


By Lainey Stalnaker, Data Analytics Writer

In what year did South Carolina have its lowest unemployment rate? Find out on page 31
July 18 is Insurance Nerd Day! We have plenty of insurance nerds here at DEW, since our agency is tasked with administering South Carolina’s unemployment insurance tax and benefits systems. And our state’s employers need a lot more of them: According to the Postsecondary Supply Gap Analysis, published earlier this year, accountants and auditors are the occupation with the largest disparity between how many people are ready to take those jobs and the number of job postings on the market You can learn a lot more about this topic on the new LMI website at by visiting lmi.sc.gov .
This month’s featured article by Lainey Stalnaker takes a deep dive into our long-term employment projections by workforce development area One of our federal grants requires us to put out our best estimate of how many people will be working in each industry and occupation ten years down the road – first for the state, then at the regional level Is your area expected to gain jobs for people like you, or lose them? We’ll also be talking about questions like those over at LMI Insights, where we post short-form articles on a regular basis
As always, help is always one click away at lmicustomerservice@dew.sc.gov


Bryan P Grady, Ph .D Assistant Executive Director for Labor Market Information S C Department of Employment and Workforce

By Lainey Stalnaker, Data Analytics Writer
Introduction
Every two years, LMI produces long-term employment projections for the state of South Carolina and its 12 workforce development areas (WDAs) In this month’s Trends, we highlight some takeaways from our 2022 to 2032 employment projections shown on the map in Figure 1 .
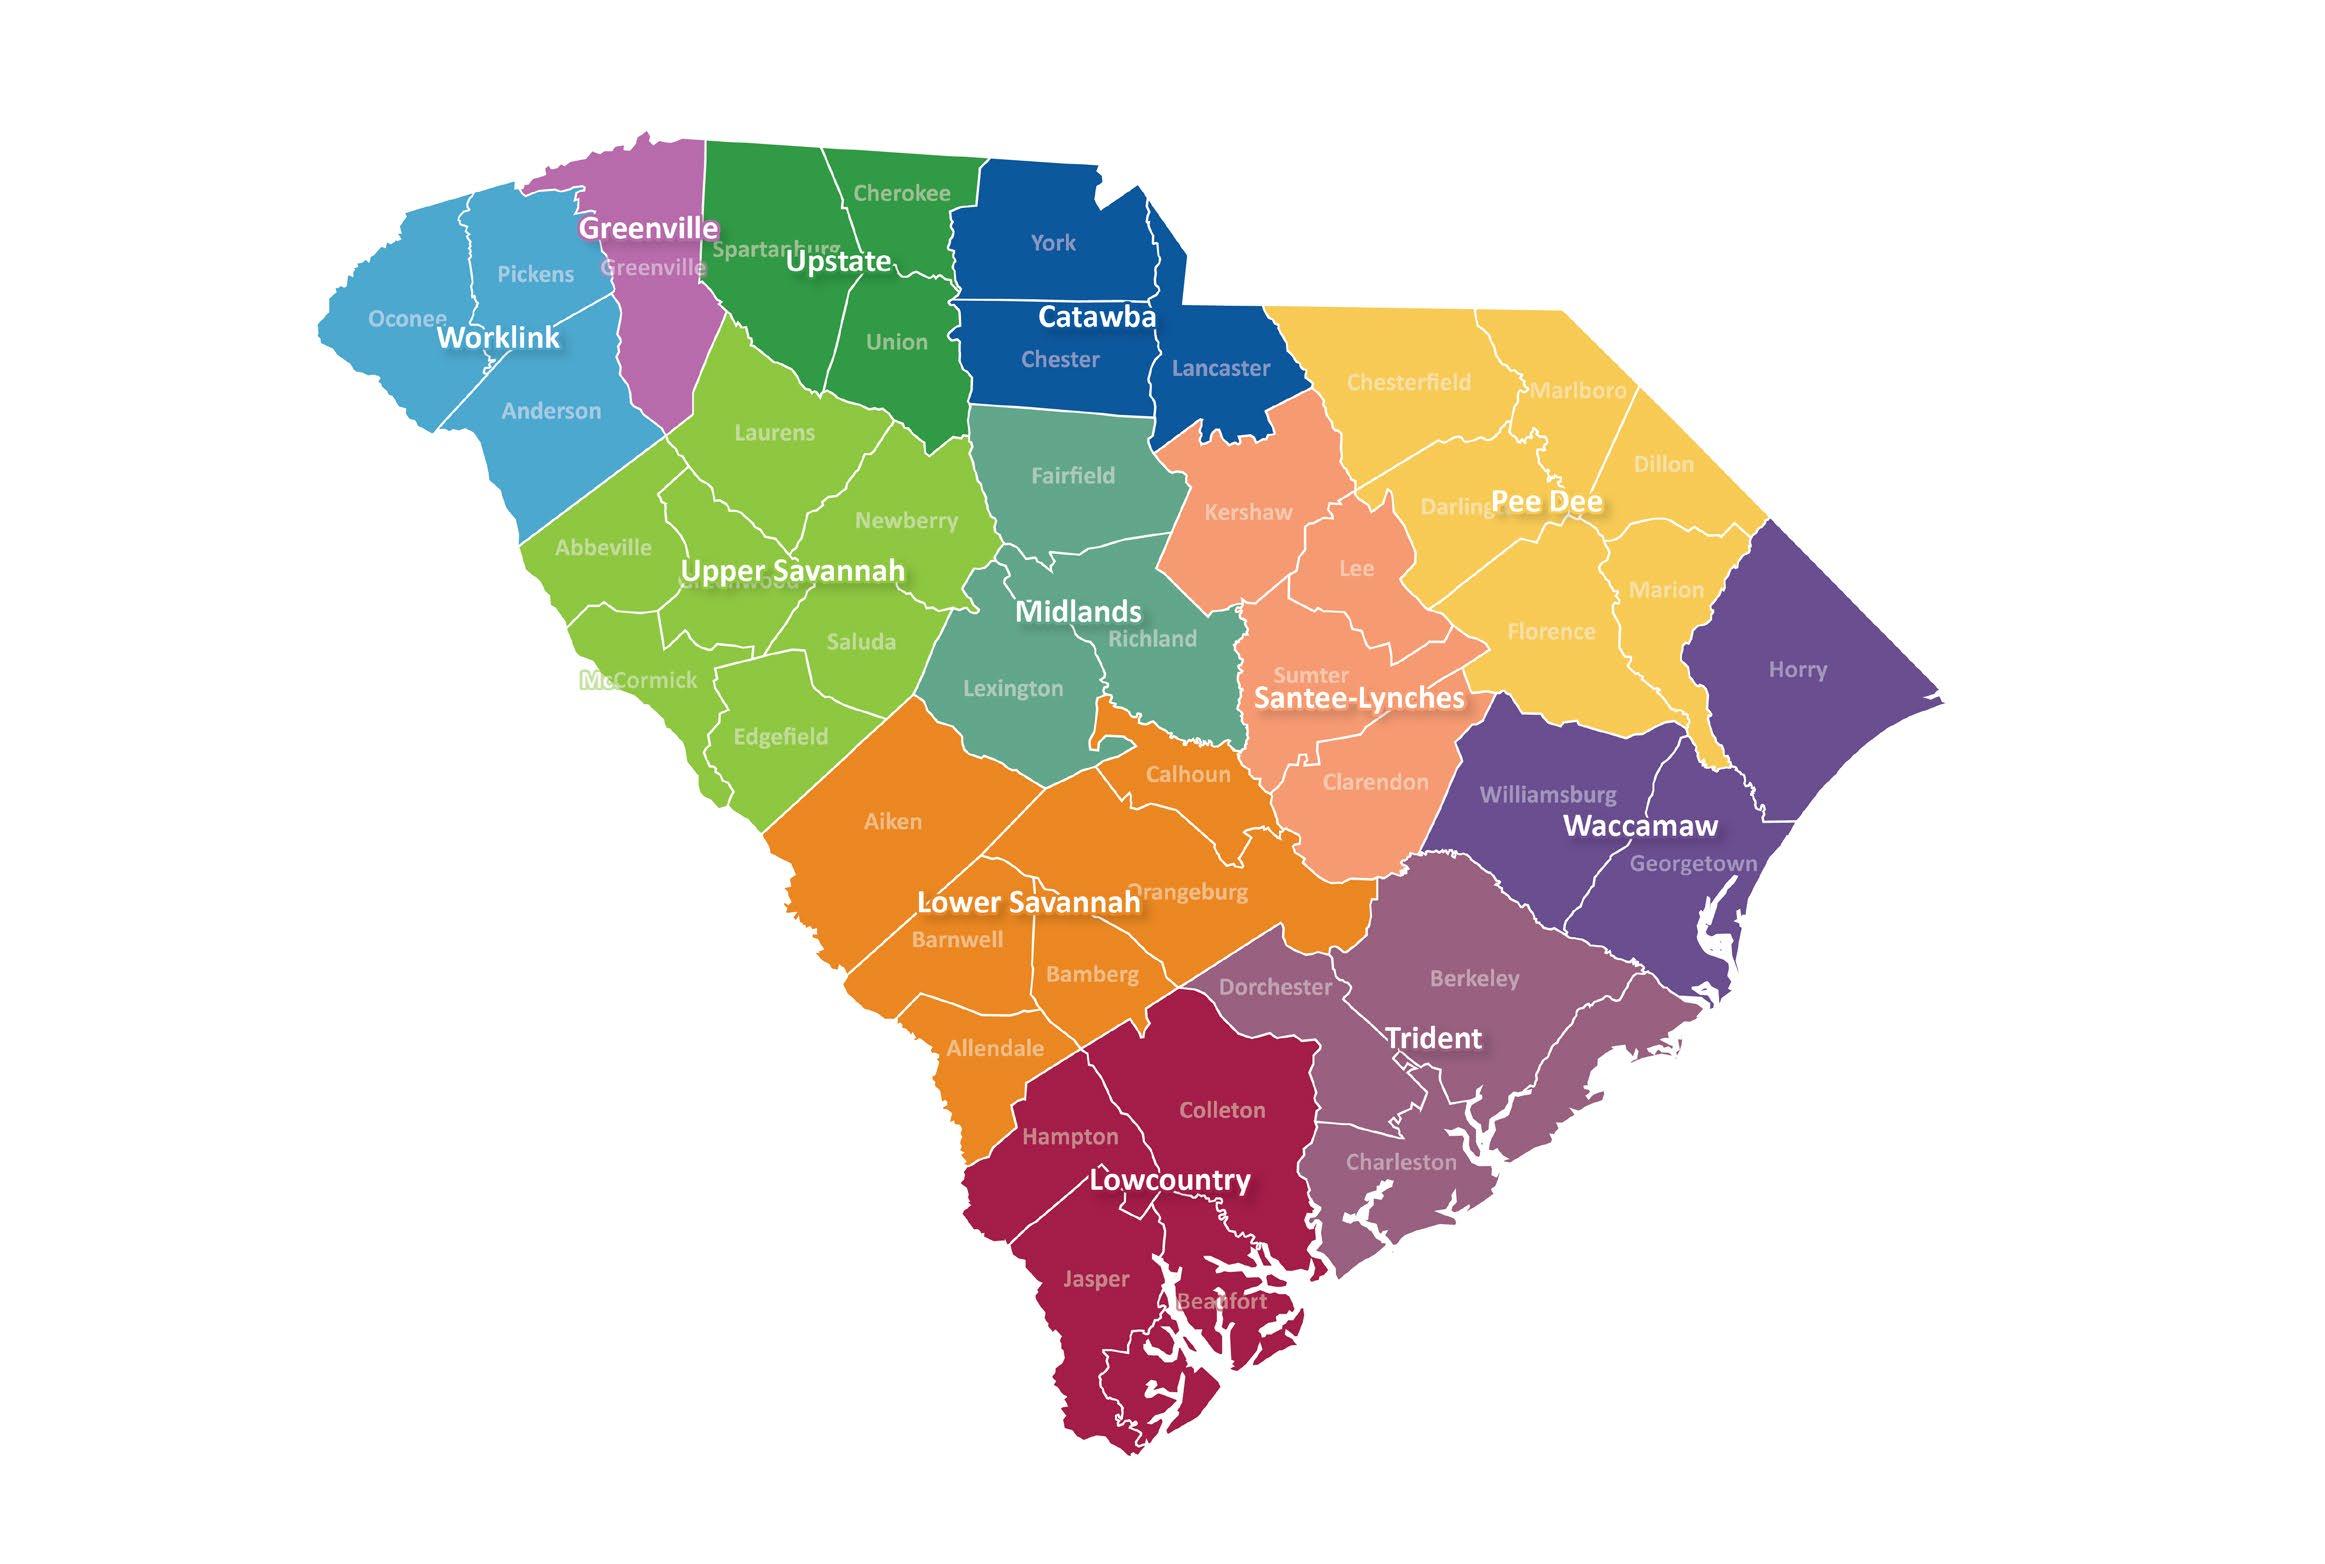
In 2022, there were 2,352,837 people employed in South Carolina, with nearly half concentrated in the Greenville, Midlands, and Trident WDAs, which comprise the state’s most populous regions By 2032, we expect employment to reach 2,614,577, an increase of 261,740 people — or 11 1 percent
More than 50,000 — or 20 1 percent — of these new workers are expected to be employed in the Trident WDA, which includes Charleston, Berkeley, and Dorchester counties. The Midlands region, comprising Richland, Lexington, and Fairfield counties, is expected to add 45,000 workers, and 40,000 more people will be employed in Greenville County, which constitutes the Greenville WDA
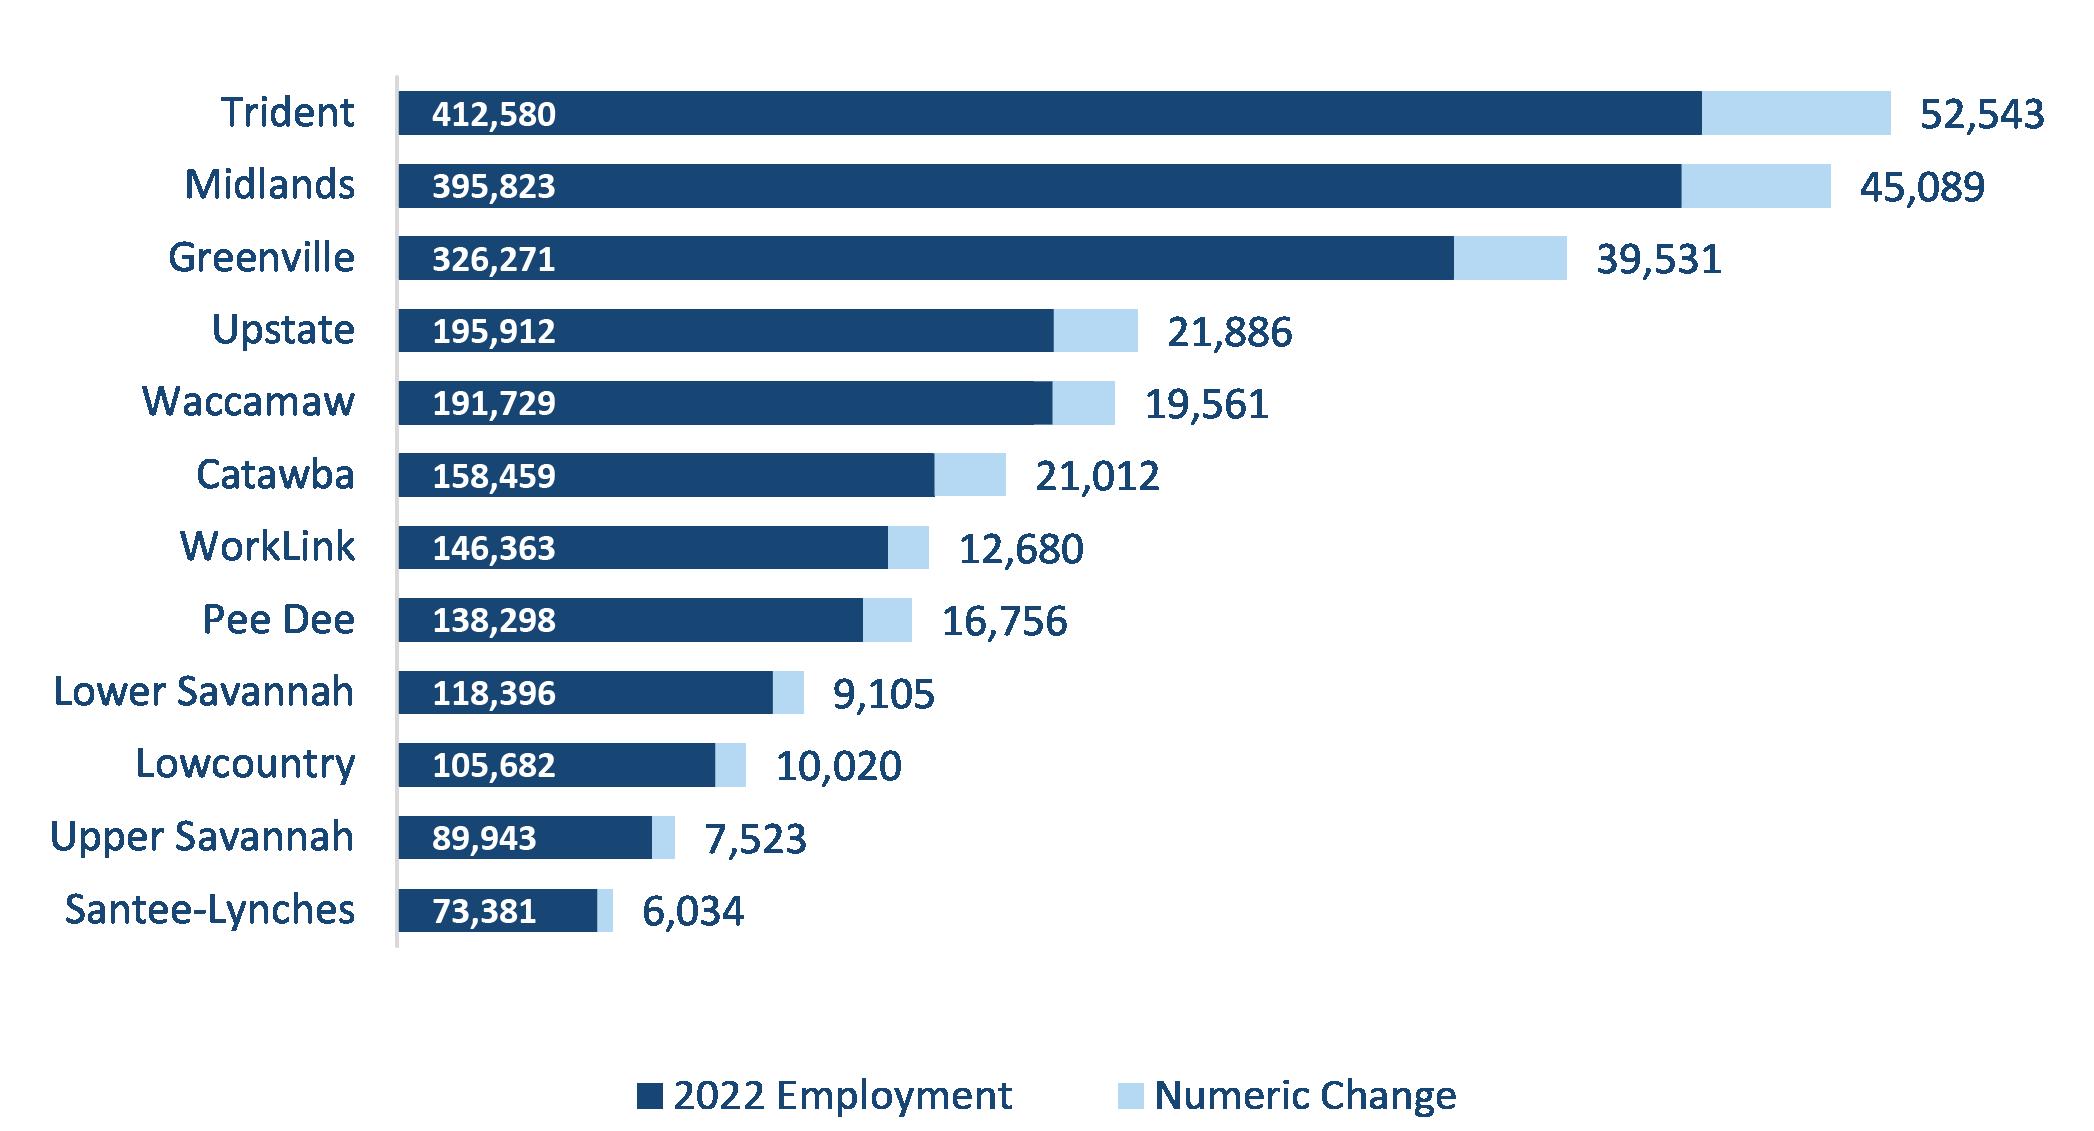
The fastest growth is expected in the Catawba region, made up of York, Lancaster, and Chester counties, at 13 .3 percent growth, followed by Trident at 12 7 percent Greenville and Pee Dee tie for third place and are each expected to see 12 1 percent growth See Figure 2 for a breakdown of 2022 employment in each region and projected gains through 2032
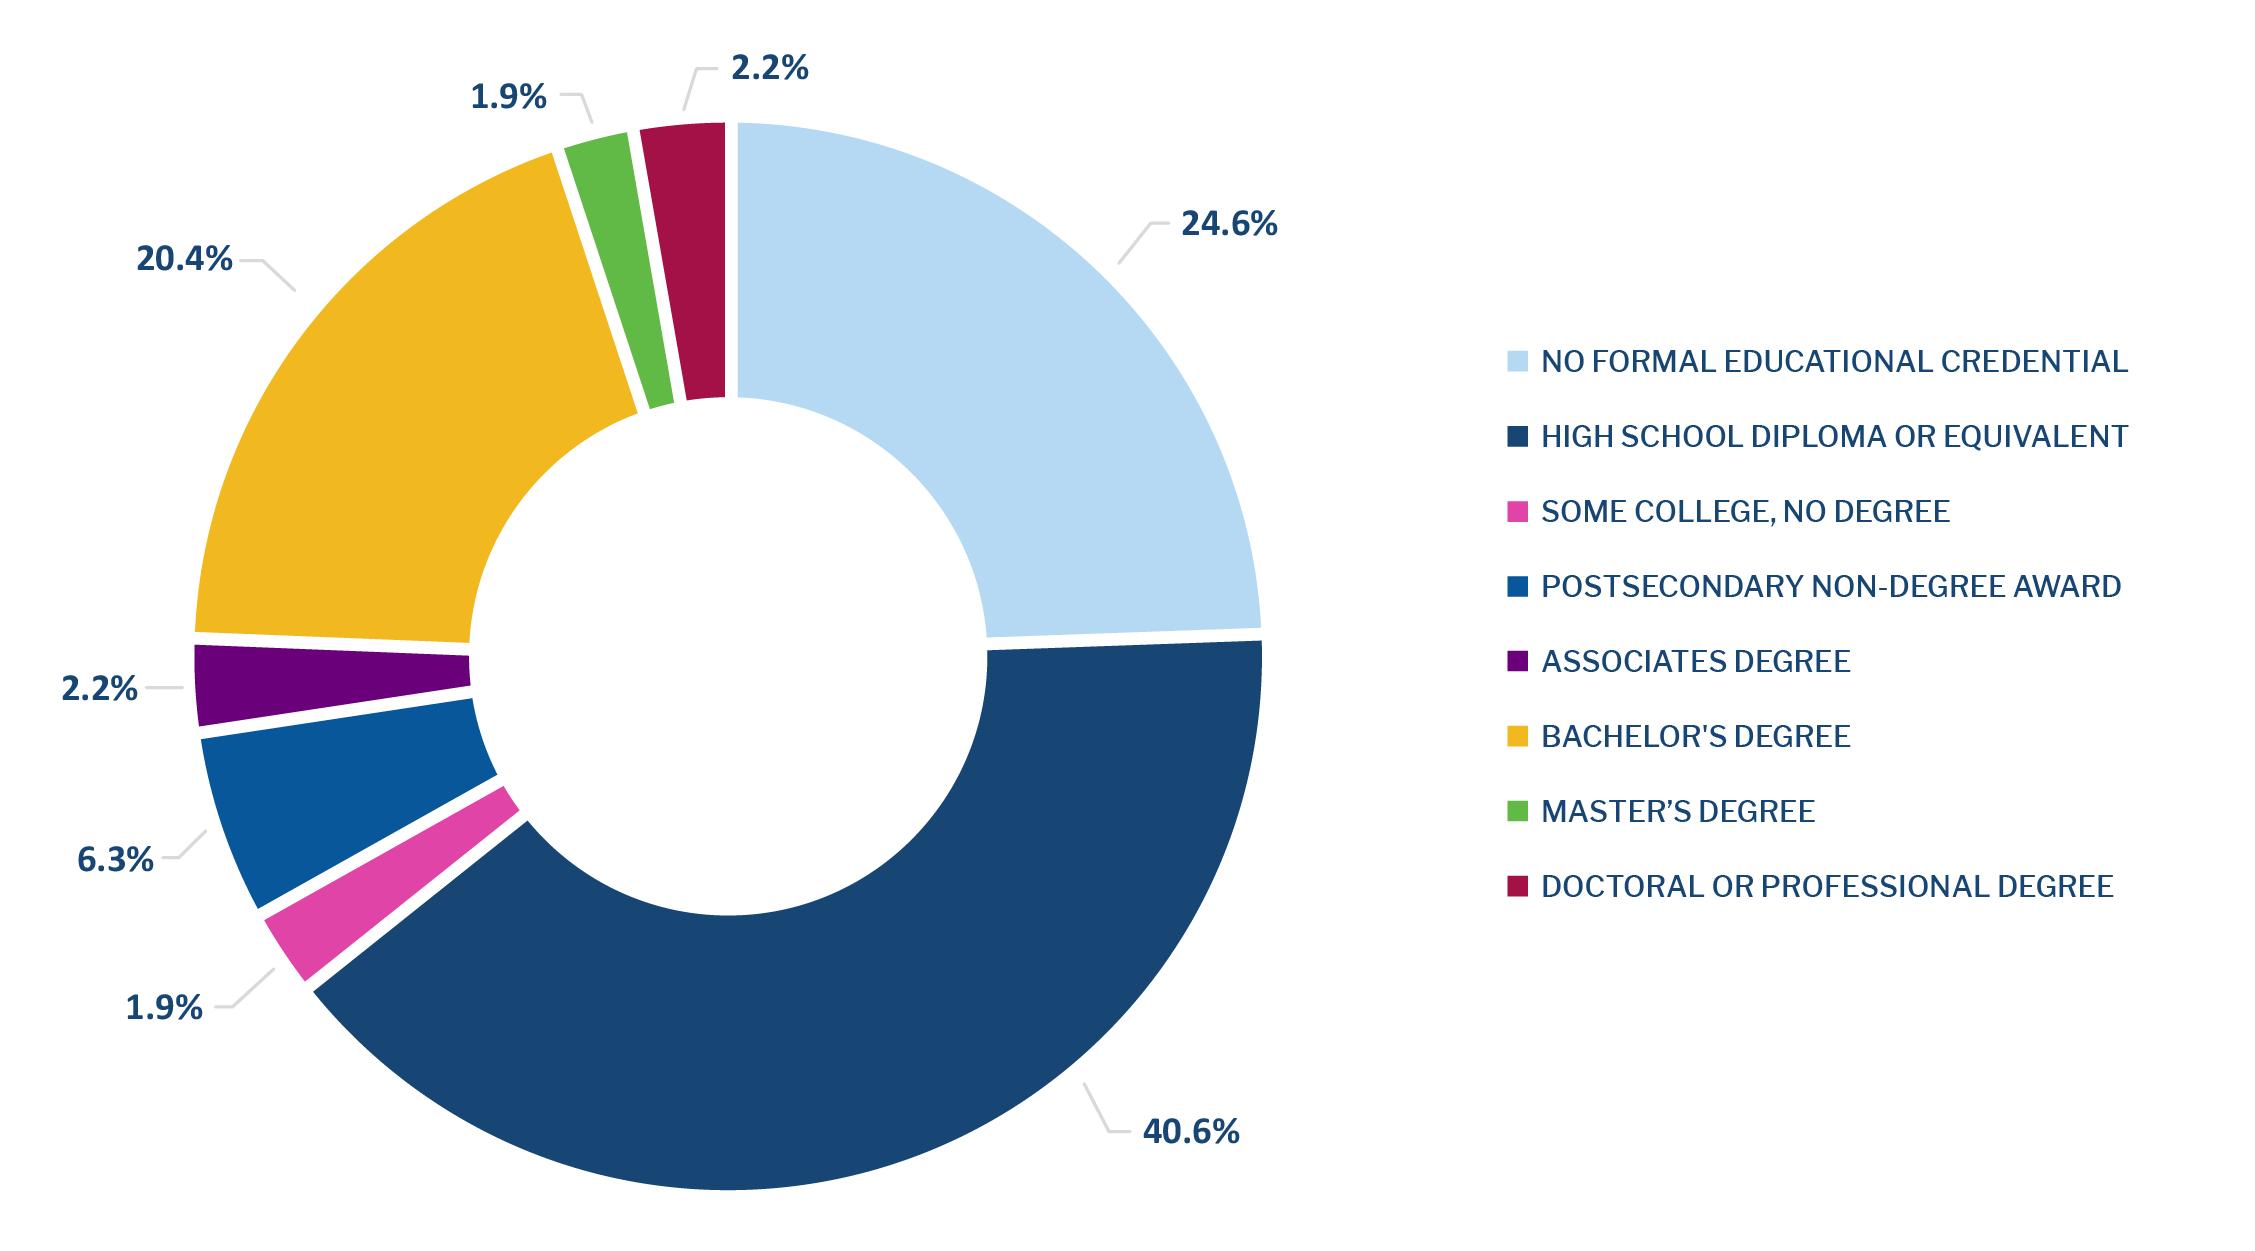
In 2032, estimates show that 65 .2 percent of jobs will require a high school diploma or no formal educational credential Across all workforce development areas, the percentage varies — from 58 0 percent in the Upper Savannah WDA to 73 0 percent in the Waccamaw WDA — but jobs with minimal educational requirements will make up the majority in every region All other jobs will require some kind of post-secondary credential, which includes post-secondary non-degree awards, associate, bachelor’s, master’s, doctoral, and other professional degrees
Figure 3 breaks down projected employment by type of credential required Across the state, the majority of jobs will require a high school diploma or no formal education About one in ten jobs will require a postsecondary non-degree award, an associate degree, or some college coursework. Around one in five jobs will require a bachelor’s degree, and jobs requiring an advanced degree will be least common.


While the number of jobs requiring a high school diploma or less will continue to exceed all other jobs in 2032, jobs that require a credential are projected to grow significantly faster than jobs that do not.
Jobs requiring a master’s degree are projected to grow faster than any other job type — and are expected to grow at more than double the rate of jobs requiring a high school diploma
As Figure 4 shows, growth of jobs requiring a high school diploma or no formal education lags that of jobs requiring a post-secondary credential — whether that’s a post-secondary non-degree award, associate degree, bachelor’s degree, master’s degree, or doctoral degree. However, Figure 4 also shows that jobs with lesser educational requirements will significantly outnumber jobs requiring more advanced degrees

South Carolina’s labor market has experienced significant changes over the last five years. From 2020 to 2024, the state’s population grew by nearly 350,000, an increase of 6 8 percent, driven primarily by domestic migration 1 Out of state migrants have been attracted by the state’s strong job market, and more residents create increasing demand for goods and services so impacts on housing, hospitality, and healthcare, are expected
In addition, South Carolina’s population, much like the rest of the country, is aging From 2013 to 2023, the median age increased from 38 1 to 40 12 and the Revenue and Fiscal Affairs Office projects this trend to continue.3
Finally, technology continues to evolve In response, we’re predicting new demand for novel skillsets as businesses adapt to and take advantage of the changing technological landscape
Altogether, these new developments will have ripple effects across the state’s labor market, affecting the types of skills and credentials that will be highest in demand, and where this demand will be concentrated For more information on the jobs we expect to grow fastest over the next decade, check out our LMI Insights series on occupational employment projections
1 https://www.census.gov/data/tables/time-series/demo/popest/2020s-counties-total.html
2 https://data.census.gov/table/ACSDP5Y2013.DP05?g=040XX00US45&d=ACS+5-Year+Estimates+Data+Profiles
3 https://rfa.sc.gov/data-research/population-demographics/census-state-data-center/estimates-projections-dashboard/estimates-projections-data-downloads
Nationally, there is a monthly Current Population Survey of about 60,000 households conducted by the Census Bureau for the Bureau of Labor Statistics (BLS) to determine employment status of the civilian population This information, along with other inputs, are used by DEW to operate the Local Area Unemployment Statistics program, which estimates the number of individuals employed and those not employed, but actively seeking employment statewide and for a variety of substate geographies
• The seasonally adjusted number of South Carolina workers increased to 2,453,733
• That is an increase of 5,160 people over the April 2025 estimate .
• That is an increase of 25,136 people over the May 2024 estimate .
2,420,000 2,425,000 2,430,000 2,435,000 2,440,000 2,445,000 2,450,000 2,455,000 2,460,000
2,440,000 2,445,000
2,410,000 2,415,000 2,420,000 2,425,000 2,430,000 2,435,000 2,440,000 2,445,000 2,450,000
SEASONALLY ADJUSTED: Seasonal adjustment removes the effects of events that follow a regular pattern each year (i e tourist-related hiring and school closings in the summer) These adjustments make it easier to observe the cyclical and other nonseasonal movements in data over time
• The estimate of unemployed people decreased to 105,705
• That is a decrease of 765 people from the April estimate and an increase of 281 from the May 2024 estimate
• The state’s seasonally adjusted unemployment rate decreased from 4 2 percent to 4 1 percent The national unemployment rate was unchanged at 4 2 percent, according to the Current Population survey
2,490,000 2,500,000 2,530,000 2,540,000 2,550,000 2,560,000
2,510,000 2,520,000 2,530,000 2,540,000 2,550,000 2,560,000
LABOR FORCE:
• The state’s estimated labor force (people working plus unemployed people looking for work) increased to 2,559,438 while the labor force participation rate was unchanged at 57 .5 percent
• That is an increase of 4,395 people over the April 2025 estimate
• That is an increase of 25,417 individuals over the May 2024 estimate
SEASONALLY ADJUSTED: Seasonal adjustment removes the effects of events that follow a regular pattern each year (i e tourist-related hiring and school closings in the summer) These adjustments make it easier to observe the cyclical and other nonseasonal movements in data over time
BLS conducts a monthly Current Employment Statistics survey of approximately 119,000 businesses and government agencies which yields national estimates of nonagricultural wage and salary employment, hours, and earnings by industry These data are processed by DEW to generate comparable data for the state and its metropolitan statistical areas (MSA)
The monthly survey of businesses in South Carolina marked an estimated increase of 5,400 nonfarm payroll jobs over the month to a level of 2,413,100 .
SEASONALLY ADJUSTED: Seasonal adjustment removes the effects of events that follow a regular pattern each year (i e tourist-related hiring and school closings in the summer) These adjustments make it easier to observe the cyclical and other nonseasonal movements in data over time
The monthly survey of businesses in South Carolina marked an estimated increase of 5,400 nonfarm payroll jobs over the month to a level of 2,413,000 .
2025 TO MAY 2025
NOTE: Employment estimates have been rounded to the nearest hundred. Sum of detail may not equal totals due to rounding or the exclusion of certain industries from publication. All data are subject to revision.
SEASONALLY ADJUSTED: Seasonal adjustment removes the effects of events that follow a regular pattern each year (i e tourist-related hiring and school closings in the summer) These adjustments make it easier to observe the cyclical and other nonseasonal movements in data over time
Monthly Labor Force Participation Rate since January 2020
Apr-20 Jul-20 Oct-20 Jan-21 Apr-21 Jul-21 Oct-21 Jan-22 Apr-22 Jul-22 Oct-22 Jan-23 Apr-23 Jul-23 Oct-23
MONTH
Monthly EMPLOYMENT since January 2020
1,800,000 1,900,000 2,000,000 2,100,000 2,200,000 2,300,000 2,400,000 2,500,000 Jan-20 Apr-20Jul-20 Oct-20Jan-21 Apr-21Jul-21 Oct-21Jan-22 Apr-22Jul-22 Oct-22Jan-23 Apr-23Jul-23 Oct-23Jan-24 Apr-24Jul-24 Oct-24Jan-25 Apr-25
MONTH
NOTE:
Current month’s estimates are preliminary. All data are subject to revision.
Current month’s estimates are preliminary. All data are subject to revision.
Current month’s estimates are preliminary. All data are subject to revision.
2025 (NOT SEASONALLY ADJUSTED)
Current month’s estimates are preliminary. All data are subject to revision.
Current month’s estimates are preliminary. All data are subject to revision.
MAY 2025 (NOT SEASONALLY ADJUSTED)
Current month’s estimates are preliminary. All data are subject to revision.
1 . Household Survey: Nationally, there is a monthly Current Population Survey of about 60,000 households conducted by the Census Bureau for the Bureau of Labor Statistics (BLS) to determine employment status of the civilian population This information, along with other inputs, is used by DEW to operate the Local Area Unemployment Statistics program, which estimates the number of individuals employed and those not employed, but actively seeking employment for statewide and a variety of sub-state geographies
2 Employer Survey: BLS conducts a monthly Current Employment Statistics survey of about 44,000 employers which yields national estimates of nonagricultural wage and salary employment, hours, and earnings by industry This data is processed by DEW to generate comparable data for the state and its metropolitan statistical areas
3 . Seasonally Adjusted: Seasonal adjustment removes the effects of events that follow a regular pattern each year (i e tourist-related hiring and school closings in the summer) These adjustments make it easier to observe the cyclical and other nonseasonal movements in data over time
4 . Not Seasonally Adjusted: Effects of regular or seasonal patterns have not been removed from this data
Data is published by Industry
Data is published by County
Counts Jobs Counts People
Utilizes an Establishment Survey
Reference week is the Pay Period that includes the 12th of the month
A job held by a person on unpaid leave during the reference week is not counted since they are not receiving pay
Does not count selfemployed workers
Does not include agricultural workers
Does not count unpaid family workers
Workers on strike during the entire reference period are not counted
The Current Population Survey (CPS), which is a Household Survey, is used to calculate LAUS
Reference week is the Calendar Week that includes the 12th of the month
A person on unpaid leave is counted as employed because they will return to their job
Does count self-employed workers
Includes both agricultural and non-agricultural workers
Counts unpaid family workers if they worked at least 15 unpaid hours for a family business or family farm during the reference week
Workers on strike during the reference week are counted as employed in LAUS

Do you need some help finding specific data? Have a great idea for a research project you’d like to discuss with someone? We love to collaborate!
DATA TRENDS is prepared by the LMI Division of the S C Department of Employment and Workforce with funding provided by the US Department of Labor Featured data is prepared in conjunction with the Bureau of Labor Statistics and current month estimates are always preliminary, with all previous data subject to revision
Interested in staying up to date with TRENDS as it’s released? Subscribe by clicking here!