


By Lainey Stalnaker, Data Analytics Writer

Which city in South Carolina has the lowest unemployment rate? Find out on page 15
It’s time for the famous Double Issue of Trends! We published employment situation press releases on March 17 and 28 for January and February, respectively We’re mostly done with the annual revision cycle, but there are some updates to local labor force data coming in conjunction with the next press release on April 18
This year, Administrative Professionals Day falls on April 23 How many such workers are there in South Carolina, and how much do they make? As it happens, our new Occupational Employment and Wage Statistics data have just been released! These show payroll and earnings numbers as of May 2024, both for the state and metropolitan areas as well as three regions consisting of non-metropolitan counties Across the four standard occupational classification (SOC) codes that cover secretaries and administrative assistants – executive, legal, medical, and other – there are 43,440 such jobs in South Carolina. On average, these jobs pay an hourly wage of $21.20, though experienced executive assistants can make more than double that amount
LMI writer extraordinaire Lainey Stalnaker does a deep dive in our feature article on South Carolina’s housing market As a common aphorism goes, “A home is where a job goes to sleep at night ” Ensuring that our state’s workers can afford a place to live near job opportunities is an essential part of workforce development How do the communities across South Carolina stack up? Read on to find out.
As always, reach out to us if you have any questions about our state’s workforce You can contact us anytime at lmicustomerservice@dew.sc.gov


Bryan P Grady, Ph .D Assistant Executive Director for Labor Market Information S C Department of Employment and Workforce

By Lainey Stalnaker, Data Analytics Writer
South Carolina has made headlines for being one of the top destinations for people moving to a new state, boasting the highest rate of domestic migration in the country in 2023 . 1 Between 2018 and 2023, South Carolina’s population grew an impressive 5 .7 percent Population growth is undoubtedly a good thing—new residents add to the labor force and contribute to local economies—but it can also put pressure on infrastructure and increase housing demand As the population in South Carolina has surged, has the housing supply kept up? And how has new demand impacted the residential real estate market? Using the most recent five-year estimates from the U S Census Bureau’s American Community Survey,2 we’ll attempt to answer some of these questions and provide greater insight on the ever-changing housing market
Housing supply is growing in South Carolina—but not nearly as fast as households From 2018 to 2023, South Carolina added 30,000 more households than houses An addition of 176,000 households, or 9 3 percent, outpaced the growth of housing units With a net increase of 146,000 units, the state’s housing stock grew by 6 4 percent—which is not slow, but not fast enough to keep up with the skyrocketing demand over the last five years.
As further evidence of a tightening housing market, vacancy rates are down since 2018, as the number of vacant units dropped by more than 30,000 Vacant units for sale saw a particularly steep decline—from 24,500 to 15,700, suggesting that homeowners are less inclined to sell compared to five years ago. The number of vacant units for rent also fell —from 62,000 to 54,200, or 12.7 percent, which points to an increase in rental demand Read on to learn how individual counties have been affected by the changing market .
At the county level, two trends emerge related to housing supply In nearly every county, housing supply is not meeting housing demand In some counties, new demand is simply exceeding new supply, but in others, supply is shrinking
In most cases, housing supply is growing, but not fast enough to meet demand driven by rapid household growth Horry County, for example, added over 12,000 more households than houses from 2018 to 2023, a massive disparity Beaufort County added 5,000 more households than houses, and in Anderson, households exceeded housing growth by nearly 2,000 units . The raw numbers differ—but the majority of counties were met with the same predicament over the five-year period from 2018 to 2023: they’re simply not building enough houses
Similarly, when we look at the rate of increase, which accounts for the initial number of houses and households, households grew much faster than housing units in a majority of counties, even those with the most rapid residential building growth Jasper County, for example, topped the list for housing growth at nearly 20 percent—but households grew by 24 4 percent This trend was particularly prevalent in the state’s most populous counties Figure 1 compares the growth rates of housing units and households in the counties with the highest household growth In all, construction of new units could not keep up, with especially large discrepancies in Horry and Beaufort Counties

https://www.census.gov/newsroom/press-releases/2024/population-estimates-international-migration.html
2 https://data.census.gov/table/ACSDP5Y2023.DP04?q=DP04&g=040XX00US45
Only a few counties were able to build more homes than the number of households added (even if the rate of growth was slower) First was Charleston County, which built 21,700 housing units compared to an addition of 19,000 households, a difference of 2,700 . Aiken and Florence Counties both added over 800 more homes than households Housing units built in Georgetown and Berkeley also just barely exceeded households added Figure 2 , below, compares the numeric changes in households and housing units in the counties with the fastest household growth It should be noted that household growth doesn’t track perfectly with population growth, and members of a household may be unable to move out as a result of high housing costs This is to say, household growth may be artificially deflated, and should housing prices fall low enough, certain counties could see a sudden surge in households, even if population growth remains stable

Another trend driving an inability to meet demand is a loss of housing supply, which can occur for a number of reasons Apartment units may be consolidated, causing the overall number of units to decrease even though the same structure remains standing In other cases, the structures themselves may be demolished after falling into disrepair
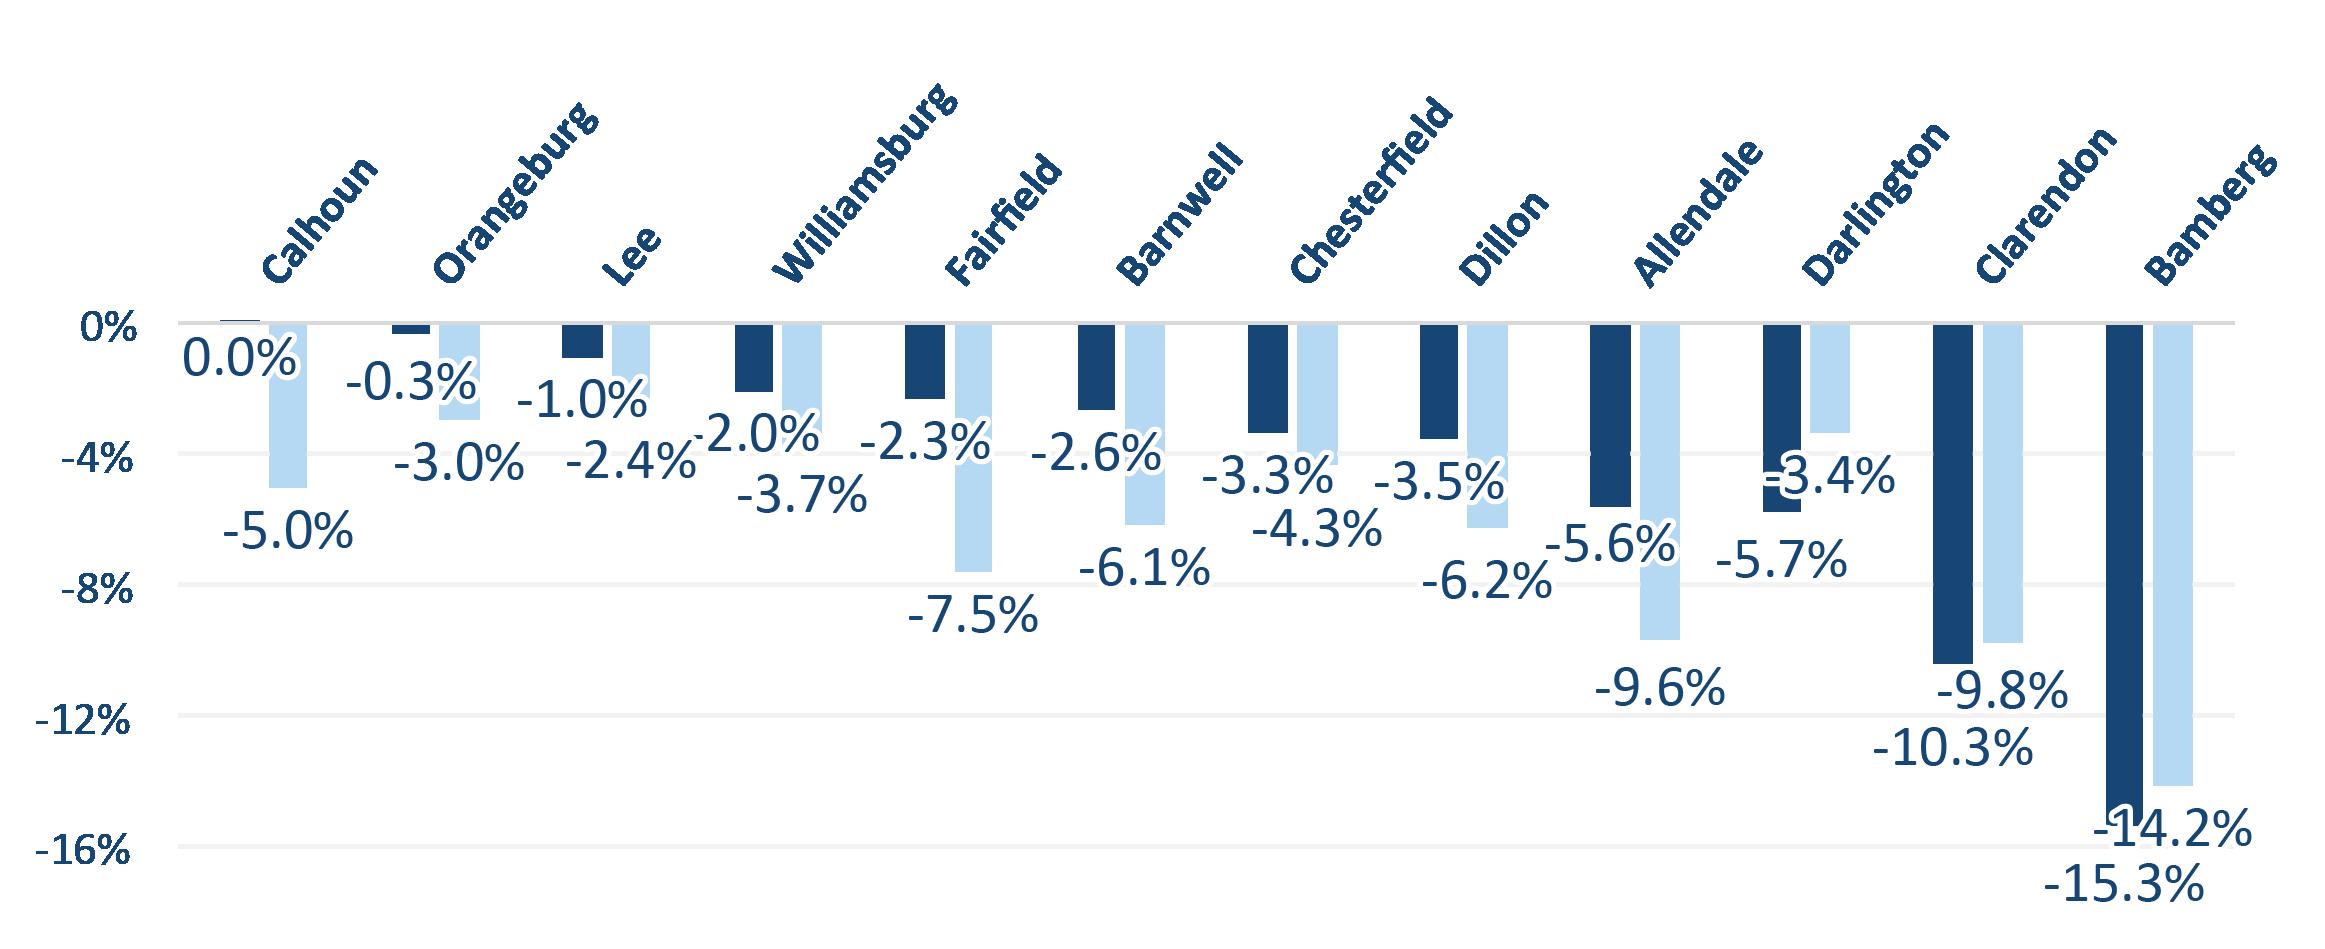
In some counties, especially those in more rural areas, housing supply decreased between 2018 and 2023 In these counties, household growth was either very low or even negative, but in almost every case, the decline in housing supply exceeded it Bamberg County, for example, recorded a loss of 860 households, but lost 1,090 housing units, or 14 2 percent of its total housing supply Clarendon, Williamsburg, Lee, and Allendale Counties all experienced the same problem This means that even places with low or stagnant household growth are experiencing tightening housing markets
Worse are the cases of a decline in housing supply paired with household growth Colleton County, for example, added 823 households between 2018 and 2023, but netted a loss of 21 housing units Union, Marion, Hampton, Sumter, and Abbeville also recorded simultaneous household growth and housing declines, pressuring the market from both the supply side and demand side On the follwing page, Figure 3 compares the rate of change in households and houses in counties with the fastest reduction in households Note that in some counties, such as Bamberg, housing units declined at a faster rate than households even though numerically, loss of housing units exceeded households


We’ve established that housing demand is outpacing housing supply Now, we’ll look at another key statistic related to the market — home values Changes in demand precipitate changes in price, and as demand for housing in South Carolina has soared, housing prices have also climbed — though not as fast as in neighboring states Between 2018 and 2023, home values increased more than 30 percent in Georgia, Tennessee and Florida In North Carolina, values rose by 28 5 percent, three points higher than in South Carolina Alabama, Kentucky, and Mississippi recorded slower growth As Figure 4 suggests, states across the Southeast 3 have become attractive destinations for people moving from other parts of the country, but states along the Atlantic are experiencing a particularly rapid increase in demand for housing
In 2018, the median value of an owner-occupied home in South Carolina was $188,500. By 2023, that figure had increased 25.6 percent to reach $236,700, but values in the nearby states of North Carolina, Georgia, Florida and Tennessee continued to exceed values in South Carolina—meaning South Carolina remains one of the more affordable options for people looking to buy a home in the South

Within South Carolina, home values vary immensely, but homes on the coast are particularly expensive In the number one spot, Charleston County was an outlier with a median home value of $450,800. This was 52.5 percent higher than in 2018, when the median was just under $300,000. Beaufort County had the second highest median home value at $407,600. In third and fourth place were York and Lancaster Counties at $322,700 and $298,000, respectively. Dorchester County rounded out the top five at $294,400.
Figure 5 , which maps home values by county, shows that coastal regions, especially in the Lowcountry, were the most expensive places to buy a home Parts of the Upstate, such as Greenville County and suburbs of Charlotte, were also more expensive By comparison, Richland and Lexington, located in the Midlands, were somewhat more affordable, but were still more expensive than rural areas of the state
At the bottom of the list was Allendale County, where the median home value was $61,600. The northeastern region of the state, containing Marion, Dillon, and Marlboro Counties, was also significantly cheaper.
Jasper County took the top spot for growth, with home values increasing 74.5 percent in a span of five years — from $154,400 to $269,400, helping it break into the top ten. Home values in Jasper County are now more expensive than in Georgetown, Horry, and Richland, three of the most populous counties in the state In 20 of 46 counties, median home values increased by more than 50 percent, including in Charleston, Greenville, Horry, and Spartanburg Values increased by at least 20 percent in all but six counties, all of which were rural

South Carolina is experiencing unprecedented growth, and for good reason The state offers beautiful scenery, harming communities, and a thriving labor market With growth, however, comes growing pains, and for South Carolina, that has meant increased housing demand and surging real estate prices For some, rising home values represent a greater return on investment For others, they inhibit the path to home ownership. Regardless, there is no indication that housing demand will let up any time soon, so addressing insufficient supply will continue to be a priority A little turbulence is expected as the market adjusts, and it may take some time to adapt to the new and evolving demand for housing in South Carolina
Nationally, there is a monthly Current Population Survey of about 60,000 households conducted by the Census Bureau for the Bureau of Labor Statistics (BLS) to determine employment status of the civilian population This information, along with other inputs, are used by DEW to operate the Local Area Unemployment Statistics program, which estimates the number of individuals employed and those not employed, but actively seeking employment for statewide and a variety of substate geographies
• The seasonally adjusted number of South Carolina workers increased to 2,443,080
• That is an increase of 3,413 people over the January 2025 estimate
• That is an increase of 21,049 people over the February 2024 estimate .
2,370,000 2,375,000 2,380,000 2,385,000 2,390,000 2,395,000 2,400,000 2,405,000 2,410,000 2,415,000 2,420,000
2,410,000 2,415,000 2,420,000 2,425,000 2,430,000 2,435,000 2,440,000
SEASONALLY ADJUSTED: Seasonal adjustment removes the effects of events that follow a regular pattern each year (i e tourist-related hiring and school closings in the summer) These adjustments make it easier to observe the cyclical and other nonseasonal movements in data over time
• The estimate of unemployed people decreased to 107,139
• That is a decrease of 2,202 people from the January estimate and an increase of 18,210 from the February 2024 estimate
• The state’s seasonally adjusted unemployment rate decreased from 4 3 percent to 4 2 percent The national unemployment rate increased to 4 1 percent, according to the Current Population survey
2,500,000 2,510,000 2,520,000 2,530,000 2,540,000
• The state’s estimated labor force (people working plus unemployed people looking for work) increased to 2,550,219 while the labor force participation rate was unchanged at 57 .6 percent
• That is an increase of 1,211 people over the January 2025 estimate
• That is an increase of 39,259 individuals over the February 2024 estimate
SEASONALLY ADJUSTED: Seasonal adjustment removes the effects of events that follow a regular pattern each year (i e tourist-related hiring and school closings in the summer) These adjustments make it easier to observe the cyclical and other nonseasonal movements in data over time
BLS conducts a monthly Current Employment Statistics survey of approximately 119,000 businesses and government agencies which yields national estimates of nonagricultural wage and salary employment, hours, and earnings by industry These data are processed by DEW to generate comparable data for the state and its metropolitan statistical areas (MSA)
The monthly survey of businesses in South Carolina marked an estimated increase of 4,500 nonfarm payroll jobs over the month to a level of 2,401,000 .
JANUARY 2025 TO FEBRUARY 2025
2024 TO
2025
SEASONALLY ADJUSTED: Seasonal adjustment removes the effects of events that follow a regular pattern each year (i e tourist-related hiring and school closings in the summer) These adjustments make it easier to observe the cyclical and other nonseasonal movements in data over time
The monthly survey of businesses in South Carolina marked an estimated increase of 4,500 nonfarm payroll jobs over the month to a level of 2,401,000 JANUARY 2025 TO FEBRUARY 2025
2024 TO
NOTE: Employment estimates have been rounded to the nearest hundred. Sum of detail may not equal totals due to rounding or the exclusion of certain industries from publication. All data are subject to revision.
SEASONALLY ADJUSTED: Seasonal adjustment removes the effects of events that follow a regular pattern each year (i e tourist-related hiring and school closings in the summer) These adjustments make it easier to observe the cyclical and other nonseasonal movements in data over time
STATISTICAL AREA
1,800,000 1,900,000 2,000,000 2,100,000 2,200,000 2,300,000 2,400,000 2,500,000
Monthly Labor Force Participation Rate since January 2020
Monthly EMPLOYMENT since January 2020
Current month’s estimates are preliminary. All data are subject to
CHARLESTON-NORTH CHARLESTON MSA
FEBRUARY 2025 (NOT SEASONALLY ADJUSTED)
Current month’s estimates are preliminary. All data are subject to revision.
FEBRUARY 2025 (NOT SEASONALLY ADJUSTED)
Current month’s estimates are preliminary. All data are subject to revision.
GREENVILLE-ANDERSON-MAULDIN MSA
FEBRUARY 2025 (NOT SEASONALLY ADJUSTED)
Current month’s estimates are preliminary. All data are subject to revision.
FEBRUARY 2025 (NOT SEASONALLY ADJUSTED)
FEBRUARY 2025 (NOT SEASONALLY ADJUSTED)
Current month’s estimates are preliminary. All data are subject to revision.
FEBRUARY 2025 (NOT SEASONALLY ADJUSTED)
1 . Household Survey: Nationally, there is a monthly Current Population Survey of about 60,000 households conducted by the Census Bureau for the Bureau of Labor Statistics (BLS) to determine employment status of the civilian population This information, along with other inputs, is used by DEW to operate the Local Area Unemployment Statistics program, which estimates the number of individuals employed and those not employed, but actively seeking employment for statewide and a variety of sub-state geographies
2 Employer Survey: BLS conducts a monthly Current Employment Statistics survey of about 44,000 employers which yields national estimates of nonagricultural wage and salary employment, hours, and earnings by industry This data is processed by DEW to generate comparable data for the state and its metropolitan statistical areas
3 . Seasonally Adjusted: Seasonal adjustment removes the effects of events that follow a regular pattern each year (i e tourist-related hiring and school closings in the summer) These adjustments make it easier to observe the cyclical and other nonseasonal movements in data over time
4 . Not Seasonally Adjusted: Effects of regular or seasonal patterns have not been removed from this data
Data is published by Industry
Data is published by County
Counts Jobs Counts People
Utilizes an Establishment Survey
Reference week is the Pay Period that includes the 12th of the month
A job held by a person on unpaid leave during the reference week is not counted since they are not receiving pay
Does not count selfemployed workers
Does not include agricultural workers
Does not count unpaid family workers
Workers on strike during the entire reference period are not counted
The Current Population Survey (CPS), which is a Household Survey, is used to calculate LAUS
Reference week is the Calendar Week that includes the 12th of the month
A person on unpaid leave is counted as employed because they will return to their job
Does count self-employed workers
Includes both agricultural and non-agricultural workers
Counts unpaid family workers if they worked at least 15 unpaid hours for a family business or family farm during the reference week
Workers on strike during the reference week are counted as employed in LAUS

Do you need some help finding specific data? Have a great idea for a research project you’d like to discuss with someone? We love to collaborate!
DATA TRENDS is prepared by the LMI Division of the S C Department of Employment and Workforce with funding provided by the US Department of Labor Featured data is prepared in conjunction with the Bureau of Labor Statistics and current month estimates are always preliminary, with all previous data subject to revision
Interested in staying up to date with TRENDS as it’s released? Subscribe by clicking here!