


By Lainey Stalnaker, Data
Writer

What sector of the state’s economy has seen the fastest wage growth recently? Find out on page 23
June 28 is National Logistics Day . We all learned during the pandemic how important managing the supply chain is to keeping assembly lines moving and store shelves stocked Logisticians are the people who make that possible — and they’re one of South Carolina’s 168 priority occupations Our agency’s Explore SC@Work campaign even featured supply logisticians with information about their typical salary, education requirements, and a profile of someone in that job Check it out at dew.sc.gov/scwork-gallery, along with many other occupational flyers.
We have some exciting news to share: The Labor Market Information Division has a new home! You can find us by going to lmi.sc.gov or simply clicking the Labor Market Information button on the top of the DEW website . We’ve joined a multi-state collaborative effort led by our counterparts in Montana that provides workforce data on a low maintenance, easy-to-navigate platform This month’s feature article highlights the site’s many improvements, including new dashboards, refreshed community profiles, and the DEW Leading Index, a just-inaugurated measure for gauging the direction of the state’s economy We can’t wait to show it off!
If you’re looking for something and can’t find it on our site, please email us at lmicustomerservice@dew.sc.gov and my team will get right on it


Bryan P Grady, Ph .D
Assistant Executive Director for Labor Market Information S C Department of Employment and Workforce

By Lainey Stalnaker, Data Analytics Writer
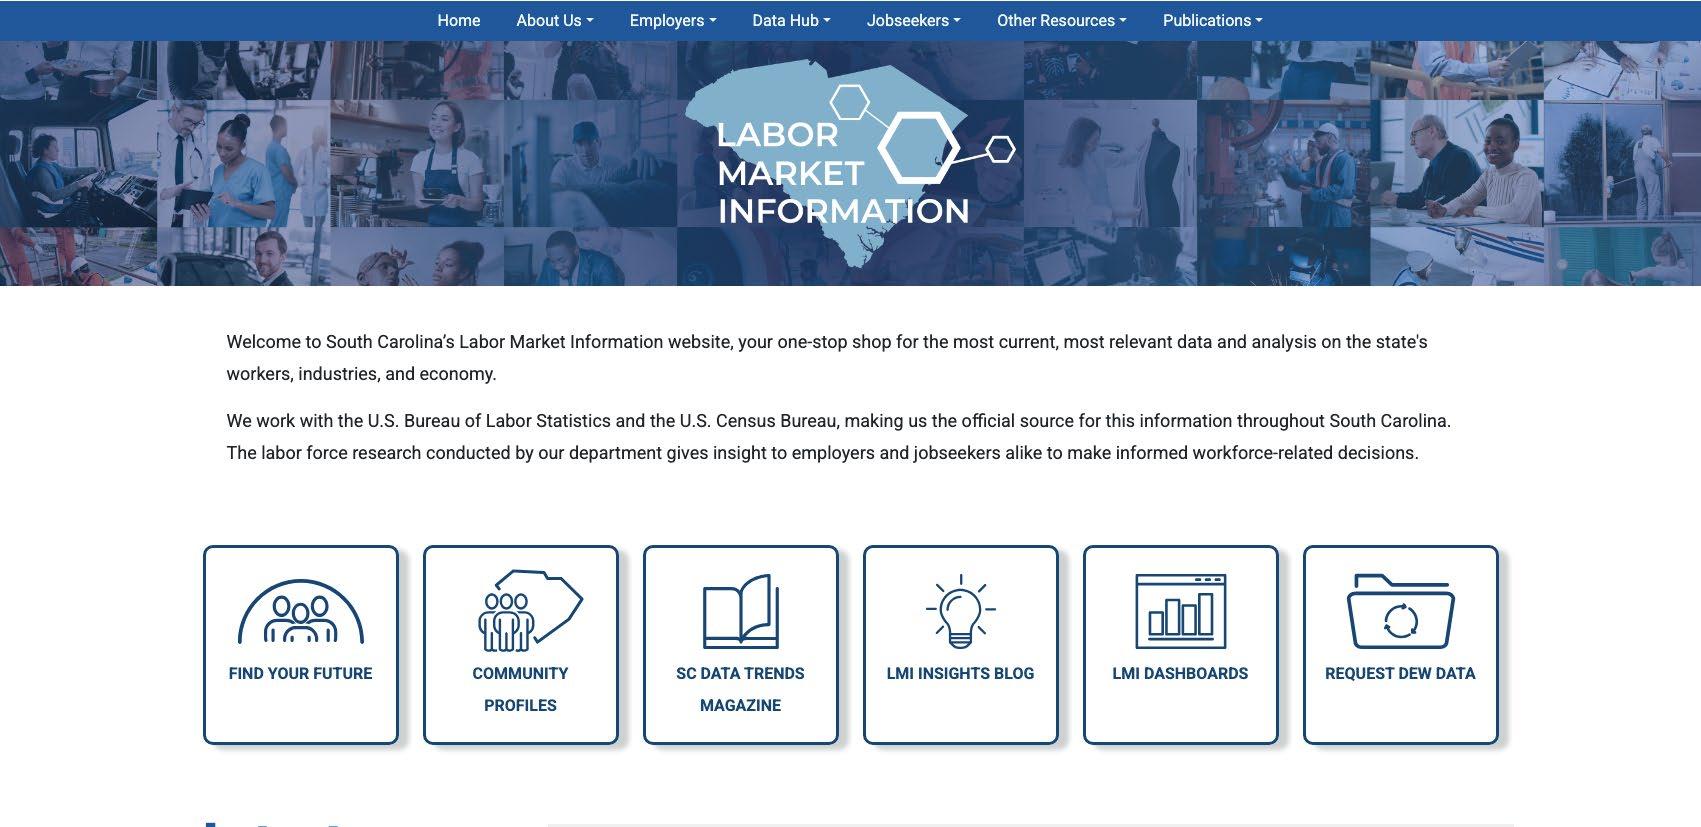
The Labor Market Information (LMI) division of DEW is launching a brand-new website, which can be accessed at lmi.sc.gov At LMI, our mission is to collect, analyze, and disseminate vital data about the labor market in order to help you make more informed decisions, whether you are a jobseeker, employer, researcher, or simply interested in the labor market Read on to learn about the many valuable resources accessible through our website
The LMI home page features six icons which lead to some of our most used resources
Find Your Future is a new website created by the Coordinating Council for Workforce Development (CCWD), a partnership between multiple agencies with the goal of aligning and enhancing South Carolina’s education and workforce system The website brings together resources (including LMI data) for jobseekers, employers, students, and educators

Community Profiles provide a summary of economic and workforce data — such as employment figures, job openings, top employers, wages, and employment projections — for multiple geographies, including the state, counties, metropolitan statistical areas, Workforce Development Areas, and WIOA regions. Profiles are updated monthly.


LMI’s Data Trends magazine is a monthly publication of employment and unemployment statistics for South Carolina, its counties, and its metropolitan statistical areas Each edition of Trends also includes a feature piece, like this one


LMI Insights is our blog, which provides topical analyses of a wide range of labor market topics, including recurring data releases, such as Bureau of Labor Statistics (BLS) and Bureau of Economic Analysis (BEA) data and U .S census estimates, along with notable trends and research related to South Carolina’s labor market

LMI dashboards allow users to visualize and compare labor market data across geographies Our labor force participation dashboard, which is updated monthly, maps and charts data, such as population size and unemployment rates Our veterans dashboard presents data on veterans in South Carolina, including their demographic traits, income status, disability status, and education level


This feature allows state and local government officials, researchers, and other qualified individuals to request DEW data for research purposes using the provided form
The home page also features resources for specific users, including employers. Under the employer tab, we have linked a list of all priority occupations, developed by LMI in conjunction with the CCWD . Priority occupations have demonstrated statistically strong demand, projected growth, viability, and retention, and are grouped by career cluster We have additionally provided a resource on Standard Occupational Classification (SOC) codes, which employers are now required to submit to submit with their quarterly wage reports . The employer tab also directs users to the SC Works Employer page, which provides services related to employee recruitment and training, along with other resources
For researchers, we’ve created the Data Hub tab This tab includes a directory of BLS data, LMI’s short-term and long-term employment projections by occupation and industry, and a dashboard of staffing patterns, which represents the distribution of employment by occupation in each industry

Under the jobseeker tab, you can find DEW’s Explore SC@Work page, which highlights priority occupations, giving an overview of educational and skill requirements, typical job activities, and average salary . This tab also directs users to the SC Works website, which helps jobseekers find employment opportunities and provides other career resources.
LMI regularly produces a variety of data products, which can be found under the publications tab These include CCWD publications such as the Postsecondary Supply Gap Analysis and return on investment analyses Our annual economic analysis reports going back to 2015 are all located under this tab, as are regional profiles and the DEW Leading index. Additionally, we have archived older reports under this tab
Other resources accessible through our new website include WARN notices, which are notifications of layoffs, DEW press releases, and a schedule of BLS data releases
Conclusion
Through the launch of our new website, LMI’s goal is to make our many resources and data products more accessible to all of our stakeholders, including members of the business community, industry leaders, educators, researchers, and jobseekers .
Here’s what Labor Market Analytics Director Brandon Wilkerson had to say:
“Regular users of the old website will notice right away that we have upgraded the experience both aesthetically and functionally We expect this to a be a crucial resource for stakeholders and web visitors of all types ”
No matter your needs, LMI has resources that can help Should you need additional guidance or have a question that’s not answered on our website, you can always contact us directly at lmicustomerservice@dew.sc.gov
Nationally, there is a monthly Current Population Survey of about 60,000 households conducted by the Census Bureau for the Bureau of Labor Statistics (BLS) to determine employment status of the civilian population This information, along with other inputs, are used by DEW to operate the Local Area Unemployment Statistics program, which estimates the number of individuals employed and those not employed, but actively seeking employment statewide and for a variety of substate geographies
• The seasonally adjusted number of South Carolina workers increased to 2,448,456
• That is an increase of 3,019 people over the March 2025 estimate .
• That is an increase of 22,204 people over the April 2024 estimate
2,410,000 2,415,000 2,420,000 2,425,000 2,430,000 2,435,000 2,440,000 2,445,000 2,450,000
2,440,000 2,445,000
SEASONALLY ADJUSTED: Seasonal adjustment removes the effects of events that follow a regular pattern each year (i e tourist-related hiring and school closings in the summer) These adjustments make it easier to observe the cyclical and other nonseasonal movements in data over time
• The estimate of unemployed people increased to 106,498
• That is an increase of 867 people from the March estimate and an increase of 7,445 from the April 2024 estimate
• The state’s seasonally adjusted unemployment rate increased from 4 1 percent to 4 2 percent The national unemployment rate was unchanged at 4 2 percent, according to the Current Population survey
2,490,000 2,500,000 2,530,000 2,540,000
• The state’s estimated labor force (people working plus unemployed people looking for work) increased to 2,554,954 while the labor force participation rate was unchanged at 57 .5 percent
• That is an increase of 3,886 people over the March 2025 estimate
• That is an increase of 29,649 individuals over the April 2024 estimate
SEASONALLY ADJUSTED: Seasonal adjustment removes the effects of events that follow a regular pattern each year (i e tourist-related hiring and school closings in the summer) These adjustments make it easier to observe the cyclical and other nonseasonal movements in data over time
BLS conducts a monthly Current Employment Statistics survey of approximately 119,000 businesses and government agencies which yields national estimates of nonagricultural wage and salary employment, hours, and earnings by industry These data are processed by DEW to generate comparable data for the state and its metropolitan statistical areas (MSA)
The monthly survey of businesses in South Carolina marked an estimated increase of 6,800 nonfarm payroll jobs over the month to a level of 2,407,800 MARCH 2025 TO APRIL 2025
SEASONALLY ADJUSTED: Seasonal adjustment removes the effects of events that follow a regular pattern each year (i e tourist-related hiring and school closings in the summer) These adjustments make it easier to observe the cyclical and other nonseasonal movements in data over time
The monthly survey of businesses in South Carolina marked an estimated increase of 6,800 nonfarm payroll jobs over the month to a level of 2,407,800 .
2025 TO APRIL 2025
NOTE: Employment estimates have been rounded to the nearest hundred. Sum of detail may not equal totals due to rounding or the exclusion of certain industries from publication. All data are subject to revision.
SEASONALLY ADJUSTED: Seasonal adjustment removes the effects of events that follow a regular pattern each year (i e tourist-related hiring and school closings in the summer) These adjustments make it easier to observe the cyclical and other nonseasonal movements in data over time
month's estimates are preliminary All data are subject to revision
Unemployment Rate Up Substate estimates are not seasonally adjusted and may diverge from state-level figures.
Monthly Labor Force Participation Rate since January 2020
Jan-20 Apr-20 Jul-20 Oct-20 Jan-21 Apr-21 Jul-21 Oct-21 Jan-22 Apr-22 Jul-22 Oct-22 Jan-23 Apr-23 Jul-23 Oct-23 Jan-24 Apr-24
MONTH
Monthly EMPLOYMENT since January 2020
1,800,000 1,900,000 2,000,000 2,100,000 2,200,000 2,300,000 2,400,000 2,500,000 Jan-20 Apr-20 Jul-20 Oct-20Jan-21 Apr-21 Jul-21 Oct-21Jan-22 Apr-22 Jul-22 Oct-22Jan-23 Apr-23 Jul-23 Oct-23Jan-24 Apr-24 Jul-24 Oct-24Jan-25 Apr-25
MONTH
Current month’s estimates are preliminary. All data are subject to revision.
APRIL 2025 (NOT SEASONALLY ADJUSTED)
Current month’s estimates are preliminary. All data are subject to revision.
APRIL 2025 (NOT SEASONALLY ADJUSTED)
Current month’s estimates are preliminary. All data are subject to revision.
APRIL 2025 (NOT SEASONALLY ADJUSTED)
Current month’s estimates are preliminary. All data are subject to revision.
Current month’s estimates are preliminary. All data are subject to revision.
APRIL 2025 (NOT SEASONALLY ADJUSTED)
Current month’s estimates are preliminary. All data are subject to revision.
APRIL 2025 (NOT SEASONALLY ADJUSTED)
1 . Household Survey: Nationally, there is a monthly Current Population Survey of about 60,000 households conducted by the Census Bureau for the Bureau of Labor Statistics (BLS) to determine employment status of the civilian population This information, along with other inputs, is used by DEW to operate the Local Area Unemployment Statistics program, which estimates the number of individuals employed and those not employed, but actively seeking employment for statewide and a variety of sub-state geographies
2 Employer Survey: BLS conducts a monthly Current Employment Statistics survey of about 44,000 employers which yields national estimates of nonagricultural wage and salary employment, hours, and earnings by industry This data is processed by DEW to generate comparable data for the state and its metropolitan statistical areas
3 . Seasonally Adjusted: Seasonal adjustment removes the effects of events that follow a regular pattern each year (i e tourist-related hiring and school closings in the summer) These adjustments make it easier to observe the cyclical and other nonseasonal movements in data over time
4 . Not Seasonally Adjusted: Effects of regular or seasonal patterns have not been removed from this data
Data is published by Industry
Data is published by County
Counts Jobs Counts People
Utilizes an Establishment Survey
Reference week is the Pay Period that includes the 12th of the month
A job held by a person on unpaid leave during the reference week is not counted since they are not receiving pay
Does not count selfemployed workers
Does not include agricultural workers
Does not count unpaid family workers
Workers on strike during the entire reference period are not counted
The Current Population Survey (CPS), which is a Household Survey, is used to calculate LAUS
Reference week is the Calendar Week that includes the 12th of the month
A person on unpaid leave is counted as employed because they will return to their job
Does count self-employed workers
Includes both agricultural and non-agricultural workers
Counts unpaid family workers if they worked at least 15 unpaid hours for a family business or family farm during the reference week
Workers on strike during the reference week are counted as employed in LAUS

Do you need some help finding specific data? Have a great idea for a research project you’d like to discuss with someone? We love to collaborate!
DATA TRENDS is prepared by the LMI Division of the S C Department of Employment and Workforce with funding provided by the US Department of Labor Featured data is prepared in conjunction with the Bureau of Labor Statistics and current month estimates are always preliminary, with all previous data subject to revision
Interested in staying up to date with TRENDS as it’s released? Subscribe by clicking here!