


How much has the average hourly wage increased in the past year? The answer is on page 23
It’s the peak of South Carolina’s famously hot summer, so what better time to enjoy a frosty treat? You can celebrate National Ice Cream Sandwich Day (August 2), National Frozen Custard Day (August 8), National Creamsicle Day (August 14), National Ice Cream Pie Day (August 18), National Soft Ice Cream Day (August 19), National Spumoni Day (August 21), National Banana Split Day (August 25), and National Cherry Popsicle Day (August 26) in the days to come. (Yes, those are all real.) Nationwide, there are nearly 1,000 establishments and more than 25,000 jobs in the ice cream and frozen dessert manufacturing industry (NAICS 311520), according to 2024 Quarterly Census of Employment and Wages annual averages. While most of those businesses are in the northern and western parts of the country, South Carolina does have 12 firms and 90 workers in the industry, with nearly half of those in Horry County. Good luck staying cool out there!
This month, LMI’s Lainey Stalnaker sits down for a one-on-one interview with Dr. Rebecca Battle-Bryant, who was confirmed earlier this year by the South Carolina Senate to serve as the first-ever Director of the Office of Statewide Workforce Development. Her position was created by the Statewide Education and Workforce Development Act of 2023 to help state agencies and other stakeholders better coordinate activities to strengthen all parts of the cradle-to-career pipeline. Read what she’s been up to in the first couple months on the job.
You don’t need to send a Bat-Signal for help with your economics quandaries! Just email lmicustomerservice@ dew.sc.gov and we’ll get on the case.


Bryan P. Grady, Ph.D. Assistant Executive Director for Labor Market Information S.C. Department of Employment and Workforce

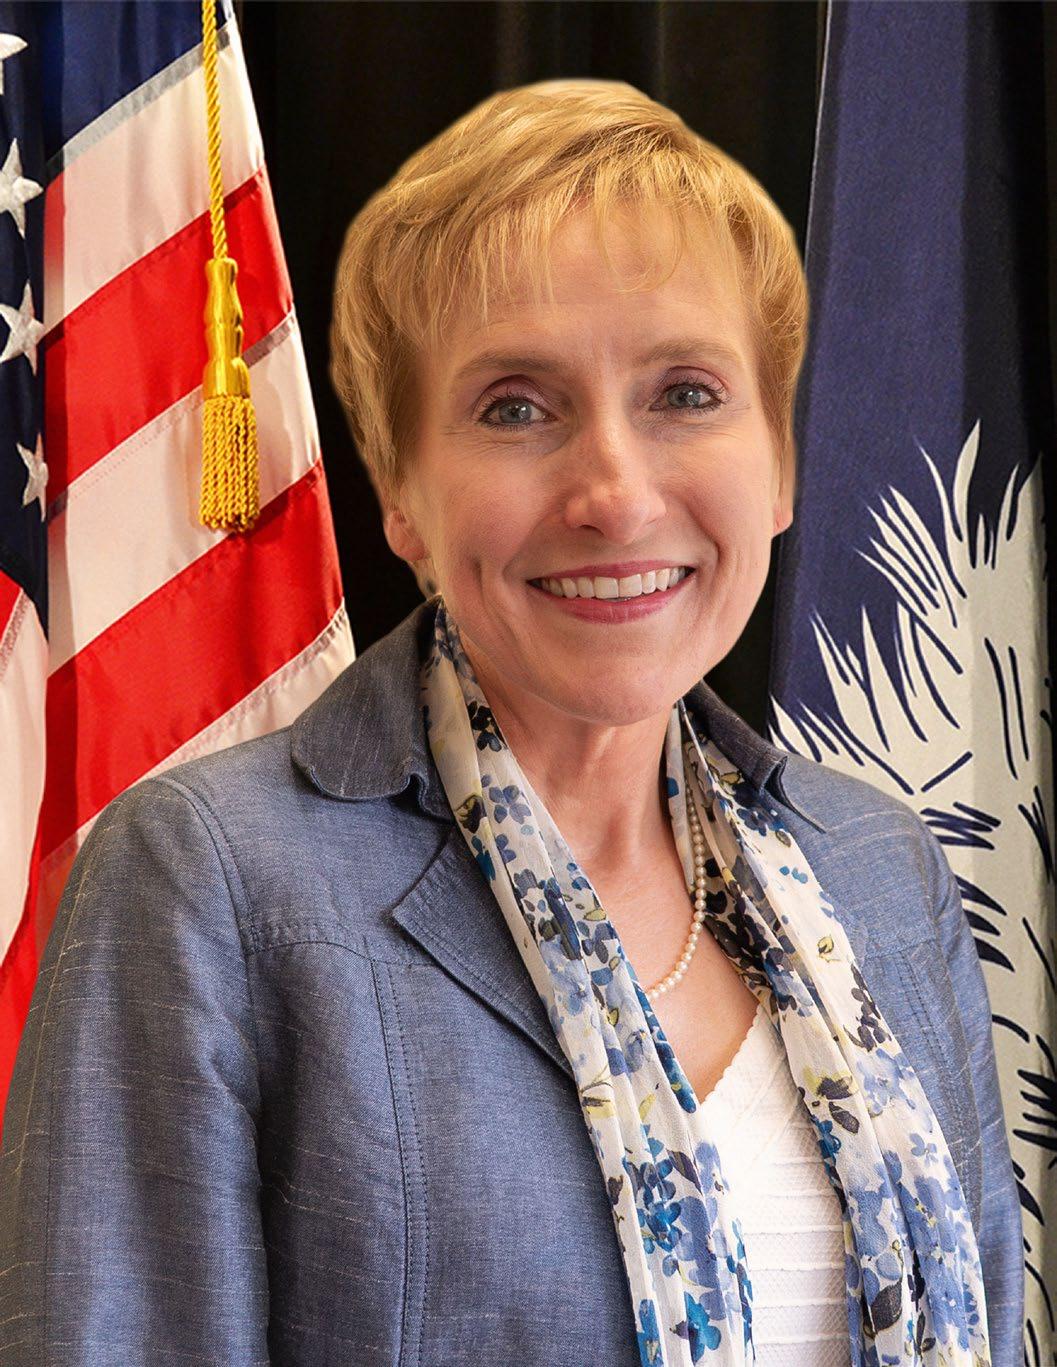
LMI SPOKE TO DR. REBECCA BATTLE-BRYANT, DIRECTOR OF THE OFFICE OF STATEWIDE WORKFORCE DEVELOPMENT (OSWD).
THE OSWD IS TASKED WITH COORDINATING, ALIGNING, AND DIRECTING WORKFORCE EFFORTS ACROSS THE STATE.
IT SEEKS TO IMPLEMENT THE PROJECTS OF THE COORDINATING COUNCIL FOR WORKFORCE DEVELOPMENT (CCWD), CREATING A CUSTOMER-CENTRIC WORKFORCE DEVELOPMENT SYSTEM THAT IS ACCESSIBLE, EFFECTIVE, AND EASY TO NAVIGATE.
Tell us about your role as director of the Office of Statewide Workforce Development.
While the OSWD is relatively new, workforce development has been a strategic priority in South Carolina for years. The legislation that created this office and my role as director aimed to coordinate the agencies and organizations in the state that foster education and career opportunities for our citizens.
There are hundreds of wonderful programs out there. I call them “pockets of brilliance.” My objective with the CCWD is to find ways to work together so that more people can benefit from the collective effort. If we channel workforce efforts into a singular direction, while supporting each programs’ individuality and area of expertise, it will be easier for people to find the education and training they need to smoothly enter the workforce. This alignment of energies will also help employers build a robust talent pipeline for their businesses.
My career pathway has been unique in that I have worked in private industry, higher education, government, and consulting. That journey has given me comprehensive insight into the education and workforce system, from the policy and program side to the training and education development components, all the way to direct interactions between a worker and an employer.
By bringing that background to this position, my focus will be on the relationships, partnerships, and collaboration needed to eliminate duplication and overlapping services while connecting potential employees with employers in the most efficient way.
That is how I see my role benefiting the most people – making connections so that we can co-locate resources and efforts in a central location, allowing students, jobseekers, and employers to easily access viable options and determine what works best for them.
My first two months have been spent learning about the groundwork of the legislation and what has been done so far by OSWD staff, and all the committees and partners of the CCWD.
I give a lot of credit to the staff here at DEW and in the OSWD, specifically. They have done some significant work to get things started. They have set up a system of operation, implemented policies and procedures, brought in the personnel resources designated by the legislation, and moved the mission forward. I must thank Charles Appleby, Robert Davis, and Jennifer Judy for what they have done internally, as well as Executive Director Floyd for his leadership and guidance in that process up to this point.
A great deal of my time has been spent listening. Executive committee members, committee chairs and co-chairs, association directors, partner organizations, and reaching out to people who have not been involved in the project up to now have been my focus. My goal is to learn, understand, and have context for their respective roles within the education and workforce systems.
Going forward, I am eager to change the conversation around career pathways. We are all uniquely and wonderfully made, and each person’s life situation and career pathway is going to be as individual as their fingerprint. We can’t prescribe one career pathway for all, but we can provide opportunities at every step of the journey by offering choose-your-own-adventure type options, as well as the people and resources to help. This is particularly important for our rural communities that may have additional challenges. Whatever the circumstance, we want to provide technology to connect a jobseeker with a human being who can help them navigate their unique journey.
And that is the vision, the connection between the employee and the employer. Life is about balancing business with people. Workforce is a balancing act between who has the needed resources available and what technology is there to make connections possible?
The innovative use of technology is going to be essential, and there has been a big push since the legislation was passed to create a space where we can channel different systems into one user-friendly digital location. However, we also need to reach individuals in a personal way. Generation Z and Millennials make up approximately 55 percent of our workforce and, we know we must find a way to reach them through technology, but at the end of the day the research shows that even this tech-savvy population wants to have one-on-one relationships and wants someone to mentor and guide them.
I like to ask people: “Are you in the job that you envisioned when you graduated from high school or college?” Most people say, “no.” The second question I ask is: “How did you find your first or your second job?” Two-thirds of the people answer that someone told them about the job, which is a reminder of the enduring value of human connection. So how do we build those connections, while using technology as a tool to facilitate the use of the education and workforce systems?
What is happening in the workforce is very complex. We have workplaces now that can have up to five generations working alongside each other.
Younger people today want to know how the job aligns with their values and purpose. They want to know how they are going to be professionally developed. They don’t want a supervisor or a boss. They want a coach. Many businesses are looking for ways to retrain supervisors and managers to lead and communicate differently. We also need to shift our thinking about how we, as education and workforce providers, deliver services along those same frameworks.
Gen Z is very interested in their strengths versus their weaknesses, and when I have engaged in consulting activities with this group, I have asked Gen Z leaders how they got in their role at such a young age. Their response is that one or both parents, a good boss, a religious figure, a sports coach, and/or a job were what made the difference for them. Having a positive example of mentorship and/or real-world experiences allowed them to learn to lead at a young age. I think technology will expand our reach, but genuine relationships will deepen our impact, regardless of age.


What are you most excited about for the future of your role?
I’m just happy to be working with people who are passionate about workforce development. It’s fun to come to work every day where the enthusiasm is palpable. The thing I love is that everyone has a vested interest, is willing to brainstorm solutions from different angles, and comes to the table to share their contributions.
My goal is that everybody who participates gets a win, and that every organization we touch will benefit. It is amazing that we have a governor and a legislature that emphasize workforce development and its central role in the lives of South Carolinians. Executive Director Floyd’s leadership is also critical in this effort. I am impressed with what our state is doing and excited to be a leader in this initiative.
Thank you, Dr. Battle-Bryant!

Nationally, there is a monthly Current Population Survey of about 60,000 households conducted by the Census Bureau for the Bureau of Labor Statistics (BLS) to determine employment status of the civilian population. This information, along with other inputs, are used by DEW to operate the Local Area Unemployment Statistics program, which estimates the number of individuals employed and those not employed, but actively seeking employment statewide and for a variety of substate geographies.
• The seasonally adjusted number of South Carolina workers increased to 2,459,338.
• That is an increase of 5,627 people over the May 2025 estimate.
• That is an increase of 28,694 people over the June 2024 estimate.
2,415,000 2,420,000 2,425,000 2,430,000 2,435,000 2,440,000 2,445,000 2,450,000 2,455,000 2,460,000 2,465,000
SEASONALLY ADJUSTED: Seasonal adjustment removes the effects of events that follow a regular pattern each year (i.e. tourist-related hiring and school closings in the summer). These adjustments make it easier to observe the cyclical and other nonseasonal movements in data over time.
• The estimate of unemployed people increased to 105,951.
• That is an increase of 257 people from the May estimate and a decrease of 5,226 from the June 2024 estimate.
• The state’s seasonally adjusted unemployment rate was unchanged 4.1 percent. The national unemployment rate decreased to 4.1 percent, according to the Current Population survey.
• The state’s estimated labor force (people working plus unemployed people looking for work) increased to 2,565,289 while the labor force participation rate increased to 57.6 percent.
• That is an increase of 5,884 people over the May 2025 estimate
• That is an increase of 23,468 individuals over the June 2024 estimate.
SEASONALLY ADJUSTED: Seasonal adjustment removes the effects of events that follow a regular pattern each year (i.e. tourist-related hiring and school closings in the summer). These adjustments make it easier to observe the cyclical and other nonseasonal movements in data over time.
BLS conducts a monthly Current Employment Statistics survey of approximately 119,000 businesses and government agencies which yields national estimates of nonagricultural wage and salary employment, hours, and earnings by industry. These data are processed by DEW to generate comparable data for the state and its metropolitan statistical areas (MSA).
The monthly survey of businesses in South Carolina marked an estimated increase of 5,800 nonfarm payroll jobs over the month to a level of 2,420,600.
SEASONALLY ADJUSTED: Seasonal adjustment removes the effects of events that follow a regular pattern each year (i.e. tourist-related hiring and school closings in the summer). These adjustments make it easier to observe the cyclical and other nonseasonal movements in data over time.
The monthly survey of businesses in South Carolina marked an estimated increase of 5,800 nonfarm payroll jobs over the month to a level of 2,420,600.
NOTE: Employment estimates have been rounded to the nearest hundred. Sum of detail may not equal totals due to rounding or the exclusion of certain industries from publication. All data are subject to revision.
SEASONALLY ADJUSTED: Seasonal adjustment removes the effects of events that follow a regular pattern each year (i.e. tourist-related hiring and school closings in the summer). These adjustments make it easier to observe the cyclical and other nonseasonal movements in data over time.
STATISTICAL AREA
Jan-20Apr-20Jul-20Oct-20Jan-21Apr-21Jul-21Oct-21Jan-22Apr-22Jul-22Oct-22Jan-23Apr-23Jul-23Oct-23Jan-24Apr-24Jul-24Oct-24Jan-25Apr-25
Jan-20Apr-20Jul-20Oct-20Jan-21Apr-21Jul-21Oct-21Jan-22Apr-22Jul-22Oct-22Jan-23Apr-23Jul-23Oct-23Jan-24Apr-24Jul-24Oct-24Jan-25Apr-25
2, 500,000
Monthly EMPLOYMENT since January 2020
1,
Jan-20Apr-20Jul-20Oct-20Jan-21Apr-21Jul-21Oct-21Jan-22Apr-22Jul-22Oct-22Jan-23Apr-23Jul-23Oct-23Jan-24Apr-24Jul-24Oct-24Jan-25Apr-25
Current month’s estimates are preliminary. All data are subject to revision.
JUNE 2025 (NOT SEASONALLY ADJUSTED)
Current month’s estimates are preliminary. All data are subject to revision.
JUNE 2025 (NOT SEASONALLY ADJUSTED)
Current month’s estimates are preliminary. All data are subject to revision.
GREENVILLE-ANDERSON-MAULDIN
JUNE 2025 (NOT SEASONALLY ADJUSTED)
Current month’s estimates are preliminary. All data are subject to revision.
JUNE 2025 (NOT SEASONALLY ADJUSTED)
Current month’s estimates are preliminary. All data are subject to revision.
JUNE 2025 (NOT SEASONALLY ADJUSTED)
Current month’s estimates are preliminary. All data are subject to revision.
1. Household Survey: Nationally, there is a monthly Current Population Survey of about 60,000 households conducted by the Census Bureau for the Bureau of Labor Statistics (BLS) to determine employment status of the civilian population. This information, along with other inputs, is used by DEW to operate the Local Area Unemployment Statistics program, which estimates the number of individuals employed and those not employed, but actively seeking employment for statewide and a variety of sub-state geographies.
2. Employer Survey: BLS conducts a monthly Current Employment Statistics survey of about 44,000 employers which yields national estimates of nonagricultural wage and salary employment, hours, and earnings by industry. This data is processed by DEW to generate comparable data for the state and its metropolitan statistical areas.
3. Seasonally Adjusted: Seasonal adjustment removes the effects of events that follow a regular pattern each year (i.e. tourist-related hiring and school closings in the summer). These adjustments make it easier to observe the cyclical and other nonseasonal movements in data over time.
4. Not Seasonally Adjusted: Effects of regular or seasonal patterns have not been removed from this data.
Data is published by Industry
Counts Jobs
Utilizes an Establishment Survey
Reference week is the Pay Period that includes the 12th of the month
A job held by a person on unpaid leave during the reference week is not counted since they are not receiving pay
Does not count selfemployed workers
Data is published by County
Counts People
The Current Population Survey (CPS), which is a Household Survey, is used to calculate LAUS
Reference week is the Calendar Week that includes the 12th of the month
A person on unpaid leave is counted as employed because they will return to their job
Does count self-employed workers
Does not include agricultural workers Includes both agricultural and non-agricultural workers
Does not count unpaid family workers
Workers on strike during the entire reference period are not counted
Counts unpaid family workers if they worked at least 15 unpaid hours for a family business or family farm during the reference week
Workers on strike during the reference week are counted as employed in LAUS

Do you need some help finding specific data? Have a great idea for a research project you’d like to discuss with someone? We love to collaborate!
DATA TRENDS is prepared by the LMI Division of the S.C. Department of Employment and Workforce with funding provided by the US Department of Labor. Featured data is prepared in conjunction with the Bureau of Labor Statistics and current month estimates are always preliminary, with all previous data subject to revision.
Interested in staying up to date with TRENDS as it’s released? Subscribe by clicking here!