South Carolina Data TRENDS


By Lainey Stalnaker, Data Analytics Writer

Which metro area has a higher average hourly wage: Hilton Head or Myrtle Beach? Check out page 24 to find out.
Happy New Year! January may mean a fresh start for you and your family, but for workforce data experts, it means revision season is coming. The numbers in this publication constitute our first estimate based on the data available at the time; after all, it’s not reasonable for us to travel around and ask every South Carolinian about their workforce status However, as both LMI and the federal government collect more information, it’s possible to adjust these numbers to take this into account This process is called “benchmarking,” and it takes place every February A revision is not evidence of incompetence or malice, but simply an effort to create a better data set When we publish numbers for January on March 17, this will reflect the results of the benchmarking process, and multiple years of prior figures will be revised as well. So, if things look different by then, now you know why!
If the new year has you thinking of making changes at work, DEW has launched its “New Year, New Career” initiative, highlighting the resources available through the Explore SC@Work portal on our website But is now a good time to look for a new job? How many job openings are there? Are layoffs going up or down? Thankfully, we have answers in the Job Openings and Labor Turnover Survey, conducted by the U .S Bureau of Labor Statistics . This month’s featured article provides an overview of where our state’s labor force dynamics have been in recent years and some thoughts about where we might be heading Be sure to give it a look And if you love it, hate it, or have a question about it, please feel free to let us know at lmicustomerservice@dew.sc.gov


Bryan P Grady, Ph .D Assistant Executive Director for Labor Market Information SC Department of Employment and Workforce

By Lainey Stalnaker,
Writer
The new year has arrived and it’s a perfect opportunity for career planning, since we can reflect on the year behind us while also considering the one that lies ahead For a little help with this, the South Carolina Department of Employment and Workforce (DEW) has created the “New Year, New Career” initiative, which offers jobseekers a wealth of information and ideas about occupations, employers, and in-demand job openings through the ever-expanding Explore SC@Work campaign
Explore SC@Work provides weekly updates on its webpage, which offers occupational snapshots, labor market information, salary estimates, education requirements, and other details that will equip a South Carolina jobseeker with the knowledge (and the New Year’s resolve) to pursue their next career For some additional grounding in the job journey, read on to get a sense of how the labor market performed in 2024 and where it may be going in 2025
Each month, the Bureau of Labor Statistics (BLS) conducts the Job Openings and Labor Turnover Survey (JOLTS), collecting data on job openings, hires, and separations at both the national and state level These data are available for all nonfarm establishments and are seasonally adjusted 1
Job openings in South Carolina spiked to historic highs after the pandemic, but the surge has slowed in recent years From January 2024 through October 2024 2 , job openings averaged 151,000 per month, down from an average of 172,000 in 2023 The beginning of the year was the strongest, with 163,000 openings recorded in January of 2024 The number of openings dipped over the summer, hitting a low of 122,000 in September, possibly due to inclement weather events This was the lowest number recorded since August of 2020 . But in October, openings increased by 31,000 to reach 153,000 . See Figure 1 for the full data
Job openings rates, calculated by dividing the number of job openings by the sum of job openings and employment then multiplying by 100, followed a similar trend, decreasing slightly from 2023 to 2024 The rate was 6 5 in January of 2024, down one point from the year before September recorded a low of 4 8, but the rate increased 1 2 points in October See Figure 2 for the full breakdown While the job market is not as robust as it was immediately post-pandemic, openings remain high To contextualize, the average number of job openings in 2024 was 38,000 more than the average in 2019, which was just 113,000

Compared to job openings, hires have fluctuated less drastically in recent years. While there was an increase in hiring following the COVID-19 pandemic, it was less extreme than the increase in job openings, and while hiring hit a high of 137,000 in November of 2021—around the same time openings hit their peak—the jump in hires was not as sustained as the increase in openings But, like job openings, we’re seeing a decline in hiring In 2023, the average number of hires was 109,000 per month Between January and October of 2024, the average fell to 107,600 Hiring was also higher in the beginning of the year—a 12 month high of 119,000 was recorded in January Hiring then slowed, falling to 97,000 in August, as shown in Figure 3 Hires rates, calculated by dividing the number of hires by employment and multiplying by 100, were also lower at the end of the year A rate of 5 1 was recorded in January, which fell to 4 2 in October, shown in Figure 4

Perhaps as a result of the drop in job openings and hires, less people are quitting their jobs today than they were two years ago In 2023, quits averaged 69,000 a month Between January and October of 2024, the average fell to 65,000, a difference of 4,000 people each month See Figure 5 for the full data
The quits rate, which equals the number of quits divided by total employment and multiplied by 100, also declined between 2023 and 2024 In January of 2023, the quits rate was 3 4, and rate only fell below 3 0 a few times that year In March of 2024, the rate hit a nearly four year low of 2 2, and in October was reported to be 2 7

FIGURE

While job openings, hires, and quits have fluctuated over the past two years, layoff and discharge levels have wavered little. In 2023, layoffs and discharges averaged 26,000 per month In 2024, the average increased to 28,000 per month Layoffs dropped as low as 23,000 in 2024—but there was a slight uptick later in the year, with 37,000 people being laid off in September and 32,000 in October, as seen in Figure 7 . Figure 8 shows the rate of layoffs and discharges (which is calculated similarly to the quits rate) since January of 2023 The rate has remained at historically low levels, with only marginal shifts In October of 2024, the rate hit 1 3, just 0 2 points higher than it was one year prior

Changes to the unemployed persons per job opening ratio tend to echo shifts in the unemployment rate During times of economic contraction, as more people lose their jobs, there are fewer employment opportunities to go around—at least temporarily—and the ratio increases In 2023, the ratio of unemployed persons to job openings was mostly static, sitting at 0 4 every month except December, when it then increased to 0 . 5 and stayed there for six months During the second half of 2024, the ratio rose steadily, reaching 0 9 in September before settling at 0 8 in October This was twice as high as the ratio a year earlier, meaning the number of people searching for a job relative to the number of positions doubled 0 8 is still a historically low rate, however, and is on par with pre-pandemic trends See figure 9 for a visualization of the change in ratio from 2023 to 2024.
3

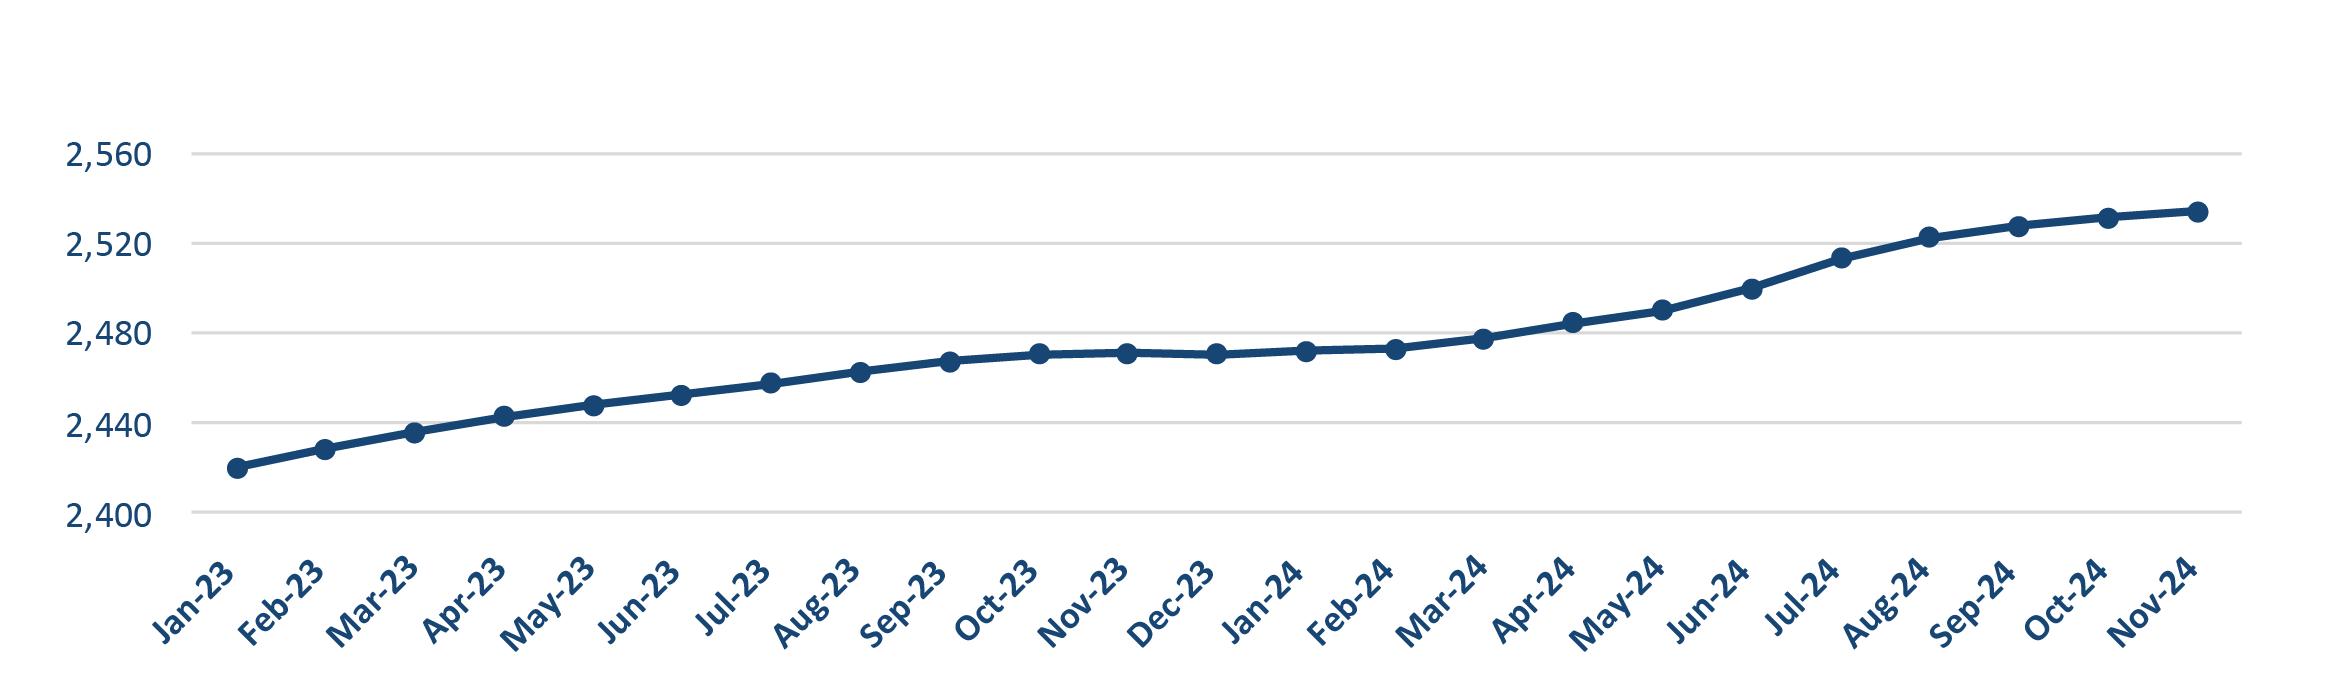
South Carolina’s labor force, which comprises everyone who is employed or unemployed and looking for a job, reached 2,534,000 in October of 2024 and grew almost every month in the last two years, as shown in Figure 10 3 The labor force grew steadily throughout most of 2023 but increased little from October of 2023 through February 2024 In March, growth picked up again, and the state added 13,000 workers from just June to July From November of 2023 through November of 2024, South Carolina’s labor force increased by 63,000—or 2 5 percent This is especially impressive considering the U S labor force increased by just 0 09 percent over the same period
Post-pandemic, South Carolina saw a significant and sustained increase in job openings, as well as a jump in hiring, particularly from the end of 2021 through the first half of 2022, as depicted in Figure 11 This was accompanied by an increase in the number of people quitting their jobs, leading to high job turnover, even with low levels of layoffs But in the last two years, the rate of job openings has declined and hiring has slowed, returning to pre-pandemic levels . This is not a reason to panic, however . A stabilizing job market is not a weak job market—openings are still much higher than they were five years ago, and layoffs and discharges remain low.

While demand for labor is not quite as high as it was a few years ago, supply only continues to grow in South Carolina, suggesting that the state’s job market remains attractive, even during a period of cooling. In the last five years, the state added nearly 200,000 people to its labor force, an increase of 8.3 percent. In the previous five-year period (October 2014-2019), the labor force grew by just 4.0 percent Considered together, these data may provide insight into the state’s rising unemployment rate, which has increased from 3 0 percent to 4 8 percent in the last year This is not, it appears, because of a spike in layoffs, but rather because job openings and hires are not increasing fast enough to meet the growing labor force’s demand for work . While this may sound bleak, note that unemployment remains well below historic levels—from October of 2001 through June of 2015, South Carolina’s unemployment rate never fell below 6 0 percent
Additionally, the unemployed persons per job opening ratio remains exceptionally low at 0 8 Only in the last few years has a ratio below 1.0 become the norm—meaning there are more unfilled jobs than there are people to fill them. At a rate of 0.8, for every 100 open positions, there are only 80 people looking for work In contrast, just a decade ago, it was normal for there to be two or even three unemployed persons for every job opening This change marks a pivotal shift in the labor market, and sustaining growth of the workforce will be critical for South Carolina in the coming years . One reason for this is that the state’s population is aging rapidly In 2013, the median age was 38 1, according to estimates from the Census Bureau’s American Community Survey By 2023, it had risen to 40.1. Meanwhile, deaths outnumber births, and have for several years. This is also reflected in the labor force participation rate (LFPR), which has been steadily declining since the start of the millennium In November of 2000, LFPR was 65 0 In November of 2024, it was 57 6, a difference of 7 4 points Although retirements account for some of this decline, some people have exited the labor force for other reasons or delayed joining entirely . In those cases, DEW’s “New Year, New Career” initiative may represent the freshly energized mindset they have been waiting for
Despite these challenges, South Carolina is one of the fastest growing states in the country, largely due to migration The state’s population grew by 91,001 in 2024, or 1 69 percent Net migration was 91,277 4 , indicating that the state is succeeding at attracting and retaining workers . Here at the outset of 2025, economic conditions remain favorable, especially in comparison to historical trends
4 https://www.census.gov/programs-surveys/popest/data/tables.html

Nationally, there is a monthly Current Population Survey of about 60,000 households conducted by the Census Bureau for the Bureau of Labor Statistics (BLS) to determine employment status of the civilian population This information, along with other inputs, are used by DEW to operate the Local Area Unemployment Statistics program, which estimates the number of individuals employed and those not employed, but actively seeking employment for statewide and a variety of substate geographies
• The seasonally adjusted number of South Carolina workers decreased to 2,412,486
• That is a decrease of 679 people over the October 2024 estimate
• That is an increase of 16,552 people over the November 2023 estimate .
2,370,000 2,375,000 2,380,000 2,385,000 2,390,000 2,395,000 2,400,000 2,405,000 2,410,000 2,415,000 2,420,000 Aug2023 Sept2023 Oct2023 Nov2023 Dec2023 Jan2024 Feb2024 Mar2024 Apr2024 May2024 Jun2024 Jul2024 Aug2024 2,370,000 2,375,000 2,380,000 2,385,000 2,390,000 2,395,000 2,400,000 2,405,000 2,410,000 2,415,000 2,420,000 Sept2023 Oct2023 Nov2023 Dec2023 Jan2024 Feb2024 Mar2024 Apr2024 May2024 Jun2024 Jul2024 Aug2024 Sept2024 Oct2024
2,365,000 2,370,000 2,375,000 2,380,000 2,385,000 2,390,000 2,395,000 2,400,000 2,405,000 2,410,000 2,415,000 2,360,000 2,370,000 2,380,000 2,390,000 2,400,000 2,410,000 2,420,000 Jun2023 Jul2023 Aug2023
2,375,000 2,380,000 2,385,000 2,390,000 2,395,000 2,400,000 2,405,000 2,410,000 2,415,000 Nov2023 Dec2023 Jan2024 Feb2024 Mar2024 Apr2024 May2024 Jun2024 Jul2024 Aug2024 Sept2024 Oct2024 Nov2024
SEASONALLY ADJUSTED: Seasonal adjustment removes the effects of events that follow a regular pattern each year (i e tourist-related hiring and school closings in the summer) These adjustments make it easier to observe the cyclical and other nonseasonal movements in data over time
• The estimate of unemployed people increased to 121,501
• That is an increase of 3,404 people from the October estimate and a significant increase of 46,544 from the November 2023 estimate
• The state’s seasonally adjusted unemployment rate increased from 4 7 percent to 4 8 percent The national unemployment rate increased to 4 2 percent, according to the Current Population Survey LABOR FORCE:
• The state’s estimated labor force (people working plus unemployed people looking for work) increased to 2,533,987 while the labor force participation rate was unchanged at 57 .6 percent
• That is an increase of 2,725 people over the October 2024 estimate
• That is a significant increase of 63,096 individuals over the November 2023 estimate.
SEASONALLY ADJUSTED: Seasonal adjustment removes the effects of events that follow a regular pattern each year (i e tourist-related hiring and school closings in the summer) These adjustments make it easier to observe the cyclical and other nonseasonal movements in data over time
BLS conducts a monthly Current Employment Statistics survey of approximately 119,000 businesses and government agencies which yields national estimates of nonagricultural wage and salary employment, hours, and earnings by industry These data are processed by DEW to generate comparable data for the state and its metropolitan statistical areas (MSA)
The monthly survey of businesses in South Carolina marked an estimated increase of 4,200 nonfarm payroll jobs over the month to a level of 2,395,900
OCTOBER 2024 TO NOVEMBER 2024
2023 TO
2024
SEASONALLY ADJUSTED: Seasonal adjustment removes the effects of events that follow a regular pattern each year (i e tourist-related hiring and school closings in the summer) These adjustments make it easier to observe the cyclical and other nonseasonal movements in data over time
The monthly survey of businesses in South Carolina marked an estimated increase of 4,200 nonfarm payroll jobs over the month to a level of 2,395,900 .
OCTOBER 2024 TO NOVEMBER 2024
2023 TO
2024
NOTE: Employment estimates have been rounded to the nearest hundred. Sum of detail may not equal totals due to rounding or the exclusion of certain industries from publication. All data are subject to revision.
SEASONALLY ADJUSTED: Seasonal adjustment removes the effects of events that follow a regular pattern each year (i e tourist-related hiring and school closings in the summer) These adjustments make it easier to observe the cyclical and other nonseasonal movements in data over time
STATISTICAL AREA
Current month’s estimates are preliminary All data are subject to revision Substate estimates are not seasonally adjusted and may diverge from state-level figures.
Monthly Labor Force Participation Rate since January 2020
Jan-20Apr-20 Jul-20 Oct-20Jan-21Apr-21 Jul-21 Oct-21Jan-22Apr-22 Jul-22 Oct-22Jan-23Apr-23 Jul-23 Oct-23Jan-24Apr-24
2, 500,000
2, 400,000
2, 300,000
2, 200,000
2, 100,000
2, 000,000
1, 900,000
1, 800,000
Monthly EMPLOYMENT since January 2020
Jan-20Apr-20 Jul-20Oct-20Jan-21Apr-21 Jul-21Oct-21Jan-22Apr-22 Jul-22Oct-22Jan-23Apr-23 Jul-23Oct-23Jan-24Apr-24 Jul-24Oct-24
MONTH
CHARLESTON-NORTH CHARLESTON MSA
NOVEMBER 2024 (NOT SEASONALLY ADJUSTED)
Current month’s estimates are preliminary. All data are subject to revision.
NOVEMBER 2024 (NOT SEASONALLY ADJUSTED)
Current month’s estimates are preliminary. All data are subject to revision.
GREENVILLE-ANDERSON-MAULDIN MSA
NOVEMBER 2024 (NOT SEASONALLY ADJUSTED)
Current month’s estimates are preliminary. All data are subject to revision.
NOVEMBER 2024 (NOT SEASONALLY ADJUSTED)
Current month’s estimates are preliminary. All data are subject to revision.
NOVEMBER 2024 (NOT SEASONALLY ADJUSTED)
Current month’s estimates are preliminary. All data are subject to revision.
1 . Household Survey: Nationally, there is a monthly Current Population Survey of about 60,000 households conducted by the Census Bureau for the Bureau of Labor Statistics (BLS) to determine employment status of the civilian population This information, along with other inputs, is used by DEW to operate the Local Area Unemployment Statistics program, which estimates the number of individuals employed and those not employed, but actively seeking employment for statewide and a variety of sub-state geographies
2 Employer Survey: BLS conducts a monthly Current Employment Statistics survey of about 44,000 employers which yields national estimates of nonagricultural wage and salary employment, hours, and earnings by industry This data is processed by DEW to generate comparable data for the state and its metropolitan statistical areas
3 . Seasonally Adjusted: Seasonal adjustment removes the effects of events that follow a regular pattern each year (i e tourist-related hiring and school closings in the summer) These adjustments make it easier to observe the cyclical and other nonseasonal movements in data over time
4 . Not Seasonally Adjusted: Effects of regular or seasonal patterns have not been removed from this data
Data is published by Industry
Data is published by County
Counts Jobs Counts People
Utilizes an Establishment Survey
Reference week is the Pay Period that includes the 12th of the month
A job held by a person on unpaid leave during the reference week is not counted since they are not receiving pay
Does not count selfemployed workers
Does not include agricultural workers
Does not count unpaid family workers
Workers on strike during the entire reference period are not counted
The Current Population Survey (CPS), which is a Household Survey, is used to calculate LAUS
Reference week is the Calendar Week that includes the 12th of the month
A person on unpaid leave is counted as employed because they will return to their job
Does count self-employed workers
Includes both agricultural and non-agricultural workers
Counts unpaid family workers if they worked at least 15 unpaid hours for a family business or family farm during the reference week
Workers on strike during the reference week are counted as employed in LAUS

Do you need some help finding specific data? Have a great idea for a research project you’d like to discuss with someone? We love to collaborate!
DATA TRENDS is prepared by the LMI Division of the S C Department of Employment and Workforce with funding provided by the US Department of Labor Featured data is prepared in conjunction with the Bureau of Labor Statistics and current month estimates are always preliminary, with all previous data subject to revision
Interested in staying up to date with TRENDS as it’s released? Subscribe by clicking here!