TRENDS
SC Department of Employment and Workforce Labor Market Information Division Columbia, South Carolina 29202

October
Issue
Data
2022
South Carolina
dew.sc.gov scworkforceinfo.com

SC Department of Employment and Workforce Labor Market Information Division Columbia, South Carolina 29202

South Carolina’s Employment Situation (September 2022)
Local Area Unemployment Statistics
Current Employment Statistics — Not Seasonally Adjusted

Welcome to the October 2022 issue of Trends! How much does the average employee at a South Carolina manufacturer make? The answer is on page 21 …

I hope you and yours are having a wonderful holiday season. The Quarterly Census of Employment and Wages, which LMI produces in conjunction with the U.S. Bureau of Labor Statistics, provides deeply granular details on economic activity in our state, including how many establishments there are, how many people they employ, and how much they are paid. So for example, as of the first quarter of 2022, there were 69 firms in the nursery and tree production industry (NAICS 111421), though surely not all of them produce evergreens. Another 291 companies were categorized as gift, novelty, and souvenir retailers (NAICS 459420), so there are plenty of options for those of you looking to shop this month. You can find out more about QCEW on the LMI website here
This month’s featured article is about some of the results that DEW has gleaned from the South Carolina Labor Force Participation Task Force. Established earlier this year, the task force has sponsored outside researchers to determine why our state has one of the lowest participation rates in the country (56.7 percent as of October). One of those projects was a survey of people who filed for unemployment insurance and dropped out of DEW wage records during the pandemic. We wanted to know what happened to them. Were they working? If not, why not? What could convince them to come back? Read on to find out what we learned, and stay up to date on the task force’s activities at dew.sc.gov/taskforce
Also, LMI is hiring once again! We’re looking for a database administrator. Click here for more information. And as always, feel free to connect with us anytime via email at lmicustomerservice@dew.sc.gov.
 By Dr. Bryan Grady, Labor Market Information Director
One of the major initiatives undertaken by DEW in 2022 is the Labor Force Participation Task Force. Initially convened in March, this group of academics, researchers, and professionals with expertise in labor markets was tasked with sorting out why South Carolina ranks near the bottom among states when it comes to its labor force participation rate – the percentage of adults eligible to work who are either employed or actively looking for work. (Disclosure: I am one of two DEW staff who serve on the task force.)
After three meetings this spring, it was determined that DEW should hire outside experts for two projects. One is an analysis of the big-picture factors that have led to declining labor force participation and a review of potential policy solutions; that work is due by the end of the year. The other was a survey that was conducted among people who were suspected to have dropped out of the labor force. This work was completed in September and presented to the task force in October. The full report, as well as all other materials related to the task force, can be viewed on our website at https://dew.sc.gov/taskforce
The dark days of early 2020, when the number of people filing unemployment insurance (UI) claims hit unprecedented highs during the first wave of the COVID-19 pandemic, had a very unintended silver lining: DEW was able to identify a group of people who (a) were located in our employment and wage records during 2019, (b) filed for unemployment in 2020, and (c) were not in our wage records in 2021. Just over 150,000 people fell into this category. So DEW and our contractor, Millan Chicago LLC set out to craft an email survey to find out what had happened to these individuals, and if they had departed the labor force, what barriers to employment they faced and what might convince them to return to work. The survey was deployed in August; overall, there were 6,116 responses to the survey, or a response rate of about four percent—more than enough to be able to glean useful insights.
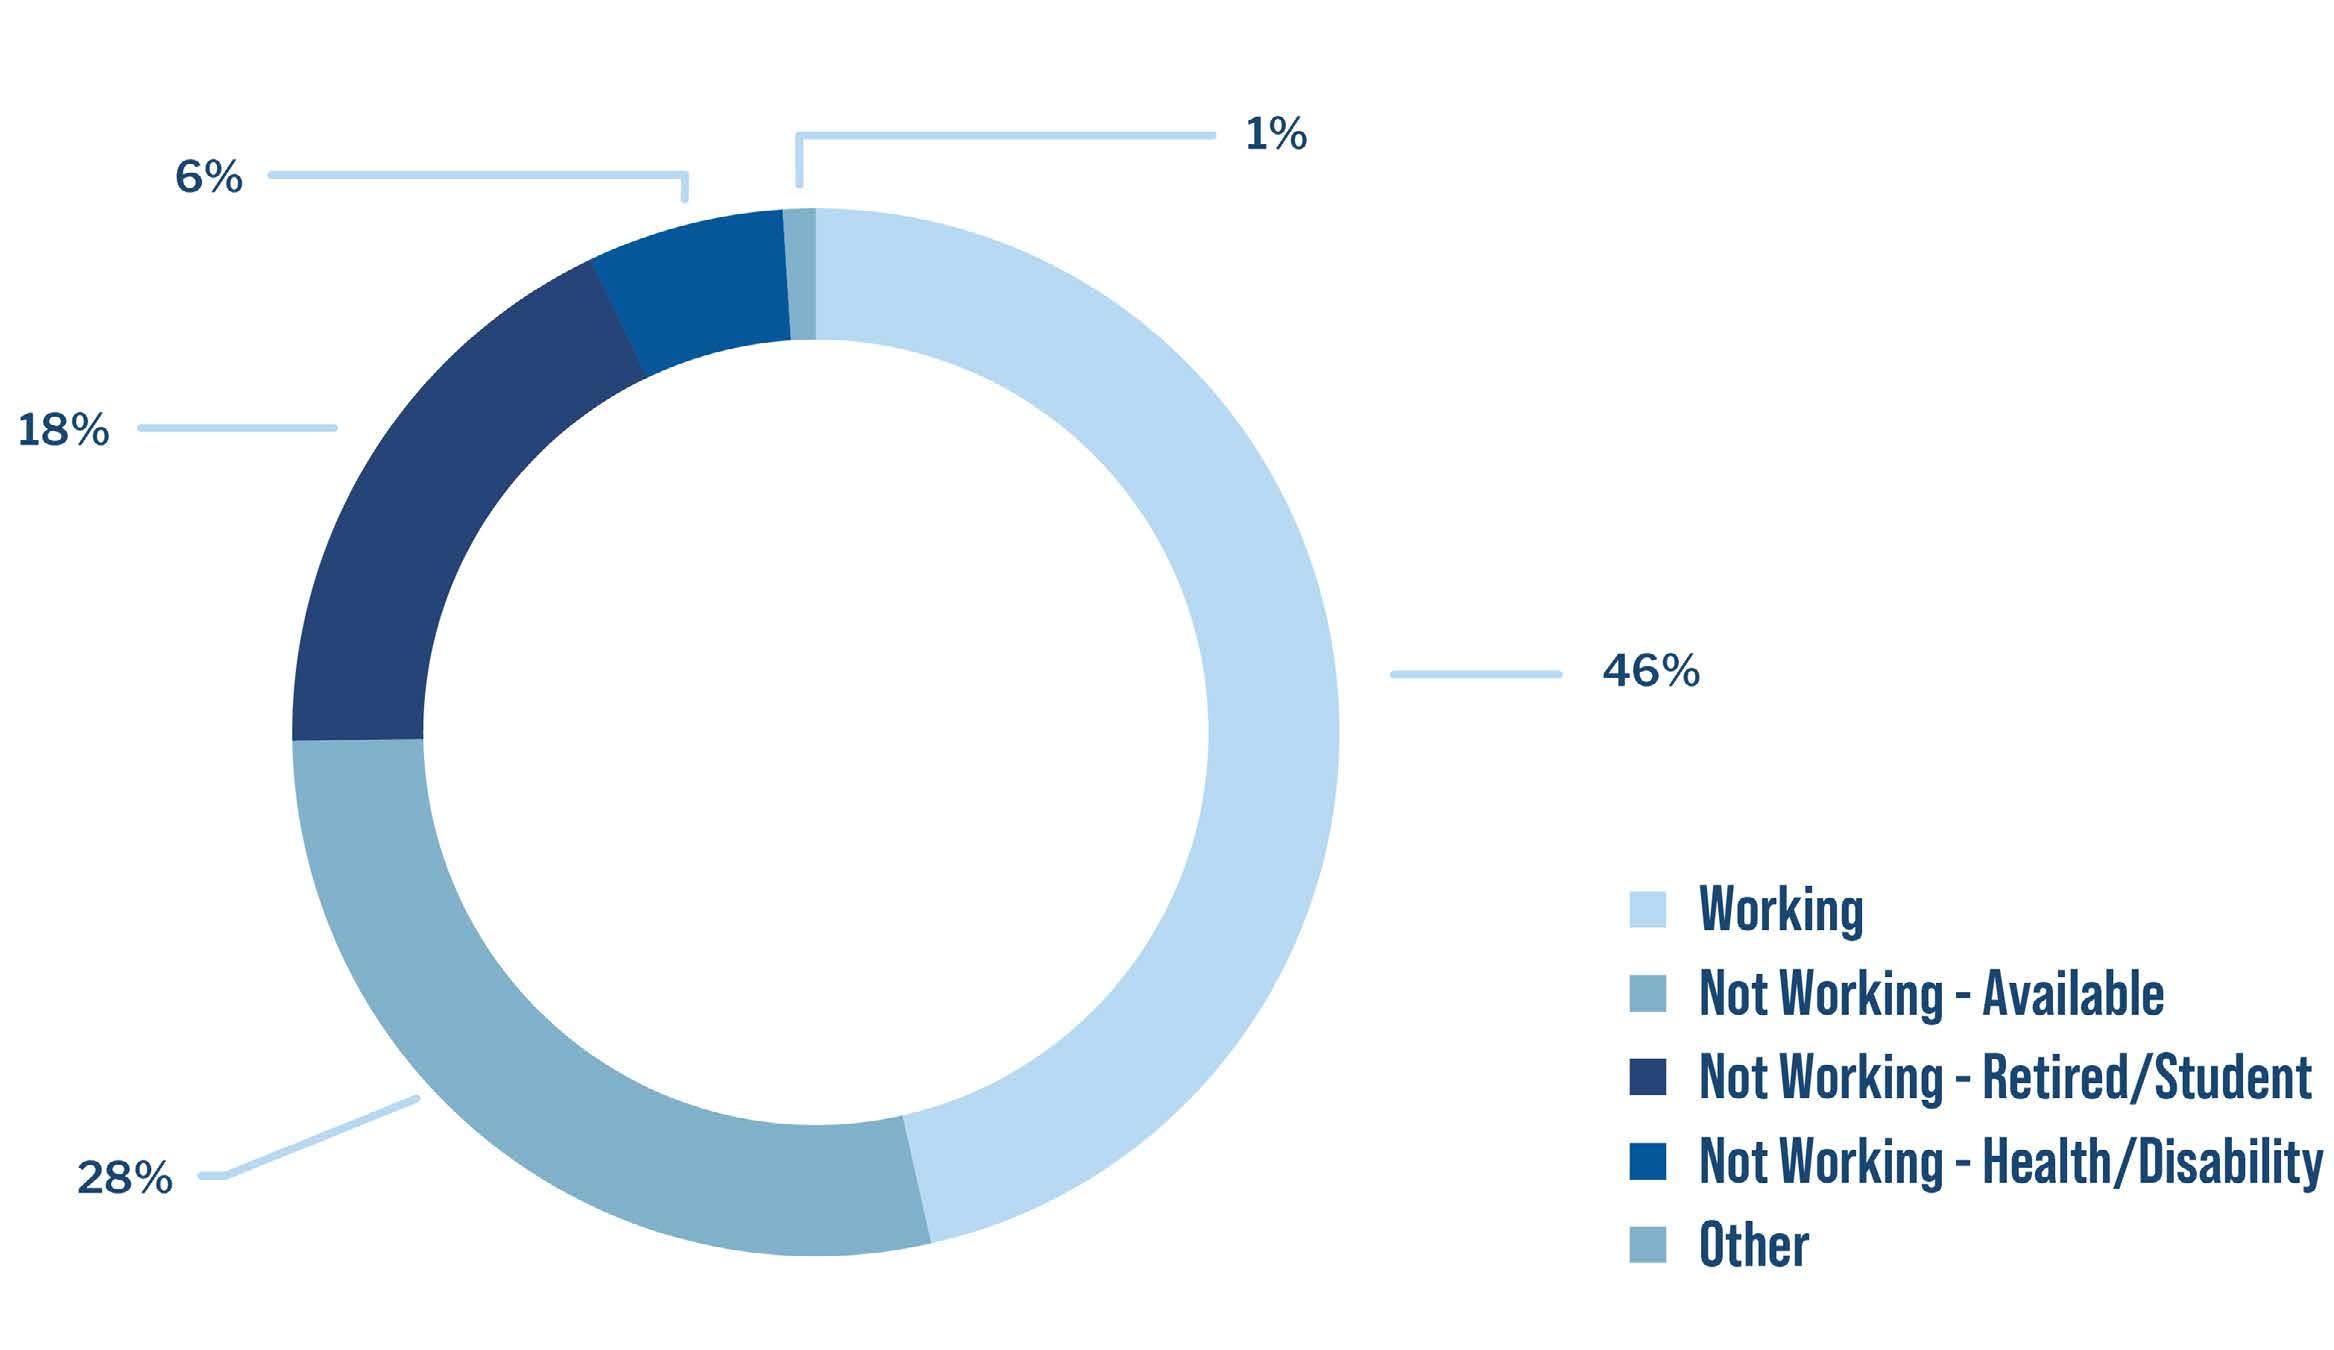
As it happens, 46 percent of those who took the survey reported they were in fact working (see Figure 1). There are lots of reasons why that might be the case. Anyone who is self-employed wouldn’t show up in the UI data because they don’t pay UI taxes. The same goes for contractors, gig workers, or anyone else that isn’t a traditional hourly or salaried employee. It’s also possible that the person left South Carolina, in which case they would show up in another state’s records. Last, the respondent could have been engaged in some sort of informal employment. All these factors help to explain the 46 percent figure.
Another 26 percent of respondents indicated that they were not working and not available to work. People in this group included students, retirees, caregivers, and those with permanent disability or health challenges that prevented employment. This left 28 percent of the group reporting that they were not working but could work. That last group is the population of interest: If South Carolina is going to increase its labor force participation rate, it is most likely to be done by bringing those who were previously employed but not actively seeking a job into the workforce.
Where are the characteristics of this group? One quick way to get a handle on it is to look at what categories of people are disproportionately represented in it—in other words, groups where more than 28 percent of respondents said they were not working but able to work:
• Black/African American: 32 percent
• Aged 54 or younger: 33 percent
• Less than college degree: 31 percent
• Living in Tier IV counties 37 percent
Among South Carolina’s 12 workforce development areas, Lower Savannah and Midlands had significantly more residents in this group on a percentage basis, while Trident and Waccamaw had significantly fewer.
SC Department of Employment and Workforce Labor Market Information Division Columbia, South Carolina 29202 dew.sc.gov scworkforceinfo.com
Disabilities
Lack Of Child Care
Stay With Child Age (Too Old)
Record
If someone reported that they were not working but able to do so, the survey then asked what was preventing them from seeking employment. The top answer—perhaps surprisingly, given how strong the labor market has been in the past 18 months—was low pay (see Figure 2), with 23 percent of respondents indicating this was a barrier. Broadly speaking, these barriers were consistent between sexes and races, but each one reported a couple of unique challenges.
• Women were more likely to say a lack of childcare or a desire to stay with their child was a barrier, while men indicated that a criminal record and limited information about available jobs were among the top challenges.

• Black respondents also cited criminal records, as well as a lack of training, while Whites were more likely to indicate that old age and low self-esteem were relevant barriers. (There were insufficient numbers of responses from other racial or ethnic groups to produce meaningful findings.)
As before, the Tier IV counties are a substantial outlier. While most of the state aligned with the overall finding that low pay was the most common barrier to employment, a lack of reliable transportation led the list at 27 percent for respondents from these overwhelmingly poor and rural areas. This suggests that different approaches may be required in these communities.
Finally, the survey sought to determine what would convince someone not currently working to return to the labor force. The answers were unequivocal and not particularly surprising: this population would be likely to consider employment if they were able to locate high paying jobs located close to home that offered flexible hours and working conditions (i.e., full or partial remote work). Other factors simply were not considered to be all that important for most respondents.
DEW is in the process of further evaluating these findings as it pertains to internal policy changes that can be enacted to improve labor force participation in South Carolina. However, many insights from this report and the pending macroeconomic analysis will require action by other actors, whether by the Governor, other cabinet agencies, the General Assembly, local governments, non-profits, and/ or the private sector. In 2023, the task force will be reconstituted to bring in new voices that can articulate a path forward for action on this pressing issue.
¹ Each year, the South Carolina Department of Revenue sorts the state’s counties into four tiers for purposes of awarding job tax credits, with businesses investing in the most economically distressed counties (Tier IV) receiving the largest amount of credits per job. The tier IV counties for 2022 are Allendale, Bamberg, Barnwell, Cherokee, Chester, Dillon, Lee, Marion, Marlboro, Orangeburg, Union, and Williamsburg.
SC Department of Employment and Workforce Labor Market Information Division Columbia, South Carolina 29202
EMPLOYMENT: The seasonally adjusted, monthly survey of households estimated the number of South Carolinians working decreased to 2,307,838.
• That is a significant decrease of 7,984 people over the September estimate.
• That is an increase of 23,631 people over the October 2021 estimate.
UNEMPLOYMENT: The estimate of unemployed people increased to 78,578..
• That is an increase of 3,174 people from September’s estimate and a decrease of 7,945 over the October 2021 estimate.
• The state’s seasonally adjusted unemployment rate increased to 3.3 percent from September’s estimate of 3.2 percent.
• Nationally, the unemployment rate increased to 3.7 percent from September’s estimate of 3.5 percent, according to the Current Population Survey.
LABOR FORCE: The state’s estimated labor force (people working plus unemployed people looking for work) decreased to 2,386,416 from September’s level of 2,391,226.
• That is a decrease of 4,810 individuals over the
The monthly survey of businesses in South Carolina marked an estimated increase of 2,600 nonfarm payroll jobs over the month to a level of 2,247,000.
• Industries that reported gains were Trade, Transportation, and Utilities (+1,900); Professional and Business Services (+900); Education and Health Services (+700); and Manufacturing (+400).

• Other Services (-400); Construction (-300); Government (-300); Financial Activities (-200); and Information (-100) industries declined.
• Leisure and Hospitality marked no change.
From October 2021 to October 2022, South Carolina’s economy has picked up 89,300 seasonally adjusted, nonfarm jobs.
• Industries with strong growth were Trade, Transportation, and Utilities (+22,500); Leisure and Hospitality (+20,500); Professional and Business Services (+16,800); Education and Health Services (+8,300); Manufacturing (+8,000); Financial Activities (+5,400); Other Services (+4,500); Government (+2,800); and Information (+2,300).
• The Construction industry declined (-2,100). September estimate.
• That is an increase of 15,686 individuals over the October 2021 estimate.
SC Department of Employment and Workforce Labor Market Information Division Columbia, South Carolina 29202
Not seasonally adjusted, nonfarm payroll employment increased by 12,000 from September 2022 to October 2022 for a total of 2,255,700.
• Industries reporting gains were Government (+4,200); Professional and Business Services (+4,000); Education and Health Services (+3,600); Trade, Transportation, and Utilities (+3,200); Construction (+600); and Financial Activities (+200).
• Leisure and Hospitality (-2,700); Other Services (-900); Manufacturing (-100); and Information (-100) industries marked declines
• The Mining and Logging industry showed no change over the month.
Since October 2021, not seasonally adjusted, nonfarm jobs were up 91,200 in South Carolina.
• Industries making strong annual gains were Trade, Transportation, and Utilities (+22,000); Leisure and Hospitality (+20,800); Professional and Business Services (+17,600); Educational and Health Services (+8,800); Manufacturing (+8,100); Financial Activities (+5,400); Other Services (+4,500); Government (+3,600); Information (+2,400); and Mining and Logging (+300).
• The Construction (-2,300) industry showed a decline over the year.
dew.sc.gov scworkforceinfo.com
11 10
3.5% 3.6% 3.2%
Area Unemployment Statistics Unemployment Rate by County
3.2% 6.0%
3.0% 4.2% 3.0%
3.9%
5.1% 4.9% 4.1% 4.6% 3.7%
7.7% 3.8%
3.9% 3.6% 5.4% 3.0%
3.1%
3.6%
5.6%
5.1% 3.6% 3.9%
4.0% 2.9%
dew.sc.gov scworkforceinfo.com SC Department of Employment and Workforce Labor Market Information Division Columbia, South Carolina 29202 Local
3.4% 4.3% LAUS EMPLOYMENT ESTIMATES (SEASONALLY ADJUSTED) CIVILIAN NON-INSTITUTIONAL POPULATION
5.6% 5.3% CIVILIAN LABOR FORCE TOTAL PERCENT OF POPULATION
3.9% 5.1% 3.3%
4.1% 3.1%
3.5%
3.4% EMPLOYMENT UNEMPLOYMENT TOTAL PERCENT OF POPULATION TOTAL RATE (%) 4,211,601 2,386,416 56.7 2,307,838 54.8 78,578 3.3 NOTE: Current month’s estimates are preliminary. All data are subject to revision. Civilian non-institutional population (age 16+) is not seasonally adjusted.
Abbeville County ↑ 9,537 9,142 395 4.1 9,464 9,123 341 3.6 9,602 9,217 385 4.0
Aiken County ↑ 73,580 71,068 2,512 3.4 73,453 71,330 2,123 2.9 74,166 72,126 2,040 2.8
Allendale County ↑ 2,216 2,072 144 6.5 2,243 2,111 132 5.9 2,389 2,230 159 6.7
Anderson County ↑ 92,122 89,143 2,979 3.2 91,514 88,973 2,541 2.8 90,401 87,609 2,792 3.1
Bamberg County ↑ 4,586 4,283 303 6.6 4,553 4,305 248 5.4 4,672 4,386 286 6.1
Barnwell County ↑ 7,484 7,095 389 5.2 7,494 7,149 345 4.6 7,532 7,099 433 5.7
Beaufort County ↑ 75,845 73,320 2,525 3.3 75,715 73,561 2,154 2.8 75,835 73,669 2,166 2.9
Berkeley County ↑ 111,251 107,396 3,855 3.5 110,872 107,646 3,226 2.9 107,873 104,556 3,317 3.1
Calhoun County ↑ 6,338 6,087 251 4.0 6,337 6,118 219 3.5 6,395 6,147 248 3.9
Charleston County ↑ 217,986 211,706 6,280 2.9 217,590 212,131 5,459 2.5 211,790 205,611 6,179 2.9
Cherokee County ↑ 24,686 23,439 1,247 5.1 24,168 23,235 933 3.9 24,833 23,814 1,019 4.1
Chester County ↑ 13,558 12,900 658 4.9 13,439 12,878 561 4.2 13,336 12,653 683 5.1
Chesterfield County ↑ 21,184 20,326 858 4.1 21,146 20,416 730 3.5 21,560 20,690 870 4.0
Clarendon County ↑ 11,798 11,259 539 4.6 11,827 11,361 466 3.9 12,075 11,565 510 4.2
Colleton County ↑ 15,845 15,259 586 3.7 15,803 15,295 508 3.2 16,147 15,581 566 3.5
Darlington County ↑ 28,921 27,803 1,118 3.9 28,863 27,892 971 3.4 29,804 28,712 1,092 3.7
Dillon County ↑ 12,886 12,235 651 5.1 12,804 12,257 547 4.3 13,040 12,361 679 5.2
Dorchester County ↑ 80,631 78,009 2,622 3.3 80,392 78,187 2,205 2.7 78,295 75,919 2,376 3.0
Edgefield County ↑ 10,372 9,967 405 3.9 10,337 10,001 336 3.3 10,361 10,079 282 2.7
Fairfield County ↑ 9,106 8,638 468 5.1 9,108 8,683 425 4.7 9,224 8,740 484 5.2
Florence County ↑ 64,238 61,923 2,315 3.6 64,108 62,099 2,009 3.1 66,062 63,826 2,236 3.4
Georgetown County ↑ 25,925 24,922 1,003 3.9 25,961 25,095 866 3.3 25,913 24,894 1,019 3.9
Greenville County ↑ 261,842 253,866 7,976 3.0 260,116 253,385 6,731 2.6 256,795 249,540 7,255 2.8
Greenwood County ↑ 29,992 28,742 1,250 4.2 29,730 28,685 1,045 3.5 30,179 29,041 1,138 3.8
Hampton County ↑ 7,811 7,578 233 3.0 7,833 7,636 197 2.5 7,968 7,743 225 2.8
Horry County ↑ 150,497 144,347 6,150 4.1 150,691 145,421 5,270 3.5 149,575 143,463 6,112 4.1
Jasper County ↑ 13,139 12,726 413 3.1 13,106 12,754 352 2.7 13,026 12,661 365 2.8
Kershaw County ↑ 28,953 27,918 1,035 3.6 28,964 28,062 902 3.1 29,155 28,249 906 3.1
Lancaster County ↑ 44,157 42,456 1,701 3.9 43,860 42,381 1,479 3.4 43,264 41,592 1,672 3.9
Laurens County ↑ 30,330 29,229 1,101 3.6 30,106 29,172 934 3.1 29,741 28,695 1,046 3.5
Lee County ↑ 6,345 6,002 343 5.4 6,319 6,034 285 4.5 6,557 6,240 317 4.8
Lexington County ↑ 149,036 144,627 4,409 3.0 149,065 145,362 3,703 2.5 150,160 146,333 3,827 2.5
Marion County ↑ 12,597 11,888 709 5.6 12,612 11,984 628 5.0 12,876 12,115 761 5.9
Marlboro County ↑ 8,406 7,756 650 7.7 8,342 7,807 535 6.4 8,836 8,183 653 7.4
McCormick County ↑ 3,440 3,310 130 3.8 3,445 3,324 121 3.5 3,287 3,157 130 4.0
Newberry County ↑ 18,917 18,332 585 3.1 18,871 18,393 478 2.5 19,098 18,595 503 2.6
Oconee County ↑ 33,948 32,856 1,092 3.2 34,006 33,050 956 2.8 34,018 33,020 998 2.9
Orangeburg County ↑ 32,939 30,961 1,978 6.0 32,862 31,130 1,732 5.3 33,680 31,549 2,131 6.3
Pickens County ↑ 58,489 56,469 2,020 3.5 57,971 56,357 1,614 2.8 57,089 55,450 1,639 2.9
Richland County ↑ 194,299 187,229 7,070 3.6 194,209 188,218 5,991 3.1 196,503 189,847 6,656 3.4
Saluda County ↑ 8,311 8,047 264 3.2 8,315 8,089 226 2.7 8,323 8,105 218 2.6
Spartanburg County ↑ 157,352 151,995 5,357 3.4 156,623 152,181 4,442 2.8 156,183 151,096 5,087 3.3
Sumter County ↑ 40,871 39,102 1,769 4.3 40,716 39,217 1,499 3.7 42,179 40,540 1,639 3.9
Union County ↑ 11,504 10,864 640 5.6 11,437 10,876 561 4.9 11,434 10,790 644 5.6
Williamsburg County ↑ 10,707 10,137 570 5.3 10,767 10,274 493 4.6 10,983 10,415 568 5.2
York County ↑ 150,071 145,014 5,057 3.4 149,119 144,746 4,373 2.9 146,854 142,035 4,819 3.3
Current month's estimates are preliminary. All data are subject to revision. ↑ Unemployment Rate Up
Substate estimates are not seasonally adjusted and may diverge from state-level figures. ↓ Unemployment Rate Down — Unemployment Rate =
SC Department of Employment and Workforce Labor Market Information Division Columbia, South Carolina 29202
Charleston-North Charleston ↑ 409,868 397,111 12,757 3.1 408,854 397,964 10,890 2.7 397,958 386,086 11,872 3.0
Columbia ↑ 396,043 382,546 13,497 3.4 395,998 384,532 11,466 2.9 399,760 387,421 12,339 3.1
Florence ↑ 93,159 89,726 3,433 3.7 92,971 89,991 2,980 3.2 95,866 92,538 3,328 3.5
Greenville -Anderson-Mauldin ↑ 442,783 428,707 14,076 3.2 439,707 427,887 11,820 2.7 434,026 421,294 12,732 2.9
Hilton Head IslandBluffton-Beaufort
Myrtle BeachConway-North Myrtle Beach
↑ 88,984 86,046 2,938 3.3 88,821 86,315 2,506 2.8 88,861 86,330 2,531 2.8
↑ 206,922 197,892 9,030 4.4 207,052 199,432 7,620 3.7 204,478 195,540 8,938 4.4
Spartanburg ↑ 168,856 162,859 5,997 3.6 168,060 163,057 5,003 3.0 167,617 161,886 5,731 3.4 Sumter ↑ 40,871 39,102 1,769 4.3 40,716 39,217 1,499 3.7 42,179 40,540 1,639 3.9 Augusta-Richmond County, GA (SC portion)
Charlotte-Concord-Gastonia, NC (SC portion)
↑ 83,952 81,035 2,917 3.5 83,790 81,331 2,459 2.9 84,527 82,205 2,322 2.7
↑ 207,786 200,370 7,416 3.6 206,418 200,005 6,413 3.1 203,454 196,280 7,174 3.5
368 3.2 11,466 11,007 459 4.0 Bluffton ↑ 12,868 12,510 358 2.8 12,869 12,551 318 2.5 12,895 12,570 325 2.5 Charleston ↑ 76,830 74,683 2,147 2.8 76,658 74,835 1,823 2.4 74,684 72,544 2,140 2.9 Columbia ↑ 56,414 54,023 2,391 4.2 56,209 54,308 1,901 3.4 56,762 54,778 1,984 3.5
Conway ↑ 10,306 9,750 556 5.4 10,251 9,822 429 4.2 10,198 9,690 508 5.0
Florence ↑ 18,871 18,209 662 3.5 18,825 18,260 565 3.0 19,419 18,768 651 3.4
Goose Creek ↑ 21,081 20,348 733 3.5 20,993 20,396 597 2.8 20,378 19,810 568 2.8
Greenville ↑ 37,501 36,350 1,151 3.1 37,246 36,281 965 2.6 36,764 35,731 1,033 2.8
Greer ↑ 18,435 17,949 486 2.6 18,343 17,928 415 2.3 18,140 17,690 450 2.5
Hanahan ↑ 14,623 14,279 344 2.4 14,619 14,313 306 2.1 14,226 13,902 324 2.3
Hilton Head Island ↑ 16,972 16,494 478 2.8 16,949 16,548 401 2.4 16,978 16,572 406 2.4
Mauldin ↑ 13,877 13,487 390 2.8 13,797 13,462 335 2.4 13,618 13,257 361 2.7
Mount Pleasant ↑ 51,292 50,152 1,140 2.2 51,297 50,253 1,044 2.0 49,686 48,708 978 2.0
Myrtle Beach ↑ 15,625 14,984 641 4.1 15,638 15,096 542 3.5 15,536 14,893 643 4.1
North Charleston ↑ 57,680 55,685 1,995 3.5 57,513 55,800 1,713 3.0 56,127 54,107 2,020 3.6
Rock Hill ↑ 40,738 39,108 1,630 4.0 40,406 39,035 1,371 3.4 40,043 38,304 1,739 4.3
Spartanburg ↑ 16,784 16,136 648 3.9 16,727 16,156 571 3.4 16,826 16,041 785 4.7
Summerville ↑ 25,870 25,040 830 3.2 25,829 25,097 732 2.8 25,119 24,368 751 3.0
Sumter ↑ 14,584 13,924 660 4.5 14,543 13,965 578 4.0 15,076 14,436 640 4.2
Current month’s estimates are preliminary. All data are subject to revision. Substate estimates are not seasonally adjusted and may diverge from state-level figures.
dew.sc.gov scworkforceinfo.com
Monthly Unemployment since January 2020
300,000 57.8 275,000 57.6 250,000 57.4 57.2
225,000 200,000 175,000
UNEMPLOYMENT 150,000 125,000 100,000 75,000 50,000 25,000
UNEMPLOYMENT RATE (PERCENT)
Monthly Labor Force Participation Rate since January 2020
LABOR FORCE PARTICIPATION RATE (PERCENT)
57.0 56.8 56.6 56.4 - 56.2
MONTH MONTH
8.0 6.0
EMPLOYMENT
Monthly Unemployment Rate since January 2020 Monthly Employment since January 2020 14.0 2,350,000 2,300,000 12.0 2,250,000 10.0 2,200,000 2,150,000 2,100,000 2,050,000 4.0 2,000,000 2.0 1,950,000 1,900,000 0.0 1,850,000 MONTH MONTH
dew.sc.gov scworkforceinfo.com
169,300 163,700 700 0.4% 6,300 3.8%
Sumter 38,100 38,000 38,200 100 0.3% -100 -0.3%
NOTE: Employment estimates have been rounded to the nearest hundred. Sum of detail may not equal totals due to rounding or the exclusion of certain industries from publication. All data are subject to revision.
OCTOBER 2022
SEPTEMBER 2022 TO OCTOBER 2022
OCTOBER 2021 TO OCTOBER 2022
OCTOBER 2022 SEPTEMBER 2022 OCTOBER 2021 # CHANGE % CHANGE # CHANGE % CHANGE
TotalNonfarm 2,247.0 2,244.4 2,157.7 +2.6 +0.1% +89.3 +4.1%
Total Private 1,876.2 1,873.3 1,789.7 +2.9 +0.2% +86.5 +4.8%
Goods Producing 366.2 366.1 360.0 +0.1 +0.0% +6.2 +1.7%
Mining, Logging and Construction 106.0 106.3 107.8 -0.3 -0.3% -1.8 -1.7%
Mining and Logging 4.7 4.7 4.4 +0.0 +0.0% +0.3 +6.8%
Construction 101.3 101.6 103.4 -0.3 -0.3% -2.1 -2.0%
Manufacturing 260.2 259.8 252.2 +0.4 +0.2% +8.0 +3.2%
Durable Goods 152.3 152.6 151.2 -0.3 -0.2% +1.1 +0.7%
Non-Durable Goods 107.9 107.2 101.0 +0.7 +0.7% +6.9 +6.8%
Service-Providing 1,880.8 1,878.3 1,797.7 +2.5 +0.1% +83.1 +4.6%
Private Service Providing 1,510.0 1,507.2 1,429.7 +2.8 +0.2% +80.3 +5.6%
Trade, Transportation, and Utilities 438.2 436.3 415.7 +1.9 +0.4% +22.5 +5.4%
Wholesale Trade 79.8 79.4 73.4 +0.4 +0.5% +6.4 +8.7%
Retail Trade 260.4 260.0 253.2 +0.4 +0.2% +7.2 +2.8%
Transportation, Warehousing, and Utilities 98.0 96.9 89.1 +1.1 +1.1% +8.9 +10.0%
Information 30.5 30.6 28.2 -0.1 -0.3% +2.3 +8.2%
Financial Activities 116.9 117.1 111.5 -0.2 -0.2% +5.4 +4.8%
Finance and Insurance 82.7 82.7 79.5 +0.0 +0.0% +3.2 +4.0%
Real Estate and Rental and Leasing 34.2 34.4 32.0 -0.2 -0.6% +2.2 +6.9%
Professional and Business Services 312.5 311.6 295.7 +0.9 +0.3% +16.8 +5.7%
Professional, Scientific, and Technical Services 112.7 112.9 106.2 -0.2 -0.2% +6.5 +6.1%
Management of Companies and Enterprises 23.7 24.0 23.8 -0.3 -1.3% -0.1 -0.4%
Administrative and Support and Waste Management and Remediation Services 176.1 174.7 165.7 +1.4 +0.8% +10.4 +6.3%
Education and Health Services 260.7 260.0 252.4 +0.7 +0.3% +8.3 +3.3%
Educational Services 47.0 46.1 41.1 +0.9 +2.0% +5.9 +14.4%
Health Care Services 213.7 213.9 211.3 -0.2 -0.1% +2.4 +1.1%
Leisure and Hospitality 268.9 268.9 248.4 +0.0 +0.0% +20.5 +8.3%
Arts, Entertainment, and Recreation 33.2 33.7 30.2 -0.5 -1.5% +3.0 +9.9%
Accommodation and Food Services 235.7 235.2 218.2 +0.5 +0.2% +17.5 +8.0%
Other Services 82.3 82.7 77.8 -0.4 -0.5% +4.5 +5.8%
Government 370.8 371.1 368.0 -0.3 -0.1% +2.8 +0.8%
Federal Government 36.4 36.4 36.1 +0.0 +0.0% +0.3 +0.8%
State Government 111.8 111.8 108.5 +0.0 +0.0% +3.3 +3.0%
Local Government 222.6 222.9 223.4 -0.3 -0.1% -0.8 -0.4%
scworkforceinfo.com
Greenville-Anderson-Mauldin
Hilton
Myrtle Beach-Conway-North Myrtle Beach 183,100 182,700 176,200 +400 +0.2% +6,900 +3.9%
Spartanburg 170,900 169,700 164,500 +1,200 +0.7% +6,400 +3.9%
Sumter 38,000 37,700 38,100 +300 +0.8% -100 -0.3%
NOTE: Employment estimates have been rounded to the nearest hundred. Sum of detail may not equal totals due to rounding or the exclusion of certain industries from publication. All data are subject to revision.
TotalNonfarm
2,255,700 2,243,700 2,164,500 +12,000 +0.5% +91,200 +4.2%
Total Private 1,879,200 1,871,400 1,791,600 +7,800 +0.4% +87,600 +4.9%
Goods Producing 365,700 365,200 359,600 +500 +0.1% +6,100 +1.7%
Mining, Logging and Construction 105,800 105,200 107,800 +600 +0.6% -2,000 -1.9%
Mining and Logging 4,700 4,700 4,400 +0 +0.0% +300 +6.8%
Construction 101,100 100,500 103,400 +600 +0.6% -2,300 -2.2%
Construction of Buildings 24,100 23,900 24,300 +200 +0.8% -200 -0.8%
Heavy and Civil Engineering Construction 15,800 15,800 15,800 +0 +0.0% +0 +0.0%
Specialty Trade Contractors 61,200 60,800 63,300 +400 +0.7% -2,100 -3.3%
Manufacturing 259,900 260,000 251,800 -100 -0.0% +8,100 +3.2%
Durable Goods 152,200 153,100 151,300 -900 -0.6% +900 +0.6%
Fabricated Metal Product Manufacturing 24,300 24,300 23,500 +0 +0.0% +800 +3.4%
Transportation Equipment Manufacturing 51,300 51,300 48,800 +0 +0.0% +2,500 +5.1%
Non-Durable Goods 107,700 106,900 100,500 +800 +0.7% +7,200 +7.2%
Textile Mills 13,400 13,300 12,700 +100 +0.8% +700 +5.5%
Plastics and Rubber Products Manufacturing 26,400 26,100 24,000 +300 +1.1% +2,400 +10.0%
Service-Providing 1,890,000 1,878,500 1,804,900 +11,500 +0.6% +85,100 +4.7%
Private Service Providing 1,513,500 1,506,200 1,432,000 +7,300 +0.5% +81,500 +5.7%
Trade, Transportation, and Utilities 436,700 433,500 414,700 +3,200 +0.7% +22,000 +5.3%
Wholesale Trade 79,700 79,500 73,400 +200 +0.3% +6,300 +8.6%
Merchant Wholesalers, Durable Goods 44,300 43,900 39,100 +400 +0.9% +5,200 +13.3%
Merchant Wholesalers, Nondurable Goods 22,300 22,300 21,000 +0 +0.0% +1,300 +6.2%
Retail Trade 259,400 257,500 252,700 +1,900 +0.7% +6,700 +2.7%
Motor Vehicle and Parts Dealers 34,100 34,100 32,500 +0 +0.0% +1,600 +4.9%
Food and Beverage Stores 48,900 49,300 48,800 -400 -0.8% +100 +0.2%
Health and Personal Care Stores 16,000 15,800 15,600 +200 +1.3% +400 +2.6%
Clothing and Clothing Accessories Stores 17,400 17,200 16,600 +200 +1.2% +800 +4.8%
General Merchandise Stores 56,200 55,800 58,100 +400 +0.7% -1,900 -3.3%
Transportation, Warehousing, and Utilities 97,600 96,500 88,600 +1,100 +1.1% +9,000 +10.2%
Utilities 11,200 11,100 10,900 +100 +0.9% +300 +2.8%
Transportation and Warehousing 86,400 85,400 77,700 +1,000 +1.2% +8,700 +11.2%
Information 30,400 30,500 28,000 -100 -0.3% +2,400 +8.6%
Financial Activities 117,300 117,100 111,900 +200 +0.2% +5,400 +4.8%
Finance and Insurance 82,900 82,700 79,700 +200 +0.2% +3,200 +4.0%
Credit Intermediation and Related Activities including Monetary Authorities 39,600 39,300 37,600 +300 +0.8% +2,000 +5.3%
Real Estate and Rental and Leasing 34,400 34,400 32,200 +0 +0.0% +2,200 +6.8%
Professional and Business Services 314,500 310,500 296,900 +4,000 +1.3% +17,600 +5.9%
Professional, Scientific, and Technical Services 112,300 111,200 105,600 +1,100 +1.0% +6,700 +6.3%
Architectural, Engineering, and Related Services 22,200 21,900 20,900 +300 +1.4% +1,300 +6.2%
Management of Companies and Enterprises 23,800 23,900 24,000 -100 -0.4% -200 -0.8%
Administrative and Support and Waste Management and Remediation Services 178,400 175,400 167,300 +3,000 +1.7% +11,100 +6.6%
Administrative and Support Services 165,100 162,100 154,500 +3,000 +1.9% +10,600 +6.9%
Employment Services 77,700 74,700 75,300 +3,000 +4.0% +2,400 +3.2%
Services to Buildings and Dwellings 39,200 39,900 37,600 -700 -1.8% +1,600 +4.3%
Education and Health Services 263,700 260,100 254,900 +3,600 +1.4% +8,800 +3.5%
Educational Services 48,400 46,300 42,100 +2,100 +4.5% +6,300 +15.0%
Health Care and Social Assistance 215,300 213,800 212,800 +1,500 +0.7% +2,500 +1.2%
Ambulatory Health Care Services 104,600 103,200 102,700 +1,400 +1.4% +1,900 +1.9%
Hospitals 36,400 36,100 35,900 +300 +0.8% +500 +1.4%
Nursing and Residential Care Facilities 37,200 37,000 37,200 +200 +0.5% +0 +0.0%
Leisure and Hospitality 268,300 271,000 247,500 -2,700 -1.0% +20,800 +8.4%
Arts, Entertainment, and Recreation 32,400 33,600 29,400 -1,200 -3.6% +3,000 +10.2%
Amusement, Gambling, and Recreation Industries 26,500 26,500 23,200 +0 +0.0% +3,300 +14.2%
Accommodation and Food Services 235,900 237,400 218,100 -1,500 -0.6% +17,800 +8.2%
Accommodation 31,500 32,000 28,300 -500 -1.6% +3,200 +11.3%
Food Services and Drinking Places 204,400 205,400 189,800 -1,000 -0.5% +14,600 +7.7%
Other Services 82,600 83,500 78,100 -900 -1.1% +4,500 +5.8%
Repair and Maintenance 23,800 23,400 21,700 +400 +1.7% +2,100 +9.7%
Personal and Laundry Services 19,800 19,900 18,600 -100 -0.5% +1,200 +6.5%
Government 376,500 372,300 372,900 +4,200 +1.1% +3,600 +1.0%
Federal Government 36,500 36,300 36,100 +200 +0.6% +400 +1.1% State
State
State
Local
AREA
Charleston-North Charleston
$1,137.12 $1,113.04 $1,059.04 +$24.08 +2.2% +$78.08 +7.4%
Columbia $934.47 $884.90 $870.91 +$49.57 +5.6% +$63.56 +7.3%
Florence $763.95 $779.86 $780.22 -$15.91 -2.0% -$16.27 -2.1%
Greenville-Anderson-Mauldin $1,074.78 $1,046.43 $1,009.26 +$28.35 +2.7% +$65.52 +6.5%
Hilton Head Island-Bluffton-Beaufort
$826.95 $842.15 $867.34 -$15.20 -1.8% -$40.39 -4.7%
Myrtle Beach-Conway-North Myrtle Beach $864.70 $844.06 $770.88 +$20.64 +2.5% +$93.82 +12.2%
Spartanburg $966.16 $928.40 $1,026.75 +$37.76 +4.1% -$60.59 -5.9%
Sumter $712.91 $721.61 $716.41 -$8.70 -1.2% -$3.50 -0.5%
INDUSTRY
TotalPrivate
$1,024.67 $995.75 $938.43 +$28.92 +2.9% +$86.24 +9.2%
Goods Producing $1,289.61 $1,295.99 $1,214.22 -$6.38 -0.5% +$75.39 +6.2%
Construction $1,266.84 $1,311.15 $1,241.11 -$44.31 -3.4% +$25.73 +2.1%
Manufacturing $1,298.30 $1,293.55 $1,217.06 +$4.75 +0.4% +$81.24 +6.7%
Private Service Providing $960.45 $923.60 $870.15 +$36.85 +4.0% +$90.30 +10.4%
Trade, Transportation, and Utilities $841.40 $832.47 $854.25 +$8.93 +1.1% -$12.85 -1.5%
Financial Activities $1,266.41 $1,178.80 $1,172.08 +$87.61 +7.4% +$94.33 +8.1%
Professional and Business Services $1,268.58 $1,215.95 $1,093.26 +$52.63 +4.3% +$175.32 +16.0%
Education and Health Services $999.24 $995.16 $997.83 +$4.08 +0.4% +$1.41 +0.1%
Leisure and Hospitality $453.90 $442.01 $407.75 +$11.89 +2.7% +$46.15 +11.3%
Other Services $822.51 $805.27 $752.50 +$17.24 +2.1% +$70.01 +9.3%
AREA
Charleston-North Charleston 34.7 34.3 34.7 +0.4 +1.2% 0 0%
Columbia 34.7 34.1 34.1 +0.6 +1.8% +0.6 +1.8%
Florence 33.1 33.6 33.5 -0.5 -1.5% -0.4 -1.2%
Greenville-Anderson-Mauldin 36.2 35.8 35.6 +0.4 +1.1% +0.6 +1.7%
Hilton Head Island-Bluffton-Beaufort 31.1 31.4 32.1 -0.3 -1.0% -1.0 -3.1%
Myrtle Beach-Conway-North Myrtle Beach 34.3 34.2 32.0 +0.1 +0.3% +2.3 +7.2%
Spartanburg 35.3 34.5 37.0 +0.8 +2.3% -1.7 -4.6%
Sumter 32.2 32.1 31.0 +0.1 +0.3% +1.2 +3.9%
+0.9 +2.3% +2.8 +7.6% Professional and Business Services 38.5 38.7 37.3 -0.2 -0.5% +1.2 +3.2% Education and Health Services 33.0 32.3 31.9 +0.7 +2.2% +1.1 +3.5% Leisure and Hospitality 25.5 25.2 25.5 +0.3 +1.2% +0.0 +0.0% Other Services 34.2 33.4 33.4 +0.8 +2.4% +0.8 +2.4%
Charleston-North Charleston
-$0.43 -1.6%
Myrtle Beach-Conway-North Myrtle Beach $25.21 $24.68 $24.09 +$0.53 +2.2% +$1.12 +4.7%
Spartanburg $27.37 $26.91 $27.75 +$0.46 +1.7% -$0.38 -1.4%
Sumter $22.14 $22.48 $23.11 -$0.34 -1.5% -$0.97 -4.2%
Current month’s estimates are preliminary. All data are subject to revision.
$17.80 $17.54 $15.99 +$0.26 +1.5% +$1.81 +11.3%
$24.05 $24.11 $22.53 -$0.06 -0.3% +$1.52 +6.8%
SC Department of Employment and Workforce Labor Market Information Division Columbia, South Carolina 29202
dew.sc.gov scworkforceinfo.com
CHARLESTON-NORTH CHARLESTON MSA
OCTOBER 2022 (NOT SEASONALLY ADJUSTED)
SEPTEMBER 2022 TO OCTOBER 2022
OCTOBER 2021 TO OCTOBER 2022
OCTOBER 2022 SEPTEMBER 2022 OCTOBER 2021 # CHANGE % CHANGE # CHANGE % CHANGE
Total Nonfarm 399,200 396,600 374,700 +2,600 +0.7% +24,500 +6.5%
Total Private 327,700 325,400 304,400 +2,300 +0.7% +23,300 +7.7%
Goods Producing 51,400 51,400 49,300 0 0% +2,100 +4.3%
Service-Providing 347,800 345,200 325,400 +2,600 +0.8% +22,400 +6.9%
Private Service Providing 276,300 274,000 255,100 +2,300 +0.8% +21,200 +8.3%
Mining, Logging and Construction 21,600 21,700 21,400 -100 -0.5% +200 +0.9%
Manufacturing 29,800 29,700 27,900 +100 +0.3% +1,900 +6.8%
Trade, Transportation, and Utilities 69,600 69,300 67,200 +300 +0.4% +2,400 +3.6%
Wholesale Trade 11,600 11,700 10,800 -100 -0.9% +800 +7.4%
Retail Trade 41,500 41,300 40,700 +200 +0.5% +800 +2.0%
General Merchandise Stores 7,300 7,300 7,600 0 0% -300 -4.0%
Transportation, Warehousing, and Utilities 16,500 16,300 15,700 +200 +1.2% +800 +5.1%
Information 7,900 8,000 7,400 -100 -1.3% +500 +6.8%
Financial Activities 17,500 17,200 16,700 +300 +1.7% +800 +4.8%
Professional and Business Services 66,700 65,200 58,400 +1,500 +2.3% +8,300 +14.2%
Administrative and Support and Waste Management and Remediation Services 30,000 29,700 26,700 +300 +1.0% +3,300 +12.4%
Education and Health Services 45,000 44,500 43,400 +500 +1.1% +1,600 +3.7%
Leisure and Hospitality 53,900 54,000 47,100 -100 -0.2% +6,800 +14.4%
Accommodation and Food Services 47,600 47,900 42,000 -300 -0.6% +5,600 +13.3%
Food Services and Drinking Places 39,000 39,100 34,400 -100 -0.3% +4,600 +13.4%
Other Services 15,700 15,800 14,900 -100 -0.6% +800 +5.4%
Government 71,500 71,200 70,300 +300 +0.4% +1,200 +1.7%
Federal Government 11,800 11,700 11,900 +100 +0.9% -100 -0.8%
State Government 31,200 31,200 30,200 0 0% +1,000 +3.3%
Local Government 28,500 28,300 28,200 +200 +0.7% +300 +1.1%
Current month’s estimates are preliminary. All data are subject to revision.
SC Department of Employment and Workforce Labor Market Information Division Columbia, South Carolina 29202
OCTOBER 2022 (NOT SEASONALLY ADJUSTED)
SEPTEMBER 2022 TO OCTOBER 2022 OCTOBER 2021 TO OCTOBER 2022
OCTOBER 2022 SEPTEMBER 2022 OCTOBER 2021 # CHANGE % CHANGE # CHANGE % CHANGE
Total Nonfarm 406,200 404,700 398,100 +1,500 +0.4% +8,100 +2.0%
Total Private 327,400 326,600 317,000 +800 +0.2% +10,400 +3.3%
Goods Producing 48,500 48,400 48,200 +100 +0.2% +300 +0.6%
Service-Providing 357,700 356,300 349,900 +1,400 +0.4% +7,800 +2.2%
Private Service Providing 278,900 278,200 268,800 +700 +0.3% +10,100 +3.8%
Mining, Logging and Construction 16,000 15,800 16,500 +200 +1.3% -500 -3.0%
Manufacturing 32,500 32,600 31,700 -100 -0.3% +800 +2.5%
Trade, Transportation, and Utilities 76,600 76,100 74,300 +500 +0.7% +2,300 +3.1%
Wholesale Trade 16,300 16,200 14,900 +100 +0.6% +1,400 +9.4%
Retail Trade 43,600 43,400 43,000 +200 +0.5% +600 +1.4%
Transportation, Warehousing, and Utilities 16,700 16,500 16,400 +200 +1.2% +300 +1.8%
Information 5,500 5,400 5,100 +100 +1.9% +400 +7.8%
Financial Activities 34,200 34,300 33,200 -100 -0.3% +1,000 +3.0%
Credit Intermediation and Related Activities including Monetary Authorities - Central Bank 7,400 7,400 7,300 0 0% +100 +1.4%
Professional and Business Services 52,600 51,400 51,900 +1,200 +2.3% +700 +1.4%
Administrative and Support and Waste Management and Remediation Services 29,200 28,100 29,800 +1,100 +3.9% -600 -2.0%
Education and Health Services 52,600 52,600 50,700 0 0% +1,900 +3.8%
Leisure and Hospitality 40,700 41,500 37,600 -800 -1.9% +3,100 +8.2%
Food Services and Drinking Places 33,500 34,100 31,700 -600 -1.8% +1,800 +5.7%
Other Services 16,700 16,900 16,000 -200 -1.2% +700 +4.4%
Government 78,800 78,100 81,100 +700 +0.9% -2,300 -2.8%
Federal Government 11,100 11,100 11,100 0 0% 0 0%
State Government 34,100 33,400 33,400 +700 +2.1% +700 +2.1%
Local Government 33,600 33,600 36,600 0 0% -3,000 -8.2%
Current month’s estimates are preliminary. All data are subject to revision.
dew.sc.gov scworkforceinfo.com
GREENVILLE-ANDERSON-MAULDIN MSA
OCTOBER 2022 (NOT SEASONALLY ADJUSTED)
SEPTEMBER 2022 TO OCTOBER 2022
OCTOBER 2021 TO OCTOBER 2022
OCTOBER 2022 SEPTEMBER 2022 OCTOBER 2021 # CHANGE % CHANGE # CHANGE % CHANGE
Total Nonfarm 451,500 446,500 428,900 +5,000 +1.1% +22,600 +5.3%
Total Private 388,000 384,100 367,300 +3,900 +1.0% +20,700 +5.6%
Goods Producing 81,000 80,400 78,100 +600 +0.8% +2,900 +3.7%
Service-Providing 370,500 366,100 350,800 +4,400 +1.2% +19,700 +5.6%
Private Service Providing 307,000 303,700 289,200 +3,300 +1.1% +17,800 +6.2%
Mining, Logging and Construction 19,400 19,200 19,500 +200 +1.0% -100 -0.5%
Manufacturing 61,600 61,200 58,600 +400 +0.7% +3,000 +5.1%
Trade, Transportation, and Utilities 82,800 82,300 78,000 +500 +0.6% +4,800 +6.2%
Wholesale Trade 20,100 20,100 18,400 0 0% +1,700 +9.2%
Retail Trade 48,800 48,300 46,100 +500 +1.0% +2,700 +5.9%
Transportation, Warehousing, and Utilities 13,900 13,900 13,500 0 0% +400 +3.0%
Information 7,200 7,200 6,600 0 0% +600 +9.1%
Financial Activities 22,100 22,000 20,900 +100 +0.5% +1,200 +5.7%
Professional and Business Services 77,100 75,300 74,000 +1,800 +2.4% +3,100 +4.2%
Professional, Scientific, and Technical Services 26,300 25,600 23,400 +700 +2.7% +2,900 +12.4%
Management of Companies and Enterprises 5,800 5,700 5,600 +100 +1.8% +200 +3.6%
Administrative and Support and Waste Management 45,000 44,000 45,000 +1,000 +2.3% 0 0%
Education and Health Services 55,800 54,900 53,400 +900 +1.6% +2,400 +4.5%
Educational Services 13,300 12,800 11,300 +500 +3.9% +2,000 +17.7%
Health Care and Social Assistance 42,500 42,100 42,100 +400 +1.0% +400 +1.0%
Leisure and Hospitality 46,600 46,500 41,600 +100 +0.2% +5,000 +12.0% Other Services 15,400 15,500 14,700 -100 -0.7% +700 +4.8%
Government 63,500 62,400 61,600 +1,100 +1.8% +1,900 +3.1%
Federal Government 3,000 3,000 2,900 0 0% +100 +3.5%
State Government 15,900 15,500 15,000 +400 +2.6% +900 +6.0%
Local Government 44,600 43,900 43,700 +700 +1.6% +900 +2.1%
Current month’s estimates are preliminary. All data are subject to revision.
SEPTEMBER 2022 TO OCTOBER 2022
OCTOBER 2021 TO OCTOBER 2022
OCTOBER 2022 SEPTEMBER 2022 OCTOBER 2021 # CHANGE % CHANGE # CHANGE % CHANGE
Total Nonfarm 183,100 182,700 176,200 +400 +0.2% +6,900 +3.9%
Total Private 158,600 158,600 152,500 0 0% +6,100 +4.0%
Goods Producing 15,600 15,600 15,800 0 0% -200 -1.3%
Service-Providing 167,500 167,100 160,400 +400 +0.2% +7,100 +4.4%
Private Service Providing 143,000 143,000 136,700 0 0% +6,300 +4.6%
Mining, Logging and Construction 10,600 10,600 10,900 0 0% -300 -2.8%
Manufacturing 5,000 5,000 4,900 0 0% +100 +2.0%
Trade, Transportation, and Utilities 40,900 40,500 38,700 +400 +1.0% +2,200 +5.7%
Wholesale Trade 3,600 3,600 3,400 0 0% +200 +5.9%
Retail Trade 32,500 32,100 30,700 +400 +1.3% +1,800 +5.9%
Transportation, Warehousing, and Utilities 4,800 4,800 4,600 0 0% +200 +4.4%
Information 2,500 2,500 2,400 0 0% +100 +4.2%
Financial Activities 10,400 10,500 10,100 -100 -1.0% +300 +3.0%
Professional and Business Services 18,100 17,900 17,200 +200 +1.1% +900 +5.2%
Education and Health Services 20,700 20,400 19,800 +300 +1.5% +900 +4.6%
Leisure and Hospitality 43,500 44,300 41,800 -800 -1.8% +1,700 +4.1%
Accommodation and Food Services 36,600 37,300 35,500 -700 -1.9% +1,100 +3.1%
Food Services and Drinking Places 27,500 28,200 27,000 -700 -2.5% +500 +1.9%
Other Services 6,900 6,900 6,700 0 0% +200 +3.0%
Government 24,500 24,100 23,700 +400 +1.7% +800 +3.4%
Federal Government 1,500 1,500 1,400 0 0% +100 +7.1%
State Government 5,000 4,900 4,900 +100 +2.0% +100 +2.0%
Local Government 18,000 17,700 17,400 +300 +1.7% +600 +3.5%
Current month’s estimates are preliminary. All data are subject to revision.
SC Department of Employment and Workforce Labor Market Information Division Columbia, South Carolina 29202
dew.sc.gov scworkforceinfo.com
OCTOBER 2022 (NOT SEASONALLY ADJUSTED)
SEPTEMBER 2022 TO OCTOBER 2022 OCTOBER 2021 TO OCTOBER 2022
OCTOBER 2022 SEPTEMBER 2022 OCTOBER 2021 # CHANGE % CHANGE # CHANGE % CHANGE
Total Nonfarm 170,900 169,700 164,500 +1,200 +0.7% +6,400 +3.9%
Total Private 142,100 142,100 137,400 0 0% +4,700 +3.4%
Goods Producing 45,900 45,900 44,200 0 0% +1,700 +3.9%
Service-Providing 125,000 123,800 120,300 +1,200 +1.0% +4,700 +3.9% Private Service Providing 96,200 96,200 93,200 0 0% +3,000 +3.2%
Mining, Logging and Construction 7,200 7,200 7,200 0 0% 0 0%
Manufacturing 38,700 38,700 37,000 0 0% +1,700 +4.6%
Durable Goods 26,800 26,900 25,700 -100 -0.4% +1,100 +4.3%
Non-Durable Goods 11,900 11,800 11,300 +100 +0.9% +600 +5.3%
Transportation, Warehousing, and Utilities 37,100 37,300 36,200 -200 -0.5% +900 +2.5%
Wholesale Trade 8,400 8,400 8,000 0 0% +400 +5.0% Retail Trade 16,000 16,300 16,400 -300 -1.8% -400 -2.4%
Transportation, Warehousing, and Utilities 12,700 12,600 11,800 +100 +0.8% +900 +7.6%
Information 700 700 700 0 0% 0 0%
Financial Activities 5,100 5,000 5,000 +100 +2.0% +100 +2.0%
Professional and Business Services 18,700 18,600 18,000 +100 +0.5% +700 +3.9%
Education and Health Services 15,000 14,900 14,700 +100 +0.7% +300 +2.0%
Leisure and Hospitality 14,200 14,200 13,500 0 0% +700 +5.2%
Other Services 5,400 5,500 5,100 -100 -1.8% +300 +5.9% Government 28,800 27,600 27,100 +1,200 +4.4% +1,700 +6.3% Federal Government 700 600 700 +100 +16.7% 0 0% State Government 4,000 4,000 4,000 0 0% 0 0% Local Government 24,100 23,000 22,400 +1,100 +4.8% +1,700 +7.6% Current month’s estimates are preliminary. All data are subject to revision.
OCTOBER
SC Department of Employment and Workforce Labor Market Information Division Columbia, South Carolina 29202
TotalNonfarm 90,500 90,000 90,600 +500 +0.6% -100 -0.1%
Total Private 73,600 73,200 73,300 +400 +0.6% +300 +0.4%
Goods Producing 14,000 14,100 14,300 -100 -0.7% -300 -2.1%
Service-Providing 76,500 75,900 76,300 +600 +0.8% +200 +0.3%
Private Service Providing 59,600 59,100 59,000 +500 +0.9% +600 +1.0%
Trade, Transportation, and Utilities 19,200 19,000 19,300 +200 +1.1% -100 -0.5%
Government 16,900 16,800 17,300 +100 +0.6% -400 -2.3%
Federal Government 800 700 700 +100 +14.3% +100 +14.3%
State Government 4,500 4,400 4,700 +100 +2.3% -200 -4.3%
Local Government 11,600 11,700 11,900 -100 -0.9% -300 -2.5%
TotalNonfarm 84,200 83,800 82,200 +400 +0.5% +2,000 +2.4% Total Private 72,400 72,200 70,700 +200 +0.3% +1,700 +2.4% Goods Producing 6,700 6,700 6,900 0 0% -200 -2.9% Service-Providing 77,500 77,100 75,300 +400 +0.5% +2,200 +2.9% Private
Providing 65,700 65,500 63,800 +200 +0.3% +1,900 +3.0% Government 11,800 11,600 11,500 +200 +1.7% +300 +2.6%
OCTOBER 2022 (NOT SEASONALLY
SEPTEMBER 2022 TO OCTOBER 2022 OCTOBER 2021 TO OCTOBER 2022
TotalNonfarm 38,000 37,700 38,100 +300 +0.8% -100 -0.3%
Total Private 31,800 31,600
YEAR CIVILIAN NON-INSTITUTIONAL POPULATION LABOR FORCE PARTICIPATION RATE (PERCENT) EMPLOYMENT-POPULATION RATIO (PERCENT) LABOR FORCE EMPLOYMENT UNEMPLOYMENT UNEMPLOYMENT RATE (PERCENT)
1976 2,007,417 64.7 60.2 1,299,241 1,207,662 91,579 7.0
1977 2,061,250 64.4 60.0 1,327,423 1,237,495 89,928 6.8
1978 2,117,667 64.1 60.5 1,356,921 1,281,597 75,324 5.6
1979 2,169,417 63.4 60.2 1,375,201 1,306,773 68,428 5.0
1980 2,221,250 62.8 58.6 1,395,675 1,301,796 93,879 6.7
1981 2,266,583 63.2 58.0 1,432,219 1,314,907 117,312 8.2
1982 2,307,333 64.2 57.3 1,482,373 1,322,883 159,490 10.8
1983 2,341,083 63.2 56.9 1,479,137 1,333,162 145,975 9.9
1984 2,378,500 62.9 58.5 1,495,188 1,391,286 103,902 6.9
1985 2,426,500 63.8 59.5 1,548,924 1,443,612 105,312 6.8
1986 2,455,333 64.9 60.7 1,592,306 1,491,069 101,237 6.4
1987 2,495,333 65.4 61.8 1,631,897 1,542,170 89,727 5.5
1988 2,533,000 65.6 62.5 1,660,533 1,583,928 76,605 4.6
1989 2,566,000 66.0 62.9 1,693,438 1,615,009 78,429 4.6
1990 2,611,843 66.5 63.3 1,737,831 1,652,949 84,882 4.9
1991 2,663,759 66.3 62.3 1,767,123 1,659,196 107,927 6.1
1992 2,699,745 66.7 62.2 1,799,677 1,678,803 120,874 6.7 1993 2,739,480 66.7 61.8 1,826,650 1,693,483 133,167 7.3 1994 2,775,049 66.4 62.3 1,841,428 1,727,714 113,714 6.2 1995 2,813,952 66.2 62.8 1,864,221 1,768,540 95,681 5.1
1996 2,851,104 66.2 62.4 1,886,064 1,779,221 106,843 5.7 1997 2,897,839 66.3 63.3 1,920,244 1,834,337 85,907 4.5 1998 2,945,825 65.9 63.5 1,940,846 1,870,270 70,576 3.6 1999 2,989,560 65.5 62.8 1,958,598 1,877,345 81,253 4.1 2000 3,027,367 64.9 62.5 1,965,481 1,892,559 72,922 3.7 2001 3,064,191 63.4 60.0 1,941,956 1,839,246 102,710 5.3 2002 3,098,739 63.1 59.0 1,954,548 1,828,735 125,813 6.4 2003 3,133,915 63.8 59.2 1,999,485 1,855,599 143,886 7.2 2004 3,178,645 64.3 59.5 2,043,864 1,891,722 152,142 7.4 2005 3,234,049 64.0 59.4 2,071,111 1,919,644 151,467 7.3 2006 3,305,437 65.0 60.5 2,148,698 2,001,245 147,453 6.9 2007 3,374,548 63.9 60.0 2,155,198 2,024,493 130,705 6.1 2008 3,439,974 62.8 58.2 2,160,084 2,002,903 157,181 7.3 2009 3,490,448 62.1 55.0 2,166,737 1,919,307 247,430 11.4
2010 3,564,619 61.0 54.1 2,174,535 1,928,442 246,093 11.3
2011 3,612,048 60.5 54.2 2,185,171 1,957,493 227,678 10.4
2012 3,655,515 59.9 54.5 2,190,203 1,992,957 197,246 9.0
2013 3,704,281 59.3 54.9 2,197,876 2,034,404 163,472 7.4
2014 3,759,002 59.1 55.4 2,222,426 2,082,941 139,485 6.3
2015 3,822,409 59.3 55.8 2,267,837 2,134,087 133,750 5.9
2016 3,888,005 58.8 55.9 2,286,054 2,174,301 111,753 4.9
2017 3,897,645 58.0 55.6 2,261,766 2,166,708 95,058 4.2
2018 3,948,448 57.7 55.8 2,279,431 2,202,377 77,054 3.4
2019 4,002,601 58.0 56.4 2,321,189 2,256,313 64,876 2.8
2020 4,058,279 57.4 54.0 2,330,863 2,191,331 139,532 6.0
2021 4,117,555 57.4 55.1 2,364,366 2,269,813 94,553 4.0
YEAR
1939 310,100 1960 582,500 1981 1,196,500 2002 1,795,400
1940 328,600 1961 587,000 1982 1,162,300 2003 1,799,100
1941 387,500 1962 609,800 1983 1,189,000 2004 1,826,600
1942 416,500 1963 630,600 1984 1,262,500 2005 1,862,900
1943 428,500 1964 651,500 1985 1,296,200 2006 1,905,700
1944 408,600 1965 686,000 1986 1,338,000 2007 1,945,000
1945 396,000 1966 734,900 1987 1,392,200 2008 1,926,300
1946 411,600 1967 754,500 1988 1,449,000 2009 1,814,400
1947 436,200 1968 782,900 1989 1,499,700 2010 1,811,300
1948 456,400 1969 819,800 1990 1,527,600 2011 1,832,500
1949 443,100 1970 842,000 1991 1,497,300 2012 1,864,300
1950 461,400 1971 862,600 1992 1,511,800 2013 1,901,000
1951 505,800 1972 920,300 1993 1,553,000 2014 1,951,300
1952 544,300 1973 984,000 1994 1,592,000 2015 2,006,700
1953 543,900 1974 1,015,800 1995 1,636,300 2016 2,055,300
1954 519,700 1975 982,600 1996 1,669,400 2017 2,096,100
1955 533,000 1976 1,038,100 1997 1,718,800 2018 2,154,800
1956 542,900 1977 1,081,700 1998 1,779,800 2019 2,189,600
1957 545,000 1978 1,137,500 1999 1,826,300 2020 2,081,600
1958 545,900 1979 1,176,000 2000 1,854,000 2021 2,146,300
1959 566,900 1980 1,188,800 2001 1,814,800
1. Household Survey: Nationally, there is a monthly Current Population Survey of about 60,000 households conducted by the Census Bureau for the Bureau of Labor Statistics (BLS) to determine employment status of the civilian population. This information, along with other inputs, are used by DEW to operate the Local Area Unemployment Statistics program, which estimates the number of individuals employed and those not employed, but actively seeking employment for statewide and a variety of sub-state geographies.
2. Employer Survey: BLS conducts a monthly Current Employment Statistics survey of about 44,000 employers which yields national estimates of nonagricultural wage and salary employment, hours, and earnings by industry. These data are processed by DEW to generate comparable data for the state and its metropolitan statistical areas.
3. Seasonally Adjusted: Seasonal adjustment removes the effects of events that follow a regular pattern each year (i.e. tourist-related hiring and school closings in the summer). These adjustments make it easier to observe the cyclical and other nonseasonal movements in data over time.
4. Not Seasonally Adjusted: Effects of regular or seasonal patterns have not been removed from these data.
Data is published by Industry Data is published by County

Counts Jobs Counts People
Utilizes an Establishment Survey
Reference week is the Pay Period that includes the 12th of the month
The Current Population Survey (CPS), which is a Household Survey, is used to calculate LAUS
Reference week is the Calendar Week that includes the 12th of the month
A job held by a person on unpaid leave during the reference week is not counted since they are not receiving pay
A person on unpaid leave is counted as employed because they will return to their job
Does not count selfemployed workers Does count self-employed workers
Does not include agricultural workers Includes both agricultural and non-agricultural workers
Does not count unpaid family workers
Workers on strike during the entire reference period are not counted
Counts unpaid family workers if they worked at least 15 unpaid hours for a family business or family farm during the reference week
Workers on strike during the reference week are counted as employed in LAUS
SC Department of Employment and Workforce Labor Market Information Division Columbia, South Carolina 29202
Find more information at scworkforceinfo.com
Do you need some help finding the data you need? Have a great idea for a research project you’d like to discuss with someone? We love to collaborate!
DATA TRENDS is prepared by the LMI Division of the S.C. Department of Employment and Workforce with funding provided by the US Department of Labor. Featured data is prepared in conjunction with the Bureau of Labor Statistics and current month estimates are always preliminary, with all previous data subject to revision.
Interested in staying up to date with Trends as it’s released? Subscribe by clicking here!
SC Department of Employment and Workforce Labor Market Information Division Columbia, South Carolina 29202