South Carolina Data TRENDS


By Carol Hayman, Workforce

Did you know that the length of the average work week in South Carolina varies a lot based on where you live? Turn to page 24 to learn more
We are now deep into the long South Carolina summer, and as Glenn Frey once repeatedly informed us in song, the heat is on Many businesses are still hiring; according to the most recent data from the U .S Bureau of Labor Statistics (BLS), there are 157,000 job openings statewide, the fifth most in the country as a percent of total employment DEW, in partnership with Lt Gov Pamela Evette, is working to remind students and their parents that a job can be a great springboard into a career, college, or military service Businesses tell us that what they are looking for most are soft skills like communication, leadership, and teamwork, and one of the best places to learn them is in a workplace setting . DEW’s Youth Employment Site is a great place to find out about opportunities across South Carolina. And of course, any jobseeker can visit one of the dozens of SC Works offices to access services to help them start or get a leg up in their career
Canny observers of the South Carolina economy and overall milieu (many of you being readers of this periodical, I must assume) have surely noticed the rollicking pace of growth in recent years The state’s performance across a number of metrics before, after, and in some cases, during the pandemic, has been a grand success Or, as Workforce Insights Analyst and this month’s feature piece author Carol Hayman puts it, South Carolina has been booming GDP is up, wages are up, the population is up Employment? At dizzying heights Read on to get a precise look at what’s been happening with all these stats and others over time, plus some keen insights into the top industries driving all this growth
If you have any questions about our state’s labor market or know someone who does, just shoot us a line at lmicustomerservice@dew.sc.gov


Bryan P Grady, Ph D Assistant Executive Director for Labor Market Information SC Department of Employment and Workforce

By Carol Hayman, Workforce Insights Analyst
Introduction
South Carolina has been in growth mode in recent years This growth involves multiple aspects of the state, including such key economic factors as gross domestic product, population, employment, and wages
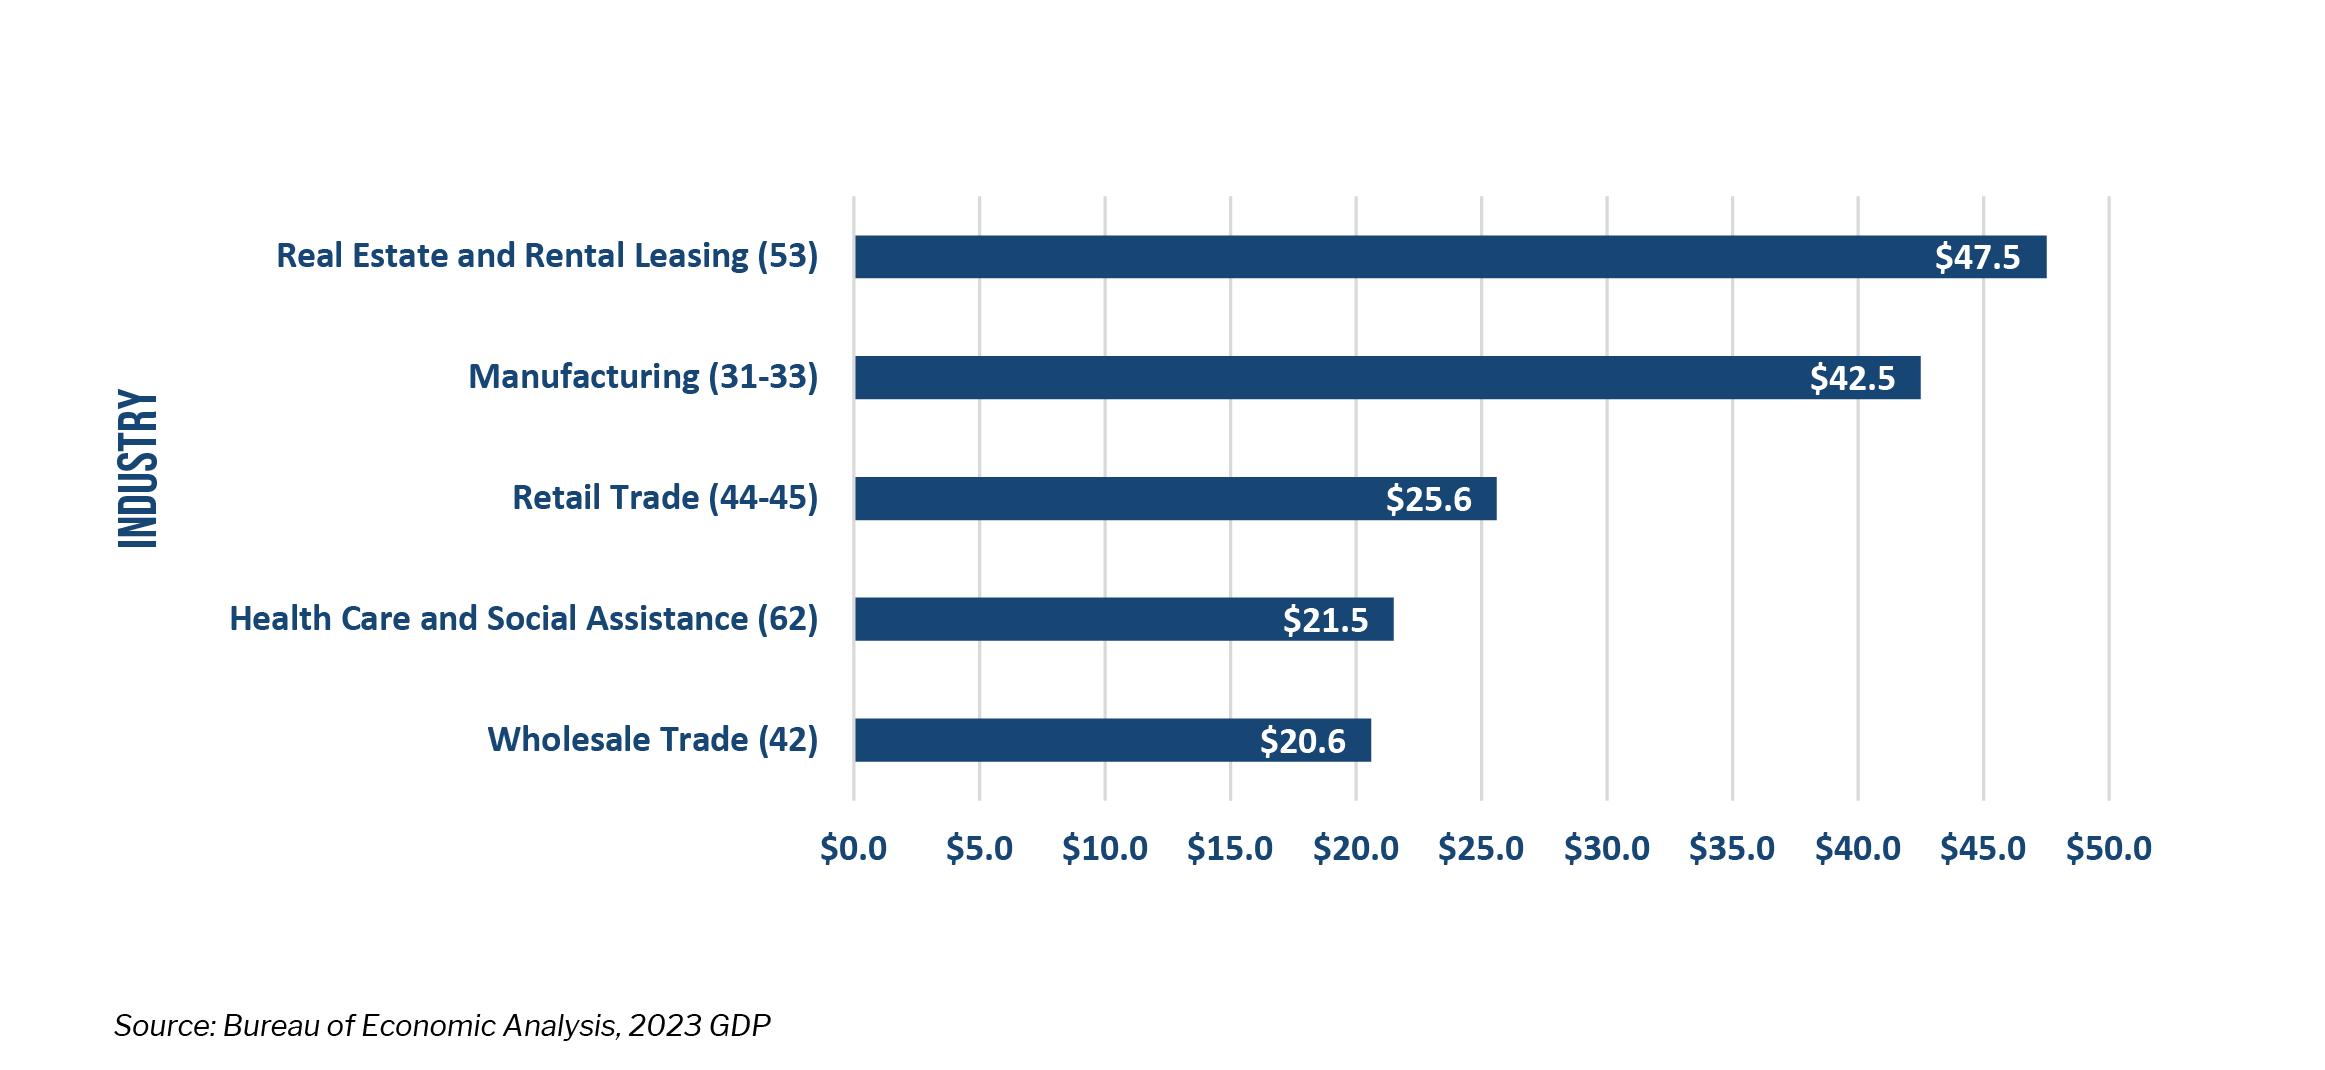
The state’s gross domestic product (GDP) in 2023 increased 8 3 percent over 2022 1 The GDP measures the overall value of goods and services that the economy produces Of the sectors in South Carolina, Real Estate and Rental Leasing contributed the largest portion of GDP in 2023 at $47 5 billion, as Figure 1 shows . The next largest contributions came from Manufacturing; Retail Trade; Health Care and Social Assistance; and Wholesale Trade Those industry clusters combined had an estimated economic impact of $157 8 billion in 2023 Some other contributors to economic health include population growth, employment levels, wage growth, number of job openings, and the influx of new business. Understanding the state of the economy in South Carolina can help investors make well informed decisions that continue to boost the economy
S.C. Economic Indicators
¹Gross Domestic Product by State and Personal Income by State, 2022 and 2023, https://www.bea.gov/news/2023/gross-domestic-product-state-and-personal-income-state-3rdquarter-2023 , Accessed June 20, 2024.
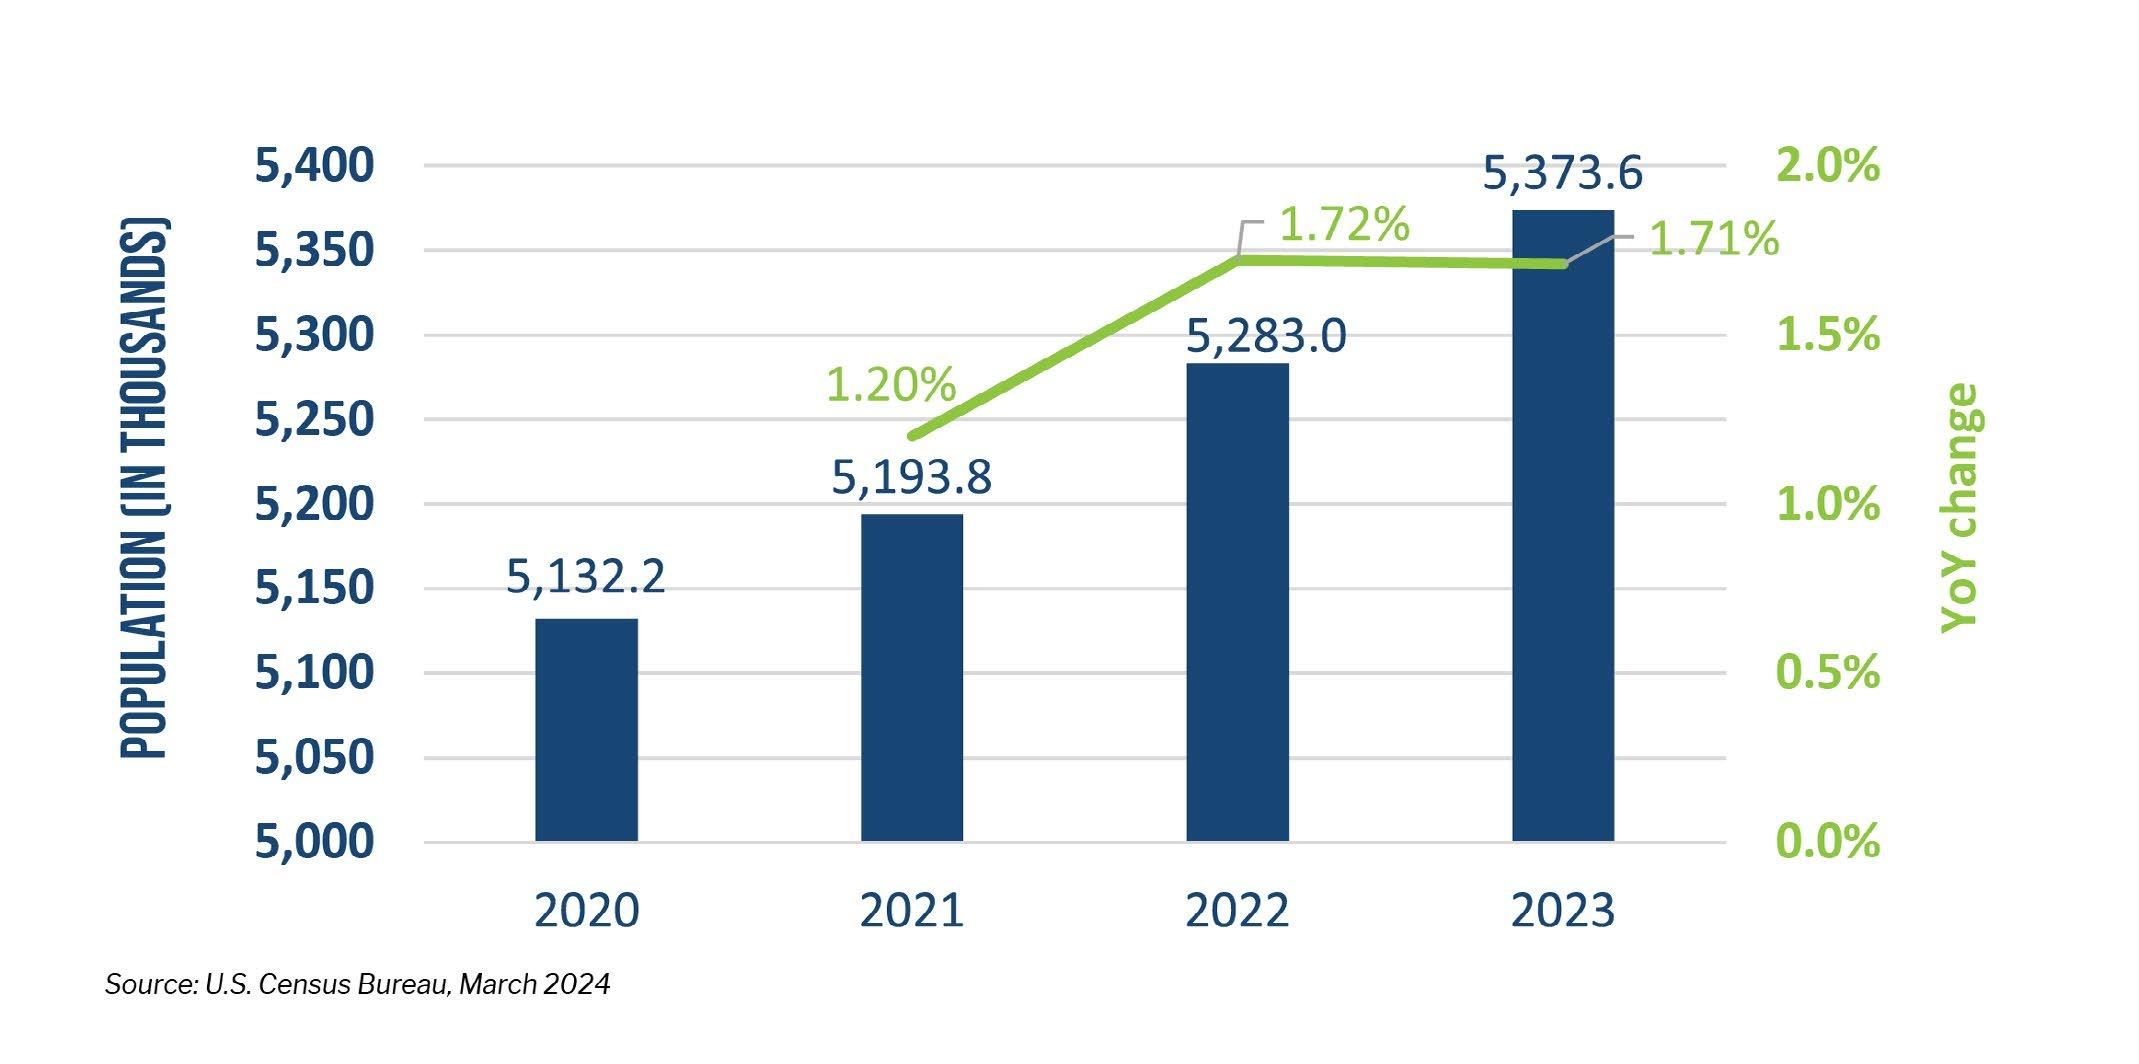
As Figure 2 illustrates, South Carolina has had strong population growth since 2020 More residents in the state leads, generally, to greater demand for goods and services, as well as a bigger labor force
As depicted in Figure 3, the average annual wage in South Carolina has been steadily increasing over the last ten years Wages ultimately affect consumer spending According to Investopedia, consumer spending accounts for two-thirds of U S gross domestic product and is a good gauge of consumer spending health ²
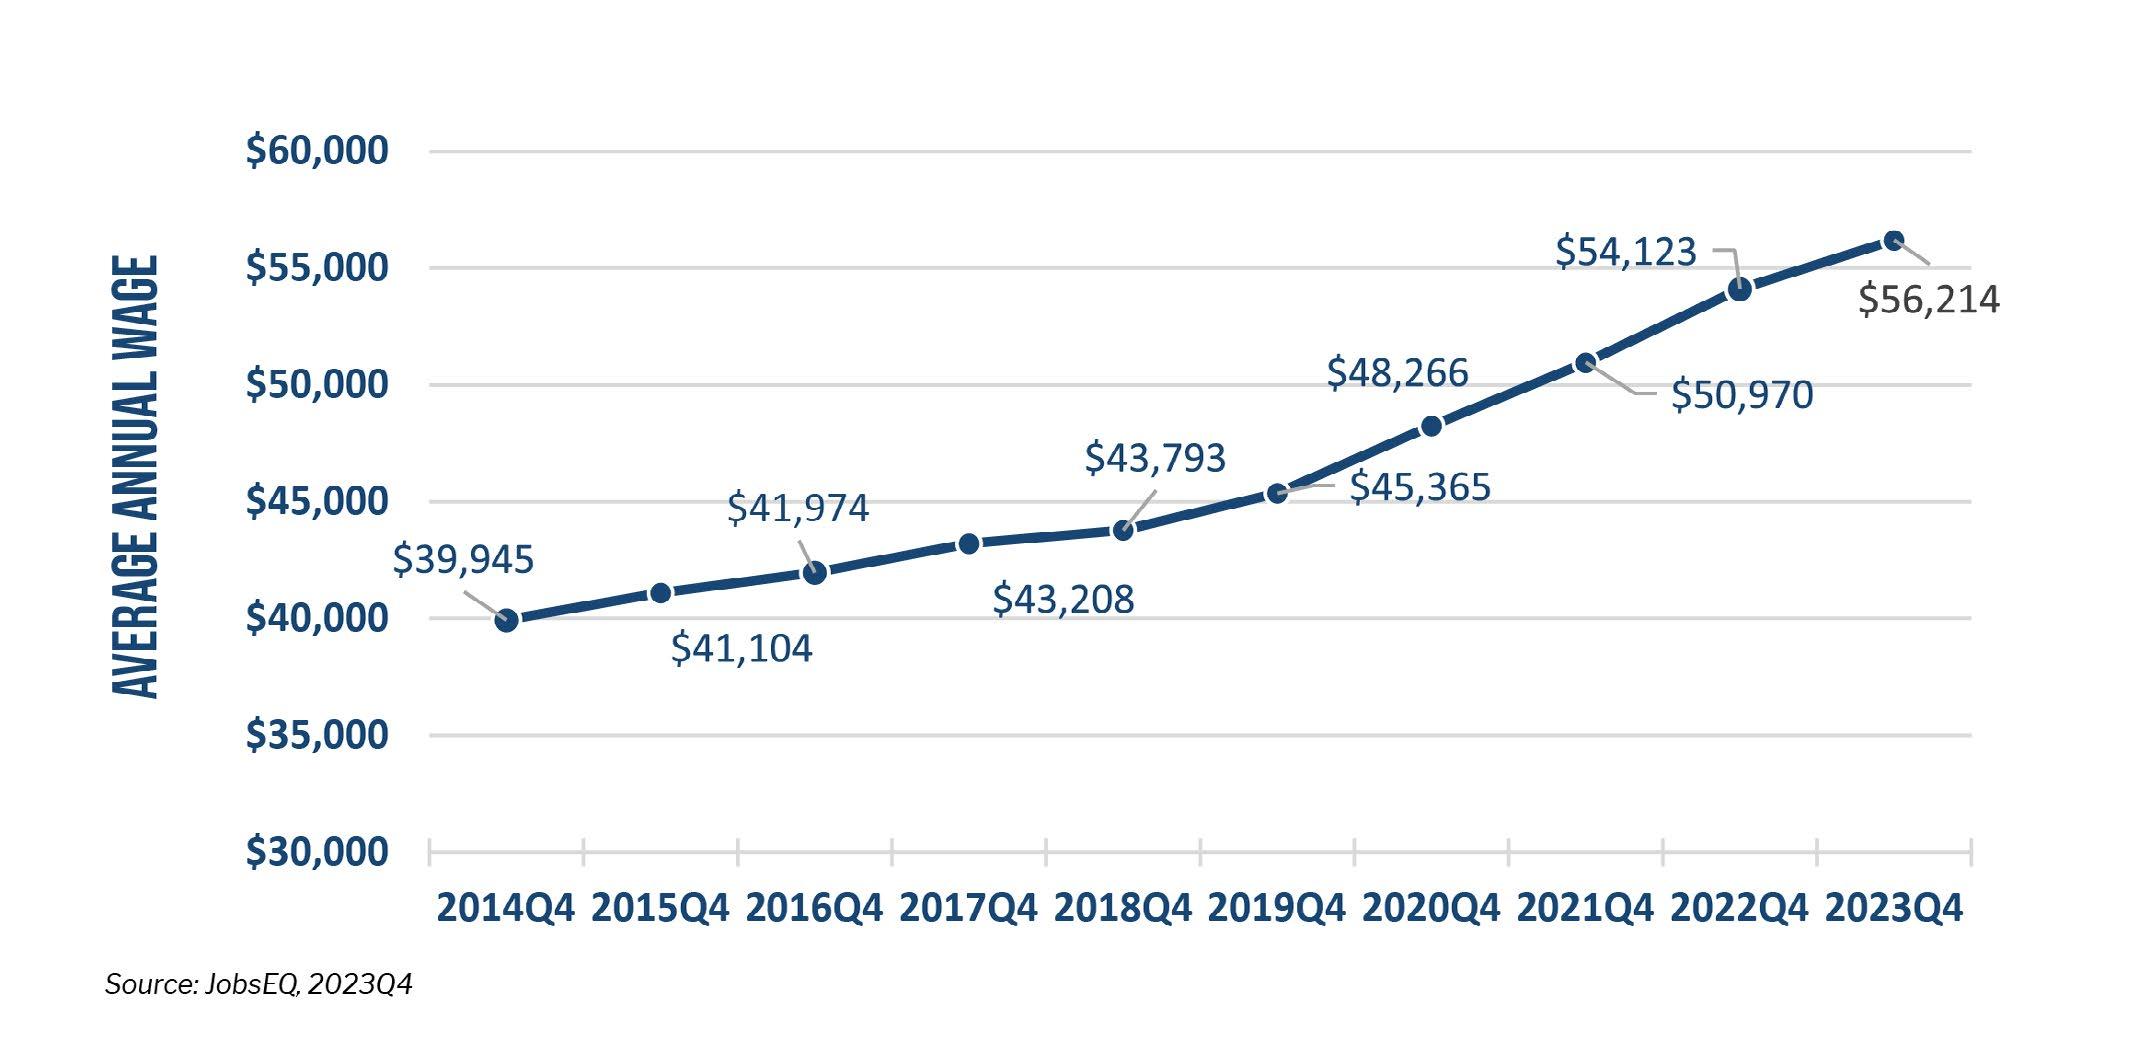
²Poonkulali Thangavelu,Top 10 U.S. Economic Indicators, March 28, 2024, https://www.investopedia.com/articles/personal-finance/020215/top-ten-us-economic-indicators.asp , Accessed June 24, 2024.
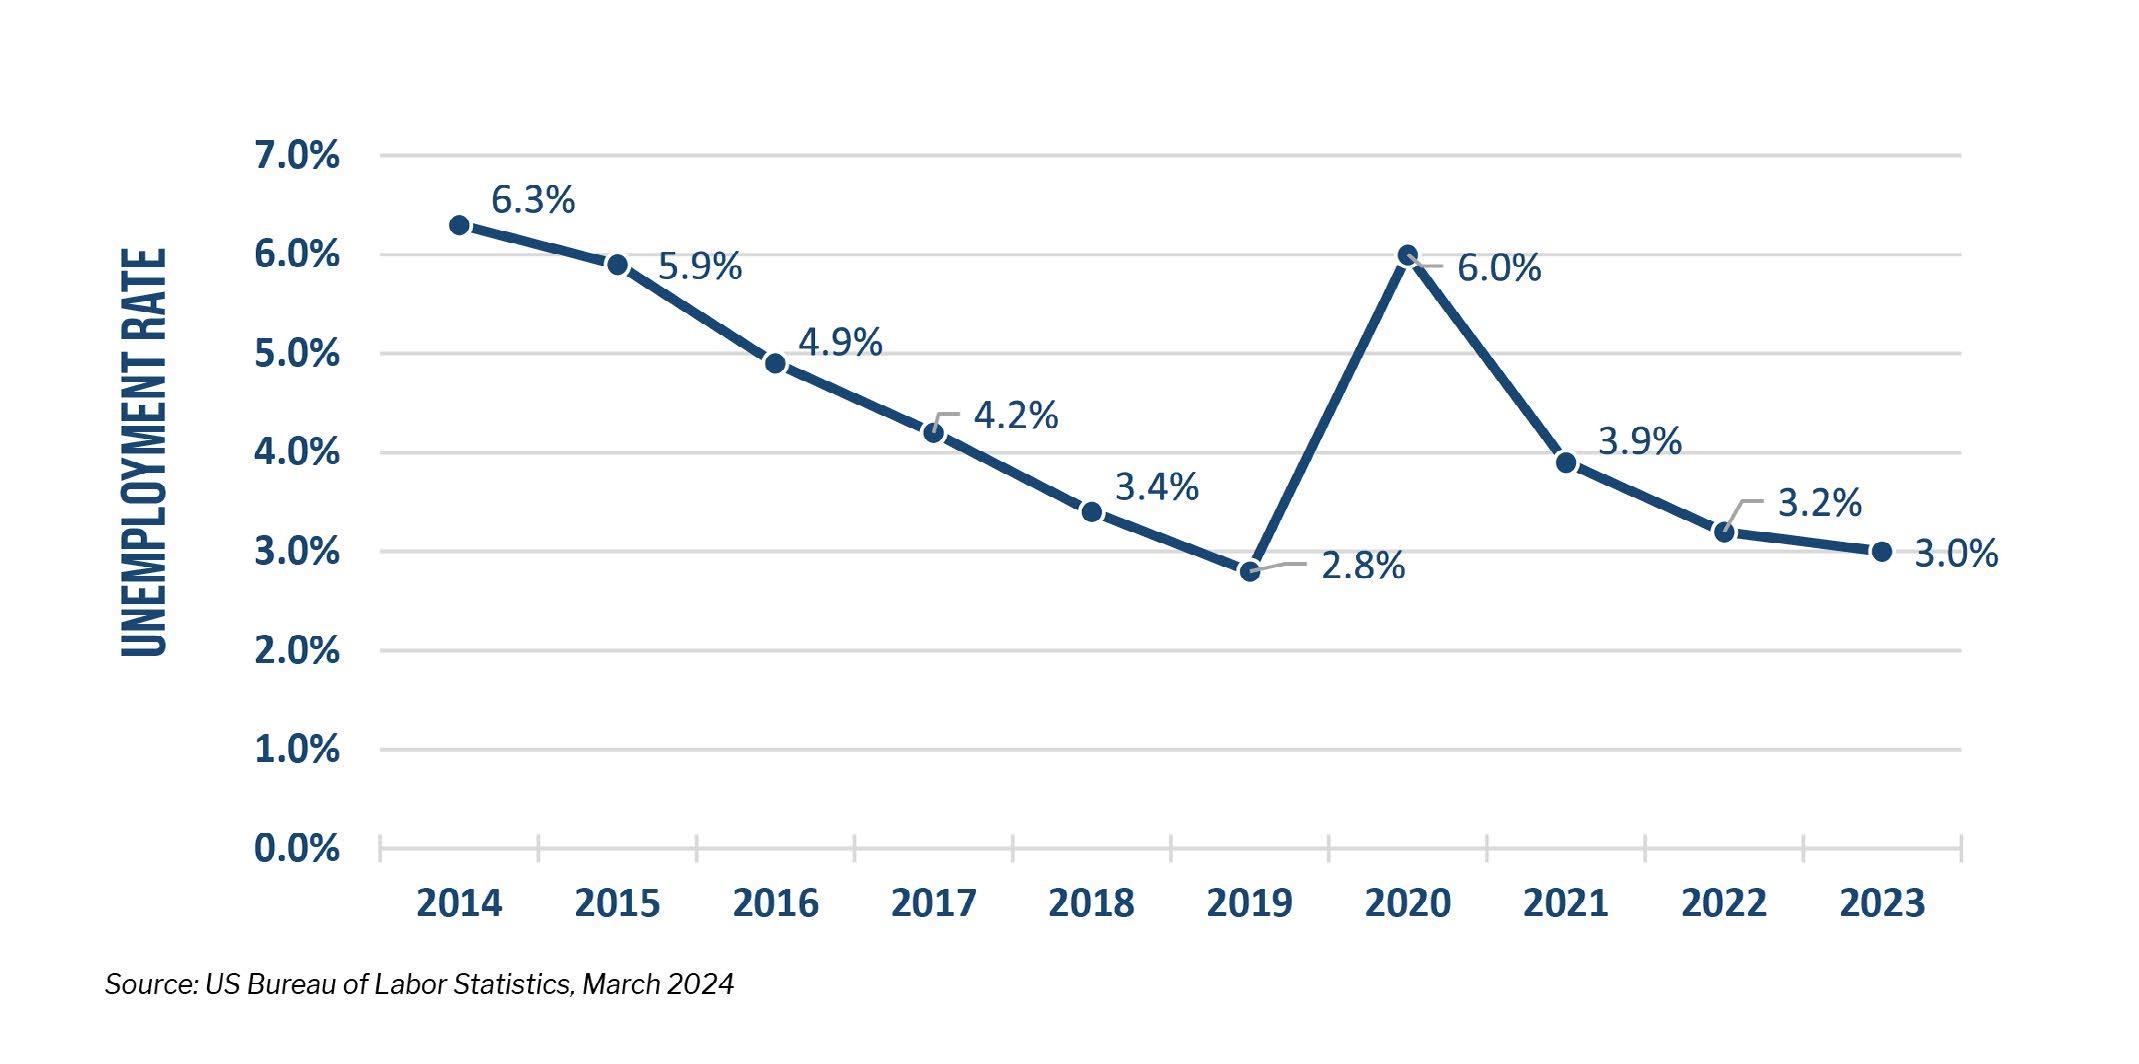
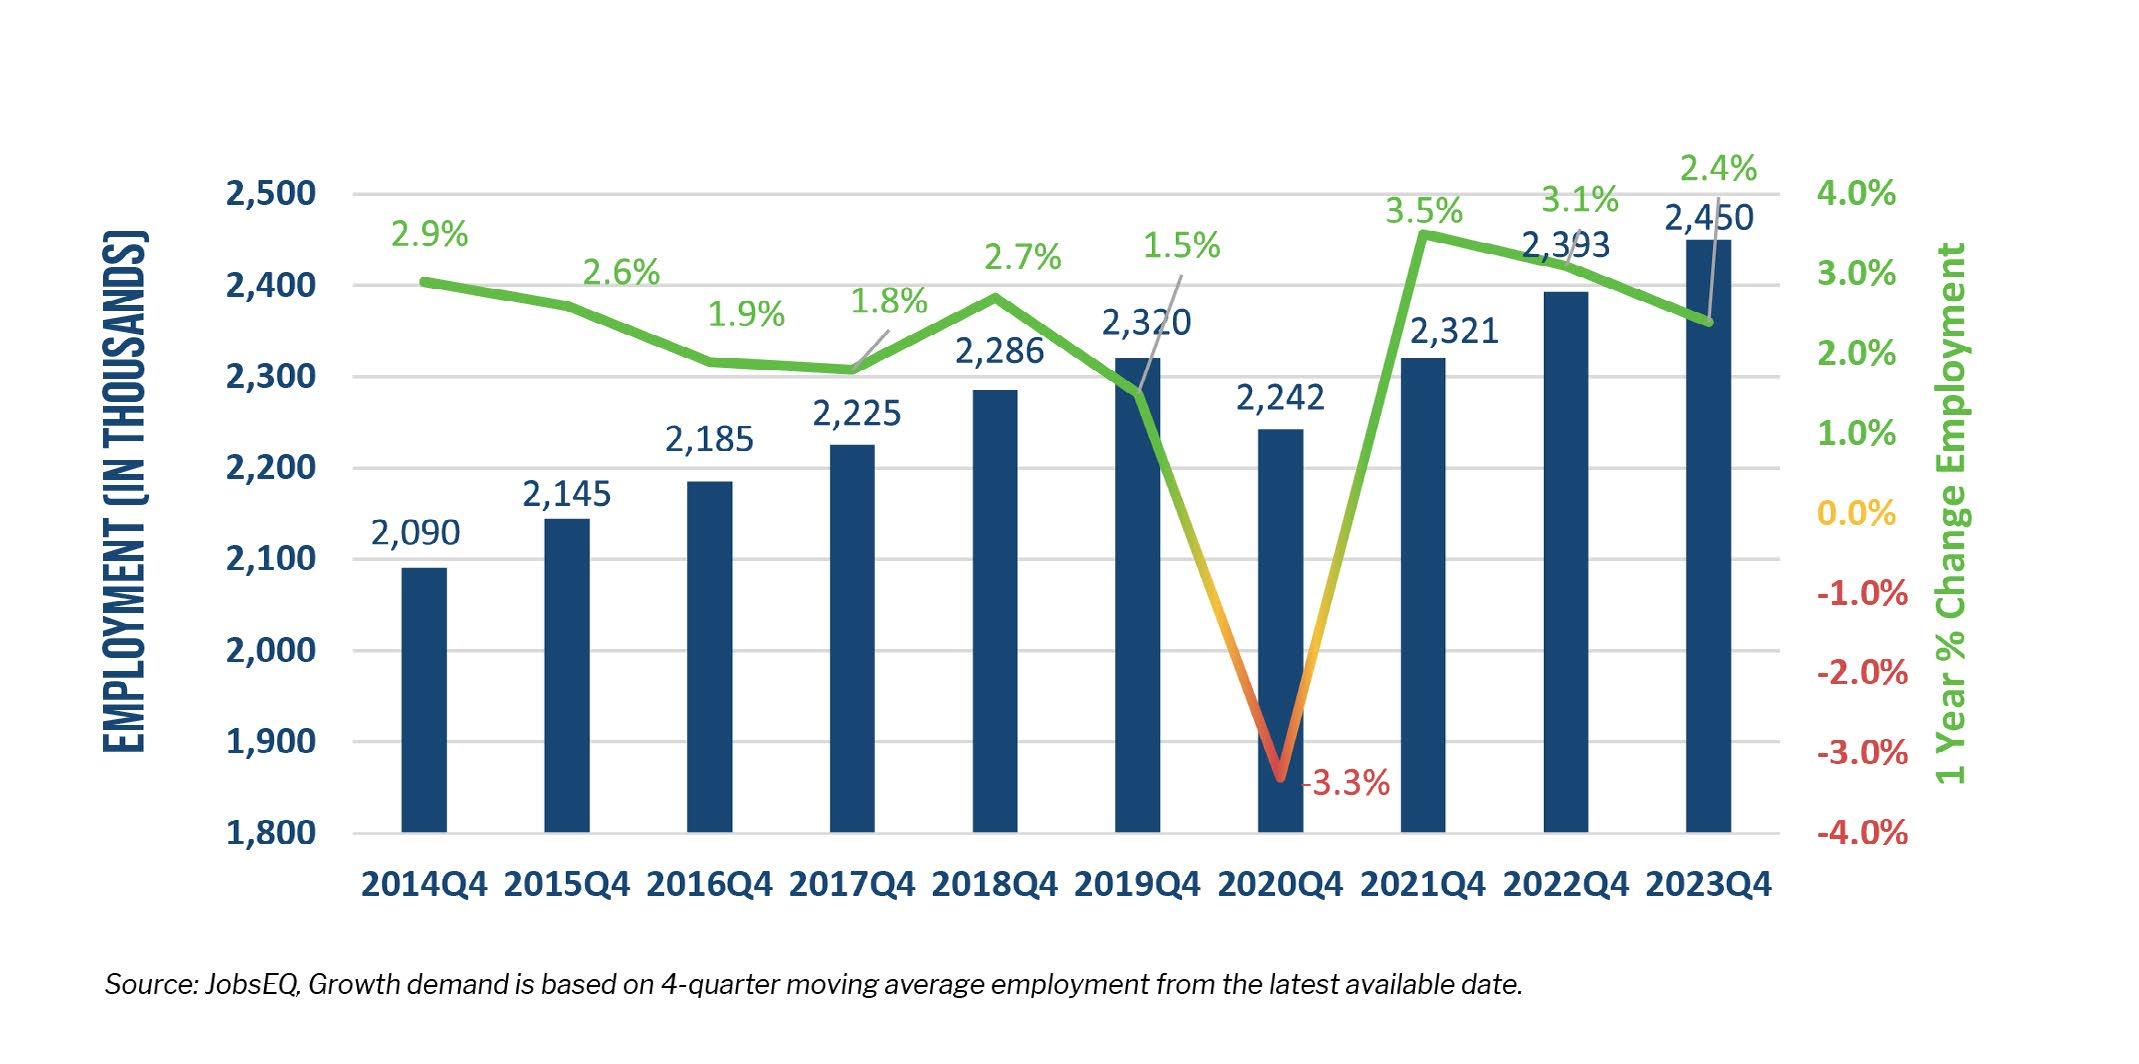
Figures 4 and 5 illustrate a decreasing unemployment rate, coupled with strong employment growth in South Carolina after the pandemic The unemployment rate has been decreasing annually from a high of 6% in 2020 to a low of 3% in 2023, almost to where it was at 2 8% before the pandemic
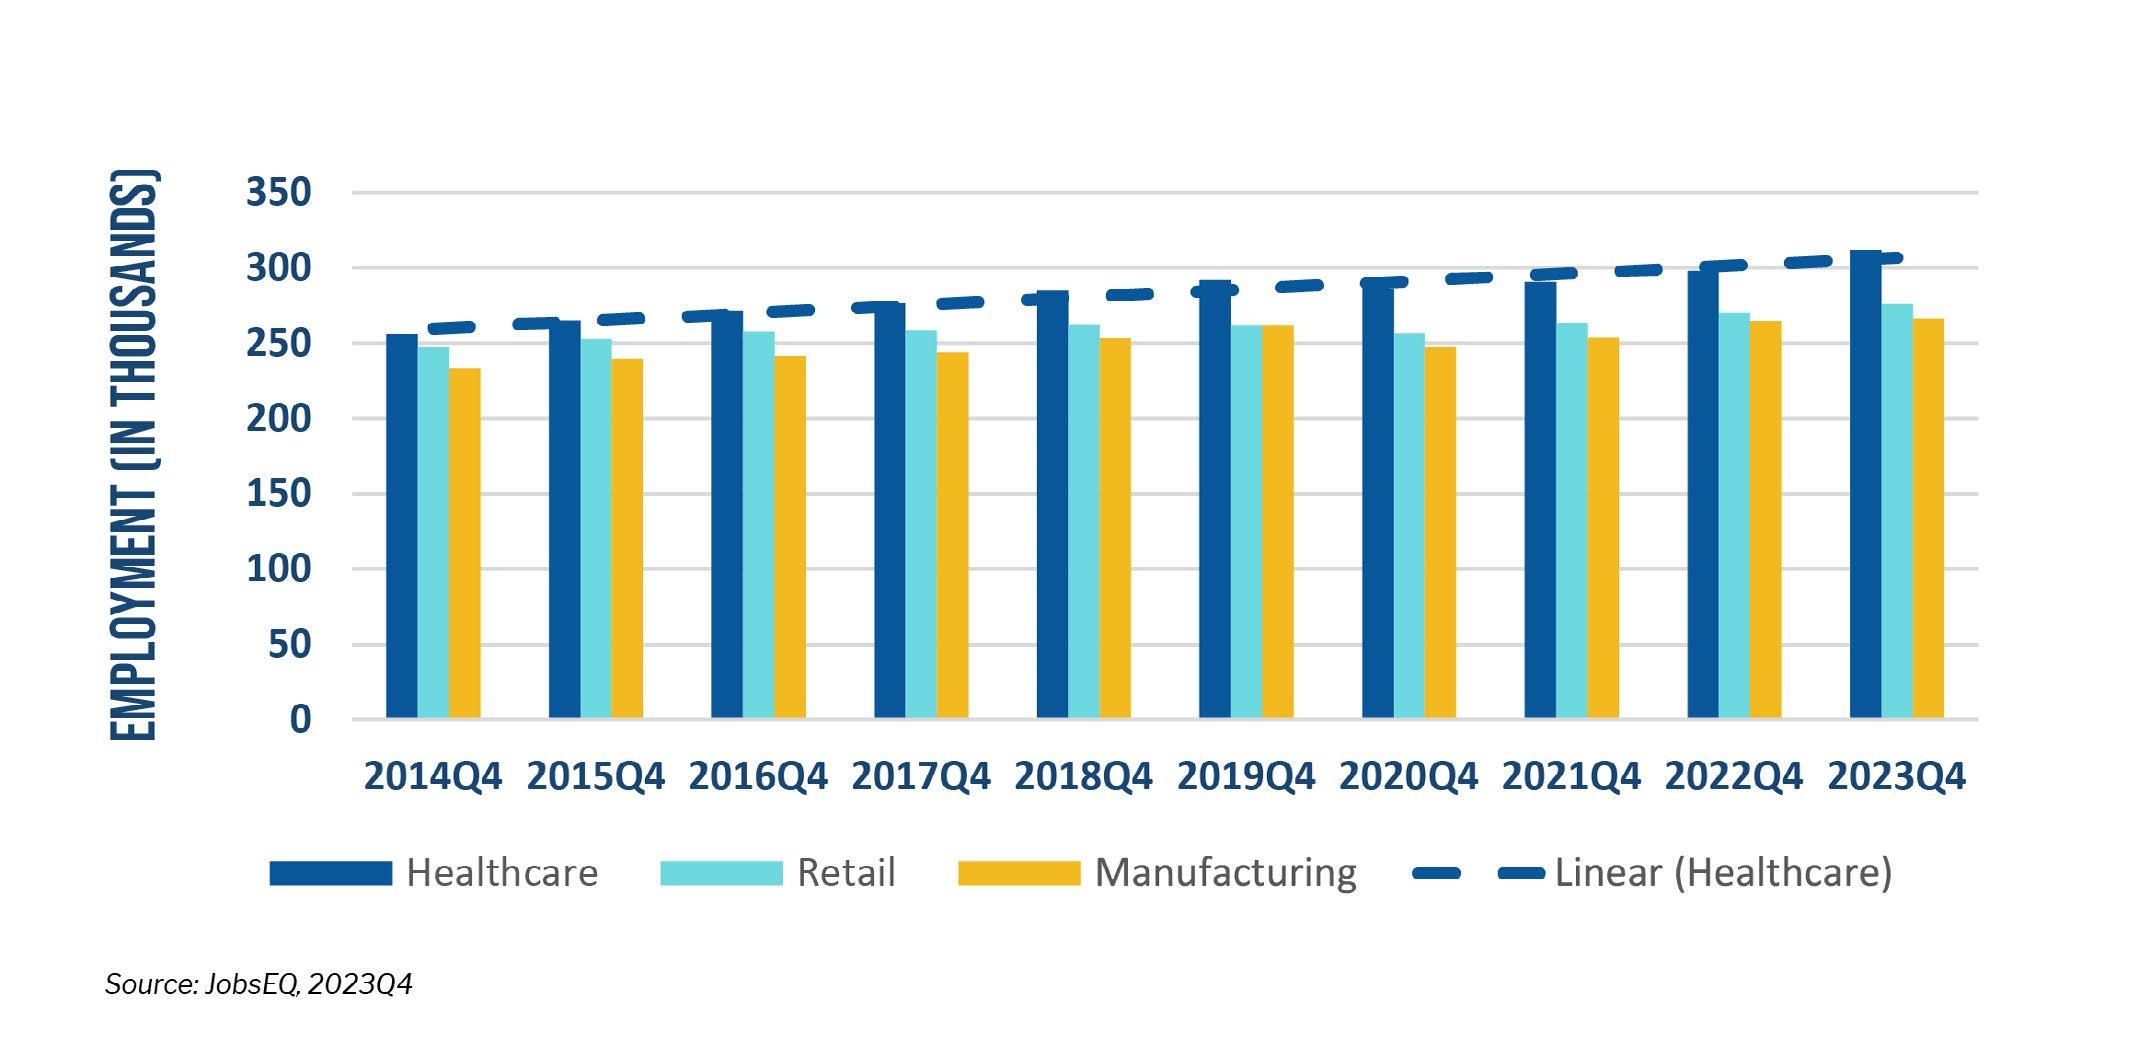
When examining industry contributions to South Carolina employment growth, Health Care and Social Assistance was found to be the largest industry sector, employing 311,852 workers The next-largest sectors in the state were Retail Trade (275,985 workers) and Manufacturing (266,484) As shown in Figure 6, the long- term employment trend in these three sectors is on the rise
Not only is it important to be aware of the top industries currently contributing to employment growth, it is also important to be able to project as the supply and demand of workers, as shown in Figure 7. Employers can use this kind of data to build strategies around filling supply gaps . Healthcare, Retail Trade, and Manufacturing have the highest amount of current and projected employment The table also shows that the most job postings by industry within the past year occurred within Healthcare; Retail Trade; Educational Services; Administrative and Support and Waste Management and Remediation Services; and Manufacturing In general, lower unemployment rates are associated with higher job openings rates, which both indicate a strong labor market
Source: South Carolina Department of Employment & Workforce, 2020-2030 Industry Projections – Long Term; June 2023 – May 2024 for Job Postings
New business has been expanding in South Carolina in growing industries such as Healthcare and Manufacturing and will continue to expand into the near future
According to a 2024 report by Deloitte, there is a global shortfall of health care workers, and as much as 87% of US health care providers cite staffing shortages as their biggest challenge.³ A demand in healthcare workers has been created by multiple factors, including the growing population and technological advances that have expanded the type and number of jobs available In South Carolina, Organizations such as Prisma Health have been focused on strengthening their relationships with schools over the past five years to keep the pipeline of healthcare workers flowing. Moreover, several new hospitals plan to open in the future in the Myrtle Beach area ⁴ Prisma Health has also broken ground on a new multispecialty ambulatory care center in Columbia ⁵
One of the contributors to the growth in the manufacturing industry in South Carolina is the automotive sector . Great examples of these are the BMW, Mercedes-Benz, and Volvo investments over the past few years A natural progression in growth and development in automotive manufacturing is a transition to electric vehicles (EVs) and hybrid vehicles A more recent example of this expansion is the significant economic investment that Scout Motors has made in establishing its first manufacturing plant in Blythewood, South Carolina. The company will manufacture electric SUVs and pickup trucks, with the potential of creating 4,000 or more permanent jobs, hoping to begin production by the end of 2026 . ⁶
South Carolina’s recent economic growth has been fueled by growth in Real Estate and Rental and Leasing; Manufacturing; Retail Trade; Health Care and Social Assistance; and Wholesale Trade Those industry clusters combined had an estimated economic impact of $157 8 billion in 2023 Population growth, increases in employment and wages, and a rising number of job openings are all indicators of the strength of the economy . Understanding the state of the economy in South Carolina can help investors make well informed decisions about doing business in South Carolina and continue to help grow the economy
³2024 Global Health Care Sector Outlook: Navigating Transformation, 2023, https://www.deloitte.com/content/dam/assets-shared/docs/industries/life-sciences-health-care/2024/gx-hcoutlook-new.pdf, Accessed June 26, 2024.
⁴Tami Luhby and Alicia Wallace, South Carolina’s Population and Economy are Booming, February 24, 2024, https://www.cnn.com/2024/02/24/business/economy-south-carolina-population/ index.html , Accessed June 17, 2024.
⁵Jason Thomas, Prisma Health Breaks Ground on $128M Columbia Medical Park, May 13, 2024, https://columbiabusinessreport.com/prisma-health-breaks-ground-on-128m-columbiamedical-park/, Accessed June 17, 2024.
⁶Christina Lee Knauss, Scout Breaks Ground in Blythewood on Midlands’ First Auto Factory, February 15, 2024, https://columbiabusinessreport.com/scout-breaks-ground-in-blythewood-onthe-midlands-first-auto-factory/, Accessed June 17, 2024.

Nationally, there is a monthly Current Population Survey of about 60,000 households conducted by the Census Bureau for the Bureau of Labor Statistics (BLS) to determine employment status of the civilian population This information, along with other inputs, are used by DEW to operate the Local Area Unemployment Statistics program, which estimates the number of individuals employed and those not employed, but actively seeking employment for statewide and a variety of substate geographies
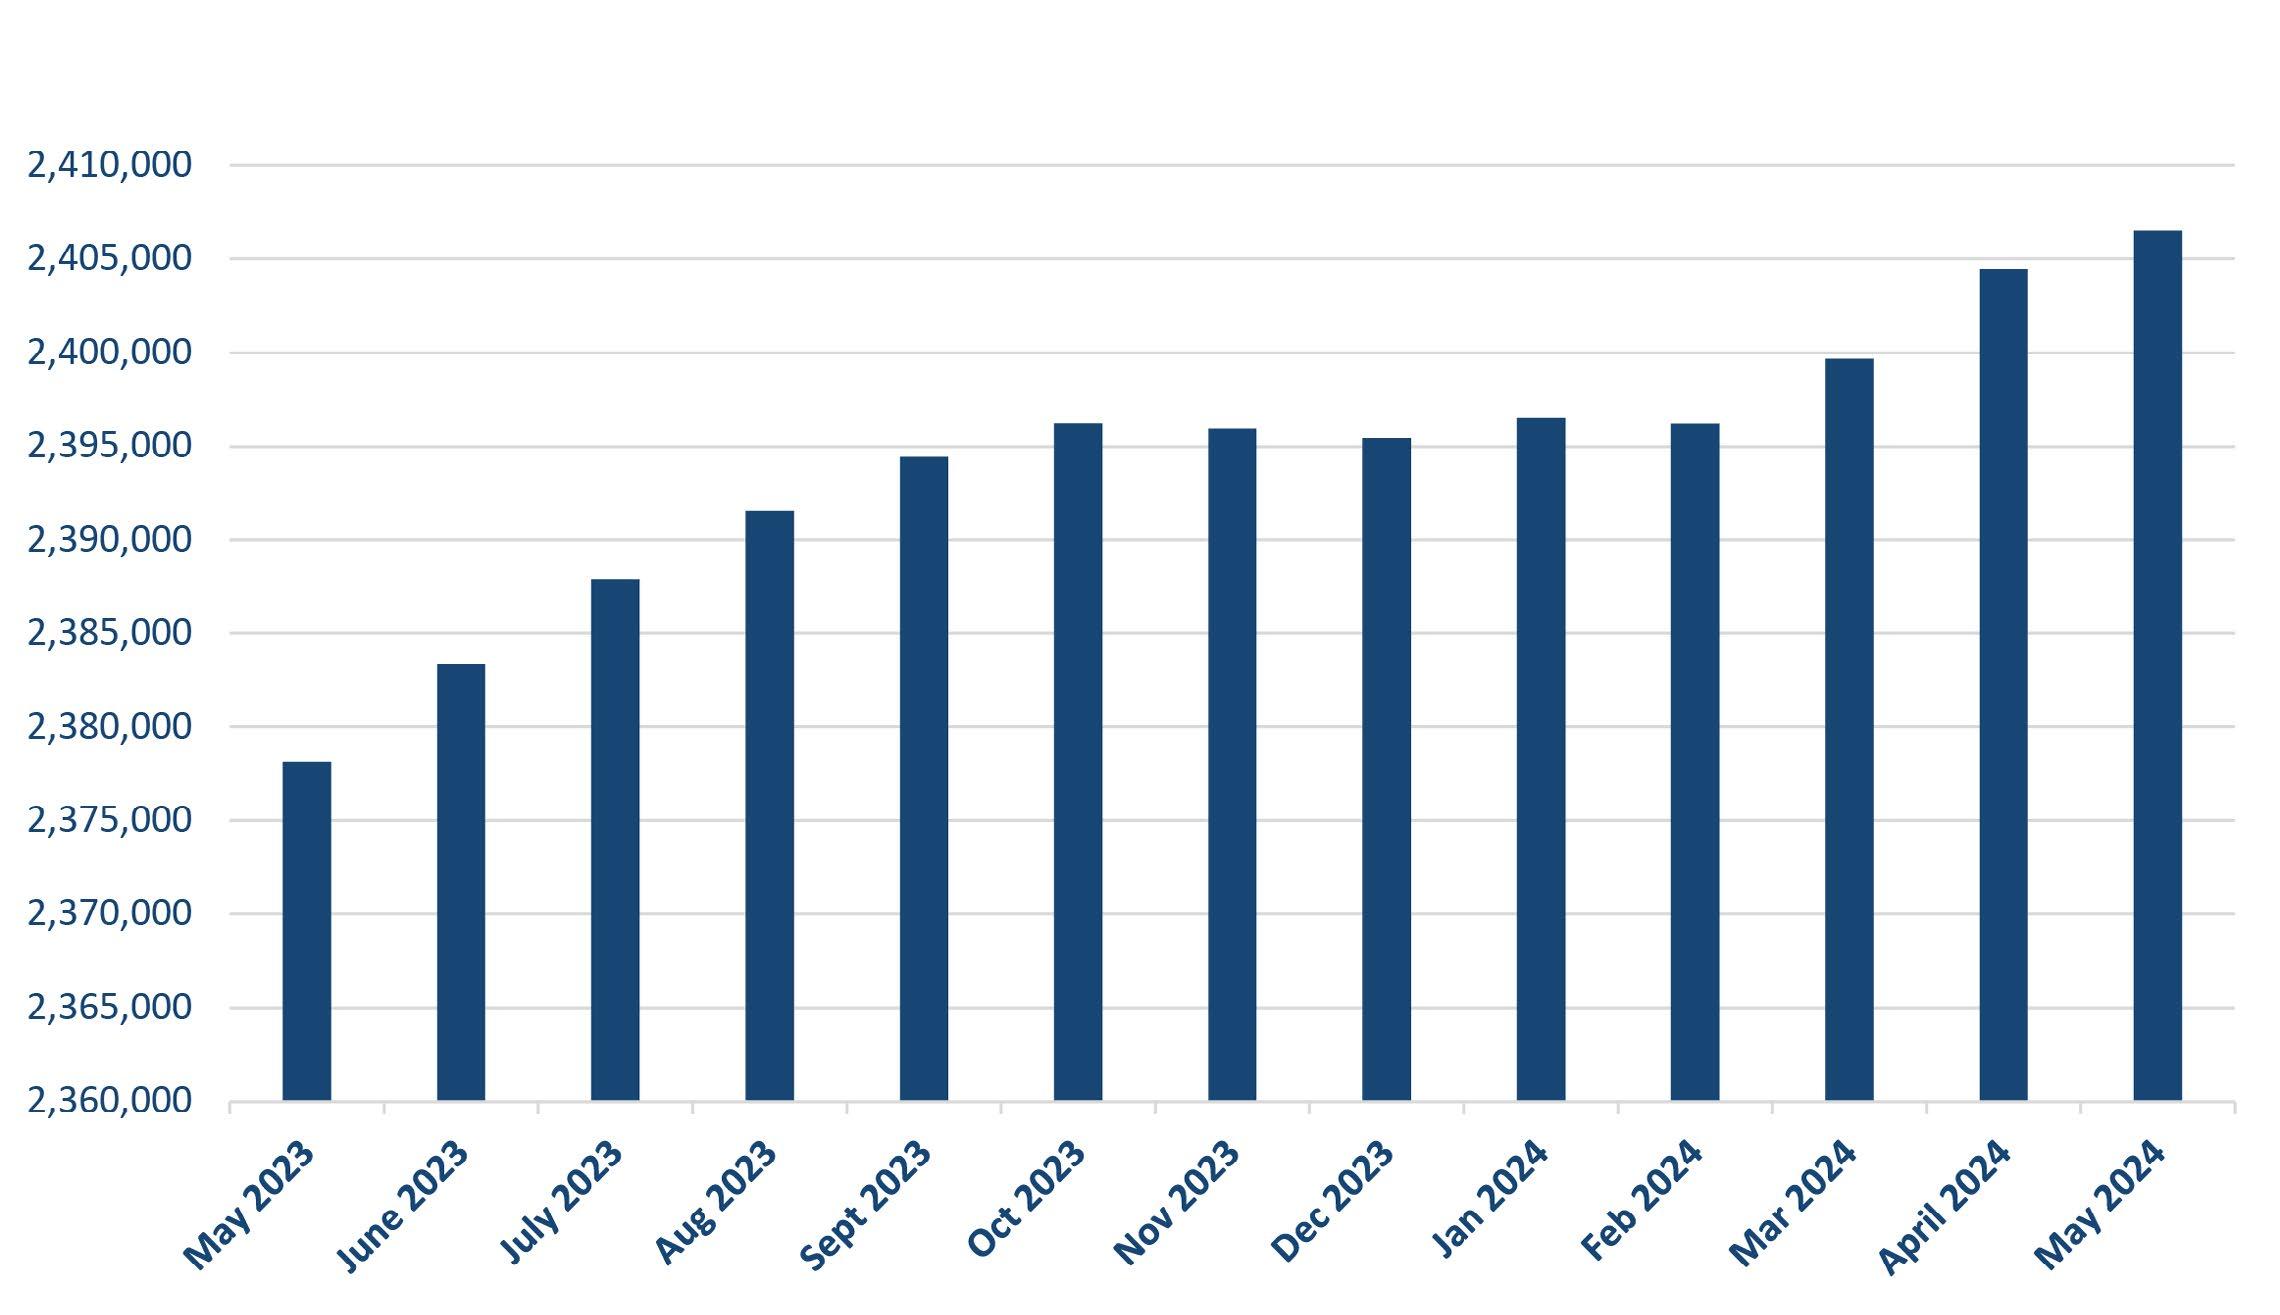
• The seasonally adjusted number of South Carolina workers increased to 2,406,502
• That is an increase of 1,985 people over the April 2024 estimate
• That is an increase of 28,382 people over the May 2023 estimate .
SEASONALLY ADJUSTED: Seasonal adjustment removes the effects of events that follow a regular pattern each year (i e tourist-related hiring and school closings in the summer) These adjustments make it easier to observe the cyclical and other nonseasonal movements in data over time
• The estimate of unemployed people increased to 83,663
• That is an increase of 3,851 people from April’s estimate and an increase of 13,783 from the May 2023 estimate
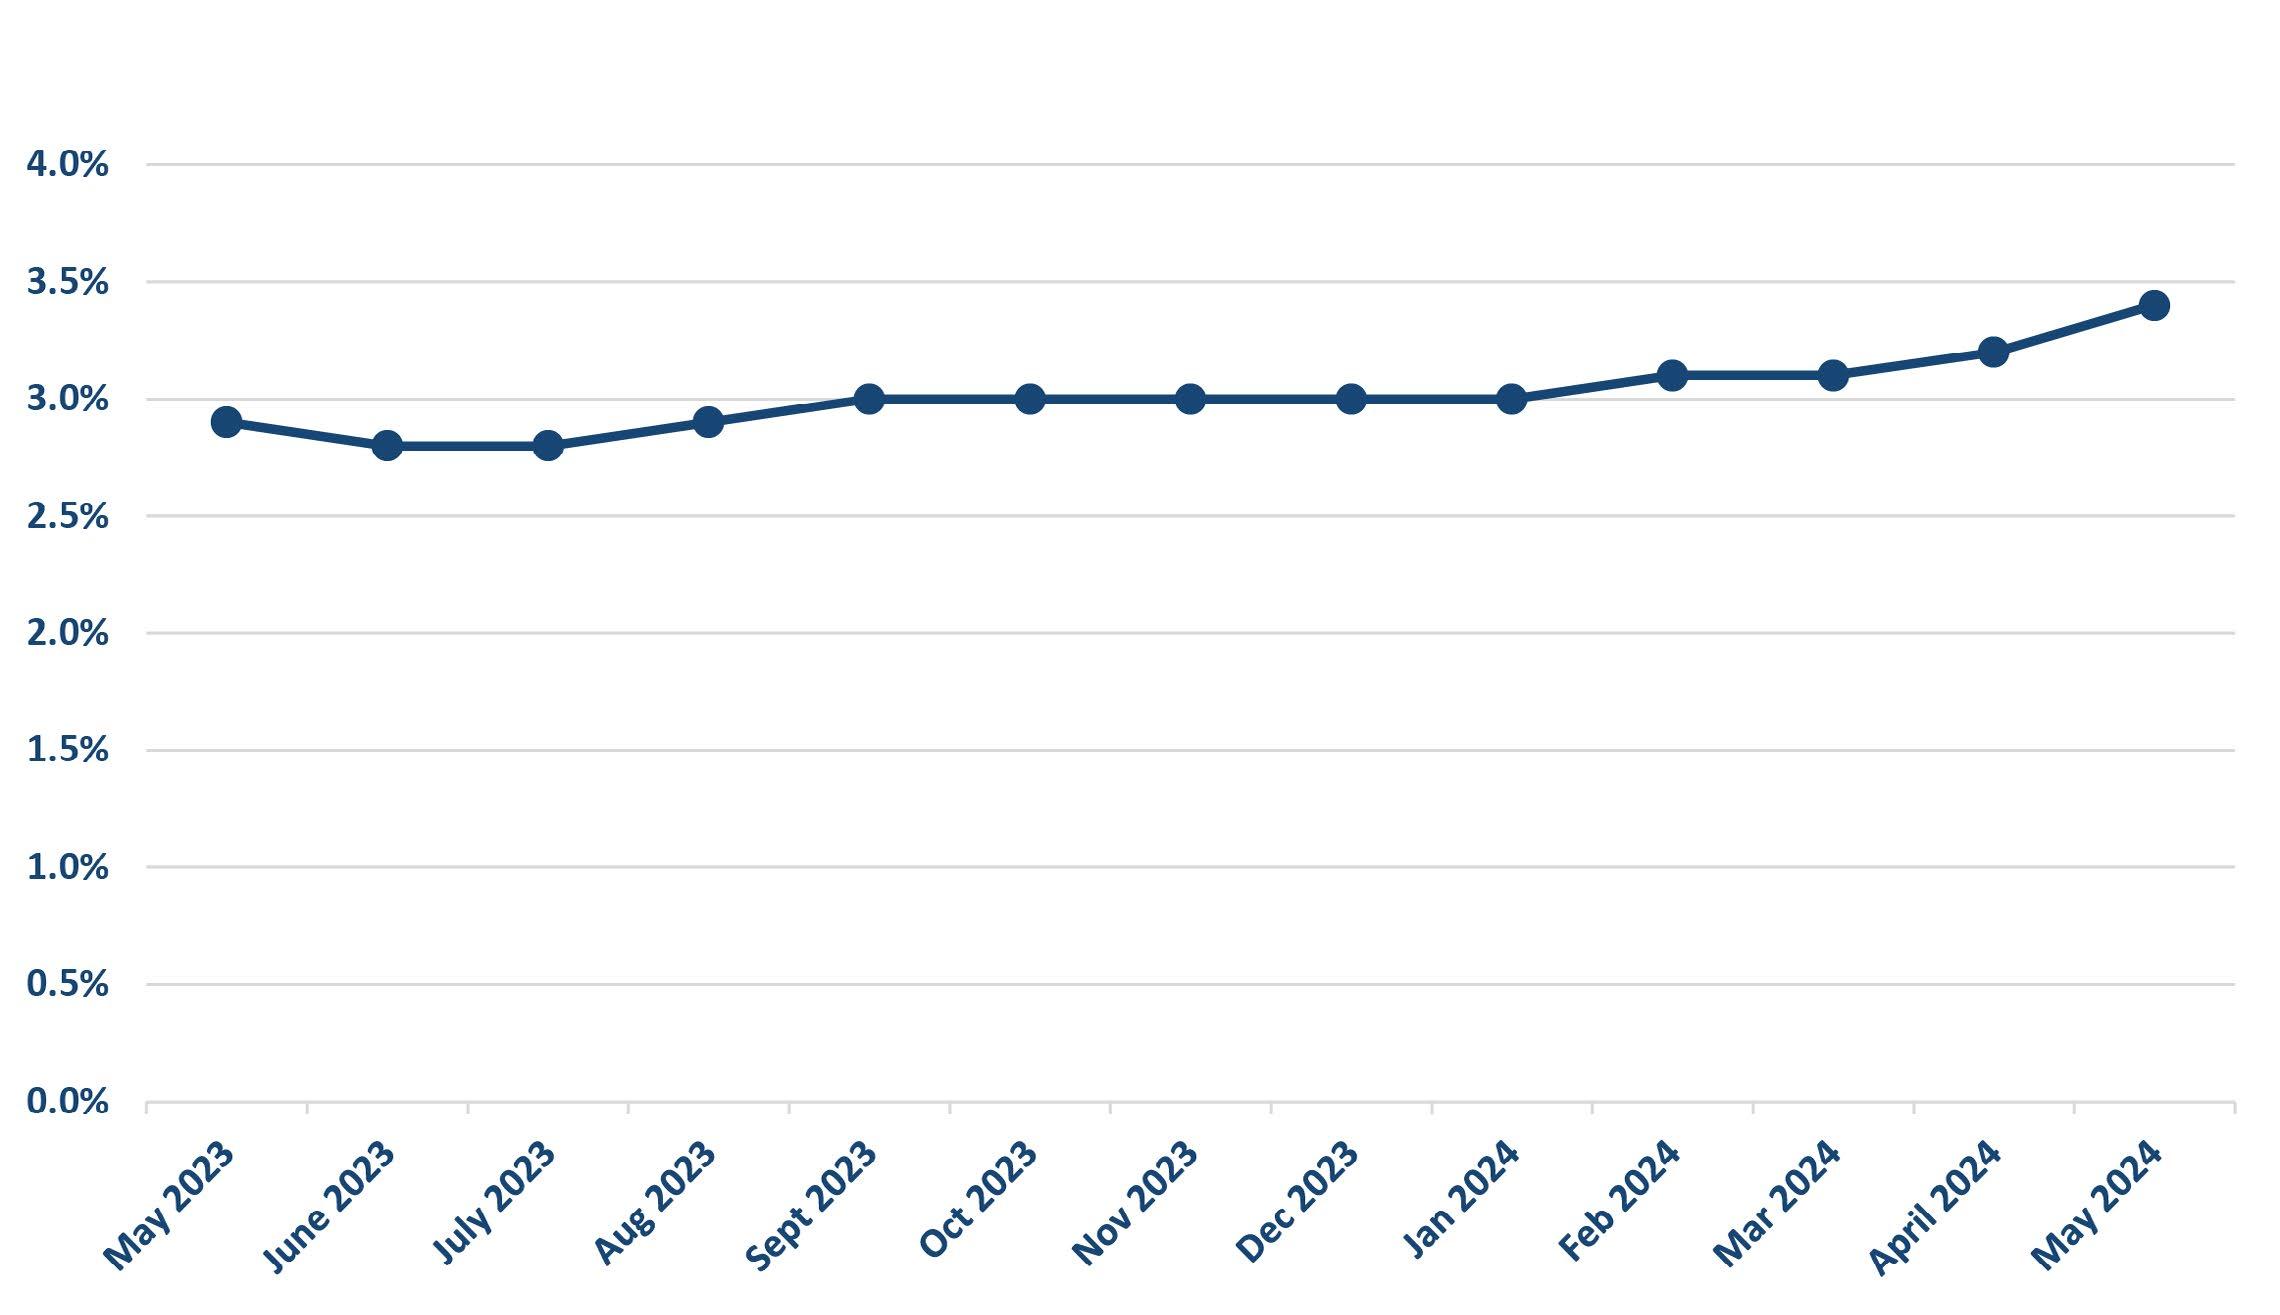
• The state’s seasonally adjusted unemployment rate increased to 3 4 percent The national unemployment rate increased to 4 0 percent, according to the Current Population Survey
• The state’s estimated labor force (people working plus unemployed people looking for work) increased to 2,490,135, while the labor force participation rate remained at 57 .2 percent .
• That is an increase of 5,836 people over the April 2024 estimate
• That is a significant increase of 42,165 individuals over the May 2023 estimate.
SEASONALLY ADJUSTED: Seasonal adjustment removes the effects of events that follow a regular pattern each year (i e tourist-related hiring and school closings in the summer) These adjustments make it easier to observe the cyclical and other nonseasonal movements in data over time
BLS conducts a monthly Current Employment Statistics survey of approximately 119,000 businesses and government agencies which yields national estimates of nonagricultural wage and salary employment, hours, and earnings by industry These data are processed by DEW to generate comparable data for the state and its metropolitan statistical areas
The monthly survey of businesses in South Carolina marked an estimated increase of 3,300 nonfarm payroll jobs over the month to a level of 2,373,500
SEASONALLY ADJUSTED: Seasonal adjustment removes the effects of events that follow a regular pattern each year (i e tourist-related hiring and school closings in the summer) These adjustments make it easier to observe the cyclical and other nonseasonal movements in data over time
The monthly survey of businesses in South Carolina marked an estimated increase of 3,300 nonfarm payroll jobs over the month to a level of 2,373,500 .
APRIL 2024 TO MAY 2024 MAY 2023 TO MAY 2024
NOTE: Employment estimates have been rounded to the nearest hundred. Sum of detail may not equal totals due to rounding or the exclusion of certain industries from publication. All data are subject to revision.
SEASONALLY ADJUSTED: Seasonal adjustment removes the effects of events that follow a regular pattern each year (i e tourist-related hiring and school closings in the summer) These adjustments make it easier to observe the cyclical and other nonseasonal movements in data over time
STATISTICAL AREA
Employment since January 2020
1,800,000 1,900,000 2,000,000 2,100,000 2,200,000 2,300,000 2,400,000 2,500,000
Current month’s estimates are preliminary. All data are subject to revision.
2024 (NOT SEASONALLY ADJUSTED)
Current month’s estimates are preliminary. All data are subject to revision.
Current month’s estimates are preliminary. All data are subject to revision.
Current month’s estimates are preliminary. All data are subject to revision.
Current month’s estimates are preliminary. All data are subject to revision.
Current month’s estimates are preliminary. All data are subject to revision.
1 . Household Survey: Nationally, there is a monthly Current Population Survey of about 60,000 households conducted by the Census Bureau for the Bureau of Labor Statistics (BLS) to determine employment status of the civilian population This information, along with other inputs, is used by DEW to operate the Local Area Unemployment Statistics program, which estimates the number of individuals employed and those not employed, but actively seeking employment for statewide and a variety of sub-state geographies
2 Employer Survey: BLS conducts a monthly Current Employment Statistics survey of about 44,000 employers which yields national estimates of nonagricultural wage and salary employment, hours, and earnings by industry This data is processed by DEW to generate comparable data for the state and its metropolitan statistical areas
3 . Seasonally Adjusted: Seasonal adjustment removes the effects of events that follow a regular pattern each year (i e tourist-related hiring and school closings in the summer) These adjustments make it easier to observe the cyclical and other nonseasonal movements in data over time
4 . Not Seasonally Adjusted: Effects of regular or seasonal patterns have not been removed from this data
Data is published by Industry
Data is published by County
Counts Jobs Counts People
Utilizes an Establishment Survey
Reference week is the Pay Period that includes the 12th of the month
A job held by a person on unpaid leave during the reference week is not counted since they are not receiving pay
Does not count selfemployed workers
Does not include agricultural workers
Does not count unpaid family workers
Workers on strike during the entire reference period are not counted
The Current Population Survey (CPS), which is a Household Survey, is used to calculate LAUS
Reference week is the Calendar Week that includes the 12th of the month
A person on unpaid leave is counted as employed because they will return to their job
Does count self-employed workers
Includes both agricultural and non-agricultural workers
Counts unpaid family workers if they worked at least 15 unpaid hours for a family business or family farm during the reference week
Workers on strike during the reference week are counted as employed in LAUS

Do you need some help finding the data you need? Have a great idea for a research project you’d like to discuss with someone? We love to collaborate!
DATA TRENDS is prepared by the LMI Division of the S C Department of Employment and Workforce with funding provided by the US Department of Labor Featured data is prepared in conjunction with the Bureau of Labor Statistics and current month estimates are always preliminary, with all previous data subject to revision
Interested in staying up to date with Trends as it’s released? Subscribe by clicking here!