

March 2024 Issue
dew.sc.gov scworkforceinfo.com SC Department of Employment and Workforce Labor Market Information Division Columbia, South Carolina 29202
South Carolina Data TRENDS
Interested in receiving the latest issue of Trends in your inbox every month? Click here to subscribe to our Trends mailing list!

2
South Carolina Short-Term Employment Projections, 2023-2025 . . . . . . . . . . . . . . . . 4 South Carolina’s Employment Situation (March 2024) . . . . . . . . . . . . . . . . . . . . . . . . . . . 12 Local Area Unemployment Statistics . . . . . . . . . . . . . . . . . . . . . . . . . . . . . . . . . . . . . . . . . . . . . 16 Current Employment Statistics — Seasonally Adjusted . . . . . . . . . . . . . . . . . . . . . . . . . . 22 Current Employment Statistics — Not Seasonally Adjusted . . . . . . . . . . . . . . . . . . . . . 24 Long-Run Trends . . . . . . . . . . . . . . . . . . . . . . . . . . . . . . . . . . . . . . . . . . . . . . . . . . . . . . . . . . . . . . . . . . .34 Technical Notes . . . . . . . . . . . . . . . . . . . . . . . . . . . . . . . . . . . . . . . . . . . . . . . . . . . . . . . . . . . . . . . . . . . 38
AT A GLANCE
NOTE FROM THE DIRECTOR
Want to know how many South Carolinians are eligible to work? Check out the Civilian Non-Institutional Population figure on page 17.
Welcome to Trends! As temperatures rise, we find ourselves in the middle of graduation season, with young adults concluding their high school and college studies and thinking about what comes next Here at DEW, we are celebrating SC@Work School to Success Month Executive Director, William Floyd, spoke alongside Lieutenant Governor Pamela Evette at an event earlier this month that launched her Empowering Tomorrow’s Leaders employment initiative We want to make sure that young people and their parents are thinking about the merits of part-time work, supplementing their studies so they can earn a paycheck and valuable skills for their futures. Visit the news feed on dew.sc.gov to read the press release about the event .
This month’s featured article is about our short-term employment projections. Once we had the final jobs numbers for 2023, LMI staff worked on estimating payroll by industry and occupation for 2025. Of course we don’t have a crystal ball, but it’s our best estimate, assuming that economic conditions remain stable Read along to see what we’re expecting to see for the South Carolina labor market in the year ahead.
As always, please don’t hesitate to reach out to us at lmicustomerservice@dew.sc.gov if you have any questions. We’d also love to hear any suggestions on what data would help you out!
Thanks for reading!

 Bryan P Grady, Ph D
Assistant Executive Director for Labor Market Information SC Department of Employment and Workforce
Bryan P Grady, Ph D
Assistant Executive Director for Labor Market Information SC Department of Employment and Workforce

3
South Carolina Short-Term Employment Projections,
2023-2025
The Labor Market Information Division (LMI) of DEW completes a two-year industry and occupational employment projection each March for the state. This comprehensive analysis for the period of 2023-2025 provides valuable insights into the state's economic landscape, highlighting growth trends, key sectors, and emerging opportunities
Industry Projections
The analysis projects employment at the three-digit industry level and aggregates the results up the hierarchy of the North American Industry Classification System (NAICS). Overall, the state is expected to surpass 2.438 million jobs by 2025, marking a two-year increase of 54,000 jobs, representing a robust growth rate of 2.25 percent. Figure 1 presents a table summarizing the industry projections at the supersector level
FIGURE 1: S.C. INDUSTRY GROUP EMPLOYMENT PROJECTIONS, 2023-2025
Source: DEW, Employment Projections Program
Education and Health Services continues to be the largest supersector, followed by Trade, Transportation and Utilities, and Professional and Business Services . Notably, Education and Health Services and Trade, Transportation, and Utilities are projected to lead in job creation, each adding more than 11,000 jobs during the period. The Goods-Producing sectors, Construction and Manufacturing, also show promising growth, with the addition of 3,172 and 1,107 jobs, respectively.
At the more granular industry sector level, Mining leads with an impressive growth rate of 8.32 percent, followed by the Professional, Scientific, and Technical Services, and Finance and Insurance sectors, which are each projected to grow by more than five percent, as indicated by the table in Figure 2. Reflective of industries at the sector level, Health Care and Social Assistance, expected to be the largest sector employer, is set to expand significantly, adding more than 11,000 jobs. The Retail Trade, Accommodations and
are also poised for substantial growth, showing the diversity of the state's economy.
and
4 SC Department of Employment and Workforce Labor Market Information Division Columbia, South Carolina 29202
Services,
Education Services sectors
Food
NAICS CODE NAICS TITLE BASE EMPLOYMENT PROJECTION EMPLOYMENT NUMERIC CHANGE PERCENT CHANGE ANNUAL GROWTH RATE 000000 Total All Industries 2,385,096 2,438,853 53,757 2 25% 1 12% 000067 Self Employed and Unpaid Family Workers, All Jobs 123,343 125,549 2,206 1.79% 0 89% 101100 Natural Resources and Mining 16,051 16,324 273 1.70% 0 85% 101200 Construction 109,749 112,921 3,172 2 89% 1 43% 101300 Manufacturing 262,264 263,371 1,107 0 42% 0 21% 102100 Trade, Transportation, and Utilities 437,633 449,218 11,585 2 .65% 1 32% 102200 Information 30,406 30,600 194 0 64% 0 32% 102300 Financial Activities 113,426 118,862 5,436 4.79% 2.37% 102400 Professional and Business Services 309,185 316,829 7,644 2.47% 1 23% 102500 Education and Health Services 454,302 468,992 14,690 3 23% 1 60% 102600 Leisure and Hospitality 266,619 269,942 3,323 1 25% 0 62% 102700 Other Services (except Government) 104,633 106,397 1,764 1 69% 0 84% 102800 Government 157,485 159,848 2,363 1 .50% 0.75%
FIGURE 2: S.C. INDUSTRY SECTOR EMPLOYMENT PROJECTIONS, 2023-2025
Source: DEW, Employment Projections Program
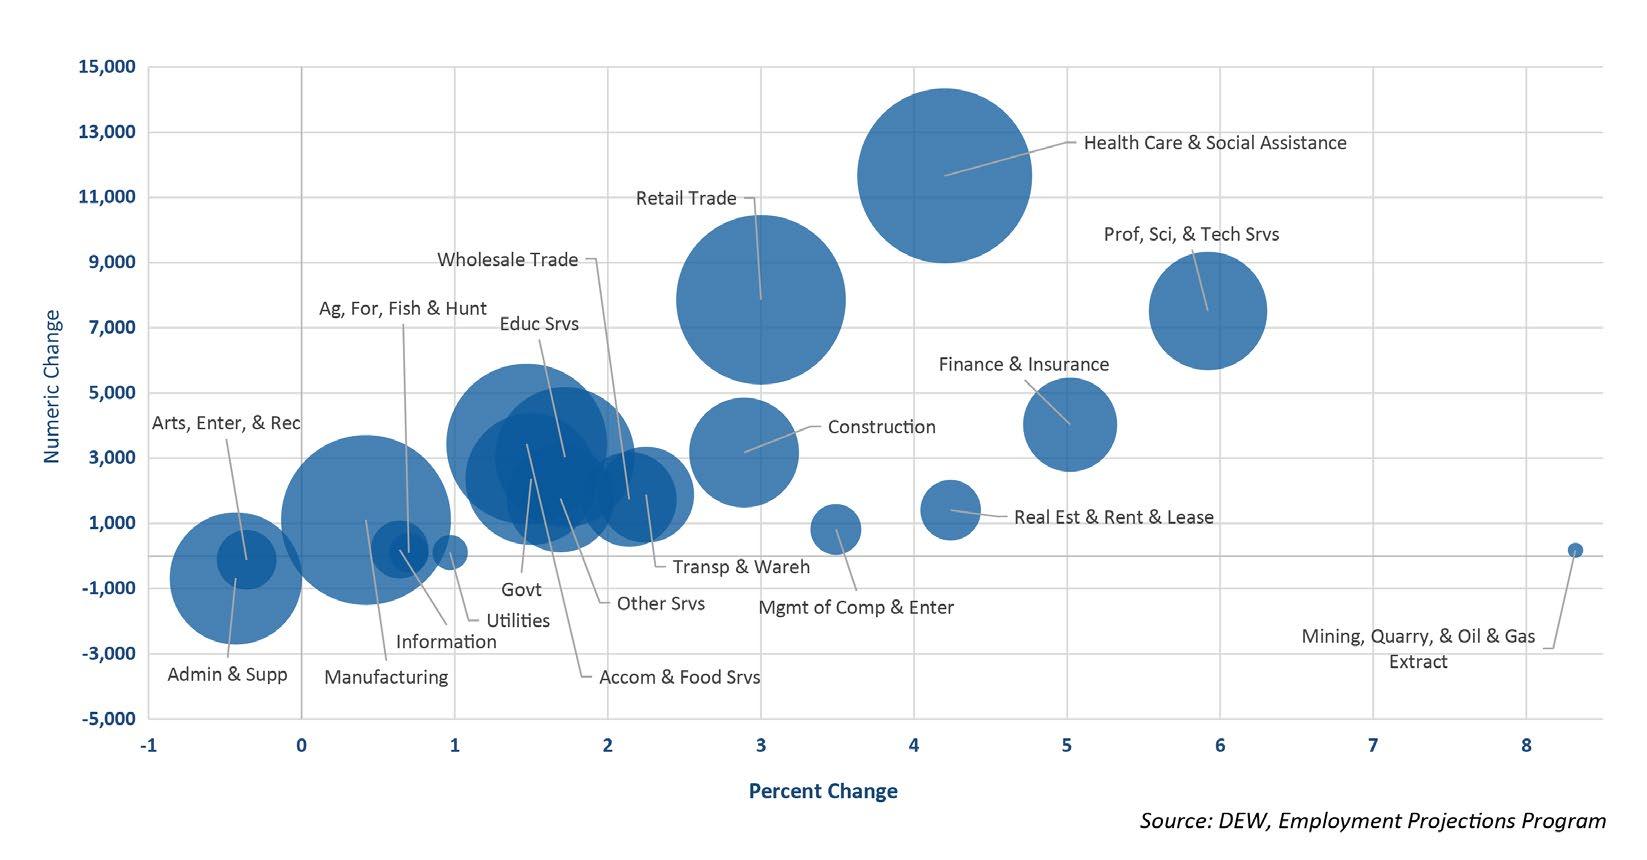
The bubble chart in Figure 3 illustrates the employment projections across various industry sectors with bubble size determined by base employment level and the axes showing the two-year change The Health Care and Social Assistance industry sector is a clear, projected leader .
5 dew.sc.gov scworkforceinfo.com
BASE EMPLOYMENT PROJECTION EMPLOYMENT NUMERIC CHANGE PERCENT CHANGE Mining, Quarry, & Oil & Gas Extract 2,104 2,279 175 8 32% Professional, Scientific, and Technical Services 126,974 134,486 7,512 5 92% Finance & Insurance 80,253 84,281 4,028 5 02% Real Estate & Rent & Lease 33,173 34,581 1,408 4 24% Health Care & Social Assistance 277,525 289,180 11,655 4 20% Management of Companies and Enterprises 23,406 24,222 816 3 49% Retail Trade 261,550 269,408 7,858 3 00% Construction 109,749 112,921 3,172 2 89% Transportation & Warehousing 83,622 85,505 1,883 2 25% Total All Industries 2,385,096 2,438,853 53,757 2 25% Wholesale Trade 81,277 83,013 1,736 2 14% Educational Services 176,777 179,812 3,035 1.72% Other Services 104,633 106,397 1,764 1 69% Government 157,485 159,848 2,363 1 50% Accommodation and Food Services 234,403 237,841 3,438 1.47% Utilities 11,184 11,292 108 0.97% Agriculture, Forestry, Fishing and Hunting 13,947 14,045 98 0.70% Information 30,406 30,600 194 0 64% Manufacturing 262,264 263,371 1,107 0 42% Arts, Entertainment, and Recreation 32,216 32,101 -115 -0 36% Administrative and Support 158,805 158,121 -684 -0 43%
NAICS TITLE
FIGURE 3: S.C. INDUSTRY SECTOR EMPLOYMENT CHANGE, 2023-2025
The placement of bubbles from left to right signifies the extent of percent growth or decline in each sector. Bubbles situated farther to the right indicate a higher projected percent change in employment, reflecting sectors expected to expand significantly. Conversely, bubbles positioned closer to the left indicate sectors with relatively stagnant or declining employment. The vertical axis shows the numeric change in employment
The sectors Health Care and Social Assistance; Professional, Scientific, and Technical Services; Finance and Insurance; and Retail Trade exhibit notable impact on the economy with significant size and growth. Stakeholders can utilize this visual representation to identify sectors with significant growth potential, informing strategic decisions related to workforce development, investment, and economic policies
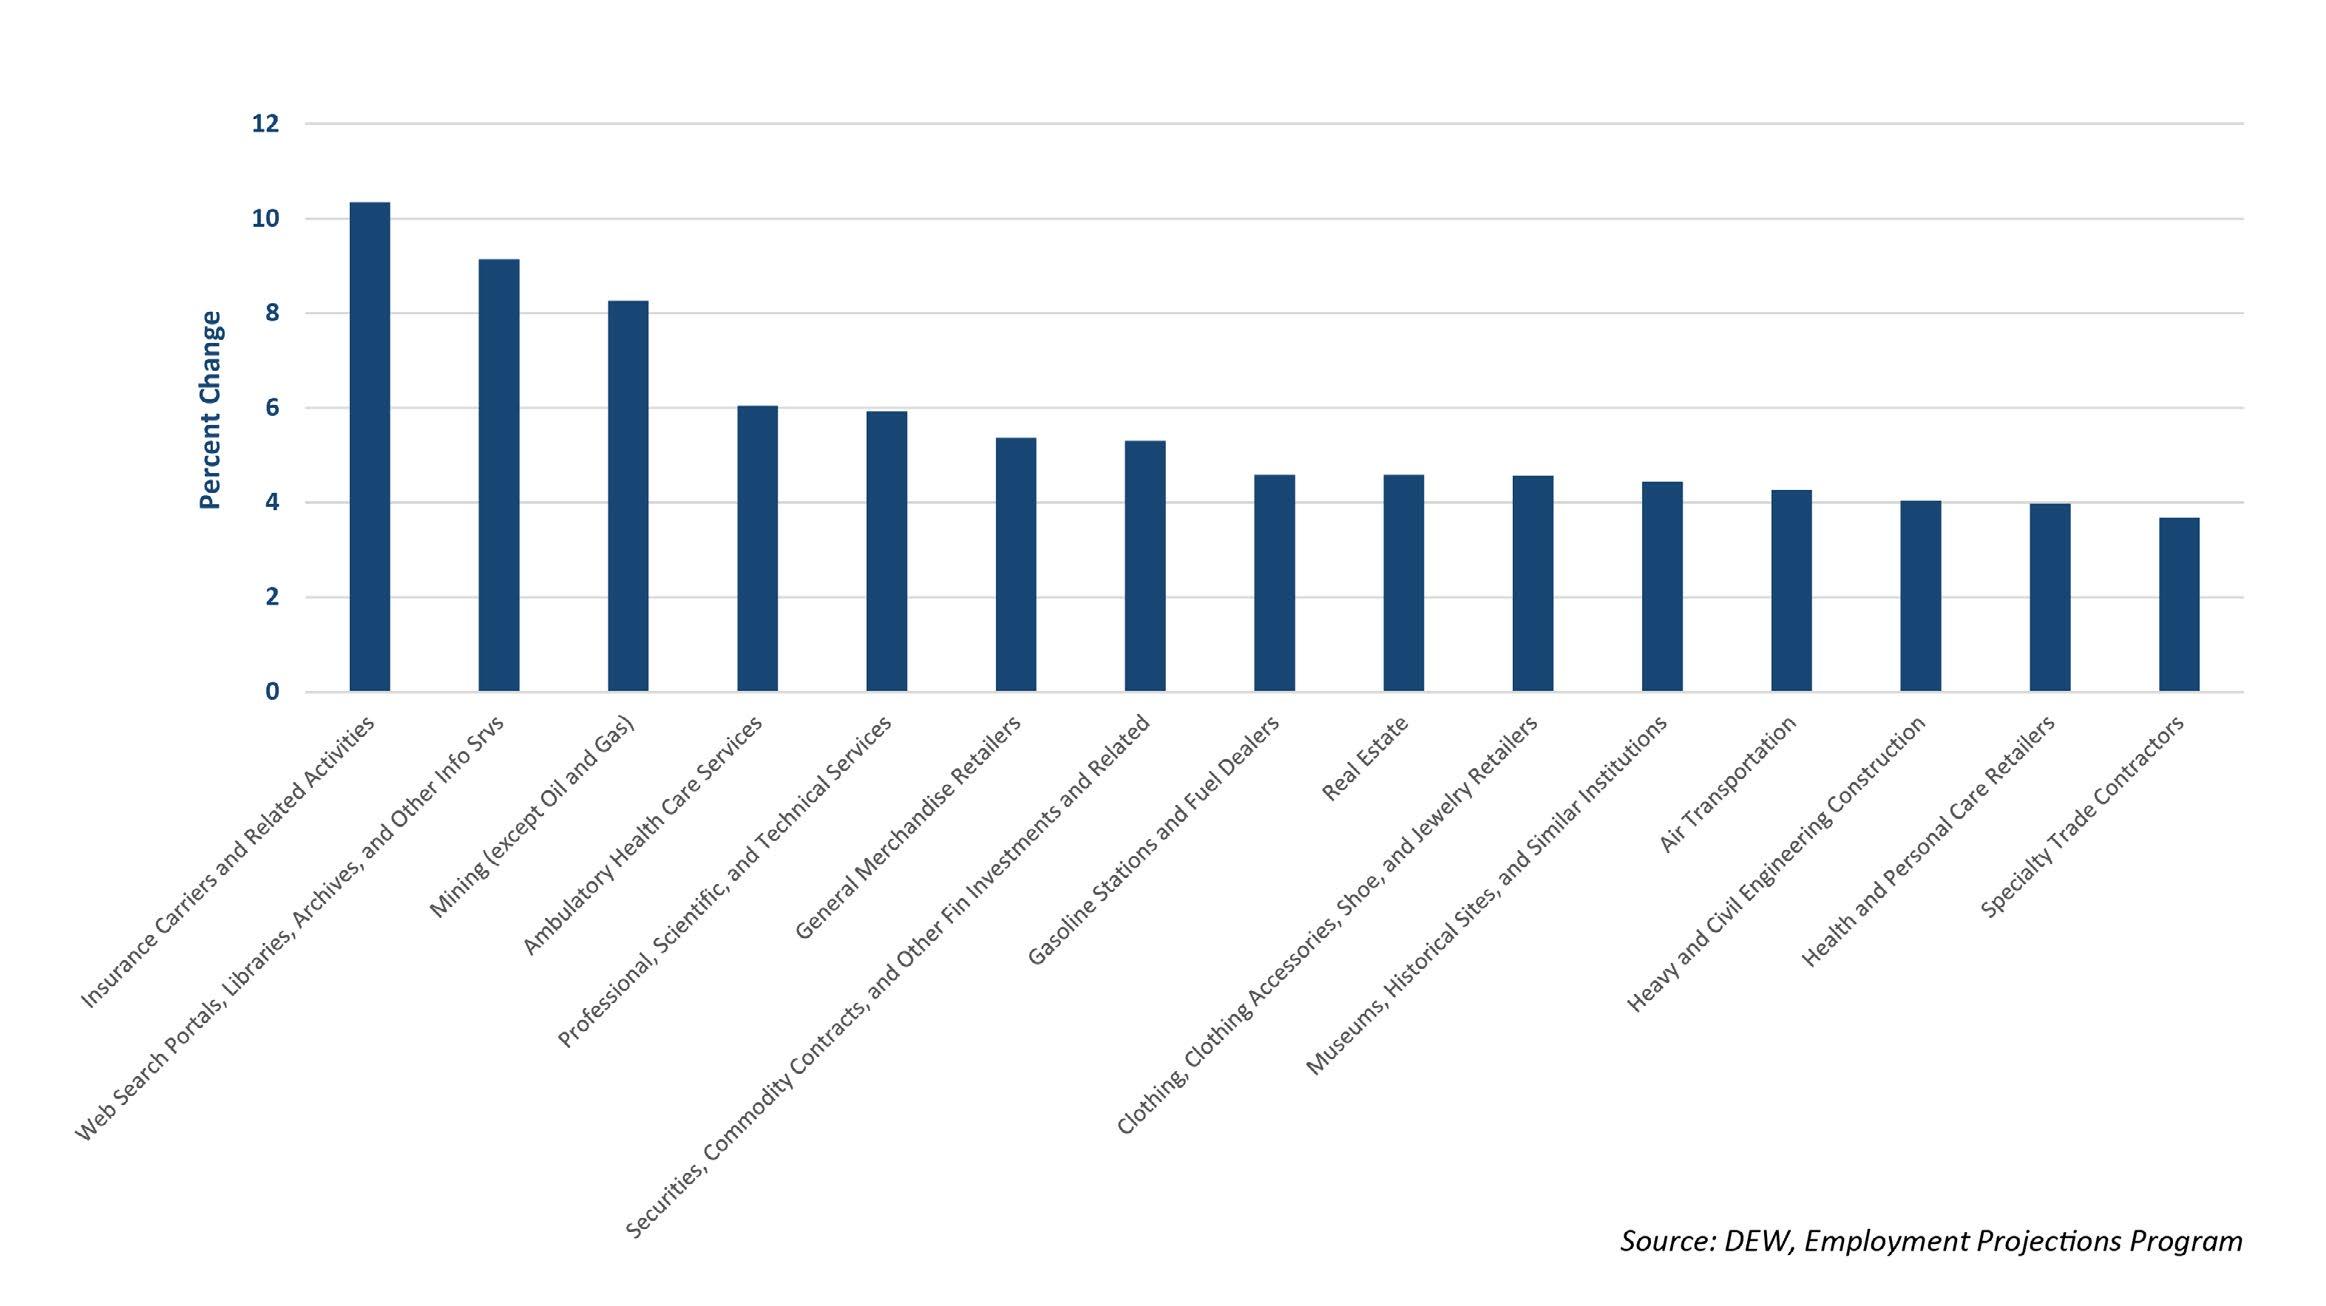
Examining the subsector-level employment change reveals a variety of industries expecting strong growth over the two-year period. Figure 4 highlights the top subsectors by percent change with Insurance Carriers, Web Search Portals, and Mining leading the way in growth
Occupational Projections
Occupations show what workers do as opposed to what their companies' activities are, as with industry projections. Figure 5 presents a table of employment projections and metrics by major occupation group. Office and Administrative Support is the largest group with 312,000 jobs, followed by Sales and Related Occupations with 241,000 jobs.
6 SC Department of Employment and Workforce Labor Market Information Division Columbia, South Carolina 29202
.
FIGURE 4: S.C. TOP INDUSTRY SUBSECTOR PROJECTED EMPLOYMENT PERCENT CHANGE, 2023-2025
FIGURE 5: S.C. OCCUPATIONAL EMPLOYMENT PROJECTIONS, 2023-2025
7 dew.sc.gov scworkforceinfo.com
SOC CODE NAICS TITLE BASE EMPLOYMENT PROJECTION EMPLOYMENT NUMERIC CHANGE PERCENT CHANGE ANNUAL JOB OPENINGS ANNUAL GROWTH RATE 00-0000 Total, All Occupations 2,385,096 2,438,853 53,757 2 25% 296,699 1 12% 11-0000 Management Occupations 152,618 157,255 4,637 3 04% 14,106 1 51% 13-0000 Business and Financial Operations Occupations 114,480 118,509 4,029 3 52% 11,176 1.74% 15-0000 Computer and Mathematical Occupations 52,765 55,593 2,828 5 36% 4,613 2 64% 17-0000 Architecture and Engineering Occupations 41,731 43,033 1,302 3 12% 3,489 1 55% 19-0000 Life, Physical, and Social Science Occupations 15,675 16,095 420 2 68% 1,614 1 33% 21-0000 Community and Social Service Occupations 30,977 31,961 984 3 18% 3,068 1 58% 23-0000 Legal Occupations 18,885 19,795 910 4 82% 1,685 2 38% 25-0000 Educational Instruction and Library Occupations 113,158 115,392 2,234 1.97% 10,815 0 98% 27-0000 Arts, Design, Entertainment, Sports, and Media Occupations 28,287 29,050 763 2.70% 3,179 1 34% 29-0000 Healthcare Practitioners and Technical Occupations 140,387 146,215 5,828 4 15% 10,898 2 05% 31-0000 Healthcare Support Occupations 84,599 88,762 4,163 4 92% 14,402 2 43% 33-0000 Protective Service Occupations 47,819 48,475 656 1.37% 5,590 0 68% 35-0000 Food Preparation and Serving Related Occupations 219,921 223,379 3,458 1.57% 43,562 0.78% 37-0000 Building and Grounds Cleaning and Maintenance Occupations 82,885 83,440 555 0.67% 11,397 0 33% 39-0000 Personal Care and Service Occupations 65,214 66,316 1,102 1 69% 12,165 0 84% 41-0000 Sales and Related Occupations 241,150 247,657 6,507 2.70% 35,354 1 34% 43-0000 Office and Administrative Support Occupations 312,017 314,497 2,480 0.79% 37,013 0 40% 45-0000 Farming, Fishing, and Forestry Occupations 9,795 9,840 45 0 46% 1,452 0 23% 47-0000 Construction and Extraction Occupations 97,649 100,430 2,781 2 85% 9,802 1 41% 49-0000 Installation, Maintenance, and Repair Occupations 102,918 105,435 2,517 2 45% 10,286 1 22% 51-0000 Production Occupations 197,485 197,882 397 0 20% 21,067 0 10% 53-0000 Transportation and Material Moving Occupations 214,681 219,842 5,161 2 40% 29,969 1 19%
DEW, Employment Projections Program
Source:
The smallest Occupation Group is Farming, Fishing, and Forestry with fewer than 9,800 jobs. The chart in Figure 6 below presents the occupation groups sorted by percent change in descending order .
FIGURE 6: S.C. OCCUPATIONAL GROUP PROJECTED EMPLOYMENT PERCENT CHANGE, 2023-2025
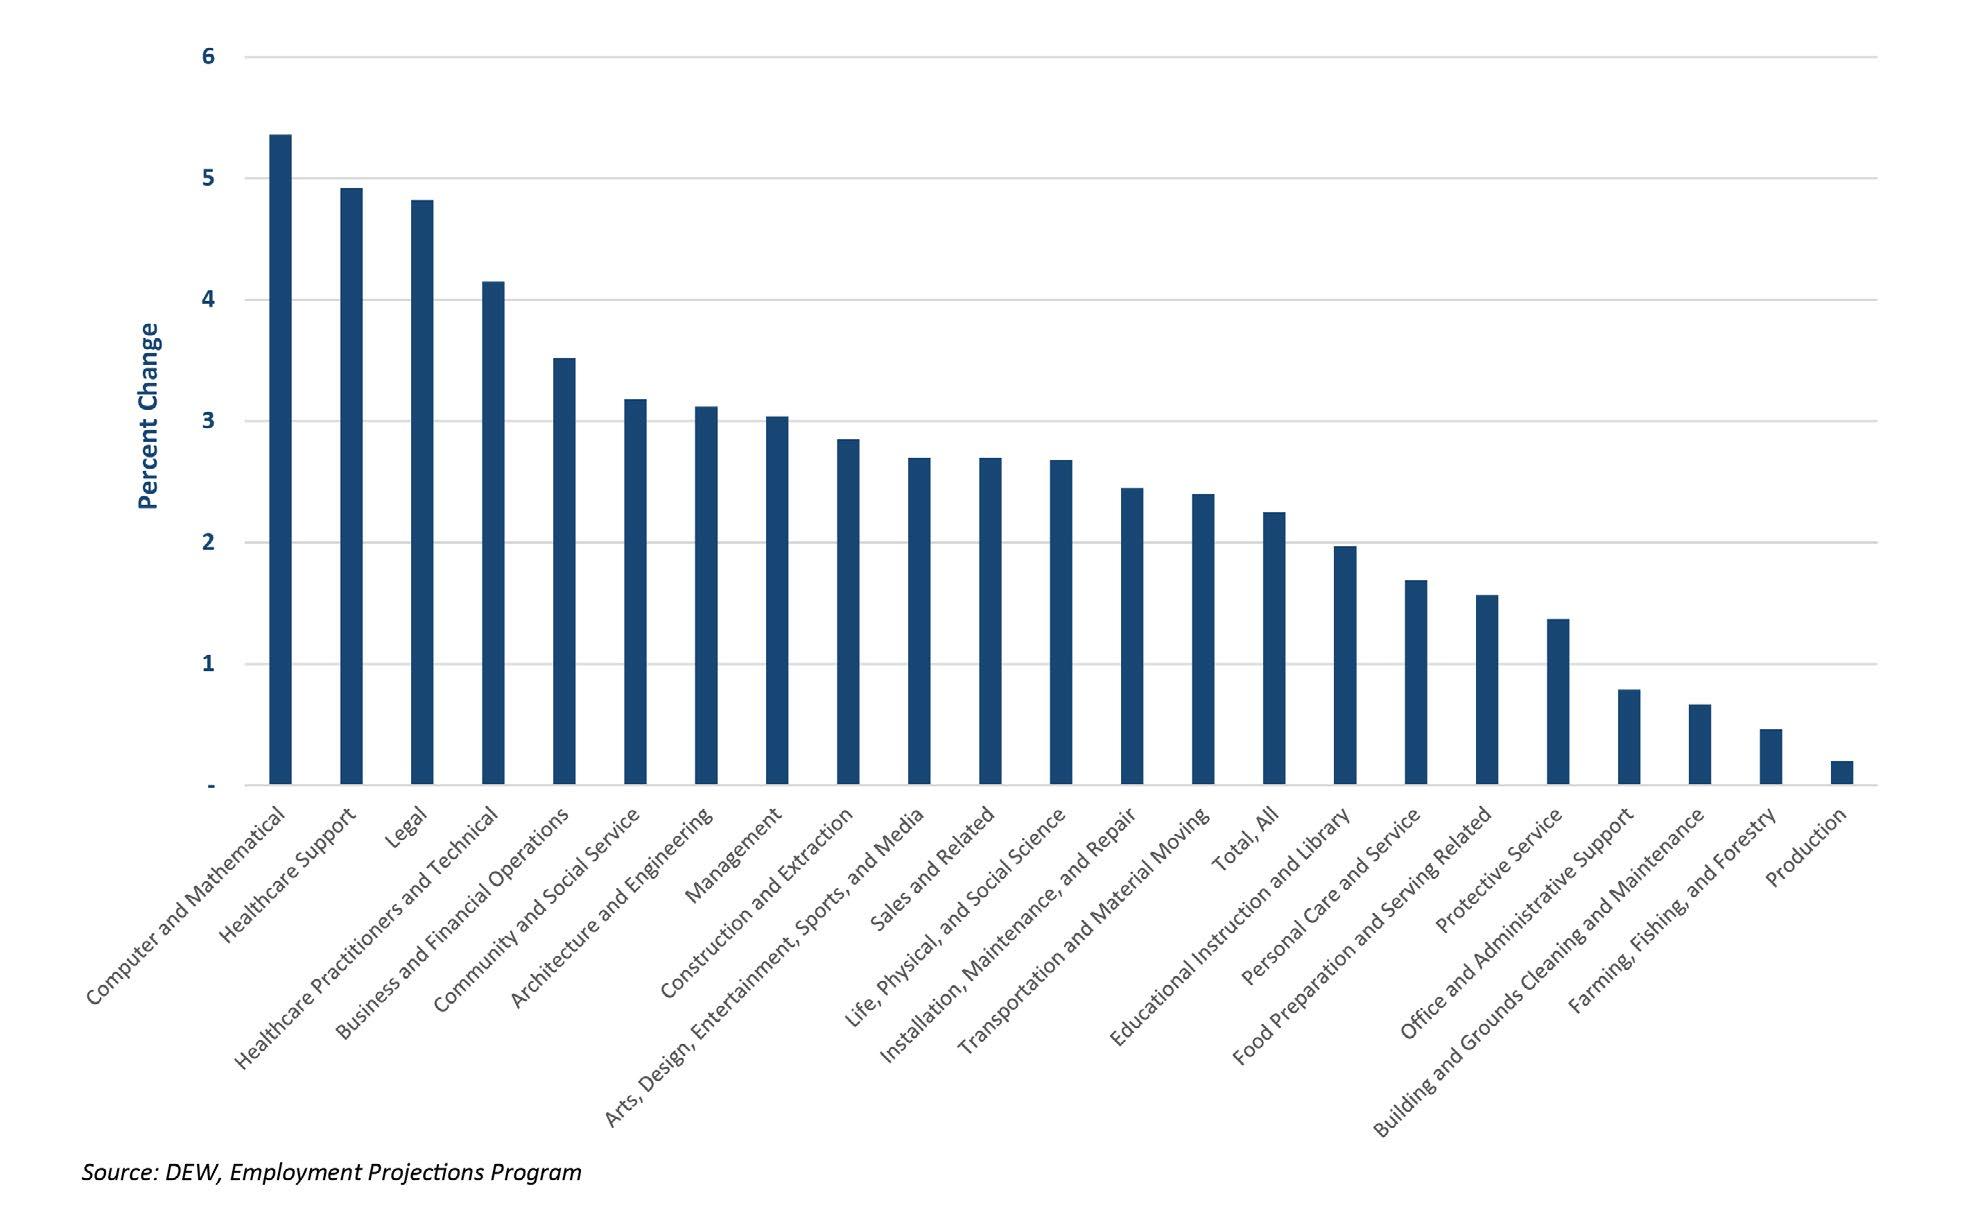
Computer and Mathematical occupations are projected to grow more than five percent for the two-year period, pointing to increasing demand for professionals skilled in computer science, data analysis, and other mathematical disciplines, driven by technological advancements and digital transformation across industries. Healthcare Support, Legal, and Healthcare Practitioners and Technical occupations are expected to grow more than four percent, indicating healthcare industry expansion and advancements in medical technology as well as demand for legal expertise in various fields. On the other end of the spectrum, Production occupations should tick up by a modest 0 2 percent
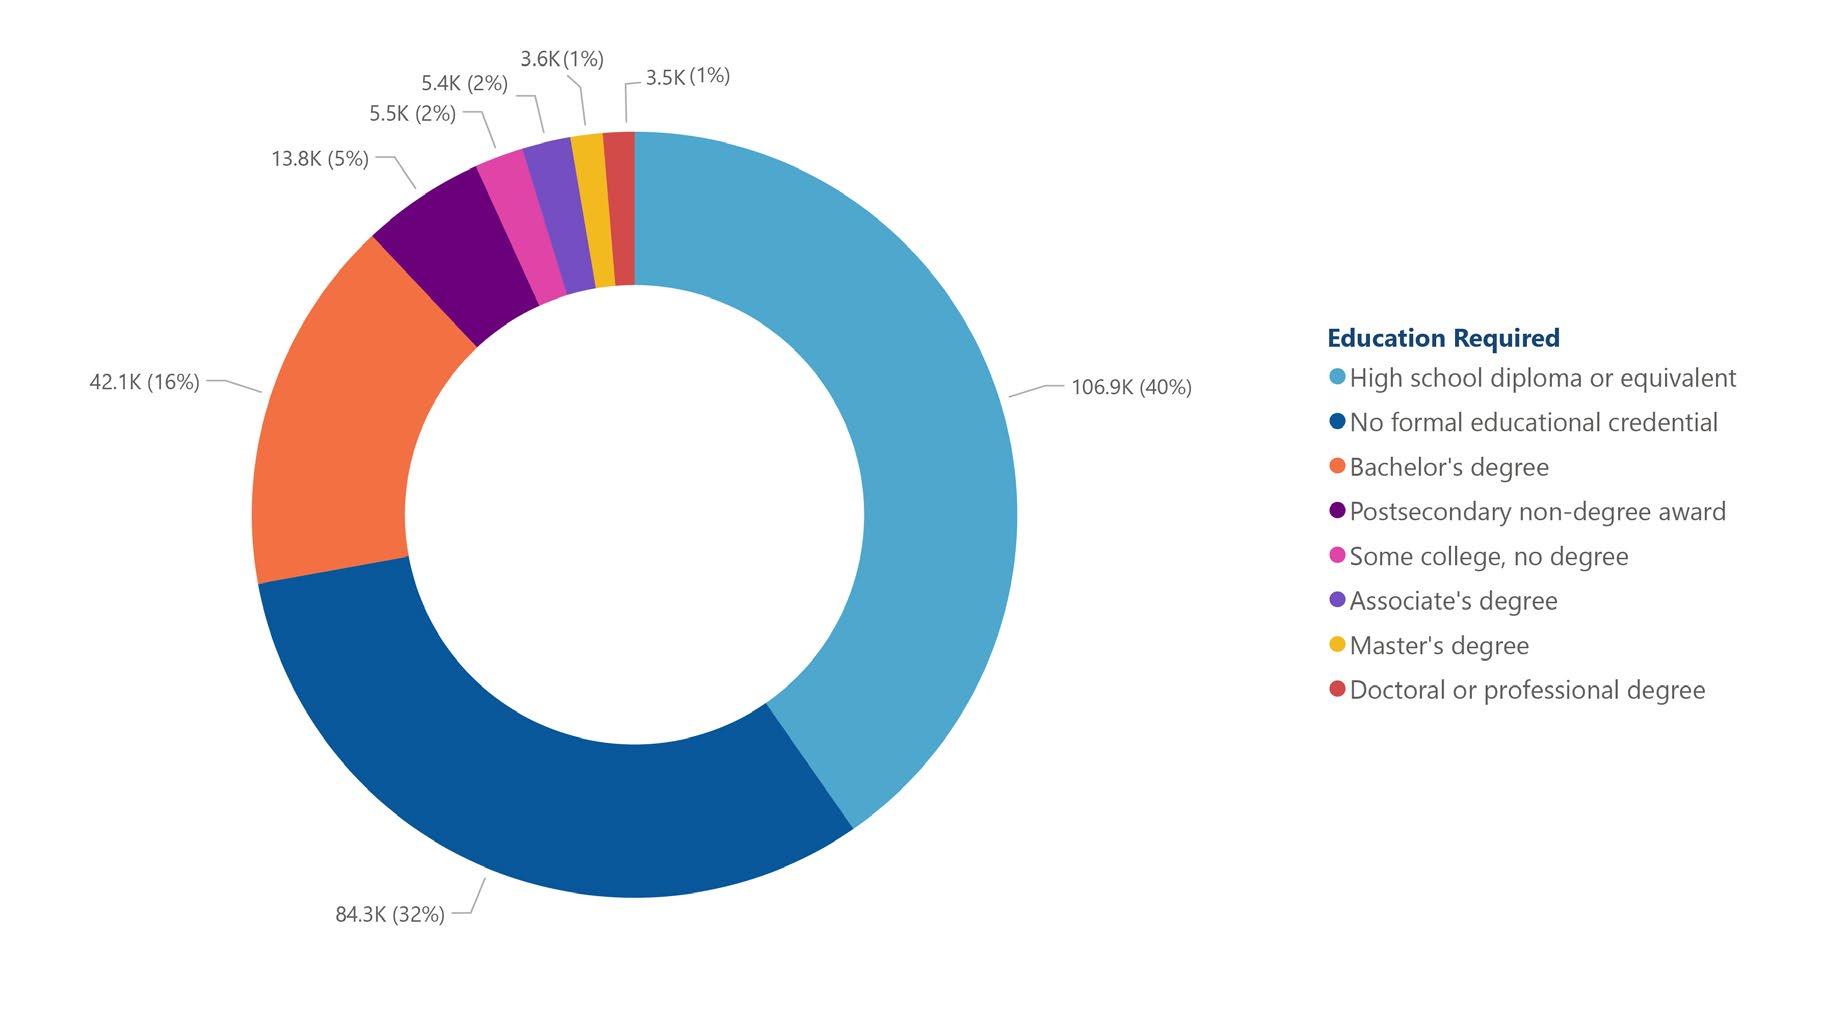
The Bureau of Labor Statistics determines the typical education for entry into an occupation by exhaustive research. A summary of the annual job openings by education required is shown in Figure 7 below
8 SC Department of Employment and Workforce Labor Market Information Division Columbia, South Carolina 29202
FIGURE 7: ANNUAL JOB OPENINGS BY EDUCATION REQUIRED
The clear majority of projected job openings require education at the high school level or below. However, occupations requiring a Bachelor’s degree still represent a significant portion of the job market. Roles requiring higher education typically offer higher earning potential and opportunities for career advancement. Occupations requiring some college but no degree and those necessitating an associate degree present moderate job openings. These roles often require specific technical or vocational skills acquired through partial college education or specialized training programs. Occupations requiring advanced degrees have comparatively fewer job openings. These roles typically represent specialized fields such as healthcare, academia, or executive leadership, where demand may be more limited but opportunities for high-level expertise and leadership exist.
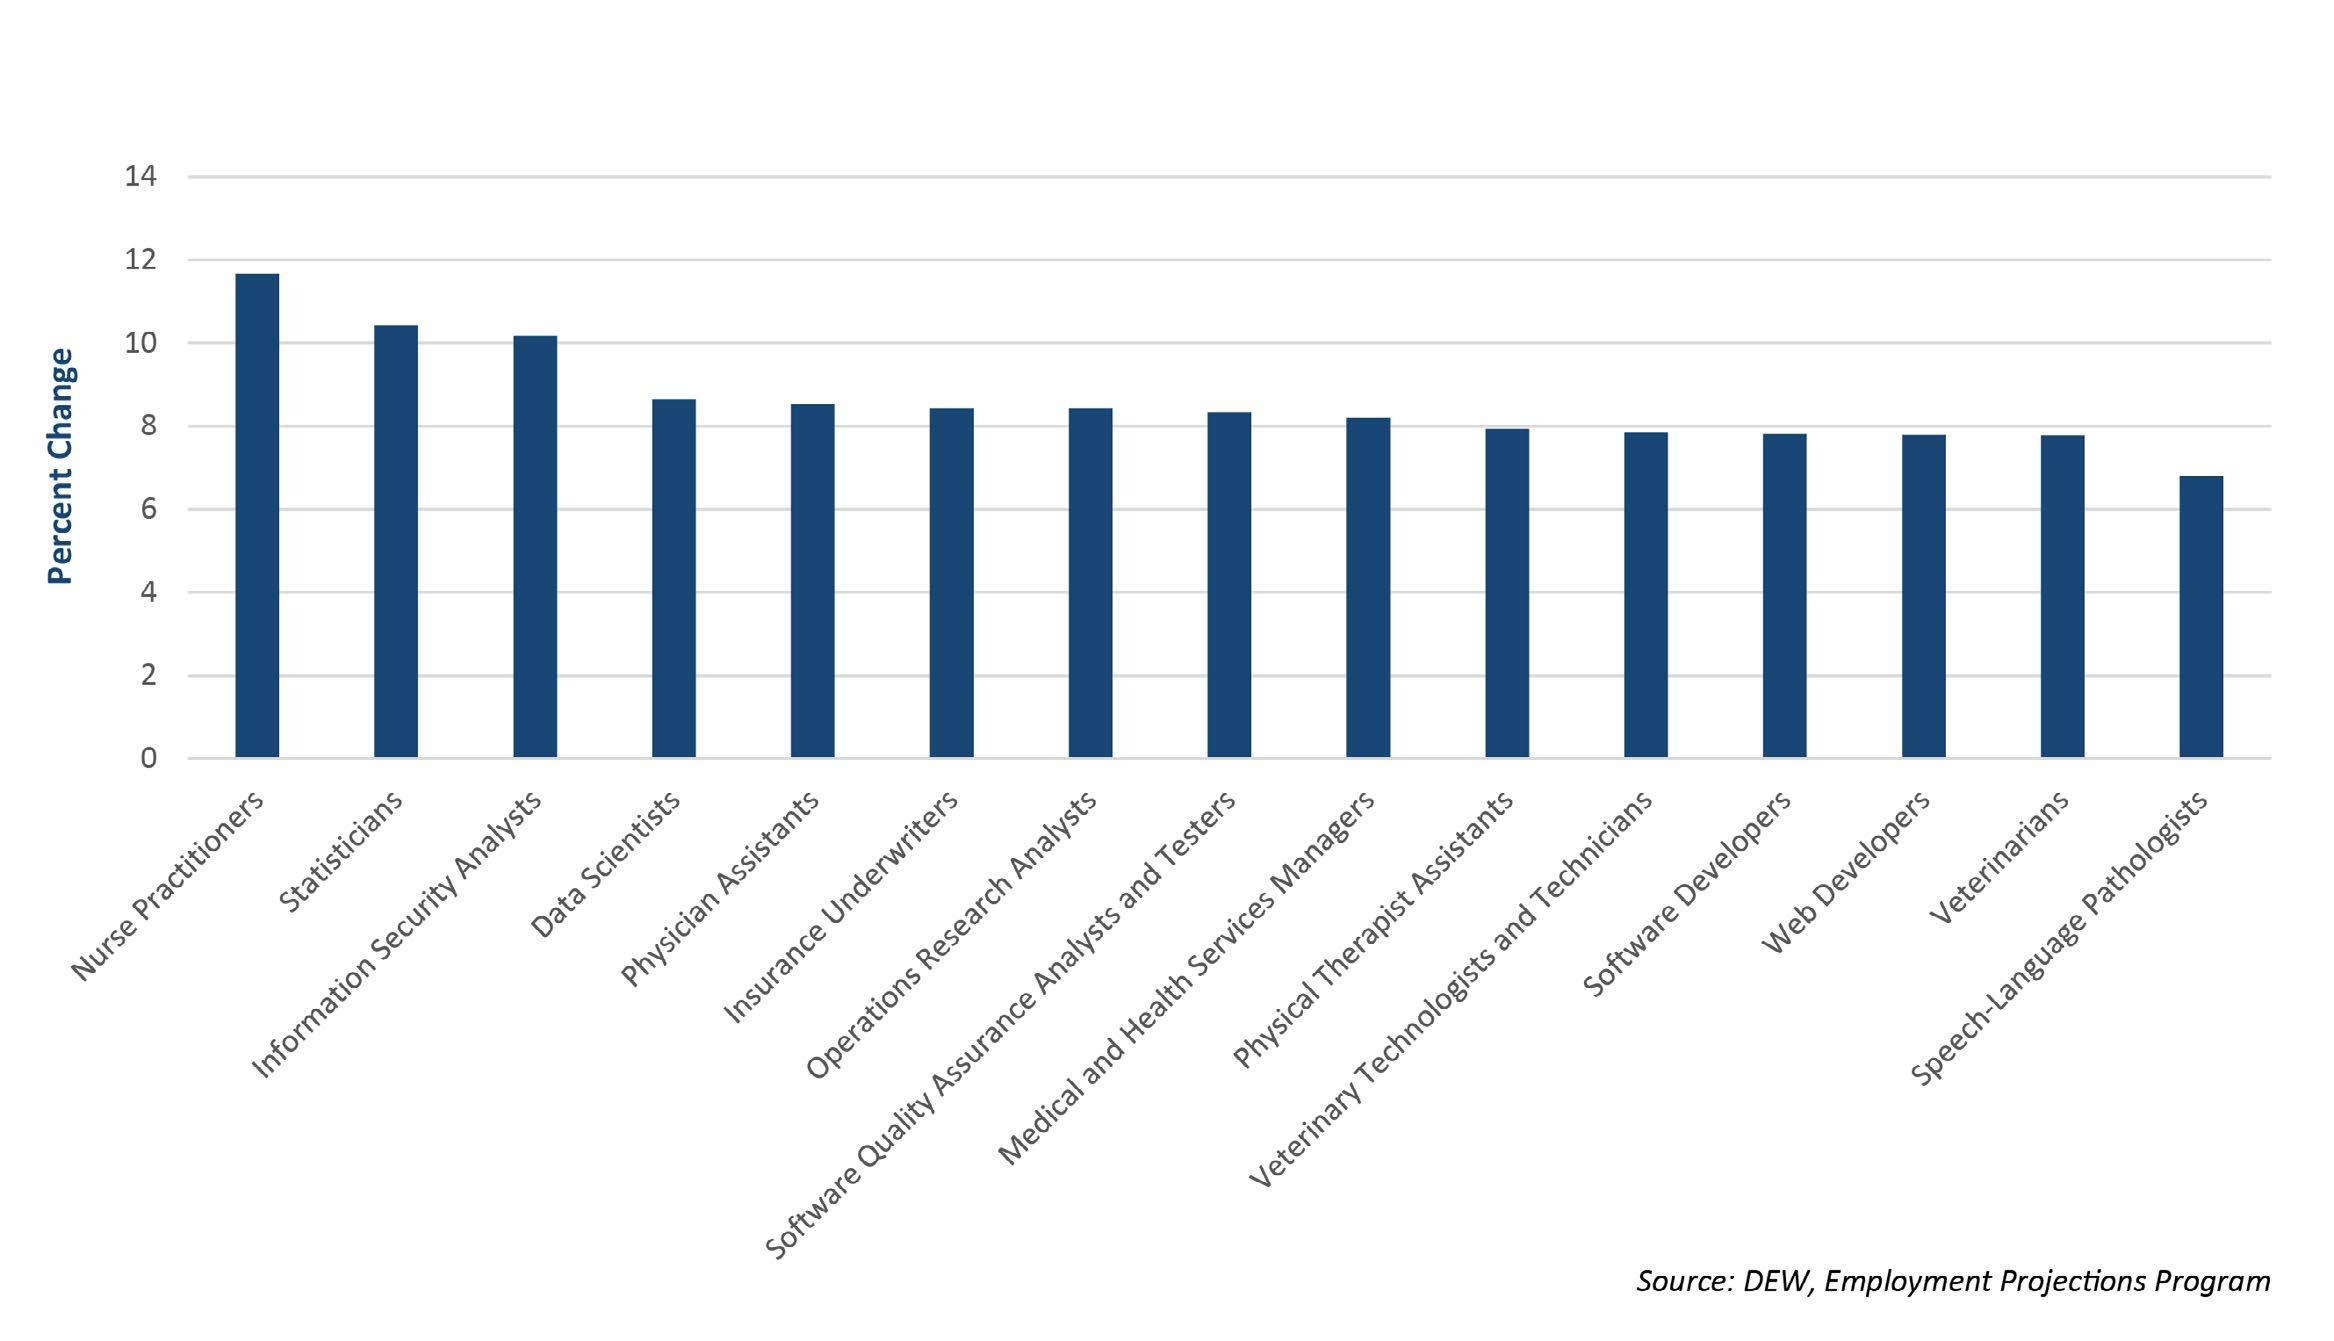
Figure 8 presents a table of the fastest-growing occupations with at least 25 new jobs projected to be added over the two-year period. Computer, Mathematical, and Healthcare occupations dominate the listing
FIGURE 8: S.C. FASTEST GROWING OCCUPATIONS WITH GROWTH OF AT LEAST 25 NEW JOBS
9 dew.sc.gov scworkforceinfo.com
SOC CODE NAICS TITLE BASE EMPLOYMENT PROJECTION EMPLOYMENT NUMERIC CHANGE PERCENT CHANGE 29-1171 Nurse Practitioners 4,243 4,738 495 11.67% 41-3021 Insurance Sales Agents 8,598 9,517 919 10 69% 15-2041 Statisticians 288 318 30 10 42% 15-1212 Information Security Analysts 1,436 1,582 146 10.17% 47-5041 Continuous Mining Machine Operators 359 391 32 8 91% 15-2051 Data Scientists 1,284 1,395 111 8 64% 29-1071 Physician Assistants 1,854 2,012 158 8 52% 31-9096 Veterinary Assistants and Laboratory Animal Caretakers 2,061 2,235 174 8 44% 13-2053 Insurance Underwriters 1,364 1,479 115 8 43% 15-2031 Operations Research Analysts 913 990 77 8 43% 15-1253 Software Quality Assurance Analysts and Testers 1,383 1,498 115 8 32% 11-9111 Medical and Health Services Managers 8,004 8,661 657 8 21% 39-9099 Personal Care and Service Workers, All Other 845 913 68 8 05% 31-2021 Physical Therapist Assistants 2,181 2,354 173 7.93% 29-2056 Veterinary Technologists and Technicians 1,952 2,105 153 7.84% 15-1252 Software Developers 11,992 12,928 936 7.81% 15-1254 Web Developers 1,566 1,688 122 7.79% 29-1131 Veterinarians 1,851 1,995 144 7.78% 43-9041 Insurance Claims and Policy Processing Clerks 4,298 4,596 298 6 93% 29-1127 Speech-Language Pathologists 2,428 2,593 165 6 80% Source: DEW, Employment Projections Program
A subset of the table shown in Figure 9 shows those occupations that require education beyond high school. The increased demand for advanced healthcare providers to address the needs of aging populations and expand healthcare services is apparent from the sheer number of healthcare occupations in the listing. The rising importance of data analysis and statistical expertise, driven by the growing emphasis on data-driven decision-making and analytics, is also evident by the many computer and mathematical positions
FIGURE 9: FASTEST GROWING BY AT LEAST 25 NEW JOBS FOR OCCUPATIONS REQUIRING EDUCATION BEYOND HIGH SCHOOL
Conversely, Figure 10 highlights the fastest declining occupations that are projected to lose at least 25 jobs. The declines result from changing consumer preferences and the impact of technological innovations in the workforce.

10
FIGURE 10: S.C. FASTEST DECLINING OCCUPATIONS WITH LOSS OF AT LEAST 25 JOBS
Overall, the analysis reveals the dynamic nature of the job market in South Carolina, with certain occupations experiencing rapid growth while others face decline due to various economic, technological, and societal factors. This data can inform workforce development strategies, education and training programs, and career planning initiatives to align with emerging opportunities and challenges in the labor market

11
.
BASE EMPLOYMENT PROJECTION EMPLOYMENT NUMERIC CHANGE PERCENT CHANGE 41-9091 Door-to-Door Sales Workers, News and Street Vendors, and Related Workers 939 885 -54 -5.75% 41-9041 Telemarketers 871 826 -45 -5.17% 51-7011 Cabinetmakers and Bench Carpenters 933 896 -37 -3.97% 51-2041 Structural Metal Fabricators and Fitters 843 816 -27 -3 2% 51-9011 Chemical Equipment Operators and Tenders 4,003 3,888 -115 -2.87% 43-3071 Tellers 6,145 5,969 -176 -2 86% 43-6011 Executive Secretaries and Executive Administrative Assistants 5,778 5,622 -156 -2.7% 43-9021 Data Entry Keyers 1,583 1,551 -32 -2 02% 51-9198 Helpers--Production Workers 3,772 3,703 -69 -1 83% 51-6064 Textile Winding, Twisting, and Drawing Out Machine Setters, Operators, and Tenders 2,417 2,377 -40 -1 65% 51-6063 Textile Knitting and Weaving Machine Setters, Operators, and Tenders 2,019 1,988 -31 -1 54% 51-4033 Grinding, Lapping, Polishing, and Buffing Machine Tool Setters, Operators, and Tenders, Metal and Plastic 1,687 1,662 -25 -1 48% 35-2011 Cooks, Fast Food 14,738 14,525 -213 -1 .45% 51-6091 Extruding and Forming Machine Setters, Operators, and Tenders, Synthetic and Glass Fibers 2,186 2,158 -28 -1 28% 51-4031 Cutting, Punching, and Press Machine Setters, Operators, and Tenders, Metal and Plastic 2,658 2,627 -31 -1.17% 43-3011 Bill and Account Collectors 5,524 5,481 -43 -0.78% 43-5071 Shipping, Receiving, and Inventory Clerks 15,277 15,213 -64 -0 42% 43-6014 Secretaries and Administrative Assistants, Except Legal, Medical, and Executive 37,467 37,345 -122 -0 33% 33-9032 Security Guards 14,224 14,196 -28 -0 20% Source: DEW, Employment Projections Program
SOC CODE SOC TITLE
South Carolina’s Employment Situation (March 2024)
Household Survey1 (Local Area Unemployment Statistics)
Nationally, there is a monthly Current Population Survey of about 60,000 households conducted by the Census Bureau for the Bureau of Labor Statistics (BLS) to determine employment status of the civilian population. This information, along with other inputs, are used by DEW to operate the Local Area Unemployment Statistics program, which estimates the number of individuals employed and those not employed, but actively seeking employment for statewide and a variety of substate geographies.
EMPLOYMENT (SEASONALLY ADJUSTED 3 )
• The seasonally adjusted number of South Carolina workers increased to 2,399,623.
• That is an increase of 3,428 people over the February 2024 estimate.
• That is an increase of 35,715 people over the March 2023 estimate.
NUMBER OF PEOPLE EMPLOYED
2,340,000 2,350,000 2,360,000 2,370,000 2,380,000 2,390,000 2,400,000 2,410,000
SEASONALLY ADJUSTED: Seasonal adjustment removes the effects of events that follow a regular pattern each year (i.e. tourist-related hiring and school closings in the summer) These adjustments make it easier to observe the cyclical and other nonseasonal movements in data over time
12 SC Department of Employment and Workforce Labor Market Information Division Columbia, South Carolina 29202
UNEMPLOYMENT (SEASONALLY ADJUSTED 3 )
• The estimate of unemployed people increased to 77,961.
• That is an increase of 1,537 people from February’s estimate and an increase of 5,931 from the March 2023 estimate.
• The state’s seasonally adjusted unemployment rate was unchanged at 3 1 percent The national unemployment rate decreased to 3 8 percent, according to the Current Population Survey
LABOR FORCE:
• The state’s estimated labor force (people working plus unemployed people looking for work) increased to 2,477,584, while the labor force participation rate was steady at 57.1 percent
• That is an increase of 4,965 people over the February 2024 estimate
• That is a significant increase of 41,646 individuals over the March 2023 estimate.
SEASONALLY ADJUSTED: Seasonal adjustment removes the effects of events that follow a regular pattern each year (i.e. tourist-related hiring and school closings in the summer) These adjustments make it easier to observe the cyclical and other nonseasonal movements in data over time
13 dew.sc.gov scworkforceinfo.com
2.7% 2.7% 2 8% 2.8% 2.9% 2.9% 3 0% 3.0% 3.1% 3.1% 3.2%
UNEMPLOYMENT RATE
South Carolina’s Employment Situation (cont.)
Employer Survey2 (Current Employment Statistics)
BLS conducts a monthly Current Employment Statistics survey of approximately 119,000 businesses and government agencies which yields national estimates of nonagricultural wage and salary employment, hours, and earnings by industry. These data are processed by DEW to generate comparable data for the state and its metropolitan statistical areas.
NONAGRICULTURAL EMPLOYMENT BY INDUSTRY (SEASONALLY ADJUSTED 3 )
The monthly survey of businesses in South Carolina marked an estimated increase of 7,200 nonfarm payroll jobs over the month to a level of 2,358,400.
FEBRUARY 2024 TO MARCH 2024
MARCH 2023 TO MARCH 2024
SEASONALLY ADJUSTED: Seasonal adjustment removes the effects of events that follow a regular pattern each year (i.e. tourist-related hiring and school closings in the summer) These adjustments make it easier to observe the cyclical and other nonseasonal movements in data over time
14 SC Department of Employment and Workforce Labor Market Information Division Columbia, South Carolina 29202
JOBS BY INDUSTRY MARCH 2024 FEBRUARY 2024 MARCH 2023 # CHANGE % CHANGE # CHANGE % CHANGE Total Nonfarm Employment 2,358,400 2,351,200 2,293,200 +7,200 ↑ +0.3% ↑ +65,200 ↑ +2.8% ↑ Construction 114,900 115,500 111,300 -600 ↓ -0 5% ↓ +3,600 ↑ +3 2% ↑ Manufacturing 265,900 265,900 262,800 0 - 0% - +3,100 ↑ +1 2% ↑ Trade, Transportation, and Utilities 447,100 446,200 440,100 +900 ↑ +0 2% ↑ +7,000 ↑ +1 6% ↑ Information 29,000 28,800 29,500 +200 ↑ +0.7% ↑ -500 ↓ -1.7% ↓ Financial Activities 123,800 123,500 121,000 +300 ↑ +0 2% ↑ +2,800 ↑ +2 3% ↑ Professional and Business Services 317,400 315,400 311,200 +2,000 ↑ +0 .6% ↑ +6,200 ↑ +2 0% ↑ Education and Health Services 295,400 293,800 276,800 +1,600 ↑ +0 5% ↑ +18,600 ↑ +6.7% ↑ Leisure and Hospitality 293,000 290,700 278,500 +2,300 ↑ +0 8% ↑ +14,500 ↑ +5 2% ↑ Other Services 89,800 89,800 85,900 0 - 0 - +3,900 ↑ +4 5% ↑ Government 377,600 377,100 371,700 +500 ↑ +0 1% ↑ +5,900 ↑ +1 6% ↑
NONAGRICULTURAL EMPLOYMENT BY METROPOLITAN STATISTICAL AREA (SEASONALLY ADJUSTED 3 )
The monthly survey of businesses in South Carolina marked an estimated increase of 7,200 nonfarm payroll jobs over the month to a level of 2,358,400.
FEBRUARY 2024 TO MARCH 2024 MARCH 2023 TO MARCH 2024 JOBS BY INDUSTRY
NOTE: Employment estimates have been rounded to the nearest hundred. Sum of detail may not equal totals due to rounding or the exclusion of certain industries from publication. All data are subject to revision.
SEASONALLY ADJUSTED: Seasonal adjustment removes the effects of events that follow a regular pattern each year (i.e. tourist-related hiring and school closings in the summer) These adjustments make it easier to observe the cyclical and other nonseasonal movements in data over time
15 dew.sc.gov scworkforceinfo.com
MARCH 2024 FEBRUARY 2024 MARCH 2023 # CHANGE % CHANGE # CHANGE % CHANGE Statewide 2,358,400 2,351,200 2,293,200 +7,200 ↑ +0.3% ↑ +65,200 ↑ +2.8% ↑ Charleston/North Charleston 424,600 424,300 409,000 +300 ↑ +0 1% ↑ +15,600 ↑ +3 8% ↑ Columbia 433,800 431,800 421,500 +2,000 ↑ +0 5% ↑ +12,300 ↑ +2 9% ↑ Florence 97,500 97,000 95,300 +500 ↑ +0 5% ↑ +2,200 ↑ +2 3% ↑ Greenville/Anderson/Mauldin 465,900 464,500 457,900 +1,400 ↑ +0 3% ↑ +8,000 ↑ +1.7% ↑ Hilton Head-Bluffton-Beaufort 91,200 90,900 88,000 +300 ↑ +0 3% ↑ +3,200 ↑ +3 6% ↑ Myrtle Beach 198,700 198,500 191,200 +200 ↑ +0 1% ↑ +7,500 ↑ +3 9% ↑ Spartanburg 174,300 173,800 169,800 +500 ↑ +0 3% ↑ +4,500 ↑ +2.7% ↑ Sumter 38,800 38,600 37,700 +200 ↑ +0 5% ↑ +1,100 ↑ +2 9% ↑
16 SC Department of Employment and Workforce Labor Market Information Division Columbia, South Carolina 29202 3.9% 3.4% 6.5% 3.1% 6.5% 5.4% 3.2% 3.8% 2.7% 4.8% 5.0% 3.7% 4.2% 3.3% 2.9% 3.3% 4.4% 3.1% 3.7% 3.2% 3.1% 3.2% 3.9% 3.4% 4.7% 2.7% 4.1% 3.4% 3.0% 4.9% 3.0% 3.4% 3.1% 3.2% 4.1% 4.2% 3.3%
Local Area Unemployment Statistics
LAUS EMPLOYMENT ESTIMATES (SEASONALLY ADJUSTED)
CIVILIAN NON-INSTITUTIONAL POPULATION CIVILIAN LABOR FORCE TOTAL PERCENT OF POPULATION EMPLOYMENT UNEMPLOYMENT TOTAL PERCENT OF POPULATION TOTAL RATE (%) 4,339,390 2,477,584 57.1% 2,399,623 55 .3% 77,961 3 .1%
Current month’s estimates are preliminary. All data are subject to revision. Population data are not seasonally adjusted. 17 dew.sc.gov scworkforceinfo.com
NOTE:
Unemployment Rate by
2.9% 2.7% 3.7% 3.6% 4.8% 3.4% 3.9% 4.1% 5.1% 6.7% 5.7%
County
STATE OF SOUTH CAROLINA
LOCAL
ESTIMATES BY
(NOT
MARCH 2024 FEBRUARY 2024 MARCH 2023 AREA LABOR FORCE EMPLOYMENT UNEMPLOYMENT LABOR FORCE EMPLOYMENT UNEMPLOYMENT LABOR FORCE EMPLOYMENT UNEMPLOYMENT LEVEL RATE (%) LEVEL RATE (%) LEVEL RATE (%) Abbeville County ↓ 9,664 9,287 377 3 9% 9,629 9,181 448 4.7% 9,487 9,107 380 4 0% Aiken County ↓ 75,501 72,935 2,566 3 4% 74,244 71,433 2,811 3 8% 73,176 70,729 2,447 3 3% Allendale County ↓ 2,448 2,288 160 6 5% 2,387 2,224 163 6 8% 2,401 2,255 146 6 1% Anderson County ↓ 95,744 92,790 2,954 3 1% 94,698 91,443 3,255 3 4% 93,517 90,694 2,823 3 0% Bamberg County ↑ 4,766 4,454 312 6 5% 4,697 4,395 302 6 4% 4,558 4,300 258 5.7% Barnwell County ↓ 7,765 7,346 419 5 4% 7,650 7,216 434 5.7% 7,795 7,441 354 4 5% Beaufort County ↓ 81,827 79,241 2,586 3 2% 80,750 77,812 2,938 3 6% 77,225 74,808 2,417 3 1% Berkeley County ↓ 118,051 114,589 3,462 2 9% 116,902 113,073 3,829 3 3% 114,458 111,060 3,398 3 0% Calhoun County ↓ 6,840 6,577 263 3 8% 6,731 6,466 265 3 9% 6,474 6,218 256 4 0% Charleston County ↓ 232,296 226,001 6,295 2.7% 229,832 222,984 6,848 3 0% 224,476 218,253 6,223 2 8% Cherokee County ↑ 22,979 21,886 1,093 4 8% 22,779 21,708 1,071 4.7% 23,846 22,832 1,014 4 3% Chester County ↑ 13,992 13,298 694 5 0% 13,783 13,110 673 4 9% 13,671 13,069 602 4 4% Chesterfield County ↓ 21,854 21,049 805 3.7% 21,530 20,699 831 3 9% 21,461 20,748 713 3 3% Clarendon County ↓ 12,537 12,010 527 4 2% 12,355 11,781 574 4 6% 12,044 11,473 571 4.7% Colleton County ↓ 16,705 16,150 555 3 3% 16,461 15,875 586 3 6% 15,998 15,417 581 3 6% Darlington County ↓ 31,338 30,217 1,121 3 6% 30,803 29,613 1,190 3 9% 30,340 29,198 1,142 3 8% Dillon County ↓ 13,364 12,718 646 4 8% 13,182 12,542 640 4 9% 13,088 12,358 730 5 6% Dorchester County ↓ 85,759 83,265 2,494 2 9% 84,851 82,155 2,696 3 2% 83,005 80,615 2,390 2 9% Edgefield County ↓ 10,667 10,316 351 3 3% 10,482 10,085 397 3 8% 10,221 9,863 358 3 5% Fairfield County ↓ 9,742 9,312 430 4 4% 9,616 9,161 455 4.7% 9,301 8,852 449 4 8% Florence County ↓ 69,377 67,006 2,371 3 4% 68,230 65,754 2,476 3 6% 67,301 65,092 2,209 3 3% Georgetown County ↓ 27,149 26,088 1,061 3 9% 26,542 25,414 1,128 4 2% 25,964 24,966 998 3 8% Greenville County ↓ 272,474 264,092 8,382 3 1% 269,256 260,300 8,956 3 3% 266,329 258,409 7,920 3 0% Greenwood County ↓ 30,386 29,254 1,132 3.7% 30,324 28,894 1,430 4.7% 29,844 28,637 1,207 4 0% Hampton County ↓ 8,419 8,148 271 3 2% 8,276 7,988 288 3 5% 7,945 7,705 240 3 0% Horry County ↓ 162,406 155,816 6,590 4 1% 158,791 151,576 7,215 4 5% 154,470 147,982 6,488 4 2% Jasper County ↓ 14,213 13,766 447 3 1% 14,010 13,516 494 3 5% 13,239 12,869 370 2 8% Kershaw County ↓ 31,093 30,084 1,009 3 2% 30,723 29,595 1,128 3.7% 29,612 28,620 992 3 3% Lancaster County ↓ 45,495 43,738 1,757 3 9% 44,931 43,131 1,800 4 0% 44,682 42,991 1,691 3 8% Laurens County ↓ 31,566 30,488 1,078 3 4% 31,221 30,031 1,190 3 8% 30,756 29,677 1,079 3 5% Lee County ↓ 6,725 6,411 314 4.7% 6,618 6,295 323 4 9% 6,410 6,105 305 4 8% Lexington County ↓ 159,892 155,532 4,360 2.7% 157,878 153,105 4,773 3 0% 152,736 148,429 4,307 2 8% Marion County ↓ 13,052 12,380 672 5 1% 12,798 12,128 670 5 2% 12,772 12,099 673 5 3% Marlboro County - 7,362 6,872 490 6.7% 7,267 6,777 490 6.7% 7,513 6,820 693 9 2% McCormick County ↓ 3,540 3,395 145 4 1% 3,507 3,347 160 4 6% 3,451 3,313 138 4 0% Newberry County ↓ 19,529 18,872 657 3 4% 19,273 18,581 692 3 6% 19,265 18,515 750 3 9% Oconee County ↓ 36,267 35,161 1,106 3 0% 35,854 34,604 1,250 3 5% 35,058 33,981 1,077 3 1% Orangeburg County - 34,063 32,380 1,683 4 9% 33,689 32,028 1,661 4 9% 33,143 31,474 1,669 5 0% Pickens County ↓ 60,573 58,751 1,822 3 0% 60,047 57,910 2,137 3 6% 59,350 57,429 1,921 3 2% Richland County ↓ 207,984 200,849 7,135 3 4% 205,290 197,859 7,431 3 6% 199,542 192,778 6,764 3 4% Saluda County ↓ 9,124 8,844 280 3 1% 8,962 8,650 312 3 5% 8,405 8,120 285 3 4% Spartanburg County ↓ 161,941 156,707 5,234 3 2% 160,115 154,516 5,599 3 5% 157,668 152,709 4,959 3 1% Sumter County ↓ 42,231 40,493 1,738 4 1% 41,545 39,685 1,860 4 5% 42,586 40,751 1,835 4 3% Union County ↓ 11,701 11,206 495 4 2% 11,549 11,051 498 4 3% 11,470 10,907 563 4 9% Williamsburg County - 10,427 9,830 597 5.7% 10,247 9,659 588 5.7% 10,652 10,083 569 5 3% York County ↓ 154,138 149,108 5,030 3 3% 152,347 147,120 5,227 3 4% 151,849 146,973 4,876 3 2% Current
preliminary. All data
subject to revision. ↑ Unemployment Rate Up Substate
are not seasonally adjusted and may diverge from state-level figures. ↓ Unemployment Rate Down Unemployment Rate = 18 SC Department of Employment and Workforce Labor Market Information Division Columbia, South Carolina 29202
AREA UNEMPLOYMENT
COUNTY
SEASONALLY ADJUSTED)
month's estimates are
are
estimates
LOCAL AREA UNEMPLOYMENT ESTIMATES BY MSA
STATISTICAL AREA
LOCAL AREA UNEMPLOYMENT ESTIMATES BY MUNICIPALITY
Current month’s estimates are preliminary All data are subject to revision Substate estimates are not seasonally adjusted and may diverge
(NOT
MARCH 2024 FEBRUARY 2024 MARCH 2023 METROPOLITAN
LABOR FORCE EMPLOYMENT UNEMPLOYMENT LABOR FORCE EMPLOYMENT UNEMPLOYMENT LABOR FORCE EMPLOYMENT UNEMPLOYMENT LEVEL RATE (%) LEVEL RATE (%) LEVEL RATE (%) Charleston-North Charleston ↓ 436,106 423,855 12,251 2 8% 431,585 418,212 13,373 3 1% 421,939 409,928 12,011 2 8% Columbia ↓ 424,675 411,198 13,477 3 2% 419,200 404,836 14,364 3 4% 406,070 393,017 13,053 3 2% Florence ↓ 100,715 97,223 3,492 3 5% 99,033 95,367 3,666 3.7% 97,641 94,290 3,351 3 4% GreenvilleAnderson-Mauldin ↓ 460,357 446,121 14,236 3 1% 455,222 439,684 15,538 3 4% 449,952 436,209 13,743 3 1% Hilton Head IslandBluffton-Beaufort ↓ 96,040 93,007 3,033 3 2% 94,760 91,328 3,432 3 6% 90,464 87,677 2,787 3 1% Myrtle BeachConway-North Myrtle Beach ↓ 222,407 213,213 9,194 4 1% 217,805 207,732 10,073 4 6% 212,203 203,125 9,078 4 3% Spartanburg ↓ 173,642 167,913 5,729 3 3% 171,664 165,567 6,097 3 6% 169,138 163,616 5,522 3 3% Sumter ↓ 42,231 40,493 1,738 4 1% 41,545 39,685 1,860 4 5% 42,586 40,751 1,835 4 3% Augusta-Richmond County, GA (SC portion) ↓ 86,168 83,251 2,917 3 4% 84,726 81,518 3,208 3 8% 83,397 80,592 2,805 3 4% Charlotte-Concord-Gastonia, NC (SC portion) ↓ 213,625 206,144 7,481 3 5% 211,061 203,361 7,700 3 6% 210,202 203,033 7,169 3 4%
SEASONALLY ADJUSTED)
MARCH 2024 FEBRUARY 2024 MARCH 2023 CITIES AND TOWNS ABOVE 25,000 POPULATION LABOR FORCE EMPLOYMENT UNEMPLOYMENT LABOR FORCE EMPLOYMENT UNEMPLOYMENT LABOR FORCE EMPLOYMENT UNEMPLOYMENT LEVEL RATE (%) LEVEL RATE (%) LEVEL RATE (%) Aiken ↓ 13,235 12,758 477 3 6% 13,008 12,495 513 3 9% 12,867 12,372 495 3 8% Anderson ↓ 12,095 11,658 437 3 6% 11,980 11,489 491 4 1% 11,804 11,395 409 3 5% Bluffton ↓ 13,918 13,520 398 2 9% 13,709 13,276 433 3 2% 13,118 12,764 354 2.7% Charleston ↓ 81,964 79,724 2,240 2.7% 81,106 78,660 2,446 3 0% 79,376 77,009 2,367 3 0% Columbia ↓ 60,193 57,954 2,239 3.7% 59,517 57,091 2,426 4 1% 57,831 55,623 2,208 3 8% Conway ↓ 10,979 10,524 455 4 1% 10,766 10,238 528 4 9% 10,500 9,995 505 4 8% Florence ↓ 20,395 19,703 692 3 4% 20,072 19,335 737 3.7% 19,821 19,141 680 3 4% Fort Mill ↓ 13,865 13,443 422 3 0% 13,698 13,263 435 3 2% 13,603 13,250 353 2 6% Goose Creek ↓ 22,358 21,711 647 2 9% 22,163 21,424 739 3 3% 21,705 21,043 662 3 0% Greenville ↓ 39,064 37,814 1,250 3 2% 38,577 37,271 1,306 3 4% 38,233 37,001 1,232 3 2% Greer - 19,229 18,631 598 3 1% 18,955 18,366 589 3 1% 18,776 18,213 563 3 0% Hilton Head Island ↓ 18,356 17,826 530 2 9% 18,102 17,504 598 3 3% 17,334 16,829 505 2 9% Mauldin ↓ 14,465 14,031 434 3 0% 14,278 13,829 449 3 1% 14,144 13,729 415 2 9% Mount Pleasant ↓ 54,908 53,539 1,369 2 5% 54,264 52,824 1,440 2.7% 52,991 51,703 1,288 2 4% Myrtle Beach ↓ 16,921 16,175 746 4 4% 16,589 15,735 854 5 1% 16,093 15,362 731 4 5% North Augusta ↓ 11,114 10,779 335 3 0% 10,922 10,557 365 3 3% - - -North Charleston ↓ 61,199 59,443 1,756 2 9% 60,567 58,649 1,918 3 2% 59,197 57,439 1,758 3 0% Rock Hill ↓ 41,764 40,212 1,552 3.7% 41,229 39,676 1,553 3 8% 41,116 39,636 1,480 3 6% Simpsonville ↓ 14,382 13,943 439 3 1% 14,216 13,743 473 3 3% - - -Spartanburg ↓ 17,334 16,637 697 4 0% 17,136 16,404 732 4 3% 16,920 16,212 708 4 2% Summerville ↓ 27,543 26,726 817 3 0% 27,235 26,370 865 3 2% 26,719 25,876 843 3 2% Sumter ↓ 15,136 14,419 717 4.7% 14,867 14,131 736 5 0% 15,228 14,511 717 4.7%
(NOT SEASONALLY ADJUSTED)
state-level
19 dew.sc.gov scworkforceinfo.com
from
figures.
Monthly Unemployment since January 2020 UNEMPLOYMENT MONTH 0 25,000 50,000 75,000 100,000 125,000 150,000 175,000 200,000 225,000 250,000 275,000 300,000 UNEMPLOYMENT RATE (PERCENT) Monthly Unemployment Rate since January 2020 MONTH 0 0 2 0 4 0 6.0 8 0 10 0 12 0 14.0 20 SC Department of Employment and Workforce Labor Market Information Division Columbia, South Carolina 29202
1,800,000 1,900,000 2,000,000 2,100,000 2,200,000 2,300,000 2,400,000 2,500,000
Monthly Employment since January 2020
LABOR FORCE PARTICIPATION RATE (PERCENT) MONTH Monthly
56.4 56 6 56 8 57.0 57 2 57 4 57.6 57 8 58 0 58.2 EMPLOYMENT
MONTH
21 dew.sc.gov scworkforceinfo.com
Labor Force Participation Rate since January 2020
CURRENT EMPLOYMENT STATISTICS
Seasonally Adjusted — Year-Over-Year Change
NONFARM PAYROLL BY METROPOLITAN STATISTICAL AREA SEASONALLY ADJUSTED MARCH 2024 FEBRUARY 2024 TO MARCH 2024 MARCH 2023 TO MARCH 2024 AREA MARCH 2024 FEBRUARY 2024 MARCH 2023 # CHANGE % CHANGE # CHANGE % CHANGE Statewide 2,358,400 2,351,200 2,293,200 +7,200 +0.3% +65,200 +2.8% Charleston-North Charleston 424,600 424,300 409,000 +300 +0 .1% +15,600 +3 8% Columbia 433,800 431,800 421,500 +2,000 +0 5% +12,300 +2 9% Florence 97,500 97,000 95,300 +500 +0 5% +2,200 +2 3% Greenville-Anderson-Mauldin 465,900 464,500 457,900 +1,400 +0 3% +8,000 +1.7% Hilton Head Island-Bluffton-Beaufort 91,200 90,900 88,000 +300 +0 3% +3,200 +3 6% Myrtle Beach-Conway-North Myrtle Beach 198,700 198,500 191,200 +200 +0 1% +7,500 +3 9% Spartanburg 174,300 173,800 169,800 +500 +0 3% +4,500 +2.7% Sumter 38,800 38,600 37,700 +200 +0 5% +1,100 +2 9% NOTE: Employment estimates have been rounded to the nearest hundred. Sum of detail may not equal totals due to rounding or the exclusion of certain industries from publication. All data are subject to revision. 22 SC Department of Employment and Workforce Labor Market Information Division Columbia, South Carolina 29202
+1.7% +2.7% +2.9% +2.9% +2.3% +3.9% +3.8% +3.6%
FEBRUARY 2024 TO MARCH 2024 MARCH 2023 TO MARCH 2024 MARCH 2024 FEBRUARY 2024 MARCH 2023 # CHANGE % CHANGE # CHANGE % CHANGE Total Nonfarm 2,358.4 2,351.2 2,293.2 +7.2 +0.3% +65.2 +2.8% Total Private 1,980 8 1,974.1 1,921 5 +6.7 +0 3% +59 3 +3 1% Goods Producing 385 3 385 9 378.5 -0 6 -0 2% +6 8 +1 8% Mining, Logging and Construction 119 4 120 0 115.7 -0 6 -0 5% +3.7 +3 2% Mining and Logging 4 5 4 5 4 4 0 0 0 0% +0 1 +2 3% Construction 114 9 115 5 111 3 -0 6 -0 5% +3 6 +3 2% Manufacturing 265 9 265 9 262 8 0 0 0 0% +3 1 +1 2% Durable Goods 162 5 162 0 159 1 +0 5 +0 3% +3 4 +2 1% Non-Durable Goods 103 4 103 9 103.7 -0 5 -0 5% -0 3 -0 3% Service-Providing 1,973.1 1,965 3 1,914.7 +7.8 +0 4% +58 4 +3 1% Private Service Providing 1,595 5 1,588 2 1,543 0 +7.3 +0 5% +52 5 +3 4% Trade, Transportation, and Utilities 447.1 446 2 440 1 +0 9 +0 2% +7.0 +1 6% Wholesale Trade 85 1 84 5 81 6 +0 6 +0.7% +3 5 +4 3% Retail Trade 266.7 267.2 264 6 -0 5 -0 2% +2 1 +0 8% Transportation, Warehousing, and Utilities 95 3 94 5 93 9 +0 8 +0 8% +1 4 +1 5% Information 29 0 28 8 29 5 +0 2 +0.7% -0 5 -1.7% Financial Activities 123 8 123 5 121 0 +0 3 +0 2% +2 8 +2 3% Finance and Insurance 87.9 87.8 86 6 +0 1 +0 1% +1 3 +1 5% Real Estate and Rental and Leasing 35 9 35.7 34 4 +0 2 +0 6% +1 5 +4 4% Professional and Business Services 317.4 315 4 311 2 +2 0 +0 6% +6 2 +2 0% Professional, Scientific, and Technical Services 132 5 132 4 126 9 +0 1 +0 1% +5 6 +4 4% Management of Companies and Enterprises 24 8 24 8 23 6 0 0 0 0% +1 2 +5 1% Administrative and Support and Waste Management and Remediation Services 160 1 158 2 160.7 +1 9 +1 2% -0 6 -0 4% Education and Health Services 295 4 293 8 276.8 +1 6 +0 5% +18 6 +6.7% Educational Services 49 4 48 9 47.0 +0 5 +1 0% +2 4 +5 1% Health Care Services 246 0 244 9 229 8 +1 1 +0 4% +16 2 +7.0% Leisure and Hospitality 293 0 290.7 278.5 +2 3 +0 8% +14 5 +5 2% Arts, Entertainment, and Recreation 38 8 38 2 35 5 +0 6 +1 6% +3 3 +9 3% Accommodation and Food Services 254 2 252 5 243 0 +1.7 +0.7% +11 2 +4 6% Other Services 89 8 89 8 85 9 0 0 0 0% +3 9 +4 5% Government 377.6 377.1 371.7 +0 5 +0 1% +5 9 +1 6% Federal Government 37.6 37.3 36 4 +0 3 +0 8% +1 2 +3 3% State Government 108 3 108 3 108 9 0 0 0 0% -0 6 -0 6% Local Government 231.7 231 5 226 4 +0 2 +0 1% +5 3 +2 3% 23 dew.sc.gov scworkforceinfo.com
NONFARM PAYROLL BY ECONOMIC SECTOR SEASONALLY ADJUSTED (IN THOUSANDS) MARCH 2024
CURRENT EMPLOYMENT STATISTICS
Not Seasonally Adjusted — Year-Over-Year Change
NONFARM PAYROLL BY METROPOLITAN STATISTICAL AREA NOT SEASONALLY ADJUSTED MARCH 2024 FEBRUARY 2024 TO MARCH 2024 MARCH 2023 TO MARCH 2024 AREA MARCH 2024 FEBRUARY 2024 MARCH 2023 # CHANGE % CHANGE # CHANGE % CHANGE Statewide 2,351,800 2,337,400 2,284,000 +14,400 +0.6% +67,800 +3.0% Charleston-North Charleston 423,000 421,500 406,200 +1,500 +0 4% +16,800 +4 1% Columbia 432,700 430,300 420,800 +2,400 +0 6% +11,900 +2 8% Florence 97,100 96,300 95,400 +800 +0 8% +1,700 +1 8% Greenville-Anderson-Mauldin 465,600 463,200 458,000 +2,400 +0 5% +7,600 +1.7% Hilton Head Island-Bluffton-Beaufort 90,200 89,400 86,900 +800 +0 9% +3,300 +3 8% Myrtle Beach-Conway-North Myrtle Beach 195,900 192,100 188,300 +3,800 +2 0% +7,600 +4 0% Spartanburg 174,200 173,400 170,000 +800 +0 5% +4,200 +2 5% Sumter 38,800 38,400 37,700 +400 +1 0% +1,100 +2 9% NOTE: Employment estimates have been rounded to the nearest hundred. Sum of detail may not equal totals due to rounding or the exclusion of certain industries from publication. All data are subject to revision. 24 SC Department of Employment and Workforce Labor Market Information Division Columbia, South Carolina 29202
+1.7% +2.5% +2.8% +2.9% +1.8% +4.0% +4.1% +3.8%
PAYROLL BY ECONOMIC SECTOR NOT SEASONALLY ADJUSTED MARCH 2024 FEBRUARY 2024 TO MARCH 2024 MARCH 2023 TO MARCH 2024 MARCH 2024 FEBRUARY 2024 MARCH 2023 # CHANGE % CHANGE # CHANGE % CHANGE Total Nonfarm 2,351,800 2,337,400 2,284,000 +14,400 +0.6% +67,800 +3.0% Total Private 1,969,600 1,957,000 1,909,700 +12,600 +0 6% +59,900 +3 1% Goods Producing 385,100 385,900 378,300 -800 -0 2% +6,800 +1 8% Mining, Logging and Construction 119,200 120,000 114,900 -800 -0.7% +4,300 +3.7% Mining and Logging 4,500 4,500 4,400 0 0 0% +100 +2 3% Construction 114,700 115,500 110,500 -800 -0.7% +4,200 +3 8% Construction of Buildings 28,400 28,500 26,800 -100 -0 4% +1,600 +6 0% Heavy and Civil Engineering Construction 17,700 17,800 17,100 -100 -0 6% +600 +3 5% Specialty Trade Contractors 68,600 69,200 66,600 -600 -0 9% +2,000 +3 0% Manufacturing 265,900 265,900 263,400 0 0 0% +2,500 +0 9% Durable Goods 162,400 161,700 159,400 +700 +0 4% +3,000 +1 9% Fabricated Metal Product Manufacturing 24,700 24,500 24,200 +200 +0 8% +500 +2 1% Transportation Equipment Manufacturing 52,900 52,600 51,300 +300 +0 6% +1,600 +3 1% Non-Durable Goods 103,500 104,200 104,000 -700 -0.7% -500 -0 5% Textile Mills 11,500 11,500 11,800 0 0 0% -300 -2 5% Plastics and Rubber Products Manufacturing 26,500 26,500 25,800 0 0 0% +700 +2.7% Service-Providing 1,966,700 1,951,500 1,905,700 +15,200 +0 8% +61,000 +3 2% Private Service Providing 1,584,500 1,571,100 1,531,400 +13,400 +0 9% +53,100 +3 5% Trade, Transportation, and Utilities 445,400 442,800 436,900 +2,600 +0 6% +8,500 +1 9% Wholesale Trade 84,500 83,100 81,500 +1,400 +1.7% +3,000 +3.7% Merchant Wholesalers, Durable Goods 45,000 44,100 43,100 +900 +2 0% +1,900 +4 4% Merchant Wholesalers, Nondurable Goods 24,000 23,600 23,400 +400 +1.7% +600 +2 6% Retail Trade 265,700 265,400 262,200 +300 +0 1% +3,500 +1 3% Motor Vehicle and Parts Dealers 34,400 34,500 33,900 -100 -0 3% +500 +1 5% Food and Beverage Stores 54,200 54,500 52,600 -300 -0 6% +1,600 +3 0% Health and Personal Care Stores 15,600 15,800 16,100 -200 -1 3% -500 -3 1% Clothing and Clothing Accessories Stores 17,700 17,700 17,400 0 0 0% +300 +1.7% General Merchandise Stores 60,700 60,300 59,600 +400 +0.7% +1,100 +1 8% Transportation, Warehousing, and Utilities 95,200 94,300 93,200 +900 +1 0% +2,000 +2 1% Utilities 11,400 11,300 11,200 +100 +0 9% +200 +1 8% Transportation and Warehousing 83,800 83,000 82,000 +800 +1 0% +1,800 +2 2% Information 29,100 28,400 29,300 +700 +2 5% -200 -0.7% Financial Activities 122,300 122,600 120,000 -300 -0 2% +2,300 +1 9% Finance and Insurance 87,300 87,900 86,400 -600 -0.7% +900 +1 0% Credit Intermediation and Related Activities including Monetary Authorities 36,600 36,900 37,500 -300 -0 8% -900 -2 4% Real Estate and Rental and Leasing 35,000 34,700 33,600 +300 +0 9% +1,400 +4 2% Professional and Business Services 316,500 316,500 309,100 0 0 0% +7,400 +2 4% Professional, Scientific, and Technical Services 132,400 133,700 127,200 -1,300 -1 0% +5,200 +4 1% Architectural, Engineering, and Related Services 23,600 23,700 23,200 -100 -0 4% +400 +1.7% Management of Companies and Enterprises 24,800 24,700 23,400 +100 +0 4% +1,400 +6 0% Administrative and Support and Waste Management and Remediation Services 159,300 158,100 158,500 +1,200 +0 8% +800 +0 5% Administrative and Support Services 147,100 145,600 146,200 +1,500 +1 0% +900 +0 6% Employment Services 69,100 69,000 68,300 +100 +0 1% +800 +1 2% Services to Buildings and Dwellings 34,900 34,800 34,400 +100 +0 3% +500 +1 5% Education and Health Services 296,000 295,100 277,000 +900 +0 3% +19,000 +6 9% Educational Services 51,500 51,000 47,900 +500 +1 0% +3,600 +7.5% Health Care and Social Assistance 244,500 244,100 229,100 +400 +0 2% +15,400 +6.7% Ambulatory Health Care Services 116,900 116,900 108,900 0 0 0% +8,000 +7.3% Hospitals 42,100 42,100 39,300 0 0 0% +2,800 +7.1% Nursing and Residential Care Facilities 42,900 42,800 40,700 +100 +0 2% +2,200 +5 4% Leisure and Hospitality 286,100 276,100 273,300 +10,000 +3 6% +12,800 +4.7% Arts, Entertainment, and Recreation 37,700 35,800 33,700 +1,900 +5 3% +4,000 +11 9% Amusement, Gambling, and Recreation Industries 29,700 28,600 26,500 +1,100 +3 8% +3,200 +12 1% Accommodation and Food Services 248,400 240,300 239,600 +8,100 +3 4% +8,800 +3.7% Accommodation 32,400 31,100 32,100 +1,300 +4 2% +300 +0 9% Food Services and Drinking Places 216,000 209,200 207,500 +6,800 +3 3% +8,500 +4 1% Other Services 89,100 89,600 85,800 -500 -0 6% +3,300 +3 8% Repair and Maintenance 25,800 25,900 24,700 -100 -0 4% +1,100 +4 5% Personal and Laundry Services 20,700 20,900 20,500 -200 -1 0% +200 +1 0% Government 382,200 380,400 374,300 +1,800 +0 5% +7,900 +2 1% Federal Government 37,500 37,300 36,200 +200 +0 5% +1,300 +3 6% State Government 111,600 111,200 110,700 +400 +0 4% +900 +0 8% State Government Educational Services 51,000 50,900 53,100 +100 +0 2% -2,100 -4 0% State Government Excluding Education 60,600 60,300 57,600 +300 +0 5% +3,000 +5 2% Local Government 233,100 231,900 227,400 +1,200 +0 5% +5,700 +2 5% Local Government Educational Services 113,600 113,400 110,900 +200 +0 2% +2,700 +2 4% Local Government Excluding Educational Services 119,500 118,500 116,500 +1,000 +0 8% +3,000 +2 6% 25 dew.sc.gov scworkforceinfo.com
NONFARM
AVERAGE WEEKLY EARNINGS (AWE)
AVERAGE HOURLY EARNINGS (AHE)
Current month’s estimates are preliminary. All data are subject to revision.
PRIVATE NSA STATEWIDE HOURS AND EARNINGS BY MSA
TOTAL
FEBRUARY 2024 TO MARCH 2024 MARCH 2023 TO MARCH 2024 AREA MARCH 2024 FEBRUARY 2024 MARCH 2023 # CHANGE % CHANGE # CHANGE % CHANGE Charleston-North Charleston $1,091 88 $1,091 54 $1,091 40 +$0 34 0 0% +$0 48 0 0% Columbia $1,007.87 $1,002 93 $917.62 +$4 94 +0 5% +$90 25 +9 8% Florence $769.76 $739.91 $759.53 +$29 85 +4 0% +$10 23 +1 3% Greenville-Anderson-Mauldin $1,121.78 $1,119.87 $1,139 19 +$1 91 +0 2% -$17.41 -1 5% Hilton Head Island-Bluffton-Beaufort $779.19 $754.21 $823 50 +$24 98 +3 3% -$44 31 -5 4% Myrtle Beach-Conway-North Myrtle Beach $852 41 $850 65 $843 68 +$1.76 +0 2% +$8.73 +1 0% Spartanburg $1,018 02 $967.69 $911 15 +$50 33 +5 2% +$106.87 +11.7% Sumter $916 43 $927.85 $738.54 -$11 42 -1 2% +$177.89 +24 1%
WEEKLY HOURS (AWH) FEBRUARY 2024 TO MARCH 2024 MARCH 2023 TO MARCH 2024 AREA MARCH 2024 FEBRUARY 2024 MARCH 2023 # CHANGE % CHANGE # CHANGE % CHANGE Charleston-North Charleston 33.7 33.7 34 0 0 0 0 0% -0 3 -0 9% Columbia 34 2 34 3 33 6 -0 1 -0 3% +0 6 +1 8% Florence 32.7 32 1 32 5 +0 6 +1 9% +0 2 +0 6% Greenville-Anderson-Mauldin 34 4 34 5 35.7 -0 1 -0 3% -1 3 -3 6% Hilton Head Island-Bluffton-Beaufort 29 9 29 6 30 5 +0 3 +1 0% -0 6 -2 0% Myrtle Beach-Conway-North Myrtle Beach 31.7 31 8 33 4 -0 1 -0 3% -1.7 -5 1% Spartanburg 34 3 33 8 34 5 +0 5 +1 5% -0 2 -0 6% Sumter 34.7 35 0 33 0 -0 3 -0 9% +1.7 +5 2%
AVERAGE
FEBRUARY 2024 TO MARCH 2024 MARCH 2023 TO MARCH 2024 AREA MARCH 2024 FEBRUARY 2024 MARCH 2023 # CHANGE % CHANGE # CHANGE % CHANGE Charleston-North Charleston $32 40 $32 39 $32 10 +$0 01 0 0% +$0 30 +0 9% Columbia $29.47 $29 24 $27.31 +$0 23 +0 8% +$2 16 +7.9% Florence $23 54 $23 05 $23.37 +$0 49 +2 1% +$0.17 +0.7% Greenville-Anderson-Mauldin $32 61 $32 46 $31 91 +$0 15 +0 5% +$0.70 +2 2% Hilton Head Island-Bluffton-Beaufort $26 06 $25 48 $27.00 +$0 58 +2 3% -$0 94 -3 5% Myrtle Beach-Conway-North Myrtle Beach $26 89 $26.75 $25 26 +$0 14 +0 5% +$1 63 +6 5% Spartanburg $29 68 $28 63 $26 41 +$1 05 +3.7% +$3.27 +12 4% Sumter $26 41 $26 51 $22 38 -$0 10 -0 4% +$4 03 +18 0%
26 SC Department of Employment and Workforce Labor Market Information Division Columbia, South Carolina 29202
AVERAGE WEEKLY EARNINGS (AWE)
AVERAGE WEEKLY HOURS (AWH)
NSA STATEWIDE HOURS AND EARNINGS BY INDUSTRY
FEBRUARY 2024 TO MARCH 2024 MARCH 2023 TO MARCH 2024 INDUSTRY TITLE MARCH 2024 FEBRUARY 2024 MARCH 2023 # CHANGE % CHANGE # CHANGE % CHANGE Total Private $1,030.90 $1,017.68 $1,007.06 +$13.22 +1.3% +$23.84 +2.4% Goods Producing $1,316 40 $1,294 69 $1,268 35 +$21.71 +1.7% +$48 05 +3 8% Construction $1,334 10 $1,291 45 $1,232 06 +$42 65 +3 3% +$102 04 +8 3% Manufacturing $1,331 94 $1,336 88 $1,288 63 -$4 94 -0 4% +$43 31 +3 4% Private Service Providing $960 98 $948 02 $943 24 +$12 96 +1 4% +$17.74 +1 9% Trade, Transportation, and Utilities $880 35 $843 05 $833 32 +$37.30 +4 4% +$47.03 +5 6% Financial Activities $1,217.25 $1,188 81 $1,224 45 +$28 44 +2 4% -$7.20 -0 6% Professional and Business Services $1,269 19 $1,278.80 $1,255 13 -$9 61 -0 8% +$14 06 +1 1% Education and Health Services $1,037.12 $1,039 03 $1,002 26 -$1 91 -0 2% +$34 86 +3 5% Leisure and Hospitality $473.84 $474.08 $470.36 -$0 24 -0 1% +$3 48 +0.7% Other Services $1,003 40 $998 82 $919 34 +$4 58 +0 5% +$84 06 +9 1%
FEBRUARY 2024 TO MARCH 2024 MARCH 2023 TO MARCH 2024 INDUSTRY TITLE MARCH 2024 FEBRUARY 2024 MARCH 2023 # CHANGE % CHANGE # CHANGE % CHANGE Total Private 33.9 33.9 34.5 0.0 0.0% -0.6 -1.7% Goods Producing 40 0 39 8 41 1 +0 2 +0 5% -1 1 -2.7% Construction 41 9 41 3 41 4 +0 6 +1 5% +0 5 +1 2% Manufacturing 39.7 39 8 41 0 -0 1 -0 3% -1 3 -3 2% Private Service Providing 32 4 32 4 32 9 0 0 0 0% -0 5 -1 5% Trade, Transportation, and Utilities 32 8 32 4 33 2 +0 4 +1 2% -0 4 -1 2% Financial Activities 37.5 37.8 38 3 -0 3 -0 8% -0 8 -2 1% Professional and Business Services 37.1 36 8 37.2 +0 3 +0 8% -0 1 -0 3% Education and Health Services 32 4 32 5 32.7 -0 1 -0 3% -0 3 -0 9% Leisure and Hospitality 24 2 24 2 24 9 0 0 0 0% -0.7 -2 8% Other Services 34 6 34 3 34 1 +0 3 +0 9% +0 5 +1 5%
FEBRUARY 2024 TO MARCH 2024 MARCH 2023 TO MARCH 2024 INDUSTRY TITLE MARCH 2024 FEBRUARY 2024 MARCH 2023 # CHANGE % CHANGE # CHANGE % CHANGE Total Private $30.41 $30.02 $29.19 +$0.39 +1.3% +$1.22 +4.2% Goods Producing $32 91 $32 53 $30 86 +$0 38 +1 2% +$2 05 +6 6% Construction $31 84 $31.27 $29.76 +$0.57 +1 8% +$2 08 +7.0% Manufacturing $33 55 $33 59 $31 43 -$0 04 -0 1% +$2 12 +6.7% Private Service Providing $29 66 $29 26 $28.67 +$0 40 +1 4% +$0 99 +3 5% Trade, Transportation, and Utilities $26 84 $26 02 $25 10 +$0 82 +3 2% +$1.74 +6 9% Financial Activities $32 46 $31 45 $31.97 +$1 01 +3 2% +$0 49 +1 5% Professional and Business Services $34 21 $34.75 $33.74 -$0 54 -1 6% +$0.47 +1 4% Education and Health Services $32 01 $31.97 $30 65 +$0 04 +0 1% +$1 36 +4 4% Leisure and Hospitality $19 58 $19 59 $18 89 -$0 01 -0 1% +$0 69 +3.7% Other Services $29 00 $29 12 $26 96 -$0 12 -0 4% +$2 04 +7.6% 27 dew.sc.gov scworkforceinfo.com
AVERAGE
HOURLY EARNINGS (AHE)
NONFARM PAYROLL BY ECONOMIC SECTOR
CHARLESTON-NORTH CHARLESTON MSA
MARCH 2024 (NOT SEASONALLY ADJUSTED)
Current month’s estimates are preliminary. All data are subject to revision.
FEBRUARY 2024 TO MARCH 2024 MARCH 2023 TO MARCH 2024 MARCH 2024 FEBRUARY 2024 MARCH 2023 # CHANGE % CHANGE # CHANGE % CHANGE Total Nonfarm 423,000 421,500 406,200 +1,500 +0.4% +16,800 +4.1% Total Private 351,800 351,100 338,900 +700 +0 2% +12,900 +3 8% Goods Producing 56,500 56,500 54,300 0 0 0% +2,200 +4 1% Service-Providing 366,500 365,000 351,900 +1,500 +0 4% +14,600 +4 1% Private Service Providing 295,300 294,600 284,600 +700 +0 2% +10,700 +3 8% Mining, Logging and Construction 22,600 22,800 22,100 -200 -0 9% +500 +2 3% Manufacturing 33,900 33,700 32,200 +200 +0 6% +1,700 +5 3% Trade, Transportation, and Utilities 77,700 77,300 74,700 +400 +0 5% +3,000 +4 0% Wholesale Trade 13,400 13,200 12,800 +200 +1 5% +600 +4.7% Retail Trade 44,900 44,900 42,800 0 0 .0% +2,100 +4 9% General Merchandise Stores 7,900 7,900 7,700 0 0 0% +200 +2 6% Transportation, Warehousing, and Utilities 19,400 19,200 19,100 +200 +1 0% +300 +1 6% Information 8,100 7,900 8,400 +200 +2 5% -300 -3 6% Financial Activities 21,400 21,700 20,500 -300 -1 4% +900 +4 4% Professional and Business Services 68,600 68,700 66,600 -100 -0 1% +2,000 +3 0% Administrative and Support and Waste Management 29,000 29,000 28,800 0 0 0% +200 +0.7% Education and Health Services 48,500 49,100 45,900 -600 -1 2% +2,600 +5.7% Leisure and Hospitality 53,900 52,700 52,300 +1,200 +2 3% +1,600 +3 1% Accommodation and Food Services 46,800 45,800 46,100 +1,000 +2 2% +700 +1 5% Food Services and Drinking Places 39,000 38,100 37,800 +900 +2 4% +1,200 +3 2% Other Services 17,100 17,200 16,200 -100 -0 6% +900 +5 6% Government 71,200 70,400 67,300 +800 +1 1% +3,900 +5 8% Federal Government 12,000 11,800 11,700 +200 +1.7% +300 +2 6% State Government 28,800 28,700 27,200 +100 +0 3% +1,600 +5 9% Local Government 30,400 29,900 28,400 +500 +1.7% +2,000 +7.0%
28 SC Department of Employment and Workforce Labor Market Information Division Columbia, South Carolina 29202
COLUMBIA MSA
MARCH 2024 (NOT SEASONALLY ADJUSTED)
Current month’s estimates are preliminary. All data are subject to revision.
NONFARM PAYROLL BY ECONOMIC SECTOR
FEBRUARY 2024 TO MARCH 2024 MARCH 2023 TO MARCH 2024 MARCH 2024 FEBRUARY 2024 MARCH 2023 # CHANGE % CHANGE # CHANGE % CHANGE Total Nonfarm 432,700 430,300 420,800 +2,400 +0.6% +11,900 +2.8% Total Private 347,800 345,800 337,500 +2,000 +0 6% +10,300 +3 1% Goods Producing 50,700 50,300 48,900 +400 +0 8% +1,800 +3.7% Service-Providing 382,000 380,000 371,900 +2,000 +0 5% +10,100 +2.7% Private Service Providing 297,100 295,500 288,600 +1,600 +0 5% +8,500 +2 9% Mining, Logging and Construction 18,000 17,900 17,200 +100 +0 .6% +800 +4.7% Manufacturing 32,700 32,400 31,700 +300 +0 9% +1,000 +3 2% Trade, Transportation, and Utilities 78,700 78,300 78,100 +400 +0 5% +600 +0 8% Wholesale Trade 17,300 16,900 16,400 +400 +2 4% +900 +5 5% Retail Trade 44,100 44,300 44,600 -200 -0 .5% -500 -1 1% Transportation, Warehousing, and Utilities 17,300 17,100 17,100 +200 +1 2% +200 +1 2% Information 4,900 4,800 5,000 +100 +2 1% -100 -2 0% Financial Activities 37,800 37,700 36,400 +100 +0 3% +1,400 +3 8% Credit Intermediation and Related Activities including Monetary Authorities - Central Bank 7,500 7,500 7,700 0 0 0% -200 -2 6% Professional and Business Services 56,400 56,600 56,100 -200 -0 4% +300 +0 5% Administrative and Support and Waste Management 29,800 29,900 28,900 -100 -0 3% +900 +3 1% Education and Health Services 58,800 58,300 55,100 +500 +0 .9% +3,700 +6.7% Leisure and Hospitality 42,200 41,300 40,100 +900 +2 2% +2,100 +5 2% Food Services and Drinking Places 35,400 34,600 33,700 +800 +2 3% +1,700 +5 0% Other Services 18,300 18,500 17,800 -200 -1 1% +500 +2 8% Government 84,900 84,500 83,300 +400 +0 5% +1,600 +1 9% Federal Government 12,200 12,100 11,400 +100 +0 8% +800 +7.0% State Government 36,800 36,600 35,700 +200 +0 5% +1,100 +3 1% Local Government 35,900 35,800 36,200 +100 +0 3% -300 -0 8%
29 dew.sc.gov scworkforceinfo.com
NONFARM PAYROLL BY ECONOMIC SECTOR
GREENVILLE-ANDERSON-MAULDIN MSA
MARCH 2024 (NOT SEASONALLY ADJUSTED)
Current month’s estimates are preliminary. All data are subject to revision.
FEBRUARY 2024 TO MARCH 2024 MARCH 2023 TO MARCH 2024 MARCH 2024 FEBRUARY 2024 MARCH 2023 # CHANGE % CHANGE # CHANGE % CHANGE Total Nonfarm 465,600 463,200 458,000 +2,400 +0.5% +7,600 +1.7% Total Private 403,300 401,000 394,600 +2,300 +0 6% +8,700 +2 2% Goods Producing 84,600 84,700 83,600 -100 -0 1% +1,000 +1 2% Service-Providing 381,000 378,500 374,400 +2,500 +0.7% +6,600 +1 8% Private Service Providing 318,700 316,300 311,000 +2,400 +0 8% +7,700 +2 5% Mining, Logging and Construction 22,200 22,400 21,500 -200 -0 9% +700 +3 3% Manufacturing 62,400 62,300 62,100 +100 +0 2% +300 +0 5% Trade, Transportation, and Utilities 83,900 83,500 83,000 +400 +0 5% +900 +1 1% Wholesale Trade 21,300 20,900 20,600 +400 +1 9% +700 +3 4% Retail Trade 47,700 47,800 48,000 -100 -0 .2% -300 -0 6% Transportation, Warehousing, and Utilities 14,900 14,800 14,400 +100 +0.7% +500 +3 5% Information 6,400 6,200 6,100 +200 +3 2% +300 +4 9% Financial Activities 22,300 22,500 21,700 -200 -0 9% +600 +2 8% Professional and Business Services 74,400 75,000 75,800 -600 -0 8% -1,400 -1 8% Professional, Scientific, and Technical Services 30,500 30,500 29,300 0 0 .0% +1,200 +4 .1% Management of Companies and Enterprises 6,900 6,900 6,800 0 0 .0% +100 +1 5% Administrative and Support and Waste Management 37,000 37,600 39,700 -600 -1 6% -2,700 -6 8% Education and Health Services 63,000 62,900 58,900 +100 +0 2% +4,100 +7.0% Educational Services 13,600 13,500 12,600 +100 +0.7% +1,000 +7.9% Health Care and Social Assistance 49,400 49,400 46,300 0 0 0% +3,100 +6.7% Leisure and Hospitality 52,300 49,700 49,600 +2,600 +5 2% +2,700 +5 4% Other Services 16,400 16,500 15,900 -100 -0 6% +500 +3 1% Government 62,300 62,200 63,400 +100 +0 2% -1,100 -1.7% Federal Government 3,000 3,000 3,100 0 0 0% -100 -3 2% State Government 13,800 13,800 15,300 0 0 0% -1,500 -9 8% Local Government 45,500 45,400 45,000 +100 +0 .2% +500 +1 .1%
30 SC Department of Employment and Workforce Labor Market Information Division Columbia, South Carolina 29202
BEACH MSA MARCH 2024 (NOT SEASONALLY ADJUSTED)
Current month’s estimates are preliminary. All data are subject to revision.
MYRTLE BEACH-CONWAY-NORTH
FEBRUARY
MARCH
MARCH 2024 FEBRUARY 2024 MARCH 2023 # CHANGE % CHANGE # CHANGE % CHANGE Total Nonfarm 195,900 192,100 188,300 +3,800 +2.0% +7,600 +4.0% Total Private 169,700 166,200 162,700 +3,500 +2 1% +7,000 +4 3% Goods Producing 17,900 18,000 17,500 -100 -0 .6% +400 +2 3% Service-Providing 178,000 174,100 170,800 +3,900 +2 2% +7,200 +4 2% Private Service Providing 151,800 148,200 145,200 +3,600 +2 4% +6,600 +4 5% Mining, Logging and Construction 12,400 12,500 12,100 -100 -0 8% +300 +2 5% Manufacturing 5,500 5,500 5,400 0 0 0% +100 +1 9% Trade, Transportation, and Utilities 43,400 42,900 41,100 +500 +1 2% +2,300 +5 6% Wholesale Trade 4,100 4,000 3,900 +100 +2 5% +200 +5 1% Retail Trade 34,100 33,700 32,000 +400 +1 2% +2,100 +6 6% Transportation, Warehousing, and Utilities 5,200 5,200 5,200 0 0 0% 0 0 0% Information 2,700 2,600 2,700 +100 +3 8% 0 0 0% Financial Activities 10,400 10,200 10,200 +200 +2 0% +200 +2 0% Professional and Business Services 19,800 19,900 18,700 -100 -0 5% +1,100 +5 9% Education and Health Services 22,800 22,700 21,600 +100 +0 4% +1,200 +5 6% Leisure and Hospitality 45,600 42,900 44,100 +2,700 +6 .3% +1,500 +3 4% Accommodation and Food Services 37,200 35,200 37,400 +2,000 +5.7% -200 -0 5% Food Services and Drinking Places 30,900 29,000 29,300 +1,900 +6 6% +1,600 +5 5% Other Services 7,100 7,000 6,800 +100 +1 4% +300 +4 4% Government 26,200 25,900 25,600 +300 +1 2% +600 +2 3% Federal Government 1,600 1,600 1,500 0 0 0% +100 +6.7% State Government 4,400 4,400 4,500 0 0 0% -100 -2 2% Local Government 20,200 19,900 19,600 +300 +1 .5% +600 +3 1%
NONFARM PAYROLL BY ECONOMIC SECTOR
MYRTLE
2024 TO MARCH 2024
2023 TO MARCH 2024
31 dew.sc.gov scworkforceinfo.com
NONFARM PAYROLL BY ECONOMIC SECTOR
SPARTANBURG MSA
MARCH 2024 (NOT SEASONALLY ADJUSTED)
Current month’s estimates are preliminary. All data are subject to revision.
FEBRUARY 2024 TO MARCH 2024 MARCH 2023 TO MARCH 2024 MARCH 2024 FEBRUARY 2024 MARCH 2023 # CHANGE % CHANGE # CHANGE % CHANGE Total Nonfarm 174,200 173,400 170,000 +800 +0.5% +4,200 +2.5% Total Private 145,000 144,300 142,300 +700 +0 5% +2,700 +1 9% Goods Producing 47,600 47,400 46,200 +200 +0 4% +1,400 +3 0% Service-Providing 126,600 126,000 123,800 +600 +0 5% +2,800 +2 3% Private Service Providing 97,400 96,900 96,100 +500 +0 5% +1,300 +1 4% Mining, Logging and Construction 8,200 8,100 7,400 +100 +1 .2% +800 +10 8% Manufacturing 39,400 39,300 38,800 +100 +0 3% +600 +1 5% Durable Goods 27,200 27,100 26,700 +100 +0 4% +500 +1 9% Non-Durable Goods 12,200 12,200 12,100 0 0 0% +100 +0 8% Transportation, Warehousing, and Utilities 35,900 35,700 35,900 +200 +0 6% 0 0 0% Wholesale Trade 8,300 8,100 8,200 +200 +2 5% +100 +1 2% Retail Trade 17,500 17,600 17,400 -100 -0 6% +100 +0 6% Transportation, Warehousing, and Utilities 10,100 10,000 10,300 +100 +1 0% -200 -1 9% Information 1,000 1,000 1,000 0 0 0% 0 0 0% Financial Activities 5,100 5,100 5,300 0 0 0% -200 -3 8% Professional and Business Services 16,800 17,000 17,200 -200 -1 2% -400 -2 3% Education and Health Services 17,000 16,900 16,000 +100 +0 6% +1,000 +6 3% Leisure and Hospitality 15,700 15,300 15,000 +400 +2 6% +700 +4.7% Other Services 5,900 5,900 5,700 0 0 .0% +200 +3 5% Government 29,200 29,100 27,700 +100 +0 3% +1,500 +5 4% Federal Government 700 700 700 0 0 0% 0 0 0% State Government 4,000 4,000 4,000 0 0 0% 0 0 0% Local Government 24,500 24,400 23,000 +100 +0 4% +1,500 +6 5%
32 SC Department of Employment and Workforce Labor Market Information Division Columbia, South Carolina 29202
NONFARM PAYROLL BY ECONOMIC SECTOR
MSA
MARCH 2024 (NOT SEASONALLY ADJUSTED)
2024 TO MARCH 2024
HILTON HEAD ISLAND-BLUFFTON-BEAUFORT MSA
SUMTER MSA
FLORENCE
MARCH
MARCH 2024 FEBRUARY 2024 MARCH 2023 # CHANGE % CHANGE # CHANGE % CHANGE Total Nonfarm 97,100 96,300 95,400 +800 +0.8% +1,700 +1.8% Total Private 79,100 78,300 78,000 +800 +1 0% +1,100 +1 4% Goods Producing 14,800 14,700 15,200 +100 +0.7% -400 -2 6% Service-Providing 82,300 81,600 80,200 +700 +0 9% +2,100 +2 6% Private Service Providing 64,300 63,600 62,800 +700 +1 1% +1,500 +2 4% Trade, Transportation, and Utilities 20,300 20,200 21,000 +100 +0 5% -700 -3 3% Government 18,000 18,000 17,400 0 0 0% +600 +3 4% Federal Government 700 700 700 0 0 0% 0 0 0% State Government 4,900 4,900 4,700 0 0 0% +200 +4 3% Local Government 12,400 12,400 12,000 0 0 0% +400 +3 3%
FEBRUARY
2023 TO MARCH 2024
MARCH 2024 (NOT SEASONALLY ADJUSTED) FEBRUARY 2024 TO MARCH 2024 MARCH 2023 TO MARCH 2024 MARCH 2024 FEBRUARY 2024 MARCH 2023 # CHANGE % CHANGE # CHANGE % CHANGE Total Nonfarm 90,200 89,400 86,900 +800 +0.9% +3,300 +3.8% Total Private 78,000 77,200 75,000 +800 +1 0% +3,000 +4 0% Goods Producing 8,200 8,100 7,800 +100 +1 2% +400 +5 1% Service-Providing 82,000 81,300 79,100 +700 +0 9% +2,900 +3.7% Private Service Providing 69,800 69,100 67,200 +700 +1 0% +2,600 +3 9% Government 12,200 12,200 11,900 0 0 0% +300 +2 5%
MARCH
(NOT SEASONALLY ADJUSTED) FEBRUARY 2024 TO MARCH 2024 MARCH 2023 TO MARCH 2024 MARCH 2024 FEBRUARY 2024 MARCH 2023 # CHANGE % CHANGE # CHANGE % CHANGE Total Nonfarm 38,800 38,400 37,700 +400 +1.0% +1,100 +2.9% Total Private 32,800 32,400 31,800 +400 +1 .2% +1,000 +3 1% Goods Producing 9,400 9,200 9,200 +200 +2 2% +200 +2 2% Service-Providing 29,400 29,200 28,500 +200 +0.7% +900 +3 2% Private Service Providing 23,400 23,200 22,600 +200 +0 9% +800 +3 5% Manufacturing 6,600 6,600 6,600 0 0 0% 0 0 .0% Government 6,000 6,000 5,900 0 0 0% +100 +1.7% Federal Government 1,300 1,300 1,200 0 0 0% +100 +8 3% State Government 1,300 1,300 1,400 0 0 0% -100 -7.1% Local Government 3,400 3,400 3,300 0 0 0% +100 +3 0% 33 dew.sc.gov scworkforceinfo.com
2024
LONG-RUN TRENDS
ANNUAL LOCAL AREA UNEMPLOYMENT STATISTICS DATA
1976-2023 YEAR CIVILIAN NON-INSTITUTIONAL POPULATION LABOR FORCE PARTICIPATION RATE (PERCENT) EMPLOYMENT-POPULATION RATIO (PERCENT) LABOR FORCE EMPLOYMENT UNEMPLOYMENT UNEMPLOYMENT RATE (PERCENT) 1976 2,007,417 64.7% 60 2% 1,299,241 1,207,662 91,579 7.0% 1977 2,061,250 64 4% 60 0% 1,327,423 1,237,495 89,928 6 8% 1978 2,117,667 64 1% 60 5% 1,356,921 1,281,597 75,324 5 6% 1979 2,169,417 63 4% 60 2% 1,375,201 1,306,773 68,428 5 0% 1980 2,221,250 62 8% 58 6% 1,395,675 1,301,796 93,879 6.7% 1981 2,266,583 63 2% 58 0% 1,432,219 1,314,907 117,312 8 2% 1982 2,307,333 64 2% 57.3% 1,482,373 1,322,883 159,490 10 8% 1983 2,341,083 63 2% 56 9% 1,479,137 1,333,162 145,975 9 9% 1984 2,378,500 62 9% 58 5% 1,495,188 1,391,286 103,902 6 9% 1985 2,426,500 63 8% 59 5% 1,548,924 1,443,612 105,312 6 8% 1986 2,455,333 64 9% 60.7% 1,592,306 1,491,069 101,237 6 4% 1987 2,495,333 65 4% 61 8% 1,631,897 1,542,170 89,727 5 5% 1988 2,533,000 65 6% 62 5% 1,660,533 1,583,928 76,605 4 6% 1989 2,566,000 66 0% 62 9% 1,693,438 1,615,009 78,429 4 6% 1990 2,611,843 66 5% 63 3% 1,737,831 1,652,949 84,882 4 9% 1991 2,663,759 66 3% 62 3% 1,767,123 1,659,196 107,927 6 1% 1992 2,699,745 66.7% 62 2% 1,799,677 1,678,803 120,874 6.7% 1993 2,739,480 66.7% 61 8% 1,826,650 1,693,483 133,167 7.3% 1994 2,775,049 66 4% 62 3% 1,841,428 1,727,714 113,714 6 2% 1995 2,813,952 66 2% 62 8% 1,864,221 1,768,540 95,681 5 1% 1996 2,851,104 66 2% 62 4% 1,886,064 1,779,221 106,843 5.7% 1997 2,897,839 66 3% 63 3% 1,920,244 1,834,337 85,907 4 5% 1998 2,945,825 65 9% 63 5% 1,940,846 1,870,270 70,576 3 6% 1999 2,989,560 65 5% 62 8% 1,958,598 1,877,345 81,253 4 1% 34 SC Department of Employment and Workforce Labor Market Information Division Columbia, South Carolina 29202
ANNUAL
1976-2023 YEAR CIVILIAN NON-INSTITUTIONAL POPULATION LABOR FORCE PARTICIPATION RATE (PERCENT) EMPLOYMENT-POPULATION RATIO (PERCENT) LABOR FORCE EMPLOYMENT UNEMPLOYMENT UNEMPLOYMENT RATE (PERCENT) 2000 3,027,367 64 9% 62 5% 1,965,481 1,892,559 72,922 3.7% 2001 3,064,191 63 4% 60 0% 1,941,956 1,839,246 102,710 5 3% 2002 3,098,739 63 1% 59 0% 1,954,548 1,828,735 125,813 6 4% 2003 3,133,915 63 8% 59 2% 1,999,485 1,855,599 143,886 7.2% 2004 3,178,645 64 3% 59 5% 2,043,864 1,891,722 152,142 7.4% 2005 3,234,049 64 0% 59 4% 2,071,111 1,919,644 151,467 7.3% 2006 3,305,437 65 0% 60 5% 2,148,698 2,001,245 147,453 6 9% 2007 3,374,548 63 9% 60 0% 2,155,198 2,024,493 130,705 6 1% 2008 3,439,974 62 8% 58 2% 2,160,084 2,002,903 157,181 7.3% 2009 3,490,448 62 1% 55 0% 2,166,737 1,919,307 247,430 11 4% 2010 3,564,619 61 0% 54 1% 2,174,535 1,928,442 246,093 11 3% 2011 3,612,048 60 5% 54 2% 2,185,171 1,957,493 227,678 10 4% 2012 3,655,515 59 9% 54 5% 2,190,203 1,992,957 197,246 9 0% 2013 3,704,281 59 3% 54 9% 2,197,876 2,034,404 163,472 7.4% 2014 3,759,002 59 1% 55 4% 2,222,426 2,082,941 139,485 6 3% 2015 3,822,409 59 3% 55 8% 2,267,837 2,134,087 133,750 5 9% 2016 3,888,005 58 8% 55 9% 2,286,054 2,174,301 111,753 4 9% 2017 3,897,645 58 0% 55 6% 2,261,766 2,166,708 95,058 4 2% 2018 3,948,448 57.8% 55 9% 2,282,022 2,205,356 76,666 3 4% 2019 4,002,601 58 3% 56.7% 2,333,533 2,268,884 64,649 2 8% 2020 4,050,504 57.7% 54 3% 2,339,140 2,199,751 139,389 6 0% 2021 4,109,008 57.4% 55 2% 2,359,169 2,266,611 92,558 3 9% 2022 4,188,402 57.1% 55 3% 2,393,329 2,316,435 76,894 3 2% 2023 4,274,977 57.4% 55.7% 2,453,060 2,380,392 72,668 3 0% 35 dew.sc.gov scworkforceinfo.com
LOCAL AREA UNEMPLOYMENT STATISTICS DATA
LONG-RUN TRENDS
ANNUAL
1939-2023 YEAR EMPLOYMENT YEAR EMPLOYMENT YEAR EMPLOYMENT YEAR EMPLOYMENT 1939 310,100 1961 587,000 1983 1,189,000 2005 1,862,900 1940 328,600 1962 609,800 1984 1,262,500 2006 1,905,700 1941 387,500 1963 630,600 1985 1,296,200 2007 1,945,000 1942 416,500 1964 651,500 1986 1,338,000 2008 1,926,300 1943 428,500 1965 686,000 1987 1,392,200 2009 1,814,400 1944 408,600 1966 734,900 1988 1,449,000 2010 1,811,300 1945 396,000 1967 754,500 1989 1,499,700 2011 1,832,500 1946 411,600 1968 782,900 1990 1,527,600 2012 1,864,300 1947 436,200 1969 819,800 1991 1,497,300 2013 1,901,000 1948 456,400 1970 842,000 1992 1,511,800 2014 1,951,300 1949 443,100 1971 862,600 1993 1,553,000 2015 2,006,700 1950 461,400 1972 920,300 1994 1,592,000 2016 2,055,300 1951 505,800 1973 984,000 1995 1,636,300 2017 2,096,100 1952 544,300 1974 1,015,800 1996 1,669,400 2018 2,154,800 1953 543,900 1975 982,600 1997 1,718,800 2019 2,189,600 1954 519,700 1976 1,038,100 1998 1,779,800 2020 2,082,300 1955 533,000 1977 1,081,700 1999 1,826,300 2021 2,154,000 1956 542,900 1978 1,137,500 2000 1,854,000 2022 2,242,900 1957 545,000 1979 1,176,000 2001 1,814,800 2023 2,305,800 1958 545,900 1980 1,188,800 2002 1,795,400 1959 566,900 1981 1,196,500 2003 1,799,100 1960 582,500 1982 1,162,300 2004 1,826,600 36 SC Department of Employment and Workforce Labor Market Information Division Columbia, South Carolina 29202
CURRENT EMPLOYMENT STATISTICS NONFARM PAYROLL
ANNUAL CURRENT EMPLOYMENT STATISTICS NONFARM PAYROLL 2007-2023 AVERAGE WEEKLY EARNINGS AVERAGE WEEKLY HOURS AVERAGE HOURLY EARNINGS 2007 $675.36 36 0 $18.76 2008 $669 .28 35 .6 $18 .80 2009 $665 55 34.7 $19 18 2010 $692.17 34 8 $19 89 2011 $716.18 34 .8 $20 58 2012 $705.16 35 1 $20 09 2013 $716.15 34 9 $20 52 2014 $726.23 34 5 $21 05 2015 $743.27 34.7 $21 42 2016 $762.80 34 .5 $22 11 2017 $791.99 34 6 $22 89 2018 $829 36 34 6 $23.97 2019 $852 84 34 5 $24.72 2020 $888 31 34 1 $26 05 2021 $925 41 34 3 $26 98 2022 $972.90 34 5 $28 20 2023 $1,014 59 34 3 $29 58 37 dew.sc.gov scworkforceinfo.com
Technical Notes
1 . Household Survey: Nationally, there is a monthly Current Population Survey of about 60,000 households conducted by the Census Bureau for the Bureau of Labor Statistics (BLS) to determine employment status of the civilian population. This information, along with other inputs, is used by DEW to operate the Local Area Unemployment Statistics program, which estimates the number of individuals employed and those not employed, but actively seeking employment for statewide and a variety of sub-state geographies.
2 Employer Survey: BLS conducts a monthly Current Employment Statistics survey of about 44,000 employers which yields national estimates of nonagricultural wage and salary employment, hours, and earnings by industry This data is processed by DEW to generate comparable data for the state and its metropolitan statistical areas
3 . Seasonally Adjusted: Seasonal adjustment removes the effects of events that follow a regular pattern each year (i.e. tourist-related hiring and school closings in the summer) These adjustments make it easier to observe the cyclical and other nonseasonal movements in data over time
4 . Not Seasonally Adjusted: Effects of regular or seasonal patterns have not been removed from this data.
CURRENT EMPLOYMENT STATISTICS (CES)
Data is published by Industry
Utilizes an Establishment Survey
Reference week is the Pay Period that includes the 12th of the month
A job held by a person on unpaid leave during the reference week is not counted since they are not receiving pay
Does not count selfemployed workers
Does not include agricultural workers
Does not count unpaid family workers
Workers on strike during the entire reference period are not counted
Data is published by County
The Current Population Survey (CPS), which is a Household Survey, is used to calculate LAUS
Reference week is the Calendar Week that includes the 12th of the month
A person on unpaid leave is counted as employed because they will return to their job
Does count self-employed workers
Includes both agricultural and non-agricultural workers
Counts unpaid family workers if they worked at least 15 unpaid hours for a family business or family farm during the reference week
Workers on strike during the reference week are counted as employed in LAUS
LOCAL AREA UNEMPLOYMENT STATISTICS
(LAUS)
Counts Jobs
Counts People
38 SC Department of Employment and Workforce Labor Market Information Division Columbia, South Carolina 29202

Do you need some help finding the data you need? Have a great idea for a research project you’d like to discuss with someone? We love to collaborate!
DATA TRENDS is prepared by the LMI Division of the S.C. Department of Employment and Workforce with funding provided by the US Department of Labor. Featured data is prepared in conjunction with the Bureau of Labor Statistics and current month estimates are always preliminary, with all previous data subject to revision
Interested in staying up to date with Trends as it’s released? Subscribe by clicking here!
40 dew.sc.gov scworkforceinfo.com SC Department of Employment and Workforce Labor Market Information Division Columbia, South Carolina 29202 Find more information at scworkforceinfo.com
