


By Shane Bell, Workforce Insights Analyst

Did you know that the Charleston metro area had the fastest employment growth in the country over the past year? Read more about the numbers on page 24
A new feature on the DEW website is the Explore SC@Work page. One of the goals of the new Unified State Plan (USP) for Education and Workforce Development is to increase awareness about various career opportunities to students, parents, counselors, jobseekers, and other stakeholders To that end, Explore SC@Work is here to try and make the experience of finding a new career feel less overwhelming. At a glance, visitors can learn about opportunities, find out how much they pay, and what education or experience is required. What’s more, there’s a spotlight on jobs that were identified as Priority Occupations in the USP. Find out whether you have what it takes to be an accountant, pharmacist, or bird supervisor .
Last month, my team finalized our federally required statewide long-term employment projections. These data offer our best guess at how many people will be employed in each industry and occupation in the year 2032 Obviously, we don’t have a crystal ball, but we use data from BLS, tools provided by the Projections Managing Partnership, and our knowledge of South Carolina’s economy to offer this analysis to employers, jobseekers, and the public . Naturally, these projections come with a lot of assumptions; in plain English, they are based on the premise that current economic conditions will persist, since we have no idea – for example – whether there will be a recession in 2032, or what artificial intelligence will look like by then. Shane Bell from the LMI team gives us a deep dive into the data in this issue’s featured article
As always, we are ready to answer whatever questions you have about South Carolina’s workforce. Just shoot us a line at lmicustomerservice@dew.sc.gov


Bryan P Grady, Ph D Assistant Executive Director for Labor Market Information SC Department of Employment and Workforce

By Shane Bell, Workforce Insights Analyst
The DEW Labor Market Information Division (LMI) completes statewide ten-year industry and occupational employment projections every other July This data is represented in a 10-year forecast, and this year’s edition covers 2022 through 2032 These estimates, generated from historical employment trends and rigorous statistical models, are required by LMI’s Workforce Information Grant.
The industry group analysis projects employment based on supersector categories within the North American Industry Classification System (NAICS) Overall, Exhibit 1 shows the state is expected to support more than 2 6 million jobs by 2032, fed by a ten-year increase of almost 262,000 jobs (11.1 percent). This equates to an annual growth rate of 1.1 percent.
Education and Health Services is the largest supersector, followed by Trade, Transportation and Utilities; and Professional and Business Services These top three supersectors combined will generate more than 164,000 net new jobs by 2032, and all three are expected to grow approximately 14 percent over the period None of the supersectors are projected to contract by 2032, although Natural Resources and Mining has a generally flat trajectory, with total growth of less than half a percentage point. The fastest growing supersectors over the period – those with the steepest annual growth rate – include Financial Activities (1.45 percent), Information (1.37 percent), and Professional and Business Services (1 36 percent)
Exhibit 2 shows the employment projections ranked from greatest to least percent change at the sector level, giving a slightly more granular look at the industrial activity Note that self-employed workers are not included in this sector level table The top three by proportion of growth include Management of Companies and Enterprises (39.1 percent), Transportation and Warehousing (28.9 percent), and Health Care and Social Assistance (17.4 percent). Ranked by numeric change, the leading sectors for the period are Health Care and Social Assistance (a net gain of 46,674 jobs), Retail Trade (29,063
and Transportation (24,044
Moving down another increment of granularity, the Exhibit 3 shows the projected change in employment by industry subsector The largest changes are expected within Web Search Portals, Libraries, Archives, and Other Information Services (+108 8 percent); Warehousing and Storage (+70.0 percent); and Broadcasting and Content Providers (+49.3 percent). This explosive increase in Web Search Portals, Libraries, Archives, and Other Information Services is likely a function of the subsector maturing within the state and growing rapidly from a small initial employment figure. Establishments within this subsector provide data search, storage, and retrieval services.
Occupational projections apply to what the workers are doing, regardless of industry Exhibit 4 below represents the occupational employment projections by category of job, ranked in order from greatest to least numeric change
OCCUPATION CATEGORY
Notably, the only occupational group projected to decline in jobs also has the smallest overall total: Farming, Fishing and Forestry Occupations This group is expected to contract 3 4 percent, losing 328 net jobs
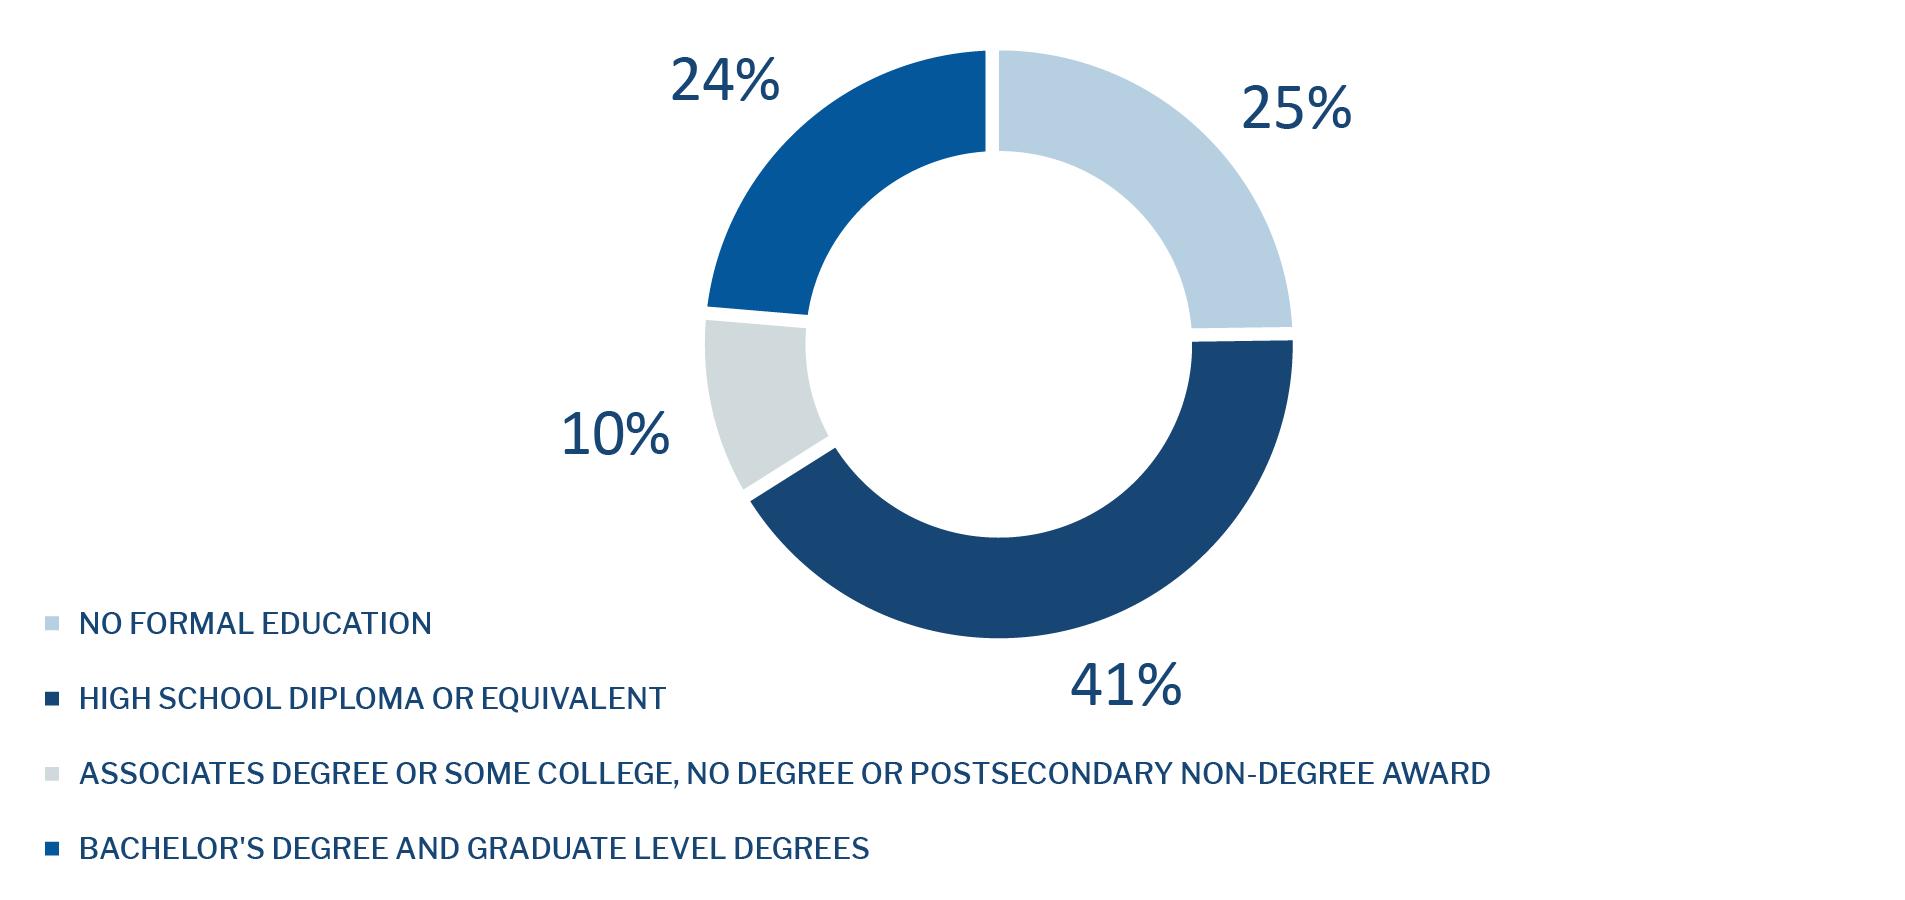
The projected job openings can also be analyzed based on the education required to obtain them. Exhibit 5, which follows, illustrates that analysis across four qualifying educational levels. A plurality of the openings (41 percent) will require only a high school diploma or equivalent. Jobs requiring a bachelor’s degree or graduate level degree, including master’s degrees and doctoral or professional degrees, make up 24 percent of all projected openings. Approximately 75 percent of the projected job openings in the state by 2032 will require some level of formal education.
The long-term projections emphasize the significant growth within the economy and the job market of South Carolina. The net employment figure of 2,614,627 represents a substantial 11 percent jump, which hints at the enormous scale of the opportunities and challenges facing the many surging industries within the state Well-informed stakeholders can make use of these projections in the development of business proposals, workforce development strategies, new academic and training curriculum, and other efforts that rely on an understanding of the upcoming labor market .
Nationally, there is a monthly Current Population Survey of about 60,000 households conducted by the Census Bureau for the Bureau of Labor Statistics (BLS) to determine employment status of the civilian population This information, along with other inputs, are used by DEW to operate the Local Area Unemployment Statistics program, which estimates the number of individuals employed and those not employed, but actively seeking employment for statewide and a variety of substate geographies
• The seasonally adjusted number of South Carolina workers increased to 2,410,144
• That is an increase of 3,632 people over the May 2024 estimate.
• That is an increase of 26,816 people over the June 2023 estimate .
2,365,000 2,370,000 2,375,000 2,380,000 2,385,000 2,390,000 2,395,000 2,400,000 2,405,000 2,410,000 2,415,000
SEASONALLY ADJUSTED: Seasonal adjustment removes the effects of events that follow a regular pattern each year (i e tourist-related hiring and school closings in the summer) These adjustments make it easier to observe the cyclical and other nonseasonal movements in data over time
• The estimate of unemployed people increased to 89,733.
• That is a significant increase of 6,144 people from May’s estimate and a significant increase of 20,544 from the June 2023 estimate
• The state’s seasonally adjusted unemployment rate increased from 3 4 percent to 3 6 percent The national unemployment rate increased to 4 1 percent, according to the Current Population Survey
• The state’s estimated labor force (people working plus unemployed people looking for work) increased to 2,499,877, while the labor force participation rate increased to 57.3 percent .
• That is a significant increase of 9,776 people over the May 2024 estimate
• That is a significant increase of 47,360 individuals over the June 2023 estimate
SEASONALLY ADJUSTED: Seasonal adjustment removes the effects of events that follow a regular pattern each year (i e tourist-related hiring and school closings in the summer) These adjustments make it easier to observe the cyclical and other nonseasonal movements in data over time
BLS conducts a monthly Current Employment Statistics survey of approximately 119,000 businesses and government agencies which yields national estimates of nonagricultural wage and salary employment, hours, and earnings by industry These data are processed by DEW to generate comparable data for the state and its metropolitan statistical areas
The monthly survey of businesses in South Carolina marked an estimated increase of 3,300 nonfarm payroll jobs over the month to a level of 2,373,500.
SEASONALLY ADJUSTED: Seasonal adjustment removes the effects of events that follow a regular pattern each year (i e tourist-related hiring and school closings in the summer) These adjustments make it easier to observe the cyclical and other nonseasonal movements in data over time
The monthly survey of businesses in South Carolina marked an estimated increase of 3,300 nonfarm payroll jobs over the month to a level of 2,373,500.
MAY 2024 TO JUNE 2024
2023 TO JUNE 2024
NOTE: Employment estimates have been rounded to the nearest hundred. Sum of detail June not equal totals due to rounding or the exclusion of certain industries from publication. All data are subject to revision.
SEASONALLY ADJUSTED: Seasonal adjustment removes the effects of events that follow a regular pattern each year (i e tourist-related hiring and school closings in the summer) These adjustments make it easier to observe the cyclical and other nonseasonal movements in data over time
estimates are not seasonally adjusted and June diverge from state-level figures.
STATISTICAL AREA
Current month’s estimates are preliminary All data are subject to revision Substate estimates are not seasonally adjusted and June diverge from state-level figures.
1,800,000 1,900,000 2,000,000 2,100,000 2,200,000 2,300,000 2,400,000 2,500,000
Monthly Employment since January 2020
Current month’s estimates are preliminary. All data are subject to revision.
JUNE 2024 (NOT SEASONALLY ADJUSTED)
Current month’s estimates are preliminary. All data are subject to revision.
JUNE 2024 (NOT SEASONALLY ADJUSTED)
Current month’s estimates are preliminary. All data are subject to revision.
GREENVILLE-ANDERSON-MAULDIN
JUNE 2024 (NOT SEASONALLY ADJUSTED)
Current month’s estimates are preliminary. All data are subject to revision.
JUNE 2024 (NOT SEASONALLY ADJUSTED)
Current month’s estimates are preliminary. All data are subject to revision.
JUNE 2024 (NOT SEASONALLY ADJUSTED)
Current month’s estimates are preliminary. All data are subject to revision.
JUNE 2024 (NOT SEASONALLY ADJUSTED)
1 . Household Survey: Nationally, there is a monthly Current Population Survey of about 60,000 households conducted by the Census Bureau for the Bureau of Labor Statistics (BLS) to determine employment status of the civilian population This information, along with other inputs, is used by DEW to operate the Local Area Unemployment Statistics program, which estimates the number of individuals employed and those not employed, but actively seeking employment for statewide and a variety of sub-state geographies
2 Employer Survey: BLS conducts a monthly Current Employment Statistics survey of about 44,000 employers which yields national estimates of nonagricultural wage and salary employment, hours, and earnings by industry This data is processed by DEW to generate comparable data for the state and its metropolitan statistical areas
3 . Seasonally Adjusted: Seasonal adjustment removes the effects of events that follow a regular pattern each year (i e tourist-related hiring and school closings in the summer) These adjustments make it easier to observe the cyclical and other nonseasonal movements in data over time
4 . Not Seasonally Adjusted: Effects of regular or seasonal patterns have not been removed from this data
Data is published by Industry
Data is published by County
Counts Jobs Counts People
Utilizes an Establishment Survey
Reference week is the Pay Period that includes the 12th of the month
A job held by a person on unpaid leave during the reference week is not counted since they are not receiving pay
Does not count selfemployed workers
Does not include agricultural workers
Does not count unpaid family workers
Workers on strike during the entire reference period are not counted
The Current Population Survey (CPS), which is a Household Survey, is used to calculate LAUS
Reference week is the Calendar Week that includes the 12th of the month
A person on unpaid leave is counted as employed because they will return to their job
Does count self-employed workers
Includes both agricultural and non-agricultural workers
Counts unpaid family workers if they worked at least 15 unpaid hours for a family business or family farm during the reference week
Workers on strike during the reference week are counted as employed in LAUS

Do you need some help finding the data you need? Have a great idea for a research project you’d like to discuss with someone? We love to collaborate!
DATA TRENDS is prepared by the LMI Division of the S.C. Department of Employment and Workforce with funding provided by the US Department of Labor. Featured data is prepared in conjunction with the Bureau of Labor Statistics and current month estimates are always preliminary, with all previous data subject to revision
Interested in staying up to date with Trends as it’s released? Subscribe by clicking here!