
TRENDS
dew.sc.gov scworkforceinfo.com SC Department of Employment and Workforce Labor Market Information Division Columbia, South Carolina 29202 July 2022 Issue South Carolina Data

2 AT A GLANCE Quarterly Workforce Indicators (QWI): Questions and Answers . . . . . . . . . . . . . . . . . . 4 South Carolina’s Employment Situation (July 2022) . . . . . . . . . . . . . . . . . . . . . . . . . . . . . . . 8 Local Area Unemployment Statistics . . . . . . . . . . . . . . . . . . . . . . . . . . . . . . . . . . . . . . . . . . . . . 10 Current Employment Statistics — Seasonally Adjusted . . . . . . . . . . . . . . . . . . . . . . . . . . 16 Current Employment Statistics — Not Seasonally Adjusted . . . . . . . . . . . . . . . . . . . . . 18 Long Run Trends . . . . . . . . . . . . . . . . . . . . . . . . . . . . . . . . . . . . . . . . . . . . . . . . . . . . . . . . . . . . . . . . . . . 28 Technical Notes . . . . . . . . . . . . . . . . . . . . . . . . . . . . . . . . . . . . . . . . . . . . . . . . . . . . . . . . . . . . . . . . . . . 30 Interested in receiving the latest issue of Trends in your inbox every month? Click here to subscribe to our Trends mailing list!

Happy Workforce Development Month! This September, South Carolina is celebrating the efforts that DEW and our industry partners make every day to provide our state’s employers with the talent they need to succeed During the month, our agency and SC Works partners will promote numerous events for jobseekers and employers through job fairs, open house events, workshops, conferences, and more Because labor market information is part of the puzzle, we’ll be celebrating, as well . In the coming weeks, we will be launching a new interactive agency dashboard, starting our new LMI in an Instant YouTube series, and hosting live weekly LMI Insights webinars highlighting some of the products that LMI has to offer . Be sure to tune in Wednesdays at 2:00 pm all month Sign up to attend a webinar by completing the quick and easy registration form here
This month’s featured article is about Quarterly Workforce Indicators (QWI) If you want to get a good overview of what’s going on with the workforce in your area, then this is a great place to start. Read on to find out what QWI have to offer … And yes, LMI is still staffing up. Click here for more information As always, whoever you are, you can reach us at lmicustomerservice@dew.sc.gov for all your workforce data needs .
NOTE FROM THE DIRECTOR
3
Welcome to the July 2022 issue of Trends! How large is the labor force in the South Carolina portion of the Charlotte metro area? Check out page 13 …
Bryan P Labor Market Information Director SC Department of Employment and Workforce


4 SC Department of Employment and Workforce Labor Market Information Division Columbia, South Carolina 29202
A: The Quarterly Workforce Indicators (QWI) provide information about trends in employment, hiring, job creation and destruction, and earnings, with detail on geography, age, sex, and industry (32 indicators in all). The QWI are reported based on detailed firm characteristics (geography, industry, age, size) and worker demographics information (sex, age, education, race, ethnicity) and are available tabulated to national, state, metropolitan/micropolitan areas, county, and Workforce Investment Board (WIB) areas
A: Quarterly Workforce Indicators are a set of employment statistics produced by the Longitudinal Employer-Household Dynamics (LEHD) program, which is part of the Center for Economic Studies at the U S Census Bureau
Q: What are Quarterly Workforce Indicators?
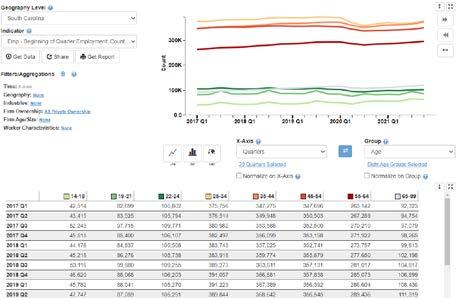
A: The Census Bureau provides several ways to obtain the data One way is called the QWI Explorer QWI Explorer is a web-based analysis tool that enables comprehensive access to the full depth and breadth of the Quarterly Workforce Indicators (QWI) dataset Through charts, maps and interactive tables, users can compare, rank and aggregate QWIs across time, geography, and/or firm and worker characteristics on the fly. QWI Explorer makes the entire QWI dataset available for visualization in line charts, bar charts, and thematic maps The application’s intuitive dashboard allows for the construction of pivot tables to compare and rank labor-force indicators such as employment, job creation and destruction, wages, and hires across a wide range of firm and worker characteristics. Potential analyses include a longitudinal look at wages by worker sex and age across counties, ranking job creation rates of young firms across NAICS industry groups and comparing hiring levels by worker race and education levels across a selection of metropolitan Areas
Q: What data are included?
Quarterly Workforce Indicators (QWI): Questions and Answers
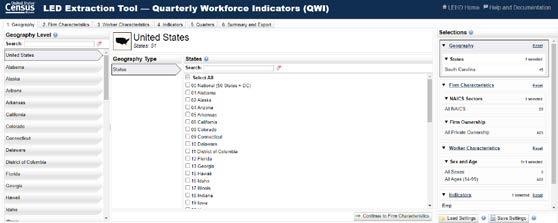
Q: How can I access the data?
Another method to obtain the data is the LED Extraction Tool, which makes the entire QWI dataset available through a simple querybuilding interface. The LED Extraction Tool provides access to all 32 QWIs, all available years/quarters, all firm and worker characteristics, and 50 states (plus the District of Columbia and national tabulations) It has a streamlined interface that walks users through the process of selecting the data they need and ignoring the data they don’t A user can grab only a single tabulation, all the data for a particular cluster of industries or geographies, or a state’s full longitudinal set of data using the intuitive query-building interface It has fast processing of the requested data tables, which are available for download as CSV and/or ZIP files (complete with metadata).
dew.sc.gov scworkforceinfo.com

SC Department of Employment and Workforce Labor Market Information Division Columbia, South Carolina 29202 6 PRIVATE-SECTOR WORKER AGE / FIRM AGE ANALYSIS EMPLOYMENT BY WORKER AGE AND FIRM AGE DATE 2017Q2 EMP FIRM AGE WorkerAge Years0-1 Years2-3 Years4-5 Years6-10 Years11+ AllAgesFirm Years0-1 Years2-3 Years4-5 Years6-10 Years11+ 14-18 2,665 3,383 1,981 4,504 31,719 44,251 6 0% 7 6% 4 5% 10 2% 71 7% 19-21 3,738 4,872 3,547 7,885 64,524 84,568 4 4% 5 8% 4 2% 9 3% 76 3% 22-24 4,444 5,485 4,428 10,293 82,319 106,969 4 2% 5 1% 4 1% 9 6% 77 0% 25-34 14,017 16,890 14,158 36,358 297,763 379,186 3 7% 4 5% 3 7% 9 6% 78 5% 35-44 11,177 14,036 11,626 31,457 283,069 351,365 3 2% 4 0% 3 3% 9 0% 80 6% 45-54 9,370 11,327 9,901 29,133 291,238 350,968 2 7% 3 2% 2 8% 8 3% 83 0% 55-64 6,344 7,617 6,754 21,555 224,695 266,966 2 4% 2 9% 2 5% 8 1% 84 2% 65-99 2,287 3,138 2,752 8,081 78,355 94,612 2 4% 3 3% 2 9% 8 5% 82 8% All(14-99)Ages 54,042 66,747 55,147 149,265 1,353,683 1,678,885 3 2% 4 0% 3 3% 8 9% 80 6% 14-18 4 9% 5 1% 3 6% 3 0% 2 3% 2 6% 19-21 6 9% 7 3% 6 4% 5 3% 4 8% 5 0% 22-24 8 2% 8 2% 8 0% 6 9% 6 1% 6 4% 25-34 25 9% 25 3% 25 7% 24 4% 22 0% 22 6% 35-44 20 7% 21 0% 21 1% 21 1% 20 9% 20 9% 45-54 17 3% 17 0% 18 0% 19 5% 21 5% 20 9% 55-64 11 7% 11 4% 12 2% 14 4% 16 6% 15 9% 65-99 4 2% 4 7% 5 0% 5 4% 5 8% 5 6% QWI are even included in LMI’s Community Profile reports. Q: How has it been used? A: DEW has used QWI to answer queries for information many times over the past several years Analysts have produced presentations of QWI data, examining various aspects of the state’s economy or workforce over time
dew.sc.gov scworkforceinfo.com 7 Q: Well, what if I’m looking for something and it’s not in here? A: Just shoot us an email and we’ll help you find it. We are here to serve anyone working to make South Carolina prosper, so we want to ensure what we publish is useful and responsive to our customers Suggestions are always welcome Community Profile Richland County AGE OF WORKERS BY INDUSTRY Industry 14-18 19-21 22-24 25-34 35-44 45-54 55-64 65+ Total, All Industries 4,151 8,148 10,479 44,850 47,110 44,926 37,460 12,907 Agriculture, Forestry, Fishing and Hunting 0 24 33 158 183 145 115 33 Mining, Quarrying, and Oil and Gas Extraction 0 0 7 32 30 31 39 7 Utilities 0 17 31 163 153 149 160 38 Construction 83 283 345 1,419 1,549 1,520 1,297 488 Manufacturing 59 219 416 2,174 2,618 2,765 2,374 486 Wholesale Trade 22 106 197 1,280 1,643 1,896 1,556 414 Retail Trade 880 1,990 1,695 4,413 3,645 3,201 2,958 1,356 Transportation and Warehousing 19 134 171 712 683 689 524 162 Information 12 47 150 709 777 843 730 258 Finance and Insurance 10 211 562 4,212 5,832 5,758 4,399 1,020 Real Estate and Rental and Leasing 5 80 172 806 832 805 687 297 Professional and Technical Services 52 215 717 2,945 3,019 2,606 2,210 877 Management of Companies and Enterprises 18 65 132 667 584 554 416 133 Administrative and Waste Services 275 877 1,155 4,675 4,110 3,642 3,154 1,344 Educational Services 48 111 340 2,855 4,404 4,385 3,558 1,540 Health Care and Social Assistance 69 492 1,235 6,763 7,027 6,377 5,255 1,723 Art, Entertainment, and Recreation 231 248 195 509 367 273 260 110 Accommodation and Food Services 2,185 2,367 1,684 3,815 2,691 2,002 1,564 611 Other Services, Except Public Administration 173 354 404 1,270 1,311 1,208 1,130 524 Public Administration 9 307 836 5,273 5,653 6,077 5,072 1,484 Source: U.S. Census Bureau, Local Employment Dynamics – 2020 Q3
• That is a decrease of 2,256 people from June’s estimate and a significant decrease of 19,711 over the July 2021 estimate
From July 2021 to July 2022, South Carolina’s economy has picked up 79,900 seasonally adjusted, nonfarm jobs
• Industries with strong growth were Trade, Transportation, and Utilities (+22,700); Leisure and Hospitality (+19,900); Government (+9,300); Manufacturing (+7,700); Financial Activities (+5,700); Other Services (+5,200); Professional and Business Services (+4,600); Education and Health Services (+3,200); and Information (+2,500)
Employer Survey2 (Current Employment Statistics)
• The state’s seasonally adjusted unemployment rate was unchanged at 3 2 percent
NONAGRICULTURAL EMPLOYMENT BY INDUSTRY (SEASONALLY ADJUSTED 3 )
EMPLOYMENT: : The seasonally adjusted, monthly survey of households estimated the number of South Carolinians working decreased to 2,323,952
UNEMPLOYMENT: The estimate of unemployed people decreased to 75,685
8 SC Department of Employment and Workforce Labor Market Information Division Columbia, South Carolina 29202
LABOR FORCE: The state’s estimated labor force (people working plus unemployed people looking for work) decreased to 2,399,637 from June’s level of 2,404,186
• Industries that reported gains were Education and Health Services (+4,100); Government (+3,600); Professional and Business Services (+3,400); Trade, Transportation, and Utilities (+2,300); Leisure and Hospitality (+2,100); Financial Activities (+900); Other Services (+800); Information (+700); and Construction (+400)
• That is a significant increase of 50,677 people over the July 2021 estimate
The monthly survey of businesses in South Carolina marked an estimated increase of 16,300 nonfarm payroll jobs over the month to a level of 2,233,600
• The Manufacturing industry declined (-2,000)
• The Construction industry declined (-1,200)
South Carolina’s Employment Situation (July 2022)
• That is an increase of 30,966 individuals over the July 2021 estimate
• Nationally, the unemployment rate declined to 3 .5 percent from June’s estimate of 3 6 percent, according to the Current Population Survey
• That is a decrease of 4,549 people over the June estimate
• That is a decrease of 2,293 people over the June estimate
Household Survey1 (Local Area Unemployment Statistics)

• Decreases was reported in the Government (-7,200) and Manufacturing (-500) industries
Not seasonally adjusted, nonfarm payroll employment increased by 6,800 from June 2022 to July 2022 for a total of 2,236,400
NONAGRICULTURAL BY INDUSTRY (NOT SEASONALLY ADJUSTED 4 )
EMPLOYMENT
Since June 2021, not seasonally adjusted, nonfarm jobs were up 78,500 in South Carolina
9 dew.sc.gov scworkforceinfo.com
• The Construction (-1,500) industry showed a decline over the year .
• The Mining and Logging industry showed no change
• Industries making strong annual gains were Trade, Transportation, and Utilities (+21,400); Leisure and Hospitality (+21,000); Manufacturing (+8,500); Government (+7,700); Financial Activities (+5,300); Other Services (+4,900); Professional and Business Services (+4,400); Educational and Health Services (+3,800); Information (+2,700) and Mining and Logging (+300)
• Increases were reported in the Leisure and Hospitality (+4,900); Education and Health Services (+3,000); Professional and Business Services (+2,500); Construction (+1,000); Other Services (+1,000); Financial Activities (+800); Information (+800); and Trade, Transportation and Utilities (+500) industries

4.1% 6.5% 6.5% 3.0% 6.4% 5.0% 3.0% 3.5% 2.7% 4.3% 4.7% 3.5% 4.0% 3.4% 2.8% 3.0% 4.9% 2.8% 3.8% 3.0% 2.9% 3.2% 3.5% 3.4% 4.9% 3.8%2.6% 2.7% 3.1% 5.8% 3.1% 2.6%3.3% 3.2% 3.8% 5.7% 3.1% 10 SC Department of Employment and Workforce Labor Market Information Division Columbia, South Carolina 29202
2.9% 2.7% 3.5% 3.7% 5.0% 3.3% 3.6% 3.6% 5.3% 7.2% 5.1% LAUS EMPLOYMENT ESTIMATES (SEASONALLY ADJUSTED) NON-INSTITUTIONALCIVILIANPOPULATION CIVILIAN LABOR FORCE TOTAL PERCENT POPULATIONOF EMPLOYMENT UNEMPLOYMENT TOTAL PERCENT POPULATIONOF TOTAL RATE (%) 4,191,288 2,399,637 57 .3 2,323,952 55 4 75,685 3 .2 NOTE: Current month’s estimates are preliminary. All data are subject to revision. Civilian non-institutional population (age 16+) is not seasonally adjusted. 11 dew.sc.gov scworkforceinfo.com Local Area Unemployment Statistics Unemployment Rate by County
All
Clarendon County ↓ 11,883 11,409 474 4 0 12,539 12,024 515 4 1 12,359 11,687 672 5 4
Union
4 1 Horry
Cherokee County 23,584 22,580 1,004 4 3 24,665 23,609 1,056 4 3 24,305 22,948 1,357 5 6
225 3 5
Sumter County ↓ 41,664 40,095 1,569 3 8 42,165 40,481 1,684 4 0 43,241 41,102 2,139 4 9 County ↑ 11,490 10,830 660 5 7 11,606 10,995 611 5 3 11,508 10,663 845 7 County ↓ 10,867 10,308 559 5 1 11,110 10,506 604 5 4 11,405 10,651 754 6 6 York County ↓ 149,083 144,464 4,619 3 1 151,773 146,781 4,992 3 3 146,224 140,620 5,604 month's estimates are preliminary data are subject to revision Unemployment Rate Substate estimates are not seasonally adjusted and may diverge from state-level figures. Unemployment Rate Down Unemployment Rate = South Carolina
3 Williamsburg
Calhoun County 6,366 6,141 6,443 6,210 233 6,487 6,169 County 218,548 212,689 220,065 213,701 6,364 215,692 207,282 8,410 3 9
2 9
4
5,859 2 7
↑
STATE OF SOUTH CAROLINA LOCAL AREA UNEMPLOYMENT ESTIMATES BY COUNTY (NOT SEASONALLY ADJUSTED) JULY 2022 JUNE 2022 JULY 2021** AREA LABORFORCE EMPLOYMENT UNEMPLOYMENT LABORFORCE EMPLOYMENT UNEMPLOYMENT LABORFORCE EMPLOYMENT UNEMPLOYMENT LEVEL RATE (%) LEVEL RATE (%) LEVEL RATE (%) Abbeville County ↓ 9,117 8,747 370 4 1 9,509 9,105 404 4 2 9,429 8,957 472 5 0 Aiken County ↓ 74,262 72,093 2,169 2 9 74,952 72,523 2,429 3 2 74,867 72,154 2,713 3 6 Allendale County 2,314 2,163 151 6 5 2,400 2,245 155 6 5 2,453 2,257 196 8 0 Anderson County ↓ 91,295 88,566 2,729 3 0 91,961 89,022 2,939 3 2 91,109 87,402 3,707 4 1 Bamberg County ↓ 4,370 4,090 280 6 4 4,525 4,226 299 6 6 4,694 4,291 403 8 6 Barnwell County ↓ 7,492 7,114 378 5 0 7,705 7,298 407 5 3 7,628 7,092 536 7 0 Beaufort County ↓ 78,654 76,323 2,331 3 0 79,217 76,686 2,531 3 2 79,132 76,172 2,960 3 7 Berkeley County ↓ 111,281 108,082 3,199 2 9 111,888 108,448 3,440 3 1 109,337 105,057 4,280 3 9
Chester County 13,503 12,873 630 4 7 13,721 13,077 644 4 7 13,398 12,547 851 6 4
↓
Pickens County ↓ 57,880 56,066 1,814 3 1 58,294 56,369 1,925 3 3 57,543 55,330 2,213 3 8
Colleton County ↓ 15,998 15,455 543 3 4 16,245 15,657 588 3 6 16,675 15,884 791 4 7
Richland County ↓ 195,467 188,935 6,532 3 3 197,502 190,525 6,977 3 5 197,290 188,321 8,969 4 5 Saluda County ↓ 8,369 8,149 220 2 6 8,520 8,269 251 2 9 8,587 8,306 281 County ↓ 156,609 151,581 5,028 3 2 159,199 153,846 5,353 3 4 156,024 149,134 6,890 4
3 6
Fairfield County ↓ 9,165 8,719 446 4 9 9,289 8,806 483 5 2 9,311 8,733 578 6 2 Florence County ↓ 64,980 62,815 2,165 3 3 65,830 63,569 2,261 3 4 66,652 63,689 2,963 4 4 Georgetown County ↓ 26,622 25,655 967 3 6 26,999 25,962 1,037 3 8 27,153 25,795 1,358 5 0 Greenville County ↓ 259,346 252,210 7,136 2 8 261,200 253,462 7,738 3 0 258,283 248,752 9,531 3 7 Greenwood County ↓ 28,620 27,540 1,080 3 8 29,838 28,668 1,170 3 9 29,716 28,235 1,481 5 Hampton County 7,987 7,744 243 3 0 8,213 7,966 247 3 0 8,067 7,735 332 County 155,580 150,039 5,541 3 6 157,424 151,302 6,122 3 9 156,113 148,172 7,941 5 County ↓ 13,544 13,145 399 2 9 13,694 13,261 433 3 2 13,687 32,332 30,441 1,891 5 8 33,081 31,072 2,009 6 1 34,142 31,455 2,687 7 9
Dorchester County ↓ 80,743 78,492 2,251 2 8 81,202 78,780 2,422 3 0 79,406 76,347 3,059 3 9 Edgefield County ↓ 10,418 10,108 310 3 0 10,525 10,192 333 3 2 10,569 10,183 386 3 7
13,199 488 3 6 Kershaw County ↓ 29,122 28,178 944 3 2 29,480 28,455 1,025 3 5 29,436 28,215 1,221 4 1 Lancaster County ↓ 43,870 42,322 1,548 3 5 44,678 43,009 1,669 3 7 43,242 41,254 1,988 4 6 Laurens County ↓ 30,042 29,034 1,008 3 4 30,311 29,209 1,102 3 6 30,114 28,716 1,398 4 6 Lee County ↓ 6,383 6,071 312 4 9 6,491 6,162 329 5 1 6,680 6,277 403 6 0 Lexington County ↓ 149,832 145,876 3,956 2 6 151,581 147,273 4,308 2 8 150,879 145,841 5,038 3 3 Marion County ↓ 12,783 12,100 683 5 3 13,049 12,323 726 5 6 13,123 12,147 976 7 4 Marlboro County ↓ 8,283 7,684 599 7 2 8,636 8,009 627 7 3 8,844 8,139 705 8 0 McCormick County ↓ 3,278 3,154 124 3 8 3,406 3,269 137 4 0 3,373 3,196 177 5 2 Newberry County ↓ 19,090 18,568 522 2 7 19,483 18,915 568 2 9 19,494 18,796 698 3 6 Oconee County ↓ 33,432 32,384 1,048 3 1 34,774 33,653 1,121 3 2 33,940 32,424 1,516 4 5 Orangeburg County ↓
0
3 8 Current
1 Jasper
3 3 Spartanburg
Chesterfield County ↓ 21,323 20,577 746 3 5 21,746 20,929 817 3 8 21,847 20,809 1,038 4 8
↓
29202
↓
Up
318 4 9 Charleston
12 SC Department of Employment and Workforce Labor Market Information Division Columbia,
↓
Darlington County ↓ 29,372 28,272 1,100 3 7 29,765 28,611 1,154 3 9 30,264 28,736 1,528 5 0 Dillon County 12,408 11,791 617 5 0 13,108 12,456 652 5 0 12,781 11,960 821 6 4
LOCAL AREA UNEMPLOYMENT ESTIMATES BY MSA (NOT SEASONALLY ADJUSTED) JULY 2022 JUNE 2022 JULY 2021 STATISTICALMETROPOLITANAREA LABORFORCE EMPLOYMENT UNEMPLOYMENT LABORFORCE EMPLOYMENT UNEMPLOYMENT LABORFORCE EMPLOYMENT UNEMPLOYMENT LEVEL RATE (%) LEVEL RATE (%) LEVEL RATE (%) CharlestonCharleston-North ↓ 410,572 399,263 11,309 2 8 413,155 400,929 12,226 3 0 404,435 388,686 15,749 3 9 Columbia ↓ 398,321 385,998 12,323 3 1 402,815 389,538 13,277 3 3 401,990 385,585 16,405 4 1 Florence ↓ 94,352 91,087 3,265 3 5 95,595 92,180 3,415 3 6 96,916 92,425 4,491 4 6 Greenville son-Mauldin-Ander ↓ 438,563 425,876 12,687 2 9 441,766 428,062 13,704 3 1 437,049 420,200 16,849 3 9 Hilton Head Bluffton-BeaufortIsland- ↓ 92,198 89,468 2,730 3 0 92,911 89,947 2,964 3 2 92,819 89,371 3,448 3 7 Myrtle MyrtleConway-NorthBeach-Beach ↓ 214,080 206,009 8,071 3 8 215,611 206,496 9,115 4 2 213,084 201,710 11,374 5 3 Spartanburg ↓ 168,099 162,411 5,688 3 4 170,805 164,841 5,964 3 5 167,532 159,797 7,735 4 6 Sumter ↓ 41,664 40,095 1,569 3 8 42,165 40,481 1,684 4 0 43,241 41,102 2,139 4 9 (SCCounty,Augusta-RichmondGAportion) ↓ 84,680 82,201 2,479 2 9 85,477 82,715 2,762 3 2 85,436 82,337 3,099 3 6 cord-Gastonia,Charlotte-Con NC (SC portion) ↓ 206,456 199,659 6,797 3 3 210,172 202,867 7,305 3 5 202,864 194,421 8,443 4 2 LOCAL AREA UNEMPLOYMENT ESTIMATES BY MUNICIPALITY (NOT SEASONALLY ADJUSTED) JULY 2022 JUNE 2022 JULY 2021 CITIES AND TOWNS ABOVE 25,000 POPULATION LABORFORCE EMPLOYMENT UNEMPLOYMENT LABORFORCE EMPLOYMENT UNEMPLOYMENT LABORFORCE EMPLOYMENT UNEMPLOYMENT LEVEL RATE (%) LEVEL RATE (%) LEVEL RATE (%) Aiken ↓ 13,001 12,610 391 3 0 13,168 12,686 482 3 7 13,210 12,621 589 4 5 Anderson 11,537 11,127 410 3 6 11,605 11,184 421 3 6 11,463 10,981 482 4 2 Bluffton ↓ 13,327 13,022 305 2 3 13,430 13,084 346 2 6 13,409 12,997 412 3 1 Charleston ↓ 77,032 75,039 1,993 2 6 77,550 75,389 2,161 2 8 75,956 73,118 2,838 3 7 Columbia ↓ 56,712 54,515 2,197 3 9 57,288 54,975 2,313 4 0 57,111 54,339 2,772 4 9 Conway ↓ 10,622 10,134 488 4 6 10,729 10,219 510 4 8 10,599 10,008 591 5 6 Florence 19,134 18,471 663 3 5 19,362 18,693 669 3 5 19,570 18,728 842 4 3 Goose Creek ↓ 21,111 20,478 633 3 0 21,203 20,548 655 3 1 20,678 19,905 773 3 7 Greenville ↓ 37,089 36,113 976 2 6 37,408 36,292 1,116 3 0 37,002 35,618 1,384 3 7 Greer ↓ 18,281 17,848 433 2 4 18,475 17,979 496 2 7 18,179 17,592 587 3 2 Hanahan ↓ 14,680 14,371 309 2 1 14,764 14,419 345 2 3 14,379 13,968 411 2 9 Hilton Head Island ↓ 17,546 17,169 377 2 1 17,705 17,251 454 2 6 17,691 17,135 556 3 1 Mauldin ↓ 13,732 13,399 333 2 4 13,828 13,466 362 2 6 13,702 13,216 486 3 5 Mount Pleasant ↓ 51,467 50,385 1,082 2 1 51,846 50,625 1,221 2 4 50,371 49,104 1,267 2 5 Myrtle Beach ↓ 16,098 15,575 523 3 2 16,299 15,706 593 3 6 16,248 15,381 867 5 3 North Charleston ↓ 57,854 55,963 1,891 3 3 58,201 56,215 1,986 3 4 57,401 54,516 2,885 5 0 Rock Hill ↓ 40,487 38,959 1,528 3 8 41,223 39,584 1,639 4 0 40,005 37,923 2,082 5 2 Spartanburg ↓ 16,735 16,092 643 3 8 16,998 16,333 665 3 9 16,871 15,833 1,038 6 2 Summerville ↓ 25,903 25,194 709 2 7 26,071 25,287 784 3 0 25,452 24,506 946 3 7 Sumter ↓ 14,900 14,277 623 4 2 15,062 14,415 647 4 3 15,472 14,636 836 5 4 Current month’s estimates are preliminary All data are subject to revision Substate estimates are not seasonally adjusted and may diverge from state-level figures. 13 dew.sc.gov scworkforceinfo.com
Monthly Unemployment since January 2020 UNEMPLOYMENT MONTH 25,000 50,000 75,000 100,000 125,000 150,000 175,000 200,000 225,000 250,000 275,000 300,000 (PERCENT)RATEUNEMPLOYMENT Monthly Unemployment Rate since January 2020 MONTH 0 0 2 0 4 0 6 0 8.0 10 0 12 0 14 0 14 SC Department of Employment and Workforce Labor Market Information Division Columbia, South Carolina 29202
(PERCENT)RATEPARTICIPATIONFORCELABOR Monthly Labor Force Participation Rate since January 2020 MONTH 56 8 56 9 57 0 57 1 57 2 57 3 57 4 57.5 57 6 57.7 57 8 EMPLOYMENT Monthly Employment since January 2020 MONTH 1,900,000 1,950,000 2,000,000 2,050,000 2,100,000 2,150,000 2,200,000 2,250,000 2,300,000 2,350,000 15 dew.sc.gov scworkforceinfo.com
+2.9% +2.9% +1.7% -1.5% +0.2% +3.6% +4.9% +2.1% NONFARM PAYROLL BY METROPOLITAN STATISTICAL AREA SEASONALLY ADJUSTED JULY 2022 JUNE 2022 TO JULY 2022 JULY 2021 TO JULY 2022 AREA 2022JULY 2022JUNE 2021JULY # CHANGE % CHANGE # CHANGE % CHANGE Statewide 2,233,600 2,217,300 2,153,700 16,300 0.7% 79,900 3.7% Charleston-North Charleston 391,700 387,900 373,300 3,800 1 0% 18,400 4 9% Columbia 403,000 401,500 396,100 1,500 0 4% 6,900 1 7% Florence 90,400 90,100 90,200 300 0 0% 200 0 2% Greenville-Anderson-Mauldin 440,700 437,300 428,400 3,400 0 8% 12,300 2 9% Hilton Head Island-Bluffton-Beaufort 84,000 83,700 82,300 300 0 4% 1,700 2 1% Myrtle Beach-Conway-North Myrtle Beach 179,300 178,600 173,000 700 0 4% 6,300 3 6% Spartanburg 168,700 168,000 163,900 700 0 4% 4,800 2 9% Sumter 38,200 38,100 38,800 100 0 .3% -600 -1 5% NOTE: Employment estimates have been rounded to the nearest hundred. Sum of detail may not equal totals due to rounding or the exclusion of certain industries from publication. All data are subject to revision. 16 SC Department of Employment and Workforce Labor Market Information Division Columbia, South Carolina 29202 CURRENT EMPLOYMENT STATISTICS Seasonally Adjusted — Year-Over-Year Change
NONFARM PAYROLL BY ECONOMIC SECTOR SEASONALLY ADJUSTED (IN THOUSANDS) JULY 2022 JUNE 2022 TO JULY 2022 JULY 2021 TO JULY 2022 2022JULY 2022JUNE 2021JULY # CHANGE % CHANGE # CHANGE % CHANGE Total Nonfarm 2,233.6 2,217.3 2,153.7 +16.3 +0.7% +79.9 +3.7% Total Private 1,858 7 1,846 0 1,788 1 +12 7 +0 7% +70 6 +3 9% Goods Producing 365 4 367 0 358 6 -1 6 -0 4% +6 8 +1 9% Mining, Logging and Construction 108 3 107 9 109 2 +0 4 +0 4% -0 9 -0 8% Mining and Logging 4 7 4 7 4 4 +0 0 +0 0% +0 3 +6 8% Construction 103 6 103 2 104 8 +0 4 +0 4% -1 2 -1 1% Manufacturing 257 1 259 1 249 4 -2 0 -0 8% +7 7 +3 1% Durable Goods 151 7 153 5 148 9 -1 8 -1 2% +2 8 +1 9% Non-Durable Goods 105 4 105 6 100 5 -0 2 -0 2% +4 9 +4 9% Service-Providing 1,868 2 1,850 3 1,795 1 +17 9 +1 0% +73 1 +4 1% Private Service Providing 1,493 3 1,479 0 1,429 5 +14 3 +1 0% +63 8 +4 5% Trade, Transportation, and Utilities 436 6 434 3 413 9 +2 3 +0 5% +22 7 +5 5% Wholesale Trade 78 9 78 8 74 8 +0 1 +0 1% +4 1 +5 5% Retail Trade 261 5 259 7 250 5 +1 8 +0 7% +11 0 +4 4% Transportation, Warehousing, and Utilities 96 2 95 8 88 6 +0 4 +0 4% +7 6 +8 6% Information 30 0 29 3 27 5 +0 7 +2 4% +2 5 +9 1% Financial Activities 116 2 115 3 110 5 +0 9 +0 8% +5 7 +5 2% Finance and Insurance 82 3 81 5 79 2 +0 8 +1 0% +3 1 +3 9% Real Estate and Rental and Leasing 33 9 33 8 31 3 +0 1 +0 3% +2 6 +8 3% Professional and Business Services 301 8 298 4 297 2 +3 4 +1 1% +4 6 +1 5% Professional, Scientific, and Technical Services 110 4 109 6 106 4 +0 8 +0 7% +4 0 +3 8% Management of Companies and Enterprises 24 1 24 3 23 9 -0 2 -0 8% +0 2 +0 8% Administrative and Support and Waste Management and Remediation Services 167 3 164 5 166 9 +2 8 +1 7% +0 4 +0 2% Education and Health Services 260 5 256 4 257 3 +4 1 +1 6% +3 2 +1 2% Educational Services 45 5 44 9 40 7 +0 6 +1 3% +4 8 +11 8% Health Care Services 215 0 211 5 216 6 +3 5 +1 7% -1 6 -0 7% Leisure and Hospitality 266 0 263 9 246 1 +2 1 +0 8% +19 9 +8 1% Arts, Entertainment, and Recreation 32 6 32 .6 29 4 +0 0 +0 0% +3 .2 +10 9% Accommodation and Food Services 233 4 231 3 216 7 +2 1 +0 9% +16 7 +7 7% Other Services 82 2 81 4 77 0 +0 8 +1 0% +5 2 +6 8% Government 374 9 371 3 365 6 +3 6 +1 0% +9 3 +2 5% Federal Government 36 1 35 8 36 2 +0 3 +0 8% -0 1 -0 3% State Government 113 2 113 2 105 8 +0 0 +0 0% +7 4 +7 0% Local Government 225 6 222 3 223 6 +3 3 +1 5% +2 0 +0 9% 17 dew.sc.gov scworkforceinfo.com
+3.3% +3.4% +2.0% -1.0% +0.5% +3.2% +4.7% +2.4% NONFARM PAYROLL BY METROPOLITAN STATISTICAL AREA NOT SEASONALLY ADJUSTED JULY 2022 JUNE 2022 TO JULY 2022 JULY 2021 TO JULY 2022 AREA 2022JULY 2022JUNE 2021JULY # CHANGE % CHANGE # CHANGE % CHANGE Statewide 2,236,400 2,229,600 2,157,900 +6,800 +0.3% +78,500 +3.6% Charleston-North Charleston 393,500 391,800 375,800 +1,700 +0 4% +17,700 +4 7% Columbia 401,400 401,700 393,500 -300 -0 1% +7,900 +2 0% Florence 90,100 90,300 89,700 -200 -0 2% +400 +0 5% Greenville-Anderson-Mauldin 439,400 437,700 425,400 +1,700 +0 4% +14,000 +3 3% Hilton Head Island-Bluffton-Beaufort 86,400 85,900 84,400 +500 +0 6% +2,000 +2 4% Myrtle Beach-Conway-North Myrtle Beach 186,900 186,700 181,100 +200 +0 1% +5,800 +3 2% Spartanburg 166,800 168,300 161,400 -1,500 -0 9% +5,400 +3 4% Sumter 38,100 38,200 38,500 -100 -0 3% -400 -1 0% NOTE: Employment estimates have been rounded to the nearest hundred. Sum of detail may not equal totals due to rounding or the exclusion of certain industries from publication. All data are subject to revision. 18 SC Department of Employment and Workforce Labor Market Information Division Columbia, South Carolina 29202 CURRENT EMPLOYMENT STATISTICS Not Seasonally Adjusted — Year-Over-Year Change
NONFARM PAYROLL BY ECONOMIC SECTOR NOT SEASONALLY ADJUSTED JULY 2022 JUNE 2022 TO JULY 2022 JULY 2021 TO JULY 2022 JULY 2022 JUNE 2022 JULY 2021 # CHANGE % CHANGE # CHANGE % CHANGE Total Nonfarm 2,236,400 2,229,600 2,157,900 +6,800 +0.3% +78,500 +3.6% Total Private 1,876,000 1,862,000 1,805,200 +14,000 +0 8% +70,800 +3 9% Goods Producing 367,500 367,000 360,200 +500 +0 1% +7,300 +2 0% Mining, Logging and Construction 109,000 108,000 110,200 +1,000 +0 9% -1,200 -1 1% Mining and Logging 4,700 4,700 4,400 +0 +0 0% +300 +6 8% Construction 104,300 103,300 105,800 +1,000 +1 0% -1,500 -1 4% Construction of Buildings 25,000 25,000 25,100 +0 +0 0% -100 -0 4% Heavy and Civil Engineering Construction 16,100 16,200 16,300 -100 -0 6% -200 -1 2% Specialty Trade Contractors 63,200 62,100 64,400 +1,100 +1 8% -1,200 -1 9% Manufacturing 258,500 259,000 250,000 -500 -0 2% +8,500 +3 4% Durable Goods 152,600 153,100 149,200 -500 -0 3% +3,400 +2 3% Fabricated Metal Product Manufacturing 24,400 24,400 23,600 +0 +0 0% +800 +3 4% Transportation Equipment Manufacturing 50,900 50,500 48,200 +400 +0 8% +2,700 +5 6% Non-Durable Goods 105,900 105,900 100,800 +0 +0 0% +5,100 +5 1% Textile Mills 13,000 13,100 12,700 -100 -0 8% +300 +2 4% Plastics and Rubber Products Manufacturing 25,600 25,500 23,900 +100 +0 4% +1,700 +7 1% Service-Providing 1,868,900 1,862,600 1,797,700 +6,300 +0 3% +71,200 +4 0% Private Service Providing 1,508,500 1,495,000 1,445,000 +13,500 +0 9% +63,500 +4 4% Trade, Transportation, and Utilities 436,700 436,200 415,300 +500 +0 1% +21,400 +5 2% Wholesale Trade 79,900 80,000 75,000 -100 -0 1% +4,900 +6 5% Merchant Wholesalers, Durable Goods 43,800 43,600 40,200 +200 +0 5% +3,600 +9 0% Merchant Wholesalers, Nondurable Goods 22,100 22,400 21,300 -300 -1 3% +800 +3 8% Retail Trade 261,500 260,700 252,300 +800 +0 3% +9,200 +3 6% Motor Vehicle and Parts Dealers 34,400 34,200 32,900 +200 +0 6% +1,500 +4 6% Food and Beverage Stores 51,000 50,100 49,500 +900 +1 8% +1,500 +3 0% Health and Personal Care Stores 15,600 15,700 15,300 -100 -0 6% +300 +2 0% Clothing and Clothing Accessories Stores 17,300 17,400 16,900 -100 -0 6% +400 +2 4% General Merchandise Stores 57,300 56,800 56,000 +500 +0 9% +1,300 +2 3% Transportation, Warehousing, and Utilities 95,300 95,500 88,000 -200 -0 2% +7,300 +8 3% Utilities 11,100 11,000 11,000 +100 +0 9% +100 +0 9% Transportation and Warehousing 84,200 84,500 77,000 -300 -0 4% +7,200 +9 4% Information 30,300 29,500 27,600 +800 +2 7% +2,700 +9 8% Financial Activities 116,900 116,100 111,600 +800 +0 7% +5,300 +4 7% Finance and Insurance 82,600 81,700 79,000 +900 +1 1% +3,600 +4 6% Credit Intermediation and Related Activities including Monetary Authorities 39,400 39,000 37,300 +400 +1 0% +2,100 +5 6% Real Estate and Rental and Leasing 34,300 34,400 32,600 -100 -0 3% +1,700 +5 2%
Professional and Business Services 300,500 298,000 296,100 +2,500 +0 8% +4,400 +1 5% Professional, Scientific, and Technical Services 110,300 109,600 106,700 +700 +0 6% +3,600 +3 4% Architectural, Engineering, and Related Services 22,000 21,900 21,100 +100 +0 5% +900 +4 3% Management of Companies and Enterprises 24,200 24,400 24,000 -200 -0 8% +200 +0 8% Administrative and Support and Waste Management and Remediation Services 166,000 164,000 165,400 +2,000 +1 2% +600 +0 4% Administrative and Support Services 152,500 150,500 152,800 +2,000 +1 3% -300 -0 2% Employment Services 72,000 71,800 72,400 +200 +0 3% -400 -0 6% Services to Buildings and Dwellings 38,300 38,000 38,300 +300 +0 8% +0 +0 0% Education and Health Services 257,800 254,800 254,000 +3,000 +1 2% +3,800 +1 5% Educational Services 43,100 43,600 38,400 -500 -1 1% +4,700 +12 2% Health Care and Social Assistance 214,700 211,200 215,600 +3,500 +1 7% -900 -0 4% Ambulatory Health Care Services 104,700 103,300 102,600 +1,400 +1 4% +2,100 +2 0% Hospitals 36,100 35,700 37,100 +400 +1 1% -1,000 -2 7% Nursing and Residential Care Facilities 36,400 35,700 38,500 +700 +2 0% -2,100 -5 5% Leisure and Hospitality 283,700 278,800 262,700 +4,900 +1 8% +21,000 +8 0% Arts, Entertainment, and Recreation 36,600 36,800 33,800 -200 -0 5% +2,800 +8 3% Amusement, Gambling, and Recreation Industries 29,400 29,700 27,100 -300 -1 0% +2,300 +8 5% Accommodation and Food Services 247,100 242,000 228,900 +5,100 +2 1% +18,200 +8 0% Accommodation 34,700 33,900 30,900 +800 +2 4% +3,800 +12 3% Food Services and Drinking Places 212,400 208,100 198,000 +4,300 +2 1% +14,400 +7 3% Other Services 82,600 81,600 77,700 +1,000 +1 2% +4,900 +6 3% Repair and Maintenance 23,800 23,200 21,600 +600 +2 6% +2,200 +10 2% Personal and Laundry Services 19,900 19,400 18,400 +500 +2 6% +1,500 +8 2% Government 360,400 367,600 352,700 -7,200 -2 0% +7,700 +2 2% Federal Government 36,200 35,700 36,200 +500 +1 4% +0 +0 0% State Government 107,800 107,800 102,200 +0 +0 0% +5,600 +5 5% State Government Educational Services 52,000 51,700 46,800 +300 +0 6% +5,200 +11 1% State Government Excluding Education 55,800 56,100 55,400 -300 -0 5% +400 +0 7% Local Government 216,400 224,100 214,300 -7,700 -3 4% +2,100 +1 0% Local Government Educational Services 100,700 107,800 97,400 -7,100 -6 6% +3,300 +3 4% Local Government excluding Educational Services 115,700 116,300 116,900 -600 -0 5% -1,200 -1 0% 19 dew.sc.gov scworkforceinfo.com
TOTAL PRIVATE NSA STATEWIDE HOURS AND EARNINGS BY MSA AVERAGE WEEKLY EARNINGS (AWE) JUNE 2022 TO JULY 2022 JULY 2021 TO JULY 2022 AREA 2022JULY JUNE2022 2021JULY # CHANGE % CHANGE # CHANGE % CHANGE Charleston-North Charleston $1,078 58 $1,071 53 $1,023 86 +$7 05 +0 7% +$54 72 +5 3% Columbia $926 14 $904 45 $850 68 +$21 69 +2 4% +$75 46 +8 9% Florence $778 16 $774 15 $752 05 +$4 01 +0 5% +$26 11 +3 5% Greenville-Anderson-Mauldin $1,014 04 $1,001 09 $980 67 +$12 95 +1 3% +$33 37 +3 4% Hilton Head Island-Bluffton-Beaufort $802 90 $819 95 $801 06 -$17 05 -2 1% +$1 84 +0 2% Myrtle Beach-Conway-North Myrtle Beach $836 30 $838 17 $764 14 -$1 87 -0 2% +$72 16 +9 4% Spartanburg $961 80 $964 66 $973 04 -$2 86 -0 3% -$11 24 -1 2% Sumter $739 67 $756 90 $663 42 -$17 23 -2 3% +$76 25 +11 5% AVERAGE WEEKLY HOURS (AWH) JUNE 2022 TO JULY 2022 JULY 2021 TO JULY 2022 AREA 2022JULY JUNE2022 2021JULY # CHANGE % CHANGE # CHANGE % CHANGE Charleston-North Charleston 34 1 34 3 34 3 -0 2 -0 6% -0 2 -0 6% Columbia 34 7 33 9 34 0 +0 8 +2 4% +0 7 +2 1% Florence 34 1 34 3 33 8 -0 2 -0 6% +0 3 +0 9% Greenville-Anderson-Mauldin 35 1 35 2 35 2 -0 1 -0 3% -0 1 -0 3% Hilton Head Island-Bluffton-Beaufort 31 0 31 0 31 7 0 0% -0 7 -2 2% Myrtle Beach-Conway-North Myrtle Beach 33 6 33 5 32 6 +0 1 +0 3% +1 0 +3 1% Spartanburg 35 0 34 7 35 8 +0 3 +0 9% -0 8 -2 2% Sumter 31 8 33 7 29 2 -1 9 -5 6% +2 6 +8 9% AVERAGE HOURLY EARNINGS (AHE) JUNE 2022 TO JULY 2022 JULY 2021 TO JULY 2022 AREA 2022JULY JUNE2022 2021JULY # CHANGE % CHANGE # CHANGE % CHANGE Charleston-North Charleston $31 63 $31 24 $29 85 +$0 39 +1 3% +$1 78 +6 0% Columbia $26 69 $26 68 $25 02 +$0 01 +0 0% +$1 67 +6 7% Florence $22 82 $22 57 $22 25 +$0 25 +1 1% +$0 57 +2 6% Greenville-Anderson-Mauldin $28 89 $28 44 $27 86 +$0 45 +1 6% +$1 03 +3 7% Hilton Head Island-Bluffton-Beaufort $25 90 $26 45 $25 27 -$0 55 -2 1% +$0 63 +2 5% Myrtle Beach-Conway-North Myrtle Beach $24 89 $25 02 $23 44 -$0 13 -0 5% +$1 45 +6 2% Spartanburg $27 48 $27 80 $27 18 -$0 32 -1 2% +$0 30 +1 1% Sumter $23 26 $22 46 $22 72 +$0 80 +3 6% +$0 54 +2 4% Current month’s estimates are preliminary. All data are subject to revision. 20 SC Department of Employment and Workforce Labor Market Information Division Columbia, South Carolina 29202
NSA STATEWIDE HOURS AND EARNINGS BY INDUSTRY AVERAGE WEEKLY EARNINGS (AWE) JUNE 2022 TO JULY 2022 JULY 2021 TO JULY 2022 INDUSTRY TITLE JULY 2022 JUNE 2022 JULY 2021 # CHANGE % CHANGE # CHANGE % CHANGE Total Private $971.46 $964.97 $916.56 +$6.49 +0.7% +$54.90 +6.0% Goods Producing $1,281 91 $1,281 95 $1,187 80 -$0 04 +0 0% +$94 11 +7 9% Construction $1,258 82 $1,269 63 $1,152 60 -$10 81 -0 9% +$106 22 +9 2% Manufacturing $1,288 97 $1,283 85 $1,189 32 +$5 12 +0 4% +$99 65 +8 4% Private Service Providing $896 75 $886 26 $847 26 +$10 49 +1 2% +$49 49 +5 8% Trade, Transportation, and Utilities $829 62 $849 15 $822 70 -$19 53 -2 3% +$6 92 +0 8% Financial Activities $1,161 27 $1,160 86 $1,159 13 +$0 41 +0 0% +$2 14 +0 2% Professional and Business Services $1,227 26 $1,223 37 $1,017 74 +$3 89 +0 3% +$209 52 +20 6% Education and Health Services $1,013 25 $972 55 $969 07 +$40 70 +4 2% +$44 18 +4 6% Leisure and Hospitality $438 88 $438 19 $405 34 +$0 69 +0 2% +$33 54 +8 3% Other Services $793 90 $778 18 $774 18 +$15 72 +2 0% +$19 72 +2 6% AVERAGE WEEKLY HOURS (AWH) JUNE 2022 TO JULY 2022 JULY 2021 TO JULY 2022 INDUSTRY TITLE JULY 2022 JUNE 2022 JULY 2021 # CHANGE % CHANGE # CHANGE % CHANGE Total Private 34.4 34.5 34.2 -0.1 -0.3% +0.2 +0.6% Goods Producing 41 1 41 3 41 2 -0 2 -0 5% -0 1 -0 2% Construction 41 3 41 6 40 8 -0 3 -0 7% +0 5 +1 2% Manufacturing 40 7 40 9 40 8 -0 2 -0 5% -0 1 -0 3% Private Service Providing 32 8 32 8 32 4 +0 0 +0 0% +0 4 +1 2% Trade, Transportation, and Utilities 33 32 9 33 2 +0 1 +0 3% -0 2 -0 6% Financial Activities 37 4 37 1 37 5 +0 3 +0 8% -0 1 -0 3% Professional and Business Services 38 4 39 4 36 4 -1 0 -2 5% +2 0 +5 5% Education and Health Services 32 3 32 3 31 2 +0 0 +0 0% +1 1 +3 5% Leisure and Hospitality 26 25 7 26 +0 3 +1 2% +0 0 +0 0% Other Services 34 33 6 34 5 +0 4 +1 2% -0 5 -1 5% AVERAGE HOURLY EARNINGS (AHE) JUNE 2022 TO JULY 2022 JULY 2021 TO JULY 2022 INDUSTRY TITLE JULY 2022 JUNE 2022 JULY 2021 # CHANGE % CHANGE # CHANGE % CHANGE Total Private $28.24 $27.97 $26.80 +$0.27 +1.0% +$1.44 +5.4% Goods Producing $31 19 $31 04 $28 83 +$0 15 +0 5% +$2 36 +8 2% Private Service Providing $30 48 $30 52 $28 25 -$0 04 -0 1% +$2 23 +7 9% Construction $31 67 $31 39 $29 15 +$0 28 +0 9% +$2 52 +8 6% Manufacturing $27 34 $27 02 $26 15 +$0 32 +1 2% +$1 19 +4 6% Trade, Transportation, and Utilities $25 14 $25 81 $24 78 -$0 67 -2 6% +$0 36 +1 5% Financial Activities $31 05 $31 29 $30 91 -$0 24 -0 8% +$0 14 +0 5% Professional and Business Services $31 96 $31 05 $27 96 +$0 91 +2 9% +$4 00 +14 3% Education and Health Services $31 37 $30 11 $31 06 +$1 26 +4 2% +$0 31 +1 0% Leisure and Hospitality $16 88 $17 05 $15 59 -$0 17 -1 0% +$1 29 +8 3% Other Services $23 35 $23 16 $22 44 +$0 19 +0 8% +$0 91 +4 1% 21 dew.sc.gov scworkforceinfo.com
NONFARM PAYROLL BY ECONOMIC SECTOR CHARLESTON-NORTH CHARLESTON MSA JULY 2022 (NOT SEASONALLY ADJUSTED) JUNE 2022 TO JULY 2022 JULY 2021 TO JULY 2022 2022JULY 2022JUNE 2021JULY # CHANGE % CHANGE # CHANGE % CHANGE Total Nonfarm 393,500 391,800 375,800 +1,700 +0.4% +17,700 +4.7% Total Private 323,700 321,200 308,200 +2,500 +0 8% +15,500 +5 0% Goods Producing 51,100 50,800 49,700 +300 +0 6% +1,400 +2 8% Service-Providing 342,400 341,000 326,100 +1,400 +0 4% +16,300 +5 0% Private Service Providing 272,600 270,400 258,500 +2,200 +0 8% +14,100 +5 5% Mining, Logging and Construction 22,000 21,900 21,600 +100 +0 5% +400 +1 9% Manufacturing 29,100 28,900 28,100 +200 +0 7% +1,000 +3 6% Trade, Transportation, and Utilities 69,300 69,400 68,700 -100 -0 1% +600 +0 9% Wholesale Trade 11,800 11,800 11,000 0 0% +800 +7 3% Retail Trade 41,300 41,400 41,600 -100 -0 .2% -300 -0 7% General Merchandise Stores 7,500 7,400 7,400 +100 +1 4% +100 +1 4% Transportation, Warehousing, and Utilities 16,200 16,200 16,100 0 0% +100 +0 6% Information 8,000 7,800 7,200 +200 +2 6% +800 +11 1% Financial Activities 17,000 16,900 16,700 +100 +0 6% +300 +1 8% Professional and Business Services 63,600 62,000 58,100 +1,600 +2 6% +5,500 +9 5% Administrative and Support and Waste Management and Remediation Services 29,400 27,700 25,900 +1,700 +6 1% +3,500 +13 5% Education and Health Services 43,500 43,500 43,400 0 0% +100 +0 2% Leisure and Hospitality 55,400 55,200 49,400 +200 +0 4% +6,000 +12 2% Accommodation and Food Services 49,400 49,300 43,500 +100 +0 2% +5,900 +13 6% Food Services and Drinking Places 40,700 40,700 35,600 0 0% +5,100 +14 3% Other Services 15,800 15,600 15,000 +200 +1 3% +800 +5 3% Government 69,800 70,600 67,600 -800 -1 1% +2,200 +3 3% Federal Government 11,800 11,700 12,000 +100 +0 9% -200 -1 7% State Government 29,700 29,900 27,400 -200 -0 7% +2,300 +8 4% Local Government 28,300 29,000 28,200 -700 -2 4% +100 +0 4% Current month’s estimates are preliminary. All data are subject to revision. 22 SC Department of Employment and Workforce Labor Market Information Division Columbia, South Carolina 29202
NONFARM PAYROLL BY ECONOMIC SECTOR COLUMBIA MSA JULY 2022 (NOT SEASONALLY ADJUSTED) JUNE 2022 TO JULY 2022 JULY 2021 TO JULY 2022 2022JULY 2022JUNE 2021JULY # CHANGE % CHANGE # CHANGE % CHANGE Total Nonfarm 401,400 401,700 393,500 -300 -0.1% +7,900 +2.0% Total Private 325,900 325,400 318,000 +500 +0 2% +7,900 +2 5% Goods Producing 48,500 48,500 49,000 0 0% -500 -1 0% Service-Providing 352,900 353,200 344,500 -300 -0 1% +8,400 +2 4% Private Service Providing 277,400 276,900 269,000 +500 +0 2% +8,400 +3 1% Mining, Logging and Construction 16,100 16,000 17,200 +100 +0 .6% -1,100 -6 4% Manufacturing 32,400 32,500 31,800 -100 -0 3% +600 +1 9% Trade, Transportation, and Utilities 76,300 75,900 74,400 +400 +0 5% +1,900 +2 6% Wholesale Trade 16,300 16,300 15,000 0 0% +1,300 +8 7% Retail Trade 43,600 43,200 42,700 +400 +0 .9% +900 +2 1% Transportation, Warehousing, and Utilities 16,400 16,400 16,700 0 0% -300 -1 8% Information 5,400 5,300 4,900 +100 +1 9% +500 +10 2% Financial Activities 34,800 34,700 33,000 +100 +0 3% +1,800 +5 5% Credit Intermediation and Related Activities including Monetary Authorities - Central Bank 7,500 7,500 7,300 0 0% +200 +2 7% Professional and Business Services 50,700 52,200 52,300 -1,500 -2 9% -1,600 -3 1% Administrative and Support and Waste Management and Remediation Services 28,100 29,300 29,700 -1,200 -4 1% -1,600 -5 4% Education and Health Services 52,400 51,700 51,300 +700 +1 4% +1,100 +2 1% Leisure and Hospitality 41,100 40,600 37,200 +500 +1 2% +3,900 +10 5% Food Services and Drinking Places 34,400 34,000 31,100 +400 +1 2% +3,300 +10 6% Other Services 16,700 16,500 15,900 +200 +1 2% +800 +5 0% Government 75,500 76,300 75,500 -800 -1 1% 0 0% Federal Government 11,000 10,900 11,100 +100 +0 9% -100 -0 9% State Government 31,800 31,600 29,400 +200 +0 6% +2,400 +8 2% Local Government 32,700 33,800 35,000 -1,100 -3 3% -2,300 -6 6% Current month’s estimates are preliminary. All data are subject to revision. 23 dew.sc.gov scworkforceinfo.com
NONFARM PAYROLL BY ECONOMIC GREENVILLE-ANDERSON-MAULDINSECTORMSA JULY 2022 (NOT SEASONALLY ADJUSTED) JUNE 2022 TO JULY 2022 JULY 2021 TO JULY 2022 2022JULY 2022JUNE 2021JULY # CHANGE % CHANGE # CHANGE % CHANGE Total Nonfarm 439,400 437,700 425,400 +1,700 +0.4% +14,000 +3.3% Total Private 380,800 377,100 368,200 +3,700 +1 0% +12,600 +3 4% Goods Producing 80,200 79,900 77,900 +300 +0 4% +2,300 +3 0% Service-Providing 359,200 357,800 347,500 +1,400 +0 4% +11,700 +3 4% Private Service Providing 300,600 297,200 290,300 +3,400 +1 1% +10,300 +3 6% Mining, Logging and Construction 19,500 19,300 20,100 +200 +1 .0% -600 -3 .0% Manufacturing 60,700 60,600 57,800 +100 +0 2% +2,900 +5 0% Trade, Transportation, and Utilities 82,100 82,200 77,700 -100 -0 1% +4,400 +5 7% Wholesale Trade 20,100 20,000 18,900 +100 +0 5% +1,200 +6 4% Retail Trade 48,200 48,400 45,600 -200 -0 4% +2,600 +5 7% Transportation, Warehousing, and Utilities 13,800 13,800 13,200 0 0% +600 +4 6% Information 7,100 7,100 6,600 0 0% +500 +7 6% Financial Activities 22,000 21,800 20,300 +200 +0 9% +1,700 +8 4% Professional and Business Services 73,200 71,300 73,400 +1,900 +2 7% -200 -0 3% Professional, Scientific, and Technical Services 25,900 25,100 23,800 +800 +3 .2% +2,100 +8 8% Management of Companies and Enterprises 5,900 5,800 5,600 +100 +1 .7% +300 +5 4% Administrative and Support and Waste Management and Remediation Services 41,400 40,400 44,000 +1,000 +2 5% -2,600 -5 9% Education and Health Services 53,900 53,500 52,900 +400 +0 .8% +1,000 +1 9% Educational Services 11,800 11,800 10,500 0 0% +1,300 +12 4% Health Care and Social Assistance 42,100 41,700 42,400 +400 +1 0% -300 -0 7% Leisure and Hospitality 46,800 45,900 45,000 +900 +2 0% +1,800 +4 0% Other Services 15,500 15,400 14,400 +100 +0 .7% +1,100 +7 6% Government 58,600 60,600 57,200 -2,000 -3 3% +1,400 +2 5% Federal Government 3,000 2,900 2,900 +100 +3 5% +100 +3 5% State Government 13,400 13,400 12,400 0 0% +1,000 +8 1% Local Government 42,200 44,300 41,900 -2,100 -4 7% +300 +0 7% Current month’s estimates are preliminary. All data are subject to revision. 24 SC Department of Employment and Workforce Labor Market Information Division Columbia, South Carolina 29202
NONFARM PAYROLL BY ECONOMIC SECTOR MYRTLE BEACH-CONWAY-NORTH MYRTLE BEACH MSA JULY 2022 (NOT SEASONALLY ADJUSTED) JUNE 2022 TO JULY 2022 JULY 2021 TO JULY 2022 2022JULY 2022JUNE 2021JULY # CHANGE % CHANGE # CHANGE % CHANGE Total Nonfarm 186,900 186,700 181,100 +200 +0.1% +5,800 +3.2% Total Private 164,300 162,900 159,100 +1,400 +0 9% +5,200 +3 3% Goods Producing 16,000 16,100 16,100 -100 -0 .6% -100 -0 .6% Service-Providing 170,900 170,600 165,000 +300 +0 2% +5,900 +3 6% Private Service Providing 148,300 146,800 143,000 +1,500 +1 0% +5,300 +3 7% Mining, Logging and Construction 11,000 11,100 11,200 -100 -0 9% -200 -1 8% Manufacturing 5,000 5,000 4,900 0 0% +100 +2 0% Trade, Transportation, and Utilities 42,200 41,800 39,800 +400 +1 0% +2,400 +6 0% Wholesale Trade 3,600 3,600 3,500 0 0% +100 +2 9% Retail Trade 33,800 33,400 31,500 +400 +1 2% +2,300 +7 3% Transportation, Warehousing, and Utilities 4,800 4,800 4,800 0 0% 0 0% Information 2,500 2,400 2,400 +100 +4 2% +100 +4 2% Financial Activities 10,400 10,300 10,500 +100 +1 0% -100 -1 0% Professional and Business Services 17,600 17,600 17,600 0 0% 0 0% Education and Health Services 20,100 20,000 19,800 +100 +0 5% +300 +1 5% Leisure and Hospitality 48,600 47,800 46,200 +800 +1 7% +2,400 +5 .2% Accommodation and Food Services 41,700 40,800 39,000 +900 +2 2% +2,700 +6 9% Food Services and Drinking Places 32,300 31,400 30,200 +900 +2 9% +2,100 +7 0% Other Services 6,900 6,900 6,700 0 0% +200 +3 0% Government 22,600 23,800 22,000 -1,200 -5 0% +600 +2 7% Federal Government 1,400 1,400 1,400 0 0% 0 0% State Government 4,700 4,700 4,500 0 0% +200 +4 4% Local Government 16,500 17,700 16,100 -1,200 -6 8% +400 +2 5% Current month’s estimates are preliminary. All data are subject to revision. 25 dew.sc.gov scworkforceinfo.com
NONFARM PAYROLL BY ECONOMIC SECTOR SPARTANBURG MSA JULY 2022 (NOT SEASONALLY ADJUSTED) JUNE 2022 TO JULY 2022 JULY 2021 TO JULY 2022 2022JULY 2022JUNE 2021JULY # CHANGE % CHANGE # CHANGE % CHANGE Total Nonfarm 166,800 168,300 161,400 -1,500 -0.9% +5,400 +3.4% Total Private 141,100 141,300 137,300 -200 -0 1% +3,800 +2 8% Goods Producing 45,700 45,600 43,900 +100 +0 2% +1,800 +4 1% Service-Providing 121,100 122,700 117,500 -1,600 -1 3% +3,600 +3 1% Private Service Providing 95,400 95,700 93,400 -300 -0 3% +2,000 +2 1% Mining, Logging and Construction 7,300 7,300 7,400 0 0% -100 -1 4% Manufacturing 38,400 38,300 36,500 +100 +0 3% +1,900 +5 2% Durable Goods 26,700 26,600 25,000 +100 +0 4% +1,700 +6 8% Non-Durable Goods 11,700 11,700 11,500 0 0% +200 +1 7% Transportation, Warehousing, and Utilities 37,000 37,500 36,100 -500 -1 3% +900 +2 5% Wholesale Trade 8,400 8,400 8,200 0 0% +200 +2 4% Retail Trade 16,100 16,600 16,200 -500 -3 0% -100 -0 6% Transportation, Warehousing, and Utilities 12,500 12,500 11,700 0 0% +800 +6 8% Information 700 700 700 0 0% 0 0% Financial Activities 5,000 5,000 5,000 0 0% 0 0% Professional and Business Services 18,200 18,200 18,100 0 0% +100 +0 6% Education and Health Services 14,700 14,600 14,700 +100 +0 7% 0 0% Leisure and Hospitality 14,400 14,400 13,600 0 0% +800 +5 9% Other Services 5,400 5,300 5,200 +100 +1 9% +200 +3 9% Government 25,700 27,000 24,100 -1,300 -4 8% +1,600 +6 6% Federal Government 600 600 700 0 0% -100 -14 3% State Government 3,600 3,600 3,500 0 0% +100 +2 9% Local Government 21,500 22,800 19,900 -1,300 -5 7% +1,600 +8 0% Current month’s estimates are preliminary. All data are subject to revision. 26 SC Department of Employment and Workforce Labor Market Information Division Columbia, South Carolina 29202
NONFARM PAYROLL BY ECONOMIC SECTOR FLORENCE MSA JULY 2022 (NOT SEASONALLY ADJUSTED) JUNE 2022 TO JULY 2022 JULY 2021 TO JULY 2022 2022JULY 2022JUNE 2021JULY # CHANGE % CHANGE # CHANGE % CHANGE Total Nonfarm 90,100 90,300 89,700 -200 -0.2% +400 +0.5% Total Private 74,200 73,700 73,400 +500 +0 7% +800 +1 1% Goods Producing 14,400 14,200 14,100 +200 +1 4% +300 +2 1% Service-Providing 75,700 76,100 75,600 -400 -0 5% +100 +0 1% Private Service Providing 59,800 59,500 59,300 +300 +0 5% +500 +0 8% Trade, Transportation, and Utilities 19,300 19,100 19,400 +200 +1 1% -100 -0 5% Government 15,900 16,600 16,300 -700 -4 2% -400 -2 5% Federal Government 700 700 700 0 0% +00 0% State Government 4,100 4,200 4,300 -100 -2 4% -200 -4 7% Local Government 11,100 11,700 11,300 -600 -5 1% -200 -1 8% HILTON HEAD ISLAND-BLUFFTON MSA JULY 2022 (NOT SEASONALLY ADJUSTED) JUNE 2022 TO JULY 2022 JULY 2021 TO JULY 2022 2022JULY 2022JUNE 2021JULY # CHANGE % CHANGE # CHANGE % CHANGE Total Nonfarm 86,400 85,900 84,400 +500 +0.6% +2,000 +2.4% Total Private 75,000 74,500 73,100 +500 +0 7% +1,900 +2 6% Goods Producing 6,900 6,900 6,900 0 0% 0 0% Service-Providing 79,500 79,000 77,500 +500 +0 6% +2,000 +2 6% Private Service Providing 68,100 67,600 66,200 +500 +0 .7% +1,900 +2 9% Government 11,400 11,400 11,300 0 0% +100 +0 9% SUMTER MSA JULY 2022 (NOT SEASONALLY ADJUSTED) JUNE 2022 TO JULY 2022 JULY 2021 TO JULY 2022 2022JULY 2022JUNE 2021JULY # CHANGE % CHANGE # CHANGE % CHANGE Total Nonfarm 38,100 38,200 38,500 -100 -0.3% -400 -1.0% Total Private 32,200 32,000 32,500 +200 +0 6% -300 -0 9% Goods Producing 9,400 9,200 9,400 +200 +2 2% 0 0% Service-Providing 28,700 29,000 29,100 -300 -1 0% -400 -1 4% Private Service Providing 22,800 22,800 23,100 0 0% -300 -1 3% Manufacturing 6,700 6,600 6,800 +100 +1 5% -100 -1 5% Government 5,900 6,200 6,000 -300 -4 8% -100 -1 7% Federal Government 1,300 1,300 1,400 0 0% -100 -7 1% State Government 1,300 1,300 1,300 0 0% 0 0% Local Government 3,300 3,600 3,300 -300 -8 3% 0 0% 27 dew.sc.gov scworkforceinfo.com
ANNUAL LOCAL AREA UNEMPLOYMENT STATISTICS DATA 1976-2021 YEAR CIVILIAN NON-INSTITUTIONALPOPULATION LABOR FORCERATEPARTICIPATION(PERCENT) EMPLOYMENT-POPULATIONRATIO(PERCENT) LABOR FORCE EMPLOYMENT UNEMPLOYMENT UNEMPLOYMENTRATE(PERCENT) 1976 2,007,417 64 7 60 2 1,299,241 1,207,662 91,579 7 0 1977 2,061,250 64 4 60 0 1,327,423 1,237,495 89,928 6 8 1978 2,117,667 64 1 60 5 1,356,921 1,281,597 75,324 5 6 1979 2,169,417 63 4 60 2 1,375,201 1,306,773 68,428 5 0 1980 2,221,250 62 8 58 6 1,395,675 1,301,796 93,879 6 7 1981 2,266,583 63 2 58 0 1,432,219 1,314,907 117,312 8 2 1982 2,307,333 64 2 57 3 1,482,373 1,322,883 159,490 10 8 1983 2,341,083 63 2 56 9 1,479,137 1,333,162 145,975 9 9 1984 2,378,500 62 9 58 5 1,495,188 1,391,286 103,902 6 9 1985 2,426,500 63 8 59 5 1,548,924 1,443,612 105,312 6 8 1986 2,455,333 64 9 60 7 1,592,306 1,491,069 101,237 6 4 1987 2,495,333 65 4 61 8 1,631,897 1,542,170 89,727 5 5 1988 2,533,000 65 6 62 5 1,660,533 1,583,928 76,605 4 6 1989 2,566,000 66 0 62 9 1,693,438 1,615,009 78,429 4 6 1990 2,611,843 66 5 63 3 1,737,831 1,652,949 84,882 4 9 1991 2,663,759 66 3 62 3 1,767,123 1,659,196 107,927 6 1 1992 2,699,745 66 7 62 2 1,799,677 1,678,803 120,874 6 7 1993 2,739,480 66 7 61 8 1,826,650 1,693,483 133,167 7 3 1994 2,775,049 66 4 62 3 1,841,428 1,727,714 113,714 6 2 1995 2,813,952 66 2 62 8 1,864,221 1,768,540 95,681 5 1 1996 2,851,104 66 2 62 4 1,886,064 1,779,221 106,843 5 7 1997 2,897,839 66 3 63 3 1,920,244 1,834,337 85,907 4 5 1998 2,945,825 65 9 63 5 1,940,846 1,870,270 70,576 3 6 1999 2,989,560 65 5 62 8 1,958,598 1,877,345 81,253 4 1 2000 3,027,367 64 9 62 5 1,965,481 1,892,559 72,922 3 7 2001 3,064,191 63 4 60 0 1,941,956 1,839,246 102,710 5 3 2002 3,098,739 63 1 59 0 1,954,548 1,828,735 125,813 6 4 2003 3,133,915 63 8 59 2 1,999,485 1,855,599 143,886 7 2 2004 3,178,645 64 3 59 5 2,043,864 1,891,722 152,142 7 4 2005 3,234,049 64 0 59 4 2,071,111 1,919,644 151,467 7 3 2006 3,305,437 65 0 60 5 2,148,698 2,001,245 147,453 6 9 2007 3,374,548 63 9 60 0 2,155,198 2,024,493 130,705 6 1 2008 3,439,974 62 8 58 2 2,160,084 2,002,903 157,181 7 3 2009 3,490,448 62 1 55 0 2,166,737 1,919,307 247,430 11 4 2010 3,564,619 61 0 54 1 2,174,535 1,928,442 246,093 11 3 2011 3,612,048 60 5 54 2 2,185,171 1,957,493 227,678 10 4 2012 3,655,515 59 9 54 5 2,190,203 1,992,957 197,246 9 0 2013 3,704,281 59 3 54 9 2,197,876 2,034,404 163,472 7 4 2014 3,759,002 59 1 55 4 2,222,426 2,082,941 139,485 6 3 2015 3,822,409 59 3 55 8 2,267,837 2,134,087 133,750 5 9 2016 3,888,005 58 8 55 9 2,286,054 2,174,301 111,753 4 9 2017 3,897,645 58 0 55 6 2,261,766 2,166,708 95,058 4 2 2018 3,948,448 57 7 55 8 2,279,431 2,202,377 77,054 3 4 2019 4,002,601 58 0 56 4 2,321,189 2,256,313 64,876 2 8 2020 4,058,279 57 4 54 0 2,330,863 2,191,331 139,532 6 0 2021 4,117,555 57 4 55 1 2,364,366 2,269,813 94,553 4 0 28 SC Department of Employment and Workforce Labor Market Information Division Columbia, South Carolina 29202 LONG-RUN TRENDS
ANNUAL CURRENT EMPLOYMENT STATISTICS NONFARM PAYROLL 1939-2021 YEAR EMPLOYMENT YEAR EMPLOYMENT YEAR EMPLOYMENT YEAR EMPLOYMENT 1939 310,100 1960 582,500 1981 1,196,500 2002 1,795,400 1940 328,600 1961 587,000 1982 1,162,300 2003 1,799,100 1941 387,500 1962 609,800 1983 1,189,000 2004 1,826,600 1942 416,500 1963 630,600 1984 1,262,500 2005 1,862,900 1943 428,500 1964 651,500 1985 1,296,200 2006 1,905,700 1944 408,600 1965 686,000 1986 1,338,000 2007 1,945,000 1945 396,000 1966 734,900 1987 1,392,200 2008 1,926,300 1946 411,600 1967 754,500 1988 1,449,000 2009 1,814,400 1947 436,200 1968 782,900 1989 1,499,700 2010 1,811,300 1948 456,400 1969 819,800 1990 1,527,600 2011 1,832,500 1949 443,100 1970 842,000 1991 1,497,300 2012 1,864,300 1950 461,400 1971 862,600 1992 1,511,800 2013 1,901,000 1951 505,800 1972 920,300 1993 1,553,000 2014 1,951,300 1952 544,300 1973 984,000 1994 1,592,000 2015 2,006,700 1953 543,900 1974 1,015,800 1995 1,636,300 2016 2,055,300 1954 519,700 1975 982,600 1996 1,669,400 2017 2,096,100 1955 533,000 1976 1,038,100 1997 1,718,800 2018 2,154,800 1956 542,900 1977 1,081,700 1998 1,779,800 2019 2,189,600 1957 545,000 1978 1,137,500 1999 1,826,300 2020 2,081,600 1958 545,900 1979 1,176,000 2000 1,854,000 2021 2,146,300 1959 566,900 1980 1,188,800 2001 1,814,800 ANNUAL CURRENT EMPLOYMENT STATISTICS NONFARM PAYROLL 2007-2021 AVERAGE WEEKLY EARNINGS AVERAGE WEEKLY HOURS AVERAGE HOURLY EARNINGS 2007 $675 36 36 0 $18 76 2008 $669 28 35 6 $18 80 2009 $665 55 34 7 $19 18 2010 $692 17 34 8 $19 89 2011 $716 18 34 8 $20 58 2012 $705 16 35 1 $20 09 2013 $716 .15 34 .9 $20 52 2014 $726 23 34 5 $21 05 2015 $743 27 34 7 $21 42 2016 $762 80 34 5 $22 11 2017 $791 99 34 6 $22 89 2018 $829 36 34 6 $23 97 2019 $852 84 34 5 $24 72 2020 $888 31 34 1 $26 05 2021 $925 .41 34 3 $26 98 29 dew.sc.gov scworkforceinfo.com
1 . Household Survey: Nationally, there is a monthly Current Population Survey of about 60,000 households conducted by the Census Bureau for the Bureau of Labor Statistics (BLS) to determine employment status of the civilian population
3 . Seasonally Adjusted: Seasonal adjustment removes the effects of events that follow a regular pattern each year (i e tourist-related hiring and school closings in the summer) These adjustments make it easier to observe the cyclical and other nonseasonal movements in data over time
A job held by a person on unpaid leave during the reference week is not counted since they are not receiving pay A person on unpaid leave is counted as employed because they will return to their job Does not count selfemployed workers Does count self-employed workers Does not include agricultural workers Includes both agricultural and non-agricultural workers Does not count unpaid family workers Counts unpaid family workers if they worked at least 15 unpaid hours for a family business or family farm during the reference week
Technical Notes
The Current Population Survey (CPS), which is a Household Survey, is used to calculate LAUS Reference week is the Pay Period that includes the 12th of the month Reference week is the Calendar Week that includes the 12th of the month
STATISTICSEMPLOYMENTCURRENT(CES) LOCAL STATISTICSUNEMPLOYMENTAREA(LAUS)
Workers on strike during the entire reference period are not counted Workers on strike during the reference week are counted as employed in LAUS 30 SC Department of Employment and Workforce Labor Market Information Division Columbia, South Carolina 29202
2 Employer Survey: BLS conducts a monthly Current Employment Statistics survey of about 44,000 employers which yields national estimates of nonagricultural wage and salary employment, hours, and earnings by industry These data are processed by DEW to generate comparable data for the state and its metropolitan statistical areas
This information, along with other inputs, are used by DEW to operate the Local Area Unemployment Statistics program, which estimates the number of individuals employed and those not employed, but actively seeking employment for statewide and a variety of sub-state geographies
Data is published by Industry Data is published by County Counts Jobs Counts People Utilizes an Establishment Survey
4 . Not Seasonally Adjusted: Effects of regular or seasonal patterns have not been removed from these data
Subscribe
Do you need some help finding the data you need? Have a great idea for a research project you’d like to discuss with someone? We love to collaborate!
Interested in staying up to date with Trends as it’s released? by clicking here!
32 SC Department of Employment and Workforce Labor Market Information Division Columbia, South Carolina 29202 dew.sc.gov scworkforceinfo.com Find more information at scworkforceinfo.com
DATA TRENDS is prepared by the LMI Division of the S C Department of Employment and Workforce with funding provided by the US Department of Labor Featured data is prepared in conjunction with the Bureau of Labor Statistics and current month estimates are always preliminary, with all previous data subject to revision