

January/february 2024 Issue South Carolina Data
dew.sc.gov scworkforceinfo.com SC Department of Employment and Workforce Labor Market Information Division Columbia, South Carolina 29202
TRENDS
Interested in receiving the latest issue of Trends in your inbox every month? Click here to subscribe to our Trends mailing list!

2
Statewide Supply Gap Analysis: Interview with Labor Supply Analyst, Daniel Lyons . . . . . . . . . . . . . . . . . . . . . . . . . . . . . . . . 4 South Carolina’s Employment Situation (February 2024) . . . . . . . . . . . . . . . . . . . . . . . . . 8 Local Area Unemployment Statistics . . . . . . . . . . . . . . . . . . . . . . . . . . . . . . . . . . . . . . . . . . . . . 10 Current Employment Statistics — Seasonally Adjusted . . . . . . . . . . . . . . . . . . . . . . . . . . 16 Current Employment Statistics — Not Seasonally Adjusted . . . . . . . . . . . . . . . . . . . . . 18 Long-Run Trends 28 Technical Notes 32
AT A GLANCE
NOTE FROM THE DIRECTOR
Which of South Carolina’s largest cities has the lowest unemployment rate? Turn to page 13 to find out.
Welcome back to Trends! We have a double issue for you today that covers data from the first two months of 2024. In case you haven’t heard, April is Second Chance Month here at DEW and across the country The best way to make sure someone with a criminal record doesn’t reoffend is to help them find a stable job, and we partner with the Department of Corrections to help put that mission into practice DEW is hosting hiring events all over the state this month to serve this population, and we also offer tax credits and a bonding program that offers financial support to businesses that hire these individuals Please connect with Amy Hill here at DEW to learn more .
This month’s featured article is an interview with Daniel Lyons, who serves as the Labor Supply Analyst on my team . As we’ve mentioned previously, last year’s Act 67 requires the Coordinating Council for Workforce Development to produce a supply gap analysis that evaluates how well the credentials earned from South Carolina colleges and universities line up with the needs of our state’s employers. We’re in the final stages of putting that report together and hope to have a final published version available this summer. The numbers definitely raise some concerns, but also some opportunities, for South Carolina . Explore the work Daniel has done along with some of our preliminary findings. You’re not going to want to miss this.
And remember, we are your resource for anything data
Please don’t hesitate to connect with us at lmicustomerservice@dew.sc.gov – no question is too big or too small
Until next time!

 Bryan P Grady, Ph .D Assistant Executive Director for Labor Market Information SC Department of Employment and Workforce

3

Statewide Supply Gap Analysis: Interview with Labor Supply Analyst, Daniel Lyons
LMI spoke to Daniel Lyons, Labor Supply Analyst, primary author of the upcoming 2024 Statewide Supply Gap Analysis.
Hi Daniel, what can you tell us about your report?
"So, we’ve had numerous people in the education and industry community ask about some sort of account of positions and graduates and how to determine whether the South Carolina education system is meeting the needs of local employers. The Statewide Education and Workforce Act (Act 67) – which created my current position –requires the Coordinating Council for Workforce Development to produce a supply gap analysis as part of its Unified State Plan. That sort of mandate allowed me to go more in-depth, bring in more variables and provide a better model for joining these two different data sources. I’m sure, in this interview, we’ll talk about some of the complications that are inherent in that.
But the overall idea is to compare annual graduates from the South Carolina higher education system to the specific openings that require educational credentials."
Who do you see as your audience?
"I hope lots of people will be interested. I would expect people in education, policymakers, people who are developing curriculums, and working on the programs and skills that we offer through our education system…also employers who are trying to decide whether South Carolina is a good fit and if our workforce matches what their needs are. Another example would also be students and student advisors who are there to help them understand what occupations are in demand in the state."
Where did the data for this come from?
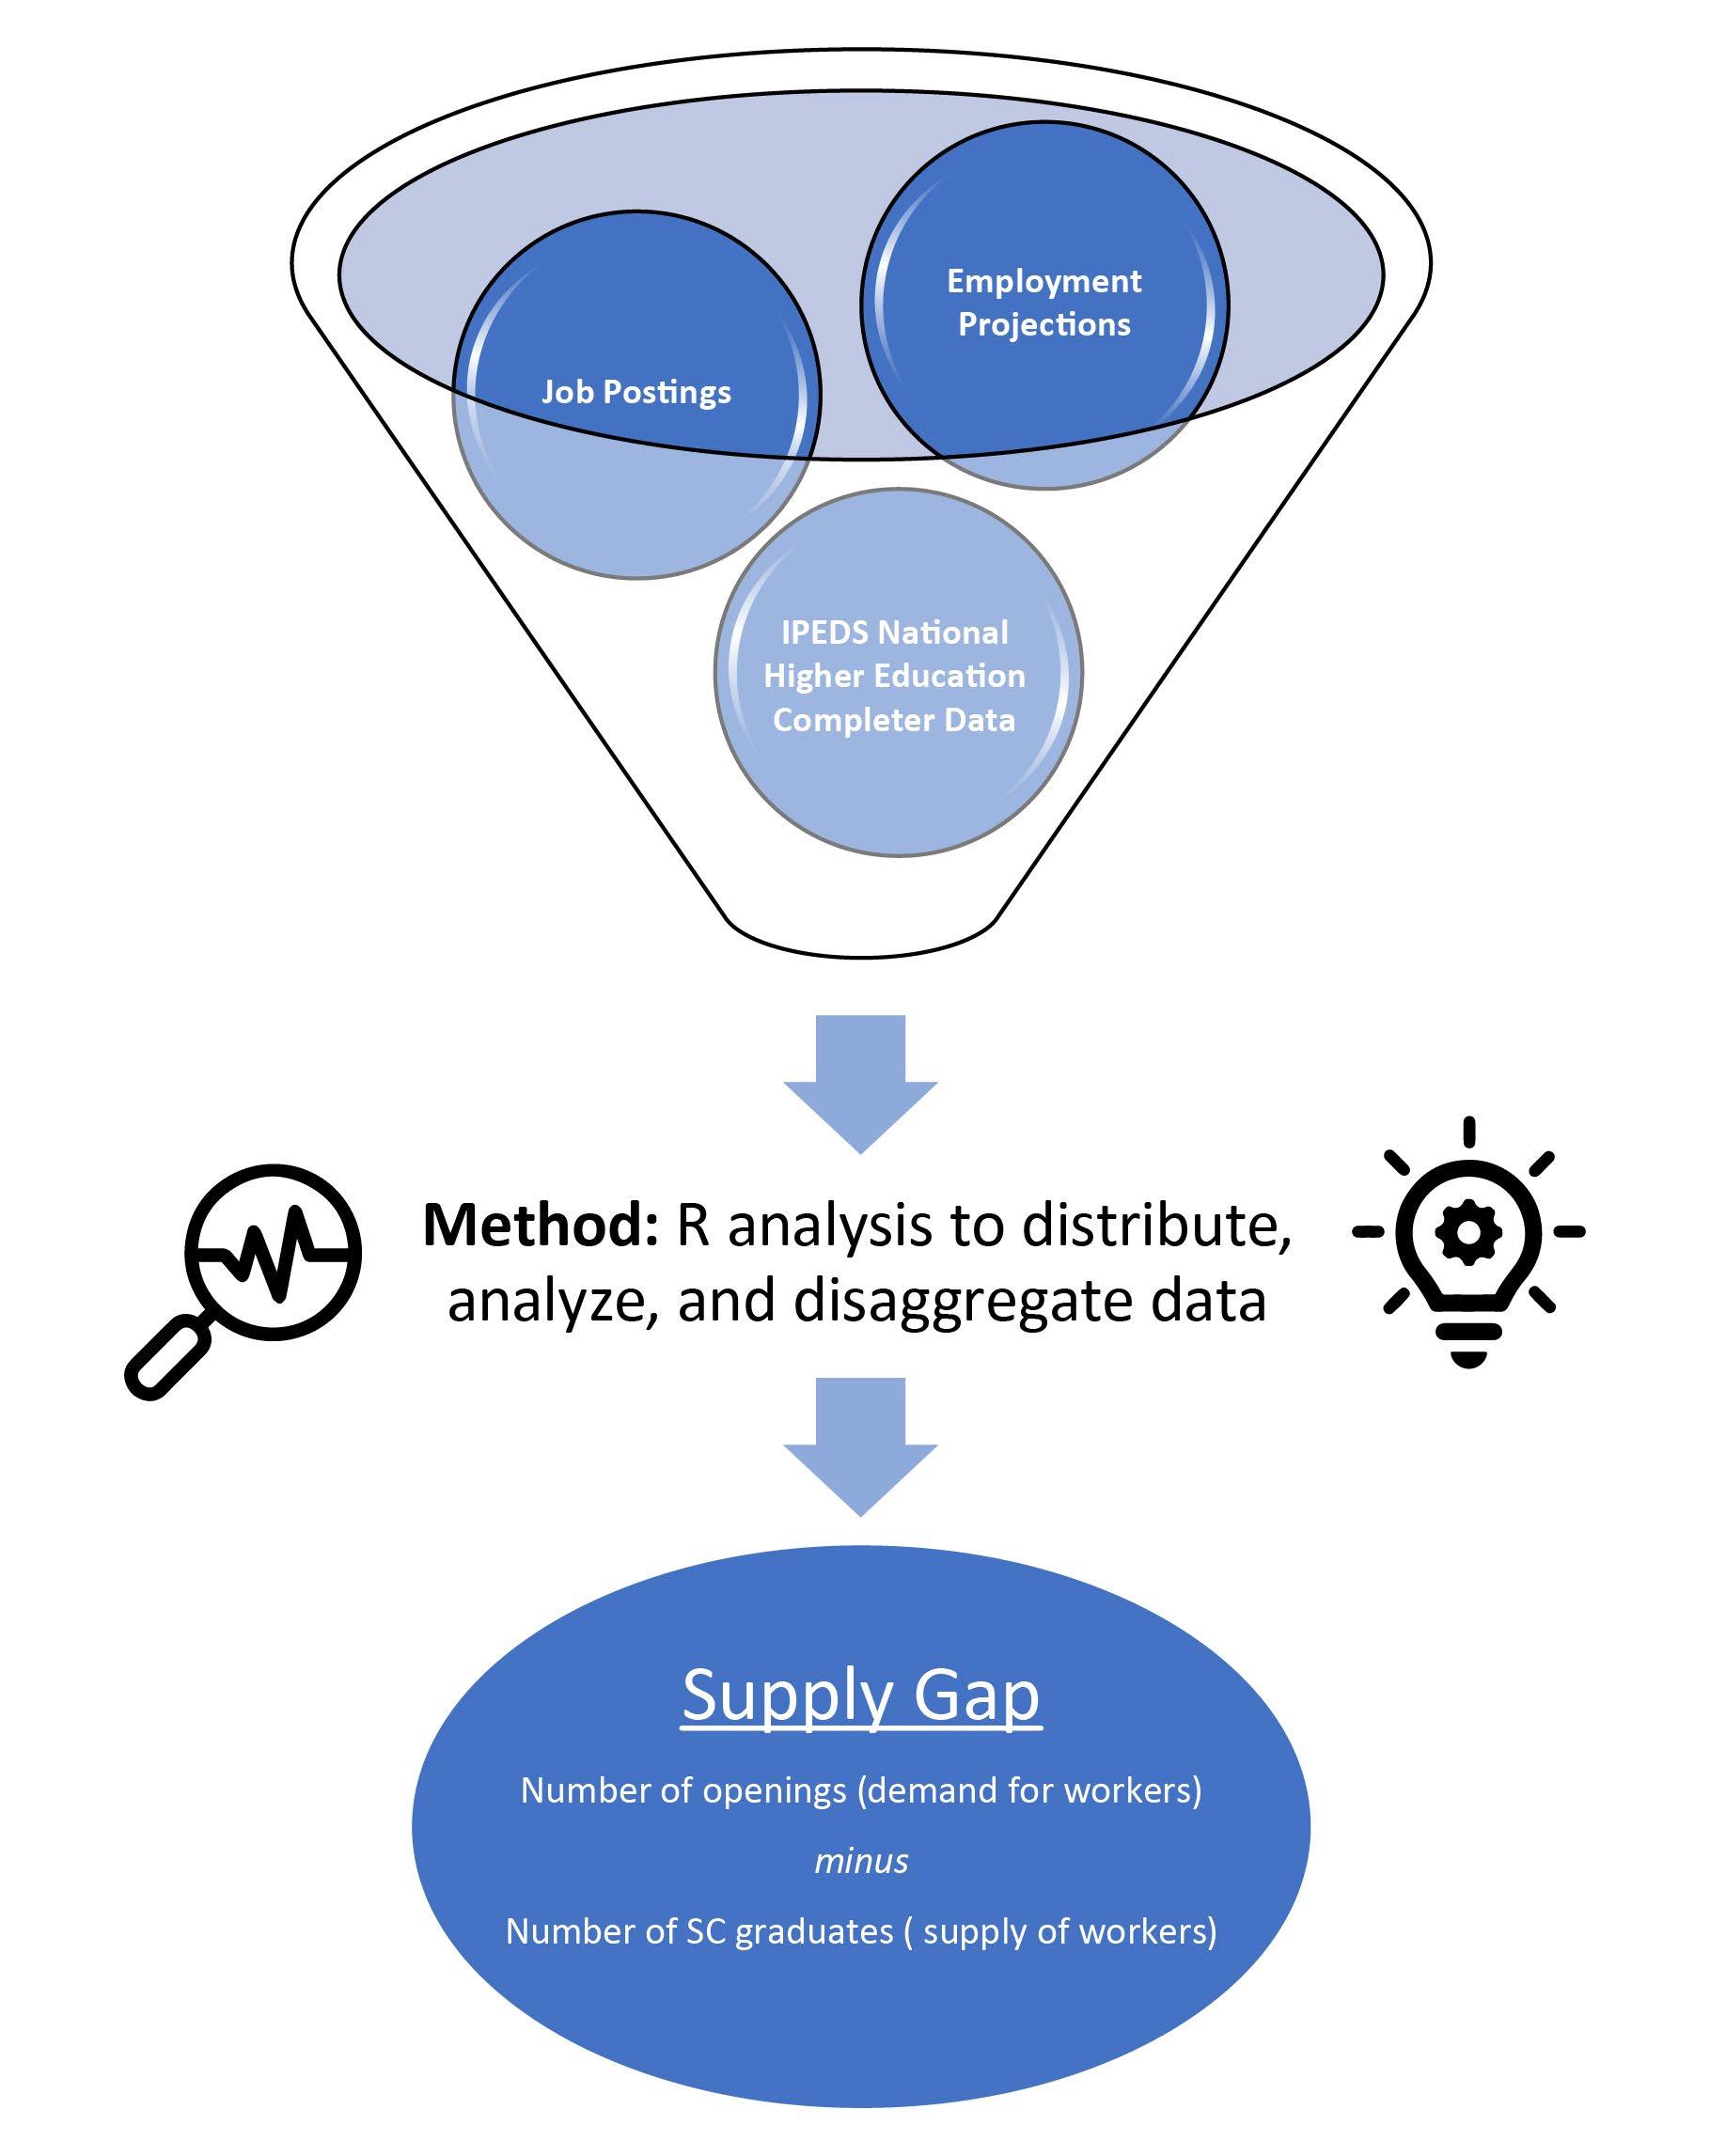
"The data came from two sources: one is the detailed employment projections data, which we get through Lightcast, a private contractor that provides it via a very clean method. And then also from the National Higher Education System. They have a national database of graduate totals that I used to get all the data for this project."
I know this is very statistically rigorous work, but could you give us a layman’s explanation of your methodology?
"Sure, we have these two data sources, one of them is providing graduates by academic program and then we want to compare that to occupation-level data on the openings… so a lot of the methodology was getting that graduate data into that format so we can directly compare them. The methodology takes these academic programs, and we build the labor market model around people’s preferences for more specialized and higher-paying occupations. Then we take those graduates and map them over to distribute them into occupations, sum all those graduates up at the occupation level to provide a comparable difference."
5
dew.sc.gov scworkforceinfo.com
6 SC Department of Employment and Workforce Labor Market Information Division Columbia, South Carolina 29202
Can you share some of your major findings?
"I think one of the most surprising things about this project is how reliant South Carolina is on workers coming in with high-demand educational credentials. The job growth in the state has reached a point where the higher education system isn’t producing enough graduates to meet the openings. To be clear, not every occupation has a supply gap, but when the data is aggregated statewide, you’ll see that there is a significant supply gap. Then, when you look at different career clusters, there’s a supply gap in those aggregations too. If there’s demand for workers with a higher education, we see a significant gap."
Is there anything the analysis doesn’t cover?
"As I mentioned, this study looks at occupations that require some level of higher education. The scope of the report is confined to that—occupations that don’t typically require a higher education are not covered by the report. It also doesn’t include a specific type of graduate, which come from programs that naturally lead to occupations that are not thought to require higher post-secondary education, though the degree can still give them an advantage over other candidates. It’s just not possible to map high school graduates onto careers like we do in this report."
And there’s a plan to do this annually, right?
"That’s currently our plan! This is the first one, so we had a lot of legwork going into developing it and figuring out exactly how we were going to execute this methodology, figure out our best data sources, and determining if there were other information out there. Now we hope to continue to do this going forward. Building it and improving it every year from now on."
What changes do you see for future editions?
"One of the biggest improvements that we can see that could possibly go into this is also through Act 67. So, starting this year, every employer in the state is required to submit occupational classification data for all their workers. We can combine that with education data and instead of modeling graduates to occupations, we can take the real-world career paths of the people in the state and use that for the basis for how we distribute graduates into occupations. That’s a long way off, but it’ll be great to have that clear data."
When can interested readers look forward to the release of your report?
"Even as we interview, I’m finalizing our internal draft which I hope will be the last or second-to-last iteration. Then, we just require some external feedback. So, I think you can look forward to it in the coming weeks!”
Thank you, Daniel!
(Note: This interview has been edited for length and clarity.)
7
dew.sc.gov scworkforceinfo.com

South Carolina’s Employment Situation (February 2024)
Household Survey1 (Local Area Unemployment Statistics)
EMPLOYMENT: The seasonally adjusted, monthly survey of households estimated the number of South Carolinians working decreased to 2,396,234
• That is a decrease of 280 people over the January 2024 estimate
• That is a significant increase of 41,106 people over the February 2023 estimate
UNEMPLOYMENT: The estimate of unemployed people increased to 76,434
• That is an increase of 1,109 people from January’s estimate and an increase of 3,437 from the February 2023 estimate
• The state’s seasonally adjusted unemployment rate increased to 3 1 percent from January’s estimate of 3 0 percent
• Nationally, the unemployment rate increased to 3 9 percent, according to the Current Population Survey
LABOR FORCE: The state’s estimated labor force (people working plus unemployed people looking for work) increased to 2,472,668
• That is an increase of 829 people over the January 2024 estimate
• That is a significant increase of 44,543 individuals over the February 2023 estimate
Employer Survey2 (Current Employment Statistics)
NONAGRICULTURAL EMPLOYMENT BY INDUSTRY (SEASONALLY ADJUSTED 3 )
The monthly survey of businesses in South Carolina marked an estimated increase of 4,400 nonfarm payroll jobs over the month to a level of 2,351,300.
• Industries reporting gains were Trade, Transportation, and Utilities (+2,000); Leisure and Hospitality (+1,500); Government (+1,300); Education and Health Services (+1,100); Other Services (+800); Manufacturing (+500); and Information (+100).
• The Professional and Business Services (-2,700); and Financial Activities (-200) industries declined
• The Construction industry marked no change over the month
From February 2023 to February 2024, South Carolina’s economy saw an increase 67,600 seasonally adjusted, nonfarm jobs
• Industries making strong growth were Education and Health Services (+17,400); Leisure and Hospitality (+15,400); Professional and Business Services (+6,600); Government (+6,300); Other Services (+5,600); Trade, Transportation, and Utilities (+5,500); Construction (+5,300); Manufacturing (+3,400); and Financial Activities (+3,200)
• Information (-1,100) declined
SC Department of Employment and Workforce Labor Market Information Division Columbia, South Carolina 29202

NONAGRICULTURAL EMPLOYMENT BY INDUSTRY (NOT SEASONALLY ADJUSTED 4 )
Not seasonally adjusted, nonfarm payroll employment increased by 23,500 from January 2024 to February 2024 for a total of 2,337,600
• Government (+7,700); Leisure and Hospitality (+5,000); Education and Health Services (+3,900); Professional and Business Services (+2,600); Trade Transportation and Utilities (+1,900); Other Services (+1,200); Manufacturing (+900); and Construction (+500) industries increased .
• The Financial Activities industry decreased (-200)
• The Mining and Logging and Information industries showed no change
Since February 2023, not seasonally adjusted, nonfarm jobs were up 66,300 in South Carolina
• Industries making strong annual gains were Educational and Health Services (+17,300); Leisure and Hospitality (+11,300); Professional and Business Services (+7,900); Government (+7,700); Construction (+6,000); Trade, Transportation and Utilities (+5,700); Other Services (+5,700); Financial Activities (+3,400); Manufacturing (+2,700); and Mining and Logging (+100) .
• The Information industry (-1,500) declined.
dew.sc.gov scworkforceinfo.com
10 SC Department of Employment and Workforce Labor Market Information Division Columbia, South Carolina 29202 4.7% 3.8% 6.8% 3.4% 6.3% 5.7% 3.6% 3.9% 3.0% 4.7% 4.9% 3.9% 4.6% 3.6% 3.2% 3.8% 4.7% 3.3% 4.7% 3.5% 3.5% 3.7% 4.0% 3.8% 4.9% 3.0% 4.6% 3.6% 3.5% 4.9% 3.6% 3.6% 3.5% 3.5% 4.5% 4.3% 3.4%
Local Area Unemployment Statistics
NOTE: Current month’s estimates are preliminary. All data are subject to revision. Population data are not seasonally adjusted.
CIVILIAN NON-INSTITUTIONAL POPULATION CIVILIAN LABOR FORCE TOTAL PERCENT OF POPULATION EMPLOYMENT UNEMPLOYMENT TOTAL PERCENT OF POPULATION TOTAL RATE (%) 4,332,006 2,472,668 57.1% 2,396,234 55.3% 76,434 3.1%
LAUS EMPLOYMENT ESTIMATES (SEASONALLY ADJUSTED)
11 dew.sc.gov scworkforceinfo.com
Unemployment Rate by County 3.3% 3.0% 3.9% 3.9% 4.9% 3.6% 4.3% 4.5% 5.2% 6.7% 5.7%
STATE OF SOUTH CAROLINA
LOCAL AREA UNEMPLOYMENT ESTIMATES BY COUNTY (NOT SEASONALLY ADJUSTED)
FEBRUARY 2024 JANUARY 2024 FEBRUARY 2023 AREA LABOR FORCE EMPLOYMENT UNEMPLOYMENT LABOR FORCE EMPLOYMENT UNEMPLOYMENT LABOR FORCE EMPLOYMENT UNEMPLOYMENT LEVEL RATE (%) LEVEL RATE (%) LEVEL RATE (%) Abbeville County ↑ 9,626 9,177 449 4.7% 9,548 9,171 377 3.9% 9,585 9,164 421 4.4% Aiken County ↑ 74,281 71,470 2,811 3.8% 73,621 71,111 2,510 3.4% 73,078 70,307 2,771 3.8% Allendale County ↓ 2,386 2,223 163 6.8% 2,288 2,130 158 6.9% 2,235 2,094 141 6.3% Anderson County ↑ 94,698 91,441 3,257 3.4% 94,179 91,235 2,944 3.1% 93,265 90,016 3,249 3.5% Bamberg County ↑ 4,689 4,393 296 6.3% 4,577 4,300 277 6.1% 4,559 4,296 263 5.8% Barnwell County ↑ 7,649 7,215 434 5.7% 7,564 7,148 416 5.5% 7,456 7,086 370 5.0% Beaufort County ↑ 80,744 77,808 2,936 3.6% 79,635 77,088 2,547 3.2% 76,965 74,046 2,919 3.8% Berkeley County ↑ 116,885 113,058 3,827 3.3% 116,239 112,806 3,433 3.0% 113,027 109,219 3,808 3.4% Calhoun County ↑ 6,730 6,465 265 3.9% 6,583 6,362 221 3.4% 6,435 6,175 260 4.0% Charleston County ↑ 229,805 222,952 6,853 3.0% 227,938 221,887 6,051 2.7% 221,941 214,980 6,961 3.1% Cherokee County ↑ 22,763 21,694 1,069 4.7% 22,632 21,602 1,030 4.6% 24,455 23,379 1,076 4.4% Chester County ↑ 13,793 13,120 673 4.9% 13,693 13,044 649 4.7% 13,488 12,860 628 4.7% Chesterfield County ↑ 21,532 20,700 832 3.9% 21,175 20,398 777 3.7% 21,148 20,342 806 3.8% Clarendon County ↑ 12,348 11,774 574 4.6% 12,050 11,522 528 4.4% 11,843 11,247 596 5.0% Colleton County ↑ 16,457 15,870 587 3.6% 16,248 15,720 528 3.2% 15,884 15,232 652 4.1% Darlington County ↑ 30,836 29,644 1,192 3.9% 30,581 29,458 1,123 3.7% 29,969 28,779 1,190 4.0% Dillon County ↑ 13,180 12,539 641 4.9% 12,901 12,284 617 4.8% 12,921 12,250 671 5.2% Dorchester County ↑ 84,839 82,143 2,696 3.2% 84,328 81,881 2,447 2.9% 81,922 79,295 2,627 3.2% Edgefield County ↑ 10,486 10,090 396 3.8% 10,244 9,894 350 3.4% 10,212 9,807 405 4.0% Fairfield County - 9,616 9,160 456 4.7% 9,507 9,064 443 4.7% 9,229 8,785 444 4.8% Florence County ↑ 68,299 65,823 2,476 3.6% 68,182 65,874 2,308 3.4% 66,676 64,263 2,413 3.6% Georgetown County ↑ 26,546 25,417 1,129 4.3% 26,025 25,008 1,017 3.9% 25,932 24,799 1,133 4.4% Greenville County ↑ 269,255 260,291 8,964 3.3% 268,123 260,006 8,117 3.0% 265,166 256,477 8,689 3.3% Greenwood County ↑ 30,315 28,883 1,432 4.7% 29,867 28,765 1,102 3.7% 30,036 28,772 1,264 4.2% Hampton County ↑ 8,274 7,985 289 3.5% 8,032 7,778 254 3.2% 7,840 7,560 280 3.6% Horry County - 159,097 151,876 7,221 4.5% 157,335 150,315 7,020 4.5% 151,805 144,559 7,246 4.8% Jasper County ↑ 14,010 13,515 495 3.5% 13,709 13,283 426 3.1% 13,248 12,796 452 3.4% Kershaw County ↑ 30,721 29,592 1,129 3.7% 30,318 29,307 1,011 3.3% 29,543 28,403 1,140 3.9% Lancaster County ↑ 44,966 43,165 1,801 4.0% 44,647 42,966 1,681 3.8% 44,120 42,338 1,782 4.0% Laurens County ↑ 31,220 30,029 1,191 3.8% 30,932 29,845 1,087 3.5% 30,668 29,465 1,203 3.9% Lee County ↑ 6,617 6,294 323 4.9% 6,491 6,204 287 4.4% 6,347 6,027 320 5.0% Lexington County ↑ 157,864 153,087 4,777 3.0% 156,409 152,173 4,236 2.7% 152,182 147,367 4,815 3.2% Marion County ↑ 12,802 12,133 669 5.2% 12,658 12,022 636 5.0% 12,581 11,890 691 5.5% Marlboro County ↓ 7,263 6,774 489 6.7% 7,278 6,769 509 7.0% 8,061 7,413 648 8.0% McCormick County ↑ 3,507 3,347 160 4.6% 3,468 3,334 134 3.9% 3,579 3,435 144 4.0% Newberry County ↑ 19,267 18,574 693 3.6% 18,689 18,035 654 3.5% 19,272 18,630 642 3.3% Oconee County ↑ 35,842 34,591 1,251 3.5% 35,373 34,266 1,107 3.1% 34,333 33,115 1,218 3.5% Orangeburg County - 33,678 32,015 1,663 4.9% 33,305 31,669 1,636 4.9% 32,983 31,284 1,699 5.2% Pickens County ↑ 60,048 57,908 2,140 3.6% 59,759 57,819 1,940 3.2% 59,138 57,034 2,104 3.6% Richland County ↑ 205,273 197,836 7,437 3.6% 204,766 197,805 6,961 3.4% 198,452 191,305 7,147 3.6% Saluda County ↑ 8,961 8,649 312 3.5% 8,493 8,228 265 3.1% 8,350 8,045 305 3.7% Spartanburg County ↑ 159,970 154,367 5,603 3.5% 159,649 154,543 5,106 3.2% 156,789 151,319 5,470 3.5% Sumter County ↑ 41,519 39,656 1,863 4.5% 41,345 39,594 1,751 4.2% 42,290 40,340 1,950 4.6% Union County ↑ 11,539 11,040 499 4.3% 11,514 11,041 473 4.1% 11,391 10,813 578 5.1% Williamsburg County ↑ 10,245 9,657 588 5.7% 10,158 9,597 561 5.5% 10,668 10,074 594 5.6% York County ↑ 152,473 147,239 5,234 3.4% 151,878 147,031 4,847 3.2% 149,938 144,797 5,141 3.4% Current month's estimates are preliminary All data are subject to revision ↑ Unemployment Rate Up Substate estimates are not seasonally adjusted and may diverge from state-level figures. ↓ Unemployment Rate Down Unemployment Rate = 12 SC Department of Employment and Workforce Labor Market Information Division Columbia, South Carolina 29202
Current month’s estimates are preliminary All data are subject to revision
Substate estimates are not seasonally adjusted and may diverge from state-level figures.
FEBRUARY 2024 JANUARY 2024 FEBRUARY 2023 METROPOLITAN STATISTICAL AREA LABOR FORCE EMPLOYMENT UNEMPLOYMENT LABOR FORCE EMPLOYMENT UNEMPLOYMENT LABOR FORCE EMPLOYMENT UNEMPLOYMENT LEVEL RATE (%) LEVEL RATE (%) LEVEL RATE (%) Charleston-North Charleston ↑ 431,529 418,153 13,376 3.1% 428,505 416,574 11,931 2.8% 416,890 403,494 13,396 3.2% Columbia ↑ 419,165 404,789 14,376 3.4% 416,076 402,939 13,137 3.2% 404,191 390,080 14,111 3.5% Florence ↑ 99,135 95,467 3,668 3.7% 98,763 95,332 3,431 3.5% 96,645 93,042 3,603 3.7% GreenvilleAnderson-Mauldin ↑ 455,221 439,669 15,552 3.4% 452,993 438,905 14,088 3.1% 448,237 432,992 15,245 3.4% Hilton Head IslandBluffton-Beaufort ↑ 94,754 91,323 3,431 3.6% 93,344 90,371 2,973 3.2% 90,213 86,842 3,371 3.7% Myrtle BeachConway-North Myrtle Beach - 218,201 208,123 10,078 4.6% 216,130 206,273 9,857 4.6% 208,494 198,459 10,035 4.8% Spartanburg ↑ 171,509 165,407 6,102 3.6% 171,163 165,584 5,579 3.3% 168,180 162,132 6,048 3.6% Sumter ↑ 41,519 39,656 1,863 4.5% 41,345 39,594 1,751 4.2% 42,290 40,340 1,950 4.6% Augusta-Richmond County, GA (SC portion) ↑ 84,767 81,560 3,207 3.8% 83,865 81,005 2,860 3.4% 83,290 80,114 3,176 3.8% Charlotte-Concord-Gastonia, NC (SC portion) ↑ 211,232 203,524 7,708 3.6% 210,218 203,041 7,177 3.4% 207,546 199,995 7,551 3.6%
LOCAL AREA UNEMPLOYMENT ESTIMATES BY MSA (NOT SEASONALLY ADJUSTED)
FEBRUARY 2024 JANUARY 2024 FEBRUARY 2023 CITIES AND TOWNS ABOVE 25,000 POPULATION LABOR FORCE EMPLOYMENT UNEMPLOYMENT LABOR FORCE EMPLOYMENT UNEMPLOYMENT LABOR FORCE EMPLOYMENT UNEMPLOYMENT LEVEL RATE (%) LEVEL RATE (%) LEVEL RATE (%) Aiken - 13,013 12,501 512 3.9% 12,938 12,439 499 3.9% 12,836 12,298 538 4.2% Anderson ↑ 11,980 11,488 492 4.1% 11,938 11,462 476 4.0% 11,784 11,309 475 4.0% Bluffton ↑ 13,709 13,276 433 3.2% 13,509 13,153 356 2.6% 13,040 12,634 406 3.1% Charleston ↑ 81,092 78,648 2,444 3.0% 80,506 78,287 2,219 2.8% 78,398 75,846 2,552 3.3% Columbia ↑ 59,510 57,084 2,426 4.1% 59,298 57,073 2,225 3.8% 57,604 55,199 2,405 4.2% Conway ↓ 10,787 10,258 529 4.9% 10,684 10,153 531 5.0% 10,299 9,764 535 5.2% Florence ↑ 20,093 19,356 737 3.7% 20,077 19,371 706 3.5% 19,606 18,897 709 3.6% Fort Mill ↑ 13,710 13,274 436 3.2% 13,658 13,255 403 3.0% 13,447 13,054 393 2.9% Goose Creek ↑ 22,161 21,421 740 3.3% 22,045 21,373 672 3.0% 21,420 20,694 726 3.4% Greenville ↑ 38,576 37,270 1,306 3.4% 18,940 18,350 590 3.1% 37,973 36,724 1,249 3.3% Greer ↑ 18,950 18,361 589 3.1% 15,356 14,999 357 2.3% 18,653 18,070 583 3.1% Hilton Head Island ↑ 18,102 17,503 599 3.3% 17,889 17,341 548 3.1% 17,271 16,657 614 3.6% Mauldin ↑ 14,278 13,829 449 3.1% 14,230 13,813 417 2.9% 14,080 13,626 454 3.2% Mount Pleasant ↑ 54,258 52,816 1,442 2.7% 53,828 52,564 1,264 2.3% 52,353 50,928 1,425 2.7% Myrtle Beach ↓ 16,621 15,766 855 5.1% 16,453 15,604 849 5.2% 15,866 15,006 860 5.4% North Augusta ↑ 10,928 10,563 365 3.3% 10,822 10,510 312 2.9% - - -North Charleston ↑ 60,559 58,641 1,918 3.2% 60,087 58,382 1,705 2.8% 58,504 56,559 1,945 3.3% Rock Hill ↑ 41,263 39,708 1,555 3.8% 41,117 39,652 1,465 3.6% 40,553 39,049 1,504 3.7% Simpsonville ↑ 14,216 13,743 473 3.3% 27,080 26,283 797 2.9% 40,553 39,049 1,504 3.7% Spartanburg ↑ 17,119 16,388 731 4.3% 17,098 16,407 691 4.0% 16,790 16,065 725 4.3% Summerville ↑ 27,232 26,367 865 3.2% 27,080 26,283 797 2.9% 26,324 25,453 871 3.3% Sumter ↑ 14,858 14,121 737 5.0% 14,811 14,099 712 4.8% 15,130 14,365 765 5.1%
LOCAL AREA UNEMPLOYMENT ESTIMATES BY MUNICIPALITY (NOT SEASONALLY ADJUSTED)
13 dew.sc.gov scworkforceinfo.com
Monthly Unemployment since January 2020
Monthly Unemployment Rate since January 2020
UNEMPLOYMENT MONTH 0 25,000 50,000 75,000 100,000 125,000 150,000 175,000 200,000 225,000 250,000 275,000 300,000 UNEMPLOYMENT RATE (PERCENT)
MONTH 0.0 2 0 4 0 6.0 8 0 10 0 12 0 14.0 14 SC Department of Employment and Workforce Labor Market Information Division Columbia, South Carolina 29202
LABOR FORCE PARTICIPATION RATE (PERCENT) MONTH Monthly Labor Force Participation Rate since January 2020 56 4 56 6 56.8 57.0 57 2 57 4 57 6 57 8 58.0 58.2 EMPLOYMENT Monthly Employment since
MONTH 1,800,000 1,900,000 2,000,000 2,100,000 2,200,000 2,300,000 2,400,000 2,500,000 15 dew.sc.gov scworkforceinfo.com
January 2020
Seasonally Adjusted — Year-Over-Year Change
NOTE: Employment estimates have been rounded to the nearest hundred. Sum of detail may not equal totals due to rounding or the exclusion of certain industries from publication. All data are subject to revision.
NONFARM PAYROLL BY METROPOLITAN STATISTICAL AREA SEASONALLY ADJUSTED FEBRUARY 2024 JANUARY 2024 TO FEBRUARY 2024 FEBRUARY 2023 TO FEBRUARY 2024 AREA FEBRUARY 2024 JANUARY 2024 FEBRUARY 2023 # CHANGE % CHANGE # CHANGE % CHANGE Statewide 2,351,300 2,346,900 2,283,700 +4,400 +0.2% +67,600 +3.0% Charleston-North Charleston 424,700 422,800 406,800 +1,900 +0.4% +17,900 +4.4% Columbia 431,600 431,200 420,400 +400 +0.1% +11,200 +2.7% Florence 97,000 96,800 94,800 +200 +0.2% +2,200 +2.3% Greenville-Anderson-Mauldin 464,400 465,000 457,100 -600 -0.1% +7,300 +1.6% Hilton Head Island-Bluffton-Beaufort 91,000 90,800 87,600 +200 +0.2% +3,400 +3.9% Myrtle Beach-Conway-North Myrtle Beach 199,200 198,500 189,800 +700 +0.4% +9,400 +5.0% Spartanburg 173,800 173,600 169,100 +200 +0.1% +4,700 +2.8% Sumter 38,500 38,400 37,800 +100 +0.3% +700 +1.9%
16 SC Department of Employment and Workforce Labor Market Information Division Columbia, South Carolina 29202
CURRENT EMPLOYMENT STATISTICS
+1.6% +2.8% +2.7% +1.9% +2.3% +5.0% +4.4% +3.9%
NONFARM PAYROLL BY ECONOMIC SECTOR
SEASONALLY ADJUSTED (IN THOUSANDS)
FEBRUARY 2024 JANUARY 2024 TO FEBRUARY 2024 FEBRUARY 2023 TO FEBRUARY 2024 FEBRUARY 2024 JANUARY 2024 FEBRUARY 2023 # CHANGE % CHANGE # CHANGE % CHANGE Total Nonfarm 2,351.3 2,346.9 2,283.7 +4.4 +0.2% +67.6 +3.0% Total Private 1,974 4 1,971 3 1,913 1 +3 1 +0.2% +61 3 +3.2% Goods Producing 386 8 386 3 378 1 +0.5 +0.1% +8 7 +2.3% Mining, Logging and Construction 120.5 120.5 115.2 0 0 0.0% +5.3 +4.6% Mining and Logging 4.5 4.5 4.5 0 0 0.0% 0 0 0.0% Construction 116 0 116 0 110 7 0 0 0.0% +5.3 +4.8% Manufacturing 266 3 265.8 262 9 +0.5 +0.2% +3 4 +1.3% Durable Goods 163 2 162.5 158.9 +0 7 +0.4% +4 3 +2.7% Non-Durable Goods 103 1 103 3 104 0 -0 2 -0.2% -0 9 -0.9% Service-Providing 1,964.5 1,960 6 1,905.6 +3 9 +0.2% +58.9 +3.1% Private Service Providing 1,587.6 1,585.0 1,535.0 +2 6 +0.2% +52.6 +3.4% Trade, Transportation, and Utilities 445.0 443 0 439.5 +2 0 +0.5% +5.5 +1.3% Wholesale Trade 83 4 83 7 81.5 -0 3 -0.4% +1 9 +2.3% Retail Trade 267 2 265.9 263 8 +1 3 +0.5% +3 4 +1.3% Transportation, Warehousing, and Utilities 94 4 93 4 94 2 +1 0 +1.1% +0 2 +0.2% Information 28 7 28 6 29 8 +0 1 +0.3% -1 1 -3.7% Financial Activities 123 6 123 8 120 4 -0 2 -0.2% +3 2 +2.7% Finance and Insurance 87 8 87 9 86 2 -0 1 -0.1% +1 6 +1.9% Real Estate and Rental and Leasing 35.8 35.9 34 2 -0 1 -0.3% +1 6 +4.7% Professional and Business Services 315.5 318 2 308 9 -2 7 -0.8% +6 6 +2.1% Professional, Scientific, and Technical Services 132.5 132 2 126 0 +0 3 +0.2% +6.5 +5.2% Management of Companies and Enterprises 24 8 24 7 23 7 +0 1 +0.4% +1 1 +4.6% Administrative and Support and Waste Management and Remediation Services 158.2 161 3 159.2 -3 1 -1.9% -1 0 -0.6% Education and Health Services 292 9 291 8 275.5 +1 1 +0.4% +17 4 +6.3% Educational Services 47 8 47 8 46 9 0 0 0.0% +0 9 +1.9% Health Care Services 245.1 244 0 228 6 +1 1 +0.5% +16.5 +7.2% Leisure and Hospitality 291 2 289 7 275.8 +1.5 +0.5% +15.4 +5.6% Arts, Entertainment, and Recreation 38 0 37 4 34 8 +0 6 +1.6% +3 2 +9.2% Accommodation and Food Services 253.2 252.3 241 0 +0 9 +0.4% +12 2 +5.1% Other Services 90 7 89 9 85.1 +0 8 +0.9% +5.6 +6.6% Government 376 9 375.6 370 6 +1 3 +0.3% +6 3 +1.7% Federal Government 37 3 37 1 36 0 +0 2 +0.5% +1 3 +3.6% State Government 108 2 108 7 108 6 -0.5 -0.5% -0 4 -0.4% Local Government 231 4 229 8 226 0 +1 6 +0.7% +5.4 +2.4% 17 dew.sc.gov scworkforceinfo.com
CURRENT EMPLOYMENT STATISTICS
Not Seasonally Adjusted — Year-Over-Year Change
NOTE: Employment estimates have been rounded to the nearest hundred. Sum of detail may not equal totals due to rounding or the exclusion of certain industries from publication. All data are subject to revision.
NONFARM PAYROLL BY METROPOLITAN STATISTICAL AREA NOT SEASONALLY ADJUSTED FEBRUARY 2024 JANUARY 2024 TO FEBRUARY 2024 FEBRUARY 2023 TO FEBRUARY 2024 AREA FEBRUARY 2024 JANUARY 2024 FEBRUARY 2023 # CHANGE % CHANGE # CHANGE % CHANGE Statewide 421,700 416,700 404,300 +5,000 +1.2% +17,400 +4.3% Charleston-North Charleston 430,400 427,100 419,700 +3,300 +0.8% +10,700 +2.5% Columbia 96,500 96,300 94,500 +200 +0.2% +2,000 +2.1% Florence 463,300 459,600 457,400 +3,700 +0.8% +5,900 +1.3% Greenville-Anderson-Mauldin 89,500 88,700 85,800 +800 +0.9% +3,700 +4.3% Hilton Head Island-Bluffton-Beaufort 192,700 189,900 183,800 +2,800 +1.5% +8,900 +4.8% Myrtle Beach-Conway-North Myrtle Beach 2,337,600 2,314,100 2,271,300 +23,500 +1.0% +66,300 +2.9% Spartanburg 173,400 172,400 169,200 +1,000 +0.6% +4,200 +2.5% Sumter 38,400 38,200 37,800 +200 +0.5% +600 +1.6%
18 SC Department of Employment and Workforce Labor Market Information Division Columbia, South Carolina 29202
+4.3% +2.5% +2.1% +1.6% +1.3% +2.9% +2.5% +4.8%
NONFARM PAYROLL BY ECONOMIC SECTOR NOT SEASONALLY ADJUSTED FEBRUARY 2024
JANUARY 2024 TO FEBRUARY 2024 FEBRUARY 2023 TO FEBRUARY 2024 FEBRUARY 2024 JANUARY 2024 FEBRUARY 2023 # CHANGE % CHANGE # CHANGE % CHANGE Total Nonfarm 2,337,600 2,314,100 2,271,300 +23,500 +1.0% +66,300 +2.9% Total Private 1,957,700 1,941,900 1,899,100 +15,800 +0.8% +58,600 +3.1% Goods Producing 386,600 385,200 377,800 +1,400 +0.4% +8,800 +2.3% Mining, Logging and Construction 120,300 119,800 114,200 +500 +0.4% +6,100 +5.3% Mining and Logging 4,500 4,500 4,400 0 0.0% +100 +2.3% Construction 115,800 115,300 109,800 +500 +0.4% +6,000 +5.5% Construction of Buildings 28,600 28,500 26,800 +100 +0.4% +1,800 +6.7% Heavy and Civil Engineering Construction 17,900 17,700 16,800 +200 +1.1% +1,100 +6.5% Specialty Trade Contractors 69,300 69,100 66,200 +200 +0.3% +3,100 +4.7% Manufacturing 266,300 265,400 263,600 +900 +0.3% +2,700 +1.0% Durable Goods 163,200 162,100 159,200 +1,100 +0.7% +4,000 +2.5% Fabricated Metal Product Manufacturing 24,700 24,500 24,100 +200 +0.8% +600 +2.5% Transportation Equipment Manufacturing 53,000 52,700 51,200 +300 +0.6% +1,800 +3.5% Non-Durable Goods 103,100 103,300 104,400 -200 -0.2% -1,300 -1.2% Textile Mills 11,400 11,400 11,900 0 0.0% -500 -4.2% Plastics and Rubber Products Manufacturing 26,300 26,200 25,900 +100 +0.4% +400 +1.5% Service-Providing 1,951,000 1,928,900 1,893,500 +22,100 +1.1% +57,500 +3.0% Private Service Providing 1,571,100 1,556,700 1,521,300 +14,400 +0.9% +49,800 +3.3% Trade, Transportation, and Utilities 441,400 439,500 435,700 +1,900 +0.4% +5,700 +1.3% Wholesale Trade 81,900 82,700 81,400 -800 -1.0% +500 +0.6% Merchant Wholesalers, Durable Goods 43,400 43,900 43,100 -500 -1.1% +300 +0.7% Merchant Wholesalers, Nondurable Goods 23,200 23,500 23,300 -300 -1.3% -100 -0.4% Retail Trade 265,200 263,300 261,100 +1,900 +0.7% +4,100 +1.6% Motor Vehicle and Parts Dealers 34,500 34,300 33,900 +200 +0.6% +600 +1.8% Food and Beverage Stores 54,500 54,000 52,700 +500 +0.9% +1,800 +3.4% Health and Personal Care Stores 15,800 15,800 16,400 0 0.0% -600 -3.7% Clothing and Clothing Accessories Stores 17,700 18,100 17,000 -400 -2.2% +700 +4.1% General Merchandise Stores 60,400 60,800 59,200 -400 -0.7% +1,200 +2.0% Transportation, Warehousing, and Utilities 94,300 93,500 93,200 +800 +0.9% +1,100 +1.2% Utilities 11,300 11,200 11,200 +100 +0.9% +100 +0.9% Transportation and Warehousing 83,000 82,300 82,000 +700 +0.9% +1,000 +1.2% Information 28,400 28,400 29,900 0 0.0% -1,500 -5.0% Financial Activities 122,700 122,900 119,300 -200 -0.2% +3,400 +2.8% Finance and Insurance 87,700 88,000 86,300 -300 -0.3% +1,400 +1.6% Credit Intermediation and Related Activities including Monetary Authorities 36,900 37,000 37,600 -100 -0.3% -700 -1.9% Real Estate and Rental and Leasing 35,000 34,900 33,000 +100 +0.3% +2,000 +6.1% Professional and Business Services 316,900 314,300 309,000 +2,600 +0.8% +7,900 +2.6% Professional, Scientific, and Technical Services 133,700 132,100 127,100 +1,600 +1.2% +6,600 +5.2% Architectural, Engineering, and Related Services 23,700 23,700 22,900 0 0.0% +800 +3.5% Management of Companies and Enterprises 24,700 24,600 23,500 +100 +0.4% +1,200 +5.1% Administrative and Support and Waste Management and Remediation Services 158,500 157,600 158,400 +900 +0.6% +100 +0.1% Administrative and Support Services 145,900 145,100 146,100 +800 +0.6% -200 -0.1% Employment Services 68,100 67,500 68,100 +600 +0.9% 0 0.0% Services to Buildings and Dwellings 35,100 34,700 34,100 +400 +1.2% +1,000 +2.9% Education and Health Services 294,000 290,100 276,700 +3,900 +1.3% +17,300 +6.3% Educational Services 49,600 47,500 48,200 +2,100 +4.4% +1,400 +2.9% Health Care and Social Assistance 244,400 242,600 228,500 +1,800 +0.7% +15,900 +7.0% Ambulatory Health Care Services 117,500 116,700 109,100 +800 +0.7% +8,400 +7.7% Hospitals 42,000 41,800 38,800 +200 +0.5% +3,200 +8.2% Nursing and Residential Care Facilities 42,800 42,000 40,700 +800 +1.9% +2,100 +5.2% Leisure and Hospitality 277,100 272,100 265,800 +5,000 +1.8% +11,300 +4.3% Arts, Entertainment, and Recreation 35,800 34,500 31,800 +1,300 +3.8% +4,000 +12.6% Amusement, Gambling, and Recreation Industries 28,600 28,100 25,100 +500 +1.8% +3,500 +13.9% Accommodation and Food Services 241,300 237,600 234,000 +3,700 +1.6% +7,300 +3.1% Accommodation 31,200 30,800 31,200 +400 +1.3% 0 0.0% Food Services and Drinking Places 210,100 206,800 202,800 +3,300 +1.6% +7,300 +3.6% Other Services 90,600 89,400 84,900 +1,200 +1.3% +5,700 +6.7% Repair and Maintenance 26,200 25,700 24,100 +500 +1.9% +2,100 +8.7% Personal and Laundry Services 21,100 20,900 20,500 +200 +1.0% +600 +2.9% Government 379,900 372,200 372,200 +7,700 +2.1% +7,700 +2.1% Federal Government 37,300 37,100 36,000 +200 +0.5% +1,300 +3.6% State Government 110,800 105,400 109,700 +5,400 +5.1% +1,100 +1.0% State Government Educational Services 50,500 46,100 52,400 +4,400 +9.5% -1,900 -3.6% State Government Excluding Education 60,300 59,300 57,300 +1,000 +1.7% +3,000 +5.2% Local Government 231,800 229,700 226,500 +2,100 +0.9% +5,300 +2.3% Local Government Educational Services 113,400 112,700 110,700 +700 +0.6% +2,700 +2.4% Local Government excluding Educational Services 118,400 117,000 115,800 +1,400 +1.2% +2,600 +2.2% 19 dew.sc.gov scworkforceinfo.com
Current month’s estimates are preliminary. All data are subject to revision.
TOTAL PRIVATE NSA STATEWIDE HOURS AND EARNINGS BY MSA
JANUARY 2024 TO FEBRUARY 2024 FEBRUARY 2023 TO FEBRUARY 2024 AREA FEBRUARY 2024 JANUARY 2024 FEBRUARY 2023 # CHANGE % CHANGE # CHANGE % CHANGE Charleston-North Charleston $1,088 17 $1,088 91 $1,083 11 -$0 74 -0.1% +$5.06 +0.5% Columbia $999 67 $988 19 $880 72 +$11 48 +1.2% +$118.95 +13.5% Florence $740 23 $726.95 $755.17 +$13 28 +1.8% -$14 94 -2.0% Greenville-Anderson-Mauldin $1,117 31 $1,122 98 $1,109 20 -$5.67 -0.5% +$8 11 +0.7% Hilton Head Island-Bluffton-Beaufort $755.57 $752.25 $814 46 +$3 32 +0.4% -$58.89 -7.2% Myrtle Beach-Conway-North Myrtle Beach $849 06 $840 41 $827.54 +$8.65 +1.0% +$21.52 +2.6% Spartanburg $955.98 $956.74 $906 78 -$0 76 -0.1% +$49 20 +5.4% Sumter $928 20 $899 46 $710.65 +$28 74 +3.2% +$217.55 +30.6%
AVERAGE WEEKLY EARNINGS (AWE)
JANUARY 2024 TO FEBRUARY 2024 FEBRUARY 2023 TO FEBRUARY 2024 AREA FEBRUARY 2024 JANUARY 2024 FEBRUARY 2023 # CHANGE % CHANGE # CHANGE % CHANGE Charleston-North Charleston 33 7 33 3 34 2 +0 4 +1.2% -0.5 -1.5% Columbia 34 2 33 9 33 9 +0 3 +0.9% +0 3 +0.9% Florence 32 1 31 8 32 3 +0 3 +0.9% -0 2 -0.6% Greenville-Anderson-Mauldin 34 4 34 3 35.7 +0 1 +0.3% -1 3 -3.6% Hilton Head Island-Bluffton-Beaufort 29 7 29.5 30 3 +0 2 +0.7% -0 6 -2.0% Myrtle Beach-Conway-North Myrtle Beach 31 8 31 3 32 8 +0.5 +1.6% -1 0 -3.0% Spartanburg 33 9 33 7 34 0 +0 2 +0.6% -0 1 -0.3% Sumter 35.0 34 2 32 2 +0 8 +2.3% +2 8 +8.7%
AVERAGE WEEKLY HOURS (AWH)
JANUARY 2024 TO FEBRUARY 2024 FEBRUARY 2023 TO FEBRUARY 2024 AREA FEBRUARY 2024 JANUARY 2024 FEBRUARY 2023 # CHANGE % CHANGE # CHANGE % CHANGE Charleston-North Charleston 32 29 32 7 31 67 -$0 41 -1.3% +$0 62 +2.0% Columbia 29 23 29.15 25.98 +$0 08 +0.3% +$3.25 +12.5% Florence 23 06 22 86 23 38 +$0 20 +0.9% -$0 32 -1.4% Greenville-Anderson-Mauldin 32 48 32 74 31 07 -$0 26 -0.8% +$1 41 +4.5% Hilton Head Island-Bluffton-Beaufort 25.44 25.5 26 88 -$0 06 -0.2% -$1 44 -5.4% Myrtle Beach-Conway-North Myrtle Beach 26 7 26.85 25.23 -$0.15 -0.6% +$1 47 +5.8% Spartanburg 28 2 28 39 26 67 -$0 19 -0.7% +$1.53 +5.7% Sumter 26.52 26 3 22 07 +$0 22 +0.8% +$4.45 +20.2%
AVERAGE HOURLY EARNINGS (AHE)
20 SC Department of Employment and Workforce Labor Market Information Division Columbia, South Carolina 29202
AVERAGE WEEKLY HOURS (AWH)
NSA STATEWIDE HOURS AND EARNINGS BY INDUSTRY
JANUARY 2024 TO FEBRUARY 2024 FEBRUARY 2023 TO FEBRUARY 2024 INDUSTRY TITLE FEBRUARY 2024 JANUARY 2024 FEBRUARY 2023 # CHANGE % CHANGE # CHANGE % CHANGE Total Private 1,014.97 1,012.71 992.67 +$2.26 +0.2% +$22.30 +2.2% Goods Producing 1,291 11 1,294 62 1,266 49 -$3.51 -0.3% +$24 62 +1.9% Construction 945.76 944 925.65 +$1 76 +0.2% +$20 11 +2.2% Manufacturing 1,291 04 1,267 13 1,192 99 +$23 91 +1.9% +$98.05 +8.2% Private Service Providing 1,323 04 1,361 74 1,302 19 -$38 70 -2.8% +$20.85 +1.6% Trade, Transportation, and Utilities 847 28 849 2 821.51 -$1 92 -0.2% +$25.77 +3.1% Financial Activities 1,189 3 1,183 7 1,209 98 +$5.60 +0.5% -$20 68 -1.7% Professional and Business Services 1,266.52 1,251.26 1,231 02 +$15.26 +1.2% +$35.50 +2.9% Education and Health Services 1,034 8 1,051.69 978 1 -$16 89 -1.6% +$56.70 +5.8% Leisure and Hospitality 473.35 456.42 458.3 +$16 93 +3.7% +$15.05 +3.3% Other Services 998 82 979 96 918 72 +$18 86 +1.9% +$80 10 +8.7%
AVERAGE WEEKLY EARNINGS (AWE)
JANUARY 2024 TO FEBRUARY 2024 FEBRUARY 2023 TO FEBRUARY 2024 INDUSTRY TITLE FEBRUARY 2024 JANUARY 2024 FEBRUARY 2023 # CHANGE % CHANGE # CHANGE % CHANGE Total Private 33.9 33.5 34.6 +0.4 +1.2% -0.7 -2.0% Goods Producing 39 8 39 7 41 2 +0 1 +0.3% -1 4 -3.4% Construction 32 4 32 33 +0 4 +1.3% -0 6 -1.8% Manufacturing 41 3 40 6 40 8 +0 7 +1.7% +0.5 +1.2% Private Service Providing 39 6 40 3 41 3 -0 7 -1.7% -1 7 -4.1% Trade, Transportation, and Utilities 32.5 32 4 32 9 +0 1 +0.3% -0 4 -1.2% Financial Activities 37 9 37 2 38 4 +0 7 +1.9% -0.5 -1.3% Professional and Business Services 36 7 36 3 37 6 +0 4 +1.1% -0 9 -2.4% Education and Health Services 32.5 32 3 32 8 +0 2 +0.6% -0 3 -0.9% Leisure and Hospitality 24 2 23 6 24 8 +0 6 +2.5% -0 6 -2.4% Other Services 34 3 33 4 34 8 +0 9 +2.7% -0.5 -1.4%
JANUARY 2024 TO FEBRUARY 2024 FEBRUARY 2023 TO FEBRUARY 2024 INDUSTRY TITLE FEBRUARY 2024 JANUARY 2024 FEBRUARY 2023 # CHANGE % CHANGE # CHANGE % CHANGE Total Private 29.94 30.23 28.69 -$0.29 -1.0% +$1.25 +4.4% Goods Producing 32 44 32 61 30 74 -$0 17 -0.5% +$1 70 +5.5% Construction 29 19 29.5 28.05 -$0 31 -1.1% +$1 14 +4.1% Manufacturing 31 26 31 21 29 24 +$0.05 +0.2% +$2 02 +6.9% Private Service Providing 33 41 33 79 31.53 -$0 38 -1.1% +$1 88 +6.0% Trade, Transportation, and Utilities 26 07 26 21 24 97 -$0 14 -0.5% +$1 10 +4.4% Financial Activities 31 38 31 82 31.51 -$0 44 -1.4% -$0 13 -0.4% Professional and Business Services 34.51 34 47 32 74 +$0 04 +0.1% +$1 77 +5.4% Education and Health Services 31 84 32.56 29 82 -$0 72 -2.2% +$2 02 +6.8% Leisure and Hospitality 19.56 19 34 18 48 +$0 22 +1.1% +$1 08 +5.8% Other Services 29 12 29 34 26 4 -$0 22 -0.7% +$2 72 +10.3% 21 dew.sc.gov scworkforceinfo.com
AVERAGE HOURLY EARNINGS (AHE)
NONFARM PAYROLL BY ECONOMIC SECTOR
CHARLESTON-NORTH CHARLESTON MSA
FEBRUARY 2024 (NOT SEASONALLY ADJUSTED)
Current month’s estimates are preliminary. All data are subject to revision.
JANUARY 2024 TO FEBRUARY 2024 FEBRUARY 2023 TO FEBRUARY 2024 FEBRUARY 2024 JANUARY 2024 FEBRUARY 2023 # CHANGE % CHANGE # CHANGE % CHANGE Total Nonfarm 421,700 416,700 404,300 +5,000 +1.2% +17,400 +4.3% Total Private 351,200 346,900 337,200 +4,300 +1.2% +14,000 +4.2% Goods Producing 56,800 56,100 54,100 +700 +1.2% +2,700 +5.0% Service-Providing 364,900 360,600 350,200 +4,300 +1.2% +14,700 +4.2% Private Service Providing 294,400 290,800 283,100 +3,600 +1.2% +11,300 +4.0% Mining, Logging and Construction 23,000 22,700 22,100 +300 +1.3% +900 +4.1% Manufacturing 33,800 33,400 32,000 +400 +1.2% +1,800 +5.6% Trade, Transportation, and Utilities 76,500 76,100 74,700 +400 +0.5% +1,800 +2.4% Wholesale Trade 12,900 13,100 12,800 -200 -1.5% +100 +0.8% Retail Trade 44,400 44,100 42,700 +300 +0.7% +1,700 +4.0% General Merchandise Stores 7,900 7,900 7,700 0 0.0% +200 +2.6% Transportation, Warehousing, and Utilities 19,200 18,900 19,200 +300 +1.6% 0 0.0% Information 7,900 7,900 8,600 0 0.0% -700 -8.1% Financial Activities 21,500 21,400 20,200 +100 +0.5% +1,300 +6.4% Professional and Business Services 69,100 68,000 66,300 +1,100 +1.6% +2,800 +4.2% Administrative and Support and Waste Management 29,100 28,400 28,800 +700 +2.5% +300 +1.0% Education and Health Services 49,100 48,500 46,200 +600 +1.2% +2,900 +6.3% Leisure and Hospitality 52,900 51,800 51,000 +1,100 +2.1% +1,900 +3.7% Accommodation and Food Services 45,900 45,100 45,000 +800 +1.8% +900 +2.0% Food Services and Drinking Places 38,300 37,500 36,900 +800 +2.1% +1,400 +3.8% Other Services 17,400 17,100 16,100 +300 +1.8% +1,300 +8.1% Government 70,500 69,800 67,100 +700 +1.0% +3,400 +5.1% Federal Government 11,800 11,700 11,700 +100 +0.9% +100 +0.9% State Government 28,700 28,300 27,200 +400 +1.4% +1,500 +5.5% Local Government 30,000 29,800 28,200 +200 +0.7% +1,800 +6.4%
22 SC Department of Employment and Workforce Labor Market Information Division Columbia, South Carolina 29202
NONFARM PAYROLL BY ECONOMIC SECTOR
COLUMBIA MSA
FEBRUARY 2024 (NOT SEASONALLY ADJUSTED)
Current month’s estimates are preliminary. All data are subject to revision.
JANUARY 2024 TO FEBRUARY 2024 FEBRUARY 2023 TO FEBRUARY 2024 FEBRUARY 2024 JANUARY 2024 FEBRUARY 2023 # CHANGE % CHANGE # CHANGE % CHANGE Total Nonfarm 430,400 427,100 419,700 +3,300 +0.8% +10,700 +2.5% Total Private 345,900 343,800 337,000 +2,100 +0.6% +8,900 +2.6% Goods Producing 50,300 50,100 49,000 +200 +0.4% +1,300 +2.7% Service-Providing 380,100 377,000 370,700 +3,100 +0.8% +9,400 +2.5% Private Service Providing 295,600 293,700 288,000 +1,900 +0.6% +7,600 +2.6% Mining, Logging and Construction 18,000 18,000 17,100 0 0.0% +900 +5.3% Manufacturing 32,300 32,100 31,900 +200 +0.6% +400 +1.3% Trade, Transportation, and Utilities 78,000 77,600 78,200 +400 +0.5% -200 -0.3% Wholesale Trade 16,700 16,800 16,400 -100 -0.6% +300 +1.8% Retail Trade 44,200 43,800 44,700 +400 +0.9% -500 -1.1% Transportation, Warehousing, and Utilities 17,100 17,000 17,100 +100 +0.6% 0 0.0% Information 4,800 4,800 5,200 0 0.0% -400 -7.7% Financial Activities 37,700 37,600 36,200 +100 +0.3% +1,500 +4.1% Credit Intermediation and Related Activities including Monetary Authorities - Central Bank 7,500 7,600 7,700 -100 -1.3% -200 -2.6% Professional and Business Services 56,900 57,000 56,200 -100 -0.2% +700 +1.2% Administrative and Support and Waste Management 29,700 29,500 29,100 +200 +0.7% +600 +2.1% Education and Health Services 58,100 57,600 55,000 +500 +0.9% +3,100 +5.6% Leisure and Hospitality 41,500 40,700 39,500 +800 +2.0% +2,000 +5.1% Food Services and Drinking Places 34,700 34,100 33,300 +600 +1.8% +1,400 +4.2% Other Services 18,600 18,400 17,700 +200 +1.1% +900 +5.1% Government 84,500 83,300 82,700 +1,200 +1.4% +1,800 +2.2% Federal Government 12,100 11,900 11,300 +200 +1.7% +800 +7.1% State Government 36,600 35,700 35,400 +900 +2.5% +1,200 +3.4% Local Government 35,800 35,700 36,000 +100 +0.3% -200 -0.6%
23 dew.sc.gov scworkforceinfo.com
NONFARM PAYROLL BY ECONOMIC SECTOR
GREENVILLE-ANDERSON-MAULDIN MSA
FEBRUARY 2024 (NOT SEASONALLY ADJUSTED)
Current month’s estimates are preliminary. All data are subject to revision.
JANUARY 2024 TO FEBRUARY 2024 FEBRUARY 2023 TO FEBRUARY 2024 FEBRUARY 2024 JANUARY 2024 FEBRUARY 2023 # CHANGE % CHANGE # CHANGE % CHANGE Total Nonfarm 463,300 459,600 457,400 +3,700 +0.8% +5,900 +1.3% Total Private 401,300 398,800 394,200 +2,500 +0.6% +7,100 +1.8% Goods Producing 85,200 85,000 83,500 +200 +0.2% +1,700 +2.0% Service-Providing 378,100 374,600 373,900 +3,500 +0.9% +4,200 +1.1% Private Service Providing 316,100 313,800 310,700 +2,300 +0.7% +5,400 +1.7% Mining, Logging and Construction 22,500 22,500 21,400 0 0.0% +1,100 +5.1% Manufacturing 62,700 62,500 62,100 +200 +0.3% +600 +1.0% Trade, Transportation, and Utilities 83,100 83,200 83,100 -100 -0.1% 0 0.0% Wholesale Trade 20,500 20,800 20,600 -300 -1.4% -100 -0.5% Retail Trade 47,800 47,800 48,000 0 0.0% -200 -0.4% Transportation, Warehousing, and Utilities 14,800 14,600 14,500 +200 +1.4% +300 +2.1% Information 6,200 6,200 6,200 0 0.0% 0 0.0% Financial Activities 22,600 22,600 21,700 0 0.0% +900 +4.1% Professional and Business Services 74,900 74,200 76,200 +700 +0.9% -1,300 -1.7% Professional, Scientific, and Technical Services 30,600 30,500 29,300 +100 +0.3% +1,300 +4.4% Management of Companies and Enterprises 6,900 6,900 6,900 0 0.0% 0 0.0% Administrative and Support and Waste Management 37,400 36,800 40,000 +600 +1.6% -2,600 -6.5% Education and Health Services 62,600 61,500 58,600 +1,100 +1.8% +4,000 +6.8% Educational Services 13,200 12,600 12,600 +600 +4.8% +600 +4.8% Health Care and Social Assistance 49,400 48,900 46,000 +500 +1.0% +3,400 +7.4% Leisure and Hospitality 50,100 49,600 49,100 +500 +1.0% +1,000 +2.0% Other Services 16,600 16,500 15,800 +100 +0.6% +800 +5.1% Government 62,000 60,800 63,200 +1,200 +2.0% -1,200 -1.9% Federal Government 3,000 3,100 3,000 -100 -3.2% 0 0.0% State Government 13,600 12,600 15,200 +1,000 +7.9% -1,600 -10.5% Local Government 45,400 45,100 45,000 +300 +0.7% +400 +0.9%
24 SC Department of Employment and Workforce Labor Market Information Division Columbia, South Carolina 29202
NONFARM PAYROLL BY ECONOMIC SECTOR
Current month’s estimates are preliminary. All data are subject to revision.
JANUARY 2024 TO FEBRUARY 2024 FEBRUARY 2023 TO FEBRUARY 2024 FEBRUARY 2024 JANUARY 2024 FEBRUARY 2023 # CHANGE % CHANGE # CHANGE % CHANGE Total Nonfarm 192,700 189,900 183,800 +2,800 +1.5% +8,900 +4.8% Total Private 166,700 164,400 158,400 +2,300 +1.4% +8,300 +5.2% Goods Producing 18,100 17,900 17,400 +200 +1.1% +700 +4.0% Service-Providing 174,600 172,000 166,400 +2,600 +1.5% +8,200 +4.9% Private Service Providing 148,600 146,500 141,000 +2,100 +1.4% +7,600 +5.4% Mining, Logging and Construction 12,600 12,500 12,000 +100 +0.8% +600 +5.0% Manufacturing 5,500 5,400 5,400 +100 +1.9% +100 +1.9% Trade, Transportation, and Utilities 42,800 42,600 40,600 +200 +0.5% +2,200 +5.4% Wholesale Trade 4,000 4,000 3,900 0 0.0% +100 +2.6% Retail Trade 33,600 33,400 31,600 +200 +0.6% +2,000 +6.3% Transportation, Warehousing, and Utilities 5,200 5,200 5,100 0 0.0% +100 +2.0% Information 2,600 2,600 2,700 0 0.0% -100 -3.7% Financial Activities 10,100 10,300 10,100 -200 -1.9% 0 0.0% Professional and Business Services 20,000 19,800 18,400 +200 +1.0% +1,600 +8.7% Education and Health Services 22,700 22,500 21,500 +200 +0.9% +1,200 +5.6% Leisure and Hospitality 43,300 41,600 41,000 +1,700 +4.1% +2,300 +5.6% Accommodation and Food Services 35,500 34,100 34,900 +1,400 +4.1% +600 +1.7% Food Services and Drinking Places 29,400 27,800 27,100 +1,600 +5.8% +2,300 +8.5% Other Services 7,100 7,100 6,700 0 0.0% +400 +6.0% Government 26,000 25,500 25,400 +500 +2.0% +600 +2.4% Federal Government 1,600 1,600 1,500 0 0.0% +100 +6.7% State Government 4,400 4,200 4,500 +200 +4.8% -100 -2.2% Local Government 20,000 19,700 19,400 +300 +1.5% +600 +3.1%
MYRTLE BEACH-CONWAY-NORTH MYRTLE BEACH MSA FEBRUARY 2024 (NOT SEASONALLY ADJUSTED)
25 dew.sc.gov scworkforceinfo.com
NONFARM PAYROLL BY ECONOMIC SECTOR
SPARTANBURG MSA
FEBRUARY 2024 (NOT SEASONALLY ADJUSTED)
Current month’s estimates are preliminary. All data are subject to revision.
JANUARY 2024 TO FEBRUARY 2024 FEBRUARY 2023 TO FEBRUARY 2024 FEBRUARY 2024 JANUARY 2024 FEBRUARY 2023 # CHANGE % CHANGE # CHANGE % CHANGE Total Nonfarm 173,400 172,400 169,200 +1,000 +0.6% +4,200 +2.5% Total Private 144,300 143,500 141,700 +800 +0.6% +2,600 +1.8% Goods Producing 47,500 47,300 46,100 +200 +0.4% +1,400 +3.0% Service-Providing 125,900 125,100 123,100 +800 +0.6% +2,800 +2.3% Private Service Providing 96,800 96,200 95,600 +600 +0.6% +1,200 +1.3% Mining, Logging and Construction 8,200 8,000 7,300 +200 +2.5% +900 +12.3% Manufacturing 39,300 39,300 38,800 0 0.0% +500 +1.3% Durable Goods 27,200 27,200 26,600 0 0.0% +600 +2.3% Non-Durable Goods 12,100 12,100 12,200 0 0.0% -100 -0.8% Transportation, Warehousing, and Utilities 35,600 35,600 35,700 0 0.0% -100 -0.3% Wholesale Trade 8,000 8,100 8,200 -100 -1.2% -200 -2.4% Retail Trade 17,600 17,500 17,200 +100 +0.6% +400 +2.3% Transportation, Warehousing, and Utilities 10,000 10,000 10,300 0 0.0% -300 -2.9% Information 1,000 1,000 1,000 0 0.0% 0 0.0% Financial Activities 5,100 5,100 5,300 0 0.0% -200 -3.8% Professional and Business Services 17,000 16,900 17,400 +100 +0.6% -400 -2.3% Education and Health Services 16,900 16,800 16,000 +100 +0.6% +900 +5.6% Leisure and Hospitality 15,300 15,000 14,600 +300 +2.0% +700 +4.8% Other Services 5,900 5,800 5,600 +100 +1.7% +300 +5.4% Government 29,100 28,900 27,500 +200 +0.7% +1,600 +5.8% Federal Government 700 700 700 0 0.0% 0 0.0% State Government 4,000 3,900 4,000 +100 +2.6% 0 0.0% Local Government 24,400 24,300 22,800 +100 +0.4% +1,600 +7.0%
26 SC Department of Employment and Workforce Labor Market Information Division Columbia, South Carolina 29202
NONFARM PAYROLL BY ECONOMIC SECTOR
FLORENCE MSA
FEBRUARY 2024 (NOT SEASONALLY ADJUSTED) JANUARY 2024 TO FEBRUARY 2024 FEBRUARY 2023 TO FEBRUARY 2024 FEBRUARY 2024 JANUARY 2024 FEBRUARY 2023 # CHANGE % CHANGE # CHANGE % CHANGE Total Nonfarm 96,500 96,300 94,500 +200 +0.2% +2,000 +2.1% Total Private 78,500 78,600 77,200 -100 -0.1% +1,300 +1.7% Goods Producing 14,800 15,000 15,000 -200 -1.3% -200 -1.3% Service-Providing 81,700 81,300 79,500 +400 +0.5% +2,200 +2.8% Private Service Providing 63,700 63,600 62,200 +100 +0.2% +1,500 +2.4% Trade, Transportation, and Utilities 20,100 20,200 20,900 -100 -0.5% -800 -3.8% Government 18,000 17,700 17,300 +300 +1.7% +700 +4.0% Federal Government 700 700 700 0 0.0% 0 0.0% State Government 4,900 4,700 4,700 +200 +4.3% +200 +4.3% Local Government 12,400 12,300 11,900 +100 +0.8% +500 +4.2%
FEBRUARY
JANUARY
TO FEBRUARY
FEBRUARY 2023 TO FEBRUARY 2024 FEBRUARY 2024 JANUARY 2024 FEBRUARY 2023 # CHANGE % CHANGE # CHANGE % CHANGE Total Nonfarm 89,500 88,700 85,800 +800 +0.9% +3,700 +4.3% Total Private 77,300 76,700 73,900 +600 +0.8% +3,400 +4.6% Goods Producing 8,100 8,100 7,700 0 0.0% +400 +5.2% Service-Providing 81,400 80,600 78,100 +800 +1.0% +3,300 +4.2% Private Service Providing 69,200 68,600 66,200 +600 +0.9% +3,000 +4.5% Government 12,200 12,000 11,900 +200 +1.7% +300 +2.5%
FEBRUARY 2024 (NOT SEASONALLY
JANUARY 2024 TO FEBRUARY 2024 FEBRUARY 2023 TO FEBRUARY 2024 FEBRUARY 2024 JANUARY 2024 FEBRUARY 2023 # CHANGE % CHANGE # CHANGE % CHANGE Total Nonfarm 38,400 38,200 37,800 +200 +0.5% +600 +1.6% Total Private 32,400 32,300 31,900 +100 +0.3% +500 +1.6% Goods Producing 9,300 9,300 9,200 0 0.0% +100 +1.1% Service-Providing 29,100 28,900 28,600 +200 +0.7% +500 +1.7% Private Service Providing 23,100 23,000 22,700 +100 +0.4% +400 +1.8% Manufacturing 6,600 6,500 6,700 +100 +1.5% -100 -1.5% Government 6,000 5,900 5,900 +100 +1.7% +100 +1.7% Federal Government 1,300 1,300 1,200 0 0.0% +100 +8.3% State Government 1,300 1,200 1,400 +100 +8.3% -100 -7.1% Local Government 3,400 3,400 3,300 0 0.0% +100 +3.0% 27 dew.sc.gov scworkforceinfo.com
HILTON HEAD ISLAND-BLUFFTON-BEAUFORT MSA
2024 (NOT SEASONALLY ADJUSTED)
2024
2024
SUMTER MSA
ADJUSTED)
LONG-RUN TRENDS
ANNUAL LOCAL AREA UNEMPLOYMENT STATISTICS DATA 1976-2023
YEAR CIVILIAN NON-INSTITUTIONAL POPULATION LABOR FORCE PARTICIPATION RATE (PERCENT) EMPLOYMENT-POPULATION RATIO (PERCENT) LABOR FORCE EMPLOYMENT UNEMPLOYMENT UNEMPLOYMENT RATE (PERCENT) 1976 2,007,417 64.7% 60.2% 1,299,241 1,207,662 91,579 7.0% 1977 2,061,250 64.4% 60.0% 1,327,423 1,237,495 89,928 6.8% 1978 2,117,667 64.1% 60.5% 1,356,921 1,281,597 75,324 5.6% 1979 2,169,417 63.4% 60.2% 1,375,201 1,306,773 68,428 5.0% 1980 2,221,250 62.8% 58.6% 1,395,675 1,301,796 93,879 6.7% 1981 2,266,583 63.2% 58.0% 1,432,219 1,314,907 117,312 8.2% 1982 2,307,333 64.2% 57.3% 1,482,373 1,322,883 159,490 10.8% 1983 2,341,083 63.2% 56.9% 1,479,137 1,333,162 145,975 9.9% 1984 2,378,500 62.9% 58.5% 1,495,188 1,391,286 103,902 6.9% 1985 2,426,500 63.8% 59.5% 1,548,924 1,443,612 105,312 6.8% 1986 2,455,333 64.9% 60.7% 1,592,306 1,491,069 101,237 6.4% 1987 2,495,333 65.4% 61.8% 1,631,897 1,542,170 89,727 5.5% 1988 2,533,000 65.6% 62.5% 1,660,533 1,583,928 76,605 4.6% 1989 2,566,000 66.0% 62.9% 1,693,438 1,615,009 78,429 4.6% 1990 2,611,843 66.5% 63.3% 1,737,831 1,652,949 84,882 4.9% 1991 2,663,759 66.3% 62.3% 1,767,123 1,659,196 107,927 6.1% 1992 2,699,745 66.7% 62.2% 1,799,677 1,678,803 120,874 6.7% 1993 2,739,480 66.7% 61.8% 1,826,650 1,693,483 133,167 7.3% 1994 2,775,049 66.4% 62.3% 1,841,428 1,727,714 113,714 6.2% 1995 2,813,952 66.2% 62.8% 1,864,221 1,768,540 95,681 5.1% 1996 2,851,104 66.2% 62.4% 1,886,064 1,779,221 106,843 5.7% 1997 2,897,839 66.3% 63.3% 1,920,244 1,834,337 85,907 4.5% 1998 2,945,825 65.9% 63.5% 1,940,846 1,870,270 70,576 3.6% 1999 2,989,560 65.5% 62.8% 1,958,598 1,877,345 81,253 4.1% 28 SC Department of Employment and Workforce Labor Market Information Division Columbia, South Carolina 29202
ANNUAL LOCAL AREA UNEMPLOYMENT STATISTICS DATA 1976-2023
YEAR CIVILIAN NON-INSTITUTIONAL POPULATION LABOR FORCE PARTICIPATION RATE (PERCENT) EMPLOYMENT-POPULATION RATIO (PERCENT) LABOR FORCE EMPLOYMENT UNEMPLOYMENT UNEMPLOYMENT RATE (PERCENT) 2000 3,027,367 64.9% 62.5% 1,965,481 1,892,559 72,922 3.7% 2001 3,064,191 63.4% 60.0% 1,941,956 1,839,246 102,710 5.3% 2002 3,098,739 63.1% 59.0% 1,954,548 1,828,735 125,813 6.4% 2003 3,133,915 63.8% 59.2% 1,999,485 1,855,599 143,886 7.2% 2004 3,178,645 64.3% 59.5% 2,043,864 1,891,722 152,142 7.4% 2005 3,234,049 64.0% 59.4% 2,071,111 1,919,644 151,467 7.3% 2006 3,305,437 65.0% 60.5% 2,148,698 2,001,245 147,453 6.9% 2007 3,374,548 63.9% 60.0% 2,155,198 2,024,493 130,705 6.1% 2008 3,439,974 62.8% 58.2% 2,160,084 2,002,903 157,181 7.3% 2009 3,490,448 62.1% 55.0% 2,166,737 1,919,307 247,430 11.4% 2010 3,564,619 61.0% 54.1% 2,174,535 1,928,442 246,093 11.3% 2011 3,612,048 60.5% 54.2% 2,185,171 1,957,493 227,678 10.4% 2012 3,655,515 59.9% 54.5% 2,190,203 1,992,957 197,246 9.0% 2013 3,704,281 59.3% 54.9% 2,197,876 2,034,404 163,472 7.4% 2014 3,759,002 59.1% 55.4% 2,222,426 2,082,941 139,485 6.3% 2015 3,822,409 59.3% 55.8% 2,267,837 2,134,087 133,750 5.9% 2016 3,888,005 58.8% 55.9% 2,286,054 2,174,301 111,753 4.9% 2017 3,897,645 58.0% 55.6% 2,261,766 2,166,708 95,058 4.2% 2018 3,948,448 57.8% 55.9% 2,282,022 2,205,356 76,666 3.4% 2019 4,002,601 58.3% 56.7% 2,333,533 2,268,884 64,649 2.8% 2020 4,050,504 57.7% 54.3% 2,339,140 2,199,751 139,389 6.0% 2021 4,109,008 57.4% 55.2% 2,359,169 2,266,611 92,558 3.9% 2022 4,188,402 57.1% 55.3% 2,393,329 2,316,435 76,894 3.2% 2023 4,274,977 57.4% 55.7% 2,453,060 2380392 72,668 3.0% 29 dew.sc.gov scworkforceinfo.com
LONG-RUN TRENDS
ANNUAL CURRENT EMPLOYMENT STATISTICS NONFARM PAYROLL
YEAR EMPLOYMENT YEAR EMPLOYMENT YEAR EMPLOYMENT YEAR EMPLOYMENT 1939 310,100 1961 587,000 1983 1,189,000 2005 1,862,900 1940 328,600 1962 609,800 1984 1,262,500 2006 1,905,700 1941 387,500 1963 630,600 1985 1,296,200 2007 1,945,000 1942 416,500 1964 651,500 1986 1,338,000 2008 1,926,300 1943 428,500 1965 686,000 1987 1,392,200 2009 1,814,400 1944 408,600 1966 734,900 1988 1,449,000 2010 1,811,300 1945 396,000 1967 754,500 1989 1,499,700 2011 1,832,500 1946 411,600 1968 782,900 1990 1,527,600 2012 1,864,300 1947 436,200 1969 819,800 1991 1,497,300 2013 1,901,000 1948 456,400 1970 842,000 1992 1,511,800 2014 1,951,300 1949 443,100 1971 862,600 1993 1,553,000 2015 2,006,700 1950 461,400 1972 920,300 1994 1,592,000 2016 2,055,300 1951 505,800 1973 984,000 1995 1,636,300 2017 2,096,100 1952 544,300 1974 1,015,800 1996 1,669,400 2018 2,154,800 1953 543,900 1975 982,600 1997 1,718,800 2019 2,189,600 1954 519,700 1976 1,038,100 1998 1,779,800 2020 2,082,300 1955 533,000 1977 1,081,700 1999 1,826,300 2021 2,154,000 1956 542,900 1978 1,137,500 2000 1,854,000 2022 2,242,900 1957 545,000 1979 1,176,000 2001 1,814,800 2023 2,305,800 1958 545,900 1980 1,188,800 2002 1,795,400 1959 566,900 1981 1,196,500 2003 1,799,100 1960 582,500 1982 1,162,300 2004 1,826,600 30 SC Department of Employment and Workforce Labor Market Information Division Columbia, South Carolina 29202
1939-2023
2007-2023
ANNUAL CURRENT EMPLOYMENT STATISTICS NONFARM PAYROLL
AVERAGE WEEKLY EARNINGS AVERAGE WEEKLY HOURS AVERAGE HOURLY EARNINGS 2007 $675.36 36 0 $18 76 2008 $669 .28 35.6 $18 .80 2009 $665.55 34 7 $19 18 2010 $692 17 34 8 $19 89 2011 $716 18 34 .8 $20.58 2012 $705.16 35.1 $20 09 2013 $716.15 34 9 $20.52 2014 $726 23 34.5 $21.05 2015 $743 27 34 7 $21 42 2016 $762 80 34.5 $22 11 2017 $791 99 34 6 $22 89 2018 $829 36 34 6 $23 97 2019 $852.84 34.5 $24 72 2020 $888 31 34 1 $26.05 2021 $925.41 34 3 $26 98 2022 $972 90 34.5 $28 20 2023 $1,014.59 34 3 $29.58 31 dew.sc.gov scworkforceinfo.com
Technical Notes
1 . Household Survey: Nationally, there is a monthly Current Population Survey of about 60,000 households conducted by the Census Bureau for the Bureau of Labor Statistics (BLS) to determine employment status of the civilian population This information, along with other inputs, is used by DEW to operate the Local Area Unemployment Statistics program, which estimates the number of individuals employed and those not employed, but actively seeking employment for statewide and a variety of sub-state geographies
2 Employer Survey: BLS conducts a monthly Current Employment Statistics survey of about 44,000 employers which yields national estimates of nonagricultural wage and salary employment, hours, and earnings by industry This data is processed by DEW to generate comparable data for the state and its metropolitan statistical areas
3 . Seasonally Adjusted: Seasonal adjustment removes the effects of events that follow a regular pattern each year (i e tourist-related hiring and school closings in the summer) These adjustments make it easier to observe the cyclical and other nonseasonal movements in data over time
4 . Not Seasonally Adjusted: Effects of regular or seasonal patterns have not been removed from this data
Utilizes an Establishment Survey
Reference week is the Pay Period that includes the 12th of the month
A job held by a person on unpaid leave during the reference week is not counted since they are not receiving pay
Does not count selfemployed workers
Does not include agricultural workers
Does not count unpaid family workers
Workers on strike during the entire reference period are not counted
The Current Population Survey (CPS), which is a Household Survey, is used to calculate LAUS
Reference week is the Calendar Week that includes the 12th of the month
A person on unpaid leave is counted as employed because they will return to their job
Does count self-employed workers
Includes both agricultural and non-agricultural workers
Counts unpaid family workers if they worked at least 15 unpaid hours for a family business or family farm during the reference week
Workers on strike during the reference week are counted as employed in LAUS
CURRENT EMPLOYMENT STATISTICS (CES) LOCAL AREA UNEMPLOYMENT STATISTICS (LAUS) Data is published by Industry Data is published by County Counts Jobs Counts People
32 SC Department of Employment and Workforce Labor Market Information Division Columbia, South Carolina 29202

Do you need some help finding the data you need? Have a great idea for a research project you’d like to discuss with someone? We love to collaborate! DATA TRENDS is prepared by the LMI Division of the S C Department of Employment and Workforce with funding provided by the US Department of Labor Featured data is prepared in conjunction with the Bureau of Labor Statistics and current month estimates are always preliminary, with all previous data subject to revision
Interested in staying up to date with Trends as it’s released? Subscribe by clicking here!
34 dew.sc.gov scworkforceinfo.com SC Department of Employment and
Labor Market Information Division Columbia, South Carolina 29202
more information at scworkforceinfo.com
Workforce
Find
