
dew.sc.gov scworkforceinfo.com SC Department of Employment and Workforce Labor Market Information Division Columbia, South Carolina 29202 August 2022 Issue South Carolina Data TRENDS

Coming Soon: The New SCWorkforceInfo.com: Your Home for Everything Labor Market Information
South Carolina’s Employment Situation (August 2022)
Local Area Unemployment Statistics
Current Employment Statistics — Seasonally Adjusted
Current Employment Statistics — Not Seasonally Adjusted
4
8

10
16
18
Long Run Trends 28
Technical Notes 30
Interested in receiving the latest issue of Trends in your inbox every month? Click here to subscribe to our Trends mailing list!

Welcome to the August 2022 issue of Trends! Do you know what year South Carolina first had one million workers? Find out on page 29 …

As we bring Workforce Development Month to a close, I hope you were able to join us for our LMI Insights webinars every Wednesday during the month of September. We will be continuing our webinars on a monthly basis, with the next event coming up on October 26. Click here to sign up and watch DEW social media for updates.
This month’s featured article is all about the long-awaited redesign of our website, scworkforceinfo.com. I am excited to announce that the redesign is nearly complete and not only will the website be far more aesthetically pleasing, but the entire LMI Division has come up with innovative ideas and user-friendly features to ensure that this new version greatly surpasses the current one.
We will be rolling out the new platform in the coming weeks, which should make it far easier to find the data, reports, and other content currently available. We will also be adding new interactive dashboards that make our information more accessible to the casual user.
LMI is still looking to hire one more Workforce Insights Analyst. Click here for more information. And don’t hesitate to contact us anytime at lmicustomerservice@dew.sc.gov for all your workforce data needs.
Bryan P. Grady, Ph.D. Labor Market Information Director SC Department of Employment and Workforce
Let’s be honest for a minute: The LMI website isn’t great right now. It’s not particularly visually appealing, and it’s often not at all clear where you should go to find a particular piece of data or even to figure out what data you need. That’s why the LMI team has spent a lot of time in 2022 fixing it. There isn’t an exact go-live date yet, but it ought to be ready later this month. We want you to join in on our excitement for the launch of this revamped platform so, our much appreciated Trends reader, here’s a sneak peek.
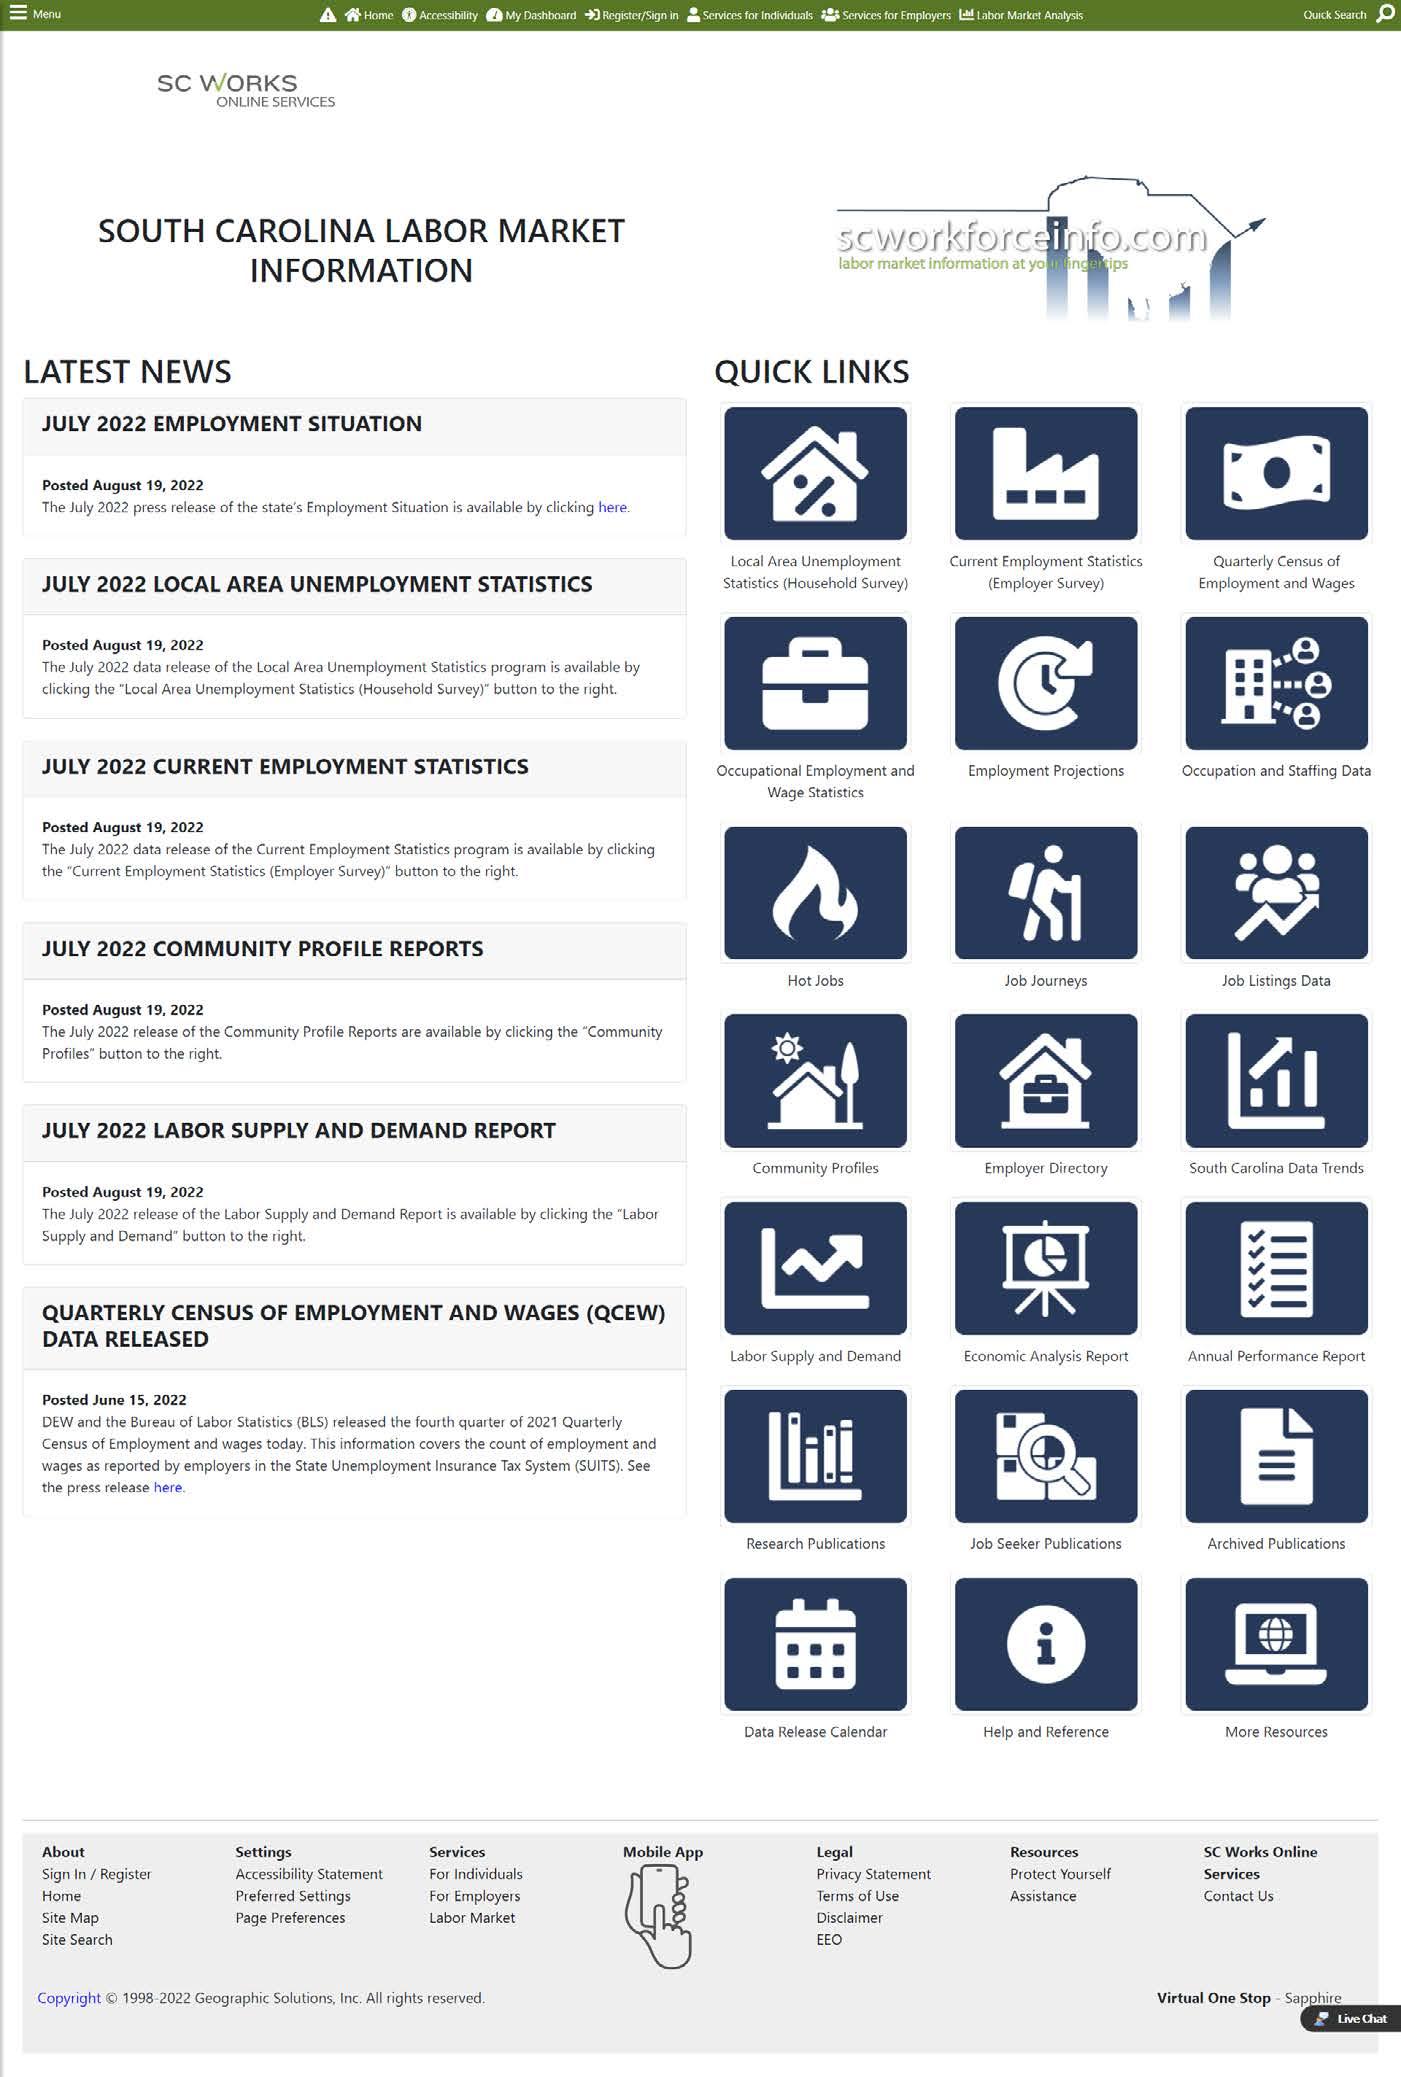
When you arrive on our page, it’ll look something like this:
Underneath the banner, you’ll see two columns of content. On the left, you’ll see a news feed that will let you know when we’ve updated a data set or released a new press release or publication. The test version is a little stale, but you get the idea. Each item will come with a link or tell you where to go on the site to find more information. This ensures the reader is always connected with the most current material.
On the right, you’ll see a grid of icons. It ought to remind you of your smartphone a bit, with a bunch of buttons directing you to different applications. The big idea here is to make it way easier to find a specific piece of information. Before, you usually had to click through a series of menus, particularly to find the raw data that we publish. Soon, there will be no more of that and everything will be far more user-friendly and accessible. Let’s walk through what all there will be.
• At the top of the grid, the first four buttons connect you with the data sets that are published by the LMI team in conjunction with the U.S. Bureau of Labor Statistics (BLS).
These are:
Local Area Unemployment Statistics
Current Employment Statistics
Quarterly Census of Employment and Wages
Occupational Employment and Wage Statistics
Clicking on one of these will bring you to a page that explains what the data set measures, including the date it was last updated, with a link to the corresponding BLS page for more information.
SC Department of Employment and Workforce Labor Market Information Division Columbia, South Carolina 29202

You’ll then have options for how to access the data. You’ll be able to download the data in bulk for statistical analysis, access the legacy analyzer tool, and view a Tableau dashboard that will allow for interactive browsing.

•Next in the grid is Employment Projections. This operates much the same way as the first four, and is also an LMI data product, but it offers four sets of projections: short-term (i.e., two-year) industry, short-term occupation, long-term (i.e., ten-year) industry, and longterm occupation.
•Last in the second row is Occupation and Staffing Data, which provides access to information on how professions are distributed among industries and occupational licensing requirements.
•The first two items in the third row, Hot Jobs and Job Journeys, are products generated by LMI to help people identify future career opportunities. Hot Jobs identifies in-demand jobs, meaning that they pay above average wages and are expected to grow faster than the overall workforce; this is available statewide and for each workforce development area. Meanwhile, Job Journeys identifies pathways from entry-level to high-skill jobs in eight career clusters statewide.
•Last in the third row is Job Listings Data. This information is provided by an outside vendor, Geographic Solutions, Inc., and allows the user to analyze data on current job postings that were scraped from verified external websites.
•The fourth row is flanked by links to our community profiles page and the catalog of current and previous issues of this very publication. In the middle is the Employer Directory button, which allows a user to search for companies by name, industry, or occupation in a particular location; this is done through a partnership between Data Axle, another vendor, and the CareerOneStop platform sponsored by the U.S. Department of Labor.
•Row #5 starts with our long-running Labor Supply and Demand report, which includes the current month’s issue as well as those for the prior year. This one-pager compares the number of people experiencing unemployment with the number of job openings identified by the Help Wanted OnLine database, both for the state and each LWDA. This is helpful for comparing how tight or loose the labor market is across different parts of the state.
•The other two buttons in the row, Economic Analysis Report and Annual Performance Report, provide current and archived reports required by the Employment and Training Administration under our Workforce Information Grant. The former provides an overview of the state’s economy, while the latter is an accounting of reporting and outreach activities conducted by our LMI team.
•The sixth row has links to three categories of publications: Research, Job Seeker, and Archived. The first two will include reports and handouts serving their respective audiences, while the latter will contain older documents that are well out of date. With our growing staff, we expect to start creating many more publications in the months to come!
•Finally, the seventh row contains some odds and ends. The first button, Data Release Calendar, shows when the monthly Employment Situation data will be released nationally and by DEW for South Carolina. Help and Reference provides a brief overview of LMI concepts, as well as our division’s contact information if you need further assistance. Last, More Resources provides links to sites maintained by federal, state, and private entities that also publish LMI or LMI-related data or might help with analysis of that data.
We hope that this new website will be much easier to navigate and use for a variety of users. As always, we welcome questions, comments, and suggestions in our inbox, lmicustomerservice@dew.sc.gov
SC Department of Employment and Workforce Labor Market Information Division Columbia, South Carolina 29202

EMPLOYMENT: The seasonally adjusted, monthly survey of households estimated the number of South Carolinians working decreased to 2,320,187.
• That is a decrease of 3,776 people over the July estimate.
• That is a significant increase of 43,839 people over the August 2021 estimate.
UNEMPLOYMENT: The estimate of unemployed people decreased to 74,539.
• That is a decrease of 1,122 people from July’s estimate and a significant decrease of 18,298 over the August 2021 estimate.
• The state’s seasonally adjusted unemployment rate declined to 3.1 percent from July’s estimate of 3.2 percent.
• Nationally, the unemployment rate increased to 3.7 percent from July’s estimate of 3.5 percent, according to the Current Population Survey.
LABOR FORCE: The state’s estimated labor force (people working plus unemployed people looking for work) decreased to 2,394,726 from July’s level of 2,399,624.
• That is a decrease of 4,898 people over the July estimate.
• That is an increase of 25,541 individuals over the August 2021 estimate.
The monthly survey of businesses in South Carolina marked an estimated increase of 9,600 nonfarm payroll jobs over the month to a level of 2,242,400.

• Industries that reported gains were Professional and Business Services (+3,900); Trade, Transportation, and Utilities (+2,300); Government (+2,000); Manufacturing (+1,300); Leisure and Hospitality (+1,200); Construction (+200); and Financial Activities (+100).
• The Education and Health Services (-1,000); Other Services (-200); and Information (-100) industries declined.
From August 2021 to August 2022, South Carolina’s economy has picked up 86,000 seasonally adjusted, nonfarm jobs.
• Industries with strong growth were Trade, Transportation, and Utilities (+25,600); Leisure and Hospitality (+18,900); Manufacturing (+10,900); Government (+7,400); Professional and Business Services (+7,100) Financial Activities (+6,000); Other Services (+5,300); Education and Health Services (+3,600); and Information (+2,000).
• The Construction industry declined (-1,100).
SC Department of Employment and Workforce
Labor Market Information Division Columbia, South Carolina 29202
Not seasonally adjusted, nonfarm payroll employment increased by 9,600 from July 2022 to August 2022 for a total of 2,243,400.
• Industries that reported gains were Government (+6,100); Professional and Business Services (+4,900); Manufacturing (+1,400); Education and Health Services (+1,000); Trade, Transportation, and Utilities (+1,000); Financial Activities (+200).
• The Leisure and Hospitality (-4,400); Information (-200); Construction (-200); Other Services (-100); and Mining and Logging (-100) industries marked declines.
Since August 2021, not seasonally adjusted, nonfarm jobs were up 80,100 in South Carolina.

• Industries making strong annual gains were Trade, Transportation, and Utilities (+23,400); Leisure and Hospitality (+19,700); Manufacturing (+10,800); Professional and Business Services (+6,400); Financial Activities (+5,700); Other Services (+5,100); Government (+4,000); Educational and Health Services (+3,900); Information (+2,300) and Mining and Logging (+300).
• The Construction (-1,500) industry showed a decline over the year.
3.2%
2.9% 2.8%3.3%
5.4%
4.1% 3.0% 6.0%
3.1% 3.9%
3.1% 5.7%
3.0%
2.8% 3.7% 2.7% 3.0%
3.1% 6.1% 5.1% 3.0%
5.2%
3.3%
3.6% 3.3% 5.0% 4.3%2.6%
2.6%
4.1% 4.7% 3.7% 4.1% 3.5%
3.6% 2.7%
2.8%
Department of Employment and Workforce Labor Market Information Division Columbia, South Carolina 29202
AREA
LABOR FORCE EMPLOY MENT
UNEMPLOYMENT LABOR FORCE EMPLOY MENT
UNEMPLOYMENT LABOR FORCE EMPLOY MENT
UNEMPLOYMENT LEVEL RATE (%) LEVEL RATE (%)
Abbeville County ↑ 9,369 8,986 383 4.1 9,119 8,750 369 4.0 9,559 9,109 450 4.7
Aiken County ↑ 74,178 71,977 2,201 3.0 74,310 72,141 2,169 2.9 74,087 71,477 2,610 3.5
Allendale County ↓ 2,290 2,152 138 6.0 2,314 2,164 150 6.5 2,417 2,222 195 8.1
Anderson County ↑ 91,204 88,407 2,797 3.1 91,246 88,521 2,725 3.0 90,251 86,690 3,561 3.9
Bamberg County ↓ 4,408 4,137 271 6.1 4,372 4,093 279 6.4 4,694 4,320 374 8.0
Barnwell County ↑ 7,519 7,134 385 5.1 7,495 7,118 377 5.0 7,549 7,034 515 6.8
Beaufort County 77,903 75,558 2,345 3.0 78,621 76,292 2,329 3.0 77,529 74,666 2,863 3.7
Berkeley County 111,138 107,961 3,177 2.9 111,391 108,198 3,193 2.9 108,439 104,358 4,081 3.8
Calhoun County ↑ 6,348 6,119 229 3.6 6,354 6,130 224 3.5 6,399 6,090 309 4.8
Charleston County 218,056 212,143 5,913 2.7 218,765 212,916 5,849 2.7 213,411 205,284 8,127 3.8
Cherokee County ↓ 24,369 23,358 1,011 4.1 23,604 22,602 1,002 4.2 24,683 23,392 1,291 5.2
Chester County ↑ 13,569 12,935 634 4.7 13,532 12,904 628 4.6 13,316 12,494 822 6.2
Chesterfield County ↑ 21,284 20,486 798 3.7 21,337 20,593 744 3.5 21,571 20,577 994 4.6
Clarendon County ↑ 12,289 11,780 509 4.1 11,881 11,409 472 4.0 12,309 11,668 641 5.2
Colleton County ↑ 15,901 15,350 551 3.5 16,011 15,468 543 3.4 16,299 15,549 750 4.6
Darlington County ↓ 29,089 28,037 1,052 3.6 29,328 28,232 1,096 3.7 30,101 28,655 1,446 4.8
Dillon County ↓ 12,887 12,264 623 4.8 12,411 11,795 616 5.0 13,311 12,511 800 6.0
Dorchester County 80,609 78,386 2,223 2.8 80,823 78,577 2,246 2.8 78,755 75,801 2,954 3.8
Edgefield County 10,389 10,074 315 3.0 10,425 10,114 311 3.0 10,414 10,047 367 3.5
Fairfield County ↑ 9,173 8,696 477 5.2 9,148 8,702 446 4.9 9,218 8,641 577 6.3
Florence County ↑ 64,439 62,254 2,185 3.4 64,887 62,727 2,160 3.3 66,366 63,455 2,911 4.4
Georgetown County ↑ 26,369 25,383 986 3.7 26,633 25,665 968 3.6 26,570 25,254 1,316 5.0
Greenville County ↑ 258,911 251,785 7,126 2.8 259,205 252,081 7,124 2.7 255,957 246,798 9,159 3.6
Greenwood County ↓ 29,435 28,333 1,102 3.7 28,633 27,554 1,079 3.8 30,205 28,772 1,433 4.7
Hampton County ↓ 8,043 7,825 218 2.7 7,989 7,746 243 3.0 8,125 7,822 303 3.7
Horry County ↑ 153,611 147,823 5,788 3.8 155,541 150,008 5,533 3.6 152,951 145,196 7,755 5.1
Jasper County ↑ 13,361 12,962 399 3.0 13,539 13,140 399 2.9 13,304 12,834 470 3.5
Kershaw County ↑ 29,068 28,102 966 3.3 29,065 28,121 944 3.2 29,105 27,916 1,189 4.1
Lancaster County ↑ 44,091 42,496 1,595 3.6 43,969 42,421 1,548 3.5 42,969 41,033 1,936 4.5
Laurens County ↓ 29,957 28,962 995 3.3 30,027 29,020 1,007 3.4 29,768 28,438 1,330 4.5
Lee County ↑ 6,366 6,048 318 5.0 6,379 6,068 311 4.9 6,650 6,251 399 6.0
Lexington County 149,420 145,495 3,925 2.6 149,534 145,582 3,952 2.6 149,240 144,338 4,902 3.3
Marion County 12,803 12,124 679 5.3 12,782 12,101 681 5.3 13,037 12,103 934 7.2
Marlboro County 8,513 7,901 612 7.2 8,287 7,689 598 7.2 8,822 8,125 697 7.9
McCormick County
Newberry County
Oconee County
Orangeburg County
Pickens County
Richland County
Saluda County
Spartanburg County
3,322 3,180 142 4.3 3,282 3,157 125 3.8 3,350 3,181 169 5.0
19,076
1,071
32,335 30,491 1,844
55,941
2.6 19,087 18,566 521 2.7 19,457 18,790 667 3.4
33,440 32,395 1,045 3.1 34,353 33,033 1,320 3.8
32,335 30,448 1,887 5.8 34,045 31,479 2,566 7.5
56,038 1,809
56,904 54,837 2,067
METROPOLITAN STATISTICAL AREA
Charleston-North Charleston
AUGUST 2022
LABOR FORCE EMPLOY MENT
JULY 2022
UNEMPLOYMENT LABOR FORCE EMPLOY MENT
UNEMPLOYMENT
LABOR FORCE EMPLOY MENT
UNEMPLOYMENT LEVEL RATE (%) LEVEL RATE (%) LEVEL RATE (%)
409,803 398,490 11,313 2.8 413,155 400,929 12,226 3.0 400,605 385,443 15,162 3.8
Columbia ↓ 397,482 385,150 12,332 3.1 402,815 389,538 13,277 3.3 397,784 381,942 15,842 4.0
Florence ↓ 93,528 90,291 3,237 3.5 95,595 92,180 3,415 3.6 96,467 92,110 4,357 4.5
Greenville -Ander son-Mauldin
Hilton Head IslandBluffton-Beaufort
Myrtle BeachConway-North Myrtle Beach
437,680 425,095 12,585 2.9 441,766 428,062 13,704 3.1 432,880 416,763 16,117 3.7
91,264 88,520 2,744 3.0 92,911 89,947 2,964 3.2 90,833 87,500 3,333 3.7
210,766 202,229 8,537 4.1 215,611 206,496 9,115 4.2 208,689 197,688 11,001 5.3
Spartanburg ↓ 168,288 162,821 5,467 3.2 170,805 164,841 5,964 3.5 167,242 159,901 7,341 4.4 Sumter
Augusta-Richmond County, GA (SC portion)
Charlotte-Con cord-Gastonia, NC (SC portion)
41,003 39,408 1,595 3.9 42,165 40,481 1,684 4.0 42,444 40,359 2,085 4.9
84,567 82,051 2,516 3.0 85,477 82,715 2,762 3.2 84,501 81,524 2,977 3.5
207,463 200,498 6,965 3.4 210,172 202,867 7,305 3.5 201,618 193,424 8,194 4.1
AUGUST
CITIES
Aiken
13,008 12,590 418 3.2 13,011 12,619 392 3.0 13,072 12,503 569 4.4
Anderson ↓ 11,496 11,107 389 3.4 11,530 11,122 408 3.5 11,380 10,891 489 4.3
Bluffton ↑ 13,228 12,892 336 2.5 13,321 13,017 304 2.3 13,143 12,740 403 3.1
Charleston 76,826 74,853 1,973 2.6 77,107 75,118 1,989 2.6 75,154 72,428 2,726 3.6
Columbia ↓ 56,504 54,427 2,077 3.7 56,593 54,403 2,190 3.9 56,466 53,899 2,567 4.5
Conway 10,472 9,984 488 4.7 10,633 10,132 501 4.7 10,340 9,807 533 5.2
Florence ↑ 19,005 18,306 699 3.7 19,105 18,445 660 3.5 19,519 18,659 860 4.4
Goose Creek 21,087 20,455 632 3.0 21,133 20,500 633 3.0 20,505 19,773 732 3.6
Greenville
Greer
Hanahan
37,091 36,052 1,039 2.8 37,069 36,094 975 2.6 36,633 35,338 1,295 3.5
18,300 17,836 464 2.5 18,279 17,848 431 2.4 18,053 17,490 563 3.1
14,687 14,354 333 2.3 14,696
Mount
300,000
275,000
250,000
225,000
200,000
175,000
150,000
125,000
100,000
75,000
50,000
25,000
SC Department of Employment and Workforce Labor Market Information Division Columbia, South Carolina 29202
2,350,000
2,300,000
2,250,000
2,200,000
2,150,000
56 8 56 9 57 0 57 1 57 2 57 3 57 4 57.5 57 6 57.7 57 8 EMPLOYMENT 2,050,000
LABOR FORCE PARTICIPATION RATE (PERCENT) 2,000,000
2,100,000
1,950,000
1,900,000
AUGUST 2022 JULY 2022 AUGUST 2021 # CHANGE % CHANGE # CHANGE % CHANGE
Total Nonfarm 2,242.4 2,232.8 2,156.4 +9.6 +0.4% +86.0 +4.0%
Total Private
1,867.0 1,859.4 1,788.4 +7.6 +0.4% +78.6 +4.4%
Goods Producing 368.0 366.6 357.9 +1.4 +0.4% +10.1 +2.8%
Mining, Logging and Construction 108.0 107.9 108.8 +0.1 +0.1% -0.8 -0.7%
Mining and Logging 4.6 4.7 4.3 -0.1 -2.1% +0.3 +7.0%
Construction 103.4 103.2 104.5 +0.2 +0.2% -1.1 -1.1%
Manufacturing 260.0 258.7 249.1 +1.3 +0.5% +10.9 +4.4%
Durable Goods 153.4 153.2 148.7 +0.2 +0.1% +4.7 +3.2%
Non-Durable Goods 106.6 105.5 100.4 +1.1 +1.0% +6.2 +6.2%
Service-Providing
1,874.4 1,866.2 1,798.5 +8.2 +0.4% +75.9 +4.2%
Private Service Providing 1,499.0 1,492.8 1,430.5 +6.2 +0.4% +68.5 +4.8%
Trade, Transportation, and Utilities 438.9 436.6 413.3 +2.3 +0.5% +25.6 +6.2%
Wholesale Trade 79.1 78.6 74.5 +0.5 +0.6% +4.6 +6.2%
Retail Trade 263.0 261.7 250.0 +1.3 +0.5% +13.0 +5.2%
Transportation, Warehousing, and Utilities 96.8 96.3 88.8 +0.5 +0.5% +8.0 +9.0%
Information 29.9 30.0 27.9 -0.1 -0.3% +2.0 +7.2%
Financial Activities 116.5 116.4 110.5 +0.1 +0.1% +6.0 +5.4%
Finance and Insurance 82.9 82.4 79.1 +0.5 +0.6% +3.8 +4.8%
Real Estate and Rental and Leasing 33.6 34.0 31.4 -0.4 -1.2% +2.2 +7.0%
Professional and Business Services 304.1 300.2 297.0 +3.9 +1.3% +7.1 +2.4%
Professional, Scientific, and Technical Services 111.8 110.5 107.2 +1.3 +1.2% +4.6 +4.3%
Management of Companies and Enterprises 23.9 24.1 24.1 -0.2 -0.8% -0.2 -0.8%
Administrative and Support and Waste Management and Remediation Services 168.4 165.6 165.7 +2.8 +1.7% +2.7 +1.6%
Education and Health Services 259.8 260.8 256.2 -1.0 -0.4% +3.6 +1.4%
Educational Services 45.4 45.4 40.8 +0.0 +0.0% +4.6 +11.3%
Health Care Services 214.4 215.4 215.4 -1.0 -0.5% -1.0 -0.5%
Leisure and Hospitality 267.4 266.2 248.5 +1.2 +0.5% +18.9 +7.6%
Arts, Entertainment, and Recreation 32.9 32.7 29.9 +0.2 +0.6% +3.0 +10.0%
Accommodation and Food Services 234.5 233.5 218.6 +1.0 +0.4% +15.9 +7.3%
Other Services 82.4 82.6 77.1 -0.2 -0.2% +5.3 +6.9%
Government
Federal Government
373.4 368.0 +2.0 +0.5% +7.4 +2.0%
36.1 36.1 +0.0 +0.0% +0.0 +0.0%
State Government 112.4 112.2 107.4 +0.2 +0.2% +5.0 +4.7%
Local Government
225.1 224.5 +1.8 +0.8% +2.4 +1.1%
Total Nonfarm
AUGUST 2022
AUGUST
2022
# CHANGE
CHANGE
# CHANGE
2,243,000 2,233,400 2,162,900 +9,600 +0.4% +80,100 +3.7%
Total Private 1,878,200 1,874,700 1,802,100 +3,500 +0.2% +76,100 +4.2%
Goods Producing 368,900 367,800 359,300 +1,100 +0.3% +9,600 +2.7%
Mining, Logging and Construction
108,200 108,500 109,400 -300 -0.3% -1,200 -1.1%
Mining and Logging 4,600 4,700 4,300 -100 -2.1% +300 +7.0%
Construction 103,600 103,800 105,100 -200 -0.2% -1,500 -1.4%
Construction of Buildings 24,200 24,800 24,800 -600 -2.4% -600 -2.4%
Heavy and Civil Engineering Construction 15,800 16,100 16,200 -300 -1.9% -400 -2.5%
Specialty Trade Contractors 63,600 62,900 64,100 +700 +1.1% -500 -0.8%
Manufacturing 260,700 259,300 249,900 +1,400 +0.5% +10,800 +4.3%
Durable Goods 154,000 153,500 149,300 +500 +0.3% +4,700 +3.1%
Fabricated Metal Product Manufacturing 24,400 24,400 23,500 +0 +0.0% +900 +3.8%
Transportation Equipment Manufacturing 51,400 51,100 48,300 +300 +0.6% +3,100 +6.4%
Non-Durable Goods 106,700 105,800 100,600 +900 +0.9% +6,100 +6.1%
Textile Mills 13,200 12,900 12,700 +300 +2.3% +500 +3.9%
Plastics and Rubber Products Manufacturing 25,700 25,500 24,000 +200 +0.8% +1,700 +7.1%
Service-Providing
1,874,100 1,865,600 1,803,600 +8,500 +0.5% +70,500 +3.9%
Private Service Providing 1,509,300 1,506,900 1,442,800 +2,400 +0.2% +66,500 +4.6%
Trade, Transportation, and Utilities 437,400 436,400 414,000 +1,000 +0.2% +23,400 +5.7%
Wholesale Trade 79,300 79,500 74,800 -200 -0.3% +4,500 +6.0%
Merchant Wholesalers, Durable Goods 44,100 43,900 39,900 +200 +0.5% +4,200 +10.5%
Merchant Wholesalers, Nondurable Goods 22,100 22,300 21,300 -200 -0.9% +800 +3.8%
Retail Trade 262,000 261,500 250,800 +500 +0.2% +11,200 +4.5%
Motor Vehicle and Parts Dealers 34,100 34,600 33,000 -500 -1.4% +1,100 +3.3%
51,200 51,100 48,400 +100 +0.2% +2,800 +5.8%
Food and Beverage Stores
Health and Personal Care Stores 15,800 15,600 15,300 +200 +1.3% +500 +3.3%
Clothing and Clothing Accessories Stores 17,600 17,400 17,000 +200 +1.1% +600 +3.5%
General Merchandise Stores 56,500 57,300 55,900 -800 -1.4% +600 +1.1%
Transportation, Warehousing, and Utilities 96,100 95,400 88,400 +700 +0.7% +7,700 +8.7%
Utilities 11,000 11,100 11,000 -100 -0.9% +0 +0.0%
Transportation and Warehousing 85,100 84,300 77,400 +800 +0.9% +7,700 +9.9%
Information 30,200 30,400 27,900 -200 -0.7% +2,300 +8.2%
Financial Activities 117,300 117,100 111,600 +200 +0.2% +5,700 +5.1%
Finance and Insurance 83,300 82,600 79,100 +700 +0.8% +4,200 +5.3%
Credit Intermediation and Related Activities including Monetary Authorities 39,500 39,400 37,400 +100 +0.3% +2,100 +5.6%
Real Estate and Rental and Leasing 34,000 34,500 32,500 -500 -1.4% +1,500 +4.6%
Professional and Business Services 302,800 297,900 296,400 +4,900 +1.6% +6,400 +2.2%
Professional, Scientific, and Technical Services 111,000 110,300 106,800 +700 +0.6% +4,200 +3.9%
Architectural, Engineering, and Related Services 22,000 22,000 21,100 +0 +0.0% +900 +4.3%
Management of Companies and Enterprises 24,100 24,200 24,200 -100 -0.4% -100 -0.4%
Administrative and Support and Waste Management and Remediation Services 167,700 163,400 165,400 +4,300 +2.6% +2,300 +1.4%
Administrative and Support Services 154,200 149,700 152,900 +4,500 +3.0% +1,300 +0.9%
Employment Services 72,600 69,500 72,300 +3,100 +4.5% +300 +0.4%
Services to Buildings and Dwellings 39,300 38,200 38,200 +1,100 +2.9% +1,100 +2.9%
Education and Health Services 259,200 258,200 255,300 +1,000 +0.4% +3,900 +1.5%
Educational Services 43,700 43,100 40,200 +600 +1.4% +3,500 +8.7%
Health Care and Social Assistance 215,500 215,100 215,100 +400 +0.2% +400 +0.2%
Ambulatory Health Care Services 105,000 104,600 103,000 +400 +0.4% +2,000 +1.9%
Hospitals 36,200 36,100 36,000 +100 +0.3% +200 +0.6%
Nursing and Residential Care Facilities 37,300 37,000 38,400 +300 +0.8% -1,100 -2.9%
Leisure and Hospitality 279,500 283,900 259,800
-1.5% +19,700 +7.6%
+3,100
+2,500
-1.4% +16,600 +7.3%
AUGUST
AREA
Charleston-North Charleston $1,091.24 $1,073.72 $1,039.14 +$17.52 +1.6% +$52.10 +5.0%
Columbia $893.71 $923.13 $858.64 -$29.42 -3.2% +$35.07 +4.1%
Florence $758.59 $780.30 $788.05 -$21.71 -2.8% -$29.46 -3.7%
Greenville-Anderson-Mauldin $1,046.19 $1,030.60 $992.17 +$15.59 +1.5% +$54.02 +5.4%
Hilton
Myrtle
$844.02 +$14.88 +1.9% -$25.31 -3.0%
$838.35 $829.69 $770.58 +$8.66 +1.0% +$67.77 +8.8%
Spartanburg $971.97 $959.05 $966.40 +$12.92 +1.4% +$5.57 +0.6%
Sumter $744.19 $743.04 $668.04 +$1.15 +0.2% +$76.15 +11.4%
AREA
Charleston-North Charleston
Columbia
Florence
Greenville-Anderson-Mauldin
AUGUST
-0.3% -0.6 -1.7%
-0.6% +0.3 +0.9%
-0.9% -0.4 -1.2%
+0.6 +1.7% -0.1 -0.3%
Hilton Head Island-Bluffton-Beaufort 30.3 31.0 32.4 -0.7 -2.3% -2.1 -6.5%
Myrtle Beach-Conway-North Myrtle Beach
Spartanburg
Sumter
Columbia
33.7 32.5 +0.2 +0.6% +1.4 +4.3%
35.7 +0.9 +2.6% +0.1 +0.3%
29.3 +0.3 +0.9% +3.0 +10.2%
Total
JULY 2022
AUGUST 2022 JULY 2022 AUGUST 2021 # CHANGE % CHANGE # CHANGE % CHANGE
$982.10 $972.49 $924.60 +$9.61 +1.0% +$57.50 +6.2%
Goods Producing $1,277.54 $1,285.61 $1,193.54 -$8.07 -0.6% +$84.00 +7.0%
Construction $1,276.47 $1,255.93 $1,176.67 +$20.54 +1.6% +$99.80 +8.5%
Manufacturing $1,271.63 $1,293.85 $1,214.09 -$22.22 -1.7% +$57.54 +4.7%
Private
Trade,
$910.15 $897.08 $856.09 +$13.07 +1.5% +$54.06 +6.3%
$813.62 $835.98 $837.50 -$22.36 -2.7% -$23.88 -2.9%
Financial Activities $1,203.20 $1,157.16 $1,220.72 +$46.04 +4.0% -$17.52 -1.4%
Professional and Business Services $1,222.13 $1,219.96 $1,053.55 +$2.17 +0.2% +$168.58 +16.0%
Education and Health Services $1,003.13 $1,000.98 $969.49 +$2.15 +0.2% +$33.64 +3.5%
Leisure and Hospitality $449.02 $442.78 $400.30 +$6.24 +1.4% +$48.72 +12.2%
Other Services $837.67 $810.12 $774.00 +$27.55 +3.4% +$63.67 +8.2%
JULY
AUGUST
JULY
AUGUST
Total Private 35.0 34.4 34.5 +0.6 +1.7% +0.5 +1.5%
Goods Producing
Construction
Manufacturing
Private Service Providing
+0.5 +1.2% +0.1 +0.2%
+0.8 +1.9% +0.9 +2.2%
+0.4 +1.0% +0.0 +0.0%
32.7 +0.6 +1.8% +0.7 +2.1%
-0.3 -0.9% -0.6 -1.8%
+0.2 +0.5% -0.5 -1.3%
+1.4 +3.7% +1.9 +5.1%
-0.2 -0.6% +0.5 +1.6%
AUGUST 2022 JULY 2022 AUGUST 2021 # CHANGE % CHANGE # CHANGE % CHANGE
Total Nonfarm 395,100 393,600 376,800 +1,500 +0.4% +18,300 +4.9%
Total Private 324,900 323,500 306,800 +1,400 +0.4% +18,100 +5.9%
Goods Producing 51,300 51,200 49,400 +100 +0.2% +1,900 +3.9%
Service-Providing 343,800 342,400 327,400 +1,400 +0.4% +16,400 +5.0%
Private Service Providing 273,600 272,300 257,400 +1,300 +0.5% +16,200 +6.3%
Mining, Logging and Construction 22,100 22,000 21,400 +100 +0.5% +700 +3.3%
Manufacturing 29,200 29,200 28,000 0 0% +1,200 +4.3%
Trade, Transportation, and Utilities 69,800 69,200 68,200 +600 +0.9% +1,600 +2.4%
Wholesale Trade 11,600 11,700 10,900 -100 -0.9% +700 +6.4%
Retail Trade 41,900 41,300 41,100 +600 +1.5% +800 +2.0%
General Merchandise Stores 7,500 7,500 7,400
0 0% +100 +1.4%
Transportation, Warehousing, and Utilities 16,300 16,200 16,200 +100 +0.6% +100 +0.6%
Information 7,900 8,000 7,300 -100 -1.3% +600 +8.2%
Financial Activities 17,200 17,000 16,800 +200 +1.2% +400 +2.4%
Professional and Business Services 64,500 63,500 57,900 +1,000 +1.6% +6,600 +11.4%
Administrative and Support and Waste Management and Remediation Services 29,300 29,300 25,800 0 0% +3,500 +13.6%
Education and Health Services 44,000 43,600 43,700 +400 +0.9% +300 +0.7%
Leisure and Hospitality 54,500 55,300 48,600 -800 -1.5% +5,900 +12.1%
Accommodation and Food Services 48,700 49,400 42,900 -700 -1.4% +5,800 +13.5%
Food Services and Drinking Places 40,400 40,400 35,100 0 0% +5,300 +15.1%
Other Services 15,700 15,700 14,900 0 0% +800 +5.4%
Government 70,200 70,100 70,000 +100 +0.1% +200 +0.3%
Federal Government 11,600 11,800 12,000 -200 -1.7% -400 -3.3%
State Government 30,200 30,000 29,800 +200 +0.7% +400 +1.3%
Local Government 28,400 28,300 28,200 +100 +0.4% +200 +0.7%
Current month’s estimates are preliminary. All data are subject to revision.
of Employment
Market
Workforce
South Carolina
AUGUST 2022 JULY 2022 AUGUST 2021 # CHANGE % CHANGE # CHANGE % CHANGE
Total Nonfarm 402,800 400,200 394,200 +2,600 +0.7% +8,600 +2.2%
Total Private 326,800 325,000 317,400 +1,800 +0.6% +9,400 +3.0%
Goods Producing 48,300 48,300 48,900 0 0% -600 -1.2%
Service-Providing 354,500 351,900 345,300 +2,600 +0.7% +9,200 +2.7%
Private Service Providing 278,500 276,700 268,500 +1,800 +0.7% +10,000 +3.7%
Mining, Logging and Construction 16,100 15,900 17,200 +200 +1.3% -1,100 -6.4%
Manufacturing 32,200 32,400 31,700 -200 -0.6% +500 +1.6%
Trade, Transportation, and Utilities 76,600 76,300 74,300 +300 +0.4% +2,300 +3.1%
Wholesale Trade 16,100 16,200 15,000 -100 -0.6% +1,100 +7.3%
Retail Trade 44,000 43,600 42,700 +400 +0.9% +1,300 +3.0%
Transportation, Warehousing, and Utilities 16,500 16,500 16,600 0 0% -100 -0.6%
Information 5,400 5,400 5,000 0 0% +400 +8.0%
Financial Activities 35,000 34,800 33,000 +200 +0.6% +2,000 +6.1%
Credit Intermediation and Related Activities including Monetary Authorities - Central Bank 7,600 7,500 7,300 +100 +1.3% +300 +4.1%
Professional and Business Services 50,100 50,200 52,400 -100 -0.2% -2,300 -4.4%
Administrative and Support and Waste Management and Remediation Services
Education and Health Services
27,200 27,500 29,700 -300 -1.1% -2,500 -8.4%
52,800 52,300 50,300 +500 +1.0% +2,500 +5.0%
Leisure and Hospitality 41,800 40,900 37,500 +900 +2.2% +4,300 +11.5%
Food Services and Drinking Places 35,000 33,900 31,400 +1,100 +3.2% +3,600 +11.5%
Other Services
16,800 16,800 16,000 0 0% +800 +5.0%
Government 76,000 75,200 76,800 +800 +1.1% -800 -1.0%
Federal Government
11,000 11,000 11,100 0 0% -100 -0.9%
State Government 31,300 31,500 29,300 -200 -0.6% +2,000 +6.8%
Local Government 33,700 32,700 36,400 +1,000 +3.1% -2,700 -7.4%
Current month’s estimates are preliminary. All data are subject to revision.
AUGUST 2022 JULY 2022 AUGUST 2021
# CHANGE % CHANGE # CHANGE % CHANGE
Total Nonfarm 441,300 438,900 427,100 +2,400 +0.6% +14,200 +3.3%
Total Private 381,600 380,400 368,300 +1,200 +0.3% +13,300 +3.6%
Goods Producing 80,800 80,100 77,800 +700 +0.9% +3,000 +3.9%
Service-Providing 360,500 358,800 349,300 +1,700 +0.5% +11,200 +3.2%
Private Service Providing 300,800 300,300 290,500 +500 +0.2% +10,300 +3.6%
Mining, Logging and Construction 19,200 19,300 20,000 -100 -0.5% -800 -4.0%
Manufacturing 61,600 60,800 57,800 +800 +1.3% +3,800 +6.6%
Trade, Transportation, and Utilities 82,400 82,500 77,600 -100 -0.1% +4,800 +6.2%
Wholesale Trade 20,000 20,100 18,900 -100 -0.5% +1,100 +5.8%
Retail Trade 48,600 48,600 45,400 0 0% +3,200 +7.1%
Transportation, Warehousing, and Utilities 13,800 13,800 13,300 0 0% +500 +3.8%
Information 7,100 7,200 6,800 -100 -1.4% +300 +4.4%
Financial Activities 22,000 22,000 20,400 0 0% +1,600 +7.8%
Professional and Business Services 72,900 71,900 73,200 +1,000 +1.4% -300 -0.4%
Professional, Scientific, and Technical Services 25,500 25,800 23,800 -300 -1.2% +1,700 +7.1%
Management of Companies and Enterprises 5,800 5,900 5,600 -100 -1.7% +200 +3.6%
Administrative and Support and Waste Management and Remediation Services
41,600 40,200 43,800 +1,400 +3.5% -2,200 -5.0%
Education and Health Services 53,900 53,900 53,400 0 0% +500 +0.9%
Educational Services 11,900 11,800 10,800 +100 +0.9% +1,100 +10.2%
Health Care and Social Assistance
Leisure and Hospitality
Other Services
42,000 42,100 42,600 -100 -0.2% -600 -1.4%
47,000 47,200 44,600 -200 -0.4% +2,400 +5.4%
15,500 15,600 14,500 -100 -0.6% +1,000 +6.9%
Government 59,700 58,500 58,800 +1,200 +2.1% +900 +1.5%
Federal Government
State Government
3,000 3,000 2,900 0 0% +100 +3.5%
13,300 13,400 12,500 -100 -0.8% +800 +6.4%
Local Government 43,400 42,100 43,400 +1,300 +3.1%
Current month’s estimates are preliminary. All data are subject to revision.
0 0%
SC Department of Employment and Workforce Labor Market Information Division Columbia, South Carolina 29202
JULY 2022 TO AUGUST 2022
AUGUST 2022
JULY 2022 AUGUST 2021 # CHANGE % CHANGE # CHANGE % CHANGE
Total Nonfarm 185,300 186,700 179,400 -1,400 -0.8% +5,900 +3.3%
Total Private 162,200 164,100 156,800 -1,900 -1.2% +5,400 +3.4%
Goods Producing 15,900 16,000 15,800 -100 -0.6% +100 +0.6%
Service-Providing 169,400 170,700 163,600 -1,300 -0.8% +5,800 +3.6%
Private Service Providing 146,300 148,100 141,000 -1,800 -1.2% +5,300 +3.8%
Mining, Logging and Construction 10,900 11,000 11,000 -100 -0.9% -100 -0.9%
Manufacturing 5,000 5,000 4,800 0 0% +200 +4.2%
Trade, Transportation, and Utilities
41,700 42,100 39,300 -400 -1.0% +2,400 +6.1%
Wholesale Trade 3,600 3,600 3,400 0 0% +200 +5.9%
Retail Trade 33,300 33,700 31,100 -400 -1.2% +2,200 +7.1%
Transportation, Warehousing, and Utilities
4,800 4,800 4,800
0 0% 0 0%
Information 2,500 2,500 2,400 0 0% +100 +4.2%
Financial Activities 10,400 10,400 10,400 0 0% 0 0%
Professional and Business Services 17,700 17,500 17,400 +200 +1.1% +300 +1.7%
Education and Health Services 20,200 20,100 19,900 +100 +0.5% +300 +1.5%
Leisure and Hospitality 46,800 48,600 45,000 -1,800 -3.7% +1,800 +4.0%
Accommodation and Food Services 39,800 41,700 38,000 -1,900 -4.6% +1,800 +4.7%
Food Services and Drinking Places 30,500 32,300 29,300 -1,800 -5.6% +1,200 +4.1%
Other Services 7,000 6,900 6,600 +100 +1.5% +400 +6.1%
Government 23,100 22,600 22,600 +500 +2.2% +500 +2.2%
Federal Government
State Government
Local Government
1,400 1,400 1,400 0 0% 0 0%
4,700 4,700 4,600 0 0% +100 +2.2%
17,000 16,500 16,600 +500 +3.0% +400 +2.4%
Current month’s estimates are preliminary. All data are subject to revision.
JULY 2022 TO AUGUST 2022
AUGUST 2021 TO AUGUST 2022
AUGUST 2022
JULY 2022
AUGUST 2021
# CHANGE % CHANGE # CHANGE % CHANGE
Total Nonfarm 168,400 167,100 163,300 +1,300 +0.8% +5,100 +3.1%
Total Private 142,000 141,400 137,800 +600 +0.4% +4,200 +3.1%
Goods Producing 46,000 45,700 43,900 +300 +0.7% +2,100 +4.8%
Service-Providing 122,400 121,400 119,400 +1,000 +0.8% +3,000 +2.5%
Private Service Providing 96,000 95,700 93,900 +300 +0.3% +2,100 +2.2%
Mining, Logging and Construction 7,300 7,300 7,300
0 0% 0 0%
Manufacturing 38,700 38,400 36,600 +300 +0.8% +2,100 +5.7%
Durable Goods 26,800 26,800 25,100 0 0% +1,700 +6.8%
Non-Durable Goods 11,900 11,600 11,500 +300 +2.6% +400 +3.5% Transportation, Warehousing, and Utilities 37,200 37,400 36,000 -200 -0.5% +1,200 +3.3%
Wholesale Trade 8,300 8,400 8,200 -100 -1.2% +100 +1.2%
Retail Trade 16,400 16,500 16,100 -100 -0.6% +300 +1.9%
Transportation, Warehousing, and Utilities 12,500 12,500 11,700 0 0% +800 +6.8%
Information 700 700 700 0 0% 0 0%
Financial Activities 5,100 5,000 5,000 +100 +2.0% +100 +2.0%
Professional and Business Services 18,300 18,200 18,300 +100 +0.6% 0 0%
Education and Health Services
Leisure and Hospitality
14,800 14,700 14,900 +100 +0.7% -100 -0.7%
14,500 14,300 13,900 +200 +1.4% +600 +4.3%
Other Services 5,400 5,400 5,100 0 0% +300 +5.9%
Government 26,400 25,700 25,500 +700 +2.7% +900 +3.5%
Federal Government 600 600 700 0 0% -100 -14.3%
State Government 3,600 3,600 3,500 0 0% +100 +2.9%
Local Government 22,200 21,500 21,300 +700 +3.3% +900 +4.2%
Current month’s estimates are preliminary. All data are subject to revision.
Department of Employment and Workforce Labor Market Information Division Columbia, South Carolina 29202
JULY 2022 TO AUGUST 2022
AUGUST 2022 JULY 2022 AUGUST 2021
# CHANGE % CHANGE # CHANGE % CHANGE
Total Nonfarm 89,800 89,900 90,500 -100 -0.1% -700 -0.8%
Total Private 73,300 74,000 73,600 -700 -1.0% -300 -0.4%
Goods Producing 13,900 14,100 14,100 -200 -1.4% -200 -1.4%
Service-Providing 75,900 75,800 76,400 +100 +0.1% -500 -0.7%
Private Service Providing 59,400 59,900 59,500 -500 -0.8% -100 -0.2%
Trade, Transportation, and Utilities 19,100 19,200 19,400 -100 -0.5% -300 -1.6%
Government 16,500 15,900 16,900 +600 +3.8% -400 -2.4%
Federal Government 700 700 700 0 0% 0 0%
State Government 4,200 4,100 4,400 +100 +2.4% -200 -4.6%
Local Government 11,600 11,100 11,800 +500 +4.5% -200 -1.7%
Total Nonfarm
Total
83,900 -300 -0.4% +2,100 +2.5%
75,000 72,300 -600 -0.8% +2,100 +2.9%
6,900
-100 -1.5% -100 -1.5%
-200
-100
-200
-100
-3.0%
YEAR
CIVILIAN NON-INSTITUTIONAL POPULATION
LABOR FORCE PARTICIPATION RATE (PERCENT)
EMPLOYMENT-POPULATION RATIO (PERCENT)
LABOR FORCE EMPLOYMENT UNEMPLOYMENT
UNEMPLOYMENT RATE (PERCENT)
1976 2,007,417 64.7 60.2 1,299,241 1,207,662 91,579 7.0
1977 2,061,250 64.4 60.0 1,327,423 1,237,495 89,928 6.8
1978 2,117,667 64.1 60.5 1,356,921 1,281,597 75,324 5.6
1979 2,169,417 63.4 60.2 1,375,201 1,306,773 68,428 5.0
1980 2,221,250 62.8 58.6 1,395,675 1,301,796 93,879 6.7
1981 2,266,583 63.2 58.0 1,432,219 1,314,907 117,312 8.2
1982 2,307,333 64.2 57.3 1,482,373 1,322,883 159,490 10.8
1983 2,341,083 63.2 56.9 1,479,137 1,333,162 145,975 9.9
1984 2,378,500 62.9 58.5 1,495,188 1,391,286 103,902 6.9
1985 2,426,500 63.8 59.5 1,548,924 1,443,612 105,312 6.8
1986 2,455,333 64.9 60.7 1,592,306 1,491,069 101,237 6.4
1987 2,495,333 65.4 61.8 1,631,897 1,542,170 89,727 5.5
1988 2,533,000 65.6 62.5 1,660,533 1,583,928 76,605 4.6
1989 2,566,000 66.0 62.9 1,693,438 1,615,009 78,429 4.6
1990 2,611,843 66.5 63.3 1,737,831 1,652,949 84,882 4.9
1991 2,663,759 66.3 62.3 1,767,123 1,659,196 107,927 6.1
1992 2,699,745 66.7 62.2 1,799,677 1,678,803 120,874 6.7
1993 2,739,480 66.7 61.8 1,826,650 1,693,483 133,167 7.3
1994 2,775,049 66.4 62.3 1,841,428 1,727,714 113,714 6.2
1995 2,813,952 66.2 62.8 1,864,221 1,768,540 95,681 5.1
1996 2,851,104 66.2 62.4 1,886,064 1,779,221 106,843 5.7
1997 2,897,839 66.3 63.3 1,920,244 1,834,337 85,907 4.5
1998 2,945,825 65.9 63.5 1,940,846 1,870,270 70,576 3.6
1999 2,989,560 65.5 62.8 1,958,598 1,877,345 81,253 4.1
2000 3,027,367 64.9 62.5 1,965,481 1,892,559 72,922 3.7
2001 3,064,191 63.4 60.0 1,941,956 1,839,246 102,710 5.3
2002 3,098,739 63.1 59.0 1,954,548 1,828,735 125,813 6.4
2003 3,133,915 63.8 59.2 1,999,485 1,855,599 143,886 7.2
2004 3,178,645 64.3 59.5 2,043,864 1,891,722 152,142 7.4
2005 3,234,049 64.0 59.4 2,071,111 1,919,644 151,467 7.3
2006 3,305,437 65.0 60.5 2,148,698 2,001,245 147,453 6.9
2007 3,374,548 63.9 60.0 2,155,198 2,024,493 130,705 6.1
2008 3,439,974 62.8 58.2 2,160,084 2,002,903 157,181 7.3
2009 3,490,448 62.1 55.0 2,166,737 1,919,307 247,430 11.4
2010 3,564,619 61.0 54.1 2,174,535 1,928,442 246,093 11.3
2011 3,612,048 60.5 54.2 2,185,171 1,957,493 227,678 10.4
2012 3,655,515 59.9 54.5 2,190,203 1,992,957 197,246 9.0
2013 3,704,281 59.3 54.9 2,197,876 2,034,404 163,472 7.4
2014 3,759,002 59.1 55.4 2,222,426 2,082,941 139,485 6.3
2015 3,822,409 59.3 55.8 2,267,837 2,134,087 133,750 5.9
2016 3,888,005 58.8 55.9 2,286,054 2,174,301 111,753 4.9
2017 3,897,645 58.0 55.6 2,261,766 2,166,708 95,058 4.2
2018 3,948,448 57.7 55.8 2,279,431 2,202,377 77,054 3.4
2019 4,002,601 58.0 56.4 2,321,189 2,256,313 64,876 2.8
2020 4,058,279 57.4 54.0 2,330,863 2,191,331 139,532 6.0
2021 4,117,555 57.4 55.1 2,364,366 2,269,813 94,553 4.0
SC Department of Employment and Workforce
Market
Columbia, South Carolina 29202
YEAR EMPLOYMENT
1939 310,100 1960 582,500 1981 1,196,500 2002 1,795,400
1940 328,600 1961 587,000 1982 1,162,300 2003 1,799,100
1941 387,500 1962 609,800 1983 1,189,000 2004 1,826,600
1942 416,500 1963 630,600 1984 1,262,500 2005 1,862,900
1943 428,500 1964 651,500 1985 1,296,200 2006 1,905,700
1944 408,600 1965 686,000 1986 1,338,000 2007 1,945,000
1945 396,000 1966 734,900 1987 1,392,200 2008 1,926,300
1946 411,600 1967 754,500 1988 1,449,000 2009 1,814,400
1947 436,200 1968 782,900 1989 1,499,700 2010 1,811,300
1948 456,400 1969 819,800 1990 1,527,600 2011 1,832,500
1949 443,100 1970 842,000 1991 1,497,300 2012 1,864,300
1950 461,400 1971 862,600 1992 1,511,800 2013 1,901,000
1951 505,800 1972 920,300 1993 1,553,000 2014 1,951,300
1952 544,300 1973 984,000 1994 1,592,000 2015 2,006,700
1953 543,900 1974 1,015,800 1995 1,636,300 2016 2,055,300
1954 519,700 1975 982,600 1996 1,669,400 2017 2,096,100
1955 533,000 1976 1,038,100 1997 1,718,800 2018 2,154,800
1956 542,900 1977 1,081,700 1998 1,779,800 2019 2,189,600
1957 545,000 1978 1,137,500 1999 1,826,300 2020 2,081,600
1958 545,900 1979 1,176,000 2000 1,854,000 2021 2,146,300
1959 566,900 1980 1,188,800 2001 1,814,800
2007
2008
2009
2014
2015
2016
2017
2018
2020
1. Household Survey: Nationally, there is a monthly Current Population Survey of about 60,000 households conducted by the Census Bureau for the Bureau of Labor Statistics (BLS) to determine employment status of the civilian population. This information, along with other inputs, are used by DEW to operate the Local Area Unemployment Statistics program, which estimates the number of individuals employed and those not employed, but actively seeking employment for statewide and a variety of sub-state geographies.
2. Employer Survey: BLS conducts a monthly Current Employment Statistics survey of about 44,000 employers which yields national estimates of nonagricultural wage and salary employment, hours, and earnings by industry. These data are processed by DEW to generate comparable data for the state and its metropolitan statistical areas.
3. Seasonally Adjusted: Seasonal adjustment removes the effects of events that follow a regular pattern each year (i.e. tourist-related hiring and school closings in the summer). These adjustments make it easier to observe the cyclical and other nonseasonal movements in data over time.
4. Not Seasonally Adjusted: Effects of regular or seasonal patterns have not been removed from these data.
Data is published by Industry
Counts Jobs
Utilizes an Establishment Survey
Data is published by County
Counts People
The Current Population Survey (CPS), which is a Household Survey, is used to calculate LAUS
Reference week is the Pay Period that includes the 12th of the month
A job held by a person on unpaid leave during the reference week is not counted since they are not receiving pay
Does not count selfemployed workers
Does not include agricultural workers
Reference week is the Calendar Week that includes the 12th of the month
A person on unpaid leave is counted as employed because they will return to their job
Does count self-employed workers
Includes both agricultural and non-agricultural workers
Does not count unpaid family workers
Counts unpaid family workers if they worked at least 15 unpaid hours for a family business or family farm during the reference week
Workers on strike during the entire reference period are not counted
Workers on strike during the reference week are counted as employed in LAUS
SC Department of Employment and Workforce Labor Market Information Division Columbia, South Carolina 29202

Do you need some help finding the data you need? Have a great idea for a research project you’d like to discuss with someone? We love to collaborate!
DATA TRENDS is prepared by the LMI Division of the S.C. Department of Employment and Workforce with funding provided by the US Department of Labor. Featured data is prepared in conjunction with the Bureau of Labor Statistics and current month estimates are always preliminary, with all previous data subject to revision.
Interested in staying up to date with Trends as it’s released? Subscribe by clicking here!
SC Department of Employment and Workforce
Labor Market Information Division Columbia, South Carolina 29202