

April 2024 Issue
dew.sc.gov scworkforceinfo.com SC Department of Employment and Workforce Labor Market Information Division Columbia, South Carolina 29202
South Carolina Data TRENDS
AT A GLANCE

2
Interview with Senior Advisor to the CCWD, Charles Appleby and Senior Analyst for the CCWD, Robert Davis . . . . . . . . . . . . . . . . . . . . . . . . . . . . . . . . . . . 4 South Carolina’s Employment Situation (April 2024) . . . . . . . . . . . . . . . . . . . . . . . . . . . . . . 8 Local Area Unemployment Statistics . . . . . . . . . . . . . . . . . . . . . . . . . . . . . . . . . . . . . . . . . . . . . 12 Current Employment Statistics — Seasonally Adjusted . . . . . . . . . . . . . . . . . . . . . . . . . . 18 Current Employment Statistics — Not Seasonally Adjusted . . . . . . . . . . . . . . . . . . . . .20 Long-Run Trends 30 Technical Notes 34 Interested in receiving the latest issue of Trends in your inbox every month? Click here to subscribe to our Trends mailing list!
NOTE FROM THE ASSISTANT EXECUTIVE DIRECTOR
Want to know how many people worked for public school districts in April? Turn to page 21
Welcome back to Trends! In the May 11 issue of the Wall Street Journal, I found an amazing statistic As the article told it, two decades ago, “average pay for manufacturing workers in Michigan was 42% more than in South Carolina . Last year, Michigan was 3% less .” Was that really true? It turns out that, yes, wages really have grown that much faster here than in the Rust Belt states that had traditionally housed our nation’s factories The average manufacturing worker made $1,330 per week in South Carolina last year, more than comparable workers in not only Michigan, but also New York, Ohio, and Pennsylvania Check out this blog post from our Labor Market Analytics Director, Brandon Wilkerson, to learn more
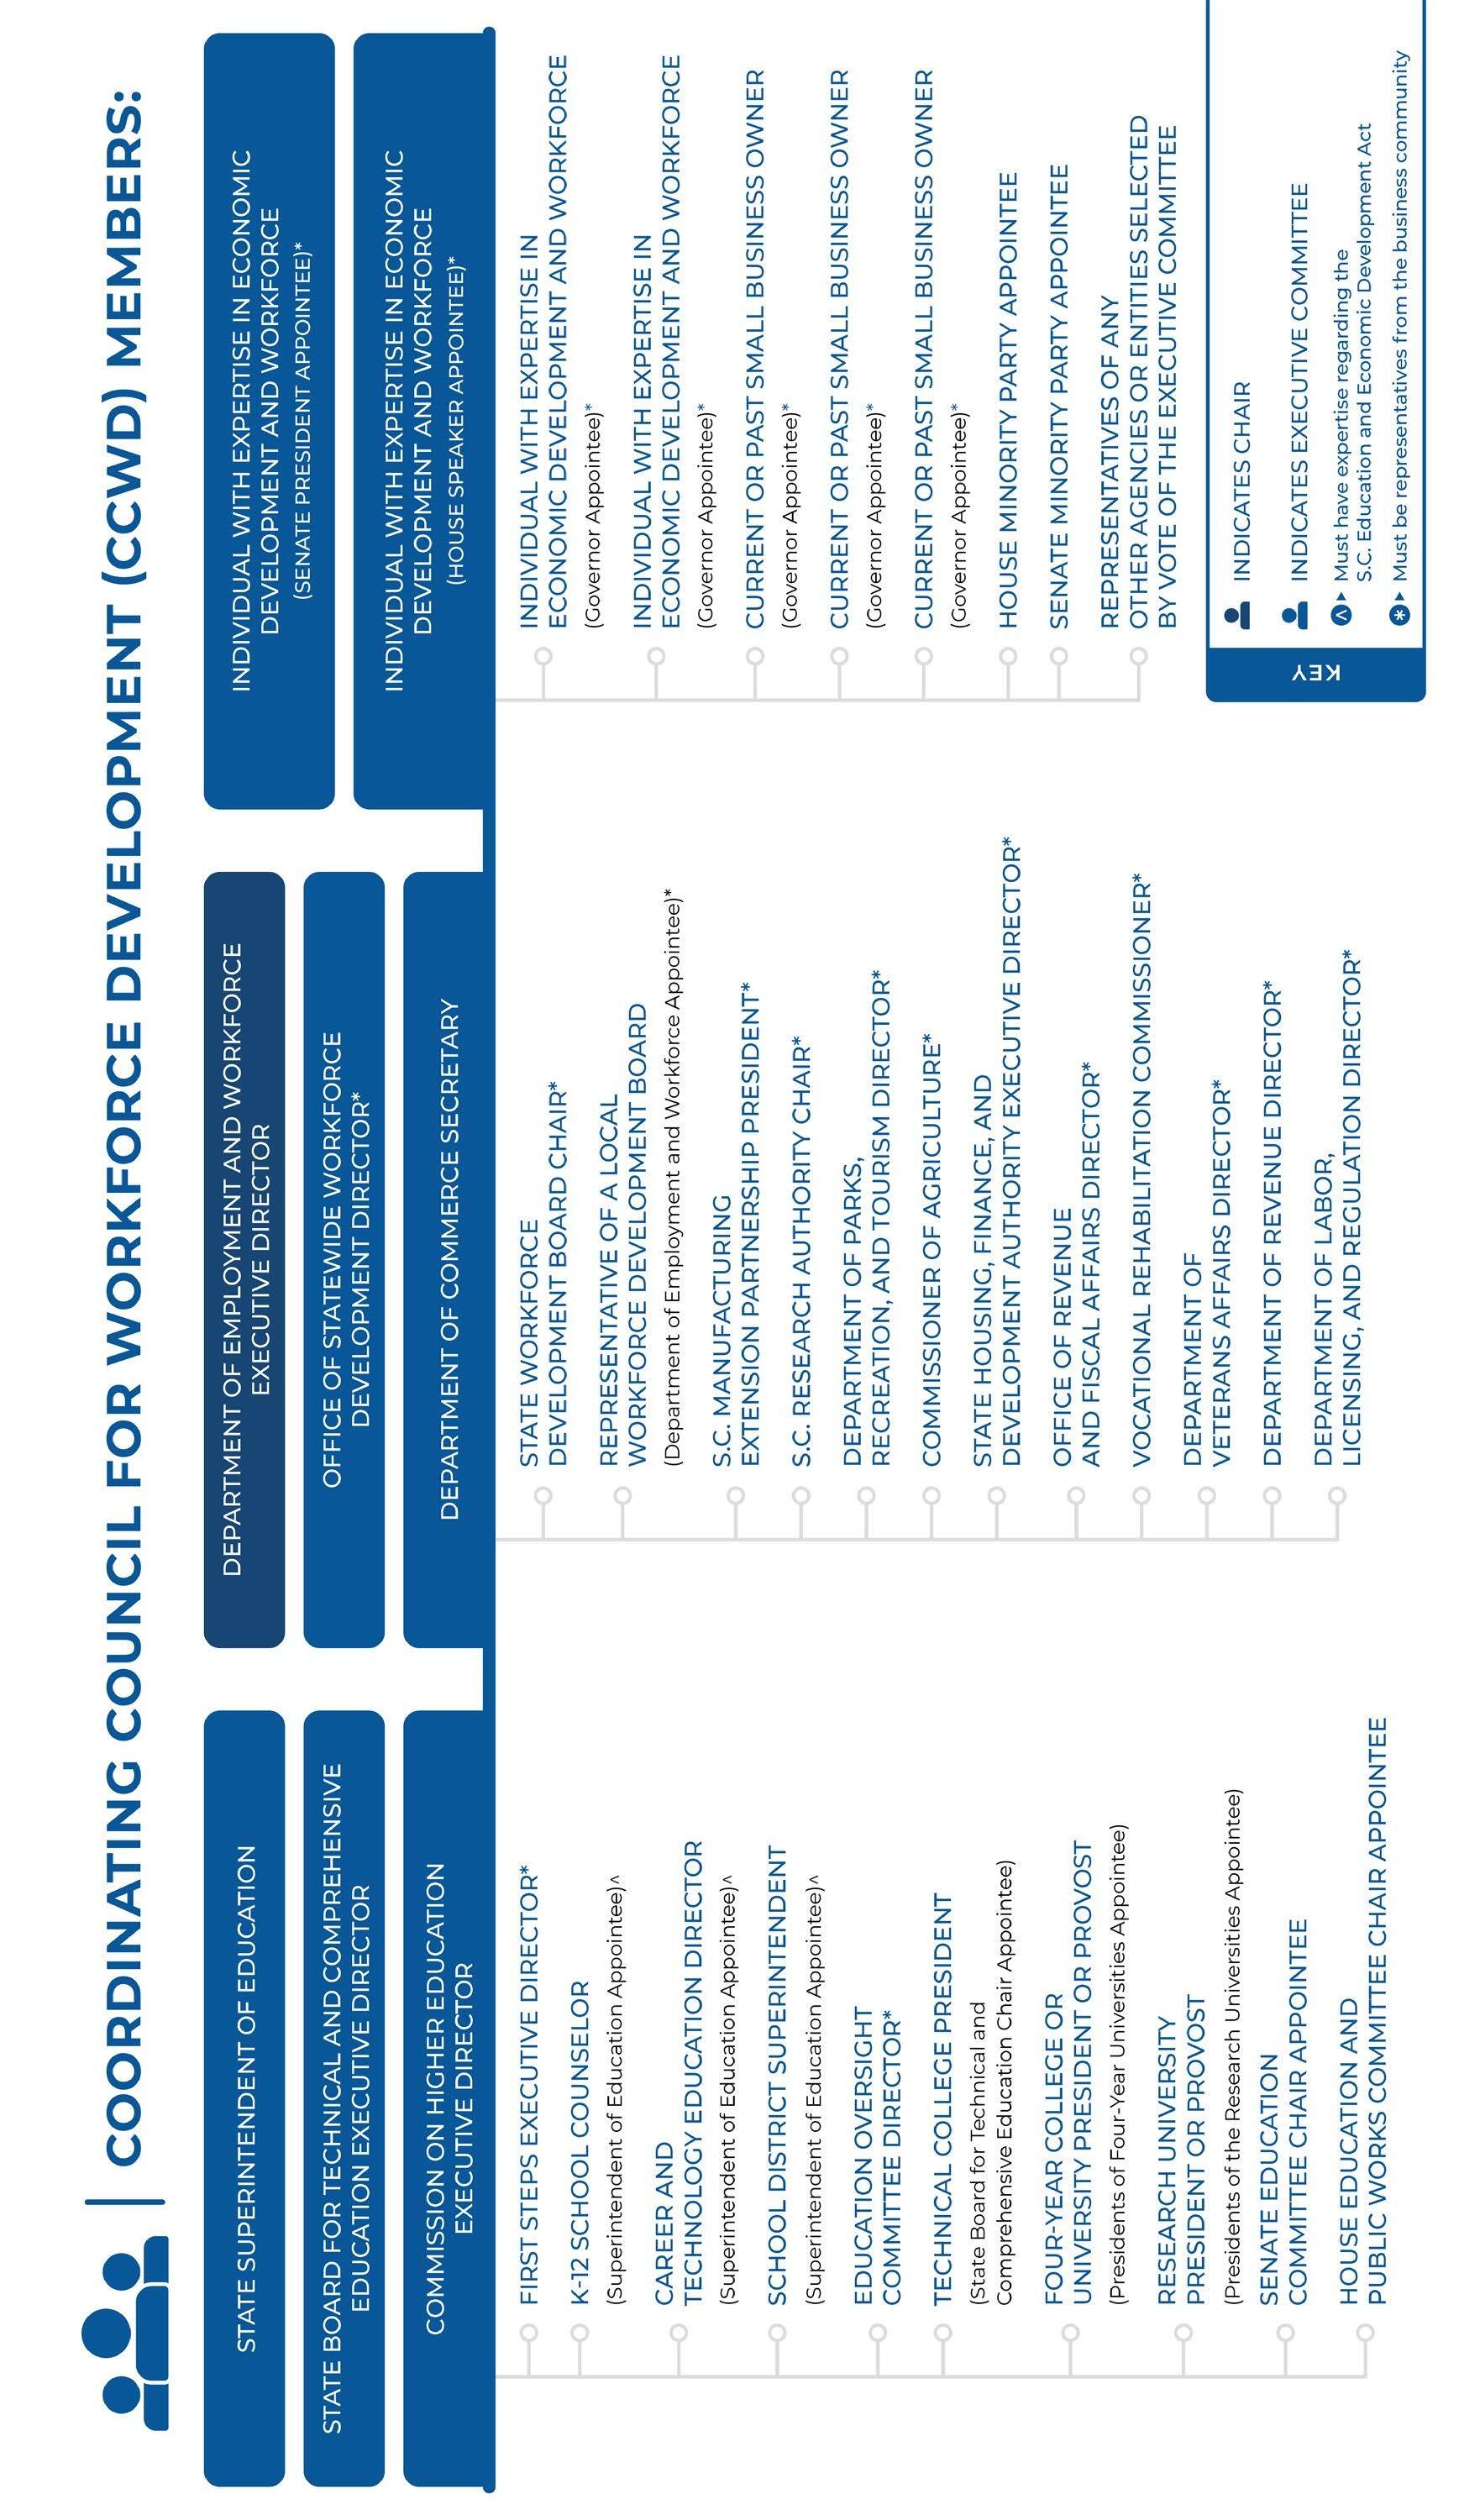
This month’s featured article is an interview with Charles Appleby and Robert Davis, who serve as Senior Advisor and Senior Analyst for the Coordinating Council for Workforce Development, or CCWD, respectively I’ve talked a fair bit about them in these pages before, but as we approach the one-year anniversary of the Statewide Education and Workforce Development Act taking effect, Charles talks about the progress that has already been made and the road ahead as DEW and other agencies across state government work to implement this milestone legislation LMI is playing our part by producing some of the reports and statistical analysis the legislature requires as part of the Unified State Plan. While we build the Education and Workforce Portal, you can keep tabs on what the CCWD is up to by visiting DEW’s website at dew.sc.gov/ccwd
Whatever your data needs, we’re only one click away at lmicustomerservice@dew.sc.gov Please don’t hesitate to reach out if we can help And pro tip: If you need an easy beach read, why not previous issues of Trends?
Click here for the full archive.
Thanks for reading!

 Bryan P Grady, Ph D Assistant Executive Director for Labor Market Information SC Department of Employment and Workforce

3

Interview with Senior Advisor to the CCWD, Charles Appleby and Senior Analyst for the CCWD, Robert Davis
LMI spoke to Charles Appleby, Senior Advisor to the Coordinating Council for Workforce Development (CCWD; or “the Council”) and Robert Davis, Senior Analyst for the CCWD, about the Council’s work in the last 12 months since passage of Act 67 of 2023, the S.C. Education and Workforce Act.
Can you give us a summary of the Council’s work during the last 12 months?
"The Council has spent the last year working towards the development of a Unified State Plan for Education and Workforce – usually called the USP – as well as identification of priority occupations and high-value credentials.
Additionally, the Council is creating a web-based interface, known as the Portal, that will enable employers, job seekers, students, and educators to find the information and resources they need in an easily understood format. The Portal will depict relevant information derived from a multitude of databases and computer systems across the state. While it will take a few years to build the Portal, the Council is creating an interim hub we hope to release by the end of the year. The hub will include, among other resources, a menu of services for employers to search across numerous agencies and entities.
Also, the Council is coordinating collaboration across agencies with education and workforce data such as return on investment analyses for certain majors.
None of these efforts would be possible without the active collaboration and participation of Council members and other partners."
What kind of data is being used for these projects and how important is the data to the Council?
"Labor market data is a crucial resource the Council uses to guide our perceptions of industry needs, along with information from industry associations. Combining labor market data, such as current and forecasted demand based on job postings, with education data like program offerings and the number of graduates in each, gives stakeholders a better-informed perspective on issues statewide as well as those regional and local."

5 dew.sc.gov scworkforceinfo.com
Speaking of the future, has the plan for education and workforce been exciting so far?
"It is very exciting to implement the framework in Act 67 that the General Assembly and Governor’s Office worked hard to enact. Additionally, it has been an honor working with talented and hardworking individuals within state, regional, and local organizations; the passion demonstrated for improving education and workforce outcomes and supporting communities is inspiring."
How does this partnership between state agencies and associations bridge the gap between education and workforce?
"The USP, and performance metrics within it, will be the first-time education, economic development and workforce partners formally agree on a common direction. Unified goals built over many months will serve as the starting point for bridging the gap between education and workforce with communication, collaboration, and cooperation solidifying efforts going forward. As an example, educators will have access to information about priority occupations in their area calculated from labor market data. As another example, employers will have the ability to access information about which education institutions in the state offer programs that lead to the jobs the employer is looking to fill."
What is one thing you want everyone to know about the Council and its work?
"Through collaboration and coordination, the Council strives to align and enhance South Carolina’s education and workforce system so it is readily accessible, highly effective, and easily understandable.
South Carolina would not be where we are today without the tremendous work of those throughout the state. We look forward to continuing this work in assisting employers, educators, residents, and all those interested in education and workforce."
Thank you, Charles and Robert!
(Note: This interview has been edited for length and clarity.)
6 SC Department of Employment and Workforce Labor Market Information Division Columbia, South Carolina 29202
7 dew.sc.gov scworkforceinfo.com
South Carolina’s Employment Situation (April 2024)
Household Survey1 (Local Area Unemployment Statistics)
Nationally, there is a monthly Current Population Survey of about 60,000 households conducted by the Census Bureau for the Bureau of Labor Statistics (BLS) to determine employment status of the civilian population This information, along with other inputs, are used by DEW to operate the Local Area Unemployment Statistics program, which estimates the number of individuals employed and those not employed, but actively seeking employment for statewide and a variety of substate geographies
EMPLOYMENT (SEASONALLY ADJUSTED 3 )
• The seasonally adjusted number of South Carolina workers increased to 2,404,450
• That is an increase of 4,810 people over the March 2024 estimate .
• That is an increase of 32,683 people over the April 2023 estimate
NUMBER OF PEOPLE EMPLOYED
2,350,000 2,360,000 2,370,000 2,380,000 2,390,000 2,400,000 2,410,000
SEASONALLY ADJUSTED: Seasonal adjustment removes the effects of events that follow a regular pattern each year (i e tourist-related hiring and school closings in the summer) These adjustments make it easier to observe the cyclical and other nonseasonal movements in data over time
8 SC Department of Employment and Workforce Labor Market Information Division Columbia, South Carolina 29202
UNEMPLOYMENT (SEASONALLY ADJUSTED 3 )
• The estimate of unemployed people increased to 79,793
• That is an increase of 1,845 people from March’s estimate and an increase of 8,870 from the April 2023 estimate
• The state’s seasonally adjusted unemployment rate increased to 3 2 percent The national unemployment rate decreased to 3 9 percent, according to the Current Population Survey
UNEMPLOYMENT RATE
LABOR FORCE:
• The state’s estimated labor force (people working plus unemployed people looking for work) increased to 2,484,243, while the labor force participation rate increased to 57 .2 percent
• That is an increase of 6,655 people over the March 2024 estimate
• That is a significant increase of 41,553 individuals over the April 2023 estimate.
SEASONALLY ADJUSTED: Seasonal adjustment removes the effects of events that follow a regular pattern each year (i e tourist-related hiring and school closings in the summer) These adjustments make it easier to observe the cyclical and other nonseasonal movements in data over time
9 dew.sc.gov scworkforceinfo.com
2.7% 2.7% 2 8% 2.8% 2.9% 2.9% 3 0% 3.0% 3.1% 3.1% 3.2% 2.6% 2.7% 2.8% 2.9% 3.0% 3.1% 3.2% 3.3%
South Carolina’s Employment Situation (cont.)
Employer Survey2 (Current Employment Statistics)
BLS conducts a monthly Current Employment Statistics survey of approximately 119,000 businesses and government agencies which yields national estimates of nonagricultural wage and salary employment, hours, and earnings by industry These data are processed by DEW to generate comparable data for the state and its metropolitan statistical areas
NONAGRICULTURAL EMPLOYMENT BY INDUSTRY (SEASONALLY ADJUSTED 3 )
The monthly survey of businesses in South Carolina marked an estimated increase of 8,100 nonfarm payroll jobs over the month to a level of 2,368,100 .
MARCH 2024 TO APRIL 2024
2023 TO
2024
SEASONALLY ADJUSTED: Seasonal adjustment removes the effects of events that follow a regular pattern each year (i e tourist-related hiring and school closings in the summer) These adjustments make it easier to observe the cyclical and other nonseasonal movements in data over time
10 SC Department of Employment and Workforce Labor Market Information Division Columbia, South Carolina 29202
APRIL
APRIL
JOBS BY INDUSTRY APRIL 2024 MARCH 2024 APRIL 2023 # CHANGE % CHANGE # CHANGE % CHANGE Total Nonfarm Employment 2,368,100 2,360,000 2,290,800 +8,100 ↑ +0.3% ↑ +77,300 ↑ +3.4% ↑ Construction 115,100 115,100 110,300 0 - 0 0% - +4,800 ↑ +4 4% ↑ Manufacturing 266,700 266,200 262,600 +500 ↑ +0 .2% ↑ +4,100 ↑ +1 6% ↑ Trade, Transportation, and Utilities 450,800 447,800 440,300 +3,000 ↑ +0 7% ↑ +10,500 ↑ +2 4% ↑ Information 28,800 29,000 29,300 -200 ↓ -0 7% ↓ -500 ↓ -1 7% ↓ Financial Activities 124,800 124,400 121,300 +400 ↑ +0 3% ↑ +3,500 ↑ +2 9% ↑ Professional and Business Services 318,200 317,900 310,600 +300 ↑ +0 1% ↑ +7,600 ↑ +2 .4% ↑ Education and Health Services 296,000 294,800 277,800 +1,200 ↑ +0 4% ↑ +18,200 ↑ +6 6% ↑ Leisure and Hospitality 293,800 293,000 276,600 +800 ↑ +0 3% ↑ +17,200 ↑ +6 2% ↑ Other Services 90,800 89,900 85,400 +900 ↑ +1 0% ↑ +5,400 ↑ +6 3% ↑ Government 378,500 377,400 372,200 +1,100 ↑ +0 3% ↑ +6,300 ↑ +1 7% ↑
NONAGRICULTURAL EMPLOYMENT BY METROPOLITAN STATISTICAL AREA (SEASONALLY ADJUSTED 3 )
The monthly survey of businesses in South Carolina marked an estimated increase of 8,100 nonfarm payroll jobs over the month to a level of 2,368,100 MARCH 2024 TO APRIL 2024
TO
2024
NOTE: Employment estimates have been rounded to the nearest hundred. Sum of detail may not equal totals due to rounding or the exclusion of certain industries from publication. All data are subject to revision.
SEASONALLY ADJUSTED: Seasonal adjustment removes the effects of events that follow a regular pattern each year (i e tourist-related hiring and school closings in the summer) These adjustments make it easier to observe the cyclical and other nonseasonal movements in data over time
11 dew.sc.gov scworkforceinfo.com
APRIL
INDUSTRY APRIL 2024 MARCH 2024 APRIL 2023 # CHANGE % CHANGE # CHANGE % CHANGE Statewide 2,368,100 2,360,000 2,290,800 +8,100 ↑ +0.3% ↑ +77,300 ↑ +3.4% ↑ Charleston/North Charleston 426,900 425,700 409,200 +1,200 ↑ +0 3% ↑ +17,700 ↑ +4 3% ↑ Columbia 434,500 434,000 422,800 +500 ↑ +0 1% ↑ +11,700 ↑ +2 .8% ↑ Florence 97,600 97,400 94,800 +200 ↑ +0 2% ↑ +2,800 ↑ +3 0% ↑ Greenville/Anderson/Mauldin 466,900 465,800 457,500 +1,100 ↑ +0 2% ↑ +9,400 ↑ +2 1% ↑ Hilton Head-Bluffton-Beaufort 91,300 91,200 88,000 +100 ↑ +0 1% ↑ +3,300 ↑ +3 8% ↑ Myrtle Beach 199,900 199,400 190,200 +500 ↑ +0 .3% ↑ +9,700 ↑ +5 .1% ↑ Spartanburg 175,100 174,600 169,300 +500 ↑ +0 3% ↑ +5,800 ↑ +3 4% ↑ Sumter 38,700 39,000 37,700 -300 ↓ -0 8% ↓ +1,000 ↑ +2 7% ↑
2023
APRIL
JOBS BY
12 SC Department of Employment and Workforce Labor Market Information Division Columbia, South Carolina 29202 3.4% 3.0% 5.7% 2.7% 5.5% 4.5% 2.6% 3.3% 2.3% 3.9% 4.0% 3.1% 3.5% 2.9% 2.5% 3.0% 3.7% 2.6% 3.3% 2.6% 2.6% 2.8% 3.2% 3.0% 4.0% 2.4% 3.3% 2.9% 2.7% 4.4% 2.8% 3.0% 2.6% 2.8% 3.5% 3.4% 2.8%
Local Area Unemployment Statistics
LAUS EMPLOYMENT ESTIMATES (SEASONALLY ADJUSTED)
CIVILIAN NON-INSTITUTIONAL POPULATION CIVILIAN LABOR FORCE TOTAL PERCENT OF POPULATION EMPLOYMENT UNEMPLOYMENT TOTAL PERCENT OF POPULATION TOTAL RATE (%) 4,346,877 2,484,243 57 2% 2,404,450 55 .3% 79,793 3 .2%
Current month’s estimates are preliminary. All data are subject to revision. Population data are not seasonally adjusted. 13 dew.sc.gov scworkforceinfo.com
NOTE:
Unemployment
2.6% 2.3% 3.1% 3.1% 4.4% 2.9% 3.1% 3.1% 4.4% 5.6% 4.6%
Rate by County
STATE OF SOUTH CAROLINA
LOCAL
ESTIMATES
(NOT
APRIL 2024 MARCH 2024 APRIL 2023 AREA LABOR FORCE EMPLOYMENT UNEMPLOYMENT LABOR FORCE EMPLOYMENT UNEMPLOYMENT LABOR FORCE EMPLOYMENT UNEMPLOYMENT LEVEL RATE (%) LEVEL RATE (%) LEVEL RATE (%) Abbeville County ↓ 9,618 9,295 323 3 4% 9,673 9,297 376 3 9% 9,450 9,161 289 3 1% Aiken County ↓ 75,939 73,695 2,244 3 0% 75,191 72,628 2,563 3 4% 74,132 72,370 1,762 2 4% Allendale County ↓ 2,423 2,285 138 5 7% 2,513 2,352 161 6 4% 2,331 2,238 93 4 0% Anderson County ↓ 95,427 92,864 2,563 2 7% 95,683 92,733 2,950 3 1% 93,454 91,355 2,099 2 2% Bamberg County ↓ 4,695 4,436 259 5 5% 4,787 4,476 311 6 5% 4,536 4,354 182 4 0% Barnwell County ↓ 7,502 7,161 341 4 5% 7,623 7,204 419 5 5% 7,737 7,488 249 3 2% Beaufort County ↓ 82,155 79,987 2,168 2 6% 81,837 79,246 2,591 3 2% 77,517 75,800 1,717 2 2% Berkeley County ↓ 118,412 115,369 3,043 2 6% 118,299 114,838 3,461 2 9% 114,874 112,382 2,492 2 2% Calhoun County ↓ 6,803 6,579 224 3 3% 6,839 6,574 265 3 9% 6,476 6,294 182 2 8% Charleston County ↓ 233,271 227,920 5,351 2 3% 232,763 226,476 6,287 2 7% 225,781 221,335 4,446 2 0% Cherokee County ↓ 22,853 21,969 884 3 9% 22,915 21,824 1,091 4 8% 24,176 23,022 1,154 4 8% Chester County ↓ 13,870 13,310 560 4 0% 13,980 13,287 693 5 0% 13,574 13,151 423 3 1% Chesterfield County ↓ 21,503 20,842 661 3 1% 21,679 20,875 804 3 7% 21,441 20,932 509 2 4% Clarendon County ↓ 12,563 12,123 440 3 5% 12,632 12,106 526 4 2% 12,071 11,674 397 3 3% Colleton County ↓ 16,981 16,492 489 2 9% 16,909 16,355 554 3 3% 16,136 15,716 420 2 6% Darlington County ↓ 31,139 30,162 977 3 1% 31,299 30,180 1,119 3 6% 30,262 29,474 788 2 6% Dillon County ↓ 13,152 12,568 584 4 4% 13,371 12,727 644 4 8% 12,951 12,452 499 3 9% Dorchester County ↓ 85,968 83,835 2,133 2 5% 85,941 83,445 2,496 2 9% 83,311 81,608 1,703 2 0% Edgefield County ↓ 10,711 10,389 322 3 0% 10,626 10,274 352 3 3% 10,389 10,122 267 2 6% Fairfield County ↓ 9,677 9,320 357 3 7% 9,738 9,308 430 4 4% 9,234 8,942 292 3 2% Florence County ↓ 69,199 67,184 2,015 2 9% 69,295 66,926 2,369 3 4% 67,366 65,735 1,631 2 4% Georgetown County ↓ 27,445 26,585 860 3 1% 27,210 26,151 1,059 3 9% 26,369 25,691 678 2 6% Greenville County ↓ 271,441 264,367 7,074 2 6% 272,302 263,929 8,373 3 1% 266,138 260,225 5,913 2 2% Greenwood County ↓ 30,176 29,171 1,005 3 3% 30,417 29,287 1,130 3 7% 29,627 28,765 862 2 9% Hampton County ↓ 8,428 8,207 221 2 6% 8,526 8,256 270 3 2% 7,959 7,781 178 2 2% Horry County ↓ 165,220 160,030 5,190 3 1% 162,805 156,219 6,586 4 0% 156,699 152,380 4,319 2 8% Jasper County ↓ 14,336 13,961 375 2 6% 14,213 13,767 446 3 1% 13,399 13,129 270 2 0% Kershaw County ↓ 30,981 30,118 863 2 8% 31,080 30,071 1,009 3 2% 29,627 28,907 720 2 4% Lancaster County ↓ 45,295 43,858 1,437 3 2% 45,455 43,701 1,754 3 9% 44,460 43,297 1,163 2 6% Laurens County ↓ 31,445 30,503 942 3 0% 31,547 30,469 1,078 3 4% 30,740 29,931 809 2 6% Lee County ↓ 6,704 6,436 268 4 0% 6,777 6,464 313 4 6% 6,372 6,160 212 3 3% Lexington County ↓ 159,716 155,953 3,763 2 4% 159,822 155,466 4,356 2 7% 152,952 149,871 3,081 2 0% Marion County ↓ 12,969 12,400 569 4 4% 13,064 12,394 670 5 1% 12,719 12,241 478 3 8% Marlboro County ↓ 7,413 6,999 414 5 6% 7,530 7,039 491 6 5% 7,313 6,817 496 6 8% McCormick County ↓ 3,541 3,425 116 3 3% 3,543 3,399 144 4 1% 3,462 3,365 97 2 8% Newberry County ↓ 19,077 18,531 546 2 9% 19,294 18,638 656 3 4% 19,164 18,761 403 2 1% Oconee County ↓ 35,840 34,890 950 2 7% 35,862 34,756 1,106 3 1% 35,258 34,498 760 2 2% Orangeburg County ↓ 33,491 32,019 1,472 4 4% 33,781 32,099 1,682 5 0% 33,021 31,864 1,157 3 5% Pickens County ↓ 60,584 58,866 1,718 2 8% 60,535 58,715 1,820 3 0% 59,378 57,881 1,497 2 5% Richland County ↓ 207,726 201,510 6,216 3 0% 207,894 200,764 7,130 3 4% 199,247 194,283 4,964 2 5% Saluda County ↓ 8,979 8,745 234 2 6% 9,120 8,840 280 3 1% 8,456 8,257 199 2 4% Spartanburg County ↓ 161,864 157,374 4,490 2 8% 162,026 156,798 5,228 3 2% 157,901 153,974 3,927 2 5% Sumter County ↓ 41,969 40,482 1,487 3 5% 42,243 40,504 1,739 4 1% 42,400 41,115 1,285 3 0% Union County ↓ 11,656 11,261 395 3 4% 11,708 11,214 494 4 2% 11,422 11,006 416 3 6% Williamsburg County ↓ 10,491 10,011 480 4 6% 10,634 10,038 596 5 6% 10,632 10,239 393 3 7% York County ↓ 154,042 149,733 4,309 2 8% 154,002 148,981 5,021 3 3% 151,487 147,986 3,501 2 3% Current month's estimates are preliminary All data are subject to revision ↑ Unemployment Rate Up Substate estimates are not seasonally adjusted and may diverge from state-level figures. ↓ Unemployment Rate Down Unemployment Rate = 14 SC Department of Employment and Workforce Labor Market Information Division Columbia, South Carolina 29202
AREA UNEMPLOYMENT
BY COUNTY
SEASONALLY ADJUSTED)
LOCAL AREA UNEMPLOYMENT ESTIMATES BY MSA
STATISTICAL AREA
LOCAL AREA UNEMPLOYMENT ESTIMATES BY MUNICIPALITY
(NOT SEASONALLY
APRIL 2024 MARCH 2024 APRIL 2023 METROPOLITAN
LABOR FORCE EMPLOYMENT UNEMPLOYMENT LABOR FORCE EMPLOYMENT UNEMPLOYMENT LABOR FORCE EMPLOYMENT UNEMPLOYMENT LEVEL RATE (%) LEVEL RATE (%) LEVEL RATE (%) Charleston-North Charleston ↓ 437,651 427,124 10,527 2 4% 437,003 424,759 12,244 2 8% 423,966 415,325 8,641 2 0% Columbia ↓ 423,882 412,225 11,657 2 8% 424,493 411,023 13,470 3 2% 405,992 396,554 9,438 2 3% Florence ↓ 100,338 97,346 2,992 3 0% 100,594 97,106 3,488 3 5% 97,628 95,209 2,419 2 5% GreenvilleAnderson-Mauldin ↓ 458,897 446,600 12,297 2 7% 460,067 445,846 14,221 3 1% 449,710 439,392 10,318 2 3% Hilton Head IslandBluffton-Beaufort ↓ 96,491 93,948 2,543 2 6% 96,050 93,013 3,037 3 2% 90,916 88,929 1,987 2 2% Myrtle BeachConway-North Myrtle Beach ↓ 226,436 218,939 7,497 3 3% 222,973 213,786 9,187 4 1% 215,498 208,997 6,501 3 0% Spartanburg ↓ 173,520 168,635 4,885 2 8% 173,734 168,012 5,722 3 3% 169,323 164,980 4,343 2 6% Sumter ↓ 41,969 40,482 1,487 3 5% 42,243 40,504 1,739 4 1% 42,400 41,115 1,285 3 0% Augusta-Richmond County, GA (SC portion) ↓ 86,650 84,084 2,566 3 0% 85,817 82,902 2,915 3 4% 84,521 82,492 2,029 2 4% Charlotte-Concord-Gastonia, NC (SC portion) ↓ 213,207 206,901 6,306 3 0% 213,437 205,969 7,468 3 5% 209,521 204,434 5,087 2 4%
ADJUSTED)
APRIL 2024 MARCH 2024 APRIL 2023 CITIES AND TOWNS ABOVE 25,000 POPULATION LABOR FORCE EMPLOYMENT UNEMPLOYMENT LABOR FORCE EMPLOYMENT UNEMPLOYMENT LABOR FORCE EMPLOYMENT UNEMPLOYMENT LEVEL RATE (%) LEVEL RATE (%) LEVEL RATE (%) Aiken ↓ 13,289 12,891 398 3 0% 13,180 12,704 476 3 6% 13,000 12,659 341 2 6% Anderson ↓ 12,054 11,667 387 3 2% 12,087 11,651 436 3 6% 11,784 11,478 306 2 6% Bluffton ↓ 13,958 13,648 310 2 2% 13,917 13,521 396 2 8% 13,177 12,933 244 1 9% Charleston ↓ 82,325 80,391 1,934 2 3% 82,134 79,891 2,243 2 7% 79,805 78,085 1,720 2 2% Columbia ↓ 60,188 58,145 2,043 3 4% 60,166 57,930 2,236 3 7% 57,757 56,059 1,698 2 9% Conway ↓ 11,243 10,809 434 3 9% 11,006 10,552 454 4 1% 10,697 10,292 405 3 8% Florence ↓ 20,325 19,756 569 2 8% 20,374 19,680 694 3 4% 19,842 19,330 512 2 6% Fort Mill ↓ 13,861 13,499 362 2 6% 13,853 13,431 422 3 0% 13,631 13,341 290 2 1% Goose Creek ↓ 22,439 21,859 580 2 6% 22,406 21,758 648 2 9% 21,823 21,293 530 2 4% Greenville ↓ 38,883 37,854 1,029 2 6% 39,041 37,791 1,250 3 2% 38,155 37,261 894 2 3% Greer ↓ 19,167 18,665 502 2 6% 19,223 18,626 597 3 1% 18,742 18,346 396 2 1% Hilton Head Island ↓ 18,420 17,994 426 2 3% 18,361 17,827 534 2 9% 17,405 17,052 353 2 0% Mauldin ↓ 14,405 14,045 360 2 5% 14,455 14,022 433 3 0% 14,125 13,825 300 2 1% Mount Pleasant ↓ 55,090 53,993 1,097 2 0% 55,017 53,651 1,366 2 5% 53,306 52,433 873 1 6% Myrtle Beach ↓ 17,174 16,612 562 3 3% 16,964 16,217 747 4 4% 16,251 15,818 433 2 7% North Augusta ↓ 11,155 10,892 263 2 4% 11,068 10,734 334 3 0% - - -North Charleston ↓ 61,515 59,926 1,589 2 6% 61,321 59,569 1,752 2 9% 59,480 58,226 1,254 2 1% Rock Hill ↓ 41,795 40,380 1,415 3 4% 41,731 40,178 1,553 3 7% 41,020 39,909 1,111 2 7% Simpsonville ↓ 14,347 13,958 389 2 7% 14,373 13,935 438 3 0% - - -Spartanburg ↓ 17,315 16,707 608 3 5% 17,345 16,646 699 4 0% 16,918 16,347 571 3 4% Summerville ↓ 27,586 26,911 675 2 4% 27,599 26,783 816 3 0% 26,785 26,195 590 2 2% Sumter ↓ 15,000 14,415 585 3 9% 15,137 14,423 714 4 7% 15,108 14,640 468 3 1%
data are subject to revision ↓
estimates are not seasonally adjusted and may diverge from state-level figures. 15 dew.sc.gov scworkforceinfo.com
(NOT SEASONALLY ADJUSTED)
Current month’s estimates are preliminary All
Substate
Monthly Unemployment since January 2020 UNEMPLOYMENT MONTH 0 25,000 50,000 75,000 100,000 125,000 150,000 175,000 200,000 225,000 250,000 275,000 300,000 UNEMPLOYMENT RATE (PERCENT) Monthly Unemployment Rate since January 2020 MONTH 0.0 2.0 4.0 6.0 8 0 10 0 12 0 14 0 16 SC Department of Employment and Workforce Labor Market Information Division Columbia, South Carolina 29202
1,800,000 1,900,000 2,000,000 2,100,000 2,200,000 2,300,000 2,400,000 2,500,000
Monthly Employment since January 2020
LABOR FORCE PARTICIPATION RATE (PERCENT) MONTH Monthly
56.4 56 6 56.8 57 0 57 2 57.4 57 6 57.8 58 0 58 2 EMPLOYMENT
MONTH
17 dew.sc.gov scworkforceinfo.com
Labor Force Participation Rate since January 2020
CURRENT EMPLOYMENT STATISTICS
Seasonally Adjusted — Year-Over-Year Change
NONFARM PAYROLL BY METROPOLITAN STATISTICAL AREA SEASONALLY ADJUSTED APRIL 2024 MARCH 2024 TO APRIL 2024 APRIL 2023 TO APRIL 2024 AREA APRIL 2024 MARCH 2024 APRIL 2023 # CHANGE % CHANGE # CHANGE % CHANGE Statewide 2,368,100 2,360,000 2,290,800 +8,100 0.3% +77,300 3.4% Charleston-North Charleston 426,900 425,700 409,200 +1,200 0 .3% +17,700 4 3% Columbia 434,500 434,000 422,800 +500 0 1% +11,700 2 8% Florence 97,600 97,400 94,800 +200 0 2% +2,800 3 0% Greenville-Anderson-Mauldin 466,900 465,800 457,500 +1,100 0 2% +9,400 2 1% Hilton Head Island-Bluffton-Beaufort 91,300 91,200 88,000 +100 0 1% +3,300 3 8% Myrtle Beach-Conway-North Myrtle Beach 199,900 199,400 190,200 +500 0 3% +9,700 5 1% Spartanburg 175,100 174,600 169,300 +500 0 3% +5,800 3 4% Sumter 38,700 39,000 37,700 -300 -0 8% +1,000 2 7%
Employment estimates have been rounded to the nearest hundred. Sum of detail may not equal totals due to rounding or the exclusion of certain industries from publication. All data are subject to revision. 18 SC Department of Employment and Workforce Labor Market Information Division Columbia, South Carolina 29202
NOTE:
+2.1% +3.4% +2.8% +2.7% +3.0% +5.1% +4.3% +3.8%
THOUSANDS)
APRIL
MARCH 2024 TO APRIL 2024 APRIL 2023 TO APRIL 2024 APRIL 2024 MARCH 2024 APRIL 2023 # CHANGE % CHANGE # CHANGE % CHANGE Total Nonfarm 2,368.1 2,360.0 2,290.8 +8.1 +0.3% +77.3 +3.4% Total Private 1,989 6 1,982 6 1,918 6 +7 0 +0 4% +71 0 +3 7% Goods Producing 386 4 385 8 377 3 +0 6 +0 2% +9 1 +2 4% Mining, Logging and Construction 119 7 119 6 114 7 +0 1 +0 1% +5 0 +4 4% Mining and Logging 4 6 4 5 4 4 +0 1 +2 2% +0 2 +4 5% Construction 115 1 115 1 110 3 0 0 0 0% +4 8 +4 4% Manufacturing 266 7 266 2 262 6 +0 5 +0 2% +4 1 +1 6% Durable Goods 163 8 163 0 159 0 +0 8 +0 5% +4 8 +3 0% Non-Durable Goods 102 9 103 2 103 6 -0 3 -0 3% -0 7 -0 7% Service-Providing 1,981 7 1,974 2 1,913 5 +7 5 +0 4% +68 2 +3 6% Private Service Providing 1,603 2 1,596 8 1,541 3 +6 4 +0 4% +61 9 +4 0% Trade, Transportation, and Utilities 450 8 447 8 440 3 +3 0 +0 7% +10 5 +2 4% Wholesale Trade 85 0 85 1 82 0 -0 1 -0 1% +3 0 +3 7% Retail Trade 269 2 267 2 264 8 +2 0 +0 7% +4 4 +1 7% Transportation, Warehousing, and Utilities 96 6 95 5 93 5 +1 1 +1 2% +3 1 +3 3% Information 28 8 29 0 29 3 -0 2 -0 7% -0 5 -1 7% Financial Activities 124 8 124 4 121 3 +0 4 +0 3% +3 5 +2 9% Finance and Insurance 88 8 88 2 86 8 +0 6 +0 7% +2 0 +2 3% Real Estate and Rental and Leasing 36 0 36 2 34 5 -0 2 -0 6% +1 5 +4 3% Professional and Business Services 318 2 317 9 310 6 +0 3 +0 1% +7 6 +2 4% Professional, Scientific, and Technical Services 134 3 132 6 127 4 +1 7 +1 3% +6 9 +5 4% Management of Companies and Enterprises 24 5 24 5 23 9 0 0 0 0% +0 6 +2 5% Administrative and Support and Waste Management and Remediation Services 159 4 160 8 159 3 -1 4 -0 9% +0 1 +0 1% Education and Health Services 296 0 294 8 277 8 +1 2 +0 4% +18 2 +6 6% Educational Services 49 8 49 4 46 9 +0 4 +0 8% +2 9 +6 2% Health Care Services 246 2 245 4 230 9 +0 8 +0 3% +15 3 +6 6% Leisure and Hospitality 293 8 293 0 276 6 +0 8 +0 3% +17 2 +6 2% Arts, Entertainment, and Recreation 40 6 39 0 35 1 +1 6 +4 1% +5 5 +15 7% Accommodation and Food Services 253 2 254 0 241 5 -0 8 -0 3% +11 7 +4 8% Other Services 90 8 89 9 85 4 +0 9 +1 0% +5 4 +6 3% Government 378 5 377 4 372 2 +1 1 +0 3% +6 3 +1 7% Federal Government 37 6 37 6 36 3 0 0 0 0% +1 3 +3 6% State Government 108 9 108 4 109 2 +0 5 +0 5% -0 3 -0 3% Local Government 232 0 231 4 226 7 +0 6 +0 3% +5 3 +2 3% 19 dew.sc.gov scworkforceinfo.com
NONFARM PAYROLL BY ECONOMIC SECTOR SEASONALLY ADJUSTED (IN
2024
CURRENT EMPLOYMENT STATISTICS
Not Seasonally Adjusted — Year-Over-Year Change
NONFARM PAYROLL BY METROPOLITAN STATISTICAL AREA NOT SEASONALLY ADJUSTED APRIL 2024 MARCH 2024 TO APRIL 2024 APRIL 2023 TO APRIL 2024 AREA APRIL 2024 MARCH 2024 APRIL 2023 # CHANGE % CHANGE # CHANGE % CHANGE Statewide 2,367,200 2,352,600 2,290,300 +14,600 +0.6% +76,900 +3.4% Charleston-North Charleston 426,300 424,200 408,100 +2,100 +0 5% +18,200 +4 5% Columbia 434,400 432,800 423,000 +1,600 +0 4% +11,400 +2 7% Florence 97,500 97,000 94,200 +500 +0 5% +3,300 +3 5% Greenville-Anderson-Mauldin 465,500 465,400 458,400 +100 0 0% +7,100 +1 5% Hilton Head Island-Bluffton-Beaufort 91,100 90,200 88,200 +900 +1 0% +2,900 +3 3% Myrtle Beach-Conway-North Myrtle Beach 201,600 196,600 191,500 +5,000 +2 5% +10,100 +5 3% Spartanburg 175,400 174,500 169,100 +900 +0 5% +6,300 +3 7% Sumter 38,800 38,900 37,700 -100 -0 3% +1,100 +2 9%
Employment estimates have been rounded to the nearest hundred. Sum of detail may not equal totals due to rounding or the exclusion of certain industries from publication. All data are subject to revision. 20 SC Department of Employment and Workforce Labor Market Information Division Columbia, South Carolina 29202
NOTE:
+1.5% +3.7% +2.7% +2.9% +3.5% +5.3% +4.5% +3.3%
PAYROLL BY ECONOMIC
NOT SEASONALLY ADJUSTED APRIL 2024 MARCH 2024 TO APRIL 2024 APRIL 2023 TO APRIL 2024 APRIL 2024 MARCH 2024 APRIL 2023 # CHANGE % CHANGE # CHANGE % CHANGE Total Nonfarm 2,367,200 2,352,600 2,290,300 +14,600 +0.6% +76,900 +3.4% Total Private 1,984,400 1,970,900 1,915,700 +13,500 +0 7% +68,700 +3 6% Goods Producing 384,500 385,700 376,900 -1,200 -0 3% +7,600 +2 0% Mining, Logging and Construction 118,600 119,500 114,600 -900 -0 8% +4,000 +3 5% Mining and Logging 4,600 4,500 4,400 +100 +2 2% +200 +4 5% Construction 114,000 115,000 110,200 -1,000 -0 9% +3,800 +3 4% Construction of Buildings 28,200 28,400 26,900 -200 -0 7% +1,300 +4 8% Heavy and Civil Engineering Construction 17,600 17,700 17,000 -100 -0 6% +600 +3 5% Specialty Trade Contractors 68,200 68,900 66,300 -700 -1 0% +1,900 +2 9% Manufacturing 265,900 266,200 262,300 -300 -0 1% +3,600 +1 4% Durable Goods 162,800 162,800 158,900 0 0 0% +3,900 +2 5% Fabricated Metal Product Manufacturing 24,700 24,700 24,100 0 0 0% +600 +2 5% Transportation Equipment Manufacturing 53,300 53,100 51,000 +200 +0 4% +2,300 +4 5% Non-Durable Goods 103,100 103,400 103,400 -300 -0 3% -300 -0 3% Textile Mills 11,500 11,500 11,600 0 0 0% -100 -0 9% Plastics and Rubber Products Manufacturing 26,400 26,500 26,000 -100 -0 4% +400 +1 5% Service-Providing 1,982,700 1,966,900 1,913,400 +15,800 +0 8% +69,300 +3 6% Private Service Providing 1,599,900 1,585,200 1,538,800 +14,700 +0 9% +61,100 +4 0% Trade, Transportation, and Utilities 448,100 445,500 436,700 +2,600 +0 6% +11,400 +2 6% Wholesale Trade 84,800 84,500 82,000 +300 +0 4% +2,800 +3 4% Merchant Wholesalers, Durable Goods 45,100 45,000 43,400 +100 +0 2% +1,700 +3 9% Merchant Wholesalers, Nondurable Goods 24,200 24,000 23,700 +200 +0 8% +500 +2 1% Retail Trade 268,200 265,900 262,400 +2,300 +0 9% +5,800 +2 2% Motor Vehicle and Parts Dealers 34,900 34,500 34,200 +400 +1 2% +700 +2 0% Food and Beverage Stores 54,100 54,100 52,600 0 0 0% +1,500 +2 9% Health and Personal Care Stores 15,600 15,600 16,000 0 0 0% -400 -2 5% Clothing and Clothing Accessories Stores 17,800 17,700 17,200 +100 +0 6% +600 +3 5% General Merchandise Stores 60,500 60,700 59,400 -200 -0 3% +1,100 +1 9% Transportation, Warehousing, and Utilities 95,100 95,100 92,300 0 0 0% +2,800 +3 0% Utilities 11,200 11,400 11,100 -200 -1 8% +100 +0 9% Transportation and Warehousing 83,900 83,700 81,200 +200 +0 2% +2,700 +3 3% Information 29,200 29,100 29,300 +100 +0 3% -100 -0 3% Financial Activities 124,300 123,000 121,000 +1,300 +1 1% +3,300 +2 7% Finance and Insurance 88,400 87,600 86,700 +800 +0 9% +1,700 +2 0% Credit Intermediation and Related Activities including Monetary Authorities 37,000 36,800 37,500 +200 +0 5% -500 -1 3% Real Estate and Rental and Leasing 35,900 35,400 34,300 +500 +1 4% +1,600 +4 7% Professional and Business Services 317,000 317,300 309,000 -300 -0 1% +8,000 +2 6% Professional, Scientific, and Technical Services 135,100 132,400 128,500 +2,700 +2 0% +6,600 +5 1% Architectural, Engineering, and Related Services 23,600 23,600 23,500 0 0 0% +100 +0 4% Management of Companies and Enterprises 24,400 24,500 23,900 -100 -0 4% +500 +2 1% Administrative and Support and Waste Management and Remediation Services 157,500 160,400 156,600 -2,900 -1 8% +900 +0 6% Administrative and Support Services 145,100 148,200 144,200 -3,100 -2 1% +900 +0 6% Employment Services 65,800 69,000 64,800 -3,200 -4 6% +1,000 +1 5% Services to Buildings and Dwellings 35,700 35,000 35,400 +700 +2 0% +300 +0 8% Education and Health Services 296,200 294,900 278,000 +1,300 +0 4% +18,200 +6 5% Educational Services 51,600 51,200 47,900 +400 +0 8% +3,700 +7 7% Health Care and Social Assistance 244,600 243,700 230,100 +900 +0 4% +14,500 +6 3% Ambulatory Health Care Services 118,100 116,100 109,600 +2,000 +1 7% +8,500 +7 8% Hospitals 42,000 42,100 39,700 -100 -0 2% +2,300 +5 8% Nursing and Residential Care Facilities 42,000 42,700 40,800 -700 -1 6% +1,200 +2 9% Leisure and Hospitality 294,500 286,300 279,100 +8,200 +2 9% +15,400 +5 5% Arts, Entertainment, and Recreation 40,500 37,700 35,600 +2,800 +7 4% +4,900 +13 8% Amusement, Gambling, and Recreation Industries 32,000 29,700 27,600 +2,300 +7 7% +4,400 +15 9% Accommodation and Food Services 254,000 248,600 243,500 +5,400 +2 2% +10,500 +4 3% Accommodation 33,500 32,400 32,500 +1,100 +3 4% +1,000 +3 1% Food Services and Drinking Places 220,500 216,200 211,000 +4,300 +2 0% +9,500 +4 5% Other Services 90,600 89,100 85,700 +1,500 +1 7% +4,900 +5 7% Repair and Maintenance 26,300 25,800 24,600 +500 +1 9% +1,700 +6 9% Personal and Laundry Services 21,000 20,700 20,600 +300 +1 4% +400 +1 9% Government 382,800 381,700 374,600 +1,100 +0 3% +8,200 +2 2% Federal Government 37,500 37,500 36,100 0 0 0% +1,400 +3 9% State Government 112,700 111,600 111,300 +1,100 +1 0% +1,400 +1 3% State Government Educational Services 52,100 51,000 53,500 +1,100 +2 2% -1,400 -2 6% State Government Excluding Education 60,600 60,600 57,800 0 0 0% +2,800 +4 8% Local Government 232,600 232,600 227,200 0 0 0% +5,400 +2 4% Local Government Educational Services 113,400 113,600 111,200 -200 -0 2% +2,200 +2 0% Local Government Excluding Educational Services 119,200 119,000 116,000 +200 +0 2% +3,200 +2 8% 21 dew.sc.gov scworkforceinfo.com
NONFARM
SECTOR
AVERAGE WEEKLY EARNINGS (AWE)
AVERAGE WEEKLY HOURS (AWH)
AVERAGE HOURLY EARNINGS (AHE)
STATEWIDE HOURS AND EARNINGS BY MSA
TOTAL PRIVATE NSA
MARCH 2024 TO APRIL 2024 APRIL 2023 TO APRIL 2024 AREA APRIL 2024 MARCH 2024 APRIL 2023 # CHANGE % CHANGE # CHANGE % CHANGE Charleston-North Charleston $1,126 59 $1,094 44 $1,148 92 +$32 15 +2 9% -$22 33 -1 9% Columbia $1,015 32 $1,010 33 $945 88 +$4 99 +0 5% +$69 44 +7 3% Florence $721 90 $755 02 $748 80 -$33 12 -4 4% -$26 90 -3 6% Greenville-Anderson-Mauldin $1,110 40 $1,112 74 $1,110 36 -$2 34 -0 2% +$0 04 0 0% Hilton Head Island-Bluffton-Beaufort $798 66 $774 11 $859 94 +$24 55 +3 2% -$61 28 -7 1% Myrtle Beach-Conway-North Myrtle Beach $810 65 $839 32 $843 89 -$28 67 -3 4% -$33 24 -3 9% Spartanburg $992 14 $1,004 11 $935 53 -$11 97 -1 2% +$56 61 +6 1% Sumter $914 20 $911 22 $742 62 +$2 98 +0 3% +$171 58 +23 1%
MARCH 2024 TO APRIL 2024 APRIL 2023 TO APRIL 2024 AREA APRIL 2024 MARCH 2024 APRIL 2023 # CHANGE % CHANGE # CHANGE % CHANGE Charleston-North Charleston 33 7 33 8 34 7 -0 1 -0 3% -1 0 -2 9% Columbia 34 7 34 4 34 0 +0 3 +0 9% +0 7 +2 1% Florence 31 9 32 6 32 5 -0 7 -2 1% -0 6 -1 8% Greenville-Anderson-Mauldin 34 7 34 6 35 6 +0 1 +0 3% -0 9 -2 5% Hilton Head Island-Bluffton-Beaufort 30 6 29 9 31 0 +0 7 +2 3% -0 4 -1 3% Myrtle Beach-Conway-North Myrtle Beach 31 0 31 4 32 9 -0 4 -1 3% -1 9 -5 8% Spartanburg 34 2 34 2 33 4 0 0 0 0% +0 8 +2 4% Sumter 34 8 34 7 32 7 +0 1 +0 3% +2 1 +6 4%
MARCH 2024 TO APRIL 2024 APRIL 2023 TO APRIL 2024 AREA APRIL 2024 MARCH 2024 APRIL 2023 # CHANGE % CHANGE # CHANGE % CHANGE Charleston-North Charleston $33 43 $32 38 $33 11 +$1 05 +3 2% +$0 32 +1 0% Columbia $29 26 $29 37 $27 82 -$0 11 -0 4% +$1 44 +5 2% Florence $22 63 $23 16 $23 04 -$0 53 -2 3% -$0 41 -1 8% Greenville-Anderson-Mauldin $32 00 $32 16 $31 19 -$0 16 -0 5% +$0 81 +2 6% Hilton Head Island-Bluffton-Beaufort $26 10 $25 89 $27 74 +$0 21 +0 8% -$1 64 -5 9% Myrtle Beach-Conway-North Myrtle Beach $26 15 $26 73 $25 65 -$0 58 -2 2% +$0 50 +1 9% Spartanburg $29 01 $29 36 $28 01 -$0 35 -1 2% +$1 00 +3 6% Sumter $26 27 $26 26 $22 71 +$0 01 0 0% +$3 56 +15 7% Current month’s estimates
preliminary. All data are subject to revision. 22 SC Department of Employment and Workforce Labor Market Information Division Columbia, South Carolina 29202
are
AVERAGE WEEKLY EARNINGS (AWE)
NSA STATEWIDE HOURS AND EARNINGS BY INDUSTRY
MARCH 2024 TO APRIL 2024 APRIL 2023 TO APRIL 2024 INDUSTRY TITLE APRIL 2024 MARCH 2024 APRIL 2023 # CHANGE % CHANGE # CHANGE % CHANGE Total Private $1,021.41 $1,022.42 $1,022.43 -$1.01 -0.1% -$1.02 -0.1% Goods Producing $1,321 89 $1,319 29 $1,293 23 +$2 60 +0 2% +$28 66 +2 2% Construction $1,317 12 $1,331 33 $1,183 49 -$14 21 -1 1% +$133 63 +11 3% Manufacturing $1,336 90 $1,336 88 $1,319 06 +$0 02 0 0% +$17 84 +1 4% Private Service Providing $950 30 $950 29 $956 16 +$0 01 0 0% -$5 86 -0 6% Trade, Transportation, and Utilities $865 92 $882 38 $865 13 -$16 46 -1 9% +$0 79 +0 1% Financial Activities $1,183 62 $1,184 65 $1,174 27 -$1 03 -0 1% +$9 35 +0 8% Professional and Business Services $1,268 62 $1,261 50 $1,291 18 +$7 12 +0 6% -$22 56 -1 7% Education and Health Services $1,056 57 $1,046 18 $1,029 41 +$10 39 +1 0% +$27 16 +2 6% Leisure and Hospitality $483 39 $475 05 $496 91 +$8 34 +1 8% -$13 52 -2 7% Other Services $991 75 $1,003 61 $932 64 -$11 86 -1 2% +$59 11 +6 3% AVERAGE WEEKLY HOURS (AWH) MARCH 2024 TO APRIL 2024 APRIL 2023 TO APRIL 2024 INDUSTRY TITLE APRIL 2024 MARCH 2024 APRIL 2023 # CHANGE % CHANGE # CHANGE % CHANGE Total Private 33.9 33.9 34.6 0.0 0.0% -0.7 -2.0% Goods Producing 39 9 40 1 40 3 -0 2 -0 5% -0 4 -1 0% Construction 41 8 41 8 40 2 0 0 0 0% +1 6 +4 0% Manufacturing 39 6 39 8 40 4 -0 2 -0 5% -0 8 -2 0% Private Service Providing 32 5 32 4 33 2 +0 1 +0 3% -0 7 -2 1% Trade, Transportation, and Utilities 32 8 32 9 33 3 -0 1 -0 3% -0 5 -1 5% Financial Activities 37 9 37 8 38 2 +0 1 +0 3% -0 3 -0 8% Professional and Business Services 36 9 36 8 37 6 +0 1 +0 3% -0 7 -1 9% Education and Health Services 32 6 32 5 33 1 +0 1 +0 3% -0 5 -1 5% Leisure and Hospitality 24 6 24 2 25 8 +0 4 +1 7% -1 2 -4 7% Other Services 34 4 34 5 34 1 -0 1 -0 3% +0 3 +0 9% AVERAGE HOURLY EARNINGS (AHE) MARCH 2024 TO APRIL 2024 APRIL 2023 TO APRIL 2024 INDUSTRY TITLE APRIL 2024 MARCH 2024 APRIL 2023 # CHANGE % CHANGE # CHANGE % CHANGE Total Private $30.13 $30.16 $29.55 -$0.03 -0.1% +$0.58 +2.0% Goods Producing $33 13 $32 90 $32 09 +$0 23 +0 7% +$1 04 +3 2% Construction $31 51 $31 85 $29 44 -$0 34 -1 1% +$2 07 +7 0% Manufacturing $33 76 $33 59 $32 65 +$0 17 +0 5% +$1 11 +3 4% Private Service Providing $29 24 $29 33 $28 80 -$0 09 -0 3% +$0 44 +1 5% Trade, Transportation, and Utilities $26 40 $26 82 $25 98 -$0 42 -1 6% +$0 42 +1 6% Financial Activities $31 23 $31 34 $30 74 -$0 11 -0 4% +$0 49 +1 6% Professional and Business Services $34 38 $34 28 $34 34 +$0 10 +0 3% +$0 04 +0 1% Education and Health Services $32 41 $32 19 $31 10 +$0 22 +0 7% +$1 31 +4 2% Leisure and Hospitality $19 65 $19 63 $19 26 +$0 02 +0 1% +$0 39 +2 0% Other Services $28 83 $29 09 $27 35 -$0 26 -0 9% +$1 48 +5 4% 23 dew.sc.gov scworkforceinfo.com
NONFARM PAYROLL BY ECONOMIC SECTOR
CHARLESTON-NORTH CHARLESTON MSA
APRIL 2024 (NOT SEASONALLY ADJUSTED)
Current month’s estimates are preliminary. All data are subject to revision.
MARCH 2024 TO APRIL 2024 APRIL 2023 TO APRIL 2024 APRIL 2024 MARCH 2024 APRIL 2023 # CHANGE % CHANGE # CHANGE % CHANGE Total Nonfarm 426,300 424,200 408,100 +2,100 +0.5% +18,200 +4.5% Total Private 355,100 353,000 339,900 +2,100 +0 6% +15,200 +4 5% Goods Producing 57,000 56,700 54,100 +300 +0 5% +2,900 +5 4% Service-Providing 369,300 367,500 354,000 +1,800 +0 5% +15,300 +4 3% Private Service Providing 298,100 296,300 285,800 +1,800 +0 6% +12,300 +4 3% Mining, Logging and Construction 22,900 22,800 21,700 +100 +0 4% +1,200 +5 5% Manufacturing 34,100 33,900 32,400 +200 +0 6% +1,700 +5 2% Trade, Transportation, and Utilities 78,000 77,700 74,600 +300 +0 4% +3,400 +4 6% Wholesale Trade 13,500 13,500 12,900 0 0 0% +600 +4 7% Retail Trade 45,100 44,900 42,700 +200 +0 4% +2,400 +5 6% General Merchandise Stores 7,900 7,900 7,700 0 0 0% +200 +2 6% Transportation, Warehousing, and Utilities 19,400 19,300 19,000 +100 +0 5% +400 +2 1% Information 8,100 8,100 8,200 0 0 0% -100 -1 2% Financial Activities 22,000 21,600 20,800 +400 +1 9% +1,200 +5 8% Professional and Business Services 68,400 69,000 66,500 -600 -0 9% +1,900 +2 9% Administrative and Support and Waste Management 28,400 29,400 28,300 -1,000 -3 4% +100 +0 4% Education and Health Services 49,000 48,800 46,400 +200 +0 4% +2,600 +5 6% Leisure and Hospitality 55,100 54,000 53,100 +1,100 +2 0% +2,000 +3 8% Accommodation and Food Services 47,800 46,900 46,500 +900 +1 9% +1,300 +2 8% Food Services and Drinking Places 39,700 39,100 38,200 +600 +1 5% +1,500 +3 9% Other Services 17,500 17,100 16,200 +400 +2 3% +1,300 +8 0% Government 71,200 71,200 68,200 0 0 0% +3,000 +4 4% Federal Government 11,900 12,000 11,500 -100 -0 8% +400 +3 5% State Government 28,800 28,800 27,300 0 0 0% +1,500 +5 5% Local Government 30,500 30,400 29,400 +100 +0 3% +1,100 +3 7%
24 SC Department of Employment and Workforce Labor Market Information Division Columbia, South Carolina 29202
COLUMBIA MSA
APRIL 2024 (NOT SEASONALLY ADJUSTED)
Current month’s estimates are preliminary. All data are subject to revision.
NONFARM PAYROLL BY ECONOMIC SECTOR
MARCH 2024 TO APRIL 2024 APRIL 2023 TO APRIL 2024 APRIL 2024 MARCH 2024 APRIL 2023 # CHANGE % CHANGE # CHANGE % CHANGE Total Nonfarm 434,400 432,800 423,000 +1,600 +0.4% +11,400 +2.7% Total Private 349,800 347,900 339,400 +1,900 +0 5% +10,400 +3 1% Goods Producing 50,500 50,700 48,800 -200 -0 4% +1,700 +3 5% Service-Providing 383,900 382,100 374,200 +1,800 +0 5% +9,700 +2 6% Private Service Providing 299,300 297,200 290,600 +2,100 +0 7% +8,700 +3 0% Mining, Logging and Construction 17,800 18,000 17,000 -200 -1 1% +800 +4 .7% Manufacturing 32,700 32,700 31,800 0 0 0% +900 +2 8% Trade, Transportation, and Utilities 78,600 78,700 77,900 -100 -0 1% +700 +0 9% Wholesale Trade 17,200 17,200 16,400 0 0 0% +800 +4 9% Retail Trade 44,200 44,200 44,500 0 0 0% -300 -0 .7% Transportation, Warehousing, and Utilities 17,200 17,300 17,000 -100 -0 6% +200 +1 2% Information 4,900 4,900 5,200 0 0 0% -300 -5 8% Financial Activities 38,500 38,100 36,700 +400 +1 0% +1,800 +4 9% Credit Intermediation and Related Activities including Monetary Authorities - Central Bank 7,600 7,500 7,600 +100 +1 3% 0 0 0% Professional and Business Services 57,000 56,600 57,200 +400 +0 7% -200 -0 3% Administrative and Support and Waste Management 29,400 30,000 29,500 -600 -2 0% -100 -0 3% Education and Health Services 59,100 58,400 55,300 +700 +1 2% +3,800 +6 .9% Leisure and Hospitality 42,500 42,200 40,500 +300 +0 7% +2,000 +4 9% Food Services and Drinking Places 35,500 35,300 33,800 +200 +0 6% +1,700 +5 0% Other Services 18,700 18,300 17,800 +400 +2 2% +900 +5 1% Government 84,600 84,900 83,600 -300 -0 4% +1,000 +1 2% Federal Government 12,100 12,200 11,500 -100 -0 8% +600 +5 .2% State Government 36,700 36,800 36,000 -100 -0 3% +700 +1 9% Local Government 35,800 35,900 36,100 -100 -0 3% -300 -0 8%
25 dew.sc.gov scworkforceinfo.com
NONFARM PAYROLL BY ECONOMIC SECTOR
GREENVILLE-ANDERSON-MAULDIN MSA
APRIL 2024 (NOT SEASONALLY ADJUSTED)
Current month’s estimates are preliminary. All data are subject to revision.
MARCH 2024 TO APRIL 2024 APRIL 2023 TO APRIL 2024 APRIL 2024 MARCH 2024 APRIL 2023 # CHANGE % CHANGE # CHANGE % CHANGE Total Nonfarm 465,500 465,400 458,400 +100 0.0% +7,100 +1.5% Total Private 403,600 403,200 395,300 +400 +0 1% +8,300 +2 1% Goods Producing 83,800 84,400 83,100 -600 -0 7% +700 +0 8% Service-Providing 381,700 381,000 375,300 +700 +0 2% +6,400 +1 7% Private Service Providing 319,800 318,800 312,200 +1,000 +0 3% +7,600 +2 4% Mining, Logging and Construction 22,200 22,300 21,200 -100 -0 4% +1,000 +4 7% Manufacturing 61,600 62,100 61,900 -500 -0 8% -300 -0 5% Trade, Transportation, and Utilities 83,900 83,900 82,700 0 0 0% +1,200 +1 5% Wholesale Trade 21,200 21,300 20,600 -100 -0 5% +600 +2 9% Retail Trade 47,900 47,700 47,900 +200 +0 4% 0 0 .0% Transportation, Warehousing, and Utilities 14,800 14,900 14,200 -100 -0 7% +600 +4 2% Information 6,300 6,400 6,100 -100 -1 6% +200 +3 3% Financial Activities 22,500 22,400 22,000 +100 +0 4% +500 +2 3% Professional and Business Services 73,300 74,600 75,600 -1,300 -1 7% -2,300 -3 0% Professional, Scientific, and Technical Services 30,600 30,500 29,700 +100 +0 3% +900 +3 .0% Management of Companies and Enterprises 6,900 6,900 7,100 0 0 .0% -200 -2 8% Administrative and Support and Waste Management 35,800 37,200 38,800 -1,400 -3 .8% -3,000 -7 7% Education and Health Services 63,000 62,700 59,300 +300 +0 5% +3,700 +6 2% Educational Services 13,500 13,500 12,500 0 0 0% +1,000 +8 0% Health Care and Social Assistance 49,500 49,200 46,800 +300 +0 6% +2,700 +5 8% Leisure and Hospitality 54,100 52,400 50,500 +1,700 +3 2% +3,600 +7 1% Other Services 16,700 16,400 16,000 +300 +1 8% +700 +4 4% Government 61,900 62,200 63,100 -300 -0 5% -1,200 -1 9% Federal Government 3,000 3,000 3,100 0 0 0% -100 -3 2% State Government 13,900 13,800 15,400 +100 +0 7% -1,500 -9 7% Local Government 45,000 45,400 44,600 -400 -0 9% +400 +0 9%
26 SC Department of Employment and Workforce Labor Market Information Division Columbia, South Carolina 29202
Current month’s estimates are preliminary. All data are subject to revision.
MYRTLE BEACH-CONWAY-NORTH
MARCH 2024 TO APRIL 2024 APRIL 2023 TO APRIL 2024 APRIL 2024 MARCH 2024 APRIL 2023 # CHANGE % CHANGE # CHANGE % CHANGE Total Nonfarm 201,600 196,600 191,500 +5,000 +2.5% +10,100 +5.3% Total Private 175,500 170,400 165,900 +5,100 +3 0% +9,600 +5 8% Goods Producing 17,800 17,900 17,500 -100 -0 .6% +300 +1 .7% Service-Providing 183,800 178,700 174,000 +5,100 +2 9% +9,800 +5 6% Private Service Providing 157,700 152,500 148,400 +5,200 +3 4% +9,300 +6 3% Mining, Logging and Construction 12,300 12,400 12,100 -100 -0 8% +200 +1 7% Manufacturing 5,500 5,500 5,400 0 0 0% +100 +1 9% Trade, Transportation, and Utilities 43,900 43,400 41,600 +500 +1 2% +2,300 +5 5% Wholesale Trade 4,100 4,100 3,900 0 0 0% +200 +5 1% Retail Trade 34,500 34,100 32,400 +400 +1 2% +2,100 +6 5% Transportation, Warehousing, and Utilities 5,300 5,200 5,300 +100 +1 9% 0 0 0% Information 2,700 2,700 2,600 0 0 0% +100 +3 8% Financial Activities 10,600 10,500 10,700 +100 +1 0% -100 -0 9% Professional and Business Services 20,300 20,100 18,900 +200 +1 0% +1,400 +7 4% Education and Health Services 22,800 22,700 21,200 +100 +0 4% +1,600 +7 5% Leisure and Hospitality 50,200 46,000 46,600 +4,200 +9 1% +3,600 +7 .7% Accommodation and Food Services 41,500 37,600 39,300 +3,900 +10 4% +2,200 +5 6% Food Services and Drinking Places 35,000 31,500 31,000 +3,500 +11 1% +4,000 +12 9% Other Services 7,200 7,100 6,800 +100 +1 4% +400 +5 9% Government 26,100 26,200 25,600 -100 -0 4% +500 +2 0% Federal Government 1,600 1,600 1,600 0 0 0% 0 0 0% State Government 4,400 4,400 4,400 0 0 0% 0 0 0% Local Government 20,100 20,200 19,600 -100 -0 .5% +500 +2 .6%
NONFARM PAYROLL BY ECONOMIC SECTOR
MYRTLE BEACH MSA APRIL 2024 (NOT SEASONALLY ADJUSTED)
27 dew.sc.gov scworkforceinfo.com
NONFARM PAYROLL BY ECONOMIC SECTOR
SPARTANBURG MSA
APRIL 2024 (NOT SEASONALLY ADJUSTED)
Current month’s estimates are preliminary. All data are subject to revision.
MARCH 2024 TO APRIL 2024 APRIL 2023 TO APRIL 2024 APRIL 2024 MARCH 2024 APRIL 2023 # CHANGE % CHANGE # CHANGE % CHANGE Total Nonfarm 175,400 174,500 169,100 +900 +0.5% +6,300 +3.7% Total Private 146,100 145,300 141,500 +800 +0 6% +4,600 +3 3% Goods Producing 47,700 47,700 45,900 0 0 0% +1,800 +3 9% Service-Providing 127,700 126,800 123,200 +900 +0 7% +4,500 +3 7% Private Service Providing 98,400 97,600 95,600 +800 +0 8% +2,800 +2 9% Mining, Logging and Construction 8,200 8,200 7,500 0 0 .0% +700 +9 3% Manufacturing 39,500 39,500 38,400 0 0 0% +1,100 +2 9% Durable Goods 27,400 27,300 26,400 +100 +0 4% +1,000 +3 8% Non-Durable Goods 12,100 12,200 12,000 -100 -0 8% +100 +0 8% Transportation, Warehousing, and Utilities 36,000 35,900 35,900 +100 +0 3% +100 +0 3% Wholesale Trade 8,200 8,300 8,300 -100 -1 .2% -100 -1 2% Retail Trade 17,700 17,500 17,500 +200 +1 1% +200 +1 1% Transportation, Warehousing, and Utilities 10,100 10,100 10,100 0 0 0% 0 0 0% Information 1,000 1,000 900 0 0 0% +100 +11 1% Financial Activities 5,200 5,100 5,300 +100 +2 0% -100 -1 9% Professional and Business Services 17,200 17,100 16,700 +100 +0 6% +500 +3 0% Education and Health Services 17,000 16,900 16,000 +100 +0 6% +1,000 +6 3% Leisure and Hospitality 16,000 15,700 15,100 +300 +1 9% +900 +6 0% Other Services 6,000 5,900 5,700 +100 +1 .7% +300 +5 3% Government 29,300 29,200 27,600 +100 +0 3% +1,700 +6 2% Federal Government 700 700 700 0 0 0% 0 0 0% State Government 4,000 4,000 4,000 0 0 0% 0 0 0% Local Government 24,600 24,500 22,900 +100 +0 4% +1,700 +7 4%
28 SC Department of Employment and Workforce Labor Market Information Division Columbia, South Carolina 29202
NONFARM PAYROLL BY ECONOMIC SECTOR FLORENCE MSA
APRIL 2024 (NOT SEASONALLY ADJUSTED)
HILTON HEAD ISLAND-BLUFFTON-BEAUFORT MSA
SUMTER MSA
MARCH 2024 TO APRIL 2024 APRIL 2023 TO APRIL 2024 APRIL 2024 MARCH 2024 APRIL 2023 # CHANGE % CHANGE # CHANGE % CHANGE Total Nonfarm 97,500 97,000 94,200 +500 +0.5% +3,300 +3.5% Total Private 79,300 79,000 76,800 +300 +0 4% +2,500 +3 3% Goods Producing 14,600 14,800 14,900 -200 -1 4% -300 -2 0% Service-Providing 82,900 82,200 79,300 +700 +0 9% +3,600 +4 5% Private Service Providing 64,700 64,200 61,900 +500 +0 8% +2,800 +4 5% Trade, Transportation, and Utilities 20,500 20,300 20,900 +200 +1 0% -400 -1 9% Government 18,200 18,000 17,400 +200 +1 1% +800 +4 6% Federal Government 700 700 700 0 0 0% 0 0 0% State Government 5,000 4,900 4,700 +100 +2 0% +300 +6 4% Local Government 12,500 12,400 12,000 +100 +0 8% +500 +4 2%
APRIL 2024 (NOT SEASONALLY ADJUSTED) MARCH 2024 TO APRIL 2024 APRIL 2023 TO APRIL 2024 APRIL 2024 MARCH 2024 APRIL 2023 # CHANGE % CHANGE # CHANGE % CHANGE Total Nonfarm 91,100 90,200 88,200 +900 +1.0% +2,900 +3.3% Total Private 78,800 78,000 76,300 +800 +1 0% +2,500 +3 3% Goods Producing 8,200 8,200 7,900 0 0 0% +300 +3 8% Service-Providing 82,900 82,000 80,300 +900 +1 1% +2,600 +3 2% Private Service Providing 70,600 69,800 68,400 +800 +1 1% +2,200 +3 2% Government 12,300 12,200 11,900 +100 +0 8% +400 +3 4%
APRIL 2024 (NOT SEASONALLY ADJUSTED) MARCH 2024 TO APRIL 2024 APRIL 2023 TO APRIL 2024 APRIL 2024 MARCH 2024 APRIL 2023 # CHANGE % CHANGE # CHANGE % CHANGE Total Nonfarm 38,800 38,900 37,700 -100 -0.3% +1,100 +2.9% Total Private 32,800 32,900 31,800 -100 -0 3% +1,000 +3 1% Goods Producing 9,300 9,500 9,100 -200 -2 1% +200 +2 2% Service-Providing 29,500 29,400 28,600 +100 +0 3% +900 +3 1% Private Service Providing 23,500 23,400 22,700 +100 +0 4% +800 +3 5% Manufacturing 6,600 6,600 6,600 0 0 0% 0 0 .0% Government 6,000 6,000 5,900 0 0 0% +100 +1 7% Federal Government 1,300 1,300 1,200 0 0 0% +100 +8 3% State Government 1,300 1,300 1,400 0 0 0% -100 -7 1% Local Government 3,400 3,400 3,300 0 0 0% +100 +3 0% 29 dew.sc.gov scworkforceinfo.com
LONG-RUN TRENDS
ANNUAL LOCAL AREA UNEMPLOYMENT STATISTICS DATA
1976-2023 YEAR CIVILIAN NON-INSTITUTIONAL POPULATION LABOR FORCE PARTICIPATION RATE (PERCENT) EMPLOYMENT-POPULATION RATIO (PERCENT) LABOR FORCE EMPLOYMENT UNEMPLOYMENT UNEMPLOYMENT RATE (PERCENT) 1976 2,007,417 64 7% 60 2% 1,299,241 1,207,662 91,579 7 0% 1977 2,061,250 64 4% 60 0% 1,327,423 1,237,495 89,928 6 8% 1978 2,117,667 64 1% 60 5% 1,356,921 1,281,597 75,324 5 6% 1979 2,169,417 63 4% 60 2% 1,375,201 1,306,773 68,428 5 0% 1980 2,221,250 62 8% 58 6% 1,395,675 1,301,796 93,879 6 7% 1981 2,266,583 63 2% 58 0% 1,432,219 1,314,907 117,312 8 2% 1982 2,307,333 64 2% 57 3% 1,482,373 1,322,883 159,490 10 8% 1983 2,341,083 63 2% 56 9% 1,479,137 1,333,162 145,975 9 9% 1984 2,378,500 62 9% 58 5% 1,495,188 1,391,286 103,902 6 9% 1985 2,426,500 63 8% 59 5% 1,548,924 1,443,612 105,312 6 8% 1986 2,455,333 64 9% 60 7% 1,592,306 1,491,069 101,237 6 4% 1987 2,495,333 65 4% 61 8% 1,631,897 1,542,170 89,727 5 5% 1988 2,533,000 65 6% 62 5% 1,660,533 1,583,928 76,605 4 6% 1989 2,566,000 66 0% 62 9% 1,693,438 1,615,009 78,429 4 6% 1990 2,611,843 66 5% 63 3% 1,737,831 1,652,949 84,882 4 9% 1991 2,663,759 66 3% 62 3% 1,767,123 1,659,196 107,927 6 1% 1992 2,699,745 66 7% 62 2% 1,799,677 1,678,803 120,874 6 7% 1993 2,739,480 66 7% 61 8% 1,826,650 1,693,483 133,167 7 3% 1994 2,775,049 66 4% 62 3% 1,841,428 1,727,714 113,714 6 2% 1995 2,813,952 66 2% 62 8% 1,864,221 1,768,540 95,681 5 1% 1996 2,851,104 66 2% 62 4% 1,886,064 1,779,221 106,843 5 7% 1997 2,897,839 66 3% 63 3% 1,920,244 1,834,337 85,907 4 5% 1998 2,945,825 65 9% 63 5% 1,940,846 1,870,270 70,576 3 6% 1999 2,989,560 65 5% 62 8% 1,958,598 1,877,345 81,253 4 1% 30 SC Department of Employment and Workforce Labor Market Information Division Columbia, South Carolina 29202
ANNUAL
1976-2023 YEAR CIVILIAN NON-INSTITUTIONAL POPULATION LABOR FORCE PARTICIPATION RATE (PERCENT) EMPLOYMENT-POPULATION RATIO (PERCENT) LABOR FORCE EMPLOYMENT UNEMPLOYMENT UNEMPLOYMENT RATE (PERCENT) 2000 3,027,367 64 9% 62 5% 1,965,481 1,892,559 72,922 3 7% 2001 3,064,191 63 4% 60 0% 1,941,956 1,839,246 102,710 5 3% 2002 3,098,739 63 1% 59 0% 1,954,548 1,828,735 125,813 6 4% 2003 3,133,915 63 8% 59 2% 1,999,485 1,855,599 143,886 7 2% 2004 3,178,645 64 3% 59 5% 2,043,864 1,891,722 152,142 7 4% 2005 3,234,049 64 0% 59 4% 2,071,111 1,919,644 151,467 7 3% 2006 3,305,437 65 0% 60 5% 2,148,698 2,001,245 147,453 6 9% 2007 3,374,548 63 9% 60 0% 2,155,198 2,024,493 130,705 6 1% 2008 3,439,974 62 8% 58 2% 2,160,084 2,002,903 157,181 7 3% 2009 3,490,448 62 1% 55 0% 2,166,737 1,919,307 247,430 11 4% 2010 3,564,619 61 0% 54 1% 2,174,535 1,928,442 246,093 11 3% 2011 3,612,048 60 5% 54 2% 2,185,171 1,957,493 227,678 10 4% 2012 3,655,515 59 9% 54 5% 2,190,203 1,992,957 197,246 9 0% 2013 3,704,281 59 3% 54 9% 2,197,876 2,034,404 163,472 7 4% 2014 3,759,002 59 1% 55 4% 2,222,426 2,082,941 139,485 6 3% 2015 3,822,409 59 3% 55 8% 2,267,837 2,134,087 133,750 5 9% 2016 3,888,005 58 8% 55 9% 2,286,054 2,174,301 111,753 4 9% 2017 3,897,645 58 0% 55 6% 2,261,766 2,166,708 95,058 4 2% 2018 3,948,448 57 8% 55 9% 2,282,022 2,205,356 76,666 3 4% 2019 4,002,601 58 3% 56 7% 2,333,533 2,268,884 64,649 2 8% 2020 4,050,504 57 7% 54 3% 2,339,140 2,199,751 139,389 6 0% 2021 4,109,008 57 4% 55 2% 2,359,169 2,266,611 92,558 3 9% 2022 4,188,402 57 1% 55 3% 2,393,329 2,316,435 76,894
2% 2023 4,274,977 57 4% 55 7% 2,453,060 2,380,392 72,668 3 0% 31 dew.sc.gov scworkforceinfo.com
LOCAL AREA UNEMPLOYMENT STATISTICS DATA
3
LONG-RUN TRENDS
ANNUAL
1939-2023 YEAR EMPLOYMENT YEAR EMPLOYMENT YEAR EMPLOYMENT YEAR EMPLOYMENT 1939 310,100 1961 587,000 1983 1,189,000 2005 1,862,900 1940 328,600 1962 609,800 1984 1,262,500 2006 1,905,700 1941 387,500 1963 630,600 1985 1,296,200 2007 1,945,000 1942 416,500 1964 651,500 1986 1,338,000 2008 1,926,300 1943 428,500 1965 686,000 1987 1,392,200 2009 1,814,400 1944 408,600 1966 734,900 1988 1,449,000 2010 1,811,300 1945 396,000 1967 754,500 1989 1,499,700 2011 1,832,500 1946 411,600 1968 782,900 1990 1,527,600 2012 1,864,300 1947 436,200 1969 819,800 1991 1,497,300 2013 1,901,000 1948 456,400 1970 842,000 1992 1,511,800 2014 1,951,300 1949 443,100 1971 862,600 1993 1,553,000 2015 2,006,700 1950 461,400 1972 920,300 1994 1,592,000 2016 2,055,300 1951 505,800 1973 984,000 1995 1,636,300 2017 2,096,100 1952 544,300 1974 1,015,800 1996 1,669,400 2018 2,154,800 1953 543,900 1975 982,600 1997 1,718,800 2019 2,189,600 1954 519,700 1976 1,038,100 1998 1,779,800 2020 2,082,300 1955 533,000 1977 1,081,700 1999 1,826,300 2021 2,154,000 1956 542,900 1978 1,137,500 2000 1,854,000 2022 2,242,900 1957 545,000 1979 1,176,000 2001 1,814,800 2023 2,305,800 1958 545,900 1980 1,188,800 2002 1,795,400 1959 566,900 1981 1,196,500 2003 1,799,100 1960 582,500 1982 1,162,300 2004 1,826,600 32 SC Department of Employment and Workforce Labor Market Information Division Columbia, South Carolina 29202
CURRENT EMPLOYMENT STATISTICS NONFARM PAYROLL
ANNUAL CURRENT EMPLOYMENT STATISTICS NONFARM PAYROLL 2007-2023 AVERAGE WEEKLY EARNINGS AVERAGE WEEKLY HOURS AVERAGE HOURLY EARNINGS 2007 $675 36 36 0 $18 76 2008 $669 .28 35 .6 $18 .80 2009 $665 55 34 7 $19 18 2010 $692 17 34 8 $19 89 2011 $716 18 34 .8 $20 58 2012 $705 16 35 1 $20 09 2013 $716 15 34 9 $20 52 2014 $726 23 34 5 $21 05 2015 $743 27 34 7 $21 42 2016 $762 80 34 .5 $22 11 2017 $791 99 34 6 $22 89 2018 $829 36 34 6 $23 97 2019 $852 84 34 5 $24 72 2020 $888 31 34 1 $26 05 2021 $925 41 34 3 $26 98 2022 $972 90 34 5 $28 20 2023 $1,014 59 34 3 $29 58 33 dew.sc.gov scworkforceinfo.com
Technical Notes
1 . Household Survey: Nationally, there is a monthly Current Population Survey of about 60,000 households conducted by the Census Bureau for the Bureau of Labor Statistics (BLS) to determine employment status of the civilian population This information, along with other inputs, is used by DEW to operate the Local Area Unemployment Statistics program, which estimates the number of individuals employed and those not employed, but actively seeking employment for statewide and a variety of sub-state geographies
2 Employer Survey: BLS conducts a monthly Current Employment Statistics survey of about 44,000 employers which yields national estimates of nonagricultural wage and salary employment, hours, and earnings by industry This data is processed by DEW to generate comparable data for the state and its metropolitan statistical areas
3 . Seasonally Adjusted: Seasonal adjustment removes the effects of events that follow a regular pattern each year (i e tourist-related hiring and school closings in the summer) These adjustments make it easier to observe the cyclical and other nonseasonal movements in data over time
4 . Not Seasonally Adjusted: Effects of regular or seasonal patterns have not been removed from this data
CURRENT EMPLOYMENT STATISTICS (CES)
Data is published by Industry
Data is published by County
Counts Jobs Counts People
Utilizes an Establishment Survey
Reference week is the Pay Period that includes the 12th of the month
A job held by a person on unpaid leave during the reference week is not counted since they are not receiving pay
Does not count selfemployed workers
Does not include agricultural workers
Does not count unpaid family workers
Workers on strike during the entire reference period are not counted
The Current Population Survey (CPS), which is a Household Survey, is used to calculate LAUS
Reference week is the Calendar Week that includes the 12th of the month
A person on unpaid leave is counted as employed because they will return to their job
Does count self-employed workers
Includes both agricultural and non-agricultural workers
Counts unpaid family workers if they worked at least 15 unpaid hours for a family business or family farm during the reference week
Workers on strike during the reference week are counted as employed in LAUS
LOCAL
AREA UNEMPLOYMENT STATISTICS (LAUS)
34 SC Department of Employment and Workforce Labor Market Information Division Columbia, South Carolina 29202

Do you need some help finding the data you need? Have a great idea for a research project you’d like to discuss with someone? We love to collaborate!
DATA TRENDS is prepared by the LMI Division of the S C Department of Employment and Workforce with funding provided by the US Department of Labor Featured data is prepared in conjunction with the Bureau of Labor Statistics and current month estimates are always preliminary, with all previous data subject to revision
Interested in staying up to date with Trends as it’s released? Subscribe by clicking here!
36 dew.sc.gov scworkforceinfo.com SC Department of Employment and Workforce Labor Market Information Division Columbia, South Carolina 29202 Find more information at scworkforceinfo.com