
Edición BilingualBilingüeEditionISSN:2448-6698 CdeivistaReMexcanaienciasPecuarias OCTUBRE-DICIEMBRE-2022846-1094,pp.4,Núm.13Vol.Pecu.Cienc.Mex.Rev. Rev. Mex. Cienc. Pecu. Vol. 13 Núm. 4, pp. 846-1094, OCTUBRE-DICIEMBRE-2022

EDITORES POR DISCIPLINA Dra. Yolanda Beatriz Moguel Ordóñez, INIFAP, México Dr. Ramón Molina Barrios, Instituto Tecnológico de Sonora, Dr. Alfonso Juventino Chay Canul, Universidad Autónoma de Tabasco, México Dra. Maria Cristina Schneider, Universidad de Georgetown, Estados Unidos Dr. Feliciano Milian Suazo, Universidad Autónoma de Querétaro, México Dr. Javier F. Enríquez Quiroz, INIFAP, México Dra. Martha Hortencia Martín Rivera, Universidad de Sonora URN, México Dr. Fernando Arturo Ibarra Flores, Universidad de Sonora URN, México Dr. James A. Pfister, USDA, Estados Unidos Dr. Eduardo Daniel Bolaños Aguilar, INIFAP, México Dr. Sergio Iván Román Ponce, INIFAP, México Dr. Jesús Fernández Martín, INIA, España Dr. Maurcio A. Elzo, Universidad de Florida Dr. Sergio D. Rodríguez Camarillo, INIFAP, México Dra Nydia Edith Reyes Rodríguez, Universidad Autónoma del Estado de Hidalgo, México Dra. Maria Salud Rubio Lozano, Facultad de Medicina Veterinaria y Zootecnia, UNAM, México Dra. Elizabeth Loza-Rubio, INIFAP, México Dr. Juan Carlos Saiz Calahorra, Instituto Nacional de Investigaciones Agrícolas, España Dr. José Armando Partida de la Peña, INIFAP, México
Revisando a las abejas del apiario; Tlalmanalco, Estado de México Fotografía: Fidel Ávila Ramos I
Dr. Arturo Francisco Castellanos Ruelas, Facultad de Química. UADY Dra. Guillermina Ávila Ramírez, UNAM, México Dr. Emmanuel Camuus, CIRAD, Francia. Dr. Héctor Jiménez Severiano, INIFAP., México
Dr. Carlos López Coello, Facultad de Medicina Veterinaria y Zootecnia, UNAM, México
DIRECTORIO FUNDADOR John A. Pino
Dr. Alejandro Plascencia Jorquera, Universidad Autónoma de Baja California, México
Dr. Jorge Alberto López García, INIFAP, México
Dr. Luis Corona Gochi, Facultad de Medicina Veterinaria y Zootecnia, UNAM, México Dr. Juan Manuel Pinos Rodríguez, Facultad de Medicina Veterinaria y Zootecnia, Universidad Veracruzana, México
Dr. Eugenio Villagómez Amezcua Manjarrez, INIFAP, CENID Salud Animal e Inocuidad, México Dr. José Juan Hernández Ledezma, Consultor privado Dr. Fernando Cervantes Escoto, Universidad Autónoma Chapingo, México Dr. Adolfo Guadalupe Álvarez Macías, Universidad Autónoma Metropolitana Xochimilco, México Dr. Alfredo Cesín Vargas, UNAM, México Dra. Marisela Leal Hernández, INIFAP, México Dr. Efrén Ramírez Bribiesca, Colegio de Postgraduados, México
REVISTA MEXICANA DE CIENCIAS PECUARIAS Volumen 13 Numero 4, Octubre Diciembre 2022. Es una publicación trimestral de acceso abierto, revisada por pares y arbitrada, editada por el Instituto Nacional de Investigaciones Forestales, Agrícolas y Pecuarias(INIFAP). Avenida Progreso No. 5, Barrio deSanta Catarina, Delegación Coyoacán, C.P. 04010, Cuidad de México, www.inifap.gob.mx Distribuida por el Centro Nacional deInvestigación Disciplinariaen Salud Animal eInocuidad, Km 15.5 Carretera México Toluca, Colonia Palo Alto, Cuidad de México, C.P. 05110. Editor responsable: Arturo García Fraustro. Reservas de Derechos al Uso Exclusivo número 04 2022 033116571100 102. ISSN: 2448 6698, otorgados por el Instituto Nacional del Derecho de Autor (INDAUTOR). Responsable de la última actualización de este número: Arturo García Fraustro, Centro Nacional de Investigación Disciplinaria en Salud Animal e Inocuidad, Km. 15.5 Carretera México Toluca, Colonia Palo Alto, Ciudad de México, C.P. 015110. http://cienciaspecuarias. inifap.gob.mx, la presente publicación tuvo su última actualización en septiembre de 2022.
Dr. Juan Hebert Hernández Medrano, UNAM, México
Dr. José Luis Romano Muñoz, INIFAP, México
Indizada en el “Journal Citation Report” Science Edition del ISI . Inscrita en el Sistema de Clasificación de Revistas Científicas y Tecnológicas de CONACyT; en EBSCO Host y la Red de Revistas Científicas de América Latina y el Caribe, España y Portugal (RedALyC) (www.redalyc.org); en la Red Iberoamericana de Revistas Científicas de Veterinaria de Libre Acceso (www.veterinaria.org/revistas/ revivec); en los Índices SCOPUS y EMBASE de Elsevier (www.elsevier. com).
Dr. Ricardo Basurto Gutiérrez, INIFAP, México
TIPOGRAFÍA Y FORMATO: Oscar L. Rodríguez Rivera
Dr. Adrian Guzmán Sánchez, Universidad Autónoma Metropolitana Xochimilco, México
Dr. Juan Ku Vera, Universidad Autónoma de Yucatán, México
EDITOR EN JEFE EDITORES ADJUNTOS Arturo García Fraustro Oscar L. Rodríguez Rivera Alfonso Arias Medina

VISIT OUR SITE IN THE INTERNET
EBSCO Host y la Red de Revistas Científicas de América Latina y el Caribe, España y Portugal (RedALyC) (www.redalyc.org), en la Red Iberoamericana de Revistas Científicas de Veterinaria de Libre Acceso (www.veterinaria.org/revistas/ revivec), indizada en el “Journal Citation Report” Science Edition del ISI (http://thomsonreuters. com/) y en los Índices SCOPUS y EMBASE de Elsevier (www.elsevier.com)
VISITE NUESTRA PÁGINA EN INTERNET
REVISTA MEXICANA DE CIENCIAS PECUARIAS
Revista Mexicana de Ciencias Pecuarias is an open access peer reviewed and refereed scientific and technical journal, which publishes results of research carried out in any scientific or academic institution, especially related to different areas of veterinary medicine and animal production. Papers on disciplines different from those shown in Editorial Committee can be accepted, if related to livestock research.
The journal publishes three types of papers: Research Articles, Technical Notes and Review Articles (please consult Instructions for authors). Authors are responsible for the content of each manuscript, which, owing to the nature of the experiments described, may contain references, in some cases, to commercial names of certain products, which however, does not denote preference for those products in particular or of a lack of knowledge of any other which are not mentioned, nor does it signify in any way an advertisement or an endorsement of the referred products. All contributions will be carefully refereed for academic relevance and quality. Submission of an article is understood to imply that the research described is unique and unpublished. Rev. Mex. Cien. Pecu. is published quarterly in original lenguage Spanish or English. Total fee charges are US $ 425.00 per article in both printed languages.
Todas las contribucionesserán cuidadosamente evaluadas por árbitros, considerando su calidad y relevancia académica. Queda entendido que el someter un manuscrito implica que la investigación descrita es única e inédita. La publicación de Rev. Mex. Cienc. Pecu. es trimestral en formato bilingüe Español e Inglés. El costo total porpublicares de $ 7,280.00 másIVA pormanuscrito ya editado. Se publica en formato digital en acceso abierto, por lo que se autoriza la reproducción total o parcial del contenido de los artículos si se cita la fuente. El envío de los trabajos de debe realizar directamente en el sitio oficial de la revista. Correspondencia adicional deberá dirigirse al Editor Adjunto a la siguiente dirección: Calle 36 No. 215 x 67 y 69 Colonia Montes de Amé, C.P. 97115 Mérida, Yucatán, México. Tel/Fax +52 (999) 941 5030. Correo electrónico (C ele): Larodriguez_oscar@prodigy.net.mx.correspondenciarelativaa suscripciones, asuntos de intercambio o distribución de números impresos anteriores, deberá dirigirse al Editor en Jefe de la Revista Mexicana de Ciencias Pecuarias, CENID Salud Animal e Inocuidad, Km 15.5 Carretera México Toluca, Col. Palo Alto, D.F. C.P. 05110, México; Tel: +52(55) 3871 8700 ext. 80316; garcia.arturo@inifap.gob.mx o Inscritaarias.alfonso@inifap.gob.mx.enlabasededatosde
La Revista Mexicana de Ciencias Pecuarias es un órgano de difusión científica y técnica de acceso abierto, revisada por pares y arbitrada. Su objetivo es dar a conocer los resultados de las investigaciones realizadas por cualquier institución científica, relacionadas particularmente con las distintas disciplinas de la Medicina Veterinaria y la Zootecnia. Además de trabajos de las disciplinas indicadas en su Comité Editorial, se aceptan también para su evaluación y posible publicación, trabajos de otras disciplinas, siempre y cuando estén relacionados con la investigación pecuaria. Se publican en la revista tres categorías de trabajos: Artículos Científicos, Notas de Investigación y Revisiones Bibliográficas (consultar las Notas al autor); la responsabilidad de cada trabajo recae exclusivamente en los autores, los cuales, por la naturaleza misma de los experimentos pueden verse obligados a referirse en algunos casos a los nombres comerciales de ciertos productos, ello sin embargo, no implica preferencia por los productos citados o ignorancia respecto a los omitidos, ni tampoco significa en modo alguno respaldo publicitario hacia los productos mencionados.
Part of, or whole articles published in this Journal may be reproduced, stored in a retrieval system or transmitted in any form or by any means, electronic, mechanical, photocopying or otherwise, provided the source is properly acknowledged. Manuscripts should be submitted directly in the official web site. Additional information may be mailed to Associate Editor, Revista Mexicana de Ciencias Pecuarias, Calle 36 No. 215 x 67 y 69 Colonia Montes de Amé, C.P. 97115 Mérida, Yucatán, México. Tel/Fax +52 (999) 941 5030. E mail: rodriguez_oscar@prodigy.net.mx. For subscriptions, exchange or distribution of previous printed issues, please contact: Editor in Chief of Revista Mexicana de Ciencias Pecuarias, CENID Salud Animal e Inocuidad, Km 15.5 Carretera México Toluca, Col. Palo Alto, D.F. C.P. 05110, México; Tel: +52(55) 3871 8700 ext. 80316; garcia.arturo@inifap.gob.mx or Registeredarias.alfonso@inifap.gob.mx.intheEBSCOHostdatabase. The Latin American and the Caribbean Spain and Portugal Scientific Journals Network (RedALyC) (www.redalyc.org). The Iberoamerican Network of free access Veterinary Scientific Journals (www.veterinaria.org/ revistas/ revivec). Thomson Reuter´s “Journal Citation Report” Science Edition (http://thomsonreuters.com/). Elsevier´s SCOPUS and EMBASE (www.elsevier.com) and the Essential Electronic Agricultural Library (www.teeal.org).
Full articles from year 1963 to date and Instructions for authors can be accessed via the site http://cienciaspecuarias.inifap.gob.mx
Artículos completos desde 1963 a la fecha y Notas al autor en: http://cienciaspecuarias.inifap.gob.mx
II
REVISTA MEXICANA DE CIENCIAS PECUARIAS REV. MEX. CIENC. PECU. VOL. 13 No. 4 OCTUBRE DICIEMBRE 2022 CONTENIDOContents
Efecto de la cobertura del suelo sobre el crecimiento y productividad del zacate buffel (CenchrusciliarisL.) en suelos degradados de zonas áridas Effect of soil cover on the growth and productivity of buffel grass (CenchrusciliarisL.) in degraded soils of arid zones
Ernesto Herssaín Pedroza Parga, Aurelio Pedroza Sandoval, Miguel Agustín Velásquez Valle, Ignacio Sánchez Cohen, RicardoTrejo Calzada, José Alfredo Samaniego Gaxiola 866
Vertical and spatial price transmission in the Mexican and international cattle and beef market Transmisión vertical y espacial de precios en el mercado mexicano e internacional de ganado JosévacunoLuis Jaramillo Villanueva …………………………………………………………………………………………..…894
Evaluation of morphological and yield traits in the populations of Viciaspp. Evaluación de rasgos morfológicos y de rendimiento en las poblaciones de Viciaspp. Hamideh Javadi, Parvin Salehi Shanjani, Leila Falah Hoseini, Masoumeh Ramazani Yeganeh.......846
Exploring bovine fecal bacterial microbiota in the Mapimi Biosphere Reserve, Northern Mexico Explorando la microbiota bacteriana fecal bovina en la Reserva de la Biosfera de Mapimí, norte de IreneMéxicoPacheco Torres Cristina García De la Peña, César Alberto Meza Herrera, Felipe Vaca Paniagua, Clara Estela Díaz Velásquez, Claudia Fabiola Méndez Catalá, Luis Antonio Tarango Arámbula, Luis Manuel Valenzuela Núñez, Jesús Vásquez Arroyo 910 III
ARTÍCULOSArticles Pág.
Tipología de consumidores de miel con educación universitaria en México
Typology of honey consumers with a university education in Mexico Fidel Ávila Ramos, Lizeth Paula Boyso Mancera, Mercedes Borja Bravo, Venancio Cuevas Reyes, Blanca Isabel Sánchez Toledano 879
Effect of weight and body condition score from pregnant cows on the carcass characteristics of their progeny: Meta-analysis Efecto del peso y la puntuación de la condición corporal de vacas gestantes en las características de la canal de su progenie: Meta análisis Sander Martinho Adams, John Lenon Klein, Diego Soares Machado, Dari Celestino Alves Filho, Ivan Luiz Brondani, Luiz Angelo Damian Pizzuti 981
IV
Perfil fitoquímico, actividad antimicrobiana y antioxidante de extractos de Gnaphaliumoxyphyllum y Euphorbiamaculatanativas de Sonora, México Phytochemical profile, antimicrobial and antioxidant activity of extracts of Gnaphalium oxyphyllumand Euphorbiamaculatanative to Sonora, Mexico Priscilia Yazmín Heredia Castro, Claudia Vanessa García Baldenegro, Alejandro Santos Espinosa, Iván de Jesús Tolano Villaverde, Carmen Guadalupe Manzanarez Quin, Ramón Dolores Valdez Domínguez, Cristina Ibarra Zazueta, Reyna Fabiola Osuna Chávez, Edgar Omar Rueda Puente, Carlos Gabriel Hernández Moreno, Susana Marlene Barrales Heredia, Jesús Sosa Castañeda .......... ………………………………………928
Growth performance and carcass classification of pure Pelibuey and crossbred lambs raised under an intensive production system in a warm-humid climate Rendimiento productivo y clasificación de canales de corderos Pelibuey puros y cruzados criados bajo un sistema de producción intensivo en un clima cálido húmedo Miriam Rosas Rodríguez, Ricardo Serna Lagunes, Josafhat Salinas Ruiz, Julio Miguel Ayala Rodríguez, Benjamín Alfredo Piña Cárdenas, Juan Salazar Ortiz ……………………………………………..962
Effects of acid whey on the fermentative chemical quality and aerobic stability of rehydrated corn grain silage Efectos del suero ácido sobre la calidad química fermentativa y la estabilidad aeróbica del ensilado de grano de maíz rehidratado Ediane Zanin, Egon Henrique Horst, Caio Abércio Da Silva, Valter Harry Bumbieris Junior …943
.................................................................................. …….
Caracterización de los sistemas de producción familiar ovina en la Mixteca Oaxaqueña, México Family sheep production systems in the Mixteca region of Oaxaca, Mexico Jorge Hernández Bautista, Héctor Maximino Rodríguez Magadán Teódulo Salinas Rios, Magaly Aquino Cleto, Araceli Mariscal Méndez ....1009
..........................................……………….........
Factores de riesgo asociados a la seroprevalencia de lentivirus en rebaños ovinos y caprinos del noreste de México Risk factors associated with lentivirus seroprevalence in sheep and goat herds from northeastern RogelioMexico Ledezma Torres, José C. Segura Correa, Jesús Francisco Chávez Sánchez, Alejandro José Rodríguez García, Sibilina Cedillo Rosales, Gustavo Moreno Degollado, Ramiro Avalos Ramírez .995
REVISIONES DE ReviewsLITERATURA La hipocalcemia en la vaca lechera. Revisión Hypocalcemia in the dairy cow. Review Carlos Fernando Arechiga Flores, Zimri Cortés Vidauri, Pedro Hernández Briano, Renato Raúl Lozano Domínguez, Marco Antonio López Carlos, Ulises Macías Cruz, Leonel Avendaño Reyes ..............................................................................................................…1025
Evaluación bacteriana de queso artesanal Zacazonapan madurado bajo condiciones no controladas en dos épocas de producción Bacterial evaluation of Zacazonapan artisanal cheese matured under non controlled conditions in two production periods
NOTAS DE
Jair Jesús Sánchez Valdés, Vianey Colín Navarro, Felipe López González, Francisca Avilés Nova, Octavio Alonso Castelán Ortega, Julieta Gertrudis Estrada Flores 1067 Antigen production and standardization of an in-house indirect ELISA for detection of antibodies againstAnaplasmamarginale Producción de antígenos y estandarización de un ELISA casero indirecto para la detección de anticuerpos contra Anaplasmamarginale Elizabeth Salinas Estrella, María Guadalupe Ortega Hernández, Erika Flores Pérez, Natividad Montenegro Cristino, Jesús Francisco Preciado de la Torre, Mayra Elizeth Cobaxin Cárdenas, Sergio D. Rodríguez ....................................................................................………………........1079
ComportamientoTechnicalINVESTIGACIÓNnotesproductivo y valor nutricional del pasto Pennisetumpurpureumcv Cuba CT 115, a diferente edad de rebrote Productive performance and nutritional value of Pennisetumpurpureumcv. Cuba CT 115 grass at different regrowth ages Gloria Esperanza de Dios León, Jesús Alberto Ramos Juárez, Francisco Izquierdo Reyes, Bertín Maurilio Joaquín-Torres, Francisco Meléndez-Nava ……………........1055
........................................
V
La Revista Mexicana de Ciencias Pecuarias se edita completa en dos idiomas (español e inglés) y publica tres categorías de trabajos: Artículos científicos, Notas de investigación y Revisiones bibliográficas.
2. Todos los trabajos estarán sujetos a revisión de un Comité Científico Editorial, conformado por Pares de la Disciplina en cuestión, quienes desconocerán el nombre e Institución de los autores proponentes. El Editor notificará al autor la fecha de recepción de su trabajo.
VI
Los autores interesados en publicar en esta revista deberán ajustarse a los lineamientos que más adelante se indican, los cuales en términos generales, están de acuerdo con los elaborados por el Comité Internacional de Editores de Revistas Médicas (CIERM) Bol Oficina Sanit Panam 1989;107:422 437.
3. El manuscrito deberá someterse a través del portal de la Revista en la dirección electrónica: http://cienciaspecuarias.inifap.gob.mx, consultando el “Instructivo para envío de artículos en la página de la Revista Mexicana de Ciencias Pecuarias”. Para su elaboración se utilizará el procesador de Microsoft Word, con letra Times New Roman a 12 puntos, a doble espacio. Asimismo se deberán llenar los formatos de postulación, carta de originalidad y no duplicidad y disponibles en el propio sitio oficial de la revista.
9. Resumen en inglés. Anotar el título del trabajo en inglés y a continuación redactar el “abstract” con las mismas instrucciones que se señalaron para el resumen en español. Al final en punto y aparte, se deberán escribir las correspondientes palabras clave (“key words”).
Actualización: marzo, 2020
NOTAS AL AUTOR
1. Sólo se aceptarán trabajos inéditos. No se admitirán si están basados en pruebas de rutina, ni datos experimentales sin estudio estadístico cuando éste sea indispensable. Tampoco se aceptarán trabajos que previamente hayan sido publicados condensados o inextensoen Memorias o Simposio de Reuniones o Congresos (a excepción de Resúmenes).
4. Por ser una revista con arbitraje, y para facilitar el trabajo de los revisores, todos los renglones de cada página deben estar numerados; asimismo cada página debe estar numerada, inclusive cuadros, ilustraciones y gráficas.
8. Resumenenespañol.Enlasegundapáginasedebe incluir un resumen que no pase de 250 palabras. En él se indicarán los propósitos del estudio o investigación; los procedimientos básicos y la metodología empleada; los resultados más importantes encontrados, y de ser posible, su significación estadística y las conclusiones principales. A continuación del resumen, en punto y aparte, agregue debidamente rotuladas, de 3 a 8 palabras o frases cortas clave que ayuden a los indizadores a clasificar el trabajo, las cuales se publicarán junto con el resumen.
5. Los artículos tendrán una extensión máxima de 20 cuartillas a doble espacio, sin incluir páginas de Título, y cuadros o figuras (los cuales no deberán exceder de ocho y ser incluidos en el texto). Las Notas de investigación tendrán una extensión máxima de 15 cuartillas y 6 cuadros o figuras. Las Revisiones bibliográficas una extensión máxima de 30 cuartillas y 5 cuadros.
6. Los manuscritos de las tres categorías de trabajos que se publican en la Rev. Mex. Cienc. Pecu. deberán contener los componentes que a continuación se indican, empezando cada uno de ellos en página aparte. Página del título Resumen en español Resumen en inglés AgradecimientosTexto y conflicto de interés Literatura citada 7. Página del Título Solamente debe contener el título del trabajo, que debe ser conciso pero informativo; así como el título traducido al idioma inglés. En el manuscrito no es necesaria información como nombres de autores, departamentos, instituciones, direcciones de correspondencia, etc., ya que estos datos tendrán que ser registrados durante el proceso de captura de la solicitud en la plataforma del OJS (http://ciencias pecuarias.inifap.gob.mx).
10. Texto.Lastrescategorías detrabajosquesepublican en la Rev. Mex. Cienc. Pecu. consisten en lo a)siguiente:Artículoscientíficos.Deben serinformesdetrabajos originales derivados de resultados parciales o finales de investigaciones. El texto del Artículo científico se divide en secciones que llevan estos encabezamientos:
b) Notas de investigación. Consisten en modificaciones a técnicas, informes de casos clínicos de interés especial, preliminares de trabajos o investigaciones limitadas, descripción de nuevas variedades de pastos; así como resultados de investigación que a juicio de los editores deban así ser publicados. El texto contendrá la misma información del método experimental señalado en el inciso a), pero su redacción será corrida del principio al final del trabajo; esto no quiere decir que sólo se supriman los subtítulos, sino que se redacte en forma continua y c)coherente.Revisiones bibliográficas. Consisten en el tratamiento y exposición de un tema o tópico de relevante actualidad e importancia; su finalidad es la de resumir, analizar y discutir, así como poner a disposición del lector información ya publicada sobre un tema específico. El texto se divide en: Introducción, y las secciones que correspondan al desarrollo del tema en cuestión.
EnLiteraturaConclusionesDiscusiónResultadosMaterialesIntroducciónyMétodoseimplicacionescitadalosartículoslargospuede
subtítulos dentro de estas divisiones a fin de hacer más claro el contenido, sobre todo en las secciones de Resultados y de Discusión, las cuales también pueden presentarse como una sola sección.
RevistasArtículoordinario,convolumenynúmero. (Incluya el nombre de todos los autores cuando sean seis o menos; si son siete o más, anote sólo el nombre de los seis primeros y agregue “etal.”).
sólo las iniciales, empezando por el apellido paterno, luego iniciales del materno y nombre(s). En caso de apellidos compuestos se debe poner un guión entre ambos, ejemplo: Elías Calles E. Entre las iniciales de un autor no se debe poner ningún signo de puntuación, ni separación; después decada autor sólo se debe poner una coma, incluso después del penúltimo; después del último autor se debe poner un Elpunto.título del trabajo se debe escribir completo (en su idioma original) luego el título abreviado de la revista donde se publicó, sin ningún signo de puntuación; inmediatamente después el año de la publicación, luego el número del volumen, seguido del número (entre paréntesis) dela revista yfinalmente el número de páginas (esto en caso de artículo ordinario de Puederevista).incluir en la lista de referencias, los artículos aceptados aunque todavía no se publiquen; indique la revista y agregue “en prensa” (entre corchetes).
11. Agradecimientos y conflicto de interés. Siempre que corresponda, se deben especificar las colaboraciones que necesitan ser reconocidas, tales como a) la ayuda técnica recibida; b) el agradecimiento por el apoyo financiero y material, especificando la índole del mismo; c) las relaciones financieras que pudieran suscitar un conflicto de intereses. Las personas que colaboraron pueden ser citadas por su nombre, añadiendo su función o tipo de colaboración; por ejemplo: “asesor científico”, “revisión crítica de la propuesta para el estudio”, “recolección de datos”, etc. Siempre que corresponda, los autores deberán mencionar si existe algún conflicto de interés.
ser necesario agregar
12. Literatura citada. Numere las referencias consecutivamente en el orden en que se mencionan por primera vez en el texto. Las referencias en el texto, en los cuadros y en las ilustraciones se deben identificar mediante números arábigos entre paréntesis, sin señalar el año de la referencia. Evite hasta donde sea posible, el tener que mencionar en el texto el nombre de los autores de las referencias. Procure abstenerse de utilizar los resúmenes como referencias; las “observaciones inéditas” y las “comunicaciones personales” no deben usarse como referencias, aunque pueden insertarse en el texto (entre Reglasparéntesis).básicasparalaLiteraturacitadaNombredelosautores,conmayúsculas
En el caso de libros de un solo autor (o más de uno, pero todos responsables del contenido total del libro), después del o los nombres, se debe indicar el título del libro, el número de la edición, el país, la casa editorial y el año.
Cuando se trate del capítulo de un libro de varios autores, se debe poner el nombre del autor del capítulo, luego el título del capítulo, después el nombre de los editores y el título del libro, seguido del país, la casa editorial, año y las páginas que abarca el Encapítulo.elcaso de tesis, se debe indicar el nombre del autor, el título del trabajo, luego entre corchetes el grado (licenciatura, maestría, doctorado), luego el nombre de la ciudad, estado y en su caso país, seguidamente el nombre de la Universidad (no el de la escuela), y finalmente el año. Emplee el estilo de los ejemplos que aparecen a continuación, los cuales están parcialmente basados en el formato que la Biblioteca Nacional de Medicina de los Estados Unidos usa en el IndexMedicus
VII
VIII
XVII) AOAC. Oficial methods of analysis. 15th ed. Arlington, VA, USA: Association of Official Analytical Chemists. 1990.
XIX) SAS. SAS User´s Guide: Statistics (version 5 ed.). Cary NC, USA: SAS Inst. Inc. 1985.
I) Basurto GR, Garza FJD. Efecto de la inclusión de grasa o proteína de escape ruminal en el comportamiento de toretes Brahman en engorda. Téc Pecu Méx 1998;36(1):35 48.
XIII) Alvarez MJA. Inmunidad humoral en la anaplasmosis ybabesiosisbovinasen becerrosmantenidosen una zona endémica [tesis maestría]. México, DF: Universidad Nacional Autónoma de México; 1989.
VIII) Steel RGD, Torrie JH. Principles and procedures of statistics: A biometrical approach. 2nd ed. New York, USA: McGraw Hill Book Co.; 1980. Autordecapítulo. IX) Roberts SJ. Equine abortion. In: Faulkner LLC editor. Abortion diseases of cattle. 1rst ed. Springfield, Illinois, USA: Thomas Books; 1968:158 179. Memoriasdereuniones.
V) Hall JB, Staigmiller RB, Short RE, Bellows RA, Bartlett SE. Body composition at puberty in beef heifers as influenced by nutrition and breed [abstract]. J Anim Sci 1998;71(Suppl 1):205.
XVIII)SAS. SAS/STAT User’s Guide (Release 6.03). Cary NC, USA: SAS Inst. Inc. 1988
XXI) Villalobos GC, González VE, Ortega SJA. Técnicas para estimar la degradación de proteína y materia orgánica en el rumen y su importancia en rumiantes en pastoreo. Téc Pecu Méx 2000;38(2): 119 5725.pdf.http://www.tecnicapecuaria.org/trabajos/20021217134.Consultado30Ago,2003.
VI) The Cardiac Society of Australia and New Zealand. Clinical exercise stress testing. Safety and performance guidelines. Med J Aust 1996;(164):282 284.
XIV) Cairns RB. Infrared spectroscopic studies of solid oxigen [doctoral thesis]. Berkeley, California, USA: University of California; 1965. Organizacióncomoautor. XV) NRC. National Research Council. The nutrient requirements of beef cattle. 6th ed. Washington, DC, USA: National Academy Press; 1984. XVI) SAGAR. Secretaría de Agricultura, Ganadería y Desarrollo Rural.Curso deactualización técnicapara la aprobación de médicos veterinarios zootecnistas responsables de establecimientos destinados al sacrificio de animales. México. 1996.
II) Stephano HA, Gay GM, Ramírez TC. Encephalomielitis, reproductive failure and corneal opacity (blue eye) in pigs associated with a paramyxovirus infection. Vet Rec 1988;(122):6 10.
XI) Olea PR, Cuarón IJA, Ruiz LFJ, Villagómez AE. Concentración de insulina plasmática en cerdas alimentadas con melaza en la dieta durante la inducción de estro lactacional [resumen]. Reunión nacional de investigación pecuaria. Querétaro, Qro. 1998:13.
IV) Cancer in South Africa [editorial]. S Afr Med J Suplemento1994;84:15.derevista.
XX) Jun Y, Ellis M. Effect of group size and feeder type on growth performance and feeding patterns in growing pigs. J Anim Sci 2001;79:803 813. Accessedhttp://jas.fass.org/cgi/reprint/79/4/803.pdf.Jul30,2003.
Sólonúmerosinindicarvolumen.
XII) Cunningham EP. Genetic diversity in domestic animals: strategies for conservation and development. In: Miller RH etal.editors. Proc XX Beltsville Symposium: Biotechnology’s role in genetic improvement of farm animals. USDA. Tesis.1996:13.
Publicacioneselectrónicas
grazing use of herbicide treated area by cattle. J Range Manage [in press] 2000. Libros y otras monografías Autortotal.
III) Chupin D, Schuh H. Survey of present status ofthe use of artificial insemination in developing countries. World Anim Rev 1993;(74 75):26 35. Noseindicaelautor.
Organización,comoautor.
VII)Enprocesodepublicación.ScifresCJ,KothmannMM.Differential
X) Loeza LR, Angeles MAA, Cisneros GF. Alimentación de cerdos. En: Zúñiga GJL, Cruz BJA editores. Tercera reunión anual del centro de investigaciones forestales y agropecuarias del estado de Veracruz. Veracruz. 1990:51 56.
XXII)Sanh MV, Wiktorsson H, Ly LV. Effect of feeding level on milk production, body weight change, feed conversion and postpartum oestrus of crossbred lactating cows in tropical conditions. Livest Prod Sci 2002;27(2 3):331 338. 2003.com/science/journal/03016226.http://www.sciencedirect.AccessedSep12,
18. Abreviaturas de uso frecuente: cal caloría (s) cm centímetro (s) °C grado centígrado (s) DL50 dosis letal 50% g gramo (s) ha hectárea (s) h hora (s) i.m. intramuscular (mente) i.v. intravenosa (mente) J joule (s) kg kilogramo (s) km kilómetro (s) L litro (s) log logaritmo decimal Mcal megacaloría (s) MJ megajoule (s) m metro (s) msnmmetros sobre el nivel del mar µg microgramo (s) µl microlitro (s) µm micrómetro (s)(micra(s)) mg miligramo (s) ml mililitro (s) mm milímetro (s) min minuto (s) ng nanogramo (s)Pprobabilidad (estadística) p página PC proteína cruda PCR reacción en cadena de la polimerasa pp páginas ppm partes por millón % por ciento (con número) rpm revoluciones por minuto seg segundo (s) t tonelada (s) TND total de nutrientes digestibles UA unidad animal UI unidades internacionales vs versus xg Cualquiergravedadesotraabreviatura se pondrá entre paréntesis inmediatamente después de la(s) palabra(s) completa(s).
14 Versión final. Es el documento en el cual los autores ya integraron las correcciones y modificaciones indicadas por el Comité Revisor. Los trabajos deberán ser elaborados con Microsoft Word. Las fotografías e imágenes deberán estar en formato jpg (o compatible) con al menos 300 dpi de resolución. Tanto las fotografías, imágenes, gráficas, cuadros o tablas deberán incluirse en el mismo archivo del texto. Los cuadros no deberán contener ninguna línea vertical, y las horizontales solamente las que delimitan los encabezados de columna, y la línea al final del cuadro.
17. Los trabajos no aceptados para su publicación se regresarán al autor, con un anexo en el que se explicarán los motivos por los que se rechaza o las modificaciones que deberán hacerse para ser reevaluados.
15. Unavez recibidala versión final, ésta se mandará para su traducción al idioma inglés o español, según corresponda. Si los autores lo consideran conveniente podrán enviar su manuscrito final en ambos idiomas.
16. Tesis. Se publicarán como Artículo o Nota de Investigación, siempre y cuando se ajusten a las normas de esta revista.
19. Los nombres científicos y otras locuciones latinas se deben escribir en cursivas. IX
13. Cuadros, Gráficas e Ilustraciones. Es preferible que sean pocos, concisos, contando con los datos necesarios para que sean autosuficientes, que se entiendan por sí mismossin necesidaddeleer el texto. Para las notas al pie se deberán utilizar los símbolos convencionales.
b) Technical Notes. They should be brief and be evidence for technical changes, reports of clinical cases of special interest, complete description of a limited investigation, or research results which X
4. Tofacilitatepeer review allpagesshouldbenumbered consecutively, including tables, illustrations and graphics, and the lines of each page should be numbered as well.
necessary to add other sections to make the content clearer. Results and Discussion can be shown as a single section if considered appropriate.
a)ResearchArticles. They should originate in primary works and may show partial or final results of research. The text of the article must include the following
8. Abstract. On the second page a summary of no more than 250 words should be included. This abstract should start with a clear statement of the objectives and must include basic procedures and methodology. The more significant results and their statistical value andthe main conclusionsshouldbe elaborated briefly. At the end of the abstract, and on a separate line, a list of up to 10 key words or short phrases that best describe the nature of the research should be stated.
Title page
2. All contributions will be peer reviewed by a scientific editorial committee, composed of experts who ignore the name of the authors. The Editor will notify the author the date of manuscript receipt.
Revista Mexicana de Ciencias Pecuarias is a scientific journal published in a bilingual format (Spanish and English) which carries three types of papers: Research Articles, Technical Notes, and Reviews. Authors interested in publishing in this journal, should follow the below mentioned directives which are based on those set down by the International Committee of Medical Journal Editors (ICMJE) Bol Oficina Sanit Panam 1989;107:422 437.
9. Text. The three categories of articles which are published in Revista Mexicana de Ciencias Pecuarias are the following:
Updated: March, 2020 INSTRUCTIONS FOR AUTHORS
1. Only original unpublished works will be accepted. Manuscripts based on routine tests, will not be accepted. All experimental data must be subjected to statistical analysis. Papers previously published condensed or inextensoin a Congress or any other type of Meeting will not be accepted (except for Abstracts).
5. Research articles will not exceed 20 double spaced pages, without including Title page and Tables and Figures (8 maximum and be included in the text). Technical notes will have a maximum extension of 15 pages and 6 Tables and Figures. Reviews should not exceed 30 pages and 5 Tables and Figures.
3. Papers will be submitted in the Web site http://cienciaspecuarias.inifap.gob.mx, according the “Guide for submit articles in the Web site of the Revista Mexicana de Ciencias Pecuarias”. Manuscripts should be prepared, typed in a 12 points font at double space (including the abstract and tables), At the time of submission a signed agreement co author letter should enclosed as complementary file; co authors at different institutions can mail this form independently. The corresponding author should be indicated together with his address (a post office box will not be accepted), telephone and Email.
AcknowledgmentsTextAbstract and conflict of interest
7. Title page. It should only contain the title of the work, which shouldbe concise but informative; aswell as the title translated into English language. In the manuscript is not necessary information as names of authors, departments, institutions and correspondence addresses, etc.; as these data will have to be registered during the capture of the application process on the OJS platform (http://cienciaspecuarias.inifap.gob.mx).
6. Manuscripts of all three type of articles published in Revista Mexicana de Ciencias Pecuarias should contain the following sections, and each one should begin on a separate page.
InLiteratureConclusionsDiscussionResultsMaterialsIntroductionparts:andMethodsandimplicationscitedlengthyarticles,itmaybe
Literature cited
f. In the case of a thesis, references should be made of the author’s name, the title of the research, thedegreeobtained, followed bythenameof the City, State, and Country, the University (not the school), and finally the year.
People which collaborated in the article may be named, adding their function or contribution; for example: “scientific advisor”, “critical review”, “data collection”, etc.
c. Accepted articles, even if still not published, can be included in the list of references, as long as the journal is specified and followed by “in press” (in d.brackets).
e. When a reference is made of a chapter of book written by several authors; the name of the author(s) of the chapter should be quoted, followed by the title of the chapter, the editors and the title of the book, the country, the printing house, the year, and the initial and final pages.
Whenever appropriate, collaborations that need recognition should be specified: a) Acknowledgement of technical support; b) Financial and material support, specifying its nature; andc) Financial relationships that could bethe source of a conflict of interest.
JournalsStandard journal article (List the first six authors followed by etal.)
c) Reviews. The purpose of these papers is to summarize, analyze and discuss an outstanding topic.
TheExamplesstyleof the following examples, which are partly based on the format the National Library of Medicine of the United States employs in its Index Medicus, should be taken as a model.
I) Basurto GR, Garza FJD. Efecto de la inclusión de grasa o proteína de escape ruminal en el comportamiento de toretes Brahman en engorda. Téc Pecu Méx 1998;36(1):35 48. Issuewithnovolume
V) Hall JB, Staigmiller RB, Short RE, Bellows RA, Bartlett SE. Body composition at puberty in beef heifers as influenced by nutrition and breed [abstract]. J Anim Sci 1998;71(Suppl 1):205. XI
In the case of a single author’s book (or more than one, but all responsible for the book’s contents), the title of the book should be indicated after the names(s), the number of the edition, the country, the printing house and the year.
III) Chupin D, Schuh H. Survey of present status of the use of artificial insemination in developing countries. World Anim Rev 1993;(74 75):26 35. Noauthorgiven
In the presence of compound last names, add a dash between both, i.e. Elias Calles E. Do not use any punctuation sign, nor separation between the initials of an author; separate each author with a comma, even after the last but one.
IV) Cancer in South Africa [editorial]. S Afr Med J Journal1994;84:15.supplement
II) Stephano HA, Gay GM, Ramírez TC. Encephalomielitis, reproductive failure and corneal opacity (blue eye) in pigs associated with a paramyxovirus infection. Vet Rec 1988;(122):6 10.
The text of these articles should include the following sections: Introduction, and as many sections as needed that relate to the description of the topic in question.
10. Acknowledgements.
should be published as a note in the opinion of the editors. The text will contain the same information presented in the sections of the research article but without section titles.
11. Literature cited. All references should be quoted in their original language. They should be numbered consecutively in the order in which they are first mentioned in the text. Text, tables and figure references should be identified by means of Arabic numbers. Avoid, whenever possible, mentioning in the text the name of the authors. Abstain from using abstracts as references. Also, “unpublished observations” and “personal communications” should not be used as references, although they can be inserted in the text (inside brackets).
Keyrulesforreferencesa.Thenamesofthe
authors should be quoted beginning with the last name spelt with initial capitals, followedbytheinitialsof thefirst and middlename(s).
b. The title of the paper should be written in full, followedbythe abbreviated titleof the journal without any punctuation sign; then the year of the publication, after that the number of the volume, followed by the number (in brackets) of the journal and finally the number of pages (this in the event of ordinary article).
XVII)AOAC. Official methods of analysis. 15th ed. Arlington, VA, USA: Association of Official Analytical Chemists. 1990.
VII)284.InpressScifresCJ,
XIV) Cairns RB. Infrared spectroscopic studies of solid oxigen [doctoral thesis]. Berkeley, California, USA: University of California; 1965.
Organizationasauthor XV) NRC. National Research Council. The nutrient requirements of beef cattle. 6th ed. Washington, DC, USA: National Academy Press; 1984.
XI) Olea PR, Cuarón IJA, Ruiz LFJ, Villagómez AE. Concentración de insulina plasmática en cerdas alimentadas con melaza en la dieta durante la inducción de estro lactacional [resumen]. Reunión nacional de investigación pecuaria. Querétaro, Qro. 1998:13.
VI) The Cardiac Society of Australia and New Zealand. Clinical exercise stress testing. Safety and performance guidelines. Med J Aust 1996;(164):282
XXI) Villalobos GC, González VE, Ortega SJA. Técnicas para estimar la degradación de proteína y materia orgánica en el rumen y su importancia en rumiantes en pastoreo. Téc Pecu Méx 2000;38(2): 119 5725.http://www.tecnicapecuaria.org/trabajos/20021217134.pdf.Consultado30Jul,2003.
XXII)Sanh MV, Wiktorsson H, Ly LV. Effect of feeding level on milk production, body weight change, feed conversion and postpartum oestrus of crossbred lactating cows in tropical conditions. Livest Prod Sci 2002;27(2 3):331 16226.http://www.sciencedirect.com/science/journal/030338.AccesedSep12,2003.
Conferencepaper
XIII) Alvarez MJA. Inmunidad humoral en la anaplasmosis ybabesiosisbovinasen becerrosmantenidosen una zona endémica [tesis maestría]. México, DF: Universidad Nacional Autónoma de México; 1989.
XII) Cunningham EP. Genetic diversity in domestic animals: strategies for conservation and development. In: Miller RH etal.editors. Proc XX Beltsville Symposium: Biotechnology’s role in genetic improvement of farm animals. USDA. Thesis1996:13.
13. Final version. This is the document in which the authors have already integrated the corrections and modifications indicatedbythe Review Committee. The works will have to be elaborated with Microsoft Word. Photographs and images must be in jpg (or compatible) format with at least 300 dpi resolution. Photographs, images, graphs, charts or tables must be included in the same text file. The boxes should not contain any vertical lines, and the horizontal ones only those that delimit the column headings, and the line at the end of the box XII
Organization,asauthor
XVI) SAGAR. Secretaría de Agricultura, Ganadería y Desarrollo Rural.Curso deactualización técnicapara la aprobación de médicos veterinarios zootecnistas responsables de establecimientos destinados al sacrificio de animales. México. 1996.
XVIII) SAS. SAS/STAT User’s Guide (Release 6.03). Cary NC, USA: SAS Inst. Inc. 1988 XIX) SAS. SAS User´s Guide: Statistics (version 5 ed.). Cary NC, USA: SAS Inst. Inc. 1985. Electronicpublications XX) Jun Y, Ellis M. Effect of group size and feeder type on growth performance and feeding patterns in growing pigs. J Anim Sci 2001;79:803 813. Accesedhttp://jas.fass.org/cgi/reprint/79/4/803.pdf.Jul30,2003.
12. Tables, Graphics and Illustrations. It is preferable that they should be few, brief and having the necessary data so they could be understood without reading the text. Explanatory material should be placed in footnotes, using conventional symbols.
X) Loeza LR, Angeles MAA, Cisneros GF. Alimentación de cerdos. En: Zúñiga GJL, Cruz BJA editores. Tercera reunión anual del centro de investigaciones forestales y agropecuarias del estado de Veracruz. Veracruz. 1990:51 56.
Kothmann MM. Differential grazing use of herbicide treatedarea bycattle. JRangeManage[in press] 2000. Books and other monographs Author(s) VIII) Steel RGD, Torrie JH. Principles and procedures of statistics: A biometrical approach. 2nd ed. New York, USA: McGraw Hill Book Co.; 1980. Chapterinabook IX) Roberts SJ. Equine abortion. In: Faulkner LLC editor. Abortion diseases of cattle. 1rst ed. Springfield, Illinois, USA: Thomas Books; 1968:158 179.
14. Once accepted, the final version will be translated into Spanish or English, although authors should feel free to send the final version in both languages. No charges will be made for style or translation services.
AU animal unit IU international units vs versus xg gravidity
15. Thesis will be published as a Research Article or as a Technical Note, according to these guidelines.
The full term for which an abbreviation stands should precede its first use in the text.
XIII
18. Scientific names and other Latin terms should be written in italics.
16. Manuscripts not accepted for publication will be returned to the author together with a note explaining the cause for rejection, or suggesting changes which should be made for re assessment.
17. List of abbreviations: cal calorie (s) cm centimeter (s) °C degree Celsius DL50 lethal dose 50% g gram (s) ha hectare (s) h hour (s) i.m. intramuscular (..ly) i.v. intravenous (..ly) J joule (s) kg kilogram (s) km kilometer (s) L liter (s) log decimal logarithm Mcal mega calorie (s) MJ mega joule (s) m meter (s) µl micro liter (s) µm micro meter (s) mg milligram (s) ml milliliter (s) mm millimeter (s) min minute (s) ng nanogram (s) P probability (statistic) p page CP crude protein PCR polymerase chain reaction pp pages ppm parts per million % percent (with number) rpm revolutions per minute sec second (s) t metric ton (s) TDN total digestible nutrients
846 https://doi.org/10.22319/rmcp.v13i4.6125Article
*Corresponding author: Hjavadim@yahoo.com; Javadi@rifr ac.ir
Abstract: The study was focused on estimation of genotypic variation for the morphological and forage yield traits of some vetch genotypes to assess their breeding potential. A small plot trial was carried out in 2018 2020 at the experimental field of the Research Institute of Forests and Rangelands, Alborz province, Iran. Fifty eight (58) vetch genotypes of Vicia spp. from the natural resources gene bank of Iran, were tested. There was significant (P<0.01) genotypic variation among populations, for all the traits measured. V monantha (32845) produced high plant and large pods, while V. villosa (322) produced more biomass than other accessions. In the shorter growing seasons, the earliness of V. sativa var.angustifollia (4740,7243), V. sativa var.stenophylla (1862), V. villosa (315, 322) resulted in high seed yield. The principal component analysis showed that the variations observed were mainly caused by traits such as days to flowering and seed ripening and seed traits, that their contribution was important in discriminating the populations. Direct selection can also be made for the populations with high biomass yield based on the recorded performance of these populations during the field experiments. A cluster analysis of the tested vetch populations based on measured traits, at 11.49 genetic distance, created five main groups that showed the similarityof members of each group. Generally, vetchspecies andtheir populations had different growth features, phenology, forage and seed productivity. The generated information in this study gives a base for genetics variety of genus Vicia L. and could be useful for including in the future breeding programs.
Key words: Biomass yield, Morphological traits, Phenology, Seed yield, Vicia spp.
Evaluation of morphological and yield traits in the populations of Vicia spp. Hamideh Javadi a* Parvin Salehi Shanjani a Leila Falah Hoseini a Masoumeh Ramazani Yeganeh a a GeneBankof Research Instituteof Forests andRangelands, Agricultural Research,Education and Extension Organization, Tehran, Iran.
Vicia L. is a genus with around 232speciesin theworldand 45speciesin Iran,from thelegume family, Fabaceae, as an annual and perennial herb. These species have been known by the common name vetches. The genus is primarily found in the Mediterranean and Irano Turanian regions, such as in Iran, Anatoly, Caucasus, Iraq, Afghanistan, Central Asia, Talesh, Syria, Armenia, Turkmenistan, Jordan, North Africa, Greece, Pakistan, and Palestine(1) Vetches are short lived forage plants that are highly resistant to cold and dehydration conditions and can be grown in rainfed and irrigated climates. They fix nitrogen in the soil by fixation in root nodes, and help to soil erosion by planting in sloping areas(2,3) As a legume crop, it provides nitrogen to the soil and reduces the incidence of diseases in succeeding non leguminous crops. Their widespread adaptation and excellent capacities to produce biomass make them very attractive to farmers(4) . One attraction of vetch is its versatility, which permits diverse utilization as either ruminant feed or green manure. Because of rapid growth in the first year, different species of Vicia spp. can be used to improve overall livestock, feed quality, improve soils, agriculturefor fodder, greenmanure,human nutrition,and thepharmaceutical industry(5) Iran is a genetics resources of the genus Vicia and it is widely distributed in different habitats and conditions. Most of the plants in Vicia genus show more variety in morphological traits and sometimes it is difficult to distinguish species of this genus(6,7)
Genetic variation among Vicia genotypes is imperative for their efficient utilization in plant breeding schemes and effective conservation. Diversity studies available in germplasm, collections have been performed on many plant species for Vicia genus from different regions of the world. In comparison to other annual forage legumes, advances in breeding vetches (Vicia spp.) are rather modest. It has been one of the morphological characteristics of the plant reported in V. sativa(8 14) , V faba(15) , V narbonensis(8,10,11,15) , V ervilia(16) , V villosa(10,11) , V atropurpurea(11) , V. dasycarpa(8) , V hybrid, V. pannonica, V. lutea, V. peregrine, V. lathyroides and V. grandiflora(11) . There are 335 accessions of 25 Vicia spp. in natural resources gene bank of Iran, that have been collected from different geographical regions of Iran. In this study, it was aimed to determine somemorphologicalcharacteristicsandforage yieldsofdifferentvetchgenotypesbycollecting from natural flora of Iran region. The present study was focused on the estimation of genotypic
Rev Mex Cienc Pecu 2022;13(4):846 865 847 Received: 22/12/2021 Accepted: 21/04/2022
Introduction
Rev Mex Cienc Pecu 2022;13(4):846 865 848 variation for 12 morphological traits within the V. michauxii, V. michauxii var.stenophylla, V. monantha, V. narbonensis, V. sativa with three varieties: V. sativa var.angustifollia, V. sativa var.cordata, V. sativa var.sativa and V. villosa, to assess their breeding potential and suitability for developing novel common vetch lines with improved agronomic characteristics related to grain production and quality.
Taxon Code Abbre.code Origin, province Longitude Latitude Altitude(masl) V. michauxii 2944 Vmi East Azerbaijan, Kaleybar 47° 02´ 38° 51´ 1500 V. michauxii var.stenophylla 37129 Vmis Qom 50° 56´ 34° 11´ 2482 V. monantha 32845 Vmo Kermanshah 47° 14´ 34° 8´ 1338 V. narbonensis 34878 Vn Lorestan, Aleshtar 48° 10´ 33° 45´ 1495 V. sativa 5321 Vs East Azerbaijan 46° 16´ 37° 54´ 1750 6646 Vs Lorestan, Kohdasht 33° 40´ 47° 30´ 1200 6654 Vs Lorestan, Kohdasht 33° 17´ 47° 27´ 1130 6681 Vs Lorestan, Kohdasht 33° 32´ 47° 37´ 1260 11760 Vs Gilan, Rezvanshahr 37° 31´ 49° 13´ 280 11761 Vs Gilan, Rasht 36° 51´ 49° 37´ 80 11762 Vs Gilan, Rezvanshahr 37° 37´ 49° 07´ 280 11763 Vs Gilan, Rasht 37° 59´ 49° 33´ 100 11764 Vs Gilan, Talesh 37° 32´ 45° 55´ 280 11771 Vs Gilan, Talesh 37° 42´ 48° 55´ 150 11772 Vs Gilan, Rezvanshahr 37° 32´ 49° 07´ 20 11774 Vs Gilan, Rasht 37° 11´ 49° 39´ 120 24062 Vs Gilan, Astaneh Ashrafiyyeh 37° 20´ 49° 47´ 25 24069 Vs Gilan, Chabuksar 36° 56´ 50° 32´ 170 24074 Vs Gilan, Astaneh Ashrafiyyeh 37° 19´ 50° 07´ 16 24076 Vs Gilan, Chabuksar 36° 57´ 50° 35´ 210 24084 Vs Gilan, Rahimabad 37° 02´ 50° 18´ 40 24097 Vs Gilan, Rahimabad 37° 01´ 50° 17´ 45 32972 Vs Kermanshah, Hersin 34° 13´ 47° 25´ 1367 33456 Vs Hamadan 47° 57´ 34° 24´ 1545 38517 Vs Gilan, Siyahkal 49° 57´ 36° 59´ 342 38523 Vs Gilan, Talesh 49° 3´ 37° 36´ 405 38526 Vs Gilan 48° 46´ 37° 41´ 827 38527 Vs Gilan, Astra 48° 58´ 38° 24´ 21 38528 Vs Gilan, Rudsar 50° 12´ 36° 48´ 608 38531 Vs Gilan, Rezvan shahr 49° 20´ 37° 30´ 315
Material and methods Germplasm
Table 1: The list of studied 58 vetch (Vicia spp.) populations
A total of 58 germplasm populations were evaluated in this study. This consisted of 1 V. michauxii, 1 V. michauxii var.stenophylla, 1 V. monanta, 1 V. narbonensis, 34 V. sativa, 9 V. sativa var.angustifollia, 1 V. sativa var.cordata, 4 V. sativa var.sativa and 6 V. villosa. The populations were acquired from the Natural Resources Genebank of Iran (Table 1).
V. sativa var.angustifollia 38524 Vsa Gilan, Siahkal 50° 14´ 36° 53´ 670 38525 Vsa Gilan, Talesh 48° 51´ 37° 41´ 281 38530 Vsa Gilan, Talesh 48° 52´ 37° 41´ 215 38534 Vsa Gilan, Rasht 49° 35´ 37° 0´ 137 38535 Vsa Gilan, Rodbar 49° 40´ 36° 46´ 968 38537 Vsa Gilan, Gilan 49° 31´ 36° 56´ 187 4740 Vsa Ilam, Ivan 46° 26´ 33° 38´ 1170 7243 Vsa Kohkiloye ve Boyerahmad, Firozabad 52° 57´ 28° 86 1900 38529 Vsa Gilan, Rezvan shahr 49° 5´ 37° 28´ 307 V. sativa var.cordata 34295 Vsc Gilan, Rezvan shahr 49° 4´ 37° 36´ 310 V. sativa var.sativa 1862 Vss Kermanshah 47° 06´ 34° 31´ 1350 24631 Vss Kermanshah 47° 06´ 34° 31´ 1400 29802 Vss Kohkiloye ve Boyerahmad 30° 59´ 51° 07´ 2380 32900 Vss Kermanshah 34° 16´ 46° 09´ 1444 V. villosa 315 Vv Alborz, Karaj 35° 83´ 51° 01´ 1460 322 Vv Karaj 35° 83´ 51° 01´ 1470 6268 Vv Fars, Shiraz, Sepidan, Sheshpir 30° 25´ 51° 98´ 2350 14561 Vv Merkezi, Arak 34° 09´ 49° 70´ 1730 28061 Vv Ardabil 38° 25´ 48° 29´ 1350 34212 Vv Chahar mahale Bakhtiyari, Borujen 31° 46´ 50° 59´ 2600
Field trial
Rev Mex Cienc Pecu 2022;13(4):846 865 849 38532 Vs Gilan, Talesh 49° 4´ 37° 37´ 450 38533 Vs* Gilan 38° 10´ 48° 20´ 600 38536 Vs* Gilan 36° 54´ 49° 26´ 577 40310 Vs Kermanshah, Salase babajani 34° 49´ 46° 05´ 1395 40315 Vs Kermanshah, Salase babajani 34° 49´ 46° 05´ 1395 40326 Vs Kermanshah, Javanrud 34° 48´ 46° 33´ 1525 40334 Vs Kermanshah, Salase babajani 34° 51´ 46° 01´ 1395 43100 Vs Khozestan, Masjed soliman 31° 56 49° 18´ 870
Morphological traits
Ten plants (normal growth, uniform performance, disease and insect pest free) of each 58 Vicia populations were evaluated by 12 different quantitative traits including day to spourat (day to germination), days to first flowering, days to total flowering, days to maturity (days to
Seed of all 58 populations were sown in seedling pots (December 2018). Then planting and maintenance operations were carried out in the field at the research field of Research Institute of Forests and Rangelands, Alborz province, Iran (2018 2020). A week before planting, the soil was prepared as a fine seedbed to enhance good seedling establishment. The field experimental layout was a One way analysis of variance (ANOVA) designed. The row and plant spacings were100and40cm, respectively.Thetrial was managedaccordingto previouse experiences (several hand weeding was practiced, the first hand weeding was made 40 d after crop emergence, and then repeated every forty days until the end of the growing season, to minimizeyieldreduction duetoweedcompetitionsforsoilnutrients,waterandsolarradiation). Irrigation was applied during the trial. The populations were harvested for seed during the period July to November 2020, depending on their maturity.
Cluster analysis was performed using Ward’s methods and Euclidean distance and a dendrogram was calculated. Results Theresults of analysis variance revealed significant (P<0.01) variationfor eight morphological and yield traits among taxa and populations of Vicia spp. except for pod width trait among populations (Table 2). Table 3 shows the comparison of mean morphological and yield traits in nine taxa of Vicia spp. The value of plant height, internode length and stems number differ between 24.50-150 cm, 3.29-15 cm and 2.81-9, respectively. The highest value of plant height (150 cm), stems number (9) and internode length (15 cm), were shown in V. monantha (Vmo) and V. michauxii var. stenophylla (Vmis), respectively. The variation of pod length between taxa was significant and it differs from1.06 cm in V. sativa var.cordata (Vsc) to 4 cm in V. monantha (Vmo). There was no significant difference in pod width between taxa and they located as two groups (a and b), so two taxa of V. michauxii (Vmi and Vmis) had the widest pod (1.14 and 1.1 cm). Despite the significant differences in biomass yield and dry weight traits, V. villosa (Vv) showed the most value of these traits (biomass yield=60.12 g and dry weight=15.63 g). Fifty eight (58) populations of Vicia spp. were compared for vegetative and phenology traits (Table 4). There was a wide range of value in plant height from 19 cm in V. sativa var.angustifollia (38534) to 150 cm in V. monantha (32845), also the most value of plant height between populations of species were shown in V. villosa (322) (100.33 cm). V.michuxii
Data analysis
Data were subjected to analysis of variance (ANOVA) using the SAS software system(18) . Significant differences among the mean values of 12 traits were compared the DMRT Duncan test. Pearson correlation was determined using SPSS v.21. To evaluate the information containedin thecollected morphological data,principalcomponentanalysis (PCA)was carried out byMinitab software (version 15). PCA was used to identifythe most important traits (plant height, internode length, stems number, pod length, pod width, pod index, biomass yield, dry weight, day to sprout, days to first flowering, days to total flowering, days to maturity) in the data set. Mean values populations were used to create a correlation matrix from which the standardizedPCAscores were extracted anda Scatterplot onthe first twoPCAwas performed.
Rev Mex Cienc Pecu 2022;13(4):846 865 850 seed ripening), plant height (at 50 % flowering, cm), internode length (second internode at 50 % flowering, cm), stems number, pod length (cm), pod width (cm), pod index (pod length/width), biomass yield (plant fresh weight) (g), and plant dry weight (g)(17) .
Analysis of the genetic correlations among the mentioned traits in the tested vetch populations revealed the existence of several significant positive coefficients (Table 5), namely between plant height with internode length (rgxy=0.43; P<0.01), stems number (rgxy=0.38; P<0.01) and pod length with internode length (rgxy=0.24; P<0.05), pod width (rgxy =0.23; P<0.05), day to sprout (rgxy=0.28; P<0.05), days to first flowering (rgxy=0.28; P<0.05) and days to maturity (rgxy=0.26; P<0.05), pod index with day to sprout (rgxy =0.23; P<0.05) and days to first flowering (rgxy=0.23; P<0.05) On the other hand, the relationship between pod width with pod index (rgxy =−0.26; P<0.05), biomass yield (rgxy =−0.35; P<0.01), and dry weigth (rgxy =−0.28; P<0.05), internode length with dry weigth (rgxy =−0.38; P<0.01) were negatively and significant.
Rev Mex Cienc Pecu 2022;13(4):846 865 851 (37129) (100 cm), V. sativa (38527) (90 cm) and V. sativa var.cordata (34295) (85.13 cm). The length of the internode was a very differet from 1.83 cm in V. sativa (24062, 40334, 43100) to 15 cm in V. michauxii var.stenophylla (37129). Also, 9.83, 8.69, and 8.28 cm of internode length were shown in V. sativa (38527), V. sativa var.cordata (34295), and V. sativa var.angustifollia (38525), respectively. The highest and lowest number of stems were 2 and 15, which were shown in two different taxa of V. sativa species (Vsa38530 and Vs11774) This trait in populations of V. villosa was no significant different Four populations of V. sativa (38527,33456,24074and32972), V. sativa var.angustifollia(38525) and V. monantha (32845), had the largest pod in terms of length (4 4.53 cm) and populations V. michauxii var.stenophylla (37129), and V. sativa (5321) had the largest pod in terms of width (1.1 and 1.06 cm). In compareof yieldtraits (biomass yield anddryweight),threepopulations of V. sativa: Vs11761, Vs24062, Vs40326, and two populations of V.villosa:Vv322, Vv6268, had the most values of these traits. The values of these traits in these populations were Vs11761 (83 and 26 g.), Vs24062 (83 and 26 g), Vs40326 (103.67 and 36.33 g), Vv322 (108.33 and 38.60) and Vv6268 (83.50 and 19.73 g). The results of phenology traits showed that all of the populations based on day to sprout and days to first flowering traits were divided into two groups (a and b). V. narbonesis (34878), V. monantha (32845)and two taxaof V. michauxii (Vmi2944 and Vmis37129)had thesamevalue in day to sprout and days to first flowering traits, but populations V. sativa var.angustifollia (Vsa4740, Vsa7243), V. sativa var.stenophylla (Vss1862, Vss24631) and two populations of V. villosa (Vv315, Vv6268) with 21 and 90 d for day to sprout and first flowering were separated from the rest of populations by earlier germination and flowering. In days to total flowering and maturity traits, populations were divided as four groups (a, b, c and d). Days to total flowering as four groups:125a,120b,115c,107d and seed maturity:167a,162b,158c,150d. Populations in group d (107 and 150 d of flowering and seed maturation) had the shortest time required for full flowering and seed maturation. That is, they reached full flowering and seed maturity earlier than other populations. Populations of V. sativa var.angustifollia (Vsa4740, Vsa7243), V. sativa var.stenophylla (Vss1862, Vss29802, Vss32900) and V. villosa (Vv315, Vv6268), having the shortest day for full flowering and seed maturation (Table 4).
var.stenophylla
Rev Mex Cienc Pecu 2022;13(4):846 865 852
A cluster analysis of the tested Vicia spp. populations showed five main groups (Table 6 and Figure 2).
Cluster G1 contained five populations, belonging to V.sativa var.angustifollia with two populations (7243, 4740), V. sativa var.sativa one population (1862) and V. villosa with two populations (315, 6268).They are characterized by the lowest values of phenology traits (day to spourat, days to first flowering, total flowering, and seed maturity). Cluster G2 contained 13 populations: 11 populations belonging to V. sativa (6646, 6681, 11761, 24062, 24069, 24074, 32972, 40310, 40315, 40326, 40334), population 38530 of V. sativa var.angustifollia and 322 of V. villosa. They are also characterized by the highest amount of vegetative, seed and yield traits compared to other populations. Cluster G3 included 16 popullations belonging to V. sativa (6654, 11760, 11762, 11771, 11772, 24076, 24084, 24097, 43100), population 38529 of V. sativa var.angustifollia, V. sativa var.sativa (24631, 29802, 32900), 28061, 34212 and 14561 of V. villosa, with high amount of vegetative traits were collectedin onegroup. Cluster G4 containedsevenpopulations: fivebelongto species V sativa (11763, 11764, 11774, 38526, 38527), population 34295 of V. sativa var.cordata and V. monantha (32845). These were classified with the highest plant height, stems number and vegetative traits compared with other clusters. Cluster G5 was the largest one with 17 populations, nine from V. sativa (5321, 33456, 38517, 38523, 38528, 38531, 38532, 38533, 38536), five from V. sativa var.angustifollia (38524, 38525, 38534, 38535, 38537), V. michauxii (2944), V. michauxii var.stenophylla (37129) and V. narbonensis (34878).These were classified as highest vegetative and pod traits populations
Two dimensional principal component analysis showing the relationship among quantitative traits of studied populations is presented in Figure 1. Populations V. sativa var.angustifollia (4770, 7243), V. sativa var.sativa (1862), V. villosa (315, 6268) were separated partially by PC1; traits related to this separation are mainly phenology traits (day to spourat, days to first flowering, days to total flowering, days to maturity).
The principal component analysis (PCA) of the 12 quantitative traits is summarized in Table 7. The first five PCs had eigenvalues >1 and they explained more than 80 % of the total variation for the vegetative and phenology traits. Day to sprout, days to first flowering, days to total flowering and days to maturity were loaded highly in PC1 and they accounted for 25.7 % of the total variation. In PC2, Biomass yield and dry weight accounted for 21 % of the total variation. In PC3, plant height and internode length accounted for 14.3 % of the total variation. PC4 contributed 11.2 % of the total traits variation in these populations with plant length and stems number loading highly. PC5 accounted for 9.8 % of total variation with length, width and pod index. Generally, for the 12 vegetative and phenology traits studied, PC1 and PC2 constituted more than 46 % of the total traits variation with most phenology traits and yield relatedtraits. This indicatedthatthesetraits can be usedto classifythepopulations understudy.
Table 2: Analysis variance of eight morphological traits of 58 vetch (Vicia spp.) populations Source Variationsof Degrees of freedom (d.f) hPlanteight Internodelength nStemumber Pod length wPodidth iPodndex Biomassyield wDryeight Taxon 8 3770.70** 48.92** 25.93** 5.23** 0.47** 9.19** 3809.63** 223.70** Population 48 905.59** 12.11** 15.62** 1.89** 0.06 ns 7.76** 1967.42** 202.36** Error 150 346.70 2.28 2.58 0.39 0.05 1.30 218.67 18.08 CV % 35.88 29.18 32.38 22.77 39.08 22.53 44.56 48.83 t.not significannssignificant at 0.05 and 0.01 levels, respectively;*, **
Table 3: Means comparison of 8 traits in different species of Visia spp. Dry weight (g)Biomassyield(g)iPodndexPod(cm)widthPod length(cm)nStemsumberleInternodength(cm)Plant(cm)heightSpecies bc5.46cd9.59b4.36a1.14bc2.54b2.81bc6.56cd63.38V. michauxii (Vmi) bc5.0bd20.0c2.27a1.1bc2.5b5.0a15.0b100.0V. michauxii var. stenophylla (Vmis) c0.01d0.06a6.67b0.6a4.0a9.0b8.0a150.0V. monantha (Vmo) c1.15cd5.13ab5.1b0.65ab3.3b3.0cd4.7524.50 eV.narbonensis (Vn) ab9.16b35.06ab5.33b0.56bc2.88b5.08cd4.8ed48.41V. sativa (Vs) bc5.18bd19.03ab5.48b0.60ab3.27b4.6bc6.9ed45.07V. sativa var. angustifollia (Vsa) bc6.92bc27.92bc3.75b0.29d1.06a8.75b8.69bc85.13V. sativa var. cordata (Vsc) ab9.32ab41.08bc4.0b0.5cd2.0b4.58d3.29ec54.67V. sativa var. sativa (Vss) a15.63a60.12b4.26b0.51c2.17b4.5d3.36cd63.56V villosa (Vv)
Rev Mex Cienc Pecu 2022;13(4):846-865 853
FloweritotaltongDays FloweringfirsttoDay SprouttoWeightDry(g)YieldBiomass(g)IndexPodWidthPod(cm)LengthPod(cm)NumberStemsInternodeLength(cm)HeightPlant(cm)
158 c115 c95 a28 a8.91 e l34.49 e l5.75 b k0.63 bc3.63 a f6.40 d f8.00 b e53.40 c kVs38528
Rev Mex Cienc Pecu 2022;13(4):846-865 854
Population
158 c115 c95 a28 a2.66 i-n10.15 j-n3.72 k-p0.82 ab2.87 c-j2.67 g-i7.94 b-e78.56 c-eVmi2944 158 c115 c95 a28 a5.00 g n20.00 h n2.27 op1.1 a2.5 f k5 f i15 a100 bVmis37129 158 c115 c95 a28 a0.01 n0.06 n6.67 a h0.6 bc4 a c9 b d8 b e150 aVmo32845 162 b120 b95 a28 a1.16 k n5.13 l n5.10 f n0.65 bc3.30 b g3.00 g i4.75 f p24.50 i kVn34878 158 c115 c95 a28 a0.55 l n2.07 mn2.00 p1.06 a2.14 g l2.50 hi4.00 i p43.88 e kVs5321 158 c115 c95 a28 a14.61c f61.83 b d5.67 c k0.50 bc2.83 c j4.67 f i2.83 n p44.33 e kVs6646 158 c115 c95 a28 a10.83 d-i42.67 e-i4.00 j-p0.50 bc2.00 h-l4.00 f-i2.00 p28.33 h-kVs6654 158 c115 c95 a28 a18.43 cd74.83 bc7.93 ab0.50 bc3.97 a d5.00 f i3.33 l p63.00 c hVs6681 158 c115 c95 a28 a15.27 c f53.00 c g4.00 j p0.50 bc2.00 h l4.67 f i4.50 g p56.67 c kVs11760 162 b115 c95 a28 a26.00 b83.00 ab5.00 f n0.50 bc2.50 f k5.33 f h6.17 c l66.67 b gVs11761 158 c115 c95 a28 a5.06 g n19.00 h n5.00 f n0.50 bc2.50 f k6.00 e g3.67 j p37.67 f kVs11762 162 b120 b95 a28 a9.33 e k45.00 e h6.67 a h0.50 bc3.33 b g11 bc6.33 c i80.00 b eVs11763 158 c115 c95 a28 a9.03 e-l51.17 c-g5.33 e-m0.50 bc2.67 e-k11.67 b5.17 e-o61.67 c-iVs11764 158 c115 c95 a28 a11.43 d h56.67 b f4.00 j p0.50 bc2.00 f k4.33 f i4.83 f p52.33 d kVs11771 162 b120 b95 a28 a8.93 e l41.50 e i4.00 j p0.50 bc2.00 f k4.67 f i3.17 m p65.00 b hVs11772 158 c115 c95 a28 a15.27 c f53.00 c g5.33 e m0.50 bc2.67 e k15.00 a4.33 h p68.33 b fVs11774 162 b120 b95 a28 a26.00 b83.00 ab4.00 j p0.50 bc2.00 f k4.67 f i1.83 p40.00 f kVs24062 158 c115 c95 a28 a10.43 d j37.17 e k7.67 a d0.50 bc3.83 a e5.33 f h2.50 n p41.00 f kVs24069 158 c115 c95 a28 a10.43 d-j44.00 d-h8.67 a0.47 bc4.00 a-c6.00 e-g4.17 h-p49.67 d-kVs24074 162 b120 b95 a28 a8.93 e l41.50 e i5.50 d l0.47 bc2.50 f k4.33 f i3.50 k p41.33 f kVs24076 158 c115 c95 a28 a10.43 d j44.00 d h5.33 e m0.50 bc2.67 e k4.67 f i5.33 d o55.00 c kVs24084 158 c115 c95 a28 a8.77 e m45.00 e h4.00 j p0.50 bc2.00 f k6.00 e g3.00 n p51.33 d kVs24097 162 b120 b95 a28 a15.10 c f48.00 c h7.11 a f0.57 bc4.00 a c3.00 g i2.83 n p44.67 e kVs32972 158 c115 c95 a28 a5.30 g n21.29 h n6.39 b i0.64 bc4.04 a c4.86 f i6.07 c m43.43 e kVs33456 158 c115 c95 a28 a3.05 h-n11.27 j-n4.72 g-n0.53 bc2.50 f-k3.33 f-i6.17 c-l34.67 f-kVs38517 158 c115 c95 a28 a7.17 f n25.87 g n5.28 f m0.60 bc3.17 b h3.67 f i7.33 c g43.33 e kVs38523
158 c115 c95 a28 a5.50 g n18.92 h n6.18 b j0.40 bc2.73 e k6.33 f i6.50 c j86.17 b dVs38526
162 b115 c95 a28 a3.91 h n20.41 h n7.56 a e0.60 bc4.53 a3.00 g i9.83 b90.00 bcVs38527
Table 4: Means comparison of 12 traits of 58 populations of different species of Vicia spp. Days MaturitytoDays
855 Days MaturitytoDays
158 c115 c95 a28 a10.83 d-i57.71 b-e5.33 f-n0.50 bc2.67 e-k4.67 f-i4.50 g-p58.33 c-jVv14561
V. michauxii (Vmi), V. michauxii var. stenophylla (Vmis), V. monantha (Vmo), V.narbonensis (Vn), V. sativa (Vs), V. sativa var. angustifollia (Vsa), V. sativa var. cordata (Vsc), V. sativa var. sativa (Vss), V. villosa (Vv).
Population 158 c115 c95 a28 a3.95 h n13.00 i n4.68 h n0.60 bc2.84 c j5.20 f i6.40 c k46.00 e kVs38531 162 b115 c95 a28 a2.00 i n8.35 k n3.27 l p0.64 bc2.00 f k4.80 f i7.60 b f29.80 g kVs38532 158 c115 c95 a28 a2.29 i-n10.54 j-n5.93 b-k0.62 bc3.66 a-f3.40 f-i4.74 f-p33.30 f-kVs38533 158 c115 c95 a28 a0.83 k n3.04 mn4.47 h o0.50 bc2.23 g k3.67 f i7.00 c h36.33 f kVs38536 158 c115 c95 a28 a15.77 c e55.00 c g6.67 a h0.50 bc3.33 b g3.67 f i3.17 m p33.33 f kVs40310 158 c115 c95 a28 a14.63 c f51.33 c g6.33 b i0.50 bc3.17 b h3.67 f i2.50 n p38.33 f kVs40315 162 b120 b95 a28 a36.33 a103.67 a7.00 a f0.50 bc3.50 a f4.33 f i2.33 op44.67 e kVs40326 158 c115 c95 a28 a8.93 e l41.50 e i7.83 a c0.43 bc3.33 b g4.67 f i1.83 p31.33 f kVs40334 162 b120 b95 a28 a0.33 mn9.57 j-n3.00 n-p0.50 bc1.50 kl4.33 f-i1.83 p22.00 j-kVs43100 158 c115 c95 a28 a1.95 j n7.18 l n4.07 j p0.78 ab3.16 b h4.40 f i7.70 b f29.60 g kVsa38524 162 b115 c95 a28 a5.62 g n19.92 h n6.96 a g0.61 bc4.22 ab5.56 f h8.28 b d50.44 d kVsa38525 162 b115 c95 a28 a10.98 d h29.33 e n5.69 c k0.53 bc3.17 b h2.00 i6.67 c i65.33 b hVsa38530 162 b115 c95 a28 a5.80 g n26.75 f n6.50 b i0.50 bc3.25 b h5.00 f i5.50 d n19.00 kVsa38534 158 c115 c95 a28 a1.25 k n4.55 l n4.29 i o0.65 bc2.75 d k2.50 hi6.50 c j36.50 f kVsa38535 162 b115 c95 a28 a1.05 k-n4.70 l-n4.89 f-n0.60 bc2.93 c-i5.67 f-h8.00 b-e43.67 e-kVsa38537 150 d107 d90 b21 b9.33 e k45.00 f h4.00 j p0.50 bc2.00 h l5.00 f i3.50 k p49.67 d kVsa4740 150 d107 d90 b21 b5.67 g n18.67 h n5.33 e m0.50 bc2.67 e k4.33 f i5.17 e o54.33 c kVsa7243 158 c115 c95 a28 a0.60 l n3.10 mn2.00 p0.3 c0.6 m3 g i4 i p30 f kVsa38529 158 c115 c95 a28 a6.92 f n27.92 e n3.75 k p0.29 c1.06 l8.75 c e8.69 bc85.13 b dVsc34295 150 d107 d90 b21 b9.00 e l31.67 e m4.00 j p0.50 bc2.004.33 f i4.33 h p44.67 e kVss1862 167 a125 a90 b21 b11.43 d-h56.67 b-f3.67 k-p0.50 bc1.83 i-l5.00 f-i2.33 op51.00 d-kVss24631 150 d107 d95 a28 a8.93 e l41.50 e i5.00 f n0.50 bc2.50 h l4.33 f i3.50 k p67.33 b gVss29802 150 d107 d95 a28 a7.93 e n34.50 e l3.33 l p0.50 bc1.67 j l4.67 f i3.00 n p55.67 c kVss32900
Rev Mex Cienc Pecu 2022;13(4):846-865
FloweringtotaltoDays FloweringfirsttoDay SprouttoWeightDry(g)YieldBiomass(g)IndexPodWidthPod(cm)LengthPod(cm)NumberStemsInternodeLength(cm)HeightPlant(cm)
158 c115 c95 a28 a7.80 e n39.33 e i4.06 j p0.53 bc2.17 g l4.67 f i3.67 j p68.33 b fVv34212
Different letters indicate significant differences among different populations for the same species. P <0.05.
158 c115 c95 a28 a3.73 h n18.00 h n4.00 j p0.50 bc2.00 h l4.33 f i2.00 p51.67 d kVv28061
150 d107 d90 b21 b13.08 c g53.83 c g4.00 j p0.50 bc2.00 h l4.33 f i2.83 n p55.00 c kVv315 158 c115 c95 a28 a38.60 a108.33 a5.00 f n0.50 bc2.50 f k4.33 f i4.00 i p100.33 bVv322 150 d107 d90 b21 b19.73 bc83.50 ab3.17 m p0.53 bc1.67 j l4.67 f i3.17 m p47.67 e kVv6268
Traits heightPlant internodelength numberStems lengthPod widthPod indexPod Biomassyield weightDry Day sproutto Days to floweringfirst Days floweringtotaltoInternode length 0.43** Stems number 0.38** 0.11ns Pod length 0.13 ns 0.24* 0.03 ns Pod width 0.10 ns 0.51 ns -0.22 ns 0.23* Pod index 0.09 ns 0.06 ns 0.16 ns 0.86 ns 0.26* Biomass yield 0.11 ns -0.46 ns 0.14 ns -0.03 ns 0.35-** 0.20 ns Dry weight 0.13 ns 0.38** 0.07 ns 0.03 ns 0.28* 0.22 ns 0.95 ns Day to sprout 0.04 ns 0.19 ns 0.06 ns 0.28* 0.11 ns 0.23* -0.16 ns -0.09 ns Days to first flowering 0.04 ns 0.19 ns 0.06 ns 0.28* 0.11 ns 0.23* 0.16 ns 0.09 ns 1 ns Days to total flowering 0.08 ns 0.03 ns 0.05 ns 0.17 ns 0.03 ns 0.15 ns 0.04 ns 0.07 ns 0.46 ns 0.46 ns Days to maturity -0.07 ns 0.13 ns 0.02 ns 0.26* 0.06 ns 0.21 ns -0.03 ns 0.02 ns 0.50 ns 0.50 ns 0.92 ns *, ** significant at 0.05 and 0.01 levels, respectively; ns not significant.
Rev Mex Cienc Pecu 2022;13(4):846-865 856 Table 5: Simple correlation matrix for the 12 traits of Vicia spp. populations
Table 6: Means comparison of 12 traits of five vetch groups produced in Figure 2 Groups hPlanteight(cm) Internodelength(cm) nStemsumber Pod length(cm) wPodidth(cm) iPodndex Biomassyield(g) wDryeight(g) Day to sprout Days to first flowering Days to total flowering Days to maturity G1 50.27 b 3.80 c 4.53 c 2.07 c 0.51 b 4.10 d 46.53 b 11.36 b 21.00 c 90.00 c 107.00 c 150.00 c G2 50.97 b 3.40 c 4.36 c 3.24 a 0.50 b 6.51 a 63.15 a 18.94 a 28.00 a 95.00 a 116.15 a 159.54 a G3 49.50 b 3.43 c 4.60 b 2.04 c 0.49 c 4.14 d 37.73 c 8.20 c 27.56 b 94.69 b 115.56 b 158.31 b G4 88.76 a 6.98 b 9.25 a 3.00 b 0.48 c 5.93 b 30.92 c 7.14 c 28.00 a 95.00 a 115.71 b 159.14 a G5 43.91 c 7.12 a 4.21 c 3.01 b 0.68 a 4.72 c 13.43 d 3.44 d 28.00 a 95.00 a 115.29 b 159.18 a abc Different letters indicate significant differences among different populations for the same species. P<0.05.
Proportion
Figure 1: Two principal components showing the relationship among 12 traits of 58 populations of Vicia spp.
Rev Mex Cienc Pecu 2022;13(4):846 865 1 Table 7: Eigenvalues, the proportion of variance, and morphological traits that contributed to the first five principal components (PC)
Cumulative
-6-5-4-3-2-10123 4 3 2 1 0 -1 -2 -3 -4 -5 First Component (26%) )%(CSecondomponent21 Vv34212 Vv28061 Vv14561 Vv6268 Vv322 Vv315 Vss32900 Vss29802 Vss24631 Vss1862 Vsc34295 Vsa38529 Vsa7243 Vsa4740 Vsa38537 Vsa38535 Vsa38534 Vsa38530 Vsa38525 Vs43100Vsa38524 Vs40334 Vs40326 Vs40315 Vs40310 Vs38536 Vs38533 Vs38532 Vs38531 Vs38528 Vs38527 Vs38526 Vs38523 Vs38517 Vs33456 Vs32972 Vs24097 Vs24084 Vs24076 Vs24074 Vs24069 Vs24062 Vs11774 Vs11772 Vs11771 Vs11764 Vs11763 Vs11762 Vs11761 Vs11760 Vs6681 Vs6654 Vs6646 Vs5321 Vn34878 Vm32845 Vms37129 Vm2944 857
Variable PC1 PC2 PC3 PC4 PC5 Plant height 0.058 0.029 0.466 0.441 0.267 Internode length 0.208 0.302 0.428 0.055 0.242 Stems number 0.050 0.107 0.176 0.668 0.075 Pod length 0.310 0.154 0.389 0.244 0.378 Pod width 0.141 0.303 0.243 0.301 0.357 Pod index 0.230 0.332 0.265 0.084 0.533 Biomass yield 0.144 0.53 0.004 0.062 0.236 Dry weight 0.101 0.541 0.043 0.042 0.321 Day to sprout 0.464 0.017 0.102 0.045 0.075 Days to first flowering 0.464 0.017 0.102 0.045 0.075 Days to total flowering 0.380 0.129 0.338 0.057 0.164 Days to maturity 0.419 0.100 0.267 0.014 0.151 Eigenvalue 3.340 2.723 1.856 1.452 1.279 0.257 0.210 0.143 0.112 0.098 0.257 0.467 0.610 0.721 0.820
34 48 22 99 11 49 0 00 Distance 858
Rev Mex Cienc Pecu 2022;13(4):846 865 2 Figure 2: Dendrogram of 58 populations of Vicia spp explained by complete linkage clustering of 12 traits
Vss1862 Vsa7243 Vv6268 Vv315 Vsa4740 Vv322 Vs40326 Vs24062 Vs11761 Vsa38530 Vs32972 Vs40334 Vs24074 Vs24069 Vs6681 Vs40315 Vs40310 Vs6646 Vss24631 Vsa38529 Vs43100 Vss32900 Vss29802 Vs24076 Vs11772 Vv14561 Vs24084 Vv34212 Vs24097 Vs11771 Vv28061 Vs11762 Vs11760 Vs6654 Vsc34295 Vs38526 Vs11774 Vs11764 Vs11763 Vs38527 Vm32845 Vsa38524 Vsa38537 Vs38532 Vs38531 Vs38523 Vsa38535 Vs38536 Vs38517 Vsa38525 Vs38528 Vsa38534 Vs38533 Vs33456 Vn34878 Vms37129 Vs5321 Vm2944
A comparison between taxon (V. sativa: Vs, Vsa, Vsc and Vss, V. mchauxii: Vmi and Vmis, V. monantha: Vmo, V. narbonensis: Vn and V. villosa: Vv) showed V. monantha (Vmo) with high values of plant height, stems number, pod length and V. villosa with high values of biomass yield and dry weight. Berhanu and Abera(24) showed that among the vetch species (V. sativa, V. villosa, V. dasycarpa, and V. bengalensis), V. dasycarpa and V. villosa were the best performing species for forage. Then the vetch species tested in the current study could be used for pasture expansion and forage production, in livestock exclusion areas, in forage strips, as an under sowing with food crops, or as a backyard forage crop in the pasture of the country.
Rev Mex Cienc Pecu 2022;13(4):846 865 3 Discussion In these study, 58 populations of Vicia spp. were investigated for genetic diversity based on morphological and phenology traits. Due to, genetic diversity analysis of germplasms using morphological traits is an initial step for crop improvement(19 22) . There was significant (P<0.01) genotypic variation among 58 germplasm accessions of Vicia spp. for all the measured vegetative and yield traits: plant length, internode length, stems number, pod length, pod width, pod index, biomass yield and dry weight.The estimates of genotypic variation and repeatability for these traits indicated the potential genetic variation available among the germplasm accessions within Vicia spp. investigated. Similar results were obtained by the Ebrahimi et al(23) on plant and seed morphology traits of white Bean genotypes, Mikic et al(12) on forage and seed yields of three lines of common vetch and Berhanu and Abera(24) on forage yield of vetch species investigation.
Phenology(earlinessandlateness)ofvetchspecies hasagreat effectonseed yieldproductivity. Late maturity for forage and seed was recorded at 125 and 167 d, respectively. This could be due to high and extended rainfall at the region of populations that encouraged vegetative growth and delayed forage and seed harvesting stages. The results indicated that for vetch populations tested, 107 to 125 and 150 to 167 d were required after the emergence of the seedlings for total flowering and seed maturity, respectively. On average, the difference in 859
The populations demonstrated high variation in plant height, internode length, stem number, pod length, biomass yield and dry weight. Populations: Vmo32845, Vv322, Vmis37129 (for plant height),populations: Vmi37129, Vs38527,Vsc34295(forinternodelength),populations: Vs11774,Vs11764,Vs11763 (for stems number), populations: Vs38527, Vmo32845, Vsa38525 (for pod length) and populations:Vs11761, Vs24062, Vs40326,Vv322, Vv6268 (for biomass yield and dry weight) showed the highest values of the mentioned traits. However, broadening the genetic base from diverse sources is recommended to include most of the genetic determinants of these traits(25). This variability can be exploited in fodder breeding programs to select an adapted plant material for the arid and semi arid areas(26)
Rev Mex Cienc Pecu 2022;13(4):846 865 4 harvest forage and seed yield between populations are about 18 and 17 d. This indicates different responses of the tested populations for these important agronomic traits.
According to Getnet et al(27) , Vicia narbonensis and Vicia sativa are early maturing and Vicia villosa is late maturing species. But in this study two populations of V. villosa (315 and 6268) and four populations of V.sativa var.angustifollia (4740, 7243), V. sativa var.sativa (1862, 29802, 32900) with 107 and 150 d for flowering and seed maturity is recommended for seed production due to earliness, whereas late maturing species like V. sativa var.sativa (24631) should not be advisable to grow for seed purpose.
There is a direct relationship between plant length with internode length and the number of stems, this indicates that tall plants produce long internodes and more number stems. Also, the length and width of the pod have a direct relationship with the number of days of sprout, flowering and seed maturation, which means long and wide pods are produced by late flowering and seed maturation time. Since, in cereals, the correlation between grain yield and plantheight isoftennegative,butinlegumes,thiscorrelationisoftenpositive,becauselegumes have unlimited growth, therefore, with increasing height, more pods are produced, which has a positive effect on performance, so similar results were obtained in the traits of white Bean genotypes where high grain yields were strongly correlated to days to flowering and plant height(23) and Lens spp.(28) .
In PCA, since the first component includes changes that are not explained by the second component and the two components are independent of each other, so the two components were intersected vertically and in the form of a biplot diagram to determine the diversity between different genotypes and determine the far and near genotypes to be used. Phenology traits(daytosprout,days tofirstflowering,daysto totalflowering,daystomaturity) accounted for the variations recorded in the populations in PC1. On the other hand, yield traits (biomass yield and dry weight) accounted for the variation observed in the populations in PC2. The total cumulative variance in the first two PC was more than 46 %, indicating the high degree of diversity among the traits under study. Furthermore, the traits can be used as phenotypic traits in differentiating the populations. In plot PCA (Figure 1), populations, V. sativa var.angustifollia (Vsa7243, Vsa4740), V. sativa var.sativa (1862) and V. villosa (Vv315, Vv6268), separated from other populations and located on the left of X axis by containing less of phenology traits (important in the first component). So, these populations recommend for areas with short growth periods. Populations V. sativa (40326) and V. villosa (322), for containing high value of biomass and dry weight, located on the bottom of Y axis (negative effect of biomass and dry weight on the second component). As a result, two populations, V. sativa (40326) and V. villosa (322), produce forage yield more than other populations 860
In the present study, the 58 populations of Vicia spp. were grouped into five clusters using 12 traits.The populations of cluster G1 are characterized by the lowest values of days to sprout, flowering, and seed maturity which are the candidate of further evaluations. Also, these populations had a shoter time for these traits. Members of G1 are similar to the dispersion of these populations in the PCA plot (Figure 1). It is interesting that the population from different climates like Shiraz clustered with populations from Karaj. This pattern of clustering indicates, the diversity of populations within these geographical areas and, the similarity of populations from different geographical areas.
The findings showed the high variation of morphology and yield traits in different species and populations of vetch. These differences are very important to select the type of companion crops and methods of integration to improve yields of both crops (food and forage) without significant effect of one on the other. Vicia sativa (Kermanshah, Javanrod) and V. villosa (Karaj) were superior in terms of fresh and dry forage yields. V.michauxii var.stenophylla (Qom), V. monantha (Kermanshah), V. sativa (Gilan, Astara), and V. villosa (Karaj), are recommended by having tall plant and big pods. However, more comprehensive studies and additional experiments are required to complete information for breeding programs.
These results agree with the report of Alemayehu and Becker(29) in Brassica carinata. Cluster G2 contained 13 populations belonging to V. sativa and V. villosa species. These populations had a high value of seed, yield and phenology traits. Member of G2 due to having a long time for flowering and seed maturity, produce more seed and forage yield. This is the best factor, that can be used for livestock feeding. Cluster G3 contained mixed 16 populations of V. sativa and V. villosa. with lowest values of seed and forage yield gather together in a group, that they are not important inbreeding. Cluster G4 contained seven populations of V. sativa and V. monantha with high vegetative traits, that recommend livestock feeding and control of erosion. G5 group with 17 populations of V. sativa, V. michauxii and V. narbonensis were classified as laterfloweringandseed ripeningandcontaininglessamount of yieldforage. Thesepopulations can be used for areas with a long growth time. Finally in this study populations were located as five groups based on morphology and phenology traits. Members of each group are similar for mentioned traits and can be recommended for breeding programs. Also, the results indicated no relationship between studied traits and the origin of populations
Rev Mex Cienc Pecu 2022;13(4):846 865 5
Conclusions and implications
861
Acknowledgments
The authors thank Dr. Jalilian for identification of plants and the director of Gene Bank for providing seeds and making the lab facilities available for our study and RIFR in Iran for financial support.
Rev Mex Cienc Pecu 2022;13(4):846 865 6
3. Gurmani ZA, Shafiq ZM, Bashir M. Performance of Vetch, Vicia sativa cultivars for fodder production under rain fed condition of Pothwar region. J Agric Res 2006;44(4): 291 299. 4. Kebede G. Correlation and cluster analysis for quantitative and qualitative traits of accessions of vetch species in the central highlands of Ethiopia. G J Adv Res 2016; 3(7):56 72.
5. Duc G, Bao SY, Baum M, Redden B, Sadiki M. Suso MJ. Diversity maintenance and use of Vicia faba L. genetic resource. Field Crops Res 2010;115:270 278.
Literature cited:
7. Smýkal P, CoyneCJ,AmbroseMJ,MaxtedN,SchaeferH,BlairMW, et al.Legumecrops phylogeny and genetic diversity for science and breeding. Crit Rev Plant Sci 2015;34:43 104. 8. Rahmati T, Azarfar A, Mahdavi A, Khademi K, Fatahnia F, Shaikhahmadi H, Darabighane B. Chemical composition and forage yield of three Vicia varieties (Vicia spp.) at full blooming stage. Ital J Anim Sci 2012;1(3):308 311. 862
2. Rebole A, Alzueta C, Ortiz LT, Barrol C, Rodriguez ML, Caballero R. Yields and chemical composition of different parts of the common vetch at flowering and at two seed filling stages. Span J Agric Res 2004;2(4):550 557.
1. Mozaffarian V. A dictionary of plant names. 1st ed. Farhang moaser publication, Tehran, Iran. 2006.
6. Büyükkartal HN, Çölgeçen H, Pınar NM. Seed coat ultrastructure of hard seeded and soft seeded varieties of Vicia sativa. Turk J Botany 2013;37:270 275.
9. Dong R, Jahufer MZZ, Dong DK, Wang YR, Liu ZP. Characterisation of the morphological variation for seed traits among 537 germplasm accessions of common vetch (Vicia sativa L.) using digital image analysis. N Z J Agric Res 2016;59(4):422 435.
7
Rev Mex Cienc Pecu 2022;13(4):846 865
16. Abbasi MR, Vaezi1 S, Baghaie N. Genetic diversity of bitter vetch (Vicia ervilia) collection of the National Plant Gene Bank of Iran based on agro morphological traits. IR J Rangelands and Forests Pl Breeding and Gene Res 2007;15(2):113 128.
17. Arzani H, Ahmadi Z, Azarnivand H, Bihamta MR. Forage quality of three life forms of rangeland species in semi arid and semi humid regions in different phenological stages Desert 2010;15:71 74.
14. Grela ER, Samolinska W, Rybinski W, Kiczorowska B. Nutritional and anti nutritional factors in Vicia sativa l. Seeds and the variability of phenotypic and morphological characteristics of some vetch accessions cultivated in european countries. Animals 2021; 11(44):1 15.
18. SAS. SAS/STAT User´s Guide. Statistical Analysis System. Inc. Cary, NC. Versión 9.1. 2011. 863
12. Mikić A, Mihailović V, Karagić D, Milošević B, Milić D, Vasiljević S, Katanski S, Zivanov D. Common vetch (Vicia sativa) multi podded mutants for enhanced commercial seed production. Proc Appl Bot Genet Breed 2019;180(1):78 81.
15. Saberi A. Investigation of yield and morphological traits of some new forage products and forgotten forage plants in Golestan province. Appl Res Pl Ecophysi 2019;6(2):45 57.
13. Sanchez GutierrezRA,Figueroa GonzálesJJ,Rivera VázquezJS,Reveles HernándezM, Gutiérrez Bañuelos H, Espinoza Canales A. Yield and nutritional value of common vetch (Vicia sativa l.)duringfall winterin Zacatecas, RevMex CiencPecu2020;11(1):294 303.
10. Demirkan AK, Nizam I, Orak A, Şen C, Serkan Tenikecier H, Güler N, Ersoy H. Determination of some morphological characters and forage yield of Vetch (Vicia sp.) genotypes collected from thrace region of Turkey. Int J Adv Res 2018;(11):276 283.
11. Kebede G. Morpho‑agronomic performance of vetch species and their accessions grown under nitosol and vertisol conditions in the central highlands of Ethiopia. Agric Food Secur 2018;7(90):1 14.
21. LoumeremM, AlerciaA.Descriptorsforjute(Corchorus olitorius L.).GenetResourCrop Evol 2016;63(7):1103 1111. 22. Shen G, Girdthai T, Liu ZY, Fu YH, Meng QY, Liu FZ. Principal component and morphological diversity analysis of Job’s tears (Coix lacryma jobi L.). Chil J Agric Res 2019;79:131 143. 23. Ebrahimi M, Bihamta MR, Hoseinzade AH, Golbashy M, Khialparast F. A study of agronomy and morphologic traits of white bean genotypes using multivariate analysis. J Crop Breed 2009;1(3):1 13. 24. Berhanu T, Abera M. Adaptation and forage yield of vetches (Vicia spp.) in the southern highlands of Ethiopia. Agric Sci Pract 2017;4(1):46 49. 25. Ghafoor A, Ahmad Z, Qureshi AS, Bashir M. Genetic relationship in Vigna mungo (L.) Hepper and V. radiate (L.) R. Wilczek based on morphological traits and SDSPAGE. Euphytica 2002;123:367 378.
8
Rev Mex Cienc Pecu 2022;13(4):846 865
19. Julia CC, Waters DLE, Wood RH, Rose TJ. Morphological characterization of Australian ex situ wild rice accessions and potential for identifying novel sources of tolerance to phosphorus deficiency. Genet Resour Crop Evol 2016;63:327 337.
26. Chebouti A, Meziani N, Bessedik F, Laib M, Amrani S. Variation in morphological traits and yield evaluation among natural populations of Medicago truncatula and Medicago laciniata. Asian J Biol Sci 2019;12:596 603. 27. Getnet A, Tekleyohanes B, Lemma G, Mesfin D, Diriba G. Major herbaceous forage legumes: Some achievements in species and varietal evaluation in Ethiopia. In: Kemal A, et al, editors. Food and forage legumes of Ethiopia: progress and prospects. Proc Workshop Food Forage Legumes 22 26 September 2003. Addis Ababa, Ethiopia. 28. Goghari M, Dashti H, Madah Hosseini Sh, Dehghan E. Evaluation of genetic diversity of lentil germplasm using morphological traits in Bardsir. IR J Field Crop Sci 2014; 45(4):541 551. 864
20. Peratoner G, Seling S, Klotz Florian C, Figl U, Schmitt AO. Variation of agronomic and qualitative traits and local adaptation of mountain landraces of winter rye (Secale cereale L.) from Val Venosta/Vinschgau (South Tyrol). Genet Resour Crop Evol 2016;63:61 273.
Rev Mex Cienc Pecu 2022;13(4):846 865 9 29. Almayehu N, Becker H. Enotypic diversity and patterns of variation in a germplasm material of Ethiopian mustard (Brassica carinata A. Braun). Genet Resour Crop Evol 2002;49(6):573 582. 865
Abstract: The objective of this study was to evaluate the use of corn crop residues as mulch and its impact on soil moisture content and the establishment, development and productivity of
866 https://doi.org/10.22319/rmcp.v13i4.5963Article
Effect of soil cover on the growth and productivity of buffel grass (Cenchrus ciliaris L.) in degraded soils of arid zones Ernesto Herssaín Pedroza Parga a Aurelio Pedroza Sandoval a* Miguel Agustín Velásquez Valle b Ignacio Sánchez-Cohen c RicardoTrejo Calzada a José Alfredo Samaniego Gaxiola d a Universidad Autónoma Chapingo. Unidad Regional Universitaria de Zonas Áridas. Bermejillo, Durango, México. Km. 40 Carr. Gómez Palacio Chihuahua. Bermejillo, 35230, Durango, México. b Instituto Nacional de Investigaciones Forestales Agrícolas y Pecuarias (INIFAP). Campo Experimental Saltillo. Departamento de Manejo Integrado de Cuencas. Saltillo, Coahuila, México. c INIFAP. Centro Nacional de Investigación Disciplinaria en Relaciones Agua Suelo Planta Atmósfera. Gómez Palacio, Durango, México. d INIFAP. Departamento de Fitopatología del Centro de Investigación Regional Norte Centro. Matamoros, Coahuila, México. * Corresponding author: apedroza@chapingo.uruza.edu.mx
Rev Mex Cienc Pecu 2022;13(4):866 878 867
buffel grass (Cenchrus ciliaris L). A randomized block design with three replications was used. The treatments were: sowing of 10 kg ha 1 of buffel grass seed (Bs); vegetation cover on soil with 10 t ha 1 of corn crop residues (Vc); Bs + Vc combination; and control (no grass sowing and no vegetation cover). The Bs + Vc treatment maintained a higher soil moisture content (P≤0.05), with 13.8 % vs 10.6 % of the control. Consequently, the number of grass plants m 2 , buffel grass cover, plant height, chlorophyll index and dry biomass production had a tendency to respond better, with values of 518.5 plants m 2, 51.23 %, 31.8 cm, 162 and 167.8 g m 2, respectively, and they exhibited a tendency toward a statistically similar response as to this treatment when applied separately (Vc and Bs). Photosynthesis (µmol s 2s 1),stomatalconductance,transpiration (mmol H2Om 2 s 1),andwateruseefficiencywere not affected by any of the treatments in this study, their response being equivalent to that of the control.
Key words: Plant stress, Soil moisture, Pasture, Extensive livestock farming.
Received: 16/03/2021
Accepted: 02/06/2022 Introduction Every year, the productive capacity of 10 million hectares of agricultural land is lost due to soil degradation caused by a series of natural and anthropogenic factors(1,2) . Water erosion is one of the main causes of soil degradation in arid areas, where rainfall is erratic and torrential, producing high volumes of water runoff in a short period with a strong erosive impact(3) Among the soil properties that determine water erosion are those related to infiltration and sediment stability, such as texture, organic matter content, and type of particle aggregates(4) The vegetation cover over the soil reduces particle shedding by intercepting raindrops and reducing their erosive energy. Vegetation and surface plant debris reduce the velocity of water flow over the soil and promote sediment settling(5). The impact is greater in these regions due to the lack of adequate vegetation cover, low organic matter content, and low soil moisture retention capacity, among other factors(6) In order to mitigate soil degradation, agronomic practices are carried out according to the type of agricultural production system and the specific conditions of each region(7,8)
Buffel grass (Cenchrus ciliaris L.) is an introduced species in Mexico that has shown adaptation to critical environmental conditions in semi arid zones, which to a large extent sustain their economy through extensive cattle raising on pastureland(13,14) . Even though this grass species has a high potential for adaptation and development in degraded soils of semi arid areas(9,15), the establishment of this forage species in marginal environmental conditions requires an adequate management of natural resources to guarantee its germination, growth and productivity according to its development potential(16,17). From this perspective, vegetative soil covers and other soil moisture retainers, among other practices, are proving to be an effective strategy in the sustainable development of pasture based livestock areas in degraded soils of arid zones(6,18,19)
In addition, overgrazing is one of the most recurrent problems that reduce the productivity of pasture areas with deficient precipitation(11) All this makes it necessary to strengthen the lines of research and generate strategies to improve the use and management of water, soil, plant and animal resources in livestock areas based on native grazing vegetation and the regularpresenceofpastureland, so as to greatersustainabilityfrom theproductive, economic, social and environmental points of view(12) .
Theconstruction of curbs on contourlines, theconstructionofmasonryto reducethevelocity of rainwater, on site rainwater harvesting systems based on micro watersheds, the replanting of native grasses with conventional tillage methods, the establishment of different species of native or introduced plants with forage potential, and the use of different types of soil moisture retainers(9) are some of the technologies applied to mitigate the problem of erosion.
Most of these techniques are aimed at retaining soil moisture in the face of high potential evaporation rates, which can be up to ten times higher than precipitation in semi arid areas.
Rev Mex Cienc Pecu 2022;13(4):866 878 868
One factor that improves physical soil conditions to increase and conserve moisture after rainfall is the use of soil cover(13) . If the use of vegetation cover is complemented with the replanting of native grasses of the region, there is a greater possibility of mitigating the degradation of pasture land.
Livestock production systems in semi arid zones are vulnerable due to recurrent droughts, the presence of soils with low vegetation cover, and low organic matter content, which generate a process of natural resource degradation that results in low productive potential(10)
The objective of this study was to evaluate the use of corn crop residues as soil cover, and its impact on soil moisture content and the establishment, development and productivity of buffel grass in degraded soils of arid zones in northern Mexico.
The study was carried out in an area with microphyllous and rosette scrub vegetation and small areas of grassland in the municipality of Mapimí in the north of the State of Durango, Mexico. The area is located at 25° 52' 23.65" N and 103° 43' 41.74" W and at an altitude of 1,176 m, with an average annual rainfall of 304 mm, a maximum temperature of 44 °C and a minimum of 10.2 °C(20)
According to physical chemical soil analysis, the experimental site presents a sandy loam soil with 56, 28, and 16 % sand, silt and clay respectively; a permanent wilting point (PWP) of 9.6 %, and a field capacity (FC) of 19.7 %. These soils are low in macro and microelements, although they have good levels of potassium (68.4 mg kg 1) and calcium (33.7 meq L 1), the latter making them alkaline soils with a pH of 8.3 and a slope of 1 % (Figure 1)(21)
Figure 1: Geographic location of the study area in the Municipality of Mapimí, State of Durango, Mexico
Description of the experimental site
Material and methods Geographic location
Rev Mex Cienc Pecu 2022;13(4):866 878 869

The soil moisture content (%) was quantified using a Soil TesterTM Model HB 2 digital tensiometer (Ontario, Canada); while plant variables such as the number of grass plants m 2 weremeasuredwith a20x20cm quadrant, countingthenumberofplants withinthequadrant; grass height (cm); grass cover (%) estimated in one m2 using a 20x20 cm quadrant and using ascaleof0to 100to estimatethe%of groundcoverbygrass perunit area. All thesevariables were measured at six different dates: 36, 52, 67, 87, 107, and 127 d after sowing (DAS), and three measurements were taken as sampling unit per treatment at each evaluation date. The physiological variables of the grass were: chlorophyll index, measured using a Spectrum Technologies Inc . Fieldscout CM 1000 chlorophyll meter; photosynthesis (µmol CO2 m 2 s 1); stomatal conductance; transpiration (mmol H2O m 2 s 1) these last three measurements were made with a model LI 6400XT infrared gas flow analyzer, (LI COR®, Inc. Lincoln, Nebraska, USA) ; water use efficiency, product of the quotient of the amount of CO2 assimilated and the amount of water transpired by the plant. These variables were measured only once at 107 DAS, for which three plants were taken per experimental unit. At the end
Experimental and treatment design
Rev Mex Cienc Pecu 2022;13(4):866 878 870
A randomized block experimental design was used with three replications and four treatments: sowing of 10 kg ha 1 with buffel grass seed (Bs); no sowing of grass and only application of 10 t ha 1 of corn stubble as mulch on the soil (Vc); the combination of the treatments Bs + Vc, plus the control (no sowing of grass or application of vegetative cover). Each experimental unit had a dimension of 5x5 m.
The study was carried out in the summer autumn of 2017, for which soil preparation of the experimental area was performed by using a rake to a depth of 5 cm. In the grass sowing treatments, the seeds were scattered, ensuring their even distribution on the ground, and then covered with a light layer of the same soil by a second pass of the rake, in order to prevent the seeds from being exposed to the wind and dragged by it. The treatments using dry corn stubble as soil cover were applied immediately after planting. The experiment was established on dry soil, and the treatments were exposed to the first rain, which occurred in July with a rainfall volume of 64.8 mm, whereby the grass seed was allowed to germinate.
Rainfall in the area of experimental influence during the study period was measured using a La Crosse TechnologyTM Heavy Weather Pro WS 2800 microclimatic station (USA).
Variables measured
Figure 2: Behavior of pluvial precipitation in the study area during the year 2017. Mapimí, Durango, Mexico
An analysis of variance and a Tukey multiple range test of means (P≤0.05) were performed using the SAS package (Version 9.0) to identify the effect of the treatment.
Data analysis
Rev Mex Cienc Pecu 2022;13(4):866 878 871 of the experiment (127 DAS), the dry biomass produced from the grass (g m 2) was obtained by cutting and drying the whole plant, except the root, at constant weight.
Results and discussion
According to precipitation records in the study area, the precipitation in year 2017 was 277.4 mm, slightly lower than the annual average, which 304 mm. The July-September period had the highest rainfall, with a total of 165.5 mm, representing 59.6 % of the total for the year (Figure 2). Buffel grass thrived adequately under these rainfall conditions, since the optimal range of summer rainfall reported a growth of 150 to 550 mm(22), which coincides with that recorded at thestudysite. Martin et al(23) reportedthat, foraperiodof3 yr,the growth activity of this species was observed 15 d after a rainfall of 20 mm or more, a condition that occurred in the months of July and September in the present study. In arid grasslands of southern New Mexico, it was found that rainfall of < 20 mm in one day does not contribute to adequately wet the topsoil by 0.1 m(24) .

As a result of this water availability condition in the Bs + Vc treatment, the number of grass plants m 2, grass cover, chlorophyll index, and grass plant height were significantly higher than in the Bs + Vc treatment (P≤0.05), with values of 518.5 plants m 2, 51.23 %, 162 and 31.8 cm, respectively; the control registered the lowest values for these variables, with no statistical difference between the control and the Bs treatment. There was no consistent response to the Bs and Vc treatments when applied separately, since they fluctuated between statistically similar values to those of the Bs + Vc treatment and the control (Table 1).
The above results are consistent with those reported by Cruz Martínez et al(9), who found that buffel grass improved growth, chlorophyll content, and grass cover in the soil when hydrogel was applied at different doses as soil moisture retainers. Alcalá(25), indicates that the development of buffel grass depends largely on the amount of water retained in the soil. On the other hand, soil moisture conservation practices in pasture sites have been reported to increase water infiltration and, therefore, plant productivity(26). In contrast, physical soil
The average soil moisture content was significantly higher (P≤0.05) in the treatment with buffel grass sowing + soil cover of corn crop residues (Bs + Vc) than that of the control, exhibiting values of 13.8 vs 10.6 %, respectively; the former (Bs + Vc) showed no statistical difference with respect to the other two treatments (Bs and Vc) applied separately (Table 1).
* No grass sowing or soil cover was applied, only natural born grass. Bs= Sowing of 10 Kg ha 1 of Buffel grass seeds without the application of corn crop residues on the soil. Vc= Application of 10 t ha 1 of corn crop residues on the soil as soil cover Bs + Vc= Combination of the last two treatments mentioned above. ab Figures with the same letters within the same column are statistically equal (P≤0.05).
Soil moisture content, grass growth and development
Rev Mex Cienc Pecu 2022;13(4):866 878 872
Table 1: Effect on soil growth and development of buffel grass (Cenchrus ciliaris L) with and without the use of a vegetative soil cover consisting of corn crop residues
Treatments (%)moistureSoil Number of plants m 2 Grass cover (%) Plant height (cm) Control* 10.6b 172.8b 12.65c 17.1bc Bs 12.2a 358.0ab 7.11c 6.5c Vc 13.0ab 481.5ab 25.68b 22.3ab Bs + Vc 13.8a 518.5a 51.23a 31.8a
Stomatic conductance, transpiration, and water use efficiency were not affected by the treatments applied in this study (Table 2).
With the treatment that combined the sowing of 10 kg ha 1 of pasture and the application of 10 t ha 1 of corn crop residues as soil cover (Bs + Vc), the chlorophyll content and biomass production were significantly higher (P≤0.05) than with the rest of the treatments with values of 162.0 and 167.8 g m 2, respectively , compared to the control, which registered values of 18.9 µmol m 2s 1, 105.7 and 54.4 g m 2. This represents an increase of 12.1, 53.2 and 208.4 % between these variables, respectively, which suggests that the sowing of grass needs to be complemented with the incorporation of a soil cover (in this study, corn crop residues) or some other type of soil moisture retainer, as reported by various authors(12,17,28)
Physiological indicators and grass biomass productivity
The Bs + Vc treatment stood out for its higher chlorophyll index with respect to the control, which would be reflected in an adequate photosynthetic activity(28). Pezeshki(29) and Carter and Knap(30) identified that a degradation of chlorophyll by any stress factor has repercussions in the reduction of the photosynthetic capacity of the leaves, as it limits the photochemical process in the absorption of radiation.
Rev Mex Cienc Pecu 2022;13(4):866 878 873 degradation negatively affects the growth and yield of agricultural crops, as a consequence of limited root depth, low soil moisture reserves, and low availability of nutrient content, which negatively affects soil organic carbon, nitrogen, phosphorus and potassium contents, and soil pH(27) .
Rev Mex Cienc Pecu 2022;13(4):866 878 874
Table 2: Physiological indicators and biomass productivity of buffel grass (Cenchrus ciliaris L) in different grass seeding treatments and use of corn crop residues as soil cover Treatm. (µmolPhotosynthesism 2s 1) conductanceStomatic (mmolTranspirationH 2O2 m 2s 1) WUE indexChlorophyll (gmatterDrym 2)
Control* 18.9ab 0.156ª 2.75a 6.9a 105.7b 54.4c Bs 14.1b 0.111a 2.16a 7.1a 75.1c 53.3c Vc 20.1ab 0.176a 2.95a 7.0a 146.4a 102.7b Bs + Vc 21.2a 0.138a 2.53a 8.4a 162.0a 167.8a Treatm.= Treatments. WUE= water use efficiency. * No grass sowing or soil cover application: only natural born grass. Bs= Sowing of 10 Kg ha 1 of buffel grass seeds; no application of corn crop residues to the soil. Vc= application of 10 t ha 1 of corn crop residues as soil cover. Bs + Vc= combination of the last two treatments mentioned above. abc Figures with the same letters in the same column are equal (P≤0.05).
In a projection of dry biomass production measured in g m 2, the best treatment (Bs + Vc) yielded 1.6 t ha 1, while the control produced 0.54 t ha 1, 208.4 % more of the former with respect to the latter, and an overall average of 0.89 t ha 1 among all the treatments. Therefore, in terms of productivity, this technology also opens up a prospect, given the low bioproductivity of these areas.
The results in Tables 1 and 2 show that lower soil moisture corresponded to a significant (P≤0.05) decrease in photosynthetic activity, at least in the Bs + Vc treatment, with respect to the control. This is consistent with the findings of Tezara et al(31), who report that the presence of moisture in the soil favors plant photosynthesis, while water deficit decreases it. The positive result of the chlorophyll index as a function of higher soil moisture content is contrary to that reported by Meléndez et al(32) and Trujillo et al(33), who observed that the chlorophyll content increases in soils with low moisture gradients and decreases in soils with high soil moisture gradients. In contrast, in a study on Opuntia ficus indica, Aguilar and Peña(34) reported that the chlorophyll concentration decreased significantly in plants under drought, consistently with the findings of this study. The above contrasting results regarding the response to water stress in terms of chlorophyll content may be related to the genetic nature of the plant materials used, such as cactus, and to the ecological conditions in which the different studies were conducted(35) . Additionally, Cabrera(36) points out that the physiological activity, such as photosynthesis, conductance, and transpiration of buffel grass, depends on the fluctuations of the weather conditions of each year.
Literature cited: 1. David P, Burgess M. Soil erosion threatens. Food production. Agriculture 2013;3(3):443 463.
Conclusions and implications
2. Encinas RA, Ibarra J. La degradación del suelo y sus efectos sobre la población. Población y Desarrollo 2003:5 9.
4. Diaz GM. Alternativas para el control de la erosión mediante el uso de coberturas convencionales, no convencionales y revegetalización. Ingeniería e Investigación 2011;31(3):80 90.
Rev Mex Cienc Pecu 2022;13(4):866 878 875
5. Distrito deConservación deRecursosdel Condado deMonterrey. Guíade prácticas para el manejo de erosión y escorrentía agrícola en laderas. 2016: https://www.rcdmonterey.org/pdf/rcdmc_hillslope_guide_en_espanol 10 5 16 final.pdf.
The use of soil cover with corn crop residues in combination with the sowing of buffel grass (Cenchrus ciliaris L.) was the treatment with the best effect on the soil moisture content, which favored the growth and development of the grass plant, with a better number of plants per unit area, a higher plant cover, a higher chlorophyll index, and a higher dry matter production. However, these same treatments applied separately showed inconsistent behavior, with a response similar to that of the combination of both practices, but differentiated from the response of the control. Grass plant physiology in terms of photosynthesis, stomatal conductance, transpiration, and water use efficiency showed no effect of the soil cover practices tested in this study.
6. Pedroza Sandoval A, Trejo Calzada R, Sánchez Cohen I, Yáñez Chávez JA, Cruz Martínez A, Figueroa Viramontes U. Water harvesting and soil water retention for forage production in degraded areas in arid lands of Mexico. In: New perspectives in forage crops. Loiola ER, Leilson RB editors. USA : Editorial Intechopen; 2018:3 23.
3. Bolaños GMA, Paz PF, Cruz G, Carlos O, Argumedo EJA, Romero B, et al. Mapa de erosión de los suelos de México y posibles implicaciones en el almacenamiento de carbono orgánico del suelo. Terra Latinoamericana 2016;34(3):271 288.
12. Roco FL, Engler PA, Jara Rojas R. Factores que influyen en la adopción de tecnologías de conservación de suelos en el secano interior de Chile Central. Rev FCA UNCUYO 2012;44(2):31 45.
14. Brorens BAHV, VanEs HM, Verheyden SML, Schindelbeck RR. Soil hydraulic properties as affected by tillage. Final report. Master degree. Department of Soil, Crop and Atmospheric Sciences. Ithaca, NY: Cornell University; 1991.
16. Velásquez VMA, Muñoz VJA, Macías RH, Esquivel AG, Rivera GM. Producción de forraje de variedades de zacate buffel [Pennisetum ciliare L. (Link.) Sin. Cenchrus ciliaris L.] en la región árida del Estado de Durango, México. Rev AGROFAZ 2014;14(1):69 76.
9. Cruz MartínezA,Pedroza Sandoval A,Trejo CalzadaR,Sánchez Cohen I,Samaniego Gaxiola JA, Hernández Salgado R. Captación de agua de lluvia y retención de humedad edáfica en el establecimiento de buffel (Cenchrus ciliaris). Rev Mex Cienc Pecu 2016;7(2):159 172. 10. Kéfi S, Rietkerk M, Alados CL, Pueyo Y, Papanastasis VP, Elaich A, de Ruiter PC Spatial vegetation patterns and imminent desertification in Mediterranean arid ecosystems. Nature 2007;449(7159):213-227.
13. Sharma BA, Lewi, SD, Gaston A, Darapuneni M, Wang JJ, Sepat S, Bohara H. Winter cover crops effect on soil moisture and soybean growth and yield under different tillage systems. Soil Tillage Res 2019;195.
15. Saucedo TRA. Guía técnica para el establecimiento y utilización de plantaciones de chamizo. Centro de Investigación Regional Norte Centro del INIFAP. Campo Experimental de Zacatecas. Folleto Técnico Núm. 10;2003.
8. Sánchez Cohen I, Díaz Padilla G, Velásquez Valle M, Slack DC, Heilman P, Pedroza Sandoval A. A decision support system for rainfed agricultural areas of Mexico. Computers Electronics Agric 20151;14:178 188.
11. Velásquez VMA, De Alba AA, Gutiérrez LR, García EG. Prácticas de restauración de suelos para la conservación del agua. Centro Investigación Regional Norte Centro del INIFAP. Campo Experimental de Zacatecas. Folleto Técnico. Núm. 46; 2012.
7. Pedroza Sandoval A, Chávez Rivero JA, Trejo Calzada R, Sánchez Cohen I, Ruiz Torres J. Captación y aprovechamiento integral del agua de lluvia y manejo de aguas residuales en zonas áridas. En: Tópicos selectos de sustentabilidad: Un reto permanente Volumen IV. Moreno RA, Reyes CJL, editores. México, DF: Editorial CLAVE. 2016:69 90.
Rev Mex Cienc Pecu 2022;13(4):866 878 876
22. CoxJR,MartinRMH,IbarraFFA,FourieJH,RethmanNFG,WilcoxDG. Theinfluence of climate and soils on the distribution of four African grasses. J Range Management 1988;41(2):127 139.
Rev Mex Cienc Pecu 2022;13(4):866 878 877
18. Yáñez Chávez LG, Pedroza Sandoval A, Martínez Salvador M, Sánchez Cohen I, Echavarría Cháirez FG Vásquez Valle MA, López Santos A. Uso de retenedores de humedad edáfica en la sobrevivencia y crecimiento de dos especies de pastos Bouteloua curtipendula [Michx.] Torr. y Chloris gayana Kunth. Rev Mex Cienc Pecu 2018;9(4):702 718. 19. Huerta Olague JJ, Oropeza MJL, Guevara GRD, Ríos BJD, Martínez MMR, Barreto GOA, et al. Efecto de la cobertura vegetal de cuatro cultivos sobre la erosión del suelo. Idesia (Arica) 2018;36:153 162.
26. Beltrán LS, Loredo OC, Núñez T, González ELA. Buffel titán y buffel regio nuevas variedades de pasto para el altiplano de San Luis Potosí. Folleto técnico N° 35. Instituto Nacional de Investigaciones Forestales Agrícolas y Pecuarias. 2008.
27. Lal R, Singh BR. Effects of soil degradation on crop productivity in East Africa. J Sust Agr 2008;13(1):15-36.
23. Martin RM, Cox JR, Ibarra FF. Climatic effects on buffelgrass productivity in the Sonoran Desert. J Range Management 1995;48(1):60 63. 24. Herbel CH, Gibbens RP. Matric potential of clay loam soils on arid rangelands in southern New Mexico. J Range Management 1989;42(5):386 392.
17. Yáñez Chávez LG, Pedroza Sandoval A, Sánchez Cohen I, Velásquez Valle MA, Trejo Calzada R. Management practices and bioproductivity in grassland of dry areas. In: Grasses as food and feed. Publisher: Intech Open (Edited by Zerihun Tadele). London, SE19SG United Kindom 2018;49 65.
20. Medina GG, Díaz PG, López HJ, Ruíz CJA, Marín SM. Estadísticas climatológicas básicas del estado de Durango. (Periodo 1961 2003). Libro Técnico № 1. Campo Experimental Valle del Guadiana. CIRNOC-INIFAP; 2005. 21. García I, Martínez JJG. Caracterización de la Reserva de la Biosfera Mapimí Mediante el uso de sistemas de información geográfica. En: Memorias del IV Simposio Internacional sobre la Flora Silvestre en Zonas Áridas. Universidad Autónoma de Chihuahua Universidad de Sonora; 2004:369 377.
25. Alcalá GC. Guía práctica para el establecimiento, manejo y utilización del zacate buffel. Patronato del Centro de Investigaciones Pecuarias del Estado de Sonora, AC. 1995.
33. Trujillo ME, Méndez JR, Hossne AJ, Parra FJ. Efecto de la humedad y compactación de un Ultisol de la sabana del estado Monagas sobre la concentración de clorofila y carotenoides,lavadodeelectrolitos ycontenidorelativodeagua enplantas desoya.Acta Universitaria 2010;20(3):18 30. 34. Aguilar BG, Peña VCB. Alteraciones fisiológicas provocadas por sequía en nopal (Opuntia ficus indica). Rev Fitotec Mex 2006;29(3):231-127.
30. Carter GA, Knapp AK. Leaf optical properties in higher plants: linking spectral characteristics to stress and chlorophyll concentration. Am J Botany 2001;88(4):677 684. 31. Tezara WM, Driscoll SD, Lawlor DW. Water stress inhibits plant photosynthesis by decreasing coupling factor and ATP. Nature 1999;1401:914 917. 32. Meléndez L, Hernández A, Fernández S. Efecto de la fertilización foliar y edáfica sobre el crecimiento de plantas de maíz sometidas a exceso de humedad en el suelo. Bioagro 2006;18(2):107 114.
Rev Mex Cienc Pecu 2022;13(4):866 878 878
28. Pedroza Sandoval A, Yáñez Chávez LG, Sánchez Cohen I, Samaniego Gaxiola JA, Trejo Calzada R. Hydrogel, biocompost and its effect on photosynthetic activity and production of forage maize (Zea mays L.) plants. Acta Agronómica 2017;66(1):63 68. 29. Pezeshki SR. Wetland plant responses to soil flooding. Environ Exper Botany 2001;46:299 312.
35. Bacarrillo López R, Pedroza Sandoval A, Inzunza Ibarra MA, Flores Hernández A, Macías Rodríguez FJ. Productividad de forraje de variedades de nopal (Opuntia spp.) bajo diferentes regímenes de humedad del suelo. Ecosist Recur Agropecu 2021;8(3): e2878. 36. Cabrera HM. Respuestas ecofisiológicas de plantas en ecosistemas de zonas con clima mediterráneo y ambientes de alta montaña. Rev Chilena Historia Natural 2002;75:625 637.
Abstract: Mexico is a honey producing country, paradoxically, its per capita consumption is low compared to European countries. The objective was to make a typology of honey consumers in Mexico with aminimum educational level of bachelor’s degree in ages from 20 to 60 years and to determine their socioeconomic characteristics and aspects that motivate consumption. A questionnaire was applied to a sample of 1,003 honey consumers who met the conditions of age and school level. The information was analyzed using cluster and discriminant analysis. Three types of consumers were identified: 1) educated consumers with average income (34.4 %), theywere those who consume honeyfrequently, have extensive knowledge about beekeeping by products and honey properties, prefer to buy the product from
879 https://doi.org/10.22319/rmcp.v13i4.6005Article
Typology of honey consumers with a university education in Mexico Fidel Ávila Ramos a Lizeth Paula Boyso Mancera a Mercedes Borja Bravo b* Venancio Cuevas Reyes c Blanca Isabel Sánchez Toledano d aUniversidaddeGuanajuato.DepartamentodeVeterinaria yZootecnia.Guanajuato,México. b Instituto Nacional de Investigaciones Forestales, Agrícolas y Pecuarias (INIFAP). Campo Experimental Pabellón, Km. 32.5 carretera Aguascalientes Zacatecas, Pabellón de Arteaga, Aguascalientes, México. c INIFAP. Campo Experimental Valle de México. Estado de México, México. d INIFAP. Campo Experimental Zacatecas. Zacatecas, México. *Corresponding author: borja.mercedes@inifap.gob.mx
beekeepers; 2) highly educated consumers with high income (25.8 %), most of them have postgraduate degrees and receive income greater than $5,000 per week, they were people of mature age and with moderate consumption of honey, a third of this group onlyknow honey, have knowledge of its properties and qualities, they are indifferent to the place of purchase; and 3) educated consumers with low income (39.8%), it grouped youngconsumers who only have a bachelor’s degree, their consumption is moderate, they prefer to buy the product in markets. The groups of consumers formed provide information on a segment of the honey market in Mexico, it is necessary to continue conducting research on issues related to consumption and preference of honey consumers in Mexico
Honeyis the main product obtained from beekeeping; it is defined as a sweet substance made by bees from the nectar of flowers, which they collect, combine with specific substances, transform and store to serve as energy food(1). In 2019, Mexico produced 61.9 thousand tonnes of honeyand during 2010-2019, the average annual growth rate was 1.2 %(2). In 2019, 43.4 % of production went to Germany and the United States, and Mexico ranked among the first exporting countries(3) .
Key words: Honey consumption, Socioeconomic characteristics, Clusters. Received: 11/06/2021
Rev Mex Cienc Pecu 2022;13(4):879 893 880
Introduction
Currently, there is a tendency in consumers to purchase food products with general (taste, price, safety, organic and certified) and subjective attributes related to environmental, social and ethical issues; in addition, they should promote health, well being and reduce the risk of developing diseases(4,5) .
Accepted: 07/03/2022
Honey is a product appreciated for its properties and health benefits, as a sweetener and natural remedy; it contains carbohydrates, water, proteins, vitamins, minerals and phenolic compounds. Consequently, its intake is associated with a better antioxidant capacity, modulation of the immune system, antimicrobial activities, influence on lipid values, regulation of glycemic responses, among others(5). This has contributed to the growing trend in world consumption, which, during 2008 to 2018, increased 5.3 % and in 2018, consumption was 2.55 million tonnes(6)
The type of research was exploratory, and the information was obtained through a structured survey. The sampling was directed to the Mexican honey consuming population with
Rev Mex Cienc Pecu 2022;13(4):879 893 881
Although the country is one of the main world producers, the Mexican population does not show a culture of honey consumption and it is reflected in the per capita consumption of 170 g, well below some European countries, which exceed 1,000 g per person per year(6)
There are studies that have determined the factors that influence honey consumption, among themsociodemographicfactorssuchas age,occupationandeducation(7,8,9).Otherinfluencing factors were color, taste, variety and price(9,10). In another study, it was mentioned that consumption is influenced by the income level of households and the purchase decision is determinedbyconsumers’knowledgeofthevalue ofhoney(11).Attributes such as therapeutic properties have become important in the purchase decision and the product is valued as traditional, healthy and for its use in alternative medicine(5,12) . Studies conducted in Croatia, Romania, Italy, Serbia and Brazil(13 16) indicate that the educational level of the honey consumer is relevant and influences the purchase decision, because the person may have greater knowledge about the qualities of the product. This aspect should be considered for Mexico, where the studies conducted deal with the production chain, commercialization(17,18) and consumer preferences at the regional level(19) .
However, information on the identification of consumer profiles and types for market segments is limited, even though this type of information contributes to the understanding of how consumption decisions are made, reveals information for agri food chains and provides elements to producers and industrialists for value addition(16,20). Knowing the types of consumers supports the design of market strategies that position the product in the market and motivate its consumption. Therefore, the objective of this work was to make a typology of honey consumers in Mexico with a minimum educational level of bachelor’s degree in ages from 20 to 60 years and to determine their socioeconomic characteristics and aspects that motivate consumption. Material and methods Sample size
In contrast, in Mexico honey consumption has decreased; during 2017 2019, an apparent national consumption of 22.3 thousand tonnes was recorded(2,3). From 2010, the trend in consumption was downward, with an average annual growth rate of 2.8 %, until 2019.
The typology of honey consumers was made using multivariate techniques, first a hierarchical cluster (CA) and K mean analysis was applied. The hierarchical CA was based on Ward’s grouping method and was used to identify the number of groups graphically and by means of Mojena’s criterion (��̃+������); where �� ̃ is the mean of the Euclidean distances, sα is the standard deviation of the distances and k is a constant(25). Subsequently, the analysis was complemented with that of K means for a better identification of the groups.
Rev Mex Cienc Pecu 2022;13(4):879 893 882
university education, between 20 and 60 years of age. The sample size was obtained using the simple random sampling formula for finite populations(21,22): �� = ��2������ (�� 1)��2 ��2����
The information was collected through a questionnaire of 15 questions on age, gender, schooling, size of the city where they lived, weekly income, monthly consumption of honey, habits in the consumption of honey, place of purchase, consumer knowledge of properties and uses and by products of honey. The questions were closed with dichotomous, multiple and scale answers(24) .
The design of the survey was made on the Google Apps server through Drive®, where the name of the surveywas first established and each of the questions raised with their respective answers was described. Subsequently, the link thatindicates the abbreviation of the URLwas generated. Prior to the application, pilot tests were conducted to ensure the clarity of the questions and minimize errors (n= 10). Once validated, the survey was applied via the internet, sharing the link in social networks. With the information obtained, a database was created in Excel 2016 spreadsheets. Statistical analysis
Where n was the sample size; N represents the population, equal to 57.34 million inhabitants, population between 20 and 60 years of age according to the Census of Population and Housing (INEGI)(23); Z was the 90 % confidence level; e was the error of 4.1 %; P was the 50 % probability that the sample is representative, and q was the probability that the sample is not representative (q=1 p). The estimated sample size was 990 surveys, but in practice 1,003 were conducted. Instrument used and sources of information
The hierarchical CA allowed identifying graphically three types of honey consumers (Figure 1), likewise this result was corroborated by estimating Mojena’s Criterion, where ��= 2.68, ��= 1.25 and ����=0.54, which resulted in 3.35. The number of clusters identified in the hierarchical CA was used for the CA of K-means.
Results Statistical results
Rev Mex Cienc Pecu 2022;13(4):879 893 883
The groups of honey consumers formed were analyzed by a discriminant analysis to verify the goodness of the classification. With the analysis, it was determined that 97.5 % of the respondents were classified correctly and, therefore, the classification in three clusters was
To verify and validate the results obtained in the CA of K means, the classification and assignment ofeach individualto thegroupformed was evaluatedwith adiscriminant analysis (DA)(22,26); where the independent variables that most discriminated against the groups were determined and it was verified that the conformation of groups of the CA was robust. In the DA, the stepwise variable selection method was used. To select the variables, the Wilk’s statistic Lambda was used, which, for its interpretation, considers that, if its value is close to zero, the total variability will be due to the differences between groups and, therefore, the corresponding set of variables will discriminate against the groups. If its value is close to 1, the groups will be mixed and the set of independent variables will not be suitable for constructing the discriminant functions(27,28). The statistical analysis of the data was performed with the SPSS 27.0 software for Windows(29) and Minitab 18.1.
Figure 1: Dendrogram of honey consumers with university education in Mexico

According to the values obtained, Wilk’s Lamda and the F statistic, six of the nine variables (weekly income, age, monthly consumption, motivation to consume, by products and place of purchase) contributed to the discrimination of groups by their level of P>0.05 and F value greaterthan3.8. Thevariablesthatdid not contributeto theseparationof groups were gender, form of consumption and size of the city (Table 2).
Wilk’s Lambda 0.115 255.14 12 1990 <0.000
Rev Mex Cienc Pecu 2022;13(4):879 893 884 valid. Similarly, the Wilk’s statistic Lamda of 0.115, a value close to zero, means that the groups formed were statistically different (Table 1).
Characterization of the types of honey consumers
Once the types of consumers were defined, they were characterized based on the variables included in the analysis (Tables 3 and 4) and the particularities of each one were determined. The name assigned to each group was considering the educational level and weekly income.
Table 1: Multivariate statistics Statistic Value valuedistributionFisher Degrees of freedom of numeratorthe Degrees of freedom of dethenominator calculatedthangreaterProbabilityF
Table 2: Mean test between the differentiated groups Variable Wilk’s Lambda F Significance Gender 0.994 3.242 0.059 Age 0.695 219.515 0.000 Weekly income 0.321 1058.353 0.000 Size of the city 0.999 0.610 0.543 Monthly consumption 0.716 198.139 0.000 Form of consumption 0.991 4.471 0.062 Place of purchase 0.908 50.893 0.000 By products 0.920 43.663 0.000 Motivation to consume 0.791 132.168 0.000
Group 1: Educated consumers with average income
Table 3: Socioeconomic and demographic characteristics of the types of honey consumers (%) Variables Group 1 (n=345) Group 2 (n=259) Group 3 (n=399)
This group consisted of 345 consumers (34.4 %), of which 64.6 % were women and the rest were men. Most of the people in this group were women aged 26 to 40 and adults aged 41 to 60, and just over half have postgraduate studies. With respect to income, the population was concentrated in the middle categories (more than $3,000 per week) and they live in large cities (Table 3). It was identified that they were the most frequent consumers of honey for sweetenerorhomeremedy. Theyacquirehoneydirectlyfromthebeekeeper, theyknowmore about the derivatives of the hive and their reasons for purchase are related to the natural properties of honey (Table 4).
MenGender 35.4 40.2 30.6 Women 64.6 59.8 69.4 FromAge 20 to 25 yr old 4.9 6.6 56.4 From 26 to 40 yr old 47.8 59.1 33.8 From 41 to 60 yr old 47.2 34.4 9.8 Schooling Bachelor’s degree 46.4 37.8 81.2 Postgraduate degree 53.6 62.2 18.8 Weekly income Less than 1,500 3.2 0.0 54.9 From 1,500 to 3,000 26.1 0.0 44.6 From 3,000 to 5,000 32.2 31.7 0.5 More than 5,000 38.6 68.3 0.0 Size of the city More than 100,000 59.4 59.1 55.4 From 30,000 to100,000 20.3 20.1 22.3 From 10,000 to 30,000 9.6 10.4 10.0 Less than 10,000 10.7 10.4 12.3
Rev Mex Cienc Pecu 2022;13(4):879 893
885
Group 2: Highly educated consumers with high income
Sugar substitute 71.0 65.6 61.7 Home remedy 25.5 32.0 32.1 In cosmetics 3.5 2.3 6.2 Where do you buy it? Market 20.0 44.4 52.6 Self service store 12.2 23.6 8.3 Beekeeper 67.8 32.0 39.1 By products of beekeeping you know Honey 8.1 31.3 26.6
Why do you consume honey?
The second group was made up of 259 consumers, 25.8 % of the respondents. This group is composed mostly of mature consumers between 26 and 40 yr of age, located in large cities. This group was characterized by having the highest school degree and high income (Table 3). They showed a low consumption of honey, and they are indifferent to where to buy it, the motivation they have to acquire it is associated with the idea of consuming a natural and healthy product, but they also do it because it is a family custom.
Table 4: Characteristics in honey consumption by type of consumer (%) Group 1 (n=345) Group 2 (n=259) Group 3 (n=399) Monthly consumption 10 g 0.9 31.7 27.6 50 g 11.9 32.0 33.8 100 g 39.1 29.7 27.3 500 g 48.1 6.6 11.3
Because of its properties 63.8 14.7 23.6
How do you consume honey?
Honey, pollen, royal jelly 23.5 29.3 30.3 Honey, pollen, royal jelly, apitoxin 68.4 39.4 43.1
Rev Mex Cienc Pecu 2022;13(4):879 893 886
It is a natural product 25.8 32.4 34.6
It is a healthy product 9.9 35.5 24.3 Because of family custom 0.6 17.4 17.5
sociodemographic
Group three consisted of 399 consumers, which corresponded to 39.8 % of the sample. The memberswere youngpeoplewithabachelor’sdegreeandweeklyincomeoflessthan$3,000. They showed a low consumption of honey and they used it as a sugar substitute. This type of consumers had a preference to buythe product in markets and directly from beekeepers, they have knowledge of the products derived from the hive and their purchase motivations are determined by the fact that it is a natural, healthy product with properties, and by family custom.
Rev Mex Cienc Pecu 2022;13(4):879 893 887
Group 3: Educated consumers with lower incomes
Discussion
On the other hand, a greater trend of honey consumption in women has been identified in other parts of the world(9) and that this consumption tends to increase when it comes to health care, both in prevention and treatment of diseases(34,35,36). In this regard, it was found that most of the interviewed population were also women, and they consume honey.
The results obtained in the characterization were similar to those found in a comparative analysis on honey consumption in Romania, Italy and Serbia, where it was mentioned that the educational level and the amount of income participate in the behavior of honey consumers in those countries(13). In several studies on honey, it is mentioned that the factors that positively influence consumption were the age, gender, educational level and income of people(30,31). This same condition was reflected in this analysis,wherethemain variablethatsegmentedthepopulationstudiedbytypeofconsumers was income. In other European countries, honey is considered an expensive product compared to other sweeteners, so its acquisition is conditioned to the income of the consumer(5,9,14), this explanation describes the condition of Mexican consumers.
Asecondvariablethatinfluencedthedifferentiationofthegroupswasage; althoughasample in ages between 20 and 60 years was considered, the difference between the groups by age ranges was noticeable; in the first group, no predominant range was observed; however, group 2 was made up of mature people and group 3 was made up of the youngest. It is assumed that older generations consume honey more frequently than younger consumers(30,32,33); these characteristics of consumption coincided with the Mexican consumers interviewed, since the adult population of group 1 were the ones who consume the most and the young people of group 3 were the ones who consume the least.
Rev Mex Cienc Pecu 2022;13(4):879 893 888 In addition to the above, the consumption of honey of groups 1 and 3 is directly related to the age, educational level, gender and income of consumers. However, consumers in group 2 do not meet these conditions, as they are highly educated people, with high income, of middle aged and low consumption. This behavior can be due to several factors, for example, in Slovakia and Romania(34), family size and frequency of honey consumption during childhood are determinants in the consumer profile. With regard to the motivation to consume honey, it was observed that, in the three groups, the properties of the product and its natural origin are appreciated and they conceive it as a healthyproduct, theseresults weresimilarto thosereportedin studies carriedout in European countries(5,9), where they mention that the perception that consumers have about honey is usually more important in the purchase decision than the price it can have in the market. The perceptionofhoneyhasdevelopedinrecent yearsandwastheproductofagreaterknowledge of consumers about its properties and contributions to human health, so it is now recognized as a natural sweetener, healthy food and there is information on the numerous therapeutic properties it has(5). In addition to the above, it is assumed that the educational level of the sample influenced the perception of the consumers surveyed, since, as Lucchese and Gerber(16) mentioned, at a higher school level, the discourse of the benefits of honey is oriented to the nutritional aspect, associated with the advantages of consuming vitamins, nutrients and medicinal qualities that contribute to having good health and better quality of Alife.differencethat was distinguishedbetween groups was consumptiondueto familytradition, mainly in groups 2 and 3. In a study conducted on young Poles(37), it was mentioned that this type of population consumes honeydue to family tradition and the eating habits learned from their families; this same situation occurs with young Mexican consumers, who preserve their eating habits until their adulthood. The most frequent consumers, who were those of Group 1, showed greater knowledge of the by products of the hive and they buy honey directly from beekeepers, this result coincided with the behavior of consumers in Croatia, where 75 % of them buy honey directly from producers(15). However, the place of purchase of honeyprovides important information about the consumer and the commercialization of the product. Acquiring it directly from the beekeeper indicates that consumers link foods to a concept of natural goods or services produced by companies in rural areas, with an established socioeconomic identity that they tend to prefer(38). On the other hand, the predominance of beekeepers as the main points of saleis confirmed, whomaintain animportant market sharein frequent consumers, in addition to pointing out that honey is marketed without a brand and label, which are extrinsic aspects of quality and are not very relevant for consumers. In this regard, Arvanitoyannis and Kristallis(14) pointed out that these consumers are traditional and they acquire quality through criteria based on experience and a personal relationship between consumer and beekeeper.
Rev Mex Cienc Pecu 2022;13(4):879 893 889
The typology obtained showed the differences that exist between honey consumers with university education in an age range of 20 60 yr in Mexico. This type of consumers is grouped into three groups, the first consists of educated consumers with an average income and they differed from others because they consume honey frequently, have extensive knowledgeoftheby productsofbeekeepingandproperties,prefertobuytheproductdirectly from beekeepers. A second group is the one made up of highly educated consumers, having mostly postgraduate degrees and receiving high incomes, these are people of mature age and with a moderate consumption of honey, even when they have knowledge of the properties and qualities of the product. A third of this group only know honey and no other by product and they are indifferent to the place of purchase. Group 3, which consists of educated consumers with low incomes, groups young consumers who only have a bachelor’s degree, their consumption is moderate, and they prefer to buythe product in markets. Those in group
Conclusions and implications
The classification made in this study considered only one segment of the honey market, represented by consumers with university education between 20 and 60 yr of age. These particularities of the study were considered relevant because, in the case of Mexico, there are no studies focused on specific market segments, in addition to the fact that, when conducting the survey on line, the level of participation of this segment of the population has been observedtobehigher,asindicatedbystudiescarriedoutinRomania(14) andCroatia(15),which highlight the greater participation of consumers with a high educational level in the answering of online surveys. Although numerous studies on profiles and types of honey consumers have been conducted in other countries(13,15,30), in Mexico this has been a little explored topic. The importance of this type of studies is highlighted by the way in which it allows producers to target their product and promote a better commercialization of it. One of the limitations of this study was that variables about tastes and preferences, consumer perception of quality, types of honey and extrinsic characteristics that are appreciated in other countries were not included(39). The results obtained represent a first approach to the types of honey consumers for the case of Mexico. Likewise, it is important to conduct this type of analysis for other market segments that allows identifying opportunities for the increase in national honey consumption.
On the other hand, group 3 showed a greater tendency to buy honey in markets and in a smaller percentage from beekeepers; whereas, for Group 2, a preferred place to make the purchase was not observed, which denotes that this type of consumer does not base its decision criteria on this aspect.
6. FAO. Organización de las Naciones Unidas para la Alimentación y la Agricultura. FAOSTAT: datos. http://www.fao.org/faostat/es/#home. Consultado 15 Nov, 2020.
2. SIAP. Servicio de Información Agroalimentaria y Pesquera. Cierre de la producción pecuaria (1980 2019). https://nube.siap.gob.mx/cierre_pecuario/. Consultado 10 Nov, 2020.
7. Pocol CB, Bolboacă SD. Perceptions and trends related to the consumption of honey: A case study of North-West Romania. Int J Consum Stud 2013;37(6):642-649.
8. Gyau A, Akalakou C, Degrande A, Biloso A. Determinants of consumer preferences for honey in the democratic republic of Congo. J Food Prod Mark 2014;20(5):476 490.
3. SE. Secretaría de Economía. Sistema de Información Arancelaria Vía Internet. http://www.economia snci.gob.mx/. Consultado 12 Nov, 2020.
4. Annunziata A, Scarpato D. Factors affecting consumer attitudes towards food products with sustainable attributes. Agric Econ 2014;60(8):353 363.
5. Testa R, Asciuto A, Schifani G, Schimmenti E, Migliore G. Quality determinants and effect of therapeutic properties in honey consumption. An exploratory study on Italian consumers. Agriculture 2019;9(174):1 12.
9. Kowalczuk I, Jezewska Zychowicz M, Trafiałek J. Conditions of honey consumption in selected regions of Poland. Acta Sci Pol Technol Aliment 2017;16(1):101 112.
Rev Mex Cienc Pecu 2022;13(4):879 893 890 1 were the most frequent and receptive consumers of honey and, therefore, potential consumers. Therefore, it is necessaryto define strategies for promoting the product to inform the positive and healing aspects of honey and thus reinforce their knowledge and purchase decision. The strategy for consumers of groups 2 and 3 should focus on publicizing beekeeping as a sustainable activity, showing the different products derived from honey and the benefits of each by product. Local honey producers should be aware that the reactivation of the beekeeping sector in Mexico could be achieved through the promotion of domestic consumption.Although theresults obtainedin this studyarenot definitive,thefindings could have repercussions on producers and marketers, in order to potentiate the consumption of honey in Mexico through effective marketing strategies for each consumer profile. It is recommended to study other market segments, deepen in the analysis of consumption preferences and the influence of motivational and subjective aspects on the consumption of honey in Mexico. Literature cited: 1. Crane E. A book of honey. USA:Oxford Univ Press; 1980.
13. Ignjatijević SD, Prodanović RV, Bošković JZ, Puvača NM, Tomaš SMJ, Peulić TA, Đuragić OM. Comparative analysis of honeyconsumption in Romania, Italy and Serbia. Food Feed Res 2019;46(1):125 136.
15. Brščić K, Šugar T, Poljuha D. An empirical examination of consumer preferences for honey in Croatia. Applied Economics 2017;49(58):5877 5889.
18. González RFJ, Rebollar RS, Hernández MJ, Guzmán SE. La comercialización de la miel en el sur del Estado de México. Rev Mex Agronegocios 2014;34(18):806 815.
21. Téllez Delgado R, Mora Flores JS, Martínez Damián MA, García Mata R, García Salazar JA. Caracterización del consumidor de carne bovina en la zona metropolitana del Valle de México. Agrociencia 2012;46(1):75 86.
16. Lucchese CT, Gerber RM. Consumo de mel de abelhas: análise dos comportamentos de comensais do Estado de Santa Catarina. Informações Econômicas 2009;39(10):22 31.
12. Badolato M, Carullo G, Cione E, Aiello F, Caroleo MC. From the hive: Honey, a novel weapon against cancer. Eur J Med Chem 2017;142:290 299.
19. Tapia CE, Castañeda SMC, Ramírez AJP, Macías MJO, Barajas PJS, Tapia GJS, et al Caracterización fisicoquímica, contenido fenólico y preferencias de los consumidores de miel de Apis mellífera honey en el Sur de Jalisco, México. Interciencia 2017;24(9):603 609.
17. Magaña MMA, Moguel OYB, Sangines GJR, Leyva MCE. Estructura e importancia de la cadena productiva y comercial de la miel en México. Rev Mex Cienc Pecu 2012;3(1):49 64.
10. Šánová P, Svobodová J, Hrubcová B, Šeráková P. Segmentation of honey buyers’ behaviour by conjoint analysis. Sci Agric Bohem 2017;48(1):55 62.
11. Roman A, Popiela-Pleban E, Kozar M. Factors influencing consumer behavior relating to the purchasing of honey. Part 1. The buying process and the level of consumption. J Apic Sci 2013;57(2):159 172.
14. Arvanitoyannis I, Krystallis A. An empirical examination of the determinants of honey consumption in Romania. Int J Food Sci Technol 2006;41:1164 1176.
Rev Mex Cienc Pecu 2022;13(4):879 893 891
20. da Silva SCM, Oliveira AA, Ramos SR, Ibiapina A, Dos Santos AL, De Souza MGA. Tipologia do consumidor de frutos do cerrado. Revista Desafíos 2019;6(Especial):134 139.
Rev Mex Cienc Pecu 2022;13(4):879 893 892
22. Borja BM, Vélez IA, Ramos GJL. Tipología y diferenciación de productores de guayaba (Psidium guajava l.) en Calvillo, Aguascalientes, México. Región y Sociedad 2018;30(71):1 22. 23. INEGI. Instituto Nacional de Estadística y Geografía. Población total por entidad federativa y grupo quinquenal de edad según sexo, 1990 a 2010. nhttps://www.inegi.org.mx/app/tabulados/interactivos/?px=Poblacion_01&bd=Poblacio.Consultado12Feb,2020.
24. Schnettler MB, Mora GM, Millis QN, Miranda VH; Sepúlveda MJ, Denegri CM, et al. Tipologías de consumidores según el estilo de vida en relación a la alimentación: un estudio exploratorio en el sur de Chile. Rev Chil Nutr 2012;39(4):165 172. 25. Martín MMT, Cabero MQ, Santana YRP. Tratamiento estadístico de datos con SPSS. Madrid, España: Paraninfo; 2007. 26. Díaz de Rada IV. Diseño de tipologías de consumidores mediante la utilización conjunta del análisis clúster y otras técnicas multivariantes. Economía Agraria 1998;(182):75 104. 27. Vivanco AM, Martínez CFJ, Taddei BIC. Análisis de la competitividad de cuatro sistemas producto estatales de tilapia en México. Estud Soc 2010;18(35):167 207. 28. Ferrán Aranaz, M. SPSS para Windows. Análisis estadístico México: McGraw Hill; 2001. 29. IBM Corporation. SPSS software. https://www.ibm.com/mx es/analytics/spss statistics software 30. Pocol CB, Teselios CM. Socio economic determinants of honey consumption in Romania. J Food Agric Environ 2012;10:18 21. 31. Pocol, CB. Modelling the honey consumption behaviour in Romania by using socio demographic determinants. Afr J Agric Res 2011;6:4069 4080. 32. Guziy S, Šedík P, Horská E. Comparative study of honey consumption in Slovakia and Russia. Potravin Slovak J Food Sci 2017;11(1):472 479. 33. Ismaiel S, Kahtani S, Adgaba N, Al Ghamdi A, Zulail A. Factors that affect consumption patterns and market demands for honey in the Kingdom of Saudi Arabia. Food Nutr Sci 2014;5:1725 1737. 34. Šedík P, Pocol CB, Horská E, Fiore M. Honey: ¿food or medicine? A comparative study between Slovakia and Romania. British Food J 2019;121(6):1281 1297.
38.
37. Żak, N. Honey market in the opinion of young consumers. Handel Wewnętrzny 2017;366(1):424 438. Wilkins JL, Bowdish E, Sobal J. Consumer perceptions of seasonal and local foods: A study in a US community. Ecology Food Nutr 2002;41(5):415 439. 39. Cosmina M, Gallenti G, Marangon F, Troiano S. Attitudes towards honey among Italian consumers: A choice experiment approach. Appetite 2016;99:52 58.
Rev Mex Cienc Pecu 2022;13(4):879 893 893 35. ZhangS, Lu Z, ChunlingT, ZhangQ, Liu L, MengG,Yao Z, et al.Associations between honey consumption and prehypertension in adults aged 40 years and older. Clinical Exper Hyper 2020;42(5):420 427. 36. Münstedt K, Männle H, Riepen T. Survey of reasons why women utilize honey therapeutically, and reasons for not utilizing honey. Heliyon 2020;6(10):1 5.
Vertical and spatial price transmission in the Mexican and international cattle and beef market
*Corresponding author: jaramillo@colpos.mx
Abstract: From 2000 to 2019, the Mexican beef subsector has undergone significant structural changes; the most important was the concentration of both production and marketing stages. In 2019, the Mexican Federal Commission of Competence revealed that, Mexican households’ income diminished between 16 and 31 % due to a lack of market efficiency. In the case of meat, the reduction may be up to 98 %. In this context, the objective of this study was to examine the degree of spatial price transmission between national and international live cattle prices and the vertical transmission between live cattle prices and carcass meat prices to evaluate market efficiency. The econometric approach consists of the estimation of a vector error correction model, using monthly beef real prices, for the period 1990 2019 Findings from this research provide information for decision makers and stakeholders in this industry: these comprehend unidirectional transmission of international beef prices to domestic beef prices and from farm price to processor price. Also point to the existence of asymmetric price transmission, which is related to whether cattle and beef prices are increasing or decreasing. Results indicate that a long run single cointegration relationship exists between international and farmer prices, and between processor and farm price. The direction of price transmission tends to go from producers to processors and from international price to farmer price. When the international price increases, the speed of adjustment tends to be significantly slower, in contrast to when the international price decreases, resulting in a significantly faster rate of adjustment.
Key words: Asymmetric price transmission, Beef prices, Vector error, Correction model.
José Luis Jaramillo Villanueva a* a Colegio de Postgraduados. Boulevard Forjadores de Puebla # 205, Santiago Momoxpan. 72760, Mpio. San Pedro Cholula, Puebla, México.
894
https://doi.org/10.22319/rmcp.v13i4.5839Article
Rev Mex Cienc Pecu 2022;13(4):894 909 895 Received: 06/11/2020 Accepted: 01/06/2022
The Mexican beef cattle sub sector has substantial economic and social relevance. Production of beef represents almost half the value of Mexican gross animal product(1) . Mexico occupies the eighth position in the world ranking for beef production, with 1.91 million t, 3.35 % of world beef production(2). The growth average rate (GAR) of cattle production in Mexico was 1.92 % in 2000 2018 (SIAP(3)). From a social perspective, it is the main economic activity carried out by small family farms, accounting for 1.06 million cattle production units in 2018 that generated 1.2 million direct jobs, and three million related jobs(4) .
In Mexico, from 1990 to 2019, the beef cattle and beef industry have undergone significant consolidation,assince2000,bothcattleandbeefpackinghaverapidlyreorganizedintofewer and larger plants. The outcome of these processes is a highly concentrated cattle and beef industry. Thus, Sukarne® is the largest beef processing company in Mexico and has dominated beef export growth from 2010 to 2019. SuKarne® ranks as the sixth largest beef packing company in North America, it accounts for 74 % of total Mexican beef exports(5) However, the Mexican Federal Commission of Competence(6) revealed that Mexican households lose between 16 and 31 % of their income. The rapid concentration of beef and cattle industry generates pressure on small processing firms, government, and consumers because retail beef prices grew at a GAR of 4.99 % from 2009 to 2018. However, farmer prices increased at a GAR of 2.43 %, calculated with data from USDA(2) and INEGI(7) Market concentration in the beef cattle industry is associated with non competitive behavior that may result in economic inefficiency and a decline in consumer welfare(8). Some research(9) pointed out that market concentration is among the major causes of asymmetric price transmission in agricultural market chains. Nonetheless, in Mexico, up to now, there are few studies about beef cattle and beef price transmission and then, no consensus exist on this issue.
Introduction The livestock and beef industry in Mexico
Vertical price transmission
Rev Mex Cienc Pecu 2022;13(4):894 909 896
Suppose that PA and PB represent the prices for a homogeneous commodity in two spatially separated markets in t, and r A B represents transfer costs to move one unity of merchandise from B to A, the LOP asserts that: PB PA ≤ r AB. The price difference in t for a commodity at two spatially separated markets should not differ by more than transfer costs. If the spatial price difference exceeds that of transfer costs, economic agents make spatial arbitrages. Following the adjustment process, a new equilibrium is reached, and the LOP is once again maintained. As literature(11) asserted, trade between two markets implies they are integrated.
The objective of this study was to estimate the speed of price transmission between the price of the Mexican beef cattle processor (carcass) and cattle farmer (calf) (vertical transmission) and between the price of Mexican and international cattle price (calf) (spatial price transmission) in order to know on possible asymmetric price transmission and related
Spatial price transmission
From 1990 to 2010, extensive studies examined market links between farm, processor, and retail markets(13). The extent of adjustment and speed with which shocks transmit between farmer, processor and retailer market prices is an essential factor that reflects market participants’ actions at varying market levels. The nature, speed and extent of adjustment to market shocks may also have important implications for marketing margins, spreads, and mark up pricing practices(9,12) .
Vertical price transmission analysis is useful for assessing the efficiency of integrating different economic actors into a market. The extent and speed at which price changes are transmitted from one level to another in the market have important policy implications for welfare distribution and competitiveness. In a competitive market, price shocks at one level of the market chain should be reflected by similar changes at other levels, as market efficiency hypothesize a relationship of mutual price equilibrium(12) .
Spatial price transmission refers to the transmission of price shocks across different areas and commodities(10). The critical underlying theoretical explanation of spatial price transmission is revealed in the spatial arbitrage relationship, known as the Law of One Price (LOP). It implies that the difference between prices at different market locations will never exceed transaction costs; otherwise, arbitrageurs would exploit these profit opportunities(10) .
Once a unit´s root existence is proved, cointegration between variables in the series is necessary for a long term equilibrium relationship. A variable vector with a unit root is co integrated if a linear combination of these variables is stationary(17) The Engle Granger two step cointegration test(17) and the Johansen test(16) were applied to test for a long run relationship. The first approach consists of estimating the cointegration regression, equation (1), by Ordinary Least Squares (OLS) method: (1)pt out = a+b 1pt in + m t
Material and methods
Rev Mex Cienc 2022;13(4):894 909 897 economic consequences on producer and consumers. The hypothesis was that domestic and international beef price transmission is asymmetric.
Verification of each series´ integration order was conducted, using the Augmented Dickey Fuller and Phillips Perron (PP) tests(14,15). These tests were followed by an estimation of the long run relationship, using the Engle Granger two step cointegration and the Johansen test(16). Finally, asymmetric Vector Error Correction Model (VECM) was performed; a test to select the lag order for an asymmetric VECM and a F test on the coefficient of ECT+ and ECT (positive and negative changes in the error term respectively) in order to test the null hypothesis of symmetry: H0: B+ i = B i. Test for cointegration; long-run relationship
Pecu
The study method consisted of econometric tests using time series of monthly spot real price data, deflated using the consumer price index, from 1990 to 2019. Farmer price was represented by calf prices, intermediate (processor) price was represented by carcass price, and international and import price by calf prices. The last one in dollars, but converted to Mexican real pesos using the bilateral exchange rate. International beef price (calf) comes fromtheU.S.DepartmentofAgriculture(USDA).Additionalinformationonotherindicators originates from official statistical sites in Mexico, among which are the Sistema de Información Agropecuaria yPesquera (SIAP), the National Institute of Statistics, Geography and Informatics (INEGI byits acronym in Spanish), the National Confederation of Livestock Organizations (CNG by its acronym in Spanish), and from the ANETIF (National Association of Federal Inspection Type) Foundation.
The estimation of equation (1) generated the residual ût, to which was applied a unit root test for ût. As the coefficient of Ut 1 was less than unity, a cointegration relationship exists.
Rev Mex Cienc Pecu 2022;13(4):894 909 898 where is a firm output price in period t, is the input price in t and Ut is the error term.
A negative coefficient of the error term (between 2 and zero) confirms a long run relationship between prices. In contrast, the Johansen test derived the distribution of two test statisticsforthenullofnocointegration;theTraceandEigenvaluetest(16).Oncecointegration between prices was verified, a two step Error Correction Model (ECM) was applied to capture the short and long term effects of on , and the speed of adjustment at which restores equilibrium after a change in . Two econometric models were estimated: the spatial asymmetric model and the vertical asymmetric model. Spatial asymmetric price transmission
Considering that farm and international prices have a unit root and were cointegrated, symmetric and asymmetric VECM were estimated to investigate possible price interdependence. Following an econometric approach(18), the ECM for spatial price transmission is depicted in equation (3). (3) In equation 3, the contemporaneous response termwas also segmented(18) It leads to equation (4), in which contemporaneous and short run response to departures from the cointegrating relationship are asymmetric if , respectively. (4) An F test was used to test for the null hypothesis of symmetry. pt out pt in Dm t = a+b1m t 1 +b2Dm t 1 pt in pt out pt out pt in Dpt farm = a+b 1Dpt int +b2ECT t 1 +b3(L)Dpt 1 farm +b4(L)Dpt 1 int 1122 and Dpt farm = a+b 1 +Dpt int +b 1 Dpt int +b2 + ECT t 1 + +b2 ECT t 1 +b3(L)Dpt 1 farm +b4(L)Dpt 1 int
Subsequently, a regression of equation (2) was performed. (2)
Vertical asymmetric price transmission
In the literature, an approach based on cointegration theory was proposed(17) to test for possible asymmetries in the beef value chain. It indicates that two non stationary time series maybelong term co integratedifbothseries, from thesameorder,areintegrated.Incontrast, using an asymmetric VECM, Cramon Taubadel(19) tested for Asymmetric Price Transmission (APT) in the presence of non stationary series, by applying the two step Engel and Granger approach. For this approach, the authors proposed splitting the error correction term into positive and negative components to identify whether prices are transmitted differently, depending on whether they increase or decrease. Following the approach for testing vertical asymmetric price transmission(19) , it was estimated equation (5): (5) where: is the error correction term, and are polynomial lags. Furthermore, splitting the ECT into positive and negative components (i.e. positive and negative deviations from the long-term equilibrium ECT+ and ECT ) reveals whether the speed of prices´ transmission differs, depending on it increases or decreases. Furthermore, it enables testing for Asymmetric Price Transmission (APT)(20). Then, we estimated equation (6): . (6)
Rev Mex Cienc Pecu 2022;13(4):894 909 899
To test for asymmetry, an F test was used to test the null hypothesis of symmetry, whether an asymmetric price response exists, Results and discussion Results from the ADF and PP(14,15) unit root tests cannot negate the null of non stationarity of price series; T statistic values do not corroborate rejection of the null hypothesis of a unit root with 95% confidence (Table 1). DP t ret = b0 +b 1DP t farm +b2ECT t 1 + B3(L)DP t 1 ret + B4(L)P t 1 farm + e t ECT t 1 = P t 1 ret a0 a1P t 1 farm b3(L),b4(L) DP t ret = b0 +b 1DP t farm +b2 + ECT t 1 + +b2 ECT t 1 + B3(L)DP t 1 ret + B4(L)P t 1 farm + e t b2 + ¹ b2
The estimation of equation (1), for the spatial model (equation 4), shows an R2 of 0.78, a t statisticof34.78 andanFstatisticof1209.7,whichindicatelong runcointegration.TheADF test on the error term shows a test statistic of 2.57 vs a 5 % critical value of 2.87, which indicates a failure to reject the null of non stationarity. Different authors(21,22,23) reported similar results for beef prices. For the vertical model (equation 6), it was found an R2 of 0.68, a t statistic of 27.47, and an F statistic of 742.4. On the error term, the ADF shows a test statistic of 2.696 vs a 5 % critical value of 2.87, indicatingthat cannot reject the null of non stationarity. For the two models, it was estimated equation (2). The results showed a negative coefficient of the error term, which confirms the long run relationship between beef prices (Table 2).
Long run cointegration
International price 2.456 3.426 11.886 21.378 Farm price 2.096 3.426 13.455 21.378 Processor price 3.489 3.426 22.733 21.378 Import price 7.396 3.426 86.416 21.378
Rev Mex Cienc Pecu 2022;13(4):894 909 900 Table 1: Results of the ADF and PP test on beef price series Price series ADF test 5% valuecritical PP test 5% valuecritical
Source: own calculations. These results enabled to use the cointegration technique to calculate the relationship between international and domestic Mexican beef prices and between a processor and farm beef prices. These results concur with previous studies concerning the non stationarity of beef prices(21,22,23) .
Results from Johansen’s test (Table 3) provided strong evidence to reject the null hypothesis of non cointegration between domestic farmer price and international price and between farmer price and processor beef prices, suggesting the existence of a long run single cointegration relationship. Table 3: Johansen cointegration test for price cointegration
Farmer Int. price Coefficient Standard error t value .148 .032 4.53* .240 .052 4.59* Constant .000 .004 0.020 F test 30.280 R squared 0.1501 Farmer-processor .014 .016 1.291 .234 .053 4.461* Constant .002 .002 F test 11.65 R squared 0.164 Source; own estimation. *denote 95% significance
Table 2: Engle Granger two step cointegration test
Rev Mex Cienc Pecu 2022;13(4):894 909 901
Farmer International price Rank Eigenvalue statisticTrace 5% valuecritical 0 . 30.208 15.411 1 0.035 1.744* 3.761 2 0.004 Variable Coeff. SE Z Farmer price 1 International price .826 .083 9.902 Constant .528 Farmer-processor Rank Eigenvalue statisticTrace 5% valuecritical 0 . 14.182* 15.41 1 0.035 1.537 3.761 2 0.004 Variable Coeff. SE Z Farmer price 1 Processor Price 0.678 0.1697 3.998* Constant 5.375 Source: Own estimation. Coeff.= Coefficient; SE= standard error. *denote 95% significance m t 1 Dm t 1 m t 1 Dm t 1
Rev Mex Cienc Pecu 2022;13(4):894 909 902
Studies on beef and cattle prices, applying the Johansen test, reported cointegration between domestic farm prices and international prices. Long run cointegration between farmers and processors/retail beef prices was also reported(24) . The results suggest that their historical innovations profoundly influence prices in the international beef market. The international beef price has a consistently strong impact on Mexican price movements in the long run. Given a unit change in the international price, farmer price of live cattle changes by 82 %, which implies a large effect, but different from unity. The remaining of the explanation given by other market fundamentals. For the case of farm processor relationship, an increase of 1 % of the processor price, induces a 0.68 % increase in farm price. Since the above results confirmed the cointegration of international and domestic farm prices and between farmer and processor beef prices, it was estimated a symmetric and an asymmetric VECM. Spatial vector error correction model For the spatial model, it was estimated a VECM to investigate the possible interdependence of domestic and international beef prices considering that farm and international prices have a unit root, and are co integrated. Results from the VECM show that both farm and international beef prices respond to disequilibria because coefficients are significant at the 5 % level. There is limited correction of price disequilibria, and coefficients are of the correct sign. In a similar study conducted in Europe(25), using the asymmetric VECM, it was found that price movement in global beef markets transmitted to domestic markets, but a lesser Tableextent.4 shows that contemporaneous change coefficients are significantly less than one in both equations. It means thatwithina singlemonth,farm prices do not react entirelyto global price changes. This fact shows that monthlydata is adequate for revealingthe process of beef price transmission(18) .
Table 4: Results of the VECM; symmetric and asymmetric spatial model variableIndependent Symmetric spatial model spatial model Coef. Std. Err. t value P value Coef. Err.Std. t value P value
Rev Mex Cienc Pecu 2022;13(4):894 909 903
Asymmetric
Pint t 2 0.048 0.022 2.14* 0.033 0.025 0.023 2.09* 0.037
Pprodt 3 0.043 0.056 0.77 0.441 0.042 0.056 0.75 0.453
Pint t 3 0.008 0.022 0.37 0.715 0.005 0.022 0.23 0.820 Pint t 4 0.022 0.019 1.17 0.243 0.023 0.018 1.27 0.215 ECTt 1 0.049 0.015 3.26* 0.000 ECT+ t 1 0.049 0.021 2.38* 0.018 ECT t 1 0.059 0.029 2.05* 0.042 Constant 0.0011 0.002 0.62 0.552 0.001 0.002 0.58 0.556 Norm. test (Prob>z)=0.000 (Prob>z)=0.000 LM test (Prob>chi2)=0.291 (Prob>chi2)=0.524 DW test 0.299 0.532 R squared 0.320 F(1,330)=0.353 0.822 F(1,330)= 12.084
The t statistics for ECT+ and ECT indicate that farm prices respond strongly to negative shocks, but positive shocks in the margin are allowed to persist. The induces a significantly greater change in farm price than the ECT+. A similar result, reported in economic literature(26), showed that VECM indicated that most of the market´s disequilibrium was corrected within a month. Prices correct a small percentage of disequilibria in the markets, mostly by external forces. An F test of the null hypothesis of symmetry ( ) leads to rejection at the 5 % level of significance (F= 12.08). This result implies that when price fall, the transmission is faster than when price rise. Price increases reach producers with a delay, with respect to a fall in international prices, which are transmitted faster. This result is consistent with the fact that international prices react more rapidly when the margin is squeezed than when it is stretched(27). A possible explanation for the price asymmetry is the insufficient access by livestock producers to price information and infrastructure(9) .
Pint t 1 .028 0.022 1.26 0.210 0.059 0.024 2.44* 0.015
The spatial market integration of livestock and beef prices between international and H0 :b1 + = b1 H0 :b2 + = b2 b2 + = b2
Pprodt 4 0.04 0.055 0.65 0.514 0.034 0.055 0.62 0.535
Pprodt 1 0.27 0.054 4.99* 0.000 0.273 0.061 4.49* 0.000 Pprodt 2 0.017 0.056 0.31 0.768 0.017 0.056 0.31 0.768
Source: Own estimation.*denote 95% significance
0.006 ECT t 1 --- --- --- -0.042 0.0117
Table 5: Results of VECM; vertical symmetric and asymmetric model variableIndependent Symmetric vertical model Asymmetric vertical model Coef. Std. Err. t value P value Coef. Err.Std. valuet P value
0.000 Constant 0.001 0.002 0.88 0.375 0.001 0.0015
0.184 ECTt 1 0.029 0.008
0.000 ECT+ t 1 0.033 0.0118
0.375 Normality test (Prob>z)=0.000 (Prob>z)=0.000 LM test (Prob>chi2)=0.336
0.032 0.075
DW test 0.344 0.612 R squared 0.341 0.391 Test: F(1,330)= 14.371 Source: Own estimation. *denote 95% significance b2 + ¹ b2
Rev Mex Cienc Pecu 2022;13(4):894 909 904 Mexican market is an issue of major importance because is deficit country, and therefore efficient trade has important food security policy implications. From the policy point of view, this should help in the design of agricultural support programs, and risk management tools for the beef industry. The finding of strong transmission effects between international and Mexican prices corroborates the view that participants in the Mexican supply chain need to consider the highly volatile nature of international prices in their decision making process. Vertical vector error correction model Because cointegration exists between processor and farm beef prices, a VECM was estimated,followingCramon Taubadel’sapproach(equation5).Theoutputofthesymmetric and asymmetric VECM in Table 5 indicates that both the coefficient for ECT and the short term parameter are significant at the 5 % level.
Pprodt 1 0.077 0.036 2.120* 0.035 0.094 0.031 2.944* 0.004 Pprodt 2 0.079 0.056 1.411 0.158 0.075 0.056 1.321 0.187 Pprodt 3 0.026 0.056 0.47 0.645 0.023 0.056 0.41 0.675 Pprodt 4 0.067 0.053 1.242 0.214 0.068 0.054 1.263 0.21 Pint t 1 0.111 0.032 3.440* 0.001 0.104 0.033 3.090* 0.002 Pint t 2 0.065 0.032 2.000* 0.046 0.063 0.032 1.93 0.054 Pint t 3 0.002 0.948 0.003 0.032 0.121 0.908 0.042 0.031 1.33 3.690* 2.811* 3.560*0.89 (Prob>chi2)=0.605
Pint t 4 0.04 0.031 1.28 0.202
This result suggests that processor and farmer’s prices share a relationship of long term equilibrium. A change in farmer’s prices has a significant effect on processor prices during the subsequent period. The ECT induces a significantly greater change in the processor price than ECT+. These results corroborate the hypothesis that price changes are not transmitted efficiently from one level to another(28). It also supports the hypothesis(9) that beef processors may have some market power.
Focusing on adjustments of retail prices to restore equilibrium, estimates of the adjustment coefficients indicatethat, withinamonth,retail prices adjust so as to eliminateapproximately 4.2 % of a unit negative change in the deviation from the equilibrium relationship created by changes in producer prices. On the other hand, retail prices adjust by3 % of a positive change in deviation from the equilibrium created by changes in producer prices. Because beef and carcasses are nonstorable commodities subject to production lags with inelastic supply in the short run, producers are unable to adjust production in response to transitory price changes. By contrast, beef processor can immediately respond to changes in producer prices by adjusting their prices. Furthermore, processor, unlike feedlots, face significant fixed costs. In the short run, margins may thus be reduced in an attempt to keep a plant operating near full capacity. Therefore, as a result of competition between different processor, farm prices may be bid down more quickly than they are bid up. Given that asymmetric price transmission implies a certain degree of market power and / or market inefficiency, more research is needed to delve into the possible causes of asymmetric price transmission of livestock and beef, not only at the national level but also regional. b2 + = b2
Rev Mex Cienc Pecu 2022;13(4):894 909 905
The asymmetric VECM results reveal that the transmission of beef prices is asymmetrical for the speed of adjustment. The t statistics for ECT+ and indicate that retail prices respond strongly to negative shocks, indicating that when producer prices decrease, the speed of adjustment tends to be significantly faster. Moreover, when prices increase, there are statistically significant changes in the speed of adjustment. An F test of the null hypothesis of symmetry ( ) leads to rejection at the 5 % level of significance (F= 14.37). It suggests that farm prices react more rapidly when the margin is squeezed than when it is stretched. In a study of the US beef market(29), it was pointed out a price transmission asymmetrythat is much more critical for wholesale retail than for farm wholesale. Likewise, positive price shocks are transmitted with higher intensity than negative ones.
Acknowledgments and conflict of interest
I am grateful for the financial support of the Colegio de Postgraduados Campus Puebla for the development of the database and to Ms. Leticia Portilla Durán for her collaboration in the development of the database. I state that there is no conflict of interest of any kind between the funding institution and the published data and results.
Rev Mex Cienc Pecu 2022;13(4):894 909 906
Conclusions and implications
This research provides for Mexico that the transmission of beef prices is asymmetric in the domestic and international markets. A long run cointegration relationship exists between international and Mexican beef farm prices and between farm and domestic processor price. For the spatial analysis, both farm and international prices show a significant response to price disequilibria and asymmetric price transmission. Price movements in international markets are transmitted asymmetrically to the Mexican market, indicating that a decrease in international prices tends to be transmitted faster to farmers than an increase in international prices. Considering the vertical price transmission model during the following period, a change in producer prices has a significant effect on processor prices. The speed at which prices tend to converge to entirely correct for deviation is moderately slow, but when producer prices decrease, the speed of adjustment tends to be significantly faster. Asymmetric price transmission in the Mexican beef market have policyimplications. The role of government intervention in the market via various price support programs may have welfare and income redistribution effects. For example, bovine livestock support programs in Mexico may be benefiting more to processors than farmers (feedlots). Findings from this research can provide valuable contributions to the policy debate, revealing a unidirectional transmission of beef prices from producers to processors, and that the transmission of beef prices is asymmetrical, depending on whether prices are increasing or decreasing.
Rev Mex Cienc Pecu 2022;13(4):894 909 907
Literature cited:
14. Dickey DA, Fuller WA. Likelihood ratio statistics for autoregressive time series with a unit root. Econometrica 1981;49(4):1057 1072.
9. Meyer J, Cramon TSV. Asymmetric price transmission: a survey. J Agric Econ 2004;55(3):581 611.
12. Serra T, Goodwin BK. Price transmission and asymmetric adjustment in the Spanish dairy sector. Appl Econ 2003;35(18):1889 1899.
6. COFECE. Comisión Federal de Competencia Económica. Poder de mercado y bienestar social. www.cofece.mx 2019, Consultado Ene 14, 2019.
11. Ganneval S. Spatial price transmission on agricultural commodity markets under different volatility regimes. Econ Model 2016;52(A):173 185.
2. USDA. United States Department of Agriculture. Livestock and poultry. https://apps.fas.usda.gov/psdonline/circulars/livestock_poultry.pdf 2019. Accessed Jan 11, 2020.
8. Xia T, Li X. Consumption inertia and asymmetric price transmission. J Agric Resour Econ 2010;35(2):209 227.
3. SIAP. Servicio de Información Agroalimentaria y Pesquera. Anuario estadístico de la producción ganadera. https://nube.siap.gob.mx/cierre_pecuario/ 2019. Consultado 16 Oct, 2019.
4. Consejo Mexicano de la Carne. Compendio estadístico 2018. https://comecarne.org/ 2018. Consultado 9 Ene, 2019.
1. SIAP. Servicio de Información Agroalimentaria y Pesquera. Indicadores Económicos. https://www.gob.mx/siap 2018. Consultado 9 Dic, 2019.
5. SUKARNE 2020. Página oficial. Consultado 16 Abr,2021. www.grupovix.mx, y http://www.sukuero.com.mx/celebrando-45-anos-de-sukarne/
7. INEGI. Instituto Nacional de Estadística y Geografía. Índice Nacional de Precios al Consumidor y al Productor, 2018. http://www.inegi.org.mx Consultado Ene 14, 2019.
13. Miller DJ, Hayenga ML. Price cycles and asymmetric price transmission in the U.S. Pork market. Am J Agr Econ 2001;83(3):551 562.
10. Fackler PL, Goodwin BK. Spatial price analysis. In Gardner B, Rausser G, editors. Handbook of agricultural economics. Amsterdam: Elsevier 2001;1(2):971 1024.
Rev Mex Cienc Pecu 2022;13(4):894 909 908
18. Cramon Taubadel SV, Loy JP. Price asymmetry in the international wheat market: comment. Can J Agric Econ Rev Can Agroecon 1996;44(3):311 317.
25. Ihle R, Brümmer B, Thompson SR. Structural change in European calf markets: Decoupling and the blue tongue disease. Eur Rev Agric Econ 2012;39(1):157 180.
26. Bekele S, Alemu D. Analysis of beef cattle market integration in the case of Wolaita Zone, Southern Ethiopia. J Market Consumer Res 2016;30:9 15.
16. Johansen S. Estimation andhypothesis testingofcointegrationvectorsin Gaussianvector autoregressive models. Econometrica 1991;59(6):1551 1580.
27. Darbandi E, Saghaian SH. Vertical price transmission in the U.S. beef markets with a focus on the great recession. J Agribus 2016;34(2):99 120.
19. Cramon Taubadel SV. Estimating asymmetric price transmission with error correction representation. Application to the German Pork market. Eur Rev Agric Econ 1998;25(1):1 18. 20. Granger CWJ, Lee TH. Investigation of production, sales and inventory relationships using multicointegration and non-symmetric error correction models. J Appl Econom 1989;4(S1):S145 S159.
22. Goodwin BK. Spatial and vertical price transmission in meat markets. Workshop of market integration and vertical and spatial price transmission in agricultural markets. University of Kentucky Lexington 2006 23. Barahona JF, Trejos B, Lee JW, Chulaphan W, Jatuporn C. Asymmetric price transmission in the livestock industry of Thailand. APCBEE procedia 2014;8:141 145. 24. Guillen J, Franquesa R. Testing for market power in the Spanish meat market: Price transmission elasticity and asymmetry using econometric models. IJCEE 2010;1(3/4):294 308.
17. Engle RF, Granger CWJ. Cointegration and error correction: Representation, estimation and testing. Econometrica 1987;55(2):251 276.
15. Phillips PCB, Perron P. Testing for unit root in time series regression. Biometrika 1988;75(2):335 346.
21. Chung C, Rushin J, Surathkal P. Impact of the livestock mandatory reporting act on the vertical price transmission within the beef supply chain. Agribusiness 2018;34(3):562 578.
Rev Mex Cienc Pecu 2022;13(4):894 909
28. Lloyd T. Forty years of price transmission research in the food industry: Insights, challenges and prospects. J Agr Econ 2017;68(1):3 21.
909
29. Emmanouilides CJ, Fousekis P. Vertical price dependence structures: copula-based evidence from the Beef supply chain in the USA. Eur Rev Agric Econ 2015;42(1):7797.
910
Exploring bovine fecal bacterial microbiota in the Mapimi Biosphere Reserve, Northern Mexico Irene Pacheco Torres a Cristina García De la Peña b* César Alberto Meza Herrera a Felipe Vaca-Paniagua c,d,e Clara Estela Díaz Velásquez c Claudia Fabiola Méndez Catalá c Luis Antonio Tarango Arámbula f Luis Manuel Valenzuela Núñez b Jesús Vásquez Arroyo g a Universidad Autónoma Chapingo. Unidad Regional Universitaria de Zonas Áridas, Bermejillo, Durango, México.
b Universidad Juárez del Estado de Durango. Facultad de Ciencias Biológicas, Av. Universidad s/n Fracc. Filadelfia, 35010 Gómez Palacio, Durango, México. c Facultad de Estudios Superiores Iztacala Laboratorio Nacional en Salud, Diagnóstico Molecular y Efecto Ambiental en Enfermedades Crónico Degenerativas. Tlalnepantla, Estado de México. d Instituto Nacional de Cancerología Ciudad de México, México e Universidad Nacional Autónoma de México. Facultad de Estudios Superiores Iztacala Unidad de Biomedicina, Tlalnepantla, Estado de México, México. f Colegio de Postgraduados, Campus San Luis Potosí, Salinas de Hidalgo, San Luis Potosí, México.
https://doi.org/10.22319/rmcp.v13i4.6138Article
Rev Mex Cienc Pecu 2022;13(4):910 927 911 g
Corresponding author: cristina.garcia@ujed.mx
Introduction
The microbial community of the gastrointestinal system of cattle remains understudied. Due to its influence on nutrient absorption, productivity, potential reservoir of human and animal pathogens, as well as overall animal health, there is a need to better understand bovine gut microbial communities(1). Recently, high throughput sequencing using 16S rRNA amplicons has provided deeper information on the fecal bovine microbiota composition, and the results obtained to date indicate a high diversity(2)
Abstract: In Mexico, information on the bovine fecal microbiota (Bos taurus) is scarce. The present study describes the diversity and abundance of bacteria in fecal samples from rangeland bovines, collected in the Mapimi Biosphere Reserve in the central part of the Chihuahuan desert. Fecal samples were analysed using high throughput next generation massive sequencing using V3 V4 16S rRNA on Illumina Miseq. A total of 17 phyla, 24 classes, 33 orders, 50 families, 281 genera, and 297 species were identified. Firmicutes and Verrucomicrobia were the most abundant phyla. The most abundant genera were Sporobacter, PAC000748_g (genera into the Ruminococcaceae family) and Eubacterium_g23. Three genera (Clostridium, Corynebacterium and Fusobacterium) and one species (Campylobacter fetus) potentially pathogenic bovine bacteria were registered. This information represents a bacteriological baseline for monitoring the grazing bovine intestinal health status, and to trace possible interactions with the fecal microbiota of native roaming wildlife in the area.
Universidad Juárez del Estado de Durango. Facultad de Ciencias Químicas. Gómez Palacio, Durango, México *
Accepted:Received:sequencing.13/01/202206/04/2022
Key words: Bos taurus; Campylobacter fetus; Bacterial diversity; 16S rRNA gene; Massive
The cattle gut microbiome has many microbial species that play an important role in health and productivity(7,8). These microbes are essential for the fermentation of consumed plant matter that is converted into energy for the host(9) However, bovines asymptomatically transport bacterial species that are potential pathogens to wildlife as Escherichia coli, Campylobacter spp., Salmonella spp. and Listeria spp.(6,10) . In recent years, the extensive use of land for agriculture has increased the densities of cattle populations creating positive correlations with pathogenic infections by fecal bacteria(11) . Though, knowledge about bovine fecal bacterial diversity under grazing management systems is relatively scarce(12) . This study aimed to explore for the first time the diversity and abundance of fecal bacteria from bovines under grazing marginal conditions in the Mapimi Biosphere Reserve, center of the Chihuahuan desert, using next generation sequencing (16S rRNA).
Material and methods
The study was developed in the Mohovano de las Lilas locality, northeast of the Mapimi Biosphere Reserve in Mexico (26°00’ and 26°10’N, 104°10’ and 103°20’W) in the center of the Chihuahuan desert. This area has warm, very arid climate, with an average annual temperature of 25.5 ° C, and an average annual precipitation of 264 mm The predominant vegetation is rosette and microphile scrub, as well as halophyte, and gypsophila plants(15)
All themethods and activitiesofthis studywerein strictaccordancewith accepted guidelines for ethical use, care and welfare of animals in research at international(13) and national(14) levels, with institutional approval reference number UJED FCB 2018 07.
Study area
Rev Mex Cienc Pecu 2022;13(4):910 927 912
The central part of the Chihuahuan Desert in Mexico has a high diversity of wildlife(3,4). The bovine (Bos taurus) has been raised as grazing livestock since its introduction at the end of the 16th century, being the most important economic activity in this area(5). However, this activity is the main reason of ecological deterioration which affects wildlife; for example, this ruminant species competes for forage resources with endemic animal species (i.e., Gopherus flavomarginatus, Bolson tortoise)(3) Cattle grazing also exerts strong pressure on plant populations, modifying their cover; this may increase soil erosion susceptibility in this desert(3,6)
Data availability
Field work
The DNA sequences were analyzed using Quantitative Insights into Microbial Ecology bioinformatics software (QIIME)(20). Both forward and reverse sequences were assembled using the PEAR program(21) considering Q30 the quality criterion (one false base for every 1,000 bases). Chimeric sequences were discarded with USEARCH(22). Then, the operational taxonomic units (OTUs) were selected with the UCLUST method(22) at 97 % similarity; a representative sequence for each OTU was obtained, and the taxonomy was assigned using EzBioClouddatabaseasreference(23).Asimplerandomrarefactionprocess wasperformed(24) in order to obtain a standardized file for all samples. The relative abundance for the phylum and family levels were represented as stacked bar plots using R, and genus level was visualized as a heatmap using Morpheus software (Morpheus,
Rev Mex Cienc Pecu 2022;13(4):910 927 913
GACTACHVGGGTATCTAATCC
In July2018, three fresh fecal samples were collected from three healthymale bovines. From each fecal sample, 0.25 g was collected from the center of the sample and deposited it in BashingBead™ cell lysis tubes (Zymo Research Corp.) adding 750 μL of lysing/stabilizing solution. Each tube was processed in a TerraLyzer™ cellular disruptor (Zymo Research Corp.) during 20 sec according to the equipment specifications. Laboratory work DNA was extracted from the samples using the Xpedition™ Soil/Fecal DNA MiniPrep kit (Zymo Research Corp.) in a laminar UV flow hood in sterile conditions. The amount of DNA obtained was measured in a Qubit™ fluorometer (Invitrogen). Then, the V3 V4 region of the 16S rRNA gene was amplified using the following primers(16): S D Bact 0341 b S 17, 5´
CCTACGGGNGGCWGCAG
3´ and S D Bact 0785 a A 21, 5´
3´. The step after sequencing was realized using a Illumina protocol(17,18) and thereafter, the samples was sequenced in MiSeq of 2 × 250 paired final The complete sequencing process is available in García De la Peña et al(19)
The files used in this study were deposited into the NCBI Sequence Read Archive (SRA) database (Accession Number: PRJNA614584). Bioinformatic analysis
Sample Total Assembled Discarded BS BSS OTUs 1 322,428 138,862 183,566 131,275 98,084 6,293 2 223,470 145,379 78,091 136,807 102,441 6,556 3 305,380 183,506 121,874 173,177 128,916 7,135 Mean 283,759 155,915 127,843 147 086 109 814 6,661
In this study, the average number of sequences assembled was 155,915. A mean ± sd of 109,814 ± 16,686 bacterial sequences were obtained after taxonomic designation. The average number of OTUs with a 97 % of similarity was 6,661 ± 431 (Table 1).
https://software.broadinstitute.org/morpheus);
hierarchical clustering (average linkage method with Euclidean distance) was used to visualize samples dendrogram(25) .
Table 1: Fecal sequences information of Bos taurus at the Mohovano de las Lilas locality, Mapimi Biosphere Reserve, Mexico BS= bacteria sequences after taxonomical designation, BSS= bacteria sequences after singletons removal; OTUs= operational taxonomic units.
Rev Mex Cienc Pecu 2022;13(4):910 927 914
A total of 17 phyla, 24 classes, 33 orders, 50 families, 281 genera, and 297 species were determined. The most abundant phyla (Figure 1) were Firmicutes (�� = 88.9 %) and Verrucomicrobia (�� = 6.4 %). The same phyla were reported in grazing Mongolian cattle in Hulunbuir grassland and Alxa Desert in China(26) These phyla are considered normal components in the basic fecal microbiota of domestic herbivores(27,28) and other species of ruminants(29,30). Firmicutes has been reported as the most frequent phylum in fecal samples of cattle, horses(2,31,32) , and red deer(33) . This abundance is related to high fiber intake(34) . Verrucomicrobia was the second abundant phylum in the cattle samples in this study. Aricha et al(26) determined that this phylum was very abundant in the intestinal tract of the grazing Mongolian cattle in the Alxa Desert, and argue that this may be related to the extremely strong disease resistance of this breed of cattle. It is important to analyze later if this phylum confers resistance to cattle diseases in the Mapimi reserve, which would represent an advantage for the bovine’s health in this area. Also, Bacteroidetes was reported in previous studies Mongolian(26), and Holstein Friesian(36) as the second most abundant phylum in other cattle species such as grazing and feedlot Angus Beef(35) . However, Bacteroidetes was found inaminimumproportion (0.001%)in thecattlesamplesoftheMapimireserve.Thisdisparity
Results and discussion
Figure 1: Relative abundance (%) of fecal bacteria taxa (phylum level) from three samples of Bos taurus at the Mohovano de las Lilas locality. Only the first 10 more abundant phyla are shown
At family level, Ruminococcaceae (�� = 68.9 %) and Lachnospiraceae (�� = 10.9 %) were abundant in the fecal samples collected (Figure 2); both families are found in the mammalian gut environment and have been associated with good health(39) . Some genera of the family are part of the normal intestinal microbiota of cattle, sheep, and goats metabolizing cellulose, and colonizing the rumen(40); these bacteria taxa are important for the degradation and fermentation of polysaccharides in the diet of ruminants(41) In addition, it has been reported that members of the Lachnospiraceae family exhibit pectin hydrolysis activities in the cattle´s rumen(42) associated to the butyric acid production and providing energy for the growth of intestinal epithelial cells(43) The high abundance of Lachnospiraceae in cattle protects the intestine and acts as a barrier that favors the adaptation of the host to its environment; it also promotes a decrease in the incidence of intestinal diseases(26)
Ruminococcaceae
Rev Mex Cienc Pecu 2022;13(4):910 927 915 can be related to the type of diet(37), geographical differences(26), and the environment in which they are distributed(38). Nevertheless, this information can only be confirmed by developing specific studies in this respect.

Figure 2: Relative abundance (%) of fecal bacteria taxa (family level) from three samples of Bos taurus at the Mohovano de las Lilas locality. Only the first 10 more abundant families are shown
From 281 classified genera found in this study, 36.6 % have a taxonomic name; this percentage is higher than the reported by Kim and Wells(44) in feces of cattle where only 110 generawereclassified,and about 41 %ofthetotal sequences couldn’t beassignedto aknown genus (Figure 3). Nevertheless, the results showed here increase the number of genera of the B. taurus fecal microbiota previously reported (12,45,46) , who confirmed that the fecal bacterial microbiota is extremely diverse in cattle, and has not yet fully described. Sporobacter was the most abundant genus found in the fecal samples of cattle in this study. This genus was reported in alpaca(47) , deer sika(28), horse(48) , donkey(49) , and the Bolson tortoises Gopherus flavomarginatus(19) This genus is related to digestion of plant ligno cellulosic matter; however relativelylittleis knownabout the roleof this bacteria in the degradation process(50) .
Rev Mex Cienc Pecu 2022;13(4):910 927 916
Durso et al(51) reported Faecalibacterium, Ruminococcus, Roseburia, and Clostridium as important components of the fecal bovine microbiota. These genera were also determined in the present study. According to some studies(52,53) these bacteria constitute 50 to 70 % of the total number of microorganisms in the digestive system of ruminants. These animals have specific gut microbial taxa as they are dependent on these bacteria to extract energy and nutrients from food(54) , besides having specialized anatomical and physiological adaptations to the cellulolytic fermentation of low nutrition high fiber vegetal material(55) . The presence of other bacterial genera reported in this study could be the result of environmental and genetic factors, age, breed, diet, phylogeny, among others(56,57,58) . Recently(56,59,60) , was demonstrated that herbivorous animals have the most diverse microbiota since they depend on microbial metabolic pathways to maximize energy and nutrient extraction from feeding(61) .

Figure 3: Heatmap of Bos taurus fecal bacteria sample at genus level at the Mohovano de las Lilas locality. Only the first 40 more abundant genera are shown
Rev Mex Cienc Pecu 2022;13(4):910 927 917

Rev Mex Cienc Pecu 2022;13(4):910 927 918
Although the gut microbiome usually remains stable over time assisting as a defense system against pathogens and other disease causing agents in the host, the disturbance of this community can lead to animal disease(62,63) . In the present study, the samples collected were obtained from apparently healthy bovines. However, bacteria considered of veterinary importance were found in these animals; this could be a potential health risk because they are carriers of these microorganisms. For example, Campylobacter, Clostridium, Corynebacterium and Fusobacterium were found in the fecal samples. These genera have been associated with cattle disease Campylobacter has been reported as a cause of infertility and abortion in ruminants(64,65); also represents a critical threat to public health, because it can be transmitted from cattle to humans(66,67,68) Clostridium has been reported causing diseases and death in ruminants, especially in cattle; examples are respiratory diseases(69) , botulism(70) and the blackleg(71) Corynebacterium has been reported in beef and dairy cattle associated with renal disease(72) , mastitis(73,74) , and tuberculosis(75,76,77); also, it is considered as an important emergent pathogen for humans(78) . Finally, Fusobacterium was reported by others(79 82) , causing abscesses in cattle. It is important to develop other studies that provide information on the pathogenicity and dynamics of these potential pathogens in the bovines of the Mapimi reserve. At species level, Pseudobacteroides cellulosolvens and Campylobacter fetus were registered in the present study. Pseudobacteroides cellulosolvens is anaerobic bacteria that degrade plant cell wall polysaccharides and cellulosic, being capable of using cellulose or cellobiose as a sole carbon source(83) . Campylobacter fetus is a relevant species; the main reservoirs of this bacteria are both the intestinal and the genital tracts in cattle and sheep(64,65). This species causes spontaneous abortion andinfertilityin cattle,whileit is also anopportunisticpathogen to humans(84) . Due to the free grazing management in the Mapimi Reserve, the bovine feces remain over the soil until natural processes degrade them. Consequently, native fauna can be in contact with these feces, increasing the probability of interspecific transmission of some bacteria(85) . Althoughit has been previouslyreportedthat therearenoevidenceofcross parasiteinfection between cattle and mule deer in the Mapimi Biosphere Reserve(86), it is important to clarify whether this same scenario occurs for bacteria. McAllister and Topp(87) estimate that about 77 % of the pathogens that usually infect livestock can also affect wildlife. However, also wildlife is considered an important source of microorganisms that could cause infectious diseases to domestic animals and humans(88,89). For these reasons, it is important to develop studies focused on risk management at the interface of domestic species and native fauna, considering the implications for the transmission of microorganisms with pathogenic potential(88,89) This information could lead to establish microbiological control strategies for wild fauna populations and livestock within the area.
The authors declare that they have no conflict of interest.
Acknowledgments
Conflict of interest
Conclusions and implications
Rev Mex Cienc Pecu 2022;13(4):910 927 919
Information about the bovine fecal microbiota under extensive grazing conditions is scarce. From economic, ecological and health perspectives, it is crucial to determine the bacterial diversity from phyla to species , in the intestine of domestic ruminants. The present study is the first insight into the fecal bacterial composition of bovines in the Mapimi Biosphere Reserve in Mexico using next generation sequencing. This information significantlyexpands the knowledge about the composition and abundance of bacteria that are part of the microbiological community of the bovine intestine. In this case, the approach was through the analysis of feces in free grazing cattle. Although a large number of bacterial taxa were reported from the collected samples, it was not possible to determine the genus or species of some bacteria, so it is still necessary to go further into the taxonomyusing specific molecular markers. However, the results obtained in the present studycould be used as a bacteriological baseline for monitoring the grazing bovine intestinal health status, and to trace possible interactions with the fecal microbiota of native roaming wildlife in the area. Finally, it is important to emphasize that the next generation massive sequencing is a very effective technique that simplifies the analysis of complete bacterial communities; therefore, complementary studies on the microbiota in this and other bovine populations in Mexico are warranted.
To S.I. Barraza Guerrero, D. Acosta Astorga and R. Zapata Fernández for their support in the fieldwork. The owners of the Mohovano de las Lilas locality gave their authorization to take bovine fecal samples.
Rev Mex Cienc Pecu 2022;13(4):910 927 920
1. Haley BJ, Pettengill J, Gorham S, Ottesen A, Karns JS, Van Kessel JAS. Comparison of microbial communities isolated from feces of asymptomatic Salmonella shedding and non Salmonella shedding dairy cows. Front Microbiol 2016;(7):691.
4. Bell GP, Yanoff S, Karges J, Montoya JA, Najera S, Arango AM, et al. Conservation blueprint for the Chihuahuan Desert ecoregion. In: Hoyt CA, Karges J editors. Proc Sixth Symp Natur Resour Chihuahuan Desert Region The Chihuahuan Desert Research Institute, For Davis, TX; 2014:1-36.
5. Barral H. El hombre y su impacto en los ecosistemas a través del ganado. En: Montaña C editor. Estudio integrado de los recursos vegetación, suelo y agua en la Reserva de la Biosfera de Mapimí, I. Ambiente natural y humano. México, DF Instituto de Ecología, AC. 1988:241 268.
2. Kim M, Kuehn LA, Bono JL, Berry ED, Kalchayanand N, Freetly HC, et al. The impact of the bovine faecal microbiome on Escherichia coli O157: H7 prevalence and enumeration in naturally infected cattle. J Appl Microbiol 2017;123(4):1027 1042.
6.Álvarez RomeroJ,MedellínRA. Bos taurus.En:MedellínRA, et al.editores.Vertebrados superiores exóticos en México: diversidad, distribución y efectos potenciales. Proyecto U020. Instituto de Ecología, Universidad Nacional Autónoma de México. México. D.F. Bases de datos SNIB CONABIO; 2005.
Literature cited:
3. SEMARNAT CONANP. Secretaría de Medio Ambiente y Recursos Naturales Comisión Nacional de Áreas Naturales Protegidas). Programa de Conservación y Manejo Reserva de la Biosfera Mapimí, México. 1ª ed, México DF: Editorial EDM; 2006.
7. Clemmons BA, Martino C, Schneider LG, Lefler J, Embree MM, Myer PR. Temporal stability of the ruminal bacterial communities in beef steers. Scientific Reports 2019;9(1):1 8.
8. O'Hara E, Neves AL, Song Y, Guan LL. The role of the gut microbiome in cattle production and health: driver or passenger? Ann Rev Anim Biosciences 2020;(8):99 220.
9. Mackie RI. Mutualistic fermentative digestion in the gastrointestinal tract: diversity and evolution. Integrat Comparat Biol 2002;42(2):319 326
10. Madden RH, Murray KA, Gilmour A. Carriage of four bacterial pathogens by beef cattle in Northern Ireland at time of slaughter. Lett Appl Microbiol 2006;44(2):115 119.
17. Illumina. 16S Metagenomic Sequencing Library Preparation, Preparing 16S Ribosomal RNA Gene Amplicons for the Illumina MiSeq System. 2020. 16shttps://support.illumina.com/documents/documentation/chemistry_documentation/16s/metagenomiclibraryprepguide15044223b.pdf.AccessedMay11,2021.
Rev Mex Cienc Pecu 2022;13(4):910 927 921
16. Klindworth A, Pruesse E, Schweer T, Peplies J, Quast Ch, Horn M, et al. Evaluation of general 16S ribosomal RNA gene PCR primers for classical and next generation sequencing based diversity studies. Nucleic Acids Res 2013;41(1):e1 e1.
18. Illumina. Nextera XT DNA Library Prep Kit Reference Guide. 2021.xterasupport/documents/documentation/chemistry_documentation/samplepreps_nextera/nehttps://support.illumina.com/content/dam/illuminaxt/nexteraxtlibraryprepreferenceguide1503194205.pdfAccessedMay11,
11. Febriani Y, Levallois P, Lebel G, Gingras S. Association between indicators of livestock farming intensity and hospitalization rate for acute gastroenteritis. Epidemiol Infect 2009;137(8):1073 1085.
15. Cornet A. Principales caractéristiques climatiques. En: Montaña C editor. Estudio integrado de los recursos vegetación, suelo y agua en la Reserva de la Biosfera de Mapimí. Publicación 23 Instituto de Ecología AC. México, DF. 1988:45 76.
19. García De la Peña C, Garduño Niño E, Vaca Paniagua F, Díaz Velásquez C, Barrows CW, Gomez Gil B, et al. Comparison of the fecal bacterial microbiota composition between wild and captive bolson tortoises (Gopherus flavomarginatus). Herpetol Conserv Biol 2019;14(3):587 600.
12. Callaway TR, Dowd SE, Edrington TS, Anderson RC, Krueger N, Bauer N, et al. Evaluation of bacterial diversity in the rumen and feces of cattle fed different levels of dried distillers grains plus solubles using bacterial tag encoded FLX amplicon pyrosequencing. J Anim Sci 2010;88(12):3977 3983.
14. NAM National Academy of Medicine. Guide for the care and use of laboratory animals. Co Produced by the National Academy of Medicine Mexico and the Association for Assessment and Accreditation of Laboratory Animal Care International, 1st ed. Harlan: Mexico City, Mexico. 2010.
20. Caporaso JG, Kuczynski J, Stombaugh J, Bittinger K, Bushman FD, Costello EK, et al. QIIME allows analysis of high throughput community sequencing data. Nat Methods 2010;(7):335.
13. FAS, Guide for the care and use of agricultural animals in agricultural research and teaching, 3rd ed.; Feder Anim Sci Soc. Champaing, IL, USA. 2010.
32. Steelman SM, Chowdhary BP, Dowd S, Suchodolski J, Janečka JE. Pyrosequencing of 16S rRNA genes in fecal samples reveals high diversity of hindgut microflora in horses and potential links to chronic laminitis. BMC Vet Res 2012;8(1):231.
27. Li Y, Ma S, Zhang X, Huang S, Yang H, Zhao F, et al. Evaluation of bacterial and archaeal diversity in the rumen of Xiangxi yellow cattle (Bos taurus) fed Miscanthus sinensis or common mixed feedstuff. Ann microbiol 2014;64(3):1385 1394.
21. Zhang J, Kobert K, Flouri T, Stamatakis A. PEAR: a fast and accurate Illumina Paired End reAd merger. Bioinformatics 2014;(30):614 620.
23. Yoon SH, Ha SM, Kwon S, Lim J, Kim Y, Seo H, Chun J. Introducing EzBioCloud: a taxonomically united database of 16S rRNA and whole genome assemblies. Int J Syst Evol Microbiol 2017;(67):1613 16 17.
25. Magurran A. Measuring biological diversity. Blackwell Science Ltd. Blackwell Publishing company. UK Copyright, Designs, and Patents Act 1988. 2004:100 130.
22. Edgar RC. Search and clustering orders of magnitude faster than BLAST. Bioinformatics 2010;26 (19):2460 2461.
28. O' Donnell MM, Harris HBB, Ross RP, O’Toole PW. Core fecal microbiota of domesticated herbivorous ruminant, hindgut fermenters, and monogastric animals. Microbiologyopen 2017;6(5):e00509.
29. Li Y, Hu X, Yang S, Zhou J, Qi L, Sun X, et al. Comparison between the fecal bacterial microbiota of healthy and diarrheic captive musk deer. Front Microbiol 2018;(9):300.
33. Menke S, Heurich M, Henrich M, Wilhelm K, Sommer S. Impact of winter enclosures on the gut bacterial microbiota of red deer in the Bavarian Forest National Park. Wildl Biol 2019;8(1):1 10.
31. Rudi K, Moen B, Sekelja M, Frisli T, Lee MR. An eight year investigation of bovine livestock fecal microbiota. Vet Microbiol 2012;160(3 4):369 377.
24. Weiss S, Xu ZZ, Peddada S, Amir A, Bittinger K, Gonzalez A, et al. Normalization and microbial differential abundance strategies depend upon data characteristics. Microbiome 2017;5(1):27.
26. Aricha H, Simujide H, Wang C, Zhang J, Lv W, Jimisi X, et al. Comparative analysis of fecal microbiota of grazing Mongolian cattle from different regions in Inner Mongolia, China. Animals 2021;11(7):1938.
Rev Mex Cienc Pecu 2022;13(4):910 927 922
30. Li Y, Shi M, Zhang T, Hu X, Zhang B, Xu S, et al. Dynamic changes in intestinal microbiota in young forest musk deer during weaning. Peer J 2020;(8):e8923.
Rev Mex Cienc Pecu 2022;13(4):910 927 923
34. Wang X, Chen Y, Shang Y, Wu X, Wei Q, Chen J, et al. Comparison of the gut microbiome in red deer (Cervus elaphus) and fallow deer (Dama dama) by high throughput sequencing of the V3 V4 region of the 16S rRNA gene. Sci Asia 2019;45(6):515 524. 35.ZhangZ,YangL,HeY,LuoX,ZhaoS,JiaX.Compositionoffecalmicrobiotaingrazing and feedlot angus beef cattle. Animals 2021;11(11):3167. 36. Deepthi M, Arvind K, Saxena R, Pulikkan J, Shamjana U, Vineet KS, Grace T. Fecal microbiota analysis exploring taxonomic diversity of hindgut microbial communities in kasaragod dwarf and Holstein Friesian cattle. 2021. Research Square, doi: https://doi.org/10.21203/rs.3.rs 732782/v1. 37. Lau SKP, Teng JLL, Chiu TH, Chan E, Tsang AKL, Panagiotou G, Zhai SL, et al. Differential microbial communities of omnivorous and herbivorous cattle in southern China. Comput Struct Biotechnol J 2018;16:54 60. 38. Ming L, Yi L, Siriguleng, Hasi S, He J, Hai L, et al. Comparative analysis of fecal microbial communities in cattle and Bactrian camels. PLoS One 2017;12(3):e0173062.
39. Donaldson GP, Lee SM, Mazmanian SK. Gut biogeography of the bacterial microbiota. Nat Rev Microbiol 2016;14(1):20 32. 40. Rainey FA. Orden Clostridiales, In: DeVos P, et al. editors. Bergey’s manual of systematic bacteriology. Second ed. Springer, Dordrecht, Heidelber, London, New York. Volume three. The Firmicutes 2009:736-1191. 41. La Reau AJ, Meier Kolthoff JP, Suen G. Sequence based analysis of the genus Ruminococcus resolves its phylogeny and reveals strong host association. Microb Genom 2016:2(12). 42. Rainey FA. Family V. Lachnospiraceae fam. nov. In: DeVos P, et al. editors. Bergey’s manual of systematicbacteriology.Second ed.Volume 3.The Firmicutes. London,New York: Springer, Dordrecht, Heidelber; 2009:921 968. 43. Hamer HM, Jonkers D, Venema K, Vanhoutvin, S, Troost FJ, Brummer RJ. Review article: The role of butyrate on colonic function. Aliment Pharm Therapy 2008;(27): 104 119. 44. Kim M, Wells JE. A meta analysis of bacterial diversity in the feces of cattle. Curr Microbiol 2015;72(2):145-151. 45. Kim M, Kim J, Kuehn LA, Bono JL, Berry ED, Kalchayanand N, et al. Investigation of bacterial diversity in the feces of cattle fed different diets. J Anim Sci 2014;92(2):683 694.
46.
Rev Mex Cienc Pecu 2022;13(4):910 927 924 ZhangZ,YangL,HeY,LuoX,ZhaoS,JiaX.Compositionoffecalmicrobiotaingrazing and feedlot angus beef cattle Animals 2021;11(11):3167.
48. Shepherd ML, Swecker Jr WS, Jensen RV, Ponder MA. Characterization of the fecal bacteria communities of forage fed horses by pyrosequencing of 16S rRNA V4 gene amplicons. FEMS Microbiol Lett 2012;326(1):62 68. 49. Liu X, Fan H, Ding X, Hong Z, Nei Y, Liu Z, et al. Analysis of the gut microbiota by high throughput sequencing of the V5 V6 regions of the 16S rRNA gene in donkey. Curr Microbiol 2014;68(5):657 662. 50. Grech‐Mora I, Fardeau ML, Garcia JL, Ollivier B. Sporobacter. Bergey's Manual of systematics of archaea and bacteria online. John Wiley & Sons, Inc., in association with Bergey’s Manual Trust JL 2015:1 6. 51. Durso LM, Harhay GP, Smith TP, Bono JL, DeSantis TZ, Harhay DM, et al. Animal-toanimal variation in fecal microbial diversity among beef cattle. Appl Environ Microbiol 2010;76(14):4858 4862. 52.WangL, ZhangK, ZhangC,FengY, ZhangX, WangX, et al. Dynamics and stabilization of the rumen microbiome in yearling Tibetan sheep. Sci Rep 2019;9(1):1 9. 53. Mamun MAA, Sandeman M, Rayment P, Brook Carter P, Scholes E, Kasinadhuni N, et al. The composition and stability of the faecal microbiota of merino sheep. J Appl Microbiol 2019;128(1):280 291. 54. Dearing MD, Kohl KD. Beyond fermentation: other important services provided to endothermic herbivores by their gut microbiota. Integr Comp Biol 2017;57(4):723 731. 55. De Tarso SGDS, Oliveira D, Afonso JAB. Ruminants as part of the global food system: how evolutionary adaptations and diversity of the digestive system brought them to the future. J Dairy Vet Anim Res 2016;3(5):00094. 56. LeyRE, HamadyM, Lozupone C, Tumbaugh PJ, RameyRR, Bircher JS, et al. Evolution of mammals and their gut microbes. Science 2007;(320):1647 1651. 57. Szeligowska N, Cholewińska P, Czyż K, Wojnarowski K, Janczak M. Inter and intraspecies comparison of the level of selected bacterial phyla in in cattle and sheep based on feces. BMC Vet Res 2021;17(1):1 9
47. Rodríguez J, Carcelen F, Agapito J, Barreto T, Rodríguez C, San Martín F. Identificación preliminar de microflora bacteriana en el compartimiento 1 del sistema digestivo en alpacas (Vicugna pacos). Informe Científico Tecnológico 2009;(9):63 165.
65. Rush JB, Edmondson MA. Infectious agents: Campylobacter. In: Hopper RM editor. Bovine reproduction. Second ed USA: John Wiley & Sons, Inc; 2021;717 724. 66. An JU, Ho H, Kim J, Kim WH, Kim J, Lee S, et al. Dairy cattle, a potential reservoir of human campylobacteriosis: epidemiological and molecular characterization of Campylobacter jejuni from cattle farms. Front Microbiol 2018;(9):3136.
61. Milani C, Alessandri G, Mancabelli L, Mangifesta M, Lugli GA, Viappiani A, et al. Multi omics approaches to decipher the impact of diet and host physiology on the mammalian gut microbiome. Appl Environ Microbiol 2020; 86(23):e01864 20.
58. Zhu L, Wang J, Bahrndorff S. The wildlife gut microbiome and its implication for conservation biology Front Microbiol 2021;12:1617.
62. Kamada N, Chen GY. Inohara N, Núñez G. Control of pathogens and pathobionts by the gut microbiota. Nat Immunol 2013;14(7):685 690.
63.WolfJF,KrissKD,MacAulayKM,MunroK,PattersonBR,ShaferAB. Gutmicrobiome composition predicts summer core range size in two divergent ungulates. FEMS Microbiol Ecol 2021;97(5):fiab048. 64. Sahin O, Yaeger M, Wu Z, Zhang Q. Campylobacter associated diseases in animals. Annu Rev Anim Biosci 2016;5:21 42.
68. Inglis GD, Gusse JF, House KE, Shelton TG, Taboada EN. Clinically relevant Campylobacter jejuni subtypes are readily found and transmitted within the cattle production continuum but present a limited foodborne risk. Appl Enviro Microbiol 2020; 86(6): e02101-19.n. 69. Elgioushy M, Rizk MA, El Adl M, Elhadidy M, El Khodery S. The first molecular detection of Clostridium perfringens from pneumonic cases associated with foot and mouth disease in cattle and buffalo in Egypt. Trop Anim Health Prod 2018;51(4):847 852.
Rev Mex Cienc Pecu 2022;13(4):910 927 925
59. Muegge BD, Kuczynski J, Knights D, Clemente JC, Gonzãlez A, Fontana L, et al. Diet drives convergence in gut microbiome functions across mammalian phylogeny and within humans. Science 2011;332:970 974.
67. Ocejo M, Oporto B, Hurtado A. Occurrence of Campylobacter jejuni and Campylobacter coli in cattle and sheep in northern Spain and changes in antimicrobial resistance in two studies 10 years apart. Pathogens 2019;8(3):98.
60. Zoelzer F, Burger AL, Dierkes PW. Unraveling differences in fecal microbiota stability in mammals: from high variable carnivores and consistently stable herbivores. Anim Microbiome 2021;3(1):77.
71. Wolf R, Hiesel J, Kuchling S, Deutz A, Kastelic J, Barkema HW, et al. Spatial-temporal cluster analysis of fatal Clostridium chauvoei cases among cattle in Styria, Austria between 1986 and 2013. Prev Vet Med 2017;138:134 138.
76. Ghebremariam MK, Michel AL, Vernooij JCM, Nielen M, Rutten VP. Prevalence of bovine tuberculosis in cattle, goats, and camels of traditional livestock raising communities in Eritrea. BMC Vet Res 2018;14(1):1-13.
72. Smith JS, Krull AC, SchleiningJA, Derscheid RJ, Kreuder AJ. Clinical presentations and antimicrobial susceptibilities of Corynebacterium cystitidis associated with renal disease in four beef cattle. J Vet Inter Med 2020;34(5):2169 2174. 73.Achollah AM, KaranjaDN, Ngâ CJ,Bebora LC. Causes of organ condemnations in cattle at slaughter and associated financial losses in Siaya County, Kenya. J Vet Med Anim Health 2020;12(2):27 35.
80. Amachawadi RG, Tom WA, Hays MP, Fernando SC, Hardwidge PR, Nagaraja TG. Bacterial community analysis of purulent material from liver abscesses of crossbred cattle and Holstein steers fed finishing diets with or without tylosin. J Anim Sci 2021;99(4):skab076.
75. Borja E, Borja LF, Prasad R, Tunabuna T, Toribio JAL. A retrospective study on bovine tuberculosis in cattle on Fiji: Study findings and stakeholder responses. Front Vet Sci 2018;(5):270.
79. Amachawadi RG, Nagaraja TG. Liver abscesses in cattle: A review of incidence in Holsteins and ofbacteriologyand vaccine approaches to control in feedlot cattle. J Anim Sci 2016;94(4):1620 1632.
70. Mariano V, Nardi A, Gradassi S, De Santis P, Anniballi F, Bilei S. A severe outbreak of botulism in cattle in Central Italy. Vet Ital 2019;55(1):57 62.
77. Kuria JK. Diseases caused by bacteria in cattle: tuberculosis. In bacterial cattle diseases. Kaoud HA (IntechOpen) editor. 2019. London: IntechOpen; 2019. https://www.intechopen.com/chapters/64814
81. Aguiar Veloso V, Drouillard JS. On the potential role of dietary lysine as a contributing factor in development of liver abscesses in cattle. Front Vet Sci 2020;(7):733.
doi: 10.5772/intechopen.82051
Rev Mex Cienc Pecu 2022;13(4):910 927 926
74. Kirkeby C, Halasa T, Farre M, Chehabi GN, Græsbøll K. Transmission dynamics of Corynebacterium spp. within two Danish Dairy Cattle herds. Front Vet Sci 2021;977.
78. Hacker E, Antunes CA, Mattos Guaraldi AL, Burkovski A, Tauch A. Corynebacterium ulcerans, an emerging human pathogen. Future microbiol 2016;11(9);1191 1208.
85. Siembieda JL, Kock RA, McCracken TA, Newman SH. The role of wildlife in transboundary animal diseases. Anim Health Res Rev 2011;12(1):95 111. 86. Cossío Bayúgar A, Romero E, Gallina S, Suzán G, Ibáñez Bernal S. Variation of gastrointestinal parasites in mule deer and cattle in Mapimí biosphere reserve, Mexico. Southwest Nat 2015;60(2 3):180 185. 87. McAllister TA. Topp E. Role of livestock in microbiological contamination of water: commonly the blame, but not always the source. Anim Front 2012;2(2):17 27.
Rev Mex Cienc Pecu 2022;13(4):910 927 927 82. Pillai DK, Amachawadi RG, Baca G, Narayanan SK, Nagaraja TG. Leukotoxin production by Fusobacterium necrophorum strains in relation to severity of liver abscesses in cattle. Anaerobe 2021;(69):102344. 83. Zhivin O, Dassa B, Moraïs S, Utturkar SM, Brown SD, Henrissat B, et al. Unique organization and unprecedented diversity of the Bacteroides (Pseudobacteroides) cellulosolvens cellulosome system. Biotechnol Biofuels 2017;10(1):1 19. 84. Duncan JS, Leatherbarrow AJH, French NP, Grove White DH. Temporal and farm management associated variation in faecal pat prevalence of Campylobacter fetus in sheep and cattle. Epidemiol Infect 2014;142(6):1196 1204.
89. Espunyes J, Cabezón O, Dias Alves A, Miralles P, Ayats T, Cerdà Cuéllar M. Assessing the role of livestock and sympatric wild ruminants in spreading antimicrobial resistant Campylobacter and Salmonella in alpine ecosystems. BMC Vet Res 2021;17(1):1 8.
88. Gortázar C, Ferroglio E, Höfle U, Frölich K, Vicente J. Diseases shared between wildlife and livestock: A European perspective. Eur J Wildl Res 2007;53(4):241 256.
928 https://doi.org/10.22319/rmcp.v13i4.6042Article
Phytochemical profile, antimicrobial and antioxidant activity of extracts of Gnaphalium oxyphyllum and Euphorbia maculata native to Sonora, Mexico Priscilia Yazmín Heredia Castro a Claudia Vanessa García Baldenegro a Alejandro Santos Espinosa a Iván de Jesús Tolano Villaverde a Carmen Guadalupe Manzanarez Quin b Ramón Dolores Valdez Domínguez c Cristina Ibarra Zazueta c Reyna Fabiola Osuna-Chávez c Edgar Omar Rueda Puente c Carlos Gabriel Hernández Moreno c Susana Marlene Barrales Heredia c Jesús Sosa Castañeda c* a Universidad Estatal de Sonora (UES). Ingeniería en Horticultura. Sonora, México. b Centro de Investigación en Alimentación y Desarrollo A. C. (CIAD, A. C.) Tecnología de Alimentos de Origen Animal. Sonora, México. c Universidad deSonora(UNISON).Departamento deAgricultura yGanadería.Carretera 100 a Bahía de Kino km 21, 83000. Sonora, México. * Corresponding autor: jesus.sosa@unison.mx
Rev Mex Cienc Pecu 2022;13(4):928 942 929 Abstract:
Accepted: 05/05/2022
Key words: Gnaphalium oxyphyllum, Euphorbia maculata, Antimicrobial activity, Antioxidant, Natural alternative, Food industry.
Introduction Consumer interest in avoiding foods with synthetic chemical compounds has increased due to their potential harm to health. In the scientific community, there is a growing interest in the search for natural strategies for food preservation; as well as in livestock production to prevent recurrent diseases of domestic animals(1). Some of the natural alternatives that have been considered in the food industry and in veterinary medicine include the use of probiotics, bacteriocins, antioxidants and chemical compounds derived from plants(1,2). Considering the above, plant extracts have advantages, since, in some of them, their antioxidant and antimicrobial potential has been shown(3). In this context, Mexico is one of the countries with great plant biodiversity worldwide, ranks fourth with approximately 31,000 different species of plants. Of these, it is estimated that more than 3,350 are used in the preparation of traditional medicine treatments(4), and in some of
The use of synthetic chemical compounds to preserve foods or treat diseases of bacterial origin is limited because they can cause health damage. Therefore, the food and livestock industries seek natural strategies to preserve foods and preserve the health of animals intended for human consumption. In this sense, some extracts of plant from Sonora, Mexico could be an alternative due to the great diversity of plants and the fact that some of them are traditionally used to treat diseases. On the other hand, there are few studies that support the biological activity of ethanolic extracts of Gnaphalium oxyphyllum (E1) and Euphorbia maculata (E2). In this study, phytochemical content was determined by spectrophotometry, antimicrobial activity was determined by agar diffusion and antioxidant activity was evaluated by ABTS, DPPH and FRAP. The results showed that the E1 and E2 extracts had total phenols, total flavonoids, flavones and flavonols, total flavanones and dihydroflavonols, as well as total tannins, total chlorogenic acid and total polysaccharides. In addition, both extracts showed higher antimicrobial activity against Listeria monocytogenes ATCC 19115, Staphylococcus aureus ATCC 25923, Escherichia coli ATCC 25922 and Salmonella enterica serovar Typhimurium ATCC 14028 when 1 mg ml 1 was used (P<0.05). In addition, they presented antioxidant activity by the methods of ABTS, DPPH and FRAP. Therefore, the antimicrobial and antioxidant potential of these plants represents a natural alternative to control some Gram positive and Gram negative bacteria in the livestock industry, as well as for food preservation.
Received: 16/08/2021
Rev Mex Cienc Pecu 2022;13(4):928 942 930 these plants, it has been seen that they have the same active ingredient that is used in the preparation of commercial drugs(5). However, the studies carried out with plants native to Mexico are incipient since phytochemical compounds and their biological activity lack scientific evidence of their activity. In addition, there are few scientific studies that have characterized the antimicrobial activity of plants native to Sonora, Mexico(6 9) and those that evaluatetheirantioxidantactivityare veryfew.Particularly, Gnaphalium oxyphyllum is a plant known as “Gordolobo” in Sonora and is endemic to northwestern Mexico. It is traditionally used in the treatment of some conditions, such as flu, asthma, cough, fever, bronchitis, swelling, stomach diseases, wounds, low back pain, in the prevention of malaria and urinary tract problems derived from prostatitis and neuritis. As well as for angina pain, antipyretic and to lower blood pressure(10,11). In addition, its abilityto inhibit the growth of some pathogenic bacteria and fungi has been demonstrated(11,12). However, the antimicrobial and antioxidant activity of the ethanolic extracts of this plant has not been evaluated(11). On the other hand, Euphorbia maculata is a plant native to northwestern Mexico, locally known as “Golondrina”. It is traditionally used to treat stomach upsets and eye problems, in addition, in Chinese medicine it is used in blood disorders such as hematuria, hemoptysis, epistaxis and hemafecia, for the treatment of anthrax and some wounds. However, the antimicrobial, antifungal and antioxidant activity has been poorly documented, and there are no studies that evaluate its antimicrobial potential in ethanolic extracts(13,14). The evidence indicates that these plants are of high biological value, but they have been little studied and have not been harvested in Sonora, Mexico, so the biological activity of the plants can be compromised, because their phytochemical profile can vary depending on factors such as altitude, cultivation site, agronomic and environmental conditions in which they grow(15). Therefore, and considering that plants can also be used as a food supplement(16), it is interesting to evaluate the nutritional value, antimicrobial, antioxidant activity and phytochemical profile of these plants grown in Sonora, Mexico.
Material and methods Preparation of ethanolic extracts
The extracts were obtained from Gnaphalium oxyphyllum (E1) and Euphorbia maculata (E2), the plants were harvested at the Department of Agriculture and Livestock (DAG, for its acronym in Spanish) of the University of Sonora (DAG UNISON). The stems and leaves ofeach plant were dehydratedat 34°C in ahot airoven(Thelco,PrecisionScience, model 28, USA). The dehydrated plant material was then pulverized in a mill (Pulvex Mini 100, Mx) to a particle size of 100 microns. Subsequently, 100 g of the pulverized plant material was mixed with 100 ml of 99 % purity ethanol (Sigma Aldrich, St. Louis MO) in an amber glass bottle and stored for 5 d(17). Finally, the extracts were filtered with
Whatman No. 41 filter paper and the remaining alcohol in the plant material was evaporated. The yield was calculated by difference in weight of the plant material, and finally, the ethanolic extracts were stored at 4 °C in the dark.
Antimicrobial activity of ethanolic extracts
The contents of total phenols and total flavonoids were quantified by the methodologies used by Al Rifai et al(18) and the data were expressed as milligrams of gallic acid equivalentpergramofextract(mgGAEq.g 1)fortotalphenols,whilefortotalflavonoids, the data were expressed as milligrams of quercetin equivalent per gram of extract (mg QEq. g 1). The content of flavones and flavonols, as well as the content of total flavanones and dihydroflavonols were determined following the methodologies proposed by Popova et al(19) and the results were expressed as milligrams of hesperetin equivalent per gram of extract (mg HEq. g 1). The total tannin content was determined by the methodology reported by Price and Butler(20) and the results were expressed in milligrams of catechin equivalent per gram of extract (mg CEq. g 1), while the chlorogenic acid content was quantified following the methodology reported by Griffiths et al(21), where the results were expressed as milligrams of chlorogenic acid per gram of extract (mg CA g 1).
The Gram positive bacteria Listeria monocytogenes ATCC 19115 and Staphylococcus aureus ATCC 25923, and the Gram negative bacteria Escherichia coli ATCC 25922 and Salmonella enterica serovar Typhimurium ATCC 14028, from the Laboratory of Microbiology of the Department of Chemical Biological Sciences of the University of Sonora, were used. The bacteria were reactivated in BHI (brain heart infusion, BD Difco, Sparks, MD) broth culture medium, and two plates with BHI (brain heart infusion, BD Difco, Sparks, MD) agar were used for each bacterium. Four sterile discs of Whatman No. 41 filter paper of 6 mm in diameter were then placed on each plate and 20 μL of ethanolic extract was added to each disc. Subsequently, the plates were incubated at 37 °C for 24 h and antimicrobial activity was measured in inhibition halos, where halos greater than 3 mm were considered as inhibition(23) .
Rev Mex Cienc Pecu 2022;13(4):928 942 931
Finally, the total polysaccharide content was determined by the methodology reported by DuBois et al(22) and the data were expressed as milligrams of glucose equivalent per gram of extract (mg GEq. g 1). Calibration curves were used in all determinations and absorbances were read on a spectrophotometer (Spectro Max MD, EU).
Phytochemical profile of ethanolic extracts
The amount of calcium (Ca), magnesium (Mg), sodium (Na) and potassium (K) from each plant was determined on a model 5000 flame atomic absorption spectrophotometer (PerkinElmer®, CT, USA)(25), while the phosphorus concentration (P) was determined by a colorimetric method of ammonium molybdovanadate in a model 3030 spectrophotometer (PerkinElmer®, CT, USA)(26). The results were expressed in grams per 100 grams of dry matter (g 100 g 1).
2,2'-azinobis-3-ethyl-benzothiazoline-6-sulfonic acid (ABTS) radical inhibition method
Physicochemical analysis of plants
Determination of minerals in plants
The concentrations of each extract were adjusted to 0.1, 0.5, 1.0 and 2.0 mg ml 1, then 1 ml of each extract was mixed with 2 ml of a methanolic solution prepared with the 2,2 diphenyl 1 picrylhidrazyl (DPPH●) radical at a concentration of 1 x 10 4 M. The mixture was left to react for 16 min in the dark at room temperature. Finally, the absorbance was measured in a spectrophotometer (Spectro Max MD, EU) at a wavelength of 517 nm and the DPPH● solution was used as control(27)
2,2 diphenyl 1 picrylhydrazyl (DPPH) radical inhibition method
The analytical methods of the AOAC(24) were used. Total solids were determined by the oven drying method (990.19); ashes bythe gravimetric method (945.46); crude fat by the ether extraction method (920.39); crude protein by the micro Kjeldahl method (991.20) and moisture by numerical difference. The data were expressed in grams per 100 grams of dry matter (g 100 g 1). Additionally, the pH was measured with an electronic potentiometer (Hanna Instruments pH 211, Cluj, Romania).
Rev Mex Cienc Pecu 2022;13(4):928 942 932
A mixture in 1:1 ratio (v/v) of the 2,2'-azinobis-3-ethyl-benzothiazoline-6-sulfonic acid (ABTS●+) radical (7 mM) and potassium persulfate (4.95 mM) was prepared and kept in the dark for 16 h at room temperature. The mixture was then diluted with methanol until an absorbance of 1 to 1.5 was obtained. Next, 0.1 mL of each extract was mixed at different concentrations (0.1, 0.5, 1.0 and 2.0 mg mL 1) with 3.9 ml of the ABTS●+
The FRAP reagent was prepared by mixing 10 parts of sodium acetate buffer solution (300 mM) at a pH of 3.6 with one part of TPTZ (10 mM) (2,4,6 tri (2 pyridyl) s triazine) and one part of FeCl3 hexahydrate (20 mM). Then, 0.2 ml of extract was mixed with 3.8 ml of FRAP reagent and the mixture was left to react for 30 min at 37 °C. Finally, absorbance was measured on a spectrophotometer (Spectro Max MD, EU) at a wavelength of 593 nm(27) Statistical analysis
A completely randomized one way experimental design was used at 95 % confidence with three repeats per treatment. The mean comparison test was performed by Tukey Kramer at a significance level of 0.05 and the Pearson correlation coefficient was performed with 95 % confidence. The statistical software used was NCSS version 11.
Results and discussion
The results of the proximate analysis of the plants showed in E2 higher moisture, less total solids and ashes with respect to the E1plant (P<0.05) (Table 1),while nodifferences were found in the amount of fat and protein of both plants (P>0.05). The results in the amount of moisture, total solids and ashes of this study are similar to those found in wild edible plants from Bangladesh and in plants consumed by native tribes of India(28,29). The variability in the results can be attributed to biological, environmental factors or the age of the plants(30). In addition, the moisture content of plants could depend on the humidity and temperature of the environment, as well as on the harvest time of the plant, while the ash content refers to the inorganic part of the plant, which includes salts (phosphates, sulfates,chlorides)andsomeminerals (sodium, potassium,calcium, magnesium,ironand manganese), and their amount may depend on the mineral content of the soil where the plant is established(31). Likewise, plant lipids are mainly found in the form of triacylglycerols, phospholipids, galactolipids and sphingolipids, and their amount is usually very low in plants(30,32,33), which coincides with what is found in the E1 and E2 plants, and with what was reported in plants from Bangladesh and India(28,29,30). Although this studyfound no difference in the amount of lipids between E1 and E2 plants (P>0.05),
Rev Mex Cienc Pecu 2022;13(4):928 942 933 solution. Finally,absorbancevaluesweremeasured onaspectrophotometer(SpectroMax MD, EU) at a wavelength of 734 nm. The ABTS●+ solution was used as control(27) .
Ferric-reducing antioxidant power (FRAP) method
Table 1: Proximate analysis of E1 and E2 plants
The results of the antimicrobial activity showed that the E1 and E2 extracts inhibited the growth of the four evaluated pathogens (P<0.05) and the greatest inhibition occurred when the pathogens were exposed to 1 mg ml 1 of each extract (Table 3). On the other hand, the E1 extract was more efficient in inhibiting S. aureus and L. monocytogenes with respect to the E2 extract (P<0.05), while both extracts did not show differences in inhibition against E. coli and S. enterica serovar Typhimurium. Similar results were reported in hexane extract from Gnaphalium oxyphyllum flowers, which was able to inhibit the growth of S. aureus, B. cereus, E. coli and S. enteric serovar Typhimurium, in addition, the methanolic extract of these flowers inhibited the growth of S. aureus and B. cereus, while the hexane extract of the leaves of Gnaphalium oxyphyllum had antimicrobial activity against S. aureus, B. cereus and E. coli(10). Another study showed that hexane and chloroform extracts from the aerial part of Gnaphalium oxyphyllum inhibited the growth of S. aureus, Streptococcus pneumoniae, Streptococcus pyogenes, Enterococcus faecalis, E. coli and Candida albicans(12). In addition, it has been reported that the hydroethanolic extract from leaves of Euphorbia maculata showed antimicrobial activity against S. aureus(39), while methanolic extracts from other plants of the genus
Likewise, the protein content of E1 and E2 plants was similar to that found in green leafy vegetable plants(35), and it has been reported that the amount of protein in plants may depend on the physiological state, age, environmental conditions and nutrients present in the soil(36). On the other hand, the content of P, Na and K was higher in plant E1 with respect to plant E2 (P<0.05), while the content of Mg was higher in plant E2 (P<0.05), and no differences were found in the content of Ca between both plants (P>0.05) (Table 2). These results are similar to those found in plants from Iran and India(30,37), and it has been reported that the variability in the mineral content of the plants could be related to the mineral composition of the soil, as well as to the geographical area where the plants are established(38)
Table 2: Mineral content of the E1 and E2 plants
Rev Mex Cienc Pecu 2022;13(4):928 942 934 it has been reported that the variation in lipid content may depend on the species and the environmental conditions in which the plant is found(30,34) .
Plant Moisture Total solids Ashes Fat Protein E1 61.53 ± 2.24ª 38.47 ± 2.23a 5.74 ± 0.63a 2.12 ± 0.12a 11.98 ± 0.85a E2 68.22 ± 1.22b 31.78 ± 1.13b 4.56 ± 0.73b 2.05 ± 0.15a 11.17 ± 0.73a E1= Gnaphalium oxyphyllum; E2= Euphorbia maculata; data expressed in g 100 g 1 of dry matter.
Plant Ca P Mg Na K E1 1.12 ± 0.13a 0.33 ± 0.05b 0.21 ± 0.03a 1.63 ± 0.03b 1.23 ± 0.05b E2 1.15 ± 0.14a 0.25 ± 0.03a 0.55 ± 0.02b 1.22 ± 0.33a 1.07 ± 0.33a E1= Gnaphalium oxyphyllum; E2= Euphorbia maculata; data expressed in g 100 g 1 of dry matter. ab Different literal indicates difference between the data in the same column (P<0.05).
ab Different literal indicates difference between the data in the same column (P<0.05).
Total polysaccharides, mg GEq. g 1 257.92±2.19a 236.59±2.16b pH of the extract 5.26 4.18 Extract yield, % 12.24 15.68 E1= Gnaphalium oxyphyllum; E2= Euphorbia maculata. ab Different literal indicates difference between the data in the same column (P<0.05).
Total phenols, mg GAEq. g 1 181.62 ± 0.04a 173.22 ± 0.06b
In this context, the results showed that the content of total phenols, total flavonoids, flavones and flavonols, total chlorogenic acid and total polysaccharides was higher in the E1 extract with respect to E2 (P<0.05) (Table 4), while no difference was found in the content of total flavanones and dihydroflavonols, and total tannins between the extract E1 and E2 (P>0.05). On the other hand, the E1 extract had a pH of 4.18 and the E2 extract had a pH of 5.26, while the yield of the extracts of these plants varied from 12.24 to 15.68 %, respectively.Similarresults werereportedbyRojas et al(12),whoreported yields of 1.76 % and 5.64 % in hexane and chloroform extracts from the Gnaphalium oxyphyllum plant. The differences in the yield of this plant may be due to the polarity of the type of solvent that was used for the extraction of phytochemical compounds. In addition, the variation in the pH of plant extracts may be due to the acidic nature of the compounds present, such as flavonoids, tannins, benzoic acid, oleic acid, stearic acid, lignoceric acid, among others(43). In this sense, it has been reported that, in Gnaphalium oxyphyllum and other species of the genus Gnaphalium, the presence of diterpenoids, flavonoids, acetylene compounds and carotenoids was found(10,44), while in Euphorbia maculata, the presence of polyphenols and flavonoids has been reported(45,46,47), and in other species of Euphorbia, the presence of sesquiterpenes, diterpenes, sterols, flavonoids and other polyphenols has been reported(14)
Total flavanones and dihydroflavonols, mg HEq. g 1 23.68±1.89a 21.58±2.16a
Euphorbia showed antimicrobial activityagainst S. aureus, Bacillus megaterium, Proteus vulgaris, Klebsiella pneumoniae, E. coli, Pseudomonas aeruginosa and Candida albicans, Candida glabrata, Epidermophyton spp. and Trichophyton spp.(40), which is similar to what was found in this study. The antimicrobial activity of the extracts is associated with cell wall damage and decrease in cytoplasmic pH in Gram positive and Gram-negative pathogenic bacteria, in addition, the antimicrobial activity of plants is attributed to a wide variety of secondary metabolites, such as tannins, alkaloids, phenolic compounds, flavonoids, xanthones and hyperforin(41,42) .
Total tannins, mg CEq. g 1 8.21±0.16ª 7.92±0.67a
Table 4: Phytochemical profile, pH and yield of E1 and E2 extracts
Total flavonoids, mg QEq. g 1 114.30 ± 0.05a 103.42 ± 0.04b
Rev Mex Cienc Pecu 2022;13(4):928 942 935
Phytochemicals E1Extracts E2
Flavones and flavonols, mg HEq. g 1 110.15±2.35a 98.33±2.44b
Total chlorogenic acid, mg CA g 1 33.14±1.01a 28.78±1.11b
Rev Mex Cienc Pecu 2022;13(4):928 942 936
Finally, the ABTS, DPPH and FRAP methods are commonly used to measure the antioxidant activity of phenolic compounds because of the high correlation that can be found between them. Therefore, it has been suggested that it is not necessary to apply more than one method to measure the antioxidant activity; however, it has been reported that this is not always the case, due to the nature of the phytochemicals present in plants(27). In this study, a high correlation coefficient (R2) was found between the DPPH,
The antioxidant activity of plants is associated with the presence of vitamins, phenolic compounds, carotenoids, among others. Particularly, in this study, it was found that the E1 and E2 extracts showed greater antioxidant activity by the DPPH and FRAP methods when they were evaluated at a concentration of 1 mg ml 1 (P<0.05) (Table 5), while in the ABTS method, the greater antioxidant activityof the E1 and E2 extracts was observed when they were evaluated at a concentration of 0.5 mg ml 1 (P<0.05). To date, there is no universal method to measure the antioxidant activity of plants because the chemical reagents used by these methods do not react the same with the different types of antioxidants present in plants. For example, ABTS● reacts with lipophilic and hydrophilic antioxidants, which allows it to be applicable in aqueous and lipid systems, while DPPH● can only be dissolved in an organic medium so it reacts well with low polar or non polar compounds, and both methods are based on the ability of antioxidants to neutralize reference free radicals (ABTS● and DPPH●). Therefore, in the E1 and E2 extracts, there could be more phenolic compounds of a hydrophobic nature than of a hydrophilic nature. Likewise, the FRAP method is based on the ability of antioxidants to reduce the ferric ion totheferrousstateandmeasuresthetotal antioxidantcapacityofthesample,whichshows the presence of phenolic compounds in the E1 and E2 extracts(48). These results of antioxidant activity are similar to those reported by Luyen et al(49), who observed high antioxidantpowerinmethanolicextracts, ethyl acetateandaqueous extracts of Euphorbia maculata using the ORAC method, while other studies have shown the antioxidant activity of plants of the genus Euphorbia, where Basma et al(50) evaluated the antioxidant activity of leaves, stems, flowers and roots of Euphorbia hirta using DPPH and FRAP techniques. In addition, Upadhyay et al(51) found antioxidant activity in Euphorbia hirta leaves by the DPPH and FRAP methods, while Zhang et al(52) reported antioxidant activity in Euphorbia lathyris stems, roots, seed and seed cover using the DPPH and FRAP methods. Table 5: Antioxidant activity of E1 and E2 extracts Extract DPPH (mg QEq. g 1) ABTS (mg QEq. g 1) FRAP (mg FeSO4Eq. g 1) (mg ml 1) E1 E2 E1 E2 E1 E2 0.1 0.028±0.001a 0.025±0.003a 0.008±0.0001a 0.005±0.0002a 0.062±0.002ª 0.054±0.004a 0.5 0.127±0.004b 0.128±0.006b 0.035±0.0002b 0.032±0.0002b 0.084±0.004b 0.072±0.006b 1 0.146±0.004c 0.140±0.004c 0.037±0.0002b 0.035±0.0003b 0.099±0.003c 0.095±0.005c 2 E1= Gnaphalium oxyphyllum; E2= Euphorbia maculata; ( )= not quantifiable. ab Different literal indicates significant difference between the data of the same column and between the treatments of the same method (P<0.05).
Rev Mex Cienc Pecu 2022;13(4):928 942 937
3. Mateos Maces L, Chávez Servia JL, Vera Guzmán AM, Aquino Bolaños EN, Alba Jiménez JE, Villagómez González BB. Edible leafy plants from Mexico as sources of antioxidant compounds, and their nutritional, nutraceutical and antimicrobial potential: A review. Antioxidants 2020;9(6):541.
1. Aguilar CN, Ruiz HA, Rubio RA, Chávez González M, Sepúlveda L, Rodríguez Jasso RM, et al Emergingstrategiesforthedevelopment offoodindustries.Bioengineered 2019;10(1):522 537.
ABTS and FRAP methods (DPPH vs ABTS= 0.99; DPPH vs FRAP= 0.93; ABTS vs FRAP= 0.88), which confirms the presence of antioxidant phenolic compounds found in E1 and E2 extracts and shows the accuracy of the methods used.
4. Mata R, Figueroa M, Navarrete A, Rivero Cruz I. Chemistry and biology of selected Mexican medicinal plants. Prog Chem Org Nat Prod 2019;108:1 142.
Acknowledgements
To the University of Sonora and the State University of Sonora for the support in the use of materials and facilities, as well as to Lic. Gerardo Reyna Cañez for his technical support. This research work was conducted in collaboration with the UES PII 20 UAH IH 02 project. Literature cited:
Conclusions and implications
The extracts of Gnaphalium oxyphyllum and Euphorbia maculata showed the presence of the phytochemicals: total phenols, total flavonoids, flavones and flavonols, total flavanones and dihydroflavonols, total tannins, total chlorogenic acid and total polysaccharides. In addition, both extracts had antimicrobial activity against Gram positive and negative pathogenic bacteria, as well as antioxidant activity by the DPPH, ABTS and FRAP methods. Therefore, the extracts from plants native to Sonora, Mexico, Gnaphalium oxyphyllum and Euphorbia maculata, represent a natural alternative in the food and livestock industry to reduce the use of synthetic chemical compounds.
2. Lillehoj H, Liu Y, Calsamiglia S, Fernandez Miyakawa ME, Chi F, Cravens RL, et al. Phytochemicals as antibioticalternatives to promotegrowthandenhancehost health. Vet Res 2018;49(1):1 18.
Rev Mex Cienc Pecu 2022;13(4):928 942 938
11. Ortega‐Ramírez LA, Rodríguez‐García I, Leyva JM, Cruz‐Valenzuela MR, Silva‐Espinoza BA, González‐Aguilar GA, et al Potential of medicinal plants as antimicrobial and antioxidant agents in food industry: a hypothesis. J Food Sci 2014;79(2):R129 R137.
12. RojasG,LévaroJ,Tortoriello J,NavarroV.Antimicrobialevaluation ofcertain plants used in Mexican traditional medicine for the treatment of respiratory diseases. J Ethnopharmacol 2001;74(1):97 101.
8. Robles Zepeda RE, Velázquez Contreras CA, Garibay Escobar A, Gálvez Ruiz JC, Ruiz Bustos E. Antimicrobial activity of Northwestern Mexican plants against Helicobacter pylori. J Med Food 2011;14(10):1280 1283.
7. Ruiz Bustos E, Velázquez C, Garibay Escobar A, García Z, Plascencia Jatomea M, Cortez Rocha MO, et al. Antibacterial and antifungal activities of some Mexican medicinal plants. J Med Food 2009;12(6):1398 1402.
13. Kwon SU, Cha JY, Lee HY, Xin M, Ji SJ, Kim DK, et al. Chloroform fraction of Euphorbia maculata has antiplatelet activity via suppressing thromboxane B2 formation. Mol Med Rep 2015;11(6):4255 4261.
14. Salehi B, Iriti M, Vitalini S, Antolak H, Pawlikowska E, Kręgiel D, et al. Euphorbia derived natural products with potential for use in health maintenance. Biomolecules 2019;9(8):337.
15. Skouta R, Morán Santibañez K, Valenzuela CA, Vázquez AH, Fenelon K. Assessing the antioxidant properties of Larrea tridentata extract as a potential molecular therapy against oxidative stress. Molecules 2018;23(7):1826.
10. Villagómez Ibarra JR, Sánchez M, Espejo O, Zúñiga Estrada A, Torres Valencia JM, Joseph Nathan P. Antimicrobial activity of three Mexican Gnaphalium species. Fitoterapia 2001;72(6):692 694.
6. Moreno Salazar SF, Verdugo AE, López CC, Martínez EB, Candelas TM, Robles Zepeda RE. Activity of medicinal plants, used by native populations from Sonora, Mexico, against enteropathogenic bacteria. Pharm Biol 2008;46(10 11):732 737.
9. Robles Zepeda RE, Coronado Aceves EW, Velázquez Contreras CA, Ruiz Bustos E, Navarro Navarro M, Garibay Escobar A. In vitro anti mycobacterial activity of nine medicinalplantsusedbyethnicgroupsinSonora, Mexico.BMCComplementAltern Med 2013;13(1):329.
5. García de Alba GJE, Ramírez HBC, Robles AG, Zañudo HJ, Salcedo RAL, García de Alba VJE. Conocimiento y uso de las plantas medicinales en la zona metropolitana de Guadalajara. Desacatos 2012;39:29 44.
24. AOAC. Official Methods of Analysis. 17th ed. Arlington, VA, USA: Association of Official Analytical Chemists. 2000.
26. Walash MI, Metwally MES, Eid MI, El Shaheny RN. Spectrophotometric determination of Risedronate and Etidronate in pharmaceutical formulations via the Molybdovanadate Method. Anal Lett 2009;42(11):1571 1587.
21. Griffiths DW, Bain H, Dale MFB. Development of a rapid colorimetric method for the determination of chlorogenic acid in freeze‐dried potato tubers. J Sci Food Agric 1992;58:41 48. 22. DuBois M, Gilles K, Hamilton J, Rebers P, Smith F. Colorimetric method for determination of sugars and related substances. Anal Chem 1956;28:350 356.
25. Hernández AF, Mateos R, Mesa JAG, Beltrán G, Escobar RF. Determination of mineral elements in fresh olive fruits by flame atomic spectrometry. Span J Agric Res 2010;4:1183 1190.
27. Chaves N, Santiago A, Alías JC. Quantification of the antioxidant activity of plant extracts: Analysis of sensitivity and hierarchization based on the method used. Antioxidants 2020;9(1):76.
16. Arteaga S, Andrade Cetto A, Cárdenas R. Larrea tridentata (Creosote bush), an abundant plant of Mexican and US American deserts and its metabolite nordihydroguaiaretic acid. J Ethnopharmacol 2005;98(3):231 239.
23. Heredia Castro PY, Méndez Romero JI, Hernández Mendoza A, Acedo Félix E, González Córdova AF, Vallejo Cordoba B. Antimicrobial activity and partial characterization of bacteriocin like inhibitory substances produced by Lactobacillus spp. isolated from artisanal Mexican cheese. J Dairy Sci 2015;98:8285 8293.
17. Khan A, Jan G, Khan A, Gul FJ, Bahadur A, Danish M. In vitro antioxidant and antimicrobial activities of Ephedra gerardiana (root and stem) crude extract and fractions. Evid Based Complementary Altern Med 2017;2017:1 6.
Rev Mex Cienc Pecu 2022;13(4):928 942 939
20. Price ML, Butler LG. Rapid visual estimation and spectrophotometric determination of tannin content of sorghum grain. J Agric Food Chem 1977;25:1268 1273.
19. Popova M, Bankova V, Butovska D, Petkov V, Nikolova Damyanova B, Sabatini AG, et al.Validatedmethodsforthequantificationofbiologicallyactiveconstituents of poplar type propolis. Phytochem Anal 2004;15:235 240
18.Al RifaiA,AqelA,Al WarhiT,WabaidurSM,Al OthmanZA,Badjah Hadj Ahmed AY. Antibacterial, antioxidant activity of ethanolic plant extracts of some Convolvulus species and their DART ToF MS profiling. Evid Based Complementary Altern Med 2017;2017:1 9.
33. Haslam RP, Sayanova O, Kim HJ, Cahoon EB, Napier JA. Synthetic redesign of plant lipid metabolism. Plant J 2016;87(1):76 86. 34. Li Q, Shen W, Zheng Q, Fowler DB, Zou J. Adjustments of lipid pathways in plant adaptation to temperature stress. Plant Signal Behav 2016;11(1):e1058461.
30. Datta S, Sinha BK, Bhattacharjee S, Seal T. Nutritional composition, mineral content, antioxidant activity and quantitative estimation of water soluble vitamins and phenolics by RP HPLC in some lesser used wild edible plants. Heliyon 2019;5(3):e01431.
31. Gopalan C, Sastri RBV, Balasubramanian SC. Nutritive Value of Indian Foods. National Institute of Nutrition, Indian Council of Medical Research, Hyderabad 500 007, India. 2004 32. Suh MC, Hahne G, Liu JR, Stewart CN. Plant lipid biology and biotechnology. Plant Cell Rep 2015;34:517 518.
35. GuptaS, Lakshmi AJ,Manjunath MN,Prakash J.Analysis ofnutrient andantinutrient content of underutilized green leafy vegetables. LWT Food Sci Technol 2005;38(4):339-345. 36. Datta S, Sinha BK, Bhattacharjee S, Seal T. Management of invasive alien species (IAS) of West Bengal via bioprospecting for a potential source of food supplement. Int J Food Sci Nutr 2018;3(2):89 94. 37. Rahmatollah R, Mahbobeh R. Mineral contents of some plants used in Iran. Pharmacogn Res 2010;2(4):267. 38. Stein RJ, Höreth S, de Melo JRF, Syllwasschy L, Lee G, Garbin ML, et al. Relationships between soil and leaf mineral composition are element‐specific, environment‐dependent and geographically structured in the emerging model Arabidopsis halleri. New Phytol 2017;213(3):1274 1286. 39. Borchardt JR, Wyse DL, Sheaffer CC, Kauppi KL, Ehlke RGFNJ, Biesboer DD, et al. Antimicrobial activity of native and naturalized plants of Minnesota and Wisconsin. J Med Plants Res 2008;2(5):098 110. 40. Kirbag S, Erecevit P, Zengin F, Guvenc AN. Antimicrobial activities of some Euphorbia species. Afr J Tradit Complement Altern Med 2013;10(5):305 309.
Rev Mex Cienc Pecu 2022;13(4):928 942 940
28. Satter MMA, Khan MMRL, Jabin SA, Abedin N, Islam MF, Shaha B. Nutritional quality and safety aspects of wild vegetables consume in Bangladesh. Asian Pac J Trop Biomed 2016;6(2):125 131.
29. Seal T, Pillai B, Chaudhuri K. Evaluation of nutritional potential of five unexplored wild edibleplants consumedbythetribal people ofArunachal Pradesh Statein India. J Food Nutr Res 2017;5(1):1 5.
47. Elmore CD, Paul RN. Phenolic deposits and kranz syndrome in leaf tissues of spotted (Euphorbia maculata) and prostrate (Euphorbia supina) spurge. Weed Sci 1983;31:131 136. 48. León MG, Osorio FMDR, Torrenegra ME, Gil GJ. Extracción, caracterización y actividadantioxidantedel aceite esencialde Plectranthus amboinicus L.RevCubana Farm 2015;49(4):708 718. 49. Luyen BTT, Tai BH, Thao NP, Lee SH, Jang HD, Lee YM, et al. Evaluation of the anti osteoporosis and antioxidant activities of phenolic compounds from Euphorbia maculata. J Korean Soc Appl Bi 2014;57(5):573 579.
51. Upadhyay A, Chattopadhyay P, Goyary D, Mazumder PM, Veer V. Euphorbia hirta accelerates fibroblast proliferation and Smad-mediated collagen production in rat excision wound. Pharmacogn Mag 2014;10(39):534 542.
41. Egamberdieva D, Wirth S, Behrendt U, Ahmad P, Berg G. Antimicrobial activity of medicinal plants correlates with the proportion of antagonistic endophytes. Front Microbiol 2017;9:199.
42. Manandhar S, Luitel S, Dahal RK. In vitro antimicrobial activity of some medicinal plants against human pathogenic bacteria. J Trop Med 2019;2019:1 5.
52. Zhang L, Wang C, Meng Q, Tian Q, Niu Y, Niu W. Phytochemicals of Euphorbia lathyris L. and their antioxidant activities. Molecules 2017;22(8):1335.
44. Zheng X, Wang W, Piao H, Xu W, Shi H, Zhao C. The genus Gnaphalium L.(Compositae): phytochemical and pharmacological characteristics. Molecules 2013;18(7):8298 8318.
45. Agata I, Hatano T, Nakaya Y, Sugaya T, Nishibe S, Yoshida T, et al. Tannins and Related Polyphenols of Euphorbiaceous Plants. VIII. Eumaculin A and Eusupinin A, and AccompanyingPolyphenols from Euphorbia maculata L. and E. Supina RAFIN. Chem Pharm Bull 1991;39(4):881 883.
46. Liu S, Jiang DS, Li L. Research on the total flavonoids' content and antioxidant activity of Euphorbia maculata and Euphorbia humifusae. J Hunan Agric Univ 2007;33(3):287.
Rev Mex Cienc Pecu 2022;13(4):928 942 941
43. Ochoa PA, Marin MJ, Rivero BD, Saborít A. Caracterización física, físico química y química de extractos totales de hojas frescas de Petiveria alliacea L. con acción antimicrobiana. Rev Mex Cienc Farm 2013;44(1):52 59.
50. Basma AA, Zakaria Z, Latha YL, Sasidharan S. Antioxidant activity and phytochemical screening of the methanol extracts of Euphorbia hirta L. Asian Pac J Trop Med 2011;4(5):386 390.
Rev Mex Cienc Pecu 2022;13(4):928 942 1 Table 3: Antimicrobial activity of E1 and E2 extracts against Gram positive and negative bacteria CONC Gram positive Gram negative S. aureus L. monocytogenes E. coli S. typhimurium E1 E2 E1 E2 E1 E2 E1 E2 0.1 8.43±0.42Dª 6.10±0.52Ca 7.50±0.20Cª 4.32±0.31Ba 3.00±0.70Aª 2.30±0.21Aa 2.50±0.15Aª 2.50±0.12Aª 0.5 12.10±0.61Eb 10.13±0.42Db 9.50±0.36CDb 8.11±0.43Cb 5.50±0.70Bb 4.20±0.32ABb 3.50±0.20Ab 3.50±0.14Ab 1 16.00±0.32Fc 14.00±0.36Ec 13.24±0.43Dc 10.34±0.41Cc 8.50±0.70Bc 8.10±0.34Bc 5.52±0.40Ac 6.52±0.22Ac 2 16.22±0.28Ec 14.10±0.51Dc 13.53±0.38Dc 10.40±0.36Cc 8.55±0.70Bc 8.30±0.41Bc 5.54±0.32Ac 6.54±0.32Ac 3 16.31±0.53Ec 14.23±0.39Dc 13.56±0.41Dc 10.48±0.38Cc 8.57±0.70Bc 8.35±0.42Bc 5.56±0.45Ac 6.55±0.31Ac CONC= concentration of extracts (mg mL 1); E1= Gnaphalium oxyphyllum; E2= Euphorbia maculata; data expressed in mm of inhibition halo. Different uppercase literal indicates significant difference between data in the same row and different lowercase literal indicates significant difference between data in the same column (P<0.05). 942
943 https://doi.org/10.22319/rmcp.v13i4.5958Article
Effects of acid whey on the fermentative chemical quality and aerobic stability of rehydrated corn grain silage
Ediane Zanin a* Egon Henrique Horst b Caio Abércio Da Silva a Valter Harry Bumbieris Junior a a State University of Londrina Department of Animal Science, Londrina, Paraná, Brazil, 86057 970. b Midwestern Paraná State University Department of Veterinary Medicine, Guarapuava, Paraná, Brazil. * Corresponding author: ediane.z@hotmail.com
Abstract:
The objective was to evaluate the fermentative, chemical characteristics and aerobic stabilityof corn grain silages rehydrated with whey fluid (WF) or wheypowder (WP) and water, with or without the addition of inoculant (I). The corn grain was ground and hydrated adding water without chlorine and/or whey to reach 35 % humidity and stored in silos of 4.36 kg. After 45 d of fermentation, samples of the silages were submitted to chemical fermentative analyses in opening of silos and 240 h of exposure to air. The aerobic stability of the silages was evaluating during 240 h has considered to the loss when the temperature of the ensiled mass exceeded the ambient temperature by 2 °C A reduction in the acid detergent fiber (ADF) and lignin content of the silages was observed with the use of WF and WP. The levels of ammoniacal nitrogen (NH3 N) were the lowest for WF and WP (0.7 and 0.9 g/kg TN) and pH was 4.31 for WF after 240 h of aerobic exposure. The use of inoculants provided higher levels of Ash, ether extract (EE), and low buffering capacity (BC), in addition to reductions in ADF levels. The inoculated silages showed higher levels of NH3 N and pH after 240 h. The silage of corn grains rehydrated with WF provided ideal pH values, low NH3 N content, reduced levels of ADF and lignin, and improved aerobic stability In addition to being a sustainable
Associated with rehydration, the fermentation of grain corn is an interesting process; dry grain is not suitable for ensiling due to its low moisture and sugar content, which results in limited production of total acids(5). Thus, rehydration, commonlyconducted with water and aimed at reaching final levels between 35 to 37 % humidity(6,7), is a practical Theapplicationuseofa liquid source with low added value or one that has polluting but non toxic characteristics can also be used for the rehydration of dry grain corn. Byproducts such as acid whey fluid, which have considerable concentrations of lactic acid bacteria and lactose(8) as well as recognized nutritional value, constitute a suitable example for this purpose, with advantages given to the supply of more nutrients to the silage(9) and an appropriate final destination for this byproduct.
Accepted: 13/05/2022 Introduction
The process of milling the dry corn grain and its subsequent rehydration also aims to increase its digestibility, reflecting positively on animal performance(4). In particular, these resources are appropriate since the corn used in most countries is characterized as flint, which has lower digestibility.
In order to improve fermentation, reduce nutrient losses, and inhibit the growth of undesirable microorganisms(5,9), microbial inoculants composed of homofermentative and heterofermentative bacteria are also incorporated into the ensiled mass, which can prolong the aerobic stability of moist and rehydrated corn grain silages(7,10). Given this context, our hypothesis was that the composition of whey fluid and its microbiological
Corn grain is one of the most used energy ingredients in animal feed; furthermore, it can also be subjected to rehydration to be stored as silage. Rehydrated corn grain silage is a strategy used to guarantee the availability of feeds throughout the year(1) decrease logistical costs(2) , and minimize the effects of fluctuations in the price of this commodity(3)
Rev Mex Cienc Pecu 2022;13(4):943 961 944
alternative, the use of fluid whey to rehydrate corn grains adds nutritional value and improves silage fermentation.
Received: 04/03/2021
Key words: Acid whey, Byproduct, Corn grain, Inoculant, Silage, Sustainability
Rev Mex Cienc Pecu 2022;13(4):943 961 945 capacity promotes the improvement of silage quality, reduces the use of water for rehydrationof grains, and contributes to anappropriatedestination forthis byproduct. For whey powder, in addition to considering the nutrient load of its composition as a liquid source for rehydration, it is available on a commercial scale for purchase. Finally, the addition of inoculants may help these two liquid sources to improve the fermentative quality and aerobic stability of the silage. Thus, the objective of the present study was to evaluate the effects of rehydration of corn grains with acid whey or whey powder and water, with or without the addition of an inoculant, on the chemical, fermentative characteristics and aerobic stability of the silages.
The corn grains were obtained from the storage silos of Cooperativa Agropecuária Cocamar®,Londrina,Paraná, Brazil,andtheirgeneticidentityisnotknown.Thesegrains were initiallyprocessed in a hammer mill to reach an average particle size of 1.5 mm, and submitted to moisture content evaluation according to the methodology described in AOAC(11), with an average value of 117 g/kg dry matter (DM). The acid whey was obtained from the dairy company Volpato®, in the city of Arapongas, Paraná, Brazil, during the processing of milk for the production of derivatives and was used shortly thereafter in natura to rehydrate the grains. The powdered wheyused was purchased from Cooperativa Cativa®, in the city of Londrina, Paraná, Brazil. The corn grain was ground and subjected to hydration according to each treatment by adding water without chlorine and/or whey to reach 35 % humidity, with or without the addition of an inoculant defining five products, which were incorporated into the drycorn grain corresponding to the experimental treatments: Corn grain silage rehydrated with water (CON); Corn grain silage rehydrated with whey fluid (SWF); Corn grain silage rehydrated with fluid whey, plus inoculant (SWF + I); Corn grain silage rehydrated with water reconstituted whey powder (SWP); and Corn grain silage rehydrated with powdered whey reconstituted with water, plus inoculant (SWP + I). The microbial inoculant added to the mass to be ensiled was previously diluted to 2.5 mL of the product to 7 L of water without chlorine and/or whey for each 20 kg of ground corn and manually homogenized. The inoculant used was Biotrato SLO® (SLO Biotecnologia & Agropecuária, Cambé, Paraná, Brazil) which consists of Propionibacterium acidipropionici, Lactobacillus plantarum, Lactobacillus acidophilus, Pediococcus acidilactici, Enterococcus faecium, Lactobacillus buchneri, and Lactbacillus curvatus at a concentration of 70×109 UFC/g and 8 % of cellulolytic enzymes.
Material and methods Corn grain and preparation of silage
Once hydrated, the mass of each of the five products was stored in six polyethylene silos with a capacity of 4 L each, determining units with an initial average weight of 4.36 ± 0.17 kg. Compaction was carried out manually, with an average specific density of 1,020 ± 0.04 kg natural matter (NM)/m3. All silos were sealed with a lid and appropriate plastic tape and stored in a dry and ventilated place for 45 d until the opening date, when they reached a final weight of 4.28 ± 0.20 kg. The experimental design was completely randomized with five treatments and six replications corresponding to each silo.
The composition of fluid whey before silage was: 60 g DM/kg NM, 865 g CP/kg DM, 3.40 g Ash/kg DM, 3.50 g EE/kg DM, pH 6.30, and acidity of 0.13 for lactic acid. The whey powder showed the following characteristics: 970 g DM/kg NM, 110 g CP/kg DM, 60 g Ash/kgDM, 15 gEE/kgDM, pH 6.30 6.80, and acidityof 0.13 for lactic acid. These analyses followed the procedures described by Zenebon et al(16). Samples of the silages for each treatment were collected when the silos were opened to determine the chemical fermentative composition using a near infrared spectroscopy system (NIRS DS2500; Foss, Denmark) (Table 2) from the 3rlab® laboratory (Chapecó, Santa Catarina, Brazil)
The analysis results shown in Table 2 are only exploratory and descriptive, since it is a characterization of silages without the application of statistical analysis
Samples ofcorngrain priorto ensiling(883gDM/kgin natural matter(NM),92.7gcrude protein (CP)/kg DM, 11.5 g Ash/kg DM, 31.8 g ether extract (EE)/kg DM, 126.2 g NDF/kg DM, 25.8 g ADF/kg DM, and 11.3 g lignin/kg DM) and the ensiled mass after opening the silos (Table 1) were evaluated according methodologies to AOAC(11) , and neutral detergent fiber (NDF) assayed with a heat stable alpha amylase and sodium sulphite (aNDF), acid detergent fiber (ADF) and lignin (lignin (sa)) using sulphuric acid and corrected for ash were evaluated according to the methodology described by Van Soest et al(12). The values of total digestible nutrients (TDN) were calculated according to Sniffen et al(13) , total carbohydrates (TCHO) according to the equation proposed by Chandler(14) , and non fibrous carbohydrates (NFC) according to Hall(15) .
Chemical analysis
Rev Mex Cienc Pecu 2022;13(4):943 961 946
1 Treatment: CON= corn grain silage rehydrated with water; SWF= corn grain silage rehydrated with whey fluid; SWF + I= corn grain silage rehydrated with fluid whey, plus inoculant; SWP= corn grain silage rehydrated with water reconstituted whey powder; SWP + I= corn grain silage rehydrated with powdered whey reconstituted with water, plus inoculant.
Digestibility of rumen starch, g/kg starch 7h 701.9 709.2 701.6 686.4 740.7 Lipids 36.2 33.1 35.3 29.7 38.1 Ash 18.5 17.9 18.3 17.8 18.6 Calcium 00.5 00.5 00.5 00.5 00.5 Phosphorus 02.2 02.0 02.0 02.2 02.2 Potassium 03.9 03.7 03.9 04.0 03.8 Magnesium 00.9 00.8 00.9 00.9 00.9 Sulfur 00.9 00.9 00.9 00.9 00.9 Lactic acid 21.5 24.8 26.3 22.2 24.8 Acetic acid 03.2 05.0 03.6 03.0 04.2 Protein equivalent of NH3 N 03.3 03.6 03.1 02.9 03.8 NH3 N, g/kg of CP 33.6 37.0 31.3 28.8 40.1 pH 4.78 3.89 4.13 4.23 4.15 Kd of starch (using 3.7 h) %h 17.00 17.19 16.96 16.29 18.86
Variables 2 (g/kg DM) CON SWF SWP Without With Without With DM, g/kg NM 652.9 609.4 655.0 641.5 621.7 Moisture 347.1 390.6 344.0 358.5 378.3 CP 97.2 98.5 100.1 100.7 95.1 Protein soluble g/kg CP 496.0 504.8 520.6 504.0 509.5 Protein available 96.2 97.9 99.2 100.1 94.4 ADIP 01.0 00.6 00.9 00.7 00.7 NDIP 02.8 02.2 02.9 02.8 02.3 ADIP g/kg CP 10.0 06.2 09.1 06.6 07.5 ADF 31.3 28.6 31.4 26.0 27.4 NDF 91.0 74.9 87.9 85.5 76.6 aFDNmo 85.4 69.3 82.1 78.7 69.4 Lignin 05.1 04.9 05.1 04.6 04.7 Lignin, g/kg NDF 56.3 64.9 58.5 53.7 61.8 Sugars (carbohydrates soluble in water) 44.5 50.5 49.0 50.4 48.3 Starch 698.8 703.9 688.9 704.7 699.9 Starch, g/kg NFC 919.7 905.1 905.0 916.4 904.4
Digestibility of rumen starch, g/kg starch 0h 466.4 394.1 417.6 354.0 458.1
Rev Mex Cienc Pecu 2022;13(4):943 961 947 Table 2: Chemical fermentative composition of rehydrated corn grain silages determined by the NIRS system Treatment 1
The pH of the ensiled mass during aerobic exposure was measured using a potentiometer (AZ Temp Meter; AZ Instrument Corp., Taichung City, Taiwan) according to the methodology of Phillip and Fellner(19). These analyses were delineated in subdivided plots, where the main portion was the treatment and the subplot was the time of aerobic exposure. Statistical analysis
The data were analyzed according to a completely randomized design using the General Linear Model (PROC GLM) procedure of SAS (see 9.2; SAS Inst. Inc., Cary, NC, USA). Contrasts were used to verify scientific hypotheses using the CONTRAST command, making it possible to compare the impacts of using fluid whey and powdered whey on the investigated variables, as well as comparing the effects of using inoculants with these reconstituting agents. The proposed model was as follows:
2Variables: DM= Dry matter (g/kg of natural matter); ADIP= acid detergent insoluble protein; NDIP= Neutral detergent insoluble protein; ADF= acid detergent fiber; NDF= neutral detergent fiber; aNDFmo= neutral detergent fiber with amylase and expressed excluding residual ash; NH3 N= ammoniacal nitrogen. Kd= fractional rate of degradation. Analyses determined by the laboratory 3rLab.
To evaluate the fermentation profile of the silages, buffering capacity (BC) and ammoniacal nitrogen (NH3 N) were determined according to the methodology of Playne and McDonald(17) at the opening of the silos and after 240 h of exposure to air (Table 3).
Fermentative analysis and aerobic stability
����������=µ+α�� +β�� +δ�� +(αβ)���� +(αδ)���� +(βδ)���� +ξ��������
Rev Mex Cienc Pecu 2022;13(4):943 961 948
The aerobic stability of the silages was determined using 3 kg of the ensiled mass, homogenized and deposited in the silos according to each treatment, which remained in a closed room exposed on a bench at ambient temperature for 240 h. The ambient (25.43 ± 2.38 °C) and silage temperatures were obtained every 12 h using a digital thermometer (TP101 Xtrad 145 mm; Shenzhen Handsome Techn., Guangdong City, China). The thermometer rod was inserted 10 cm deep in the center of the mass for this measurement. The loss aerobic stability was considered when the temperature of the ensiled mass exceeded the ambient temperature by 2 °C(18)
The lignin content differed significantly (P<0.10) between the SWF silages and other treatments, with the highest lignin content observed for SWF + I at 7.8 g/kg DM, in addition to presenting a significant interaction (P<0.05) between SWF and SWP, with a lower observed lignin content for SWF silage (Table 1).
The EE value differed (P<0.05) for the silages where SWF was used as a liquid source to rehydrate corn kernels, with a higher content of this nutrient for SWF + I. There was a significant interaction (P<0.01) between the liquid sources of SWF and SWP used to rehydrate the grains (Table 1), in which the SWF source showed an increase in EE compared to that in the silages for the control and SWP treatments.
The (αβδ)ijk interaction was initially tested, but due to its low magnitude, it was removed from the statistical model. The results are presented as means ± standard deviation, as well as the corresponding standard error. Significance was declared at P<0.01 and P <0.05, and trends were discussed when P<0.10. For the aerobic stability pH data, regression analysis (α= 0.05) was performed to split the time interaction per treatment in the RStudio statistical program (v. 3.6.0; 2019).
Rev Mex Cienc Pecu 2022;13(4):943 961 949 where: Yijkl = observed value regarding level i of factor A, combined with level j of factor B and level k of factor C, in repetition l; µ = overall average; αi = level effect i of factor A; βj = level effect j of factor B; δk = level effect k of factor C; (αβ)ij = interaction effect of A with B; (αδ)ik = interaction effect of A with C; (βδ)jk = interaction effect of B with C; ξijkl = experimental error associated with Yijkl and considered independent and identically distributed, with distribution N(0, σ2).
Results Quality of chemical composition
The ADF contents of the corn grain silage rehydrated with SWP differed significantly (P<0.01) between treatments (Table 1), with a lower observed ADF value of 14.7 g/kg DM for the silage without inoculation, followed bySWP + Iwith 21.0 g/kg of DM. There was a significant interaction (P<0.01) between the liquid sources used, in which the SWP silages had the lowest ADF values.
Rev Mex Cienc Pecu 2022;13(4):943 961 950
The NH3 N of the silages after 240 h of exposure to air from the ensiled mass were significantly different between silages (Table 3), with and without inoculation (P<0.05), for treatments with the liquid sources SWP and SWF (P<0.01), and there was significant interaction between the sources (P<0.01). The silages with the addition of inoculant and the control treatment showed the highest levels of NH3 N at 240 h.
The DM, CP, NDF, TCHO, and NFC values of the silages were not influenced (P>0.05).by the liquid sources used or by the addition of inoculants.
For levels of Ash a significance difference was observed for the sources of treatments (P<0.05), addition of inoculants (P<0.01) and interaction between the liquid sources (P<0.05). The corn grain silages that were rehydrated with SWP had the highest levels of Ash compared to those in the other sources of rehydration, and the addition of inoculant in the SWP and SWF treatments provided the highest levels of this component (Table 1).
The loss of aerobic stabilitydiffered significantly(P<0.05) between the corn grain silages rehydrated with water and SWF + I and those from the other silages, which broke the stability after 84 h of oxygen exposure, showing greater stability after opening the silos (Table 4). The time required for the ensiled mass of the treatments with water and SWF
After 240 h of exposure, the pH values differed between the SWF and SWP treatments (P<0.01; 0.10, respectively), with a lower observed value of 4.31 for the WF and a tendency towards a lower pH value for the silage with SWP when compared to those in the control (Table 3). For the addition of inoculant, corn grain silages rehydrated with SWP showed a higher pH value compared to that in the control and SWF treatments (P<0.01). In addition, a significant interaction (P<0.01) was observed between the silages with SWP and SWF, in which the lowest pH values were observed for SWF, regardless of the addition of inoculant. The inoculated silages (P<0.05) that were independent of the liquid sources used showed the lowest BC values compared to those of the SWF and control sources. Aerobic stability
ThepHvaluesevaluated in thesilages showed asignificant differenceboth in theopening of the silos and after 240 h of exposure to air (Table 3). For the pH values during the opening of the silos, a significant difference was observed between the silages with the liquid sources of SWF (P<0.05) and SWP (P<0.01) without the addition of inoculant, with a lower pH value of 4.26 for SWF.
Fermentation profile
Figure 1: pH values after aerobic exposure of rehydrated corn grain silages
CON: 6.06±1.18, Ŷ=4.23+0.01x+0.0002x2 0.000001x3, R²=0.72, P=0.0011, CV=9.54; SWP: 5.38±1.18, Ŷ=4.52 0.0042x+0.0001x², R²=0.88, P=0.028, CV=21.88; SWF: 4.31±0.27, P=0.123, CV=6.26; SWP+I: 6.37±1.60, Ŷ=4.51 0.024x+0.0006x² 0.000002x³, R²=0.92, P=0.001, CV=25.17; SWP+I: 5.11±1.40, Ŷ=4.57 0.011+0.0001x², R²=0.89, P=0.005, CV=27.35.
Rev Mex Cienc Pecu 2022;13(4):943 961 951 + Ito increase the temperature of the ensiled mass by2 °C above the ambient temperature was significantly shorter (76 and 75 h, respectively) than that in the other treatments (P<0.05), a behavior that characterizes the loss of aerobic stabilityand onset deterioration of Thesilage.time to reach the maximum temperature of the ensiled mass, except for the silage made with corn grain rehydrated with SWF (P<0.05), was longer than 200 h, with a significant difference between treatments in the final pH of the silages exposed to air for 240 h (Table 4, Figure 1).
Table 4: Aerobic stability parameters of corn grain silages submitted to rehydration Treatments Parameters CON SWP SWF SWP+I SWF+I P value stability,Aerobic hour 76b 84a 84a 84a 75b 0.0007 Time hourtemperature,maximumto 234a 234a 104b 204a 201a 0.0001 pH 240 h 5.50±1.2ac 7.35±1.2b 4.40±0.3c 6.71±1.6ab 6.88±1.4ab 0.0006
CON= corn grain silage rehydrated with water; SWF= corn grain silage rehydrated with whey fluid; SWF + I= corn grain silage rehydrated with fluid whey, plus inoculant; SWP= corn grain silage rehydrated with water reconstituted whey powder; SWP + I= corn grain silage rehydrated with powdered whey reconstituted with water, plus inoculant.
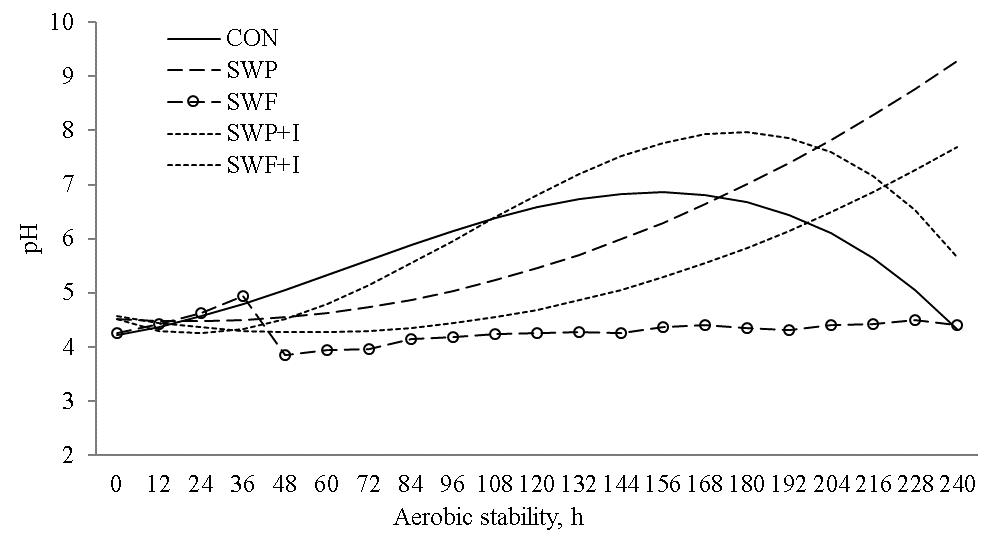
For these variables and the liquid fluid whey source, it is still unclear how reductions in the levels of these nutrients occur. However, the whey acidity contributes to potentiating fermentation, which, together with the acidic hydrolysis of hemicellulose, can reduce the levels of these fibers.
Discussion Quality of chemical composition
It was observed that the inoculant contributed to ADF reduction when compared to that in the control treatment. These lower ADF values may be related to the dilution of the fiber content evaluated(20) and to the cellulolytic enzymes present in the inoculants, which degrade the fiber and alter the three dimensional structure of the grain cell wall(9,21) , determining positive results for the digestibility of this food.
The lignin levels determined in the present study for the control treatment differed from those obtained by Oliveira et al(1), who found values for lignin between 13.7 and 14 g/kg DM in corn grain silages rehydrated with water plus enzymatic additive. One factor that may explain this variation is that the levels of lignin present in rehydrated grain silages can vary widely due to the diversity of available corn cultivars, phase, and agronomic Themanagement.additionof the inoculant may have contributed to a higher value of content of EE for SWF + I, as this increase was also observed by Tres et al(22) and Arcari et al(3) in rehydrated corn grain silages inoculated with L. buchneri. The SWF source increased in EE compared to that in the silages for the control and SWP treatments. This increase can be explained by the microbiological potential and availability of nutrients that the SWF presents as a fresh product(8) at the time of rehydration, since there was an adjustment in
The levels of lignin in all silages regardless of treatment could be considered low, since the content obtained in the corn kernels before rehydration was 11.3 g/kg DM. This reduction can occur after ensiling, due to the acid hydrolysis process of fibers and acidification that will weaken the complex lignin molecules(20) and thus obtain lower values of this component. However, the action of fluid and whey sources on reductions in lignin content in rehydrated corn grain silages requires more specific studies in terms of fiber structures, since this nutrient, as well as NDF and ADF, are directly related to feed digestibility.
Rev Mex Cienc Pecu 2022;13(4):943 961 952
The ADF and NDF results for the silages that used SWF were in agreement with Rezende et al(9), who also observed small reductions in the ADF levels in treatments with acid whey associated with inoculants, and in general observed lower NDF content for the treatments with rehydration of the corn grain with acid whey, without adding inoculant.
Fermentation profile
In the present study, the use of fluid whey may have contributed to a rapid reduction in pH and preservation of the protein fraction during storage and exposure to air due to the low proteolytic activity of lactic acid bacteria(9,24) present in the microbiological profile of whey(8) Conversely, the inclusion of the inoculant may have altered the profile of the bacterial population of the silo(10,24) and consequently reduced the prolamine content of the inoculated silages during exposure to air, as higher concentrations of soluble protein andNH3 Nwereobservedattheopeningofthesilos(Table2)and after240hofexposure to air (Table 3), respectively, in the silages in which the inoculants were incorporated, which may indicate greater proteolysis(5,21). This hypothesis was supported by the results obtained by others(10), who, when evaluating the addition of L. buchneri in moist and reconstitutedcorn grainsilages,foundthatthebacterialprofileofthesilagewasmodified, increasing the concentration of lactic acid bacteria as the silage storage period increased, with a higher concentration of NH3 N after 90 d of storage in both types of silages.
Rev Mex Cienc Pecu 2022;13(4):943 961 953 the DM base of the tested liquid sources, for homogeneous distribution of the presented nutrient load.TheEElevels determinedin thepresent studyforthecontrol treatment were similar to the results obtained byOliveira et al(1), Mombach et al(23), and Tres et al(22) who identified values of 53.1, 45.2, and 39.6 g EE/kg DM, respectively, in samples of grain silages rehydrated with water without adding inoculants.
The use of the SWP liquid source mayhave contributed to higher observed levels of Ash, due to its composition having 60 g Ash/kg DM, while SWF had 3.40 g Ash/kg DM. The DM, CP, NDF, TCHO, and NFC values of the silages were similar to the results observed by Rezende et al(9) in corn grain silages rehydrated with whey, and by Da Silva et al(10) and Oliveira et al(1) , who evaluated corn grain silages rehydrated with water, plus inoculants, and their effects on nutrients.
The corn grain silage rehydrated with SWF showed superior fermentation quality compared to that of the silage with SWP and water, with the lowest value of NH3 N at 0.7 g/kg TN after exposure to air for 240 h. According to McDonald et al(20), as the pH rapidly decreases in the silage, the protein fraction is preserved and the concentrations of NH3 N will be lower, thus characterizing an adequate fermentation. An increase in NH3 N concentrations in silages may be related to the proteolytic activity of microorganisms from the epiphyte and/or inoculated population during silage, which will affect the decomposition of the prolamine of the cereals, as well as the digestibility of starch, and asaconsequencetherewillbehigherlevels ofproteinavailablefor NH3 N production(21)
The lower pH value of 4.26 for SWF in opening silos reinforced the hypothesis that the microbial profile of fluid whey preserved the protein in corn kernels due to its low proteolytic activity of lactic acid bacteria, in addition to contributing to a rapid drop in
The pH of an ensiled sample is a measure of its acidity, which corresponds to the sum of the concentrations of acids present in the ensiled mass, whose main acids were acetic, propionic, and lactic acid. Lactic acid is produced by lactic acid bacteria and has a higher concentration, contributing more to the decline in pH during fermentation(25) Some authors(12,20) consider pH values from 3.8 to 4.2 as ideal; however, the pH itself is not able to inhibit the action of undesirable microorganisms, which are also dependent on the speed ofpHreduction, observedthroughthe BC ofthesilages. Theconcentrationoflactic acid in SWF and SWF + I were more expressive in samples obtained for the silages at the opening of the silos (Table 2), which presented the lowest pH values after 240 h of exposure to air.
Rev Mex Cienc Pecu 2022;13(4):943 961 954 pH after ensiling. It is known that the starch protein matrix of corn grains presents greater degradationduetomicrobialactivitythanfromsimplesolubilizationoffinalfermentation products, such as acids(21)
The values of pH observed after 240 of exposure to air showed the action of source WF in silages and inoculants. The modification of the bacterial profile in silos can be due to the addition of inoculants with L. buchneri, that can creating ecological niches and to benefit proteolytic bacteria in convert lactic acid into acetic acid, consequentlyincreasing the pH during the fermentation process in this type of environmental(21,24). This fact observed in the inoculated silages, which presented higher pH values after 240 h of exposure to air (Table 3).
The corn grain silage rehydrated with SWF maintained the pH at the opening and after theexposuretoair,whichwasclosetothevaluesconsideredidealforfermentativequality of the silage. This fact may also be due to the composition of the serum, which included sugars that were used as substrates by the lactic acid bacteria in the fermentation process, contributing to a rapid drop in pH. Considerable values were also observed for SWP, unlike water, which presented higher pH values at the opening of the silos. The results obtained for the control treatment were in accordance with those from Oliveira et al(1) , who found pH values of 4.25 at the opening of the silo and 6.50 on the fifth day of exposure to air in corn silage rehydrated with water.
Theinoculatedsilages thatwereindependent oftheliquid sources usedshowedthelowest BC values compared to those of the SWF and control sources (Table 3), which could be characterized as an important action of the inoculant in terms of fermentation right after ensiling, with a direct effect of inoculation on the speed of pH reduction and consequent improvement in silage BC. According to Jobim et al(26), this measurement depends on the composition of the plant regarding the contents of CP, inorganic ions, and the combination of organic acids and their salts, in addition to providing information on the speed of pH reduction, which must be low to facilitate this acidification during fermentation, culminating in improved conservation and silage quality. In the present study, these characteristics (Table 2) could be considered for a positive BC of rehydrated corn grain silages.
Aerobic stability
The loss of aerobic stability in corn grain silages rehydrated with water and whey occurred after 55 h(9); however, in this work it was obtained greater aerobic stability with values of 75 to 84 h of exposure without losing stability, which characterizes a positive effect of rehydration. One of the factors that can influence the deterioration of the silages is the humidity of the ensiled mass, as there is a favoring of the medium so that undesirable microorganisms develop when the moisture content and acetic acid concentration are high(9) . In the present work, the moisture content was between the recommended intervals of 35 to 37 for a high quality of rehydrated grain silage(6,7), and the concentrations of acetic acid were similar between silages. In addition, the use of mandatory heterofermentative bacteria in inoculants, such as L. buchneri, increases the aerobic stability of moist and rehydrated corn grain silages(5,7,27), which justifies the results achieved for the loss of stability of the silages inoculated at 84 h of exposure to Regardingair.
the variable time to reach the maximum temperature of the ensiled mass, as the heating rate was obtained through the maximum temperature records divided by the time to reach the maximum temperature, it was observed that the maximum temperature was reached from theeighth to theninthdayofexposureto air,except fortheSWF,which reached the maximum temperature on the fourth day, although the maximum temperature values reached for this silage were low. In general, the rehydrated corn grain silages, regardless of the liquid source used for rehydrating the grains, were efficient in the time to reach the maximum temperature in this process. This justification maybe related to the fermentative profile of these silages and the increased effect of the bacterial inoculant used, which improves the aerobic stability of the silages. Despite SWF reaching the maximum temperature before the other silages, with a final pH value close to the ideal (4.40) in terms of quality, after 240 h of exposure to air, the silage was still superior in qualitative terms and fermentations to those in the other silages. These results were similar to those obtained by Rezende et al(9), who observed that after 40 h of aerobic exposure, rehydrated grainsilages increased thetemperature, regardless oftheliquid used for of aerobic stability for the corn grain silage rehydrated with SWF occurred at 84 h of exposure,and it was observedthat thesesilages, whenchallengedwith the time of exposure to air, also presented average pH values lower than those of the silages made with the other sources of rehydration (Figure1). This characteristic of maintaining stability after opening the silos can be explained by the microbial profile of the liquid source used for rehydration, which has low proteolytic activity of lactic acid bacteria(24) and acceleration of grain fermentation by a rapid fall in pH after ensiling due to the presence of lactic acid (Table 2).
Althoughrehydration.theloss
Rev Mex Cienc Pecu 2022;13(4):943 961 955
ThepHvaluesforthe corngrainsilagerehydrated withSWFremainedmorestableduring the 240 h of exposure and were close to the values at the opening of the silo, when compared with those of the other treatments. This behavior can explain the significant difference in the final pH value in the aerobic exposure of this treatment. However, corn grain silage rehydrated with water, which also had a lower pH value at the end of the exposure, did not show stable behavior during the exposure. Conversely, the corn grain silage rehydrated with SWP showed a constant pH increase during the exposure and reached a higher final pH value (7.35). These results are similar to those observed by Oliveira et al(1) , who found that the pH behavior of corn grain silages rehydrated with water showed a constant increase from 48 h to 120 h of exposure to air. The final pH of the silages is influenced by several factors, but according to Kung Junior et al(25) , is more related to the concentration of lactic acid and TC in ensiled food, as shown in Table 2, in which the highest concentrations of lactic acid at the opening of the silos were for SWF, followed by the inoculated silages. A previous study(10) showed that increased aerobic stability with increased storage period for rehydrated and moist corn grain silages inoculated with L. buchneri are due to the accumulation of fermentation products such as acetic and propionic acid, which have antifungal properties.
Rev Mex Cienc Pecu 2022;13(4):943 961 956
The treatments that received an increase in microbial inoculant also showed a final pH value, in aerobic exposure, lower than that of the SWP, but not lower than that of the SWF without the inoculant and the control silage (Table 4). This shows that although the inoculation was efficient at prolonging the time to reach the heating rate of the silages, the pH values could still be considered above the ideal values, such as the value obtained for SWF. A significant increase in pH was also observed for the treatments with water, SWP, and SWP + I after 60 h of exposure (Figure 1). The pH values of the silages increased with exposure to air, due to the action of yeasts that can use lactate as carbon and energy sources, favoring an environment for the growth of molds and aerobic bacteria, which are responsible for the deterioration of silage(20)
The corn grain silages rehydrated with SWF were superior according to the quality parameters evaluated in the present study. In addition, the use of fluid whey in the rehydration of the grain can be considered as an alternative liquid source to water that provides conservation of ensiled food and an appropriate destination for this byproduct forpreservationoftheenvironment.Although wheypowder showed improvements in the chemical and fermentativequalitycomparedto thoseofthecommonlyused liquid source, it may not be an appropriate alternative option for rehydrating grains, as it requires water to dilute the powder before rehydrating the grain and distances itself from the production of food in a sustainable way. Another fact that may disadvantage the use of this source is theprocess becomingmoreexpensive,sincetheproduct is acquired through purchaseand the production of whey powder involves several processes that add value to the product to be sold.
Acknowledgments
Anim Feed Sci Technol 2019;251:86 95.
The authors declare no conflict of interest. Literature cited:
The authors would like to thank the postgraduate program in Animal Science of the State University of Londrina (UEL, Londrina, Brazil) and the Coordination of Improvement of Higher Education Personnel (CAPES, Brasília, Brazil) for granting by scholarship. Conflicts of interest
2. Ferraretto LF, Fredin SM, Shaver RD. Influence of ensiling, exogenous protease addition, and bacterial inoculation on fermentation profile, nitrogen fractions, and ruminal in vitro starch digestibilityin rehydrated and high-moisture corn. J DairySci 2015;98:7318 7327.
3. Arcari MA, Martins CMMR, Tomazi T, Gonçalves JL, Santos MV. Effect of substituting dry corn with rehydrated ensiled corn on dairy cow milk yield and nutrient digestibility. Anim Feed Sci Technol 2016;221:167 173.
Conclusions and implications
4. Ferraretto LF, Crump PM, Shaver RD. Effect of cereal grain type and corn grain harvesting and processing methods on intake, digestion, and milk production by dairy cows through a meta analysis. J Dairy Sci 2013;96:533 550.
Rev Mex Cienc Pecu 2022;13(4):943 961 957
The use of fluid whey presents itself as a suitable alternative to the use of water for rehydration of corn grains for silage, because in addition to being a sustainable alternative and that to preserve the environment, it also justifies its use by adding chemical, fermentative improvements and aerobic stability to the silage. In addition, these data suggest that more specific research is needed regarding the action of whey on the reduction of rehydrated corn grain silage fibers and the microbiological potential of the product to be used as a possible biological additive in the conservation of these silages.
1. Oliveira ER, Takiya SC, Del Valle AT, et al. Effects of exogenous amylolytic enzymes on fermentation, nutritive value, and in vivo digestibility of rehydrated corn silage.
8. Rektor A, Vatai G. Membrane filtration of Mozzarella whey. Desalination 2004; 162:279 286.
6. Silva CM, Amaral PNC, Baggio RA, et al. Estabilidade de silagens de grãos úmidos de milho e milho reidratado. Rev Bras Saúde Prod Anim 2016;17:331 343.
5. Kung Junior L, Schmidt RJ, Ebling TE, Hu W. The effect of Lactobacillus buchneri 40788 on the fermentation and aerobic stability of ground and whole high moisture corn. J Dairy Sci 2007;90:2309 2314.
Rev Mex Cienc Pecu 2022;13(4):943 961 958
10. Da Silva NC, Nascimento FC, Campos AMV, et al Influence of storage length and inoculation with Lactobacillus buchneri on the fermentation, aerobic stability, and ruminal degradability of high moisture corn and rehydrated corn grain silage. Anim Feed Sci Technol 2019;251:124 133.
16. Zenebon O, Pascuet NS, Tiglea P. Métodos físico químicos para análise de alimentos, Instituto Adolfo Lutz, São Paulo 2008;819 877.
7. Da Silva NC, Nascimento CF, Nascimento FA, Resende FD, Daniel JLP, Siqueira GR. Fermentation and aerobic stability of rehydrated corn grain silage treated with different doses of Lactobacillus buchneri or a combination of Lactobacillus plantarum and Pediococcus acidilactici J Dairy Sci 2018;101:4158 4167.
13. Sniffen CJ, O'Connor JD, Van Soest PJ, Fox DG, Russell JB. A net carbohydrate and protein system for evaluating cattle diets: II. carbohydrate and protein availability. J Anim Sci 1992;70:3562 3577.
18. Taylor CC, Kung Junior L. The effect of Lactobacillus buchneri on fermentation and aerobic stability of high moisture corn in laboratory silos. J Dairy Sci 2002;85:126 1532.
17. Playne MJ, McDonald P. The buffering constituents of herbage and of silage. J Sci Food Agric 1966;17:264 268.
14. Chandler P. Energy prediction of feeds by forage testing explorer. Feedstuffs 1990; 62:1 12.
15. Hall MB. Neutral detergent soluble carbohydrates nutritional relevance and analysis A laboratory manual. Gainesville, Florida, EUA, 2000.
9. Rezende AV, Rabelo SHC, Veiga MR, et al. Rehydration of corn grain with acid whey improves the silage quality. Anim Feed Sci Technol 2014;197:213 221.
12. Van Soest PJ, Robertson JB, Lewis BA. Methods for dietary fiber, neutral detergent fiber, and nonstarch polysaccharides in relation to animal nutrition. J Dairy Sci 1991;4:3583 3597.
11. AOAC. Association of Official Analytical Chemists. Official methods of analysis. (17th ed.) AOAC Internacional, Arlington, VA: AOAC International, 2000.
22. Tres TT, Bueno AVI, Jobim CC, Daniel JLP, Gritti VC. Effect of okara levels on corn grain silage. Rev Bras Zootec 2020;49:e20190184.
23. Mombach MA, Pereira DH, Pina DS, Bolson D, Pedreira BC. Silage of rehydrated corn grain. Arq Bras Med Vet Zootec 2019;71:959 966.
25. Kung Junior L, Shaver RD, Grant RJ, Schmidt RJ. Silage review: Interpretation of chemical, microbial, and organoleptic components of silages. J Dairy Sci 2018;101:4020 4033.
19. Phillip LE, Fellner V. Effects of bacterial inoculation of high moisture ear corn on its aerobic stability, digestion, and utilization for growth by beef steers. J Anim Sci 1992;70:3178 3187.
20. McDonald P, Henderson AR, Heron SJE. The biochemistry of silage 2 ed. Marlow, UK, 1991
21. Junges D, Morais G, Spoto MHF et al. Short communication: Influence of various proteolytic sources during fermentation of reconstituted corn grain silages. J Dairy Sci 2017;100:9048 9051.
Rev Mex Cienc Pecu 2022;13(4):943 961 959
24. Oude Elferink SJWH, Krooneman J, Gottschal JC, Spoelstra SF, Faber F, Driehuis F. Anaerobic conversion of lactic acid to acetic acid and 1,2 propanediol by Lactobacillus buchneri. Appl Environ Microbiol 2001;67:125 132.
26. Jobim CC, Nussio LG, Reis RA, Schmidt P. Avanços metodológicos na avaliação da qualidade da forragem conservada. Rev Bras Zootec 2007;36:101 119 27. Basso FC, Bernardes TF, Roth APTP, Rabelo CHS, Ruggieri AC, Reis RA. Fermentation and aerobic stability of high moisture corn silages inoculated with different levels of Lactobacillus buchneri. Rev Bras Zootec 2012;41:2369 2373.
1 Treatment: CON= corn grain silage rehydrated with water; SWF= corn grain silage rehydrated with whey fluid; SWF + I= corn grain silage rehydrated with fluid whey, plus inoculant; SWP= corn grain silage rehydrated with water reconstituted whey powder; SWP + I= corn grain silage rehydrated with powdered whey reconstituted with water, plus inoculant.
Rev Mex Cienc Pecu 2022;13(4):943-961 960 Table 1: Chemical quality (g/kg DM) of grain corn silages rehydrated with water, powdered whey and fluid whey Treatment 1 Variables 2 CON SWF SWP SEM 3 SWF SWP I SWP×SWF 4Without With Without With DM 633.4 ± 0.38 628.3 ± 0.53 637.0 ± 0.34 629.8 ± 0.68 625.7 ± 1.84 0.97 ns ns ns ns Ash 11.3 ± 0.25 11.1 ± 0.06 11.8 ± 0.05 12.0 ± 0.07 12.7 ± 0.06 0.06 ns ** * ** CP 103.0 ± 0.19 104.7 ± 0.42 103.2 ± 0.27 101.3 ± 0.17 104.7 ± 1.74 0.31 ns ns ns ns EE 37.0 ± 0.55 37.3 ± 0.35 41.8 ± 0.47 35.4 ± 0.30 43.6 ± 0.30 0.40 ** ns ns * NDF 122.1 ± 2.07 112.8 ± 0.77 128.6 ± 1.42 137.4 ± 2.21 101.4 ± 0.96 1.44 ns ns ns ns ADF 23.0 ± 0.46 20.2 ± 0.23 22.1 ± 1.00 14.7 ± 0.75 21.0 ± 0.21 0.27 ns * ** * Lignin 3.4 ± 0.57 3.3 ± 0.27 7.8 ± 0.14 3.4 ± 0.23 4.2 ± 0.31 0.24 *** ns ns **
2 DM= Dry matter (g/kg of natural matter); Ash= mineral matter; CP= crude protein; EE= ether extract; NDF= neutral detergent fiber; ADF= acid detergent fiber; TCHO= carbohydrates total; TDN= Total digestible nutrients; NFC= non fibrous carbohydrates. 3 SEM= standard error of the mean. 4 Interaction “SWF x SWP”. *P<0.01; ** P<0.05; *** P<0.10; ns= no significant.
TCHO 847.7 ± 0.77 847.0 ± 0.46 843.2 ± 0.22 851.3 ± 0.36 845.9 ± 2.01 1.04 ns ns ns ns TDN 812.9 ± 0.02 813.1 ± 0.01 812.8 ± 0.05 813.3 ± 0.04 813.0 ± 0.01 0.02 ns *** *** ** NFC 718.8 ± 2.64 734.2 ± 1.01 714.6 ± 1.29 714.0 ± 2.39 744.5 ± 2.49 2.12 ns ns ns ns
961
Rev
Cienc Pecu 2022;13(4):943 961
Table 3: Fermentative quality (g/kg DM) of grain corn silages rehydrated with water, powdered whey and fluid whey Treatment 1 Variables 2 CON SWF SWP SEM 3 SWF SWP I SWP×SWF 4Without With Without With NH3 N 0 h 0.6 ± 0.04 0.5 ± 0.02 0.4 ± 0.01 0.5 ± 0.009 0.4 ± 0.03 0.02 ns ns ns ns NH3-N-240 h 1.9 ± 0.08 0.7 ± 0.01 1.3 ± 0.04 0.9 ± 0.03 2,20 ± 0.08 0.05 * * ** * pH 0 h 4.53 ± 0.07 4.26 ± 0.09 4.43 ± 0.03 4.38 ± 0.14 4.35 ± 0.12 0.10 ** * ns ns pH 240 h 6.13 ± 0.08 4.31 ± 0.11 5.14 ± 0.70 5.44 ± 0.41 6.47 ± 0.18 0.33 * *** * * BC 259.9 ± 1.78 276.8 ± 5.27 266.3 ± 1.73 231.6 ± 3.03 243.4 ± 1.67 3.11 ns ns ** ns 1 Treatment: CON= corn grain silage rehydrated with water); SWF= corn grain silage rehydrated with whey fluid; SWF + I= corn grain silage rehydrated with fluid whey, plus inoculant; SWP= corn grain silage rehydrated with water reconstituted whey powder; SWP + I= corn grain silage rehydrated with powdered whey reconstituted with water, plus inoculant. 2 BC= buffering capacity (e.mg/100g DM); NH3 N= ammoniacal nitrogen g/kgof total nitrogen) and pH in opening (0h) and exposure to air (240 h); 3 SEM= standard error of the mean; 4 Interaction “SWF x SWP”. * P<0.01; ** P<0.05; *** P<0.10; ns= no significant. Mex
Growth performance and carcass classification of pure Pelibuey and crossbred lambs raised under an intensive production system in a warmhumid climate Miriam Rosas Rodríguez a Ricardo Serna Lagunes b Josafhat Salinas Ruiz a Julio Miguel Ayala Rodríguez c Benjamín Alfredo Piña Cárdenas d Juan Salazar Ortiz a* a Colegio de Postgraduados Campus Córdoba. Carretera Federal Córdoba Veracruz km 348, Congregación Manuel León, 94946, Amatlán de los Reyes, Veracruz, México.
962 https://doi.org/10.22319/rmcp.v13i4.6023Article
*Corresponding author: salazar@colpos.mx Abstract: The effect of breed on growth, characteristics, and carcass classification was investigated using 11 Charollais x Pelibuey (ChP) lambs, 10 Dorper x Pelibuey (DP) lambs, and 18 Pelibuey(P) lambs in an intensive production system in a warm humid climate. A significant effect of genotype (��<0.05) was observed on birth weight (BW), weaning weight (WW), and
b Universidad Veracruzana. Facultad de Ciencias Biológicas y Agropecuarias, región Orizaba Córdoba, Veracruz, México. c Colegio de Postgraduados. Campus Montecillo Ganadería. Estado de México, México. d Instituto Nacional de Investigaciones Forestales, Agrícolas y Pecuarias. Campo Experimental La Posta. Veracruz, México.
The Pelibuey is a medium sized hair breed and is distributed throughout a large portion of the Mexican territory(4). It is a breed that is used for meat production because it possesses hardiness characteristicsthatallowitto adapt todifferent climates(5,6).It haslowreproductive seasonality, high prolificacy, and resistance to parasites, although fattening animals have lower growth rates than the traditional wool breeds(7) . Due to their specific characteristics and under the conditions of the production systems in use in Mexico, Pelibuey sheep can be used as a maternal breed for crossing with other breeds specialized for meat production(6) to obtain lambs that develop carcasses with better meat conformation. However, the productive performanceand carcass characteristicsofthePelibueybreedhavebeenlesssatisfactorythan those of other breeds with better meat conformation(4) , and sometimes these carcass
Key words: Lamb, Hair sheep, Carcass, Commercial cuts, Meat. Received: 15/07/2021 Accepted: 31/01/2022
Rev Mex Cienc Pecu 2022;13(4):962 980 963 daily weight gain (DWG), all of which were higher in the ChP genotype. ChP and DP lambs reached commercial weight 35 and 23 d earlier, respectively than P lambs. Genotype has a marked influence on the carcass characteristics, affect conformation and classification of carcass. The probability of obtaining a carcass with good conformation and MEX 1 classification (good: MEX 1) is 72 % higher for the ChP genotype than for the P genotype. The loin and leg yields of the ChP genotype were higher than those of the other genotypes
Introduction
The pH, temperature, and instrumental color of the carcass, meat, and subcutaneous fat were affected by genotype. ChP lambs showed better growth, characteristics, and carcass classification than lambs of the DP and P genotypes
In Mexico, sheep production is important due to the high demand for and insufficient domestic production of meat(1). In warm-humid regions, local forage production is favorable, and sheep meat production could be improved year-round to meet domestic demand. In local sheep production systems, including those in warm-humid regions, meat production can be improved by the use of specific technologies and management strategies(2). One of these strategies is the crossing of local breeds such as the Pelibuey breed of sheep with large wool breeds to produce crossbred lambs, since the animals resulting from these crosses present greater daily weight gain(3) .
The research was conducted from 2015 to 2017 at the facilities of the Ovine Experimental Area of the Córdoba Campus Colegio de Postgraduados, located on the Córdoba Veracruz federal highway at km 348, Amatlán de los Reyes, Veracruz, Mexico. The geographic location is 18° 51' 20" N and 96° 51' 37" W, at an altitude of 650 m asl. The climate is warm humid with abundant rains in summer, the average annual temperature is 22 °C, and the annual rainfall is 2,000 mm(8). The experiment was conducted according to the criteria set forth in the Official Mexican Standard on technical specifications for the production and sanitary meat processing (NOM 009 ZOO 1994), technical specifications for the production and humane treatment in the mobilization of animals (NOM 051 ZOO 1995), use of laboratory animals (NOM 062 ZOO 1999), and methods for killing domestic and wild animals (NOM 033 SAG/ZOO 2014), in accordance with the Regulations for the Use and Care of Animals Intended for Research of the Colegio de Postgraduados.
Material and methods
Rev Mex Cienc Pecu 2022;13(4):962 980 964 characteristics are not improved by crossing with certain specialized wool breeds(5). Due to the recent introduction into Mexico of new breeds of sheep with greater specialization for meatproduction(forexample,theCharollaisand Dorperbreeds)andthepossibilitythatthese breeds maybe of potential use in crossing with the Pelibueybreed, it is necessary to evaluate the productive performance (birth weight, weaning weight, daily weight gain, and fattening days)andthecarcass meatcharacteristicsoflambs thatresultfromcrossing withthe Pelibuey Standardsbreed. for the evaluation of the quality of sheep carcass meat vary worldwide. To guide and strengthen the chain of production, processing, marketing, and consumption of sheep meat and to define the quality characteristics of sheep carcasses for national commercialization in Mexico, the Mexican standard for the classification of sheep carcass meat, NMX FF 106 SCFI 2006, was used. However, there are few reports of its application in the evaluation of sheep carcass meat. Likewise, there is little information on the growth andcharacteristicsofeitherpurebredPelibueylambsorlambsobtainedbycrossingthisbreed with breeds such as Dorper and Charollais. To meet the current and future demand of the domestic market, it is important to determine the effect of breed on the growth of lambs, their age at slaughter, and the qualityof the carcass meat for breeds currentlyin use in Mexico and thereby to generate information that contributes to the commercialization of quality carcass meat. The objective of the present study was to evaluate the effect of breed on the growth, characteristics, and carcass classification of purebred Pelibuey lambs and lambs obtained by crossing the Pelibuey breed with the Dorper and Charollais breeds.
Experimental animals and diet
Lamb growth performance
The weight of the lambs was measured at birth (within the first 24 h of life, BW) and every 15 d thereafter until they reached slaughter weight (approximately 45 kg). The lambs’ weaning weights (WW) were also recorded (approximately 75 d). The fattening days (FD) were determined as the number of days between weaning and slaughter. The daily weight gain (DWG)was determinedfrom thedifference in theslaughter weight and the WW divided by the FD. The lambs were slaughtered at similar average live weights Lamb carcass yield
Thirty nine (39) male lambs from an experimental herd: Charollais x Pelibuey (n= 11), Dorper x Pelibuey (n= 10), and Pelibuey (n= 18), were reared by their mothers. In the first week of lactation, the lambs stayed with their mothers; after this period, the ewes went out to pasture from 1000to 1400h,returningto nurse their youngandto stayall night. The lambs wereprovidedwith acommercialdiet(Agribrands PurinaMexico®creepfeeding)frombirth to weaning in feeders with restricted access for mothers. After weaning, the lambs were fed a diet of mechanically minced sugarcane forage with an approximate particle size of 3.0 cm and a commercial feed concentrate (Agribrands Purina Mexico®) containing 15% crude protein (CP) and consisting mainly of ground cereals, a combination of oilseed pastes, cereal by products, molasses, coconut paste, and vegetable oil. This food was offered freely to the lambs only once daily (0700 to 0800 h). Water was available ad libitum in cup drinkers. In the central region of Veracruz, Mexico, where the present study was developed, sheep producers manage the diet tested in this research during the fattening period. In this sense, the management conditions that sheep producers currently apply are being evaluated, so the diet of the sheep studied was not modified, in order to adopt and transfer the results of this research to the producer’s local sheep.
The slaughter of the animals was conducted in the municipal slaughterhouse of Orizaba, Veracruz, Mexico, at 18 km from the facilities of the Colegio de Postgraduados under the specifications established in standard NOM 033 SAG/ZOO 2014. Each lamb was individuallycarried, and the animals were transported at a population density of 0.2 m2/lamb to minimizethelikelihoodofinjury.Priorto slaughter(1200h),foodavailabilityto thelambs
Rev Mex Cienc Pecu 2022;13(4):962 980 965
Lamb carcass conformation-classification and commercial meat cuts
Rev Mex Cienc Pecu 2022;13(4):962 980 966 was reduced, and they were fasted for 4 h and transported to the slaughterhouse on the day of the slaughter. The live weight (LW) of the lambs was recorded at the slaughterhouse. They were then stunned using a captive bolt pistol, and exsanguination was performed through a cut in the carotid artery and the jugular vein. The animals were then skinned and eviscerated. Non carcass components such as thehead and hooves wereremovedand weighed separately. The weights of the blood, skin, full and empty green viscera, red viscera, and bile were also recorded. The hot carcass weight (HCW) was recorded immediately to determine the hot carcass yield (HCW/LW*100).
The carcasses were evaluated by five trained evaluators. The training of the evaluators consisted of several training sessions in ovine carcass quality. The photographic standards used for the evaluation of the carcasses obtained in this experiment are shown in Figure 1 The evaluation of the carcasses was based on the criteria of the Mexican standard for the classification of lamb carcasses (NMX FF 106 SCFI 2006)(9). This standard describes three carcass conformation categories (excellent, good, and deficient) and four quality grade categories for the complete carcass; in order of decreasing quality, the better are Mexico Extra (MEX EXT), Mexico 1 (MEX 1), Mexico 2 (MEX 2), and Out of Classification (O/C). The criteria for classification include age of the animal, slaughter weight, carcass conformation, and dorsal fat thickness in the longissimus dorsi muscle at the height of the 12th rib (fat/conformation ratio).
When the carcasses reached room temperature, they were stored in a cold room at 4 °C for 24 h, where they were hung by both Achilles tendons. Subsequently, the following measurements were made: cold carcass weight (CCW) for determining the cold carcass yield (CCW/LW), weight loss (HCW CCW), dorsal fat thickness, and rib eye perimeter. To determine the fat thickness and the area of the rib eye of the longissimus dorsi, a cut was made between the 12th and 13th ribs, the thickness of the dorsal fat was measured with a digital caliper, and the perimeter of the rib eye was drawn on acetate paper. The rib eye area was estimated from the perimeter using an LI 3100 leaf area meter (LICOR®, Lincoln, NE, USA).
Rev Mex Cienc Pecu 2022;13(4):962 980 967 Figure 1. Lamb carcasses classified according to the Mexican standard NMX FF 106 SCFI 2006
(A) Charollais x Pelibuey (Good conformation, MEX 1 quality grade); (B) Dorper x Pelibuey (Good conformation, MEX 1 quality grade); and (C) Pelibuey (Deficient conformation, MEX 2 quality grade). The carcasses were divided longitudinally along the dorsal spine. The right half was divided into six commercial sections in a modification of the procedure described: cuello (neck, 1st to 5th cervical vertebrae); hombro (shoulder, bone base: scapula and humerus including the first 5 ribs in a perpendicular section located under this); brazuelo (foreshank and breast, including the radius, from the 2nd to the 11th rib in a perpendicular section with the flank); costillar (ribs, 5th to 12th thoracic vertebrae); lomo (loin, longissimus lumborum from the 13th thoracic vertebra to the 7th lumbar vertebra); and pierna (leg, the section between the last lumbar vertebra and the first sacral vertebra)(10). The sections were weighed individually, and the yield (%) was determined with respect to the weight of the right half of the carcass(11)
Measurements of carcass color, temperature, and pH
Instrumental color, temperature, and pH of the carcasses were measured at 30 min and 24 h after slaughter. The instrumental color was measured according to the CIE L*a*b* scale. For the color30min of the carcass, the reading was made of the rectus abdominis muscle(11); for the color24h, the reading was made of the longissimus dorsi, and for the fat color, the reading was made of the fat coverage of the leg. A portable colorimeter was used to measure this variable (Mod CR 300/410, Minolta, Tokyo, Japan). Illuminant D65 was used as an observation standard at a visual angle of 10º and an 8 mm of aperture. The temperature of the hot carcass (HC) and that of the cold carcass (CC) were measured by inserting a food grade punch

Statistical analysis
The data were analyzed using the GLIMMIX procedure in SAS 9.3 (SAS Institute Inc., Cary, NC, USA). The type of breed was considered as the main effect in the model. For the DWG and FD variables, the following covariance model was used: yij =μ+breedi +(β+δi)Xij + animalj +εij; where ��=1,2,3; ��=1,⋯,39, ������ are the FD of breed i in animal ��, �� is the general mean, ������������ is the fixed effect due to genotype ��, (�� +����)������, �� is the intercept of the covariate ������ weaning weight, ���� is the slope of the genotype, �������������� is the random effect due to the animal, assuming ��������������~��������(0,�������������� 2 ), ������ is the experimental error with ��������~��������(0,��2). To analyze the variables of productive development, carcass characteristics, commercial cuts, and carcass and meat quality, the following mixed model was used: yij =μ+breedi +animalj +εij; where ��=1,2,3;��=1,⋯,39, ������ is the variable of the response of the type of cross ��, in animal ��, �� is the general mean, ������������ is the fixed effect due to breed, �������������� is the random effect due to the animal, assuming ��������������~��������(0,�������������� 2 ), ������ is the experimental error, assuming, ��������~��������(0,��2).
Rev Mex Cienc Pecu 2022;13(4):962 980 968 thermometer into the muscle mass (leg). The pH30min was measured using a potentiometer equipped with a puncture electrode (pH meter Mod HI 99163, Hanna, TX, USA) after calibration oftheequipment usingbuffersolutions at pH4.0and7.0,choosingthesamepoint forall thecarcasses.The pH24h ofthemeat (longissimus dorsi)was measuredaccordingusing a potentiometer (Mod pH 1100, Oaklon, Eutech Instruments, Singapore) previously calibrated with pH 4.0, 7.0, and 10.0 buffer solutions. All measurements were performed in triplicate.
The productive performance of the lambs according to genotype is shown in Table 1. The analysis of variance showed that there is a highly significant effect (��= 0.0001) of genotype on the variables BW, WW, and DWG. The average BW and WW were significantly greater in the Charollais x Pelibuey (ChP) genotype than in the Dorper x Pelibuey (DP) genotype (by 0.47 kg and 2.94 kg, respectively) and in the Pelibuey (P) genotype (by 0.69 kg and 4.05 kg, respectively). There was a significant effect of genotype (��=0.0020) and covariate weaning weight (��=0.0073) on the number of FD. The number of FD required for the lambs to reach commercial weight was not significantly different in ChP and DP lambs, but FD in those groups differed significantly from that in P lambs ChP and DP lambs reached commercial weight 35 and 23 d earlier than P lambs, respectively. The average daily weight gain (DWG) from weaning to slaughter differed significantly in the three groups; ChP and DP lambs showed higher DWG than P lambs (Figure 2). DWG was greater in the ChP genotype than in the DP genotype.
Rev Mex Cienc Pecu 2022;13(4):962 980 969 Fisher's LSD method and Satterthwaite's degrees of freedom correction method were used to compare means. The cumulative logit model was used to compare the carcass conformation and the quality grade of the genotypes. The linear predictor is ������ =���� +����, where ������ is the linear predictor in category ��th (�� = 0,1) for the ��th genotype (�� =1,2,3), ���� is the intercept for the ��th category, and ���� is the ��th fixed effect of the genotype. The Mexican standard for the classification of lamb carcasses establishes three categories for the conformationofthecarcass(excellent,good,anddeficient)andfourcategoriesforthequality grade of the whole carcass (in decreasing order of quality, these categories are MEX EXT, MEX 1, MEX 2, and O/C). In this study, only two categories for conformation (good and deficient) and two categories for quality grade (MEX 1 and MEX 2) were obtained and considered in the model for the analysis.
Results and discussion Lamb growth performance
Rev Mex Cienc Pecu 2022;13(4):962 980 970
Birth weight, kg 3.93 ± 0.24a 3.46 ± 0.24ab 3.24 ± 0.16b Weaning weight, kg 19.39 ± 0.91a 16.45 ± 0.92b 15.34 ± 0.60b FD (weaning to slaughter) 106.87 ± 7.07b 118.01 ± 6.76b 141.35 ± 5.36a DWG, kg/d (weaning to slaughter) 0.278 ± 0.01a 0.235 ± 0.01b 0.207 ± 0.01c FD= fattening days; DWG= daily weight gain; The data are reported as the mean ± the standard error. abc Means within the same row marked with different letters are significantly different (��<0.05).
Table 1. Productive behavior of Charollais x Pelibuey (ChP), Dorper x Pelibuey (DP), and Pelibuey (P) lambs Variable (n=ChP11) (n=DP 10) (n=P 18)
The present study showed that crossing of Pelibuey ewes with Charollais rams results in better productive development (BW, WW, FD and DWG) of lambs raised in conditions of high temperature and humidity, that is, in the study area where the present investigation was developed, the temperature varies from 12 to 32 °C (minimum of 9 °C and maximum of 37 °C) and it rains 25.1 d on a month with at least 1 mm of precipitation. The lambs from ewes with meat suitability (Katahdin) and rams of four breeds (Charollais, Dorper, Suffolk, and Textel) under better environmental conditions for the production of sheep (drytemperate climate at 1,962 m asl), were that the best productive behavior was found in lambs from the Katahdin x Charollais crossing(12). The production values cited in that studyare similar to the values found in the present study. The BW values found in this study are superior to those reported in other studies(13) in lambs from Black Belly x Pelibuey ewes and rams of three different breeds (Dorset, Hampshire, and Suffolk) and lambs from Pelibuey ewes and hair breed rams (Pelibuey, Katahdin, and Dorper), with average reported values of 3.18 ± 0.34 and 2.9 ± 0.09 kg, respectively. The DWG (kg/d) in the present study for the three genotypes was higher than the values in P (0.181 ± 0.02), Pelibuey x Suffolk (0.206 ± 0.03), DP (0.222 ± 0.03), F1 x Dorset (0.217 ± 0.05), F1 x Hampshire (0.219 ± 0.05), and F1 x Suffolk (0.222 ± 0.04) lambs(4,13). These differences may be due to the breeds used in the crossbreeding and to the management of the lambs during fattening. It is important to mention that no BW, WW, FD, or DWG values havepreviouslybeen reported fortheCharollais x Pelibuey(ChP)crossing. Forthefirst time, this study showed that the performance of ChP lambs with respect to the variables is better than that of other crosses, even under stressful climatic conditions of high temperature and humidity of study area. Thus, this crossing is a good alternative to produce sheep in the Figuretropics.2 shows the change in live weight from birth to 5.5 mo according to genotype. The graph shows that at the age of 5.5 mo, lambs of the ChP and DP genotypes showed a higher
The analysis of variance showed a highly significant effect of genotype on carcass weight loss (��=0.0072) and on the weight of empty green viscera (��=0.0001). This means that the Charollais x Pelibuey breed presented less loss of empty green viscera, followed by the Dorperx Pelibueybreed, whilethepurePelibueybreedhadalowerloss ofthis characteristic. There was no significant effect of genotype on the remaining variables (Table 2), such as weight loss, dorsal fat thickness, area of the rib, and red viscera, so the behavior of the characteristics of the carcasses was similar between races and crosses of sheep evaluated. y = 6.71x + 3.80 R² = 0.9952 y = 5.42x + 2.86 R² = 0.9964 y = 5.02x + 2.55 R² = 0.998545.040.035.030.025.020.015.010.05.00.0
Rev Mex Cienc Pecu 2022;13(4):962 980 971 growth rate, with average monthlyweight gains of 6.71 and 5.42 kg, respectively, than lambs of the P genotype (5.02 kg), despite the fact that the initial weights of the lambs of the three genotypes were verysimilar. ChP lambs reached the commercial weight for slaughter 35 and 12 d before lambs of the P and DP genotypes, respectively. The Dorper breed has been recommended for the production of lambs with meat suitability in crossbreeding(14) . However,the results obtained in this investigation showthat crossingofCharollais rams with Pelibuey ewes results in lambs that are more suitable to produce meat due to their better growth rate.
0 1 2 3 4 5 (kgweightLive ) Age (months) PDPChP
Figure 2. Change in live weight from birth to 5.5 months of age of Charollais x Pelibuey (ChP, closed circles), Dorper x Pelibuey (DP, open boxes), and Pelibuey (P, closed boxes) lambs. The regression lines are presented for each breed from birth to 5.5 mo of age
Lamb carcass yield
Cold carcass weight, kg 21.86 ± 0.46 21.03 ± 0.49 20.91 ± 0.36
abc Means within a row marked with different letters are significantly different (��<0.05).
Another important characteristic of the carcass is dorsal fat thickness Low values of this parameter are an indicator of lean meat, which is preferred in the Mexican market(5). The average dorsal fat thickness values in this study were very low (ChP= 1.51 ± 0.17 mm, DP= 1.63 ± 0.18mm,P=1.56± 0.13mm)despitethehighslaughterweight ofthe animals.Similar values have been reported for Pelibuey (1.2), Pelibuey x Kathadin (1.8 mm), DP (1.8 mm),
Empty green viscera, kg 3.84 ± 0.13c 4.31 ± 0.13b 4.87 ± 0.10a
The data are reported as the mean ± the standard error (SE).
Cold carcass yield, % 48.74 ± 0.43 48.90 ± 0.45 48.46 ± 0.33
Area of the rib, cm2 14.66 ± 0.69 15.43 ± 0.81 15.83 ± 1.33 Red viscera, kg 1.98 ± 0.39 1.98 ± 0.41 2.39 ± 0.30
Table 2. Characteristics of the carcasses of Charollais x Pelibuey (ChP), Dorper x Pelibuey (DP), and Pelibuey (P) lambs Variable (nChP=11) (nDP= 10) (nP = 18)
Loss of weight, kg 0.35 ± 0.03b 0.42 ± 0.03ab 0.50 ± 0.02a
Empty live weight, kg 44.85 ± 0.85 42.96 ± 0.89 43.17 ± 0.66
Dorsal fat thickness, mm 1.51 ± 0.17 1.63 ± 0.18 1.56 ± 0.13
In this study, genotype was not found to affect the CCYand lambs with standardized weights at slaughter and from hair sheep ewes and rams of the Dorset, Hampshire, Suffolk, Pelibuey, and Rambouillet breeds(5,13). Those authors showed that there were no significant differences in CCY among the genotypes studied, but the values reported for CCY were lower than those obtained in this investigation. Carcass yield can be affected by factors such as the age of the lamb, wool growth, nutrition, and breed(15) . Results in this research showed no effect of breed on the CCY. In this sense, state that with the standardization of the weight at slaughter, the carcass yield is not affected(5) . In this study, ChP lamb carcasses lost less weight at 24 h after slaughter (0.15 kg) than P and DP carcasses In contrast, in the crossing of Pelibuey with Rambouillet and Suffolk breeds, no differences were found in this variable(5)
Hot carcass yield, % 49.53 ± 0.44 49.89 ± 0.46 49.53 ± 0.34
Weight loss between hot and cold carcasses was lower in the ChP genotype; the weight of empty green viscera was significantly different among the three breeds and was higher in the hair breeds (P and DP). Lambs of the three genotypes showed similar average cold carcass yield (CCY) values because the weight of the animals at slaughter was standardized.
Rev Mex Cienc Pecu 2022;13(4):962 980 972
Hot carcass weight, kg 22.21 ± 0.47 21.45 ± 0.49 21.40 ± 0.36
Pelibuey x Rambouillet (1.7 mm), and Pelibueyx Suffolk (1.4 mm) lambs(16,17). On the other hand, higher values of dorsal fat thickness (6.33 ± 1.22 mm) have been reported in lambs obtained by crossing Kathadin ewes with Charollais rams(16). This may be because the Katahdin and Charollais breeds undergo rapid growth and accumulate dorsal fat at a young age compared to the Pelibuey breed, which is slower growing and tends to accumulate more visceral fat than dorsal fat(2)
The estimated probabilities of carcass conformation and quality grade according to genotype are shown in Figure 3. The f analysis showed a statistically significant effect among genotypes (�� <00382) on the carcass conformation and quality grade. Of the carcasses evaluated according to the NMX FF 106 SCFI 2006 standard, the ChP genotype showed better carcass conformation and quality grade than the DP and P genotypes. The lambs obtained from the crossing of Pelibuey ewes with the Charollais breed showed better carcass conformation and quality grade than the other animals, as shown by the fact that the probability of obtaining good conformation and MEX 1 quality grade in the ChP genotype is 0.10and0.72unitshigher,respectively, thanthatfortheDP andP genotypes.TheP genotype showed the highest percentage (72 %) of carcasses with deficient conformation and MEX 2 quality grade, whereas 10 % of the carcasses of the DP genotype and none of the carcasses of the ChP genotype displayed deficient quality and conformation. In general, crossbreeding DP and ChP resulted in better classification, better carcass conformation, and better quality grade than was obtained with genotype P.
Classification, conformation of the carcass, and commercial cuts
Rev Mex Cienc Pecu 2022;13(4):962 980 973
The rib eye area is an indicator of the muscle conformation of the carcass(18); the greater the rib eye area, the better is the muscle conformation. In this study, genotype did not influence the rib eye area or the area of the longissimus dorsi muscle (ChP= 14.66 ± 0.69 cm2, DP= 15.43 ± 0.81 cm2, and P= 15.83 ± 1.33 cm2). Lower values have been reported in DP (11.01 cm2), Pelibuey, Pelibuey x Rambouillet and Pelibuey x Suffolk (5.16 ± 0.13 cm2) and Black Belly(10.89 cm2)lambs(5,16,17,19).Thehighest rib eye area values (19.8 ± 0.5 cm2)were found in Kathadhhin x Charollais and Katahdin x Dorper lambs treated with β-adrenergic agonists during fattening(20). Breed, diet, and hormonal treatment affect muscle development(21) .
Rev Mex Cienc Pecu 2022;13(4):962 980 974 Figure 3. Estimated probabilities of achieving specific carcass conformation categories and quality grades for Charollais x Pelibuey (ChP), Dorper x Pelibuey (DP), and Pelibuey (P) lambs using a cumulative logit model
Theaverage weight ofthehalfcarcass andthe weight and yieldofcommercialcuts according to genotype are shown in Table 3. The analysis of variance showed a highlysignificant effect of genotype on the average weight of the neck (��=0.0036), loin (��=0.0339), and leg (��= 0.0001), but no significant effect of genotype was observed for the other commercial cuts or for the average weight of the half carcass. In the yield of the commercial cuts, there was a significant effect of genotype on the neck (��=0.0060), the foreshank+breast (��=0.0289), the loin (��=0.0484), and the leg (��=0.0088). The P genotype presented higher neck weight and yield than the ChP and DP genotypes, whereas only the P genotype presented greater loin weight than the DP genotype. It was observed that of the three genotypes ChP presented greater legweight and yield and greater foreshank+breast yield than the other two genotypes.
Figure 1 shows the photographic standards used to evaluate the carcasses obtained in this experiment. The crossing of Pelibuey ewes with rams from the Charollais and Dorper breeds conferred better carcass conformation and quality grade because the latter two breeds present better meat conformation(1) than the pure Pelibuey breed. In this study, the crossing of Katahdin x Charollais was shown to yield carcasses with excellent conformation and MEX EXT quality grade; in that case, both of the breeds used in the cross are suitable for meat production(16) .
1 0.9 0.278 0 0.1 0.7220.80.60.40.201 ChP DP P Probability Genotype Good/MEX 1 Deficient/MEX 2
Foreshank+breast 24.28 ± 1.05a 21.91 ± 0.99ab 20.59 ± 0.79b Ribs 10.51 ± 0.35 11.22 ± 0.33 10.47 ± 0.26
Table 3. The average weight of the half carcass and the weight and yield of the commercial cuts of Charollais x Pelibuey (ChP), Dorper x Pelibuey (DP), and Pelibuey (P) lambs Variable ChP (n = 11) DP (n = 10) P (n = 18)
Foreshank+breast 2.43 ± 0.12 2.23 ± 0.13 2.13 ± 0.09 Ribs 1.18 ± 0.07 1.14 ± 0.07 1.14 ± 0.06
Half-carcass weight 10.45 ± 0.26 10.17 ± 0.27 10.36 ± 0.20
Loin 1.58 ± 0.08ab 1.46 ± 0.08b 1.72 ± 0.06a Leg 3.44 ± 0.09a 3.13 ± 0.09b 3.15 ± 0.08b Yield of commercial cuts (%) Neck 5.68 ± 0.37b 5.64 ± 0.35b 6.96 ± 0.28a Shoulder 15.52 ± 0.44 15.51 ± 0.42 14.83 ± 0.33
Loin 15.31 ± 0.71ab 14.39 ± 0.68b 16.57 ± 0.53a Leg 32.81 ± 0.58a 31.35 ± 0.55ab 30.41 ± 0.43b
Commercial cuts (kg) Neck 0.58 ± 0.03b 0.56 ± 0.03b 0.71 ± 0.02a Shoulder 1.57 ± 0.05 1.57 ± 0.05 1.54 ± 0.04
The data are reported as the mean ± the standard error (SE). ab Means within the same row marked with different letters are significantly different (��<0.05). The leg and loin are cuts of great commercial value and represent 43.3 % of the yield of the carcass(10). In this study, the yield obtained for both cuts was greater than the reported value in all three genotypes: ChP (48.12 %), DP (45.74 %), and P (46.98 %). In this study, the crossing of Pelibuey with Charollais resulted in greater weight of the leg, which is a cut of high commercial value(5).However,1to 4%differences among the genotypes were observed in the weights of the neck, loin, leg, and foreshank+breast cuts minimal differences in the weights of the majority of commercial cuts in the evaluation of 15 wool breeds specialized for the production of wool or meat(22). In crossbred lambs of hair breeds (DP) and hair x wool breeds and reported differences in cut yield of approximately 1%, similar to the differences found in this study(23) . pH, temperature, and instrumental color of the carcass and meat Table 4 presents the average values of pH, temperature, and instrumental color of the rectus abdominis muscle, meat, and subcutaneous fat according to genotype. Of the variables measured in the carcass, T30min (��=0.0658), L* (��=0.0001), and a* (��=0.0107) were affected by genotype. The analysis of variance also showed significant differences in the variables
Rev Mex Cienc Pecu 2022;13(4):962 980 975
Table 4. The pH, temperature, and instrumental color of the rectus abdominis muscle and meat of Charollais x Pelibuey (ChP), Dorper x Pelibuey (DP), and Pelibuey (P) lambs Variable (nChP=11) (nDP= 10) (nP = 18) pH30min 6.64 ± 0.06 6.72 ± 0.06 6.75 ± 0.04 pH24h 5.66 ± 0.02a 5.61 ± 0.02ab 5.59 ± 0.02b T30min (°C) 39.88 ± 0.23a 39.37 ± 0.24ab 39.19 ± 0.18b T24h (°C) 4.64 ± 0.19 4.20 ± 0.20 4.33 ± 0.15 Rectus abdominis L* 41.35 ± 0.78b 38.20 ± 0.82c 44.32 ± 0.61a a* 12.78 ± 1.40b 13.30 ± 1.46b 17.80 ± 1.09a b* 0.81 ± 0.33 0.94 ± 0.35 1.22 ± 0.26 dorsiLongissimus 24h L* 33.69 ± 0.66b 32.61 ± 0.69b 37.31 ± 0.51a a* 14.73 ± 0.42b 13.84 ± 0.45b 17.24 ± 0.33a b* 4.29 ± 0.23a 3.33 ± 0.24b 4.66 ± 0.18a Subcutaneous fat L* 68.41 ± 1.38b 67.98 ± 1.45b 73.15 ± 1.08a a* 3.32 ± 0.45 3.6 ± 0.48 3.14 ± 0.35 b* 4.29 ± 0.46 4.31 ± 0.49 4.93 ± 0.36
Rev Mex Cienc Pecu 2022;13(4):962 980 976 pH24h (��=0.0607), L* (��=0.0001), a* (��=0.0001), and b* (��=0.0006), measured in the meat (longissimus dorsi) and in L* (��=0.0001) of the subcutaneous fat; no differences were observed in the remaining variables. The ChP genotype presented a higher carcass temperature than the P genotype; however, the 24 h post mortem temperature was similar among the three genotypes (T24h, ��=0.2643) because the carcasses were maintained under the same storage conditions (24 h at 4°C). The average value of pH24h was greater in the ChP genotype than in the P genotype.
The data are reported as the mean ± the standard error (SE) ab Means within the same row marked with different letters are significantly different (��<0.05).
The pH and color of meat are important indicators of quality and influence the visual appearance of the meat(24). The difference in pH at 24 h post mortem among the genotypes in this studywas probably because the T30min of the carcass tends to be lower in hair breeds than in wool breeds(25) , and it has been shown that the meat of fast growing lambs tends to have a higher pH(26). However, the pH24h values for the three genotypes in this study fell within the preferred range for this parameter(27) The color of the rectus abdominis muscle (30 min post mortem) was significantly affected by genotype in this study. The values of a* were similar to those reported in Rasa Aragonesa lamb carcasses for different thicknesses of dorsal fat with a slaughter weight of 50 60 kg(28) . Values higher reported in the present study for L* (51.12) and a* (11.64) in Rasa Aragonesa lambs, with a slaughter weight of 24 kg(29) .
Rev Mex Cienc Pecu 2022;13(4):962 980 977 In the color of meat (longissimus dorsi), the ChP and DP genotypes presented indices of L* (luminosity) and a* (red) lower than those presented by the P genotype. During storage, the ferric metmyoglobin (MetMb) accumulation rate on the surface of the meat is governed by intrinsic factors (age of the animal, breed, sex, diet, pH, and metabolic type of the muscle) and extrinsic factors (temperature, oxygen availability, lighting, growth of surface microbes, and type of packaging) or a combination of these factors(30,31). In this study, it was observed that genotype affected the color of the meat; meat color was probably also affected by the exposure time of the carcasses prior to cold room storage(26) Found an effect of genotype on the a* and b* indices of meat color in hair breed lambs and lambs obtained by crossing hair and wool breeds(32) With respect to subcutaneous fat, there were no significant differences in the indices a* (��= 0.7484)orb* (��=0.4617) amongthe three genotypes.Theb* (yellow)index ofsubcutaneous fat was similar in the three genotypes because the lambs underwent the same management during fattening and remained stabled; grazing lambs tend to have higher b* index values(26) due to the presence of high levels of carotenoids in the fat(32) , resulting in a yellow color that is unattractive to consumers.
Conclusions and implications Breed had a significant effect on the growth, characteristics, and classification of lamb carcasses. The crossing of Pelibuey sheep with the Charollais breed (ChP) resulted in higher DWG. ChP and DP lambs reached commercial weight one month earlier than P lambs. With the ChP crossing, there is a high probability (0.72) of obtaining carcasses that show good conformation and good quality grade (MEX 1). Therefore, the ChP crossing can be an option for the commercial breeding and fattening of lambs to produce quality meat in hot, humid climates In this study it was found that the genotype of the evaluated sheep presented different conditions in the composition of the meat, such as an increase in pH, temperature variations, changes in theinstrumentalcolorofthecarcass, amount ofmeat andsubcutaneous fat, however, these parameters are within the acceptable ranges of meat quality for each breed. In this sense, it is feasible for sheep producers in the Center of Veracruz, México that they can use the crosses of the breeds evaluated in this study to maintain or increase the productivity of their herds.
6. Partida de la Peña JA, Braña VD, Jiménez SH, Ríos RFG, Buendía RG. Producción de carne ovina. Libro técnico. 2013;5:6 18.
We thank the Liaison Branch of the Colegio de Postgraduados Campus Córdoba for the support provided for this work in the Microregion de Atención Prioritaria. This research was funded and was supported by a student scholarship from Consejo Nacional de Ciencia y Tecnología (CONACyT) Mexico The authors declare no conflicts of interest. Literature cited:
9. Secretaría de Economía. Productos pecuarios carne de ovino en canal clasificación. 1ra ed. Distrito Federal, México. Secretaría de Economía. 2006.
8. García E. Modificación al sistema de clasificación climática de Koppen. 5a ed. México, Distrito Federal. Universidad Nacional Autónoma de México. 2005.
7. Wildeus S. Hair sheep genetic resources and their contribution to diversified small ruminant production in the United States. J Anim Sci 1997;75:630 640.
3. Pineda J, Palma JM, Haenlein GFW, Galina MA. Fattening of Pelibuey hair sheep and crossbreds (Rambouillet Dorset×Pelibuey) in the Mexican tropics. Small Ruminant Res 1998;27(3):263-266.
1. Partida JA, Vázquez E, Rubio MS, Méndez D. Effect of breed of sire on carcass traits and meat quality of Katahdin lambs. J Food Res 2012;1(4):141 149.
5. Gutiérrez J, Rubio MS, Méndez RD. Effects of crossbreeding Mexican Pelibuey sheep with Rambouillet and Suffolk on carcass traits. Meat Sci 2005;70(1):1 5.
4. Partida de la Peña JA, Braña VD, Martínez RL. Desempeño productivo y propiedades de la canal en ovinos Pelibuey y sus cruzas con Suffolk o Dorset. Téc Pecu Méx 2009;47(3): 313 322.
Rev Mex Cienc Pecu 2022;13(4):962 980 978
10. Martínez DE, Núñez GFA, Rodríguez AFA. Manual para la evaluación de corderos en pie y en canal. Chihuahua, México. Universidad Autónoma de Chihuahua. 2007.
Acknowledgments and declaration of conflict of interest
2. Muñoz-Osorio GA, Aguilar-Caballero AJ, Sarmiento-Franco LA, Wurzinger M, CámaraSarmiento R. Technologies and strategies for improving hair lamb fattening systems in tropical regions: A review. Ecosist Recur Agropec 2016;3(8):267 277.
12. Hinojosa-Cuéllar JA, Oliva-Hernández J, Torres-Hernández G, Segura-Correa JC. Productive performance of F1 Pelibuey × Blackbellylambs and crosses with Dorper and Katahdin in a production system in the humid tropic of Tabasco, México. Archiv Med Vet 2013;45(2):135 143.
14. Vázquez Soria ET, Partida de la Peña JA, Rubio Lozano M, Méndez Medina D. Comportamiento productivo y características de la canal en corderos provenientes de la cruza de ovejas Katahdin con machos de cuatro razas cárnicas especializadas. Rev Mex Cienc Pecu 2011;2:247 258.
15. Gardner, GE, Williams A, Ball AJ, Jacob RH, Refshauge G, Hocking EJ, Behrendt R, Pethick DW. Carcass weight and dressing percentage are increased using Australian Sheep Breeding Values for increased weight and muscling and reduced fat depth. Meat Sci 2015;99:89 98.
13.Bores QRF, Velázquez MPA, Heredia A. Evaluación de razas terminales en esquemas de cruza comercial con ovejas de pelo F1. Téc Pecu Méx 2002;40:71 79.
17. Ríos FG, Gómez Vázquez A, Pinos Rodríguez JM, García López JC, Estrada Angulo A, Hernández Bautista J, Portillo JJ. Effect of breed on performance and carcass characteristics of Mexican hair sheep. South African J Anim Sci 2011;41:275 279.
18. Hopkins DL, Wotton JSA, Gamble DJ, Atkinson WR. Lamb carcass characteristics. 2. Estimation of the percentage of saleable cuts for carcasses prepared as ’trim’ and traditional cuts using carcass weight, fat depth, eye muscle area, sex, and conformation score. Australian J Exp Agr 1995;35(2):161 169.
19.Salinas RíosT,Sánchez Torres EsquedaMT,Hernández BautistaJ,Díaz CruzA,Nava Cuellar C, et al. Carcass characteristics, physicochemical changes and oxidative stress indicators of meat from sheep fed diets with coffee pulp. Arq Brasileiro Med Vet Zoot 2014;66:1901 1908.
20. Partida de la Peña JA, Cesaya RTA, Rubio LMS, Méndez MRD. Efecto del clorhidrato de zilpaterol sobre las características de la canal en cruzas terminales de corderos Katahdin. Vet Méx OA. 2015;2:1 13.
16. Estrada A, Dávila H, Herrera RS, Robles JC, La OO, Castro BI, Portillo JJ, Ríos FG, Contreras G. Carcass characteristics and yield of the primary cuts of lambs fed broom millet (Sorghum bicolor var. Technicum, jav). Cuban J Agr Sci 2012;46:145 150.
Rev Mex Cienc Pecu 2022;13(4):962 980 979
11. Colomer F, Morand FP, Kirton AH, Delfa R, Sierra I. Métodos normalizados para el estudio de los caracteres cuantitativos y cualitativos de las canales caprinas y ovinas. Madrid, España, Cuadernos del INIA. 1987
27. Sañudo C Calidad de la canal y de la carne en los ovinos: factores que la determinan. Rev Argentina Prod Anim 2006;26:155 167 28. Sañudo C, Alfonso M, Sánchez A, Delfa R, Teixeira A. Carcass and meat quality in light lambs from different fat classes in the EU carcass classification system. Meat Sci 2000;56:89 94. 29. Ripoll G, González Calvo L, Molino F, Calvo JH, Joy M. Effects of finishing period length with vitamin E supplementation and alfalfa grazing on carcass color and the evolution of meat color and the lipid oxidation of light lambs. Meat Sci 2013;93:906 913. 30. Jeong JY, Hur SJ, Yang HS, Moon SH, Hwang YH, Park GB, Joo ST. Discoloration characteristics of 3 major muscles from cattle during cold storage. J Food Sci 2009;74:C1 C5. 31. Renerre M. Factors involved in the discoloration of beef meat. Int J Food Sci Technol 1990;25:613 630. 32. Burke JM, Apple JK, Roberts WJ, Boger CB, Kegley EB. Effect of breed type on performance and carcass traits of intensively managed hair sheep. Meat Sci 2003;63:309 315.
25. Hernández Cruz L, Ramírez Bribiesca JE, Guerrero Legarreta MI, Hernández Mendo O, Crosby Galvan MM, Hernández Calva LM. Effects of crossbreeding on carcass and meat quality of Mexican lambs. Arq Brasileiro Med Vet Zoot 2009;61:475 483.
21. Ferreira OGL, Rossi FD, Coelho RAT, Fucilini VF, Benedetti M. Measurement of rib eye area by the method of digital images. Rev Brasileira Zoot 2012;41:811 814.
24. Hopkins DL, Fogarty NM. Diverse lamb genotypes 2. Meat pH, colour and tenderness. Meat Sci 1998;49:477 488.
22. Kirton AH, Carter AH, Clarke JN, Sinclair DP, Mercer GJK, Duganzich DM. A comparison of 15 ram breeds for export lamb production 2. Proportions of export cuts and carcass class. NZ J Agr Res 1996;39:333 340.
Rev Mex Cienc Pecu 2022;13(4):962 980 980
26. Priolo A, Micol D, Agabriel J, Prache S, Dransfield E. Effect of grass or concentrate feeding systems on lamb carcass and meat quality. Meat Sci 2002;62:179 185.
23. Santos CV, Ezequiel JMB, Morgado ES, de Sousa JSC. Carcass and meat traits of lambs fed by products from the processing of oil seeds. Acta Scient Anim Sci 2013;35:387 394.
981 https://doi.org/10.22319/rmcp.v13i4.6065Article
Sander Martinho Adams a* John Lenon Klein a Diego Soares Machado b Dari Celestino Alves Filho a Ivan Luiz Brondani a Luiz Angelo Damian Pizzuti a a Universidade Federal de Santa Maria. Laboratório de Bovinocultura de Corte. Av. Roraima nº 1000 Cidade Universitária, Camobi, Santa Maria RS, Brazil. b Instituto Federal de Educação Ciência e Tecnologia Farroupilha Alegrete. Brazil.
*Corresponding author: sander.adams@hotmail.com
Abstract: The objective of the meta analysis was to evaluate the effects of beef cows weight variation during the 2nd and / or 3rd trimester pregnancy on some parameters of the progeny carcass. The cow weight gain during this gestational period was calculated to standardize the treatments: moderate loss (ML= cows that lost 0 to 5 % of weight) and moderate gain (MG= cows that gained 0 to 5 % of weight). The effect size for all parameters was calculated as medium difference (MD) with a 95% confidence interval and heterogeneity determined using the Q test and the I2 statistic. A random effects meta analysis was performed for each indicator separately as the medium control and experimental groups. The cow’s weight variation during the studied time variation did not influence the progeny carcass characteristics (P>0.05). Although, a trend towards greater hot carcass weight (P=0.15) and thickness of subcutaneous fat (P=0.10) was observed in calves from MG cows in relation to calves from ML cows. However, the meta analysis demonstrated that small variations in cow weight during the final half of pregnancy do not affect progeny carcass characteristics.
Effect of weight and body condition score from pregnant cows on the carcass characteristics of their progeny: Meta-analysis
According to Reynolds et al(4), the structural and functional changes in organs and tissues caused by the supply of nutrients during pregnancy serve to allow a rapid adaptation of the developing fetus to the pressure of uterine environmental selection. These changes can be related to the health and productive potential of the progeny in adulthood. However, the nutritional challenge during fetal formation can form a phenotype with greater adaptability when nutritional conditions were more challenging in the postnatal period(5) . Thus, the effects of fetal programming are more noticeable in the first months from progeny's life(6). The authors state that the real effects of fetal programming in beef cattle are still contradictory and need further clarification, since there are many divergences between researches, such variability of the studied nutrients, gestational period and intensity of nutritional restriction, as well the progeny characteristics evaluated. Therefore, the objective of this meta analysis was to evaluate the effects of cow weight variation during pregnancy at progeny carcass characteristics.
Key words: Beef cows, Marbling. Steers. Subcutaneous fat.
Accepted: 30/05/2022
Rev Mex Cienc Pecu 2022;13(4):981 994 982
Received: 16/09/2021
Introduction Among factors that can influence the postnatal performance of beef cattle, it can be highlight the cow nutritional insults during pregnancy, uterine changes, also known as fetal programming. The prenatal development of cattle influences productive performance throughout the postnatal period(1). The authors add that the number of muscleand fat cells an animal will have throughout its lifeis determined in thefetalphase and is influenced by pregnant cow nutrition, because the myogenesis and adipogenesis processes are exclusive from the fetal period(2). Thus, Du et al(3), conclude that calves of cows kept under restricted supply of nutrients during pregnancy have a compromised meat production potential.
This meta analysis was performed using combined data from 10 studies (9 peer reviewed articles, 1 doctoral thesis), with a total record of 1053 calves during termination and after slaughter phases. When possible, the same study was inserted two or more times in the meta analysis database. The reviewed studies evaluated the effects of maternal nutrition during gestation on the postnatal performance of progeny, as described in Table 1. Table 1: Description of the studies included in the database for conducting the meta analysis Local BreedCow Sex BWInitial 1 ± Supl. No Supl. 228 228 228 ± Supl. Supl. ± 9 Supl. x No Supl. ± Supl. x No Supl.
24 24 24 24 9 2019 ARG A Male 408 ± 54 HighCPxLow CP 24 24 24 24 10 2015a USA AxS Male 440 ± 28 Positiveenergy status x Negative 11 11 11 11 11 2015b USA AxS All 463 ± 3 Positiveenergy status x Negative 101 101 101 101 12 2013 USA A Male 575
7
Rev Mex Cienc Pecu 2022;13(4):981 994 983 Material and methods
Comparations Number of observations HCW SFT M LDA 7 2013 USA AxC All 534
x
15
40 40 40 40 13 2015 USA AxS Male 600
Literature search
71 71 71 71
14
228 7 2013 USA AxC All 534 ± 14 High ECC x Low ECC 228 228 228 228 8 2009 USA AxS Male 498
x No
Literature searches were performed using specific search databases on the platforms: Scientific Electronic Library Online (https://scielo.org), Portal de Periódicos Capes (https://www.periodicos.capes.gov.br), ScienceDirect (https://www.sciencedirect.com) and Google Scholar (http://scholar.google.com).
The searches were based on the keywords: “fetal programming in beef cows and the performance of steers progeny” or “fetal programming in beef cattle and progeny performance.” The literature searches included publications from the last ten years (2009 2019).”
Study Year
Data selection and group formation
In total, 21 studies published between 2009 and 2020 were identified from the pre established search. The criteria established for inclusion of studies in database were: 1) possibility of calculating cow average daily weight gain during gestation and adequacy to treatments; 2) provide carcass progeny variables; 3) the period of nutritional insult occurs in second or third pregnancy trimester (cow greatest demand); and 4) report information on sample size and variability measurements of interest (i.e. deviation or standard error). In case of studies that reported the standard error of mean (S.E.M.), the standard deviation (σ) was it obtained through the equation: �� =�� �� ��∗ √�� A total of 11 studies obtained by the search terms were excluded from this meta analysis because theydid not answer the criteria mentioned above: criterion 1) 6 studies excluded; criterion 2) 2 studies excluded; criterion 3) 3 studies excluded. A large number of studies were excluded from this research for not meeting the inclusion criteria. In addition, this is justified by the wide variation between studies, especially concerning the intensity of food restriction and distance between treatments, period of food restriction, as well as the great diversity of variables evaluated, as reported by Klein et al(6) in a literature review on the subject.
Four carcass traits of the progeny selected as response variables, including males and females. Forthismeta analysis,themeasurements ofhotcarcassweight(HCW),obtained prior to entering the cold chamber, subcutaneous fat thickness (SFT), marbling and Longissimus dorsi area (LDA) used. These last three measurements obtained in the Longissimus dorsi muscle between the 12th and 13th ribs. The average daily weight gain (ADG) evaluated during the breastfeeding period, and the post weaning ADG considered as the daily weight gain of calves during the rearing phase.
Inclusion and exclusion criteria
Cow breed, A= Aberdeen Angus; S= Simental; C= Charolês; N= Nelore. 1 Initial body weight (kg) of cows and ± SEM. Variables, HCW= Hot carcass weight; SFT= Subcutaneous fat thickness; M= Marbling; LDA= Longissimus dorsi area. CP= crude protein; TDN= total digestible nutrients.
Rev Mex Cienc Pecu 2022;13(4):981 994 984 14 2016 USA AxS Male 684 ± 7 100% TDN x 125% TDN 86 86 86 86 15 2019 BRA CxN Male 413 ± 8 Weight Gain x Moderate Loss 240 240 240 Total 1053 1053 813 1053
Statistical analyses were performed using the software R version 4.0.2(16), through the ‘meta’ package, ‘metacont’ function(17). Egger’s linear regression asymmetry was used to examine the presence of publication bias(18), with a significant bias value when P<0.05, throughthe 'metabias'function. Inaddition, funnel plots wereusedto evaluatepublication bias in meta analysis through the 'funnel' function. The funnel plot graphically shows the precision of the estimated intervention effect, where smaller studies had a wider variance and largerones hadless spreadofvariability. Intheabsenceofbias,thefunnel plot should be approximately symmetrical. The effect size was calculated as the mean difference (MD), which is the difference between the control and experimental groups (subgroups weight gain and severe loss WG and SL from cow’ body weight). The MD requires that all studies have the same unit of measurement but allows for the interpretation of effect size in the original units(19). The effects of variation in the weight of the cow during gestation were expressed in forest plot graphs, constructed from the 'forest' function, using the estimated MD. The meta package provides a forest plot with the effect size and weighted contribution to each study from fixed and random effect models(17) . The consistency of results between the experiments was quantified using the measures of heterogeneity of the Chi-square test (Q) and I2 statistics(20) , which quantifies the impact of heterogeneity on the meta analysis, whit a mathematical criterion independent of the number of studies and the metric effect of each treatment. Although the Q test is helpful in identifying heterogeneity, the measure I2 was used to measure heterogeneity(20). The I2 statistic is given by:
In this meta analysis, the moderate loss (ML) is used as a control group. The data for each study, such as number of replicates, means and standard deviations, organized in Microsoft® Office Excel® spreadsheets for further analysis. Meta analytical procedure
The weight variation of cows during gestation was used to standardization the tested effects (treatments), according to the equation below: ���� = (���� ����) ���� ��100 where WV represents the variation in weight of the cow between the beginning of the experimental period and calving; IW represents the weight of the cow at the beginning of experiment; FW represents the weight of cow at calving.
Rev Mex Cienc Pecu 2022;13(4):981 994 985
This standardization was necessarydue to great variabilityof treatments of the researches included in the database. Thus, the meta analysis consists of two groups according to weight variation classes: moderate loss (ML= cows that lost 0 to 5 % of weight during gestation)andmoderategain(MG=cowsthat gained0to5 %ofweightduringgestation).
The funnel plots for cow weight variation effect, during pregnancy at progeny carcass characteristics are expressed in Figure 1, and no substantial asymmetry was observed in most characteristics analyzed(22) .
where Q is the χ2 heterogeneity statistic and k is the number of trials. The I2 statistic describes the percentage of variation across studies due to heterogeneity. Negative values of I2 are set equal to zero; consequently, I2 lies between 0 and 100%(21). Its value might not be important if it falls within the range 0 40 %. However, a value of 30 60 % often indicatesmoderateheterogeneity,50 90%mightrepresentsubstantialheterogeneity,and value in the range of 75 100 % represents considerable heterogeneity(22) .
Results
Rev Mex Cienc Pecu 2022;13(4):981 994 986 ��2(%)= �� (�� 1) �� ��100
The variation from cow weight (ML and MG), the number of studies, the mean gross difference and the size of the effect of each variable, P values and heterogeneity, are demonstrated in Table 2. Egger’s test showed that the variables evaluated don’t have publication bias (P>0.05).
In general, the meta analysis did not identifymajoreffects ofcowweight variationduring pregnancy at progeny carcass characteristics (P>0.05). Despite the low studies number published in this research line, the hot carcass weight showed a favorable trend for the progeny of MG cows (P=0.15), which produced 3.25 kg more carcass at progeny from MLcows (Figure 2). Likewise, animals from MG cows at gestation end showed tendency (P=0.10) for greater thickness of subcutaneous fat compared to animals from ML cows (Figure 3). The average difference was 0.05 cm between the groups studied.
a) Hot carcass weight; b) Subcutaneous fat thickness; c) Marbling; d) Longissimus dorsi area. Each point represents an individual randomized trial. The y axis is the standard error of the trials and the x axis is the effect size. The Larger studies appear toward the top of the plot and cluster around of effect size (mean) and smaller studies appear toward the bottom of the plot. When publication bias has occurred one expects an asymmetry in the scatter of small studies with more studies showing a positive result than those showing a negative result.
Rev Mex Cienc Pecu 2022;13(4):981 994 987 Figure 1: Funnel plot for cow weight variation during gestation at progeny performance
AItem, HCW= Hot carcass weight; SFT= Subcutaneous fat thickness; M= Marbling; LDA = Longissimus dorsi area. BP value for MD, *Significant at 5% probability; ** Tendency; NS Not significant. CP value for Q statistics; I2, Statistics of the estimated heterogeneity. DP value for Egger’s test; Number of studies (k<10) too small to test for small study effects(18) .
Table 2: Effect size and heterogeneity for weight variation in beef cows during pregnancy on progeny performance ItemA studiesofNumber MD intervalsconfidence95% P value-B Q P value-C I2 (%) P value-D kgHCW, 10 3.23 1.25, 7.72 0.1580** 2.54 0.9797 0 0.7841 cmSFT, 10 0.05 0.01, 0.10 0.1030** 8.07 0.5275 0 0.0825 pointsM, 9 0.16 12.96, 12.63 0.9802NS 9.61 0.2932 17 cm²LDA, 10 1.13 0.55, 2.82 0.1881NS 15.20 0.0857 41 0.9031

The solid line of the x axis is the no effect line and dotted lines represent the estimated difference of the random model; therefore, the points to the left of the line represent a reduction in the trait, while the points to the right of the line indicate an increase. Each square relative weight of the study of the overall estimate of effect size with the larger squares representing a larger weight. The upper and lower bound of the squared line represents the upper and lower confidence intervals of 95% for the size of the effect. The diamond at the bottom represents the 95% confidence interval for the global estimate. The progeny of ML and MG cows didn’t show differences (P= 0.9802) in meat marbling content (Figure 4), with average value of 438 points, equivalent to small marblingcontent according the classification used. Likewise, the Longissimus dorsi area was not influenced (P= 0.1881) by weight variation from pregnant cows (Figure 5).
The solid line of the x axis is the no effect line and dotted lines represent the estimated difference of the random model; therefore, the points to the left of the line represent a reduction in the trait, while the points to the right of the line indicate an increase. Each square relative weight of the study of the overall estimate of effect size with the larger squares representing a larger weight. The upper and lower bound of the squared line represents the upper and lower confidence intervals of 95% for the size of the effect. The diamond at the bottom represents the 95% confidence interval for the global estimate.
Figure 2: Forest plot for hot carcass weight (HCW, kg) of the progeny from cows with different weight variations during gestation
Figure 3: Forest plot for subcutaneous fat thickness (SFT, cm) of the progeny from cows with different weight variations during gestation
Rev Mex Cienc Pecu 2022;13(4):981 994 988


* 100 = Practically Devoid; 200 = Traces; 300 = Slight; 400 = Small; 500 = Modest.
Figure 5: Forest plot for Longissimus dorsi area (LDA, cm2) of the progeny from cows with different weight variations during gestation
Rev Mex Cienc Pecu 2022;13(4):981 994 989
The solid line of the x axis is the no effect line and dotted lines represent the estimated difference of the random model; therefore, the points to the left of the line represent a reduction in the trait, while the points to the right of the line indicate an increase. Each square relative weight of the study of the overall estimate of effect size with the larger squares representing a larger weight. The upper and lower bound of the squared line represents the upper and lower confidence intervals of 95% for the size of the effect. The diamond at the bottom represents the 95% confidence interval for the global estimate.
Discussion Among factors that can modify the uterine environment(23), maternal nutrition during pregnancy stands out, which according to the authors can modify developing fetus
Figure 4: Forest plot for Marbling (points*) of the progeny from cows with different weight variations during gestation
The solid line of the x axis is the no effect line and dotted lines represent the estimated difference of the random model; therefore, the points to the left of the line represent a reduction in the trait, while the points to the right of the line indicate an increase. Each square relative weight of the study of the overall estimate of effect size with the larger squares representing a larger weight. The upper and lower bound of the squared line represents the upper and lower confidence intervals of 95% for the size of the effect. The diamond at the bottom represents the 95% confidence interval for the global estimate.


The cow weight gain during late pregnancy did not improve the Longissimus dorsi area (Figure 5), corroborating the findings of Rodrigues et al(24). This result may be a consequence of environmental adaptation of cow calves after birth. Webb et al(5) describe that malnutrition or foodrestriction duringpregnancy ends up producinga phenotype that has greater adaptive skills when exposed to unfavorable environments in adulthood. Ramírez et al(27) conclude that the severe nutrient restriction during pregnancy can also compensate for the individual’s growth after birth, when it is exposed to restricted environments also after birth. Bell et al(28) also add that there may be a plasticity of postnatal rearing systems in regulation of muscle hypertrophy capable of overcoming the negative effects at pregnancy nutritional restriction.
The trends for higher hot carcass weight and subcutaneous fat thickness for the progeny of MG cows presented in Figures 2 and 3, respectively. The results corroborate the theories described by Du et al(2), who state that improving nutrition during the final stage of pregnancy favors the processes of myogenesis and adipogenesis of progeny, and consequently improves muscle mass and fat in the carcass. In a similar study, Rodrigues et al(24) obtained higher HCW in cows that gained up to 10 % of their body weight during pregnancy compared to cows that lost 0 to 10 % and 10 to 20% of weight during that period. The authors did not observe changes in SFT in that study. Body growth depends on the processes of hyperplasia and hypertrophy of preformed muscle fibers during pregnancy(2), and the nutritional restriction in this period impairs these processes due to the lower nutritional priority compared to other fetal tissues and organs(25)
Rev Mex Cienc Pecu 2022;13(4):981 994 990 metabolism and physiology. Several studies have demonstrated interferences from nutrition of the pregnant cow and the consequent variation in cow's weight and body score, but with many divergences, on the progeny performance in adulthood. In the meta analysis, it was found some influences of cow’s weight variation at final gestation period on the steer’s carcass characteristics.
Unlike subcutaneous fat, the weight variation of the pregnant cow did not alter the intramuscular fat deposition, known as marbling fat (Figure 4). Like the body fat deposition, the formation of adipocytes during pregnancy follows a chronological sequence. In a scheme presented by Du et al(26), there is sequential and overlapping deposition of visceral, subcutaneous, intermuscular and intramuscular fat. Du et al(3) conclude that the formation of intramuscular adipocytes, the last to be formed, can extend over the first months of an individual’s life (approximately 250 d). Thus, postnatal life nutrition could have more effect than fetal programming intramuscular adipogenesis(27) , according to the results obtained in the present meta analysis, since adipocytes, despite being scarce, can increase their size as nutritional leftovers occur. In general, the similarity in adipose tissue deposition may be a consequence of the small variation in weight among cows that lost or gained weight during pregnancy, with an average of less than 5%.
3. Du M, Wang B, Fu X, Yang Q, Zhu MJ. Fetal programming in meat production. Meat Sci 2015;109(1):40 47.
Rev Mex Cienc Pecu 2022;13(4):981 994 991
1. Zago D, Canozzi MEA, Barcellos JOJ. Pregnant cow nutrition and its effects on fetal weight a meta analysis. J Agric Sci 2019;157(1):1 13.
The results obtained in this meta analysis indicate that small cow's weight variations effects during the second and / or third trimester of pregnancy are difficult to be found in adulthood and post slaughter carcass characteristics of the progeny.
In addition to the greater adaptation capacity from progeny in postnatal life, the fetal programming effects and the nutrients supply of the fetus can be dependent on metabolic adaptation capacity of pregnant cows. Bauman et al(29) describe that nutrient partition of cows through hemorrhagic and homeostatic mechanisms, where the fetus has nutritional body priorities. These mechanisms may explain the mobilization of body reserves and cow weight loss duringpregnancyto maintain an adequate supply of nutrients to the fetus under moderate conditions of nutritional restrictions(5). Thus, a small reduction in body weight of the pregnant cow, within 0 to ± 5%, can be accepted in production systems as it does not interfere with the progeny carcass characteristics.
2. Du M, Tong J, Zhao J, Underwood KR, Zhu MJ, Ford SP. Nathanielsz PW. Fetal programming of skeletal muscle development in ruminant animals. J Anim Sci 2010;88(1):51 60.
In general, the absence of effects on pregnant cow nutrition at carcass characteristics verifiedin this studycan beattributedto thelow weight variationor challenge to pregnant cows. The intensity of nutritional insult is an important factor to be considered in evaluation of the effects from fetal programming on offspring quality. Therefore, the adoption of a nutritional system that provides weight gain to pregnant cows not only depend on progeny performance evaluation, but also on a economic analysis of the entire calf production cycle according the desired goals.
Literature cited:
Thus, these results corroborate those of Klein et al(6), who found through the literature review that effects of fetal programming, or pregnant cow nutrition, are more noticeable in the early months of the progeny 's life, with lesser effects with the advancing age of these animals. Brameld et al(30) complement that, with enough time during postnatal life, the animal is able to overcome or compensate for most of these initial differences, resultinginonlysmall(ifany)residualeffectsonbodycompositioninlatergrowthstages.
Conclusions and implications
Rev Mex Cienc Pecu 2022;13(4):981 994 992
11. Mohrhauser DA, Taylor AR, Underwood KR, Pritchard RH, Wertz Lutz AE, Blair AD. The influence of maternal energy status during midgestation on beef offspring carcass characteristics and meat quality. J Anim Sci 2015;93(1):786 793.
13. Wilson TB, Schroeder AR, Ireland FA, Faulkner DB, Schike DW. Effects of late gestation distiller’s grains supplementation on fall calving beef cow performance and steer calf growth and carcass characteristics. J Anim Sci 2015;93(1):4843 4851.
5. Webb MJ, Block JJ, Funston RN, Underwood KR, Legako JF, Harty AA, et al Influence of maternal protein restriction in primiparous heifers during mid and/or late gestation on meat quality and fatty acid profile of progeny. Meat Sci 2019;152(1):31 37.
6. Klein, JL, Soares DSM, Adams SM, Alves Filho DC, Brondani IL. Efeitos da nutrição materna na gestação sobre a qualidade da progênie uma revisão. Res Soc Dev 2021;10(2):1 10.
9. Maresca S, López Valiente S, Rodriguez AM, Testa LM, Long NM, Quintans GI, Pavan E. The influence of protein restriction during mid to late gestation on beef offspringgrowth, carcass characteristicand meat quality. Meat Sci 2019;153(1):103108.
14. Wilson TB, Faulkner DB, Shike DW. Influence of prepartum dietary on beef cow performance and calf growth and carcass characteristics. Livest Sci 2016;184(1):21 27.
8. Larson DM, Martin JL, Adams DC, Funston RN. Winter grazing system and supplementation during late gestation influence performance of beef cows and steer progeny. J Anim Sci 2009;87(1):1147 1155.
12. Mulliniks JT, Mathis CP, Cox SH, Petersen MK. Supplementation strategy during late gestation alters steer progeny health in the feedlot without affecting cow performance. Anim Feed Sci Technol 2013;185(1):126 132.
4. Reynolds LP, Borowicz PP, Caton JS, Crouse MS, Dahlen CR, Ward AK. Developmental programming of fetal growth and development. Vet Clin North Am Food Anim Pract 2019;35(1):229 247.
10. Mohrhauser DA, Taylor AR, Gonda MG, Underwood KR, Pritchard RH, Wertz Lutz AE, Blair AD. The influence of maternal energy status during mid gestation on beef offspring tenderness, muscle characteristics, and gene expression. Meat Sci 2015;1101:201 211.
7. Bohnert DW, Stalker LA, Nyman A, Falck SJ, Cooke RF. Late gestation supplementation of beef cows differing in body condition score: Effects on cow and calf performance. J Anim Sci 2013;91(1):5485 5491.
23. Tsuneda PP, Hatamoto ZLK, Duarte Júnior MF, Silva LES, Delbem RA, Motheo TF. Efeitos da nutrição materna sobre o desenvolvimento e performance reprodutiva da prole de ruminantes. Invest 2017;16(1):56 61.
24. Rodrigues LS, Moura AF, Alves Filho DC, Brondani IL, Klein JL, Adams SM, Cocco JM, Pereira LB. Análise dos componentes principais da variação de peso da vaca durante a gestação na programação fetal em fêmeas. Res Soc Dev 2021;10(2):1 14.
25. Zhu MJ, Ford SP, Means WJ, Hess BW, Nathanielsz PW, Du M. Maternal nutrient restriction affects properties of skeletal muscle in offspring. J Physiol 2006;575(1):241 250.
20. Lean IJ, Rabiee AR, Duffield TF, Dohoo IR. Invited review: Use of meta analysis in animal health and reproduction: Methods and applications. J Dairy Sci 2009;92(8):3545 3565.
18. Egger M, Smith GD, Schneider M, Minder C. Bias in meta analysis detected by a simple, graphical test. BMJ 1997;315(1):629 634.
22. Higgins JPT,ThompsonSG,Deeks JJ,AltmanDG.Measuringinconsistencyin meta analyses. BMJ 2003;327:557 560.
26. Du M, Huang Y, Das AK, Duarte MS, Dodson MV, Zhu MJ. Manipulating mesenchymal progenitor cell differentiation to optimize performance and carcass value of beef cattle. J Anim Sci 2013;91(1):1419 1427.
19.AppuhamyJADRN,StratheAB,JayasundaraS,DijkstraJ,FranceJ,KebreabE.Anti methanogenic effects of monensin in dairy and beef cattle: A meta analysis. J Dairy Sci 2013;96(8):5161 5173.
27. Ramírez M, Testa LM, Valiente SL, La Torre E, Long NM, Rodriguez AM, Pavan H, Maresca S. Maternal energy status during late gestation: Effects on growth performance, carcass characteristics and meat quality of steers progeny. Meat Sci 2020;164(1):1 7.
17. Schwarzer G. Meta: General package for meta analysis. 2016. https://cran.r project.org/web/packages/meta/index.html, Accessed 15 July, 2020.
16. R CoreTeam. R: Alanguageand environment forstatistical computing. R Foundation for Statistical Computing, Vienna, Austria, 2020.
21. Lean IJ, Thompson JM, Dunshea FR. A meta analysis of zilpaterol and ractopamine effects on feedlot performance, carcass traits and shear strength of meat in cattle.
15. Rodrigues LS. Nutrição no terço final da gestação: eficiência produtiva da vaca e desempenho da progênie até os doze meses de idade. [doctoral thesis]. Brazil, RS: Universidade Federal de Santa Maria; 2019.
PLoS One 2014;9(12):1 28.
Rev Mex Cienc Pecu 2022;13(4):981 994 993
29. Bauman DE, Currie B. Partitioning of nutrients during pregnancy and lactation: a review of mechanisms involving homeostasis e homeorhesis. J Dairy Sci 1980;63(9):1514 1529.
28. Bell AW, Greenwood PL. Prenatal origins of postnatal variation in growth, development and productivity of ruminants. Anim Prod Sci 2016;56(8):1217 1232.
30. Brameld JM, Greenwood PL, Bell AW. Biological mechanisms of fetal development relating to postnatal growth, efficiency and carcass characteristics in ruminants, in: Greenwood PL, et al, editors. Managing the prenatal environment to enhance livestock productivity. Dordrecht: Springer Science and Business Media 2010;93 120.
Rev Mex Cienc Pecu 2022;13(4):981 994 994
995 https://doi.org/10.22319/rmcp.v13i4.6006Article
Abstract: A cross sectional study was conducted with the purpose of determinate the risk factors associated with the serological frequency of small ruminant lentivirus (SRLV) in sheep and goats from northeastern Mexico. From 128 herds, 71 of goats, 32 of sheep and 25 mixed herds (goats + sheep), 768 individual sera were collected from animals ≥1 yr old. From each herd, 4 to 5 serum samples were mixed and analyzed byELISA to identify antibodies against SRLV glycoprotein 135. Samples were obtained from randomly selected animals in 2019 and 2020. A questionnaire was applied to the producers and the data were analyzed to
Risk factors associated with lentivirus seroprevalence in sheep and goat herds from northeastern Mexico Rogelio Ledezma Torres a José C. Segura Correa b Jesús Francisco Chávez Sánchez a Alejandro José Rodríguez García a Sibilina Cedillo Rosales a Gustavo Moreno Degollado a Ramiro Avalos Ramírez a* a Universidad Autónoma de Nuevo León, Nuevo León. Facultad de Medicina Veterinaria y Zootecnia. Campus de Ciencias Agropecuarias, calle Francisco Villa s/n colonia Ex Hacienda El Canadá, 66050. General Escobedo, Nuevo León, México. b UniversidadAutónoma deYucatán Facultadde MedicinaVeterinaria yZootecnia.Campus de Ciencias Biológicas y Agropecuarias. Mérida, Yucatán, México. *Corresponding author: ramiro.avalosrm@uanl.edu.mx
Received: 11/06/2021
Accepted: 07/04/2022 Introduction In northeastern Mexico, sheep and goats are the two species of ruminants with the greatest territorial dispersion and form one of the main economic livelihoods for the rural population of this area(1,2). In most of the herds from this area, a semi-extensive management system is practiced, in which the animals graze during the day, and before the spend the night in artisanal pens made of plant material from the region. Usually, no protein supplement, vitamins are offered, or adequate sanitary management is applied. Reports associated with health, reproduction and productivity disorders are common in herds(3,4,5). Obviously, the lack of technical assistance,training, absence orlackof biosecurity, amongothers, contribute to these health problems(2,6) .
Key words: Retrovirus epidemiology, Small ruminants, Arthritis, Veterinary care, Biosecurity on farms.
Rev Mex Cienc Pecu 2022;13(4):995 1008 996 determine the risk factors associated with herd seropositivity by logistic regression. The proportion of seropositive herds, overall, was estimated at 50.6 %. According to the type of herd, seropositivity in goat herds was 62.0 %, in sheep herds 25.4 % and 50.2 % in mixed herds. The risk factors associated with the presence of antibodies against SRLV were the presence of animals with arthritis, veterinary care, reuse of needles, nerve alterations, low pregnancy rate, type of herd and mastitis. Serological frequency indicates a high endemicity of SRLV in small ruminant herds from northeastern Mexico.
Of the viral agents that affect sheep and goats, the infection caused by the small ruminant Lentivirus (SRLV) has become relevant in recent years(7,8). SRLV is a non zoonotic virus of the genus Lentivirus, subfamily Orthoretrovirinae and family Retroviridae, highly contagious and infectious among goats and sheep(9). Initially, SRLV was named caprine arthritis encephalomyelitis virus or ovine progressive pneumonia virus (also called Maedi Visna virus) since it was considered as two different pathogens specific to goats and sheep, respectively. However, it has been recognized that this virus can cross the species barrier and infect both ruminants(10,11). In addition, molecular genetic studies have shown that, genetically, SRLV is the same virus, so it is currently recognized as a single virus with viral variants adapted to goats and sheep(12). SRLV infections are lifelong and are characterized
SRLV infections have a worldwide distribution(7) and are associated with significant economic losses(15,16) In Mexico, the serological presence of SRLV in goats from Mexico was reported in 1985(17) and the isolation of the virus in 1999(18). The serological presence of SRLV in goat herds from northeastern Mexico was reported in 1994(19). Initially, a higher seroprevalence of SRLV was estimated in goat herds under intensive management in milk production and newly imported from the United States of America(17,19). In Mexico, serological detection(20,21,22) and pathological damage associated with SRLV infection in goats and sheep(23) have been reported. Until 2012, Mexico was considered free of SRLV infection in sheep, but this infection is currently considered endemic and is within group 3 ofdiseasesandpestsinthenationalterritory(24).Serological andmolecularevidenceofSRLV infection in Mexican Pelibuey sheep was demonstrated in herds of Jalisco, Veracruz and Chiapas(25), State of Mexico and Querétaro(22). However, studies of the presence, effects and impact of SRLVs on the health and productivity of goats and sheep from Mexico are scarce. The coexistence and multiple interrelationships between small ruminant populations in Mexico, particularly in the northeast of the country, usually increases the risk of acquisition and spread of SRLV and other pathogens(6,22). It is known that sheep and goats can harbor multi species infectious agents with the potential to affect these and other animal species and even humans(26,27). In fact, SRLV can be considered within this category, so associated infections could trigger disease outbreaks and mortality. Given these conditions, a high serological frequency of SRLV at the herd level is considered and can be potentiated by at least one risk factor. Therefore, the objective of this study was to estimate the seroprevalence and determine the risk factors associated with Small Ruminant Lentivirus infection in sheep and goat herds in northeastern Mexico.
Rev Mex Cienc Pecu 2022;13(4):995 1008 997 by causing a chronic multisystem inflammatory disease, with slow and progressive development, that may or may not manifest itself clinically in the life of the animal(13). They are characterized by gradual emaciation that leads to poor body condition and shortness of breath associated with interstitial pneumonia; alterations in the central nervous system, multiplearthritisandindurativemastitisinbothspecies(9).Theclinicalmanifestationdepends on the genetic characteristics of the infecting SRLV strain, its tissue tropism, the affected animal species and its genetics(9,14)
Rev Mex Cienc Pecu 2022;13(4):995 1008 998
A cross sectional study was conducted, selecting 128 herds located in northeastern Mexico, in the states of Coahuila, Nuevo León and Tamaulipas. The management system of the herds was mostly semi extensive. In general, the animals showed nutritional, reproductive and health complications. Number of herds and animals sampled A total of 768 animals were sampled from 71 goat herds, 32 sheep herds and 25 mixed herds (n=128 herds). For the state of Nuevo León, the sampling considered the total number of ranches registered in the 2017 list of beneficiaries of the Sustainable Livestock Production and Livestock and Beekeeping Management Program obtained by the Secretariat of Agriculture, Livestock, Rural Development, Fisheries and Food of Mexico. For the states of Coahuila (Laguna Region) and Tamaulipas, the animals sampled were herds of farmers who, in a direct interview, expressed their desire to cooperate. The sample size of 128 herds and 768 animals was calculated using the computer program EpiMuestra(28). Because there was no information on SRLV infections for goats and sheep in northeastern Mexico, the following was considered: an expected prevalence of 50 %, a confidence level of 95 % and absolute accuracyof 5 %. The sampling was in two stages, first selecting the herds and then the animals within each herd, arbitrarily considering a design effect of 2(28). The sampling unit for analysis was the herd. Serological analyses were analyzed by groups that corresponded to a homogeneous mixture of 4 to 5 sera per herd(29) at a rate of 200 μL per animal. The herd whose serum mixture was positive in the commercial ELISA test was considered positive. Serum samples and their handling Serum samples were obtained between the autumn of 2019 and late spring of 2020. Blood was obtained by puncture of the jugular vein and vacuum tubes with coagulation activator gel (Becton Dickinson, www.bd.com). The samples were identified and transported to the
Material and methods Location and characteristics of herds
Rev Mex Cienc Pecu 2022;13(4):995 1008 999 laboratory under refrigeration conditions at 7 °C (±3) in a polystyrene container. In the laboratory, the sera were separated from the clot after centrifuging the tubes at 2,500 rpm for 5 min. Each serum sample was deposited in new sterile plastic tubes of 2 ml. Each tube was labeled with its individual code, date and origin. All samples were stored at 20 °C in the serum bank of the Laboratory of Virology of FMVZ UANL, until their use in the ELISA test.
Field information collection
Detection of anti-SRLV antibodies
The detection of anti SRLV antibodies was performed by competitive ELISA with the commercial kit Small Ruminant Lentivirus Antibody Test Kit, cELISA, (WMRD Inc., Pullman, WA, USA). This test detects antibodies directed against highly conserved antigenic sites of glycoprotein 135 of caprine arthritis encephalomyelitis virus. The sensitivity and specificity reported for the test was 100 % and 96.4 %, respectively(30). The reading of the reaction in each well was made at an optical densityof 650 nm in the ELISA reader (ELx800, Bio Tek®) and using the computer package KC Junior software (www.biotek.com). The presence of antibodies was derived from the calculation of the percentage of inhibition according to what was recommended by the manufacturer, using the formula: I = 100 {1 (OD of the sample/ OD of the NC)}
Where: Iis thepercentageofinhibition;ODisthe opticaldensitydetected;NC isthenegative control. For the validation of the test, an average of the OD of the NC ≥ 0.300 was considered. If the I value of the sample was ≥ 35 %, it was considered as positive, while an I <35 % as negative(30)
The identification of possible risk factors was determinated based on the responses of the farmers in an individually applied survey. The survey consisted of 30 questions, and they included aspects of the type of farm, health and animal health aspects, as well as the identification and location of the herd.
From the positive reactions in the ELISA test of each herd, the actual seroprevalence of SRLV was estimated by means of the online tool WinEpi version 2.0(31). For the estimation of proportions and 95 % confidence intervals (CI95%), the sensitivity and specificity reported by the manufacturer of the ELISA kit was included(30). To determine the association between risk factors and SRLV seropositivity, initially, possible risk factors were identified in a univariate analysis bythe Chi square test or Fisher’s exact test (PROC FREQ). Those factors with a (P>0.20) were subjected to a multivariate logistic regression analysis (Table 1) by means of the LOGISTIC procedure. Factors significant to Fisher’s exact test with fewer than 5 observations were not included in the logistic regression analysis. All analyses were performed using the statistical package SAS of 2010.
Rev Mex Cienc Pecu 2022;13(4):995 1008
Results and discussion
1000 Statistical analysis
Herd seroprevalence
The herd seroprevalence value against SRLV of 50.6 %, obtained in the present study (Table 1), is consistent with those obtained in other parts of the world(30,31,32) but contrasts with previous studies conducted in Mexico(21,33,34,35). Recently, Martínez Herrera et al(33), using an indirect ELISA test, reported a lower herd level seroprevalence in Creole goats from Veracruz, Mexico, with 6.4 %. Also, Torres Acosta et al(21), using agar gel immunodiffusion (AGID), reported in 2003 an apparent seroprevalence of 3.6 % in goat herds, mostly Creole from thestateof Yucatan, Mexico.Previously, in 1984Adams et al(34),using AGID, reported at the individual level in goats from the State of Mexico and Guanajuato serological frequenciesof22.1 %and6.3%,respectively.Thesesame researchersmentionednot finding antibodies in native Creole goat herds(34). Santiago et al(35), using the same ELISA test as the present study, found a herd level seropositivity of 41.3 % in samples of goats from the state of Guanajuato, Mexico. According to the above, the design of the study, the management, type and purpose of the herds, as well as the lack of biosecurity measures against SRLV probably influenced the seropositivity parameters of the present and each of the previous studies. In 1984 and1985, ahighseropositivityin goats ofdairybreeds importedintoMexico and absence of seropositivity in native Creole goats were reported(17,34). These observations and data from the present study suggest that SRLV entered native Creole herds from northeastern Mexico perhaps through contact with imported breed goats for the purpose of improving productivity. In the present study, no significant difference was found(36) between
Risk factors associated with serology at the herd level
Rev Mex Cienc Pecu 2022;13(4):995 1008 1001 the seroprevalence of the types of herds, of goats (63.0 %), of sheep (25.4 %) or mixed (50.2%).Thesedatacontrast with thoseobtainedinsimilarherdsfrom othercountries(30,31,32) in which the seropositivity indices are relatively low compared to those of the present study. However, this coincides with what has been reported in previous studies for the management of a single species, either sheep or goats(32,36,37) and when they are managed under mixed conditions(36). The type of serological test used, the management and characteristics of the environment could explain the differences found.
After analysis in contingency tables, a total of 21 factors out of 30 were selected to evaluate their association with SRLV seropositivity in goat and sheep herds. The risk factors that contributed significantly to the explanation of SRLV seropositivity were: type of herd, veterinary care, multiple use of needles, low pregnancy rate, presence of animals with arthritis, report of nerve alterations and animals with mastitis; these last three alterations associated with chronic inflammatory processes (Table 2). The logistic regression analysis showed a significant effect of the same factors as in Fisher’s exact test or Ji square test; but the following factors were not included: herd size, introduction of animals, quarantine, biosecurity and mixed herds because each of them had ≤5 observations. Several reports(32,33,36) have indicated these last variables as risk factors so they were included in the discussion. Table 2 shows the risk factors associated with SRLV seropositivity in goat and sheep herds from northeastern Mexico. In northeastern Mexico, it is relatively common to findmixedgoat sheepherds.Thecoexistenceofbothspeciescouldfacilitatethetransmission ofSRLVnot onlythrough direct contact but also throughtheintakeof colostrumormilk(37,38) and through other management practices such as the use of needles in several animals during the application of medicines, vaccines or identification earrings(6,37,39)
Table 1: Prevalence of antibodies against small ruminant lentivirus (SRLV) in sheep and goat herds in northeastern Mexico Herd n (+) ActP CI95% Goats 71 45 62.0 50.7 73.3 Sheep 32 9 25.4 10.3 40.5
Mixed (goats + sheep) 25 13 50.2 30.6 69.8 Overall 128 67 50.6 41.9 59.2
ActP = actual prevalence, *Sensitivity (100%) and specificity (96.4%) of the ELISA test(30), 95% confidence level(31)
Rev Mex Cienc Pecu 2022;13(4):995 1008 1002
Table 2: Herd seroprevalence and risk factors for SRLV seropositivity in goat and sheep herds from northeastern Mexico Variable n Seroprevalence P Odds Ratio (IC95%) ART YesNo 63 82.5 <0.0001 31.3 (6.7 142.8) 65 23.1 1 CARE YesNo 19 94.7 <0.0001 11.9 (1.0 142.9) 109 44.9 1 NEED YesNo 69 63.8 0.005 9.6 (2.1 43.5) 59 38.9 1 NERV YesNo 47 78.7 <0.001 7.4 (1.9 28.6) 81 37.0 1 PREG YesNo 50 74.0 <0.0001 6.8 (1.8 25.6) 78 38.5 1 HER CaprinoMixtoOvino 71 63.4 0.0041 5.4 (1.0 28.2) 25 52.0 2.2 (0.4 12.3) 32 28.1 1 MAST YesNo 66 71.2 <0.0001 4.9 (1.3 17.9) 62 32.5 1 CI = class intervals, ART = presence of arthritis, CARE = veterinary care, NEED = repeated use of needles, NERV = presence of nerve alterations, PREG = low pregnancy rate, HER = type of herd, MAST = presence of mastitis. A strong association was found between the type of herd, of goats (OR 5.4; CI95%= 1.0 28.2) or mixed (goats + sheep) (OR 2.1; CI95%= 0.3 12.3), with SRLV seropositivity. Similar observations have reported that the presence of goats is a risk factor that contributes to the SRLV seropositivity in sheep(39,40). Herd size has been reported as another important factor that influences SRLV seropositivity, because one of the routes of transmission of this virus is through direct contact between infected animals(36,39,40). However, this variable was excluded from the logistic regression analysis due to the low number of observations and to meet the data qualitycriteria for analysis. In the present work, a strong association was found between the presence of animals with arthritis (OR 31.2; CI95%= 6.7 142.8) and with mastitis (OR 4.8; CI95%= 1.3-17.8) in seropositive herds. SRLV infections are characterized by being stronglyrelated to these clinical-pathological conditions(40,41,42).Forsheep,a high association has been reported between the occurrence of mastitis and SRLV infection in endemic
Rev Mex Cienc Pecu 2022;13(4):995 1008 1003 herds(9,39,40). In a recent study, it was determined that when the goat farmer recognizes the presence of arthritis, SRLV infection is widespread in the herd(42). It has also been proposed that the development of arthritis depends on the genetic characteristics of the infectingSRLV strain(43). What was observed in the present studyindicates that animals with chronic arthritis are present with high frequencyin seropositive herds regardless of the animal species and the type of management. An association was found between reproductive problems and SRLV seropositivity. Herds in which the producer recorded a low pregnancy rate (≤50 %) were more likely to be seropositive than those with pregnancy rates ≥50 %. Few studies have focused on knowing the impact of SRLV on reproduction in small ruminants. Recently, the ability of this virus to induce intrauterine infections in small ruminants and be transmitted via semen either with artificial insemination or natural mounting was reported(44). However, no association was found between the presence of abortions or animals with low birth weight in the herd, which contrasts with previous studies in which the delayed development of newborn kids was associated with the seropositivity of the mother(37,39). Probably, the differences between the two observations are explained due to the nature of both studies or the bias in the responses given by the producers in the present research. Interestingly, an association (P<0.0001) was found between SRLV seropositivity and veterinary care (OR=11.9; CI95%= 1.0 142.8). An important form in the horizontal transmission of SRLV is contact with humans, particularly the movement of veterinarians and workers between and within herds(39). It is possible to consider that veterinarycare would playan important role in controlling SRLV infection; the increase in seropositivity in herds of small ruminants with vectorization by the veterinarian from one herd to another during their visits has been reported(39). The data obtained in the present work probably reflect that the same veterinarian cares for different herds. This was not included in the surveys, allowing the horizontal transfer of the virus in the region studied due to ignorance of the presence of the virus in the region, its consequences and forms of dispersion. One study indicates that the presence of humans, as well as the number of employees and years of experience in management within herds are related to the presence and circulation of the virus(39) .
On the other hand, the absence of biosecurity, hygiene and disinfection measures greatly increases the presence of SRLV infection(42). Therefore, it is necessary to make producers aware of this agent, as well as to let them know the biosecurity guidelines to prevent the circulation of the virus in their herds. Based on the above, the epidemiological observations indicated for more than 25 yr for SRLV in goats from Mexico are confirmed and expanded(17,19,34). In addition to this, the present work is the first serological report of SRLV infection in sheep from northeastern Mexico. SRLV is considered as a single virus with genetic variants adapted to goats or sheep(8,9). The possibility of cross infections(10,11) and the isolation of recombinants among the genetic
SRLV seropositivity in sheep and goats from northeastern Mexico is relatively high. This is the first serological report of SRLV infection in sheep from northeastern Mexico. The estimated seroprevalence and risk factors detected in seropositive herds should be considered in the design of biosecurityprograms and public policy applied to the health and productivity of goat and sheep herds in Mexico. Acknowledgements
Literature cited:
Rev Mex Cienc Pecu 2022;13(4):995 1008 1004 variants ofthevirus have also been reported(41).Giventheabove,it is interestingto determine if the serological response found in small ruminants is directed towards genetic variants of SRLV adapted to goats or sheep(22). Likewise, to be able to specify if recombinant SRLVLs(8,10) that have managed to adapt to both sheep and goats in the area(11) circulate in the northeast of Mexico. Conclusions and implications
3. Mellado M, Valdez R, Lara LM, Garcıa JE. Risk factors involved in conception, abortion, and kidding rates of goats under extensive conditions. Small Ruminant Res 2004;55:191 198.
2. Alva Pérez J, López Corona LE, Zapata Campos CC, Vázquez Villanueva J, Barrios García HB. Condiciones productivas y zoosanitarias de la producción caprina en el altiplano de Tamaulipas, México Interciencia 2019;44(3):154 160.
1. Escareño Sánchez LM, Wurzinger M, Pastor López F, Salinas H, Sölkner J, Iñiguez L. La cabra y los sistemas de producción caprina de los pequeños productores de la Comarca Lagunera, en el norte de México. Rev Chapingo Serie Cienc Forest Amb 2011;17(Esp):235 246 https://doi.org/10.5154/r.rchscfa.2010.10.087. Consultado 5 Oct, 2021.
To the participating goat and sheep producers from northeastern Mexico, without whose willingness the present work would not have been possible. The study was financially supported through the 2019 Research, Science and Technology Support Program (PAICyT, for its acronym in Spanish) of the Autonomous University of Nuevo León.
4. Avalos Ramírez R, Cedillo Rosales S, Salinas Meléndez JA, Morales Loredo A, Cervantes Vega R, Domínguez Díaz D, et al. Parasitosis y enfermedades comunes de caprinos en majadas de Nuevo León: Prevalencia y descripción. 1ª ed. México: Consorcio Técnico del Noreste de México, AC. 2010.
5. Salinas González H,ValleMoysen ED,deSantiago Miramontes MDLA, Veliz Deras FG, Maldonado Jáquez JA, Vélez Monroy LI, et al. Análisis descriptivo de unidades caprinas en el suroeste de la región lagunera, Coahuila, México. Interciencia 2016;41:763 768.
8. Ramírez H, Reina R, Amorena B, de Andrés D, Martínez HA. Small Ruminant Res Lentiviruses: genetic variability, tropism and diagnosis. Viruses 2013;5(4):1175 1207.
14. Callado AKC, Castro RS, Teixeira MFS. Lentivírus de pequenos ruminantes (CAEV e Maedi-Visna): revisão e perspectivas. Pes Vet Bras 2001;21(3):87-97.
10. Da Cruz JC, Sigh DK, Lamara A, Chebloune Y. Small ruminant lentiviruses (SRLVs) break the species barrier to acquire new host range. Viruses 2013;5(7):1867-1884.
11. Leroux C, Chastang J, Greenland T, Mornex JF. Genomic heterogeneity of small ruminant lentiviruses: existence of heterogeneous populations in sheep and of the same lentiviral genotypes in sheep and goats. Arch Virol 1997;142(6):1125 1137.
7. Gomez Lucia E, Barquero N, Domenech A. Maedi Visna virus: current perspectives. Vet Med (Auckl) 2018;9:11-21.
12. Reina R, Berriatua E, Lujan L, Juste R, Sánchez A, Andres D, et al., Prevention strategies against small ruminant lentiviruses: an update. Vet J 2009;182(1):31 37.
9. Minguijón E, Reina R, Pérez M, Polledo L, Villoria M, Ramírez H, et al. Small ruminant research Lentivirus infections and diseases. Vet Microbiol 2015;181(1 2):75 89.
6. Avalos Ramírez R, Cedillo Rosales S, Salinas Meléndez JA, Morales Loredo A, Cervantes Vega R, Domínguez Díaz D, et al. Bioseguridad en hatos caprinos: Protocolos aplicados en majadas de Nuevo León. 1ª ed. México: Consorcio Técnico del Noreste de México, AC. 2010.
13. Blacklaws BA. Small ruminant lentiviruses: Immunopathogenesis of visna maedi and caprine arthritis and encephalitis virus. Comp Immunol Microbiol Infect Dis 2012;35(3):259 269.
Rev Mex Cienc Pecu 2022;13(4):995 1008 1005
15. Azevedo DAA, Santos VWS, Sousa, ALM, Peixoto RM, Pinheiro RR, Andrioli A, et al., Small ruminant lentiviruses: economic and productive losses, consequences of the disease. Arqui Inst Biol 2017;84:1 10.
24. SADER. Secretaría de Agricultura, Ganadería, Desarrollo Rural, Pesca y Alimentación. DOF. Acuerdo mediante el cual se dan a conocer en los Estados Unidos Mexicanos las enfermedades y plagas exóticas y endémicas de notificación obligatoria de los animales terrestres y acuáticos. México. 2018.
18. Daltabuit Test M, delaConcha BermejilloA,Espinosa LE, LozaRubio E,AguilarSetién A. Isolation of caprine arthritis encephalitis virus from goats in Mexico. Can J Vet Res 1999;63(3):212 215.
21. Torres-Acosta JF, Gutiérrez RE, Butler V, Schmidt A, Evans J, Babington J, et al., Serological survey of caprine arthritis-encephalitis virus in 83 goat’s herds of Yucatán, México. Small Ruminant Res 2003;49:207 211.
23. Eguiluz C, Aluja A. Neumonía intersticial progresiva (Maedi) y adenomatosis pulmonar en vísceras de óvidos decomisadas. Vet Méx 1981;12:235 237.
16. Martínez Navalón B, Peris C, Gómez EA, Peris B, Roche ML, Caballero C, et al., Quantitative estimation of the impact of caprine arthritis encephalitis virus infection on milk production by dairy goats. Vet J 2013;197(2):311 317.
25. Sánchez JH, Martínez HA, García MM, Garrido G, Gómez L, Aguilar JA, et al., The presence of small ruminant lentiviruses in Mexican Pelibuey sheep. Theriogenology 2016;86(1):1953 1957.
Rev Mex Cienc Pecu 2022;13(4):995 1008 1006
26. Ganter M. Zoonotic risks from small ruminants. Vet Microbiol 2015;181(1-2):53-65.
19. Villarreal Cavazos DA. Prevalencia serológica del virus de la artritis encefalomielitis caprina (VAEC) en algunos hatos caprinos del Noreste de México [tesis licenciatura]. México, NL: Universidad Autónoma de Nuevo León; 1994.
27. Villagra Blanco R, Barrantes Granados O, Montero Caballero D, Romero Zúñiga JJ, Dolz G. Seroprevalence of Toxoplasma gondii and Neospora caninum infections and associated factors in sheep from Costa Rica. Parasite Epidemiol Control 2019;4:e00085. https://doi.org/10.1016/j.parepi.2019.e00085
17. Nazara SJ, Trigo FJ, Suberbie E, Madrigal V. Estudio serológico de la artritis-encefalitis caprina en México. Tec Pecu Mex 1985;48:98 101.
20. Molina RM, Trigo FJ, Cutlip RC. Estudio serológico de la neumonía progresiva ovina en México. Vet Méx 1986;17:269 273.
22. Loeza CJG. Detección serológica y molecular de lentivirus de pequeños rumiantes que circulan de forma natural en ovinos de dos estados del altiplano mexicano. [tesis especialidad]. México, Estado de México: Universidad Autónoma del Estado de México; 2017.
28. Segura Correa JC, Honhold N. Métodos de muestreo para la producción y salud animal. Universidad Autónoma de Yucatán. Mérida, Yucatán, México. 2000
37. Norouzi B, Taghavi RA, Azizzadeh M, Mayameei A, Najar NMV. Serological study of small ruminant lentiviruses in sheep population of Khorasan e Razavi province in Iran. Vet Res Forum 2015;6(3):245 249.
29.Hernandez-MedranoJH,Espinosa-CastilloLF,RodriguezAD. et al.Useofpooledserum samples to assess herd disease status using commercially available ELISAs. Trop Anim Health Prod 2021;53:507. https://doi.org/10.1007/s11250 021 02939 1.
Consultado 24 nov. 2021.
Rev Mex Cienc Pecu 2022;13(4):995 1008 1007
33. Martínez Herrera DI, Villagómez Cortes JA, Hernández Ruiz SG, Peniche Cerdeña AEJ, Pardío Sedas VT, Torres Acosta F, et al. Seroprevalence and risk factors for caprine arthritis encephalitis in the state of Veracruz, Mexico. Agrociencia 2020;54(1):15 29. https://agrociencia colpos.mx/index.php/agrociencia/article/view/1879/1876.
35. Santiago BCI, Gutierrez HJL, Herrera LE, Palomares REG, Díaz AE. Diagnóstico serológico de Lentivirus de Pequeños Rumiantes (LvPR) en rebaños caprinos del estado de Guanajuato. Quehacer Científico en Chiapas 2017; 12(1):15 19. https://dgip.unach.mx/images/pdf
36. Michiels R, Van Mael E, Quinet C, Welby S, Cay AB, De Regge N. Seroprevalence and risk factors related to small ruminant lentivirus infections in Belgian sheep and goats.
Prev Vet Med 2018;151:13 20.
31. de Blas I, Ruiz Zarzuela I, Vallejo A. WinEpi: Working in epidemiology. An online epidemiological tool. ISVEE 11: Proc 11th Sympe Int Soc Vet Epidemiol Econom, Cairns (Australia), August 6 11 2006. Theme 4 Tools & training for epidemiologists: Poster session 2006;800. 32. Pérez M, Biescas E, de Andrés X, Leginagoikoa I, Salazar E, Berriatua E, et al. Visna/maedi virus serology in sheep: survey, risk factors and implementation of a successful control programme in Aragón (Spain). Vet J 2010;186(2):221 225.
REVISTA QUEHACERCIENTIFICO/2017 ener jun/1.Diagnostico_serologico_de_Lentivirus.pdf.
34. Adams DS, Oliver RE, Ameghino E, DeMartini JC, Verwoerd DW, Houwers DJ, et al Global survey of serological evidence of caprine arthritis-encephalitis virus infection. Vet Rec 1984;115:493 495.
30. Herrmann LM, Cheevers WP, McGuire TC, Adams DS, Hutton MM, Gavin WG, et al Competitive inhibition enzyme linked immunosorbent assay for detection of serum antibodies to caprine arthritis encephalitis virus: diagnostic tool for successful eradication. Clin Diagn Lab Immunol 2003;10(2):267 71.
Consultado 30 nov 2021.
Rev Mex Cienc Pecu 2022;13(4):995 1008 1008
38. Gjerset B, Jonassen CM, Rimstad E. Natural transmission and comparative analysis of small ruminant lentiviruses in the Norwegian sheep and goat populations. Virus Res 2007;125(2):153 161.
39. Junkuszew A, Dudko P, Bojar W, Olech M, Osiński Z, Gruszecki TM, et al. Risk factors associated with small ruminant lentivirus infection in eastern Poland sheep flocks. Prev Vet Med 2016;127:44 49. 40. Kalogianni AI, Bossis I, Ekateriniadou LV, Gelasakis AI. Etiology, Epizootiology and Control of Maedi Visna in Dairy Sheep: A Review. Animals (Basel). 2020;10(4):616.
41. Gayo E, Cuteri V, Polledo L, Rossi G, García MJF, Preziuso S. Genetic characterization and phylogenetic analysis of small ruminant lentiviruses detected in Spanish Assaf sheep with different mammary lesions. Viruses 2018;10(6):315.
42. CzopowiczM, Szaluś JordanowO,Mickiewicz M, Moroz A,Witkowski L,Bereznowski A, et al., Relationship between the dissemination of small ruminant lentivirus infection in goat herds and opinion of farmers on the occurrence of arthritis. PLoS One. 2018;13(9):e0204134 43. Pérez M, Biescas E, Reina R, Glaria I, Marin B, Marquina A. et al. Small ruminant lentivirus induced arthritis: clinicopathologic findings in sheep infected by a highly replicative SRLV B2 genotype. Vet Pathol 2015;52(1):132 139. 44. Furtado Araújo J, Andrioli A, Pinheiro RR, Sider LH, deSousa ALM, de Azevedo DAA, et al. Vertical transmissibility of small ruminant lentivirus. PLoS One. 2020;15(11):e0239916.
1009
Family sheep production systems in the Mixteca region of Oaxaca, Mexico Jorge Hernández Bautista a Héctor Maximino Rodríguez Magadán a Teódulo Salinas Rios a Magaly Aquino Cleto a Araceli Mariscal Méndez a* a Universidad Autónoma Benito Juárez de Oaxaca. Facultad de Medicina Veterinaria y Zootecnia, Oaxaca, México *Corresponding author: mariscalma@hotmail.com
Family sheep production units in two municipalities in the Mixteca region of Oaxaca, Mexico, were characterized in terms of production system, market access and land use. A mixed methodology was applied, employing a structured questionnaire addressing socioeconomic and productive variables, and participatory observation in 29 family sheep producers. All the surveyed producers see sheep farming as their main income source. Most (86 %) use a subsistence system, and all use family labor. The main feeding strategy was grazing of communal land, and production was largely intended for sale of live animals to intermediaries or in local markets for eventual processing for meat, and/or for self use. Most (83 %) of the production units included a pen built from regional materials, and these pens were most frequently on the family property. Implementation of management plans and animal health and safety measures were minimal Analysis of these productive systems
https://doi.org/10.22319/rmcp.v13i4.6100Article
Abstract:
Family sheep production is common in rural Mexico. It is an important element of subsistencesystems in theseareas but is generallyrustic.Betterunderstandingofrusticsheep production is a first step in developing strategies and programs to support family producers.
Key words: Family production, Sheep Production, Small producers, Mixteca.
Mexico has a sheep population of 8.9 million(1). Sheep farming occurs in different regions throughout the country and production systems respond to local resource availability and market conditions. Production unit scale is influenced by socioeconomic conditions, land access, and input and technology availability. Extensive, subsistence family production units (FPUs) are the most common but are largely limited to valleys, hills and mountains in rural areas(2). Improvingmanagement practices in FPUs in marginal agricultural zones canprovide environmental, socioeconomic and/or nutritional benefits(3). Though considered production systems, FPUs are also a way of life, a structure of social relationships and an element of identity in peasant cultures(4) .
identified how producers manage sheep production. Management strategies respond to the environmental services available on communal lands, and involve family type production which fulfills economic, social, environmental and cultural functions, but provides low productivity. Unit productivity and producer livelihood could be improved by implementing measures such as pasture rotation and adopting technological innovations. Broadening producer access to government programs and creating public policy that promotes development in marginal rural areas could greatly improve productivity and consequently reduce poverty and food insecurity.
Introduction
Received: 24/11/2021
1010
Accepted: 08/04/2022
Most (63.4 %) subsistence UPFs are in the states of Mexico, Oaxaca, Guerrero, Puebla, Chiapas, Veracruz, Hidalgo and Michoacán; 52.0 % of these are in highlymarginalized areas and 16.4 % in extremely marginalized areas(5). Of the thirty two states in Mexico, Oaxaca is among the five poorest, with 61.7 % of its population living below the poverty line(6). It is also has the sixth largest sheep population in the country, most of which are produced in subsistence FPUs in the Mixteca and Central Valleys regions(7). A majority (78 %) of the state’s highly and extremely marginalized municipalities are in the Mixteca region, and 77.4 % of the population in this region lives in rural, small and dispersed localities; the main economic activities are seasonal agriculture and small ruminant production(8). Small livestock production based on extensive grazing and communal work has been present in the
Rev Mex Cienc Pecu 2022;13(4):1009 1024
The study was carried out in the municipalities of Coixtlahuaca (17°38’ and 17°49’ N, 97° 09’ and 97° 25’ W; altitude 2,000 to 2,900 m asl) and Suchixtlahuaca (17°43’ and 17°72’ N, 97°22’ and 97°36’; altitude 2,000 to 2,900 m asl) in the Mixtec region of Oaxaca (Figure 1).
Traditional production systems of this kind help to mitigate poverty by promoting food sovereignty and security, and generating employment in agriculture, in addition to contributing to environmental, climate and cultural sustainability in rural areas(12). However, FPUs face myriad challenges such as technological, social, economic, environmental and political changes (e.g., globalization). Given their precarious economic situation, small rural producers can be acutely affected and experience technological regression in production systems(13). The large livestock population in Oaxaca’s Mixteca region provides very low productionvalue;forexample,thecurrent$59.74kgaverageregionalpriceforsheepis much lower than the $76.34 kg national average(7,14)
Rural production systems in Mexico are extremely heterogeneous. They must adapt to varying availabilities of different natural, human and financial resources, and inconsistent and unequal access to institutions andmarkets. Strategies intended to promote and strengthen small family livestock production must encompass this heterogeneity to generate policies differentiated by producer type that are not overly generalized in scope(13). Tailoring policy design to meet the needs of specific production systems requires identification of their particular characteristics, including their scale, management practices and territory. Strategies can then be designed and implemented based on PU type and resources, which also allow for their analysis, promote organization and social actor participation, and result in differentiated policies that help to develop marginalized rural areas. The present study objective was to analyze sheep FPUs in the municipalities of Suchixtlahuaca and Coixtlahuaca in the Mixteca region of Oaxaca, Mexico.
Both municipalities have a temperate sub humid climate with summer rains, a 15.6 °C average annual temperature and 500 to 1,000 mm annual rainfall(15,16) .
Material and methods
Rev Mex Cienc Pecu 2022;13(4):1009 1024 1011 region since 1530, and is still widely used(9). Small ruminants are an integral element in regional culinary tradition, and a vital contribition to the peasant economy since their production is low cost and they provide multiple benefits(10,11) .
Rev Mex Cienc Pecu 2022;13(4):1009 1024 1012
Data on population socioeconomic parameters and sheep producer systems was collected using a questionnaire structured in two sections:
Figure 1: Study area. San Juan Bautista Coixtlahuaca and San Cristóbal Suchixtlahuaca, Mixteca region, Oaxaca, Mexico Scale 1:250000. Political boundaries as of 2012(17) Vegetation cover is limited in both municipalities, and includes oak, juniper, savin and cacti, as well as shrubs used as sheep forage such as Leucaena leucocephala, Vachellia farnesiana, Prosopis laevigata and Morus spp. This is partially due to the region’s low rainfall and consequent semi arid hydrogeography. Just north of the town of Suchixtlahuaca is the Rio Grande and to the south is the Rio de la Cruz, bothof which are seasonal(15). La Culebra river, the main drainage in Coixtlahuaca, is predominantly seasonal(16) . The population of Coixtlahuaca largely considers itself indigenous (64.72 %) and is highly marginalized in socioeconomic terms. In Suchixtlahuaca, most (65.59 %) of the population considers itself indigenous and experiences moderate marginalization(17) . From August 2017 to February 2018, a mixed methodology was used to study sheep producers using a FPU system in these populations. Since the number of production units and their locations were not known, a non probabilistic (a.k.a. snowball) sampling method was applied(18), resulting in a sample of 29 producers.

b) Transition. Sheep are fed by grazing in extensively managed paddocks with supplements.
Rev Mex Cienc Pecu 2022;13(4):1009 1024 1013
Preventive health management is used and producers have market access, although their market articulation is hindered by intermediaries.
Producers have access to sufficient feed within their production units and access to local markets. However, this system depends heavily on government support and other income sources for livestock development.
Questionnaire data was supported and triangulated through participatory observation from the participating sheep producers.
Data analysis was done by descriptive statistics and an analysis of variance (ANOVA) run with the Infostat statistical package. Participant observation data served to triangulate and contextualize the statistical analysis.
a) Subsistence. Sheep diet is based on grazing grasses and legumes in rangeland. During the dry season, animals are fed stubble and straw harvested in the rainy season, in addition to sporadic supplements of salt and minerals; health and safety management is commonly poor. These systems have a holding pen. The animals represent savings for the producer, and are occasionally sold. The subsistence system also encompasses sheep production units (SPUs) in which animals remain in a holding pen all day and are fed stubble and poor quality straw.
2) Production system data. Items addressed the variables of livestock inventory, breed, zootechnical purpose, production purpose, food strategy, infrastructure, health management, access to government programs and production diversification.
1) Socioeconomic data. Items addressed the variables of gender, age, education level, years of experience in the activity, main source of herd management technical knowledge, nature of production unit, land tenure, production system type and main economic activity.
c) Consolidated. This intensive system involves two management strategies. One involves stabling animals and feeding with silage, hay, balanced feed and integrated rations. The feeding strategy is adjusted according to animal physiological stage. In the other, animals are intensively grazed in fenced areas on improved forages, commonly supplemented with concentrates. Both strategies employ an animal health calendar and a record system.
Familysheepproductionsystemswereclassifiedintothreecategoriesbased onmarketaccess and production system(19,20):
A majority of producers (97 %, n= 28) were men, with just one woman (3 %) in the sample. There are reports of the frequent participation of women in sheep production, particularly in subsistence systems. However, cultural perceptions in the two studied municipalities consider management of land and food production as work too strenuous for women and children; nonetheless, women and children do engage in these activities when men are otherwise occupied
The total analyzed sample of sheep producers was 29, nineteen (66 %) of which were in Coixtlahuaca and ten (34 %) in Suchixtlahuaca. Most (86 %, n= 25) production systems were subsistence and of these fifteen (60 %) were in Coixtlahuaca and ten (40 %) in Suchixtlahuaca. The remaining four systems (14 % of total) were transition systems located in Coixtlahuaca (Table 1). All the analyzed SPUs used family labor.
Average producer age was 55.5 yr. Most (62 %, n= 18) were aged 20 to 59 years and the remainder (38 %, n= 11) were 60 yr or older. This coincides with the average age (52.6 yr) of heads of household reported for small SPUs(19). Although production unit owners were older in age, their children did participate in production activities. However, family participation does not ensure intergenerational continuity. Just because producers’ children have learned how to raise sheep and goats is no guarantee that they will continue in the activity once they inherit the production units. This raises the question of how to manage intergenerational turnover in production systems in a manner that maintains them as culturallyrelevant agroecosystems. Attaining this transition will require livestock breeds that provide economic value, are marketable in the region and beyond, meet local subsistence requirements and contribute to natural resources conservation and/or resilience.
Table 1: Sheep production systems by municipality Production system Suchixtlahuaca Coixtlahuaca Total n % n % n % Subsistence 10 100 15 79 25 86 Transition 0 0 4 21 4 14 Total 10 34 19 66 29 100 n= number of production units; %= proportion of total.
Socioeconomic data
Rev Mex Cienc Pecu 2022;13(4):1009 1024 1014
Results and discussion
The average number of years dedicated by producers to sheep farming was 28.1 yr, highlighting the deep rooted tradition of sheep production in these communities. Among the producers using a subsistence system, average years of experience was 29.5 yr (± 2.18), whileamongthoseinatransitionsystemitwas19.5yr(±5.45).Onecommonaspect among all the producers was that they had entered the activity because a relative had already begun it; in other words, they continued their predecessors’ efforts, essentially preserving a tradition. They continue the tradition even though production can be hampered bychallenges such as health problems and low market prices, among other factors.
Rev Mex Cienc Pecu 2022;13(4):1009 1024 1015
Agricultural activities (agriculture and livestock) were the sole economic activity for most (65.5 %, n= 19) of the producers, and sheep production was the principal income source. Slightly more than half (52 %, n= 13) the subsistence producers identified themselves as peasants living off agriculture and livestock, while 20 % (n= 5) perceived themselves as only ranchers,and24 %(n=6) as vendors.Amongthetransition producers,onlyone(25 %)stated agriculture and livestock to be their main economic activity, while another two (50 %) perceived themselves as vendors (Table 2). This agrees with previous studies observing that small agricultural producers tend to diversify their income strategies, mostly pursuing agriculture, sheep production and sales(10,21) .
Education level varied between the subsistence and transition systems evaluated in the present study. Of the producers involved in a subsistence system, 12 % (n= 3) had no formal education, 48 % (n= 12) had an elementarylevel education, 32 % (n= 8) had a middle school education, and 8 % (n= 2) a high school education. These data are consistent with previous reports of family managed subsistence level sheep production systems(17,18). Among the producers using transition systems, 50 % (n= 2) had a middle school education and 25 % (n= 1) a high school education and professional training. Average education level among the subsistence level producers (6.8 yr) was clearly lower than among the transition system producers (11.7 yr). This supports previous reports that producers with a higher education level tend to employ greater technification in their production systems(20). It also coincides with observations that agricultural activity in rural areas in Mexico is largely managed by peasants with low education and specialization levels(10). Indeed, the studied municipalities are highly to moderately marginalized and their populations suffer social deficiencies such as low education levels. Limited access to education prevents rural populations from specializing or acquiring training. This is coupled with their greater dependence on agricultural activities, and the fact that knowledge of productive activities is transferred betweenfamilymembers.Noformaleducationisrequiredsince,throughsocialreproduction, they acquire knowledge and understanding of their territory from social interaction and use of tangible and intangible assets.
Among the subsistence producers, most (88 %, n= 22) used communal lands and 12 % (n= 3) owned small properties. All (100 %, n= 4) the transition producers used communal lands. Theseresultscontradict reportsstatingthatuseofsmallprivatepropertiesis morewidespread in transition and commercial systems(20). In the present study, this discrepancy may exist because in the historically agricultural Mixteca region communal land tenure is the primary form of tenure(22). This highlights the fact that the Mixteca region is a socially constructed, rather than a merely geographic, space within which communal access is allowed on some land resources under certain rules. Therefore, sheep producers can graze their animals in the same area year round, regardless of a pasture’s carrying capacity.
Production system data
Total sheep population in all the studiedSPUswas 1,222,and average herd sizewas 42 heads (SD, s= 43). At the municipality level, average herd size was 23.58 heads (± 11.16) in Coixtlahuaca and 68.50 (± 12.54) in Suchixtlahuaca. In the subsistence SPUs, average animal inventory was 50.08 heads (± 8.10) and in the transition SPUs it was 15.50 heads (± 19.83). An SPU’s animal inventory is linked to the production system and the feasibility of implementing technological improvements. Making technological improvements is particularly difficult for small producers since they are generally rudimentary, have only limitedinfrastructure, experiencedifficultyin accessingcredit and aremanagedbyproducers with low education levels. In the present results, the subsistence SPUs had larger inventories, perhaps because they are based on grazing resources available in their natural surroundings, which keeps costs low. In contrast, transition SPUs employ more technology, consequently raising herd management costs.
Rev Mex Cienc Pecu 2022;13(4):1009 1024 1016 Table 2: Main economic activities of sheep producers by production system Main occupation Sheep production system Subsistence Transition n % n % Farmer/Rancher 13 52 1 25 Rancher 5 20 0 0 Construction 1 14 0 0 Vendor 6 24 2 50 Teacher 0 0 1 25 n= number of producers; %= proportion of total.
Rev Mex Cienc Pecu 2022;13(4):1009 1024 1017
The SPUs studied here produced sheep for live sale and eventual processing for meat. In the subsistence SPUs, animals were sold in bulk at a price imposed by an intermediary. Animal weight was not considered; perhaps for this reason weight is not recorded in this type of system. In the transition SPUs, average final animal weight for sale was 35 kg. Most (55.1 %, n= 16) of the SPUs used Creole breeds or Creole x commercial breed crosses as their main breed. The subsistence SPUs mostly used Creole breeds or crosses (56 %, n= 14), although many (40 %, n= 10) did use Pelibuey or Pelibuey crosses. Half (50 %, n= 2) the transition SPUs employed Creole animals or Creole crosses, although Pelibuey and Dorper animals were present at one unit each (i.e., 25 %) (Figure 2). Overall, Creole breeds continue to dominate among the studied SPUs, although commercial breeds are increasingly used. Local or Creole breeds may remain popular in the study area because they are adapted to local conditions and therefore conserved by small producers. They form an integral part of sustainable use strategies in which sheep can feed on crops and/or wild vegetation, then provide food and other resources to people(23) .
Figure 2: Sheep genotypes in subsistence and transition production systems in Coixtlahuaca and Suchixtlahuaca, Oaxaca, Mexico
All (100 %, n= 29) the SPUs had holding pens and basic livestock infrastructure. Most (83 %, n= 24) of the infrastructure was made from regionally available materials (mesquite and oak wood), and the rest (17 %, n= 5) were made with metal; 40 % (n= 2) of those with metal structures weretransition SPUs.Most (60 %)oftheproducerswith metal infrastructure had accessed it via social programs, while the others had repurposed metal elements as a way of keeping down costs. Feeders and drinkers in pens were used in all the transition SPUs, whereas none ofthe subsistenceSPUshad feeders and76 % (n=19)had drinkersinsidepens.
8 48 0 4 12 28 252525 00 25 0 10 20 30 40 50 60 Creole Creole crossbreedDorper Dorper PelibueycroossbreedPelibueycrossbreed Percentage Breed Transition Subsistence


Rev Mex Cienc Pecu 2022;13(4):1009 1024 1018
Most (88 %, n= 22) of the subsistence producers used grazing as the sole feed source. This occurs from 0800 to 1600 h every day, with the producers leading animals to pasture in the morning and penning them in the afternoon (Table 3). The remaining producers (12 %, n= 3) based feeding on a combination of forage and grain. These same producers have small properties and, lacking extensive grazing land, must feed in pens. All four (100 %) transition SPUs fed in pens. Two (50 %) fed with forage, one (25 %) fed an integrated diet, and another (25 %) used a combination of grazing and an integrated diet. These producers mayhave more knowledge and technical training as well as economic resources to invest in their production system. The subsistence producers are taking advantage of the surrounding natural environment to lower production costs, but it is also an element of their participation in a regional socio-cultural agroforestry system. Grazing is done on communal lands, which provides substantial cost savings on the main production input, but also requires active participation in the community’s social structures.
The lack of drinkers in some of the subsistence SPUs, and feeders in all of them, may be because they are extensive grazing systems in which the animals only spend the night in a pen; producers may feel a feeder or drinker is unnecessary. These results coincide with previous reports of the use of regionally available materials in family managed SPUs(24) , which allows producers to exploit natural assets and/or ecosystem services.
Regional tree shrub forages such as L. leucocephala, V. farnesiana, P. laevigata and Morus spp. are quite palatable to sheep, but also provide high crude protein content(25). When managed rationally using strategies such as rotation, this renewable natural resource can be extremely productive and environmentally stable. The 19 (66 %) subsistence SPUs implemented pasture rotation. However, they did not use technical productive strategies to manage this rotation, rather they based it on how the animals use the land and the paths the animals graze along; animal load was not considered. Year round grazing of an area or region allows for no prolonged rest period for vegetation renewal and regeneration, decreasing potential animal productivity. Grazing natural vegetation on communal lands can be sustainable and economically viable if ecosystem services are efficiently exploited by applying a grazing plan. This needs to consider the amount of forage provided by the vegetation, the most appropriate animal load to effectively exploit available forage, the most efficient grazing time, the target number of animals to be sold yearly, and herd productive and reproductive events.
Rev Mex Cienc Pecu 2022;13(4):1009 1024 1019 Table 3: General characteristics of subsistence and transition sheep production units Category Subsistence Transition n % n % Pen Regional materials 22 88 2 50 Metal and other materials 3 12 2 50 iPennfrastructure Feeder 0 0 4 100 Drinker 19 76 4 100 purposeProduction Sale 21 84 3 75 Self use 1 4 0 0 Sale/self use 3 12 1 25 Market Intermediary 20 80 0 0 Local market 4 16 4 100 Not sold 1 4 0 0 Feeding strategy Integrated diet 0 0 1 25 Forage 0 0 2 50 Forage/grain 3 12 0 0 Grazing 10 40 0 0 dietGrazing/integrated 0 0 1 25 Grazing/forage/grain 12 48 0 0 Pasture rotation Yes 19 76 0 0 No 6 24 4 100 Land tenure Communal 22 88 4 100 Small property 3 12 0 0 Vaccination Yes 0 0 3 75 No 25 100 1 25 Deparasitization Yes 24 96 4 100 No 1 4 0 0 diversificationproductionLivestock Yes 22 88 1 25 No 3 12 3 75 n= number of units, %= proportion of total. Planned grazing provides ecosystem benefits such as manure, the growth of smaller sized plant species, and reduction of dryplant material, a potential fuel for fires(26). If implemented based on a well designed plan, exploitation of natural resources by sheep producers can be seen as effective usufruct of communal lands that interweaves their livelihoods. If no plan properly guides this use, it can lead to degradation of vegetation, increased soil erosion, deteriorated soil fertility and structure, and a consequent reduction in forage availability and thus animal productivity.
Rev Mex Cienc Pecu 2022;13(4):1009 1024 1020
Vaccinations were only applied in three (75 %) of the transitions SPUs (Table 3), although infrequently, and the producers were unclear as to what vaccine had been used. Internal deworming was done by all the transition SPUs (100 %, n= 4) and most of the subsistence SPUs (96 %, n= 24). Very few of the producers took additional health care measures such as administering vitamins and minerals. These results coincide with a previous study indicating that family livestock production systems largely lack health and safety measures and receive minimal management. Productivity is consequently low, as is the income generated for producers(24) Only two (6.8 %) of the studied producers (both transition SPUs) had accessed government programs. That all the subsistence SPUs had no access to these programs suggests that low
Among the subsistence SPUs, production was aimed at sale of live animals in most cases (84 %, n= 21), while fewer units (12 %, n= 3) used it for sale of live animals and self use, and just one (4 %) was only for self use. Of the four transition SPUs, three (75 %) used production for sale of live animals and one (25 %) for sale of live animals and self use. These results support previous research indicating that in Mexico small ruminants are widely used for sale and self use, a dynamic adapted to the rural and culinary culture which includes traditionaldishessuchas roastedlambintheMixtecaregionofOaxaca(11).Familyproduction units like those in the present study fulfill tangible and intangible functions(4). Tangible functions include cash generation from sale of animals, food for self use and in some cases manure which serves as the fertilizer that completes the productive cycle. Intangibles include the roasted sheep which is an integral element in regional food culture since it is prepared for family celebrations and religious festivities, is transmitted and enriched intergenerationally, and forms a part of regional sociocultural dynamics. The family nature of the studied SPUs also has the intangible function of perpetrating a cultural element since grazing occurs on communal land, the traditional production methods are transferred from parents to children and the herd itself represents both the family’s livelihood and its continued participation in cultural traditions(2). It is essentially a lifeway contained within a territory with its own landscape, natural environment and customs aimed at reproducing the sheep production system and with it regional culture. Market access differed between the production systems (P<0.05). In the subsistence SPUs, most (80 %, n= 20) sold their animals to intermediaries, while only four (16 %) sold them in local markets. All (100 %, n= 4) the transition SPUs sold in local markets (Table 3), where the animals were acquired by intermediaries, roasters, finishers or other producers. The dependence of the subsistence SPUs on intermediaries may be linked to the generally low education level among producers, and their lack of resources, organization and information. Thistranslatesintomarkedinequityinmarket access,lowerpricesimposedbyintermediaries and low added value. In contrast, the transition SPUs sell directly in the markets and are thus able to command better prices.
Rev Mex Cienc Pecu 2022;13(4):1009 1024 1021 producer education level may play a role, although other factors also surely come into play, such as insufficient program information and promotion, and a lack of specific programs, differentiated policies, technical assistance, research and targeted financing focused on subsistence producers. The absence of institutional benefits in these two studied municipalities highlights their marginalization.
Diversificationof agricultural productionwas present in most (79 %,n= 23) oftheproducers. Only one (25 %) of the transition SPUs diversified its production, whereas 22 (88 %) of the subsistence SPUs did so. Poultry for self use (eggs and/or meat) was used in all (100 %) the diversified SPUs, but pigs (meat), cows (meat, milk, work animals) and horses (work animals) were also raised for self use (Table 3 and Figure 2).
Conflict of interest
Conclusions and implications Sheep farming in the studied municipalities is a largely subsistence activity following a peasant approach in that exploitation focuses on goods and services provided by the land, such as grazing areas and zoogenetic resources. Sheep farming is a livelihood as well as a traditional activity that fulfills socioeconomic, environmental and cultural functions in the region. Limiting factors in the studied production units include advanced age of the producers, their low educational level, their ignorance of and/or minimal participation in government programs, lack of organization and access to efficient marketing channels. In conjunction, these factors substantially lower productivity and profitability of sheep production. Only a small proportion of the production units were in transition, emphasizing the need to promote public policies for development in marginalized rural areas. The guiding axis of these policies needs to be organization and association of small family producers to work towards innovation, technology transfer, and access to financing and local markets. Improving sheep production practices in regions that depend heavily on this activity can be a very effective way of addressing the ongoing issues of poverty and food insecurity.
The authors declare no conflict of interest related to the research reported herein or its publication.
7. SIACON NG. Sistema de Información Agroalimentaria de Consulta. Pecuario Estatal 2020 México: Servicio de Información Agroalimentaria y Pesquera, SADER. https://www.gob.mx/siap/documentos/siacon-ng-161430.
6.CONEVAL.ConsejoNacionaldeEvaluacióndelaPolíticadeDesarrolloSocial.Medición de la pobreza en entidades federarivas. Consultadohttps://www.coneval.org.mx/coordinacion/entidades/Oaxaca/Paginas/principal.aspx.2feb,2022.
9. Romero F. Economía y vida de los españoles en la Mixteca Alta: 1519 1720. México, DF: Instituto Nacional de Antropología e Historia. 1990.
Rev Mex Cienc Pecu 2022;13(4):1009 1024 1022
11. Vásquez G. Ganado menor y enfoque de género. Aportes teóricos y metodológicos. Agricultura, Sociedad y Desarrollo 2015;12(4):515-530.
12. López S, Carrión A. Geografía, economía y territorios rurales en América Latina: presentación del dossier. Eutopía U 2018;(4):7 22.
Consultado 20 mar, 2022.
1. SADER. Secretaría de Agricultura y Desarrollo Rural. Atlas agroalimentario 2012 2018 2019. https://nube.siap.gob.mx/gobmx_publicaciones_siap/pag/2018/Atlas Agroalimentario 2018. Colsultado 20 jul, 2019.
4. Samper M. Sistemas territoriales de agricultura familiar IICA, Ed. San José, Costa Rica 2016.
8. UTM. Universidad Tecnológica de la Mixteca. Diagnóstico Regional de la Mixteca. Oaxaca: Comité de Planeación para el Desarrollo del Estado. 2017.
3. Moreno DC, Grajales HA. Caracterización de los sitemas de producción ovinos de trópico alto enColombia: Manejo eindicadores productivos yreproductivos. RevMedVet Zoot 2017;64(3):36 51.
10. Desauguste M, Lerdon J, Moreira L, Alomar C. Caracterización de la producción ovina en la agricultura familiar de la comuna de Paillaco, Región de los ríos, Chile. Agro Sur, 2011;39(2):88 94.
5. SAGARPA, & FAO. Agricultura familiar con potencial productivo en s/Attachments/42/Ahttp://www.sagarpa.gob.mx/programas2/evaluacionesExternas/Lists/Otros%20EstudioMéxico.gricultura%20Familiar_Final.pdfConsultado2feb,2022.
2. Partida de la Peña J, Braña V, Jiménez S, Ríos R, Buendía R. Producción de carne ovina. México: Instituto Nacional de Investigaciones Forestales, Agrícolas y Pecuarias. 2013.
Literature cited:
13. CEPAL. Comisión Económica para América Latina y el Caribe. Efectos sociales de la globalización sobre la economía campesina: reflexiones a partir de experiencias en México, Honduras y Nicaragua. México CEPAL. 1999.
16. Juárez F. Plan Municipal de Desarrollo. H. Ayuntamiento Constitucional de San Juan Bautista Coixtlahuaca, Oaxaca. https://finanzasoaxaca.gob.mx/pdf/inversion_publica/pmds/08_10/176.pdf2008
21. Robles B. La pequeña agricultura campesina y familiar: construyendo una propuesta desde la sociedad. Entre Diversidades 2016;(7):46 83. 22. Lazos ChE. Conocimientos, poder y alimentación en la mixteca Oaxaqueña: Tareas para la “gobernanza ambiental”. CLACSO. 2012 . 23. Díaz T, Valencia P. Lineamientos para el Fortalecimiento de la Producción Pecuaria Familiar en América Latina y el Caribe. En: Salcedo S, Guzmán L. Agricultura familiar en América Latina y el Caribe: recomendaciones de política Santiago, Chile 2014:165 174.
15. Hernández B. Plan Municipal de Desarrollo 2008 2010. H. Ayuntamiento Constitucional San Cristóbal Suchixtlahuaca, Oax. 2008 https://www.finanzasoaxaca.gob.mx/pdf/inversion_publica/pmds/08_10/129.pdf.
17. INEGI. Instituto Nacional de Estadísticas Geografía e Informática. Encuesta inter censal. Oaxaca: Dirección General de Población de Oaxaca. 2022.productos/nueva_estruc/inter_censal/panorama/7028https://www.inegi.org.mx/contenido/productos/prod_serv/contenidos/espanol/bvinegi/201525082307.pdfConsultado2feb, 18. Hernández SR, Fernández CC, Baptista LP. Metodología de la investigación 6a. ed. México DF: McGraw Hill; 2014. 19. Hernández Bautista J, Salinas Rios T, Rodríguez Magadán HM, Aquino Cleto M, Mariscal Méndez A, Ortiz Muñoz IY. Características que determinan el sistema de producción ovina en el estado de Oaxaca, México. Rev Mex Agroecosist 2017;4(1):38 47. 20. Pérez H, Vilaboa A, Chalete M, Bernardino M, Díaz R, López O. Análisis descriptivo de los sistemas de producción con ovinos en el estado de Veracruz, México. Rev Cientifica 2011:XXI(4):327 334.
14.SEDAPA.SecretariadeDesarrollo,Agropecuario,PescayAcuacultura/SNIDRUS.Atlas agroalimentario del Estado de Oaxaca. 2017.
Rev Mex Cienc Pecu 2022;13(4):1009 1024 1023
24. Cuéllar OJA, Tórtora PJ, Trejo GA, Román RP. La producción ovina mexicana, particularidades y complejidades. S./FES UNAM Ed. Distirto Federal, México: Ariadna; 2012.
25. Hernández HJ. Valoración de la caprinocultura en la Mixteca Poblana: socioeconomía y recursos arbóreo arbustivos [tesis doctoral]. Cuba: Universidad de Camagüey; 2006.
26. Lasanta T. Pastoreo en áreas de montaña: Estrategias e impactos en el territorio. Rev Estudios Geográficos 2010:LXX1(268):203 233.
Rev Mex Cienc Pecu 2022;13(4):1009 1024 1024
Review Carlos Fernando Arechiga Flores a* Zimri Cortés Vidauri a Pedro Hernández Briano a Renato Raúl Lozano Domínguez a Marco Antonio López Carlos a Ulises Macías Cruz b Leonel Avendaño Reyes b a Universidad Autónoma de Zacatecas. Unidad Académica de Medicina Veterinaria y Zootecnia. El Cordovel, Enrique Estrada, Zacatecas, México.
https://doi.org/10.22319/rmcp.v13i4.5277Review
b Universidad Autónoma de Baja California. Instituto de Ciencias Agrícolas. Mexicali, B.C.
Abstract: Calcium (Ca) levels decrease in blood and cytosol at the time of calving, altering nerve impulse transmission, muscle contraction, and immune cell activity. In the nervous system, Caparticipatesintheconductionofstimuli. Inthe muscularsystem,itdecreasescontractions, causing alterations in smooth muscle, uterus and mammary gland. In the uterus, there is retention and storage of uterine fluids and waste, with bacterial complications. In the immune system, the function of neutrophils is important, and it manifests itself with a decrease in cells engaged in phagocytosis, predisposing to mastitis and metritis. In bovine hypocalcemia, two manifestations are distinguished: clinical and subclinical. In the clinical one (Ca values less than 5.5 mg/dl), homeostasis alters, with loss of appetite, decubitus and lethargy.
*CorrespondingMéxico.
Hypocalcemia in the dairy cow.
1025
author: arechiga.uaz@gmail.com
Serum Ca is present in three forms: ionic (iCa2+) or free calcium (50 % of total calcium), bound to proteins (approximately 40 %) and in the form of complexes with anions (10 %). iCa2+ is the only biologically active calcium. Calcium participates in nerve, muscle and immune functions(8 10). At the nervous level, it participates in the conduction of stimuli. At
Received: 22/02/2019
Rev Mex Cienc Pecu 2022;13(4):1025 1054 1026
Accepted: 12/03/2020 Introduction The transition period of the dairy cow comprises 3 wk before and 3 wk after calving(1) and several physiological changes occur in the obtaining of nutrients for the calving process, expulsion of fetal membranes and production of colostrum and milk. Therefore, circulating levels of calcium (Ca) decrease in blood and cytosol(2,3). Homeostasis or self-regulation of Ca normally uses the following feedback mechanism: it decreases the concentration of ionized calcium (iCa2+),stimulatingtheparathyroid glandto secretetheparathyroidhormone (PTH). PTH binds to its hormone receptors in kidneys and bone tissue. In the kidneys, PTH increases renal reabsorption of Ca as well as the increase in production of 1,25 dihydroxyvitamin D, the active form of vitamin D(4) . Vitamin D stimulates the epithelial cells oftheintestineto increasetheactivetransportofCa(5). Ifthe calcium in thedietis insufficient to generatehomeostasis, themechanism is directed to bonetissue(4).Dairycowsslowlybegin the reabsorption of Ca from bone tissue, but the accelerated demand of the mammary gland induces clinical hypocalcemia(2). The parathyroid gland (PTH) participates in the homeostasis of Ca, but there is also the function of the parathyroid hormone related protein (PTHrP), secreted in the mammary gland(6). The serotonin hormone is responsible for stimulating the production of the PTHrP protein(7) .
Subclinical hypocalcemia is more common (Ca between 8.0 and 5.5 mg/dl), and homeostasis does not alter, but muscle contraction and immune function decrease. The treatment is based on the application of calcium orally in standing cows, and intravenously in prostrate cows. Prevention depends on the inclusion of rations that contain anionic salts, which favors the stimulus to maintain blood Ca levels to control the level of cations and anions. In addition, Ca can be administered orally. Calcium homeostasis in lactation is regulated bythe serotonin hormone, which stimulates the parathyroid hormone and bone resorption in osteoclasts.
Key words: Hypocalcemia, Dairy cow, Homeostasis, Calcium, Serotonin, Metritis.
Rev Mex Cienc Pecu 2022;13(4):1025 1054 1027 the muscular level, in muscle contraction, and in the immune part, with the function of immune cells. Therefore, cows with hypocalcemia alter these functions depending on the severity in the decrease in calcium. There are two types of hypocalcemia: 1) clinical and 2) subclinical. The purpose of this review is to succinctly evaluate the incidence of hypocalcemia, as well as its consequences on immune function, metritis and mastitis(11 13) .
Hypocalcemia
Hypocalcemia is a metabolic nutritional disease, caused by the decrease in blood Ca. It usually occurs after calving, its manifestation can be clinical and subclinical.
Clinical hypocalcemia
Clinical hypocalcemia, also known as milk fever or puerperal paresis, is characterized by a momentary imbalance in the regulation of the concentration of calcium (Ca) in the blood between 48 72 h postpartum. Serum Ca levels decrease to 5.5 mg/dL, with the subsequent alteration in homeostasis(14 15). This disease causes great economic losses in dairyproduction units, mainly due to the cost of treatments, secondary complications and the deaths it causes(13). Amongthe risk factors for hypocalcemia, the following are considered: 1) The age of the cow, 2) The high demand for Ca to produce colostrum and milk, 3) The diet consumed during the transition period. Animals recovered from puerperal hypocalcemia produce 5 to 15 %lessmilk in thatlactation(14 15).That is, thehomeostasis ofCa(16) alters, mainlyaffecting highly producing cows, showing loss of appetite, decubitus and lethargy. Its incidence varies from 5 to 7 %(14 21) and increases as lactations progress. Calcium is related to muscle contraction. During milk fever, muscle contraction and tone in the gastrointestinal and cardiovascular systems are not maintained, and it can cause the death of the animal. Immune function decreases(2,22), and the risk of postpartum diseases such as mastitis, fetal membrane retention (FMR), metritis and abomasum displacement increases(11 14,23 26). The clinical signs of hypocalcemia are divided into three phases(11). In phase I, the cow does not show paresis, it may even go unnoticed, its signs are tenuous and transient; it is hypersensitive, nervous, excitable, with muscle tremors, anorexia, ataxia and general weakness. Some cows lose weight quickly and drag their hind limbs. The animal avoids walking or moving, does not feed, body temperature can be normal, and it can remain several hours in that state. Some cows show clinical signs of hypocalcemia similar to those described, but without having calved. This alteration usually occurs after periods of stress or decrease in dry matter consumption. This condition is more common in cows in estrus or heat, with severe digestive
It occurs when blood Ca decreases to levels less than 2.00 to 1.38 nM, but homeostasis continues(14). The normal concentration of Ca is 8.5 to 10 mg/dL (2.1 2.5 nM). It can start 12 24 h after calving, when the lowest concentration of Ca is recorded, and increases with a greater number of lactations, affecting up to 50 % of cows(2,14,20,27 28). That is whysubclinical hypocalcemia is more expensive(29 30). The decrease in blood Ca is related to the transmission of nerve impulses that lead to less muscle contraction; with lower rumen and abomasal motility, with the subsequent displacement of the abomasum and lower food consumption(14,31). For example, with the reduction of the blood level of Ca to 7.5 and 5 mg/dl, the abomasal motility of cows decreases by 30 to 70 %, respectively(32). Its effects on muscle contraction also prevent the effective closure of the mammary nipple duct (teat), which contributes to the occurrence of mastitis, and its biological and economic consequences(13 14). In addition to the relationship of Ca with muscle contraction, Ca also affects immune function and insulin secretion(12). The function of neutrophils decreases, as the cytosolic concentration of ionized calcium (iCa2+) in peripheral blood mononuclear cells decreases(2,33). Therefore, the severity of the problem will manifest itself with secondary disorders related to production and reproduction, such as retention of fetal membranes and metritis(12,30 33). iCa2+ corresponds to approximately 50 % of total calcium, the rest is bound
Phase II, (prodromal), it exhibits moderate to severe depression, partial paralysis and the characteristic sign of lying down with the neck bent and with the head directed towards the flank. The tetany observed in the first phase progresses to impossibilityto get up, paresis and prolonged decubitus, cold extremities, dry muzzle and temperature higher than normal (36.5 to 38 °C); weak arterial pulse, heart sounds, barely audible, and moderate heart rate (80/min). Absence of rumen movements is detected, which can lead to states of secondary exhaustion. Phase III is the most severe. The animal exhibits complete lateral decubitus. Severe cardiac depression, irregular pulse (almost imperceptible), decreased shallow breathing. Animals without an established therapy die in a few hours, with the manifestation of a state of shock. Thediagnosis ofmilk feveris basedonthehistoryoftheanimal, ageofthe motherandserum calcium concentration. The decrease in serum magnesium and phosphorus levels may be associated with eosinopenia and lymphopenia (adrenal hyperactivity), but the latter are not specific. It is necessary to make the differential diagnosis with hepatic steatosis, septic endometritis, mastitis and acute rumen acidosis.
Subclinical hypocalcemia
Rev Mex Cienc Pecu 2022;13(4):1025 1054 1028 disorders or severe toxic mastitis. Transient hypocalcemia may occur in cows with anorexia and low intestinal motility(17) .
Immune function
The immune system contains cells and molecules with the ability to recognize and eliminate invading or foreign microorganisms; it is regulated by the cytosolic concentration of ionic calcium(8 10). The [Antigen Receptor] binding of the immune cell triggers a series of events characterized by the increase of iCa2+ in the cytosol and depletion of iCa2+ reserves in the endoplasmic reticulum; this continues with the obtaining of additional iCa2+ from the extracellular space(40). Hypocalcemia reduces the cytosolic concentration of iCa2+ in the mononuclear cells of the blood, also reducing immune function(2). The ATPase pumps for iCa2+ of the sarcoplasmic and endoplasmic reticula regulate the entry and replacement of iCa2+ in the endoplasmic reticulum(41). The cytosolic increase of iCa2+ is needed for the adhesion of neutrophils to endothelial cells, their transmigration into tissues, chemotaxis and phagocytosis(42). This could be altered in cases of the decrease in extracellular iCa2+. In addition, control in the magnitude, amplitude and duration of the destination of iCa2+ in the immune cell is also required for the functions of immune cells(43). Immunity can be innate and specific. Innate immunity Innate immunity is activated quickly and constitutes the first immune defense when the infection begins. It depends on phagocytes such as polymorphonuclear neutrophils, macrophages and mammary epithelial cells. Macrophages identify and recognize foreign pathogens, produce cytokines (interleukin 1γ, interleukin 6 and tumor necrosis factor α) to begin the immune response, they also recruit polymorphonuclear neutrophils. In addition, they phagocytize and eliminate invading pathogens and constitute a bridge between the innate response and the specific response through the major histocompatibilitycomplex class
Rev Mex Cienc Pecu 2022;13(4):1025 1054 1029 to proteins and is biologicallyinactive. Cows with subclinical hypocalcemia decrease insulin secretion and increase blood glucose concentration(3,33 35) . Because the entry of glucose into peripheral tissues reduces, as happens in the period of insulin resistance during the postpartum period of the dairy cow(36). The cytosol of pancreatic cells requires iCa2+, which decreases duringhypocalcemia, for the release of insulin(35 37). The decrease in insulin allows the release of the lipase hormone, responsible for participating in lipolysis. This increases the plasma concentration of non esterified fatty acids (NEFAs)(12,20,23,27,37 39) with its corresponding risk of ketosis(23 25) due to the increase of ketone bodies: acetone, β hydroxybutyrate and acetoacetic acid in the bloodstream.
II, to prepare T cells(44). After the start of the inflammatory response, the predominant cells are polymorphonuclear neutrophils, which, through blood circulation, are directed by chemotaxis to locate the site of invasion(45). Polymorphonuclear neutrophils, as well as macrophages, engulf and eliminate foreign microorganisms. In activated phagocytes, oxidative burst (respiratory burst) is triggered by the activation of the nicotinamide adenine dinucleotide phosphate (NADPH) enzyme that catalyzes the reduction of oxygen to the superoxide anion, extremely toxic to foreign microorganisms. Finally, foreign microorganisms are eliminated by exocytosis. In hypocalcemia(12,22), the function of neutrophilsreduces,thepercentageofneutrophilsengagedinphagocytosisdecreases(3,12,22,33 34), the mononuclear cellular response to the antigen activated stimulus weakens(2) and the oxidative burst response reduces after incubation with pathogenic bacteria(3). In neutrophils of cows with subclinical hypocalcemia, it has been observed that the cytosolic level of iCa2+ decreases more rapidly than in normocalcemic cows, therefore the influx of calcium is not sufficient to maintain and use the cytosolic iCa2+, or replenish endoplasmic reticulum deposits, or both. This leads to a decrease in their ability to phagocytize and eliminate pathogenic bacteria(3). The reduction of the immune response leads to the manifestation of other infections of bacterial origin such as mastitis(23 24) and metritis(12,46 48) .
Specific immunity
It depends on antibodies, macrophages and T and B lymphocytes that recognize specific microorganisms(47).Thisimmunityis activatediftheinfectionpersists. Tcells aresubdivided into helper T lymphocytes and cytotoxic T lymphocytes. Helper cells produce cytokines, such as interleukin (IL 2) and interferon gamma (IFN γ), crucial in the immune response. Cytotoxic T cells recognize and eliminate cells infected with an antigen, as well as predecessor immune cells or damaged cells, which, when present, increase the susceptibility of infection. B lymphocytes differentiate into plasma cells that produce antibodies or immunoglobulins (Igs): IgG1, IgG2 and IgM, or memory cells(47)
Rev Mex Cienc Pecu 2022;13(4):1025 1054 1030
Metritis Metritis (puerperal metritis) is a postpartum bacterial complication that can be caused by less contraction of the uterine muscle (myometrium), facilitating the entry and proliferation of bacteria in the uterus, or by less activity of immune cells. Both factors caused by hypocalcemia. This infection can lead to negative consequences on reproductive function during the postpartum period(48 49). In the first 65 d postpartum, the percentage of gestation
Rev Mex Cienc Pecu 2022;13(4):1025 1054 1031 at first service has been found in 39.4 % in cows diagnosed with metritis, 38.7 % in cows with clinical endometritis and 51.4 % in cows without uterine infection(50). Immune function is compromised before metritis. Circulating neutrophils in these cows have shown a decrease in glycogen at the time of calving, and monocytes stimulated by the bacterium Escherichia coli have reduced the expression of tumor necrosis factor α(51) . Metritis is characterized by an increase in uterine size, dark red and foul smelling aqueous uterine discharges, associated with decay, loss of appetite, high heart rate, fever and decrease in milk production(52 54). There are predisposing factors such as fetal membrane retention (FMR)(55), fetal maceration and dystocia(53 58). The incidence of metritis ranges from 2.2 % to 37.3 %(59). At the herd level, the factors of greatest risk for the occurrence of metritis are the size of the herd (greater in large herds), time of year (greater in November and April), number of calving (greater in animals of three calvings or less), dystocia and placental retention(60 61). The process of infection is as follows: after calving, the cervix and cervical canal remain open for a few days for the expulsion of fluids and waste from the uterus, through the contraction of the uterine muscles(62 65). This process is more efficient in normocalcemic vs hypocalcemic cows(60,66 69). Hypocalcemic cows are more prone to retention andstagnation ofuterine fluids andwaste, andthereforeto a greater riskofbacterial complications(60,66 69). Stagnation of fluids and waste is an excellent medium for bacterial multiplication(70 73). The opening of the cervix allows bacteria to enter the uterus, although their presence will not necessarily develop the infection. Bacteria have been isolated in most cows after calving(60,74 75), but it is controlled by the action of neutrophils and other leukocytes(57 60,67,76 79). They migrate to the uterine lumen in response to the presence of bacteria and are generally able to control bacterial populations until the infection is eliminated. The cow remains healthy and has a normal postpartum period: milk production, and a new conception and gestation. The above, however, does not always happen. In some cows with subclinical hypocalcemia(12), neutrophils do not stop the infection, bacterial populations grow, and females have purulent and fetid discharges, characteristic of metritis(80 81). In the diagnosis of gestation byrectal palpation, the uterus presents an increase in size and its inflammation suppresses postpartum follicular growth and development(79 82) . The cows have a fever and remain depressed and inappetent. The lack of adequate food consumption predisposes to the presence of other disorders such as abomasum displacement and the fatty liver complex/ketosis. If the inflammation continues, it usually progresses to endometritis, which greatly compromises the cow’s fertility. Cows with subclinical hypocalcemia had a lower gestation rate and a longer interval from calving to conception compared to normocalcemic cows; the risk of metritis decreases with high levels of Ca in the blood(12)
Two models of mastitis transmission are recognized: environmental mastitis and contagious mastitis(83) .
Environmental mastitis
Hypocalcemia affects the teat canal and neutrophils. It can influence the immune system through the secretion of cortisol during calving. The teat canal is the first line of defense against mastitis because it is the pathway by which pathogens can enter the mammary gland. The canal is sealed between milkings and during the dry period by a keratin plug derived from the lining of the stratified epithelium of the canal. Probably, the main function of this waxy plug is to establish a physical barrier to prevent bacterial penetration. The teat has muscles in its sphincter that keep it closed between one milking and another. After milking, it takes two hoursforthe contractionofthesphincterandclosureoftheteat canal(94).Calcium decreases at the time of calving, both in the blood circulation and in the internal deposits of blood cells(2). Normally, the calcium recovers within a few days. In cows with hypocalcemia, this decrease is accentuated, which leads to other alterations linked to Ca. In cows with subclinical hypocalcemia, probably the teat sphincter remains distended for longer due to inefficient muscle contraction caused by Ca deficiency. In addition, when starting lactation, cows remain prostrate for long periods, compared to normocalcemic cows. This facilitates the entry of environmental pathogens through the teat canal, which reach the cistern of the mammary gland, where they proliferate and consequently induce mastitis(95). Lactoferrin is a protein that exerts different functions related to innate immunity, is synthesized in neutrophils(96) , and has a high affinity for iron (Fe; chelating activity), so it binds to free iron and reduces it. Microorganisms require Fe for their growth(97 99), its bacteriostatic effect prevents bacterial proliferation(100 101), although lactoferrin can also act as a bactericide(102) In hypocalcemia, the function of neutrophils reduces(3,22), and the activity of lactoferrin decreases, generating a higher incidence of mastitis in hypocalcemic cows.
Some normal microorganisms in the environment such as Escherichia coli, Klebsiella spp., Enterobacter spp., Serratia spp., Pseudomona spp., Proteus spp., and some gram positive bacteria such as Streptococcus uberis and Streptococcus dysgalactiae, are the ones involved in causing environmental mastitis(84 87) . The cow uses innate immunity to combat environmental mastitis, with physical barriers such as the teat sphincter; chemical barriers such as keratin and lactoferrin, and immune system components such as macrophages, dendritic cells, mast cells, neutrophils, eosinophils and natural killer cells (NKCs)(88 93) .
Rev Mex Cienc Pecu 2022;13(4):1025 1054 1032 Mastitis
The microorganisms involved in contagious mastitis are: Staphylococcus aureus, Streptococcus agalactiae, Arcanobacterium pyogenes, Mycoplasma spp.(105 106). The spread of the bacterium responsible for the infection occurs during milking, due to practices such as the shared use of towels to wash and dry udders, through contaminated hands of milkers and use of teatcups of mechanical milking without disinfecting between cow and cow. The use of individual gloves or towels, as well as the milking separatelyand milkingof infected cows to the end, with prior disinfection of the milking units, helps to prevent infection(107 109) .
Rev Mex Cienc Pecu 2022;13(4):1025 1054 1033
Hypocalcemia can reduce immune function through cortisol at the time of calving. The fetus starts the calving in the cow, stimulating the hypothalamic pituitary adrenal axis and increasing the secretion of cortisol. Cortisol changes the steroidogenic pathway, instead of directing it towards the synthesis of progesterone (P4), it directs it towards the synthesis of estradiol (E2).Asaresult,thesynthesis ofprogesteronereduces andthesynthesis ofestradiol increases, inducing calving. Cortisol secretion increases considerably in cows with hypocalcemia. Cortisol secretion is higher in hypocalcemic cows than in normocalcemic cows(103). In addition, cortisol is considered a very potent immunosuppressive agent and probably increases the immunosuppression observed in the cow during peripartum(104), with the subsequent risk of occurrence of mastitis. Contagious mastitis
Treatment Treatment should be applied immediately. The best option is to apply calcium orally to cows that are still standing. The blood calcium level increases over the course of 30 min after administration(110) and remains elevated for 4 to 6 h(110 111). Intravenous treatment rapidly increases blood calcium levels, but this increase can be extreme and potentially dangerous, and can cause fatal cardiac complications, so it is not advisable to administer it in cows that are still standing(112). After intravenous treatment, the level of blood Ca decreases again to lower than normal concentrations; consequently, the cow again shows hypocalcemia in a periodof12 to 18h(112 113).EventhedosageofCaintravenouslysuspends theanimal’sability to mobilize the necessary Ca and meet the requirements at critical times(111 113)
Experimentally, atropine induced arrhythmia has been reversed by alternating states of hypercalcemia and hypocalcemia in dairy cows(114). For cows in phases II and III of clinical disease, 500 ml of 23 % calcium gluconate solution should be administered immediately slowly intravenously. This provides 10.8 g of elemental calcium, which is enough to correct
Diet manipulation
Rev Mex Cienc Pecu 2022;13(4):1025 1054 1034 the total calcium deficiency in the cow (4 6 g). The administration of Ca intravenously is little recommended(115). In cows that respond favorably to treatment, it is important to reinforce it with oral administration 12 h after recovery, to avoid relapses(111) .
Low-calcium diets (LCDs) are administered, and the ration is adjusted to meet nutritional needs considering the dietary cation-anion difference (DCAD). Feeding with LCDs leads to transient hypocalcemia, with subsequent reabsorption from bone tissue and increase in absorption from the small intestine and increases in calcium availability(120). Rations with 8 to 10 g of calcium per day produce favorable effects for the aforementioned purpose(120). The use of anionic salts to reduce hypocalcemia is based on their acidogenic nature, which causes digestive and metabolic acidity, and generates optimal conditions for the circulation of Ca in the body(121 122). Another dietary strategy to reduce the occurrence of hypocalcemia consists of providing a ration deficient in Ca before calving. This causes a negative Ca balance in the cow before calving and stimulates the secretion of parathyroid hormone (PTH) and 1,25 dihydroxyvitamin D, promoting Ca homeostasis at calving. In the field, it is recommended to provide prepartum rations with reduced levels of Ca (approximately 0.5 % of Ca)(123 124) . The acidification of the pH in the rumen and intestine leads to the increase of the solubilization of Ca; acidosis promotes the activation of parathormone (PTH), and this in turn participates in the absorption of intestinal Ca(124 125). Acidity increases the function of osteoclasts, responsible for bone resorption, transferring iCa2+ from the bones to the blood circulation and increasingthe excretion of Ca in the urine(125 127). Cows fed a negative DCAD diet in the prepartum increase the blood concentration of iCa2+(127). Under normal conditions, the body maintains a pH between 7.35 and 7.45(128), through various physical chemical regulatorymechanisms, such as: the buffer systems of the plasma (bicarbonates and proteins) and bone tissue. There are other physiological regulators such as the elimination of CO2 by respiratory route to the detriment of bicarbonates, the elimination of acids through the kidneys and the reabsorption of bicarbonates. The concentration of ions (milliequivalents) establishes an equality in the different media, the sum of anions (negatively charged ions with acid nature) is equal to the sum of cations (positively charged ions with basic nature).
Prevention Hypocalcemia is prevented bymanipulatingthe diet and administeringcalcium orally(113 119) .
Based on the fact that Na+ , K+ and Cl ions (bioavailable ions that cannot be metabolized in
Rev Mex Cienc Pecu 2022;13(4):1025 1054 1035 simpler forms) determine the acid base balance of the plasma medium and the acidogenic function of sulfates (SO=; theydirectly acidifybiological fluids)(129),these four ions are taken into account for the calculation of the cation anion balance of the raw material and the formulationofdietsfordrycows(117 118,125).Bycalculatingthedietarycation aniondifference (DCAD), the diet can be formulated on the ionic balance and pH of the plasma medium(117 118). DCAD is defined as the difference between cations and anions. Feeding cows with a negative DCAD diet to dry cows at the end of gestation increases anions (SO4= and Cl ), so the blood buffer capacity alters, and the blood acidifies(125). In response, the body releases cations (H+) to neutralize anions and maintain electroneutrality. This causes the pH to decrease and generates acidity in the urine and greater excretion of Ca; the level of iCa2+ in the blood circulation reduces and stimulates the secretion of PTH and this in turn participates in the active formation of 1,25 dihydroxyvitamin D3 (1,25(OH)2 D3) and in the mobilization of bone Ca(4,130) with the increase in the concentration of iCa2+ in the blood(123 125,130). In addition, cowsfed negativeDCADdiets increasetheirconcentrations of serotonin(127),which is important for the function of the mammary gland during lactation. Based on the above, the use of DCAD reduces the incidence of hypocalcemia(34,116 118,124,131 132), with the subsequent increase in leukocyte function and reproductive health(34). A problem with anionic salts is their low palatability, as they reduce feed consumption and predispose to other eating disorders such as low energy intake in the transition period. Fortunately, the new DCAD are more palatable and avoid this situation. Another disadvantage is their cost, but the cost benefit of their use must be analyzed(133 137) .
The favorable effect of oral calcium for the prevention of hypocalcemia in dairy cows has been demonstrated, even having access to rations with anionic salts or in herds with low incidence of milk fever cases(119). When the animal consumes less Ca than required, the absorption of Ca increases. On the contrary, when the animal consumes more Ca than required,theabsorptionofCadecreases(138).Eventsthatcausechangesin efficientabsorption of Ca begin with changes in plasma Ca but depend on the control of the active metabolite of vitamin D3, known as 1 25 dihydroxyvitamin D3 [1 25 (OH)2 D3]. Although there is evidence of pre-duodenal absorption of Ca, the greatest absorption of Ca occurs in the duodenum or upper part of the small intestine(139). The transfer of Ca through the intestinal villi occurs by facilitated transport and is initiated by 1,25 (OH)2 D3, which enters the enterocyte by means of cell diffusion and binds to its receptor in the cellular cytoplasm(140) . The 1,25 (OH)2 D3 receptor complex moves to the chromatin fraction in the cell nucleus and this hormone receptor complex synthesizes more messenger RNA and specific proteins that regulate Ca transport.
Oral administration of calcium
There are several components that limit the bioavailability and absorption of Ca. Oxalates, which could reduce the amount of Ca in hays and alfalfas, or low levels of phosphorus (P) in the diet, as well as high levels of magnesium fluoride, concentration of lipids in the diet, or by nucleic acids produced by bacteria or bacterial cell walls(138). There are compounds such as calcium chloride (CaCl3) that have the ability to maintain the concentration of blood calcium(110 111), this is due to its bioavailability and its ability to stimulate the acid response in the cow, which increases its own mobilization of calcium(110). Good absorption is obtained with 50 g of elemental calcium dissolved in 250 ml of water. However, care should be taken with the dosage of calcium. There is a risk of inhalation, and it is very caustic for the tissues of the upper airways(110). Calcium propionate is absorbed slowly, probably because it does not increase acidity. The administration of 75 to 125 g dissolved in water and propylene glycol offers good results(110 111). Calcium carbonate dissolved in water is another presentation that has been evaluated, without satisfactory results since it does not increase the level of blood calcium(110), probably due to its low bioavailability. In addition, calcium carbonate produces an alkalogenic response, which acts in the opposite way to anionic salts and prevents the mobilization of bone calcium. To facilitate the dosage of calcium, the use of boluses with calcium chloride and sulfate has been studied. The bolus is administered immediately after calving and 12 h after. With this treatment, the ionic concentration of plasma calcium has been increased(134 136). This bolus has the advantage of being palatable, Ca is not wasted, there are no risks of inhalation, and the release of calcium is slower and more effective. The application of calcium subcutaneously is not recommended because it causes irritation and necrosis in the tissues(11) .
Serotonin Serotonin regulates the physiology of the mammary gland during lactation. It is synthesized in various tissues of the body from the L tryptophan amino acid, by the action of the tryptophan hydroxylase (TPH) enzyme to transform it into 5 hydroxytryptophan (5 HTP).
Decarboxylase converts 5 HTP into serotonin(137 140). In rodents, serotonin is synthesized in the intestine and other tissues(141 144), travels through the bloodstream and acts on the mammary gland. The mammary gland has receptors for serotonin(145 148). In addition, it expresses the TPH enzyme(147) and synthesizes serotonin during lactation(148 151). Serotonin stimulates the synthesis and secretion of parathyroid hormone related protein (PTHrP) in the mammary gland(145 146,151 157) and participates in the expression of calcium sensitive receptors (CaSRs) during lactation(158 160). PTHrP is secreted into the maternal circulation and acts on bone cells to stimulate bone resorption in osteoclasts, releasing calcium into the systemic circulation(142), destined for the mammary gland(160). The addition of 5 HTP, the precursor of serotonin, to the feed ration, during the gestation lactation transition period in
Rev Mex Cienc Pecu 2022;13(4):1025 1054 1036
Rev Mex Cienc Pecu 2022;13(4):1025 1054 1037 rodents, increases the circulating concentration of serotonin, PTHrP and Ca, as well as the content of Ca in milk(151). PTHrP, unlike PTH, acts as a paracrine regulator and is located in the circulation during lactation or humoral hypercalcemia(160). Therefore, like PTH, PTHrP acts as a hormonal regulator of Ca and is important for the homeostasis and mobilization of Ca during calving and lactation(161 162). In addition, PTHrP is detected in blood only during lactation. It decreases its production, plasma concentration and the preservation of bone mass(159). The zero serum concentration of PTHrP during lactation is restored with the application of 5 HTP over the course of 1 h(146). This demonstrates the importance of 5 HTP in the production of PTHrP during lactation and in the increase of blood Ca(152 153). CaSR identifies variations of extracellular free calcium, its ions bind, and the link for cellular response is established in various organs(163 167). During lactation, the production of PTHrP is inhibited and the transport of calcium to milk is stimulated, it is activated with the increase of calcium in the circulation(158,168). Therefore, the mammary gland acts as a calcium sensitive organ during lactation, which responds to changes in its extracellular concentration, mainly through the calcium-sensitive receptor. Which identifies the concentration of Ca in the blood circulation and together with the PTHrP regulates its level in the blood(159) .
Serotonin helps maintain calcium homeostasis in lactation. PTHr releases calcium from bone tissue into the circulation, and activates CaSRs, which have negative feedback on PTHrP. Consequently, the stimulation on the osteoclasts is suspended, that is, their release from bone tissue is decreased. CaSR also promotes the transport of blood calcium to milk. Consequently, it reduces Ca in the blood and causes greater secretion of PTHrP in the mammary epithelial cells, increasing calcium reabsorption. Therefore, the mammary gland regulates its own calcium requirements under a negative feedback system(159) that allows it to maintain its calcium requirements duringmilk production. In dairycattle, a process similar to that of rodents may occur. There is expression of serotonin receptors in the mammary epithelium(144,169). The circulating concentration of serotonin on the first day of lactation has been positively correlated with the circulating level of Ca in dairy cows(153 156), as well as throughout most of lactation(170). The intravenous application of 5 HTP, the precursor of serotonin, administered at the end of lactation in non pregnant Holstein cows(157) and at the end of gestation in pregnant cows(148 151) has increased the systemic level of serotonin and calcium, and has decreased the elimination of calcium in the urine, increasing the concentration of calcium in milk and colostrum. The effect of serotonin is independent of parathyroid hormone(151). In addition, PTHrP has been previously identified in the cow’s circulatory system(170 172)
Hypocalcemia can occur in the peripartum due to alterations in calcium homeostasis when the blood and cytosolic concentration of Ca decreases. Hypocalcemia can occur clinically and subclinically. The reduction of calcium leads to a decrease in immune function and in smooth muscle contractions, increasing the risk of metritis and mastitis, among other alterations. Clinical hypocalcemia is treated with intravenous calcium and subclinical hypocalcemiawith oral calcium. Preventionrequires theaddition ofanionicsalts in theration and the addition of calcium orally. In addition to inducing mild prepartum hypocalcemia to stimulate the secretion of parathyroid hormone (PTH) and of 1,25 dihydroxyvitamin D and thus induce Ca homeostasis after calving. Efficient absorption of Ca depends on the plasma Ca level and on the active metabolite of vitamin D3, called 1,25 dihydroxyvitamin D3 [1 25 (OH)2 D3]. During lactation, serotonin participates in maintaining calcium homeostasis through the synthesis and secretion of parathyroid hormone related protein (PTHrP), and this effect is independent of the action of parathyroid hormone.
Rev Mex Cienc Pecu 2022;13(4):1025 1054 1038
2. Kimura K, Reinhardt TA, Goff JP. Parturition and hypocalcemia blunts calcium signals in immune cells of dairy cattle. J Dairy Sci 2006;89:2588 2595.
3. Martinez N, Sinedino LDP, Bisinotto RS, Ribeiro ES, Gomes GC, Lima FS, et al Effect of induced subclinical hypocalcemia on physiological responses and neutrophil function in dairy cows. J Dairy Sci 2014;97:874-887.
6. MoseleyJM, Kubota M, Diefenbach Jagger H, Wetthenhall RE, Kemp BE, Suva LJ, et al Parathyroid hormone related protein purified from a human lung cancer cell line. Proc Natl Acad Sci USA 1987;84:5048 5052.
Conclusions
Literature cited: 1. Drackey JK. Biology of dairy cows during the transition period the final frontier? J Dairy Sci 1999;82:2259 2273.
4. Horst RL, Reinhardt TA. Vitamin D metabolism in ruminants and its relevance to the periparturient cow. J Dairy Sci 1983;66:661 678.
7.HorsemanND,Hernandez LL.Newconceptsofbreastcellcommunicationtobone.Trends Endocrinol Metab 2014;25:34 41
5. Goff JP. Calcium and magnesium disorders. Vet Clin North Am Food Anim Pract 2014;30:359 381.
10. Vig M, Kinet JP. Calcium signal in immune cell. Nat Immunol 2009;10:21 27.
17. Esslemont RJ, Kossaibati MA. Incidence of production diseases and other health problems in a group of dairy herds in England. Vet Rec 1996;139:486 490.
18. Hansen SS, Ersboll AK, Blom JY, Jorgensen RJ. Preventive strategies and risk factors for milk fever in Danish dairyherds a questionnaire survey. Prev Vet Med 2007;80:271 286. 19. Mulligan FJ, Doherty ML. Production diseases of the transition cow. The Vet J 2008;176(1):3 9. 20. Reinhardt TA, Lippolis JD, McCluskeyBJ, Goff JP, Horst RL. Prevalence of subclinical hypocalcemia in dairy herds. Vet J 2011;188:122 124.
13. Doehring C, Sundrum A. The informative value of an overview on antibiotic consumption, treatment efficacy and cost of clinical mastitis at farm level. Prevent Vet Med 2019;165:63 70.
21. Bhanugopan MS, Lievaart J. Survey on the occurrence of milk fever in dairy cows and the current preventive strategies adopted by farmers in New South Wales, Australia. Aust Vet J 2014;92:200 205.
16. Goff JP, Horst RL. Effects of addition of potassium or sodium, but not calcium, to prepartum rations on milk fever in dairy cows. J Dairy Sci 1997;80:176 186.
9. Parekh AB. Cell biology. Cracking the calcium entry code. Nature 2006;441:163 165.
14. Goff JP. The monitoring, prevention, and treatment of milk fever and subclinical hypocalcemia in dairy cows. Vet J 2008;176:50 57.
Rev Mex Cienc Pecu 2022;13(4):1025 1054 1039
8. Saris NE, Carafoli E. A historical review of cellular calcium handing, with emphasis of mitochondria. Biochem (Mosc) 2005;70:187 194.
11. Goff JP. Treatment of calcium, phosphorus, and magnesium balance disorders. Vet Clin North Am Food Animal Pract 1999;15:619 639.
15. DeGaris PJ, Lean IJ. Milk fever in dairy cows: a review of pathophysiology and control principles. The Vet J 2008;176(1):58 69.
12. Martinez N, Risco CA, Lima FS, Bisinotto RS, Greco LF, Ribeiro ES, et al. Evaluation of peripartal calcium status, energetic profile, and neutrophil function in dairy cows at low or high risk of developing uterine diseases. J Dairy Sci 2012;95:7158 7172.
33. Martinez N, Sinedino LDP, Bisinotto RS, Ribeiro ES, Gomes GC, Lima FS, et al. Effect of induced subclinical hypocalcemia on physiological responses and neutrophil function in dairy cows. J Dairy Sci 2014;97(2):874 887.
22. Ducusin RJ, Uzuka Y, Satoh E, Otani M, Nishimura M, Tanabe S, Sarashina T. Effects of extracellular Ca2+ on phagocytosis and intracellular Ca2+ concentrations in polymorphonuclear leukocytes of postpartum dairy cows. Res Vet 2003;75:27 32.
26. Mulligan FJ, O’Grady L, Rice DA, Doherty ML. A herd health approach to dairy cow nutrition and production diseases of the transition cow. Anim Reprod Sci 2006;96(3 4):331 353.
5. Goff JP, Horst RL. Physiological changes at parturition and their relationship to metabolic disorders. J Dairy Sci 1997;80:1260 1268.
29. Guard CL. Fresh cow problems are costly: culling hurts the most. Hoard’s Dairyman 1996;141:8 11.
30. Chapinal N, CarsonME, LeBlank SJ, Leslie KE, Godden S, Capel M, Santos JE, Overton MW, Duffield TF. The association of serum metabolites in the transition period with milk production and early lactation reproductive performance. J Dairy Sci 2012;95:1301 1309.
28. Horst RL, Goff JP, McCluskey BJ. Prevalence of subclinical hypocalcemia in US dairy operations. J Dairy Sci 2003b;86 (Suppl 1):247.
23. Curtis RA, Erb HN, Sniffen CJ, Smith RD, Powers PA, Smith MC, White ME, Hillman RB, Pearson EJ. Association of parturient hypocalcemia with eight periparturient disorders in Holstein cows. JAVMA 1983;183:559 561.
31. ChapinalN,Carson M, Duffield TF,Capel M, GoddenS, OvertonM, Santos JE,LeBlank SJ. The association of serum metabolites with clinical disease during the transition period. J Dairy Sci 2011;94:4897 4903.
24. Curtis RA, Erb HN, Sniffen CJ, Smith RD, Kronfeld DS. Path analysis of dry period nutrition, postpartum metabolic and reproductive disorders, and mastitis in Holstein cows. J Dairy Sci 1985;68:2347 2360.
32. Daniel RCW. Motility of the rumen and abomasum during hypocalcemia. Can J Comp Med 1983;47:276-280.
Rev Mex Cienc Pecu 2022;13(4):1025 1054 1040
27. Horst RL, Goff JP, McCluskey B. Prevalence of sub-clinical hypocalcemia in US dairy operations. US Departament of Agriculture (USDA) Agr Res Serv. Washington, DC. 2003a.
35. Hayirili A. The role of exogenous insulin in the complex of hepatic lipidosis and ketosis associated with insulin resistance phenomenon in postpartum dairy cattle. Vet Res Commun 2006;30:749 774. 36. Witzel DA, Littledike ET.Suppressionofinsulinsecretion duringinducedhypocalcemia. Endocrinol 1973;93:761 766.
37. Rorsman P, Braun M, Zhang Q. Regulation of calcium in pancreatic α and β cells in health and disease. Cell Calcium 2012;51(3 4):300 308. 38. Spain J, Vogel RJ, Sampson JD. The effects of supplemental anionic salt fed during the periparturient period: Implications of milk production and feed intake for high producing dairy cows. J Dairy Sci 2004;87(Suppl 1):345 39. Chamberlin WG, Middleton JR, Spain JN, Johnson GC, Ellersieck MR, Pithua P. Subclinical hypocalcemia, plasma biochemical parameters, lipid metabolism, postpartum disease, and fertility in postparturient dairy cows. J Dairy Sci 2013;96(11):7001 7013. 40. Bréchard S, Tschirhart EJ. Regulation of superoxide production in neutrophils: role of calcium influx. J Leuk Biol 2008;84(5):1223-1237.
45. Suriyasathaporn W, Daemen AJ, Noordhuizen Stassen EN, Dieleman SJ, Nielen M, Schukken YH. β hydroxibutirate levels in peripheral blood and ketone bodies supplemented in culture media affect the in vitro chemiotaxis of bovine leukocytes. Vet Immunol Immunopath 1999;68:177 186.
34. Martinez N, Rodney RM, Block E, Hernandez LL, Nelson CD, Lean IJ, Santos JEP. Effects of prepartum dietary cation anion difference and source of vitamin D in dairy cows: Health and reproductive responses. J Dairy Sci 2018;101:2563 2578.
41. Burgos RA, Conejeros I, Hidalgo MA, Werling D, Hermosilla C. Calcium influx, a new potentialtherapeutictarget in thecontrol ofneutrophil dependent inflammatorydiseases in bovines. Veterin Immunol Immunopathol 2011;143(1 2):1 10.
Rev Mex Cienc Pecu 2022;13(4):1025 1054 1041
42. Cohen MS. Molecular events in the activation of human neutrophils for microbial killing. Clin Infect Dis 1994;18:S170 S179. 43. Quah BJ, ParishCR.Newandimprovedmethods formeasuringlymphocyteproliferation in vitro and in vivo using CFSE like fluorescent dyes. J Immunol Meth 2012;379(1 2):1 14. 44. Rainard P, Roillet C. Innate immunity of the bovine mammary gland. Vet Res 2006;37: 369 400.
46. Ribeiro ES, Lima FS, Greco LF, Bisinotto RS, Monteiro AP, Favoreto M, et al. Prevalence of periparturient diseases and effects of fertility of seasonality calving grassing dairy cows supplemented with concentrates. J Dairy Sci 2013;96:5682 5697.
51. Galvao K, Felippe M, Britttin S, Sper R, Fraga M, Galvao J, Caixeta L, Guard C, Ricci A, Gilbert R. Evaluation of cytokine expression by blood monocytes of lactating Holstein cows with or without postpartum uterine diseases. Theriogenology 2012;77:356 372.
48. Kasimanickam R, Duffield T, Foster R, Gartey C, Leslie K, Walton J, Johnson W. Endometrial cytology and ultrasonography for the detection of subclinical endometritis in postpartum dairy cows. Theriogenology 2004;62:9 26.
49. Dobson H, Walker SL, Morris MJ, Routly JE, Smith RF. Why is it getting more difficult to successfully artificially inseminate dairy cows? Animal 2008;2(8):1104 1111.
47. Sordillo LM, Shafer-Weaver K, DeRosa D. Immunology of the mammary gland. J Dairy Sci 1997;80:1851 1865.
52. Benzanquen ME, Risco CA, Archbald LF, Melendez P, Thatcher MJ, Thatcher WW. Rectal temperature, calving related factors, and their incidence of puerperal metritis in postpartum dairy cows. J Dairy Sci 2007;90:2804-2814. 53. Sheldon IM, Lewis GS, LeBlanc S, Gilbert RO. Defining postpartum uterine diseases in cattle. Theriogenology 2006;65:1516 1530.
54. Sheldon IM, Wathers DC, Dobson H. The management of bovine reproduction in elite herds. Vet J 2006;171:70 78. 55. Arechiga CF, Ortiz O, Hansen PJ. Effect of prepartum injection of vitamin E and selenium on postpartum reproductive function of dairy cattle. Theriogenology 1994;41(6):1251 1258. 56. Földi J, Kulcsar M, Pecsi A, Huyghe B, De Sa C, Lohuis J, Cox P, Huezenicza G. Bacterial complication of postpartum uterine involution in cattle. Anim Reprod Sci 2006;96:265-281. 57. Kimura K, Goff JP, Kehrli ME Jr, Reinhardt TA. Decreased neutrophil function as a cause of retained placenta in dairy cattle. J Dairy Sci 2002;85:544 550. 58. Gunnink JW. Pre partum leucocytic activity and retained placenta. Vet Q 1984;6:52 54.
Rev Mex Cienc Pecu 2022;13(4):1025 1054 1042
50. Santos J, Bisinotto R, Ribeiro E, Lima F, Greco L, Staples C, Thatcher W. Applying nutrition and physiology to improve reproduction in dairy cattle. Soc Reprod Fertil 2010;67(Suppl):387 403.
59. Kelton DF, Lissemore KD, Martin RE. Recommendations for recording and calculating the incidence of selected clinical diseases of dairy cattle. J Dairy Sci 1998;81:2502 2509. 60. Sheldon IM, Dobson H. Postpartum uterine health in cattle. Anim Reprod Sci 2004;82/83:295 306. 61. Bruun J, Ersboll AK, Alban L. Risk factors for metritis in Danish dairy cows. Prev Vet Med 2002;54:179 190.
67. Lewis GS. Uterine health and disorders. J Dairy Sci 1997;80:984 994. 68. Al Eknah MM, Noakes DE. A preliminary study on the effect of induced hypocalcemia and nifedipine on uterine activity in the parturient cow. J Vet Pharmacol Ther 1989;12:237 239. 69. Martin LR, Williams WF, Russek E, Gross TS. Postpartum uterine motilitymeasurement in dairy cows retaining their fetal membranes. Theriogenology 1981;15:513 524. 70. Peter AT, Bosu WTK, Lucker CV. Plasma endotoxin and concentrations of stable metabolites of prostacyclin thromboxane A2 and prostaglandin E2 in postpartum dairy cows. Prostaglandins 1987;34:15 28. 71. Peter AT, Bosu WTK, Gilbert RO. Absorption of E coli endotoxin (lipopolysaccharide) from the uteri of postpartum dairy cows. Theriogenology 1990;33:1011 1020.
66. Kamgarpour R, Daniel RCW, Fenwick DC, McGuigan K, Murphy G. Postpartum subclinical hypocalcemia and effects on ovarian function and uterine involution in a dairy herd. Vet J 1999;158:59 67.
62. Bajcsy AC, Szenci O, Doornenbal A, van der Weijden GC, Csorba C, Kocsis L. Szucs I, Ostgard S, Taverne AM. Characteristics of bovine early puerperal uterine contractility recorder under farm conditions. Theriogenology 2005;64:99 111. 63. Burton MJ, Dziuk HE, Fahning ML, Zemjanis R. Myometrial activity during natural and dexamethasone induced parturition in the cow. Am J Vet Res 1987;48:37 44. 64. Gajewski Z, Thun R, Faundez R, Boryczko Z. Uterine motility in the cow during puerperium. Reprod Domest Anim 1999;34:185 191. 65. Paisley LG, Mickelsen WD, Anderson PB. Mechanisms and therapy for retained fetal membranes and uterine infection of cows: a review. Theriogenology 1986;25:353 381
Rev Mex Cienc Pecu 2022;13(4):1025 1054 1043
72. Dohmen MJW, Joop K, Sturk A, Bols PEJ, Lohuis JACM. Relationship between intrauterine bacterial contamination, endotoxin levels and the development of endometritis in postpartum cows with dystocia or retained placenta. Theriogenology 2000;54:1019 1032.
Rev Mex Cienc Pecu 2022;13(4):1025 1054 1044
74. Hussain AM, Daniel RCW, O’Boyle D. Postpartum uterine flora following normal and abnormal puerperium cows. Theriogenology 1990;34:291 302.
76. Cai TQ, Weston P, Lund LA, Brodie B, McKenna D, Wanger WC. Association between neutrophil functions and periparturient disorders in cows. Am J Vet Res 1994;55:934 943.
77. Lewis GS. Steroidal regulation of uterine immune defenses. Anim Reprod Sci 2004;82/83:281 294. 78. Bondurant RH. Inflammation in the bovine reproductive tract. J Dairy Sci 1999;82(Suppl 2):101 110. 79. Mateus L, Lope de Costa L, Robalo Silvia J. Influence of puerperal uterine infection on uterine involution and postpartum ovarian activity in dairy cows. Reprod Domest Anim 2002;37:31 35. 80. Kim IH, Na KJ, Yang MP. Immune response during the peripartum period in dairy cows with postpartum endometritis. J Reprod Dev 2005;51:757 764. 81. Hammon DS, Evjen IM, Dhiman TR, Goff JP, Walters JL. Neutrophil function and energy status in Holstein cows with uterine health disorders. Vet Immunol Immunopathol 2006;113:21 29. 82. Sheldon IM, Noakes DE, Rycroft AN, Pfeiffer DU, Dobson H. Influence of uterine bacterial contamination after parturition on ovarian dominant follicle selection and follicle growth and function in cattle. Reproduction 2002;123:837 845. 83. Zadoks R. Understanding the sources, transmission routes and prognoses for mastitis pathogens. WCDS Adv Dairy Technol 2014;26:91 100. 84. Smith KL, Hogan JS. Environmental mastitis. Vet Clin North Am Food Anim Pract 1993;9:489 498.
73. Mateus L, Lope de Costa L, Diniz P, Ziecik AJ. Relationship between endotoxin and prostaglandin (PGE2 andPGFM)concentrations andovarianfunctionin dairycowswith puerperal endometritis. Anim Reprod Sci 2003;76:143 154.
75.Elliot L,McMahon KJ,GierHT,MarionGB.Uterusofthecowafterparturition:bacterial content Am J Vet Res 1968;29:77 81.
90. Riollet C, Rainard P, Poutrel B. Cells and cytokines in inflammatory secretions of bovine mammary gland. Biol Mamm Gland 2000;480:247 258.
98. Olever SP, Bouche T. Growth inhibition of Escherichia coli and Klebsiella pneumonae during involution of the bovine mammary gland: relation to secretion composition. Am J Vet Res 1987;48:1669 1673.
Rev Mex Cienc Pecu 2022;13(4):1025 1054 1045
97. Rainard P. Bacteriostasis of Escherichia coli by bovine lactoferrin, transferrin and immunoglobulins (IgG1, IgG2, IgM) acting alone or in combination. Vet Microbiol 1986;11:103 115.
86. Seegers H, Fourichon C, Beaudeau F. Production effects related to mastitis and mastitis economics in dairy cattle herds. Vet Res 2003;34(5):475 491.
87. Muñoz MA, Welcome FL, Schukken YH, Zadoks RN. Molecular epidemiology of two Klebsiella pneumonia mastitis outbreaks on a diary farm in New York State. J Clin Microbiol 2007;45:3964 3971.
85. Hogan J, Smith KL. Coliform mastitis. Vet Res 2003;34:507 519.
88. Craven N. Do rising fat globules assist microbial invasion via the teat duct between milking? Kieler Milch Forschung 1985;37:554 558.
91. Kelley J, Walter L, Trowsdale J. Comparative genomics of natural killer cell receptor gene clusters. PLoS Genetics 2005;1:129 139. 92. O’Connor GM, Hart OM, Gardiner CM. Putting the natural killer cells in its place. Immunol 2006;117:1 10. 93. Werling D, Piercy J, Coffey TJ. Expression of TOLL-like receptors (TLR) by bovine antigen-presenting cells-potential role in pathogen discrimination? Vet Immunol Immunopath 2006;112:2 11. 94. Schultze WD, Bright SC. Changes in penetrability of bovine papillary duct to endotoxin after milking. Am J Vet Res 1983;44(12):2373 2375. 95. Goff JP, Horst RL, Jardon PW, Borelli C, Wedam J. Field trails of an oral calcium propionate paste as an aid to prevent milk fever in periparturient dairy cows. J Dairy Sci 1996;79:378 383.
89. Craven N, Williams MR. Defenses of the bovine mammary gland against infection and prospects for their enhancement. Vet Immunol Immunophatol 1985;10:71 127.
96. Harmon RJ, Newbould FHS. Neutrophil leukocyte as a source of lactoferrin in bovine milk. Am J Vet Res 1980;41:1603 1606.
101. Rainard P. Bacterioestatic activity of bovine milk lactoferrin against mastitic bacteria. Vet Microbiol 1986;11:387 392. 102. Orsi N. The antimicrobial activity of lactoferrin: current status and prespectives. Biometals 2004;17:189 196. 103. Horst RL, Jorgensen NA. Elevated plasma cortisol during induced and spontaneous hypocalcemia in ruminants. J Dairy Sci 1982;65(12):2332 2337.
99. Legrand D, Elass E, Pierce A, Mazurier L. Lactoferrin and host defence: an overview of its immune modulating and anti inflammatory properties. Biometals 2004;17:225 229.
104. Kehril ME Jr, Nonnecke BJ, Roth JA. Alterations in bovine lymphocyte function during periparturient period. Am J Vet Res 1989;50:215 220. 105. Bradley A. Bovine mastitis: an evolving disease. Vet J 2002;164:116 128. 106. White LJ, Lam TJGM, Schukken YH, Green LE, Medley GF, Chappell MJ. The transmission and control of mastitis in dairycows: a theoretical approach. Prev Vet Med 2006;74(1):67 83. 107. Halasa T, Huijps K, Østerås O, Hogeveen H. Economic effects of bovine mastitis and mastitis management: a review. Vet Quart 2007;29(1):18 31. 108. Venjakob PL, Borchardt S, Heuwieser W Hypocalcemia Cow level prevalence and preventive strategies in German dairy herds. J Dairy Sci 2017;100(11):9258 9266. doi: 10.3168/jds.2016 12494. 109. Contreras GA, Rodriguez JM. Mastitis: comparative etiology and epidemiology. J Mamm Gl Biol Neoplasia 2011;16:339 356. 110. Goff JP, Horst RL. Oral administration of calcium salts for treatment of hypocalcemia in cattle. J Dairy Sci 1993;76:101 108. 111. Goff JP, Horst RL. Calcium salts for treating hypocalcemia: carrier effects, acid base balance, and oral versus rectal administration. J Dairy Sci 1994;77:1451 1456. 112. Thilsing Hansen T, Jorgensen RJ, Ostergaard S. Milk fever control and principles: a review. Acta Vet Scand 2002;43:1 19. 113. Curtis RA, Cote JF, McLennan MC, Smart JF, Rowe RC. Relationship of methods of treatment of relapse rate and serum levels of calcium and phosphorus in parturient hypocalcemia. Can Vet J 1978;19:155 158.
Rev Mex Cienc Pecu 2022;13(4):1025 1054 1046
100. Smith KL, Schanbacher FL. Lactoferrin as a factor of resistance to infection of the bovine mammary gland. J Am Vet Med Assoc 1977;170:1224 1227.
Rev Mex Cienc Pecu 2022;13(4):1025 1054 1047
125. Muhammad SH, Muhammad AS, Mahr Un Nisa, Muhammad S. Dietary cation anion difference: impact on reproductive and productive performance in animal agriculture. Afr J Biotechnol 2010;9:7976 7988.
114. Littledike ET, Glazier D, Cook HM. Electrocardiographic changes after induced hypercalcemia and hypocalcemia in cattle: reversal of the induced arrhythmia with atropine. Am J Vet Res 1976;37(4):383 388. 115. Doze JG, Donders R, van der Kolk JH. Effects of intravenous administration of two volumes of calcium solution on plasma ionized calcium concentration and recovery from naturally occurring hypocalcemia in lactating dairy cows. Am J Vet Res 2008;69:1346 1350. 116. Oetzel GR, Olson JO, Cartis CR, Fettmen M. Ammonium chloride and ammonium sulfate for prevention of parturient paresis in dairy cows. J Dairy Sci 1988;71:3302 117.3309.Tucker WB, Houge JF, Waterman DF, Swenson TS, Xing Z. Role of sulfur and chloride in the dietary cation anion balance equation for lactating dairy cattle. J Anim Sci 1991;69:1205 1213. 118. Moore SJ, Vandehaar MG, Sharma BK. Effects of altering dietary cation anion difference on calcium and energy metabolism in peripartal cows. J Dairy Sci 2000;83:2095 2104. 119. Oetzel GR, Miller BE. Effect of oral calcium bolus supplementation on early lactation health and milk yield in commercial dairy herds. J Dairy Sci 2012;95:7051 7065. 120. Horst RL, Goff JP, Reinhardt TA, Buxton DR. Strategies for preventing milk fever in dairy cattle. J Dairy Sci 1997;80:1269-1280. 121. Block E. Manipulation of dietary cation anion difference on nutritionally related production diseases, productivity, and metabolic responses of dairy cows. J Dairy Sci 1994;77:1437 1450. 122. Block E. Manipulating dietary cations and anions for prepartum dairy cows to reduce incidence of milk fever. J Dairy Sci 1984;67:2939 2948. 123. Goff JP. The monitoring, prevention, and treatment of milk fever and subclinical hypocalcemia in dairy cows. The Vet J 2008;176(1):50 57. 124. Goff JP, Koszewski NJ Comparison of 0.46% calcium diets with and without added anions with a 0.7% calcium anionic diet as a means to reduce periparturient hypocalcemia. J Dairy Sci 2018;101(6):5033-5045.
128. Nagy O, Kovác G, Seidel H, Weissová T. The effect of arterial blood sampling sites on blood gases and acid base balance parameters in calves. Acta Vet Hung 2001;49:331 129.340.Whiting SJ, Drapper HH. Effect of a chronic acid load as sulfate or sulfur amino acid on bone metabolism in adult rats J Nutr 1981;111:1721 1726.
131. Gaynor PJ, Mueller FJ, Miller JK, Ramsey N, Goff JF, Horst RL. Parturient hypocalcemia in Jersey cows fed alfalfa haylage based based diets with different cation to anion ratios. J Dairy Sci 1989;72:2525 2531.
135. Santos JEP, Lean IJ, Golder H, Block E. Meta analysis of the effects of prepartum dietary cation anion difference on performance and health of dairy cows. J Dairy Sci 2019;102(3):2134 2154.
Rev Mex Cienc Pecu 2022;13(4):1025 1054 1048
134. Lean IJ, Santos JEP, Block E, Golder HM Effects of prepartum dietary cation anion difference intake on production and health of dairy cows: A meta analysis. J Dairy Sci 2019;102(3):2013 2133.
126. Goff JP, Horst RL. Role of acid bas physiology on the pathogenesis of parturient hypocalcemina (milk fever) the DECAD theory in principal and practice. Acta Vet Scand 2003;97:51 56.
132. Goff JP, Horst RL, Mueller FJ, Miller JK, Kiess GA, Dowlen HH. Addition of chloride to a prepartal diet high in cations increases 1,25 dihidroxivitamin response to hypocalcemina preventing milk fever. J Dairy Sci 1991;74:3863-3871.
127. Rodney RM, Martinez N, Block E, Hernandez LL, Celi P, Nelson CD, Santos EP, Lean IJ. Effects of prepartum dietary cation anion difference and source of vitamin D in dairy cows: vitamin D, mineral, and bone metabolism. J Dairy Sci 2018;101:2519 2543.
136. Charbonneau E, Pellerin D, Oetzel GR. Impact of lowering dietary cation anion difference in nonlactating dairycows: A meta-analysis. J DairySci 2006;89(2):537-548. 137. Goff JP. The monitoring, prevention, and treatment of milk fever and subclinical hypocalcemia in dairy cows. The Vet J 2008;176(1):50 57.
130. Horst RL, Littledike ET, Patridge TA. Plasma concentrations of 1,25 dihydroxivitamin D, 1,24R,25 trihydroxivitamin D3 and 1,25,26 trihydroxivitamin D3 after administration to dairy cows. J Dairy Sci 1983;66:1455 1460.
133. Lean IJ, DeGaris PJ, McNeil DM, Block E. Hypocalcemia in dairy cows: meta analysis and dietary cation anion difference theory revisited. J Dairy Sci 2006;89(2):669 684.
141. Sampson JD, Spain JN, Jones C, Castensen L. Effects of calcium chloride and calcium sulfate in an oral bolus given as a supplement to postpartum dairy cows. Vet Ther 2009;10:131 139. 142. Wang L, Erlandsen H, Haavik J, Knappskog PM, Stevens RC. Three dimensional structure of human tryptophan hydroxylase and its implications for the biosynthesis of the neurotransmitters serotonin and melatonin. Biochem 2002;41:12569 12574. 143. Ormsbee HS, Fondacaro JD. Action of serotonin on the gastrointestinal tract. Proc Exp Biol Med 1985;178:333 338. 144. Berger M, Gray JA, Roth BL. The expanded biology of serotonin. Annu Rev Med 2009;60:1514 1529. 145. Wysolmerski JJ. Parathyroid hormone related protein: an uptake. J Clin Endocrinol Metab 2012;97:2947 2952. 146. Wyler SC, Lord CC, Lee S, Elmqist JK. Liu C. Serotonergic control of metabolic homeostasis. Front Cell Neurosci 2017;11:277.
147. Hernandez LL, Limesand SW, Collier JL, Horseman ND, Collier RJ. The bovine mammary gland expressed multiple functional isoforms of serotonin receptors. J Endocrinol 2009;203:123 131. 148. Hernandez LL, Gregerson KA, Horseman ND. Mammary gland serotonin regulates parathyroid hormone related protein and other bone related signals. Am J Physiol Endocrinol Metab 2012;302:E1009 1015.
138. Horst RL. Regulation of calcium and phosphorus homeostasis in the dairy cow. J Dairy Sci 1986;69(2):604 616.
139. Braithwaite GD. Calcium and phosphorus metabolism in ruminants with special reference to parturient paresis. J Dairy Res 1976;43(3):501 520. 140. Wasserman RH, Fullmer CS. Vitamin D and intestinal calcium transport: facts, speculations and hypotheses. The Journal of Nutrition 1995;125(suppl 7):1971S 1979S.
Rev Mex Cienc Pecu 2022;13(4):1025 1054 1049
149. Matsuda M, Imaoka T, Vomachka AJ, Gudelsky GA, Hou Z, Mistry M, Bailey JP, Nieport KM, Walter DJ, Bader M, Horseman ND. Serotonin regulated mammary gland development via an autocrine paracrine loop. Dev Cell 2004;6:193 203.
150. Weaver SR, Prichard AP, Endres EL, Newhouse SA, Peters PL, Crump PM, Akins MS, Crenshau TD, Bruckmaier RM, Hernandez Castelam LL. Elevates of circulating serotonin improves calcium dynamics in the prepartum dairy cows. J Endocrinol 2016;230:105 123.
156. Laporta J, Keil KP, Vezina CM, Hernandez LL. Peripheral serotonin regulates maternal calcium trafficking in mammary epithelial cells during lactation in mice. PloS One 2014a 9:E110190.
158. Laporta J, Gross JJ, Creshaw TD, Bruckmaier RM, Hernandez LL. Short communication: Timing of first milking affects serotonin concentrations. J Dairy Sci 2014;97:2944 2948. 159. Laporta J, More SAE, Weaver SR, Cronick CM, Olsen M, Pichard AP, et al. Increasing serotonin (5 HT) alters calcium and energy metabolism in late lactation dairy cows. J Endocrinol 2015;226:43 55. 160. VanHoulten JN, Dann P, McGeoch G, Browen EM. Calcium sensing receptor regulates mammary gland parathyroid hormone related protein production and calcium transport. J Clin Invest 2004;113:598 608. 161. VanHoulten JN. Calcium sensing by the mammary gland. J Mammary Gland Biol Neoplasia 2005;10:129-139.
162. Wysolmerski JJ. Interactions between breast, bone, and brain regulate mineral and skeletal metabolism during lactation. Ann NY Acad Sci 2010;1192:161 169.
151. Weaver SR, Jury NJ, Gregerson KA, Horseman ND, Hernandez L. Characterization of mammary specific disruptions for Tph1 and Lrp5 during murine lactation. Scientific Reports 2017;7:151 155.
Rev Mex Cienc Pecu 2022;13(4):1025 1054 1050
154. Laporta J, Peters TL, Weaver SR, Merriman KE, Hernandez LL. Feeding 5 hydorxi l tryptophan during transition from pregnancyto lactation increases calcium mobilization from the bone in rats. Domest Anim Endocrinol 2013;44:176 184
152. Hernández-Castellano LE, Hernandez LL, Sauerwein H, Bruckmaier RM. Endocrine and metabolic changes in transition dairy cows are affected by prepartum infusion of a serotonin precursor. J Dairy Sci 2017;100(6):5050 5057.
155. Laporta J, Moore SAE, Peters NW, Peters TL, Hernandez LL. Short communication: circulating serotonin (5 HT) concentrations on day 1 of lactation as a potential predictor of transition related disorders. J Dairy Sci 2013;96:5146 5150.
157. Laporta J, Keil KP, Weaver SR, Cronick CM, Prichard AP, Crenshaw TD, et al Serotonin regulates calcium homeostasis in lactation by epigenetic activation of hedgehog signaling. Mol Endocrinol 2014;11:1866-1874.
153. Hernández Castellano LE, Hernandez LL, Weaver S, Bruckmaier RM. Increased serum serotonin improves parturient calcium homeostasis in dairy cows. J Dairy Sci 2017;100:1580 1587.
171. Suárez Trujillo A, Argüello A, Rivero MA, Capote J, Castro N. Differences in distribution of serotonin receptor subtypes in the mammary gland of sheep, goats, and cows during lactation and involution. J Dairy Sci 2019;102(3):2703 2707.
172. More SA, Laporta J, Crenshaw TD, Hernandez LL. Plasma of circulating serotonin and related metabolites in multiparous dairy cows in the peripartum period. J Dairy Sci 2015;98:3754 3765.
163. Rakoupoulos M, Vargas SJ, Guillespie MT, Ho PW, Diefenbach Jagger H, Leaver DD, et al. Production of parathyroid hormone related protein by the rat mammary gland in pregnancy and lactation. Am J Physiol 1992;263:E1077 E1085. 164. Ratcliffe WA, Thompson GE, Care AD, Peaker M. Production of parathyroid hormone related protein by the mammary gland of the goat. J Endocrinol 1992;133:87 93.
165. Brown EM, Gamba G, Riccardi D, Lombardi M, Butters R, Kifor O, Sun A, Hediger MA, Litton J, Hebert SC. Cloning and characterization of an extracellular Ca(2+) sensing receptor form bovine parathyroid. Nature 1993;366:575 580.
170. Ardeshirpour L, Dann P, Polland M, Wysolmerski J, VanHulten J. The calcium sensing receptor regulates PTHrP production and calcium transport in the lactating mammary gland. Bone 2006;38:787 793.
Rev Mex Cienc Pecu 2022;13(4):1025 1054 1051
169. Brennan SC, Thiem U, Roth S, Agarwal A, Fetahu ISh, Tennakon S, et al. Calcium sensing receptor signaling in physiology and cancer. Biochem Biophys Acta 2013;1833:1732 1744.
166. Hoffer AM, Brown EM. Extracellular calcium sensing and signaling. Nat Rev Mol Cell Biol 2003;4:530 538. 167. Brown EM, Conigrave AD. Regulation of cellular signal transduction pathway by extracellular calcium sensing receptor. Curr Pharm Biol 2009;10:270 281. 168. Quinn SJ, Kifor O, Kifor I, Butters RR Jr. Role of the cytoskeleton in extracellular calcium regulated PTH release. Biochem Biophys Res Comm 2007;354:8 13.
173. Corbellini CN. Etiopatogenia e controle da hipocalcemia e hipomagnesemia em vacas leiteiras. Seminário internacional sobre deficiências minerais em ruminantes, 1998;28.
174. Beede DK, Wang C, Donovan GA, Archbald LF, Sanchez WK. Dietary cation anion difference (electrolyte balance) in late pregnancy. In: Florida Dairy Production Conference Proc 1991:1 6.
176. Albornoz L, Albornoz JP, Cruz JC, Fidalgo LE, Espino L, Morales, et al. Estudio comparativo de los niveles de calcio, fósforo y magnesio durante el periparto en vacas lecheras en diferentes sistemas de producción en Uruguay y España. Veterinaria (Montevideo), 2017;53(205):1 11.
177. Wittwer F, Heuer G, Contreras PA, Böhmwald TM. Valores bioquímicos clínicos sanguíneos de vacas cursando con decúbito en el sur de Chile. Arch Med Vet 1993;15:83 88. 178. WagemannC, Wittwer F,Chihuailaf R,NoroM. Estudio retrospectivodela prevalencia de desbalances minerales en grupos de vacas lecheras en el sur de Chile: a retrospective study. Arch Med Vet 2014;46(3):363 373. 179. Sánchez JM, Saborío Montero A. Hipocalcemia e hipomagnesemia en un hato de vacas Holstein, Jersey y Guernsey en pastoreo. Agronom Costarric 2014;38(2):55 65. 180. Ceballos Márquez A, Villa NA, Betancourth TE, Roncancio DV. Determinación de la concentración de calcio, fósforo y magnesio en el periparto de vacas lecheras en Manizales, Colombia. Rev Colomb Cienc Pec 2004;17(2):125 133. 181. Sánchez JM, Saborío Montero A. Prevalencia de hipocalcemia en cuatro hatos Jersey en pastoreo en Costa Rica. Agronomía Costarricense 2014;38(2):33-41 182. Reinhardt TA, LippolisJD,McCluskeyBJ,GoffJP,Horst RL. Prevalenceofsubclinical hypocalcemia in dairy herds. The Vet J 2011;188(1):122 124. 183. Reyes C, Mellado M. Ocurrencia de desórdenes derivados del parto y mastitis en vacas Holstein, en función del número de partos y meses del año. Vet Méx 1994;25(2):133 135.
Rev Mex Cienc Pecu 2022;13(4):1025 1054 1052
175. Hernández EGS, Bouda J, Cecilio AA, Doubek J, Forero FHV. Efecto de la aplicación de prostaglandina F2α en las primeras horas posparto sobre las concentraciones séricas de calcio en vacas lecheras. Vet Méx 2014;1(2):1 13.
Rev Mex Cienc Pecu 2022;13(4):1025 1054 1053
Country Treatment No. animalsof (mg/dl)Ca hypocalcemiaSubclinical hypocalcemiaClinical FMR1 (%) (%)cowsFallen Ref2 Argentina Control 240 7.11 9.4 12.5 173 Treatment3 280 9.32 6.0 0.6 StatesUnited Americaof Control4 3.8 82 % 174 Treatment5 4.3 30 % Mexico Control 10 80 % (8/10) 0 % (0/10) 175 Treatment 10 40 % (4/10) 0 % (0/10)
System: Spain Uruguayand Intensive 256 10.96 + 0.06 176 Silvopastoral 354 9.35 + 0.09 Chile 76 2.0 mmol/L2.6 51 % 26 177 Prepartum: 178 1986 20026 471 2.37 + 0.14 2003 2011 270 2.29 + 0.18 1986Postpartum:2002 1041 2.35 + 0.14 2003 2011 766 2.27 + 0.12 Costa Rica HolsteinBreed: 49 7.85 27 (55 %) 2 (4 %) 179 Jersey 62 7.49 31 (50 %) 8 (13 %) Guernsey 41 8.06 18 (44 %) 0 (0 %) Colombia production:Dairy Stage: 180 Low Prepartum 2.14 + 0.10 Postpartum 2.39 + 0.10 High Prepartum 2.42 + 0.11 Postpartum 2.40 + 0.12 1FMR= Fetal membrane retention (%). 2Ref= Bibliographic references. 3Treatment: mixture of mineral salts (150g Cl2Ca, 150g NHSO4, 29g MgO2). 4Control= Diet with +50 meq/kg; 5Diet with 250meq/kg. 6Periods (years).
Table 1: Blood levels of calcium (Ca) in dairy cows exposed to different treatments and conditions of the production system
Rev Mex Cienc Pecu 2022;13(4):1025 1054 1054
Table 2: Comparison of incidence of cases of subclinical hypocalcemia and clinical hypocalcemia in dairy herds in different countries. Country Breed No. (n=)animalsof (mg/dcalciumlevelsPlasmaofL) (%)hypocalcemiaSubclinical (%)hypocalcemiaClinical Ref.1 Costa Rica Holstein 49 7.85 27 (55) 2 (4) 180 (Grazing) Jersey 62 7.49 31 (50) 8 (13) Guernsey 41 8.06 18 (44) 0 (0) Costa Rica : No. animalsof No. calvingsof (%)hypocalcemiaSubclinical (%)hypocalcemiaClinical 181 (Grazing) Jersey 454 1 25 1 447 2 41 4 291 3 49 6 166 4 51 10 72 5 54 8 32 6 42 13 United States Holstein No. calvingsof (%)hypocalcemiaSubclinical (%)hypocalcemiaClinical 182 (Housed) 1 53 6 2 42 13 3 78 2 4 44 29 5 47 29 6 63 25 Risk indices Mexico Holstein No. calvingsof FMR2 Hypocalcemia 183 (Housed) 1 2 0.68 0.31 3 4 1.33 0.32 5 6 1.57 5.80 7 8 1.65 3.37 >9 1.12 2.14 1Ref= Bibliographic reference. 2FMR=fetal membrane retention.
b Universidad Popular de la Chontalpa. Departamento de Zootecnia. Cárdenas, Tabasco.
https://doi.org/10.22319/rmcp.v13i4.5217Thecnicalnote
Productive performance and nutritional value of Pennisetum purpureum cv. Cuba CT-115 grass at different regrowth ages Gloria Esperanza de Dios León a Jesús Alberto Ramos Juárez a* Francisco Izquierdo Reyes a Bertín Maurilio Joaquín-Torres a† Francisco Meléndez Nava b a Colegio de Postgraduados, Campus Tabasco. Periférico Carlos A. Molina. Km 3.5 carretera Cárdenas-Huimanguillo, 86500, H. Cárdenas, Tabasco, México.
1055
*Corresponding author: ramosj@colpos.mx Abstract: Grass species forage yield and nutritional value directly affect livestock production performance. Theyalso varyin response to regional climate and soil conditions. Forage yield and nutritional value in Pennisetum purpureum cv. Cuba CT 115 were evaluated at five regrowth ages (30, 45, 60, 75 and 90 d) in three seasons (dry, rainy and northwinds). A completely randomized block design with repeated measures was used, with four replicates per treatment. In all three seasons, maximum height was reached at 75 d: 127.1 cm in the dry season, 151.6 cm in the rainy season and 137.0 cm the northwind season. Forage yield was highest (27.0 t DM ha 1) at 90 d in the rainy season, with a growth rate of 300.2 kg DM ha 1 d 1, 7.3% crude protein and 37.0% in situ digestibility of dry matter. The leaf:stem ratio was highest at 30 d in all seasons, with a 1.65 average value. Crude protein content was highest in the northwind season at 30 and 45 d, with a 15.6 % average value. In all three seasons, digestibility was highest at 30 (mean= 49.3 %), 45 (51.8 %) and 60 d (48.2 %). Based on forage yield, use of P purpureum cv. Cuba CT 115 grass for open grazing is recommended
To obtain maximum forage yield each forage species requires specific seasonal management(9). It is therefore important to understand a forage species’ productive behavior and optimal harvest time since these parameters directly affect forage yield and pasture persistence(10) No data has yet been published on the productive behavior of P. purpureum cv. Cuba CT 115 under the climatic and soil conditions of the state of Tabasco, Mexico. The present study objective was to evaluate the forage yield and nutritional value of P. purpureum cv. Cuba CT 115 at different regrowth ages during the dry, rainy and northwind seasons in Cambisol soil in the Chontalpa region of Tabasco.
Cutting frequency also influences forage yield(7). Seasonal and annual forage growth and yield are a direct function of weather conditions, soil fertility and management practices(8) .
Rev Mex Cienc Pecu 2022;13(4):1055 1066 1056
In the humid tropics of Mexico, forages are the main feed source for cattle. Forage availability and its nutritional value varies between seasons. Production is highest during the rainy season and declines during the northwind and dry seasons(1). Meat and milk production in grazing cattle respond directly to forage production, with decreased yields as forage production drops. Consequently, there is an ongoing search for forage species that meet animal nutritional requirements while maintaining constant, year-round production(2). The grass Pennisetum purpureum cv. Cuba CT-115 is part of this search. Created from a clone of King grass generated through tissue culture, this cultivar was originally introduced in Cuba in the 1990s. Its short internodes and low height make apt for direct grazing. In addition, beginning at four to six months of age it has high biomass production (15 t MS 1 ha) and higher nutritional value than the Cameroon, Dwarf and Taiwan cultivars of King grass(2,3)
for cutting at 90 days’ regrowth and based on its nutritional quality is recommended for grazing at 60 days’ regrowth, both during the rainy season.
.
Understanding a forage species’ growth and production performance, and consequent forage availability, in a specific region is vital to designing management strategies that maximize animal production(4). Seasonal variations in growth rate, leaf biomass, leaf area index and plant height are used as criteria for guiding optimal and sustainable pasture management(5,6) .
Key words: Pennisetum purpureum, Forage yield, Growth rate, Quality. Received: 14/01/2019 Accepted: 30/08/2021
The experiment was carried out under seasonal conditions from April 2011 to April 2012, at the Experimental Field of the Colegio de Postgraduados, in the state of Tabasco, Mexico, (17°59'15.6" N, 93°35'06.9" W; 12 m asl). Regional climate is Am, warm humid, with summer rains, 2,251 mm average annual rainfall and 26 °C average annual temperature(11) . Rainfall during the experimental period was 2,576 mm, with 6. 9% falling in the dry season, 70.3 % in the rainy season and 22.8 % in the northwind season. The highest rainfall (723 mm) during the experimental period was recorded in October. Average temperature during the experimental period was 24.4 °C, with seasonal averages of 25.6 °C in the dry season, 25.7 °C in the rainy season and 21.8 °C in the northwind season. Maximum temperature during the experimental period was 35.3 °C in April and the minimum was 16.0 °C in December (Figure 1). Soil in the experimental field is Cambisol, with a clay loam texture, pH 5.5, 1.9 % organic matter (OM), 0.14 % nitrogen (N) and 21.4 mg kg 1 phosphorous (P).
Figure 1: Average monthly temperature and rainfall during experimental period at Experimental Field at Cárdenas, Tabasco
The P. purpureum cv. Cuba CT 115 pasture used in the present study was planted in 2009, in furrows spaced at 0.80 m and 1 m between plants. Since then, it has been grazed with cattle. A uniform manual cut was done on April 1, 2011, at an approximate height of 10 cm above ground surface. After this initial cut the field was fertilized with 100 kgnitrogen (urea) in three 33.3 kg applications: one in April, July and October. Weed control was done manually at the beginning of the experimental period. Experimental design was a completely random block design involving five regrowth ages (30, 45, 60, 75 and 90 d) and three seasons (dry, March May; rainy, June October; and northwind, November February). Fourreplicates were doneofeach treatment (e.g., regrowth age), using season as a repeated measurement(12). Samples were collected after reaching each successive regrowth age. Each of the twenty experimental plots consisted of four rows (4 m
Rev Mex Cienc Pecu 2022;13(4):1055 1066 1057

Rev Mex Cienc Pecu 2022;13(4):1055 1066 1058 long, 0.80 m apart). The plots measured 4 x 3.2 m, with a total area of 12.8 m2, and an effective area of 4.8 m2 consisting of the central furrows. Measurements weretaken ofplantheight andtheseusedto calculateforage yield, and growth rate (GR). The leaf:stem ratio was quantified using plant samples. Analyses were done of dry matter (DM), crude protein (CP), in vitro digestibility of dry matter (IDDM), neutral detergent fiber (NDF) and acid detergent fiber (ADF). Plant height, from soil surface to the top oftheflagleaf(13),was measuredimmediatelypriorto cutting.Forage yield was estimated by harvesting plants inside the 4.8 m2 effective area from ground level. A representative 3 kg subsample was taken from the harvested forage, washed and dried at 65 °C for 72 h in a forced air oven. Calculation of drymatter yield (DM) was done using the formula: DM = FM x % DM/100, where FM= fresh matter(13). The leaf:stem ratio was calculated using a 2 kg subsample of the harvested forage. Its leaf and stem components were separated, weighed and dried at the temperature and time indicated above. Growth rate (GR) was calculated with the formula: GR= HF/t, where GR= growth rate (kg DM ha 1d 1), HF= harvested forage (kg DM ha 1) and t= days elapsed between forage harvests(14). Both DM and CP content were measured following the applicable AOAC techniques(15). Established protocols were used to quantifyIDDMat24h(16),andNDFandADF(17).AllanalyseswererunattheAnimalScience Laboratory of the Colegio de Posgraduados, Tabasco. Results were evaluated with an analysis of variance (ANOVA) to identify statistical differences between the studied factors: treatments, seasons and the treatments x season interaction. A Tukey test (α=0.05) was applied for a multiple comparison of means for treatments, seasons and the treatments x season interaction. Significant differences were analyzed following the general guide A factor (treatments) effects in each B factor (season) level(18). All analyses were run with the Proc Mixed procedure and Slice instruction in the SAS ver. 9.4 software(19) . The ANOVA identified differences (P<0.05) in the treatments x seasons interaction in all the evaluated variables. Plant height increased as regrowth age increased, the highest value (165.1 cm) being recorded at 90 d in the rainy season; this is 10.8 % higher than in the northwind season and 15.4 % higher than in the dry season. Forage yield also increased as regrowth age increased, the highest yield (27.0 t DM ha 1) also being observed at 90 d in the rainy season. In all three seasons, leaf:stem ratio values decreased as regrowth age increased, the highest value (1.79) being recorded at 30 d in the rainy season. Growth rate (GR) was highest (300.2 kg DM ha 1d 1) at 90 d in the rainy season. Average GR in the rainy season was 237.3 kg DM ha 1d 1, which is 105 % higher than in the northwind season and 148 % higher than in the dry season (Table 1).
Rev Mex Cienc Pecu 2022;13(4):1055 1066 1059
Table 1: Plant height, forage yield, leaf:stem ratio and growth rate in Pennisetum purpureum cv. Cuba CT 115 at different regrowth ages in three seasons Seasons Regrowth age (days) 30 45 60 75 90 Plant height (cm) Dry 59.4c 91.5b 96.0b 127.1a 147.2a Rainy 64.4c 103.8b 123.3b 151.6a 165.1a Northwind 45.0c 64.7c 98.5b 137.0a 138.9a Forage yield (t DM ha 1) Dry 4.0b 4.2b 3.9b 5.0b 10.7a Rainy 5.9c 6.6c 16.3b 20.3b 27.0a Northwind 3.1c 2.9b 7.8ab 11.8a 11.3a Leaf:stem ratio Dry 1.73a 1.69a 0.79b 0.82b 0.76b Rainy 1.79a 1.15b 0.88bc 0.72c 0.56c Northwind 1.43a 1.26ab 0.85bc 0.94bc 0.75c Growth rate (kg DM ha 1 d 1) Dry 134.8a 92.9a 65.4a 66.8a 119.3a Rainy 196.4bc 147.7c 272.0ab 270.9ab 300.2a Northwind 103.4ab 65.3b 129.2ab 156.9a 125.5ab abc Different letter superscripts in the same row indicate statistical difference (Tukey, P<0.05).
An increase in plant height at greater regrowth ages is normal behavior in upright growth grasses(20). The highest height was recorded in the rainy season and can be attributed to the higher rainfall (1,812 mm) and temperature (25.7 °C) values recorded in that season. In P.
In all three seasons, DM increased as regrowth age increased. The highest average values were recorded at 90 d: 23.7 % in the dry season, 19.4 % in the rainy season and 15.4 % in the northwind season. At all five regrowth ages, DM values were higher in the dry season, with a 19.7 % average. This average is 16.2 % higher than in the rainy season and 35 % higher than in the northwind season. Crude protein (CP) values decreased as regrowth age increased. The highest values were all recorded at 30 d: 15.7 % in the northwinds season, 12.5 % in the dry season and 10.4 % in the rainy season. At all five regrowth ages, average CP values were highest (13.1 %) in the northwind season. This value is 50.6 % higher than in the rainy season and 57.8 % higher than in the dry season. In all three seasons, IDDM remained unchanged up to 60 d regrowth and decreased after 75 d regrowth. The lowest NDF values were observed at 45 d in the dry and rainy seasons. No differences were found at any of the regrowth ages in the northwind season. In contrast, ADF content increased as regrowth age increased, the highest value (47.1 %) being observed at 90 d in the rainy season, which had 43.2 % average ADF.
Rev Mex Cienc Pecu 2022;13(4):1055 1066 1060 purpureum, both higher rainfall and temperature favor photosynthesis, and consequently growth. As expected, the lower precipitation (586 mm) and temperature (21.8 °C) of the dry season, in addition to its shorterdays, highwinds andgreatercloud cover,negatively affected plant photosynthesis capacity, slowing growth. Lower heights have been reported previously for P. purpureum cv. Cuba CT 115. For example, during the dry season heights of 31 cm at 75 d regrowth and 53 cm at 90 d have been reported(21). In a study evaluating P. purpureum clones, height was 68 cm at 60 d regrowth during the rainy season and 64 cm at 90 d in the dry season(22). In an evaluation of 12 P. purpureum species, heights during the rainy season were 56.4 cm at 60 d regrowth and 66.3 cm at 90 d. In the present study, regardless of season, averageplantheightat60dregrowthwas105.9cm.Sincemaximumheightfordirect grazing of this grass cultivar is 100 cm(23), 60 d regrowth is apparently the optimal time of use for this grass under the present study conditions Forage yield was highest (27.0 t DM ha 1) in the rainy season at 90 days’ regrowth; this yield was 139 % higher than in the northwind season and 151 % higher than in the dry season. Thereis apositivecorrelationbetweenplantageand yield,and rainfall and yield,as observed elsewhere(24). The forage yields observed in the present study are notably higher than previously reported for the studied cultivar. For example, one study found a 3.8 t DM ha 1 yield during the rainy seasons and a 1.2 t DM ha 1 yield during the dry season(22). In eight P. purpureum clones, yields of 2.5 t DM ha 1 were observed in the rainy season and 0.47 t DM ha 1 in the dry season(25). Such broad discrepancies in results may result from variations in climate conditions, crop management practices and soil fertility. Forage yield distribution in the present study was 5.6 t DM ha 1 in the dry season, 7.4 t DM ha 1 in the northwinds season and 15.2 t DM ha 1 in the rainy season. The lower yield observed during the dry season can beattributedtothesubstantiallylowerrainfall (178mm)duringthisseason, whichnegatively affectsthebiochemical processofplantphotosynthesis(24).Inthenorthwind season,thelower yield is more probably due to its lower temperatures rather than the relatively lower Inprecipitation.allthreeseasons
the leaf:stem ratio was highest at 30 d regrowth, which can be attributed to the higher number of leaves present at early ages in this grass species. This parameter decreased from 1.65 at 30 d to 0.69 at 90 d, analogous to the decrease from 1.33 at 33 d to 0.77 at 90 d reported elsewhere for P. purpureum(26)
The high GR observed in the present study during the rainy season can be attributed to the higher rainfall and temperatures (1,812 mm and 25.7 °C, respectively) occurring during this season. These favor plant metabolic activity, increasing the amount of photosynthates and, consequently, DM production. In contrast, the lack of rainfall in the dry season clearly limits plant growth. In all three seasons GR increased at 60, 75 and 90 d regrowth, indicating an increase in DM yield with age. The same response has been reported previously in P. purpureum cv. Cuba CT 115(27,28), as well as in P. purpureum cv. King(29) .
Rev Mex Cienc Pecu 2022;13(4):1055 1066 1061
The above growth response also accounts for the greater fiber accumulation with age observed in the present results, which is normal in tropical grasses(26) . It occurs because the proportion of cell wall in a plant, directly associated with DM content, increases with age as theleaf:stemratio tips in favorofstems, morevascularbundlesappear,cell content decreases and water is lost(28,29). In the present results, DM content was highest (23.7 %) in the dry season, perhaps due to water stress caused by greater leaf maturation and senescence, and consequent DM accumulation. Compared to stems, leaves have a higher senescence rate because their surface is more sensitive, causing them to lose more water(29)
The lower CP content with greater regrowth age observed in the present results can be attributed to the lower leaf:stem ratio with plant age. The higher leaf:stem ratio at younger ages results in higher CP content since protein occurs in greater quantities in leaves. In addition, synthesis of structural components such as cellulose, hemicellulose and lignin increases as plants mature, lowering forage quality in grasses. The highest CP content in the present results were lower than reported elsewhere for this cultivar during the rainy season (14.5 % at 28 d, 12.0 % at 56 d and 11.0 % 84 d regrowth)(28). However, CP contents at all the regrowth times and in all three seasons in the present study were above the 7 % minimum CP level required for proper rumen functioning(30) . The lower IDDM values with greater regrowth age observed in the present study were due to the higher leaf:stem ratio at 30, 40 and 60 days’ regrowth than at 75 and 90 days’ regrowth (Table 2). Older forage plants have higher DM percentages and more NDF and ADF content because, as they mature, the proportion of stems increases and that of leaves decreases (i.e., theleaf:stemratiodrops),increasingtheamountofstructuralcarbohydratesandlignin,which directlyinfluenceforage digestibilityanduseefficiency(31).Theaverage IDDMin thepresent results (46.2 %) is considered low, although it is onlyslightly lower than the 50.1 % reported for this cultivar at 56 days’ regrowth and 24 h incubation(32). The average rainy season NDF (75.5 %) and ADF (43.2 %) values in the present results are similar to the 72.2 % NDF and 44.1 % ADF reported for another Pennisetum species(33). In the present study, both NDF and ADF contents were highest in the rainy season at 60, 75 and 90 days’ regrowth. This is probably due to the higher rainfall and temperature values in this season, which would generate more growth, more stem production and, consequently, more DM, cellulose, hemicellulose and lignin accumulation(17). The present results coincide with the literature, which indicates that tropical grasses grow and mature quickly, causing changes in their chemical composition and decreased forage nutritional quality.
Rev Mex Cienc Pecu 2022;13(4):1055 1066 1062 Table 2: Nutritional value of Pennisetum purpureum cv Cuba CT 115, at different age of regrowth in three seasons
abc Different letter superscripts in the same row indicate statistical difference (Tukey, P<0.05).
Forage yield of the grass Pennisetum purpureum cv. Cuba CT 115 studied here increased with regrowth age, providing a yield distribution of 53.9 % in the rainy season, 26.2 % in the northwind season and 19.9 % in the dry season. Total annual production under the experimental conditions was 28.2 t DM ha 1. Forage nutritional value in terms of CP, IDDM, and NDF and ADF content decreased with regrowth age. From a forage yield and quality perspective, Pennisetum purpureum cv. Cuba CT-115 grass is best at 60 days’ regrowth for direct grazing and 90 days’ for cutting. Seasons Regrowth age (days) 30 45 60 75 90 Dry matter (%) Dry 17.4b 18.4b 19.3b 19.6b 23.7a Rainy 14.4b 14.7b 16.2ab 17.9ab 19.4a Northwind 10.6b 11.2ab 12.2ab 14.4ab 15.4a Crude protein (%) Dry 12.5a 7.8b 7.1b 7.0b 7.4b Rainy 10.4a 10.9a 7.9b 7.0b 7.3b Northwind 15.7a 15.5a 13.0b 11.2bc 10.3c In situ degradation of dry matter (%) Dry 48.1ab 54.3a 49.4ab 46.7b 42.9b Rainy 51.3a 49.8a 45.1ab 40.2b 37.0c Northwind 48.6a 51.3a 50.1a 39.0b 39.3b Neutral detergent fiber (%) Dry 60.7c 62.9bc 67.4ab 70.5a 64.4bc Rainy 70.1b 70.0b 77.0a 79.7a 80.6a Northwind 65.4a 68.0a 67.1a 70.8a 68.2a Acid detergent fiber (%) Dry 31.6c 33.6bc 39.3ab 34.3bc 43.6a Rainy 38.8b 40.3b 44.9ab 45.0ab 47.1a Northwind 33.8b 34.9ab 35.9ab 36.9ab 40.8a
Rev Mex Cienc Pecu 2022;13(4):1055 1066 1063
5. Da Silva SC, Hernández GA. Manejo del pastoreo en praderas tropicales. En: Velasco ZME et al, editores. Los Forrajes y su impacto en el trópico. 1ra. ed. Universidad Autónoma de Chiapas. Chiapas, México; 2010:63 95.
7. Herrera RS, Martínez RO, Cruz R, Tuero R, García M, Guisado I et al. Producción de biomasa con hierba elefante (Pennisetum purpureum) y caña de azúcar (Saccharum officinarum) para la ganadería tropical. II. Carbohidratos solubles y estructurales. Rev Cubana Cienc Agric 1995;29(2):245 252.
Literature cited:
6. Velasco ZME, Hernández GA, González HVA, Pérez PJ, Vaquera HH. Curvas estacionales de crecimiento del ballico perenne. Rev Fitotec Mex 2002;25(1):97-106.
4. Hernández GA, Hodgson JG, Matthew C. Effect of spring grazing management on perennial ryegrass and ryegrass white clover pastures. 1. Tissue turnover and herbage accumulation. N Z J Agric Res 1997;40(1):37 50.
1. Sosa REE, Cabrera TE, Pérez RD, Ortega RL. Producción estacional de materia seca de gramíneas y leguminosas forrajeras con cortes en el Estado de Quintana Roo. Téc Pecu Méx 2008;46(4):413 426.
8. McKenzie BA, Kemp PD, Moot DJ, Matthew C, Lucas RJ. Enviromental effects on plant growth and development. In: White J, Hodgson J editors. New Zealand pasture crop science. Oxford: University Press; 1999:29 44.
2. Araya MM, Boschini C. Producción de forraje y calidad nutricional de variedades de Pennisetum purpureum en la Meseta Central de Costa Rica. Agron Mesoamericana 2005;16(1):37 43.
9. Zaragoza EJA, Hernández GA, Pérez PJ, Herrera HJG, Osnaya GF, Martínez HP et al. Análisisdecrecimientoestacionaldeunapraderaasociadaalfalfa pasto ovillo.TécPecu Méx 2009;47(2):173 188.
3. Cruz R, Torres V, Herrera RS, Martínez RO. Cultivo de tejido y fitotecnia de las mutaciones de pastos tropicales. Pennisetum purpureum: otro ejemplo para la obtención de nuevos clones. Rev Cubana Cienc Agríc 1996;30(1):1 10.
19. SAS. SAS User’s Guide: Statistics(version9.4). CaryNC, USA: SAS Institute Inc.2013.
17. Van Soest PJ, Robertson JB, Lewis BA. Methods for dietary fiber, neutral detergent fiber and nonstarch polysaccharides in relation to animal nutrition. J Dairy Sci 1991;74(10):3583 3597.
10. Santana PAA, Pérez LA, Figueredo AME. Efectos del estado de madurez en el valor nutritivo ymomento óptimo decortedel forraje napier(Pennisetum purpureum Schum.) en época lluviosa. Rev Mex Cienc Pecu 2010;1(3):277 286.
12. Gumpertz ML, Brownie C. Repeated measures in randomized blocks and split experiments. Institute of Statistics Mimeograph. Series No. 2202. NCSU, NC, USA; 1991.
16. Orskov ER, Howell DeBFD, Mould F. The use of the nylon bag technique for the evaluation of feedstuffs. Trop Anim Prod 1980;5(3):195 213.
15. AOAC. Official Methods of Analysis. 20th Edition. Maryland, USA: Association of Official Analytical Chemists. 2016.
13. Toledo JM, Schulze Kraft R. Metodología para la evaluación agronómica de pastos tropicales. En: Toledo JM editor. Manual para la evaluación. Red Internacional de Evaluación de Pastos Tropicales (RIEPT). Centro Internacional de Agricultura Tropical (CIAT), Cali Colombia; 1982:91 110.
11. García E. Modificaciones al sistema de clasificación climática de Köppen. Quinta edición. Serie Libros No. 6. Anexo. Instituto de Geografía, Universidad Nacional Autónoma de México, México; 2004.
Rev Mex Cienc Pecu 2022;13(4):1055 1066 1064
18. Maxwell SE, Delaney HD. Designing experiments and analysing data: A model comparison perspective. Brooks/Cole Publishing Company, Pacific Grove, CA.USA;1990.
14. Garduño VS, Hernández GA, Herrera HJG, Martínez HPA, Joaquín TBM. Rendimiento y dinámica de crecimiento estacional de Ballico perenne, pastoreado con ovinos a diferentes frecuencias e intensidades. Téc Pecu Méx 2009;47(2):189 202.
27. Fortes D, Herrera RS, García M, Cruz AM, Romero A. Growth analysis of the Pennisetum purpureum cv. Cuba CT 115 in the biomas bank technology. Cuban J Agric Sci 2014;48(2):167 172.
23. Tarazona AM, Ceballos MC, Naranjo JF, Cuartas CA. Factores que afectan el comportamiento de consumo yselectividadde forrajes enrumiantes. RevColombCienc Pecu 2012;25(3):473 487.
21. Casanovas E, Figueredo Y, Soto R, Novoa R, Valera R. Efecto de la frecuencia de corte en el comportamiento fenológico y productivo de Pennisetum purpureum vc. Cuba CT 115 en el periodo poco lluvioso. Rev Cubana Cienc Agríc 2006;40(4):465 470.
22.HerreraRS,GarcíaM,CruzAM,RomeroA.Assessmetof Pennisetum purpureum clones obtained by in vitro tissue culture. Cuban J Agric Sci 2014;46(4):427 433.
24. Sanderson MA, Stair DW, Hussey MA. Physiological and morphological responses of perennial forages to stress. Adv Agron 1997;59:171 224.
26. LunaMR, Chacón ME,Ramírez RJ,Álvarez PG,Álvarez PP,PlúaPK et al. Rendimiento y calidad de dos especies del género Pennisetum en Ecuador. Rev Electrón Vet 2015;16(8):1-10.
28. Valenciaga D, Chongo B, Herrera RS, Torres V, Oramas A, Cairo JG et al. Efecto de la edad de rebrote en la composición química de Pennisetum purpureum cv. Cuba CT 115. Rev Cubana Cienc Agríc 2009;43(1):73 79.
30. Van Soest PJ. Nutritional ecology of the ruminant. Second ed. Ithaca NY, USA: Cornell University Press; 1994.
25. Herrera RS. Clones of Pennisetum purpureum for different ecosystems and productive purposes. Cuban J Agric Sci 2015;49(4):515 519.
20. Crespo G, Álvarez J. Comparison of biomass production of Penissetum purpureum clones N fertilized. Cuban J Agric Sci 2014;48(3):287 291.
29. Chacón HPA, Vargas RCF. Digestibilidad ycalidad del Pennisetum Purpureum cv. King grass a tres edades de rebrote. Agron Mesoamericana 2009;20(2):399 408.
Rev Mex Cienc Pecu 2022;13(4):1055 1066 1065
Rev Mex Cienc Pecu 2022;13(4):1055 1066 1066
33. Valles MB, Castillo GE, Bernal BH. Rendimiento y degradabilidad ruminal de materia seca y energía de diez pastos tropicales cosechados a cuatro edades. Rev Mex Cienc Pecu 2016;7(2):141 158.
32. Valenciaga D, Chongo B, Lao O. Caracterización del clon Pennisetum CUBA CT 115. Composición química y degradabilidad ruminal de la materia seca. Rev Cubana Cienc Agríc 2001;35(4):349 354.
31. Vieira RMA, Fernández AM. Importancia de los estudios cuantitativos asociados a la fibra para la nutrición y alimentación de los rumiantes. 43 Reunión de la Sociedad Brasilera de Zootecnia. Joao Pessoa, Brasil: Sociedad Brasileira de Zootecnia; 2006.
Bacterial evaluation of Zacazonapan artisanal cheese matured under non controlled conditions in two production periods
1067
Jair Jesús Sánchez Valdés a Vianey Colín Navarro a Felipe López-González a Francisca Avilés Nova b Octavio Alonso Castelán Ortega c Julieta Gertrudis Estrada Flores a* a Universidad Autónoma del Estado de México. Instituto de Ciencias Agropecuarias y Rurales. Campus UAEM El Cerrillo, El Cerrillo Piedras Blancas. 50295, Toluca, Estado de México, México. b Universidad Autónoma del Estado de México. Centro Universitario UAEM Temascaltepec. Temascaltepec, Estado de México, México. c Universidad Autónoma del Estado de México. Facultad de Medicina Veterinaria y Zootecnia. Campus UAEM El Cerrillo, Toluca, Estado de México, México. * Corresponding author: jgestradaf@uaemex.mx
Abstract:
Traditional Zacazonapan cheeses have unique organoleptic characteristics and are characterized by being linked to the territory of origin. In the maturation process, there are many interactive variables that are responsible for physical, chemical, biological and structural changes. In order to evaluate the bacteriological evolution of artisanal cheeses during their maturation under non controlled conditions in two production periods, samples of raw milk and cheese were collected at 0, 30, 60, 120 and 150 d of maturation. The
https://doi.org/10.22319/rmcp.v13i4.5959Technicalnote
Rev Mex Cienc Pecu 2022;13(4):1067 1078 1068
produced from a complex system that gives rise to unique organoleptic characteristics and are characterized by strong links with their territory of origin(1). In the process, there are several interactive variables that are responsible for physical, chemical, biological and structural changes. Their quality depends on environmental factors, and on interactions between inoculated microorganisms and curd substrates that result from variations in the quality of raw milk and processing conditions(2) .
presence of molds and yeasts (MaY), mesophilic aerobic bacteria (MAB), Staphylococcus spp. (Staph), total coliforms (TC), fecal coliforms (FC), Salmonella spp. (Salm) and Listeria spp. (List) was determined. The average microbial load was 9.68, 9.38, 8.55 and 8.10 log10 CFU/g of cheese for MaY, MAB, Staph and TC respectively, as well as 2.68 log10 MPN/g of cheese for FC. Salm was not detected but List was. The microbiological evolution of Zacazonapan matured cheese had counts that exceed the maximum levels of the Official Mexican Standard 243 SSA1 2010.
Zacazonapan cheese is handmade with raw milk from Creole cattle from the southern region of the State of Mexico in the rainy season (July November). In this season, the feeding of the cattle is based on grazing and the cheeses are consumed after four months of maturation at environmental temperature and relative humidity. This cheese has also been described as Zacazonapan aged cheese(5)
Knowing the evolution of the main microbial groups during the maturation of this cheese and the final microbiological quality can suggest modifications to the maturation process that improve the quality without losing any of its characteristics. Therefore, the objective of the study was to evaluate the bacteriological evolution of artisanal cheeses during their maturation under non controlled conditions in two production periods.
Key words: Environmental maturation, Aging, Microbiological evolution, Raw milk. Received: 08/03/2021 Accepted: Traditional07/04/2022cheesesare
Lactic microflora is of particular interest because the biochemical activities of these organisms are involved in cheese making and may play a role in the development of organoleptic characteristics during maturation(3); however, due to their process of preparation and use of raw milk, they can generate outbreaks of food poisoning(4) .
The work was carried out in seven cheese factories in the municipality of Zacazonapan (19° 07’ 27” N, 100° 02’ 57” W and 1,470 m asl). Its average annual temperature and precipitation is 23.0 °C and 1,041.8 mm respectively. The study was carried out at the end of the cheese production season (from November 2010 to April 2011), which was called a batch of “dry season cheese” due to the environmental conditions in which it is matured. In the middle of the following year’s production season (September 2011 to February 2012), the batch was called “rainy season cheese”. Before the cheese was made, a milk sample was taken from each production site according to the Official Mexican Standard (NOM, for its acronym in Spanish) 109 (handling and collection of samples)(6). The samples were placed in closed sterile containers and transported at 4 °C for their analysis in the microbiology laboratory the next day. Two pieces of fresh cheese weighing approximately 2.0 kg were acquired in both sampling seasons and taken to a cheese factory in the area, where they were left to mature for 150 d under normal conditions of temperature and relative humidity. Using a cork borer, two samples of 50.0 g were collected from each piece of cheese at 0, 30, 60, 120 and 150 d of maturation. Campeche wax was used to seal the holes in the place where the sample was taken. From each sample of cheese, the presence of molds and yeasts (MaY), mesophilic aerobic bacteria (MAB), Staphylococcus spp. (Staph), total coliforms (TC), fecal coliforms (FC), Salmonella spp. (Salm) and Listeria spp. (List) was determined. To determine MaY, 10 g of the central part of the cheese + 10 ml of milk from each sample obtained were homogenized in 90 ml of 0.1 % peptone water (in duplicate) and decimal dilutions were prepared from this first dilution, obtaining dilutions 10 2 to 10 7. Subsequently, they were incubated for 24 h at a temperature of 25 °C(7) . To determine MAB, Staph, TC, FC, Salm and List, 25 g from the central part of the cheese + 25 ml of milk from each sample were collected and homogenized in 225 ml of 0.1 % peptone water (in duplicate). Decimal dilutions up to 10 7 were made from this solution, then incubated for 24 h at a temperature of 35 °C(7) . According to NOMs, the presence of MaY was determined by plate counting with potato dextrose agar after incubation at 25 °C for 48 h(8). For MAB, tryptone yeast extract agar was used, incubating at 35 °C for 48 h(9). TCs were determined in plate by violet red bile agar after incubation at 35 °C for 24 h(10). The presence of FC was determined by the most probable number technique, using lauryl sulfate tryptose broth, after incubating at 35 °C for 24 h(11). The determination of Staph with Baird Parker agar and the addition of egg yolk tellurite, incubated at 37 °C for 48 h after growth(12). Analysis for Salm in Salmonella Shigella agar incubated for 48 h at 35 °C(13) and List incubated at 35 °C for 48 h in Oxford agar(14). The data obtained were normalized by log10, an experimental design of completely randomized blocks was used and analyzed with the command of the general linear model of
Rev Mex Cienc Pecu 2022;13(4):1067 1078 1069
Relative humidity, temperature and time are important factors during cheese maturation(16) .
Rev Mex Cienc Pecu 2022;13(4):1067 1078 1070
a) Dry season cheese b) Rainy season cheese
Figure 1: Precipitation and temperature during the environmental maturation of Zacazonapan cheese
The maturation temperatures observed in this work favored the development of microorganisms and rainfall affected the final texture of the cheeses; the absence of rains produced drier cheeses, which showed cracked crusts, and the presence of rains produced softer cheeses with wet crusts, which prevented the cheeses from bursting due to the production of gas. However, these cheeses had holes and putrefactive areas inside, a phenomenon known as late swelling(17) .
The maturation temperature of dry season cheeses starts at 24.8 °C in November and ends with 31.8 °C in April; rainfall is almost zero (<12 mm/mo), typical characteristics of the dry season (Figure 1a). In rainy season cheeses, the maturation temperature begins with 22.1 °C in September and ends with 22.7 °C in February, rainfall was 240 mm at the beginning of maturation and 36 mm at the end (Figure 1b).
minitab V.14(15). When significant differences were observed (P<0.05), the Tukey test was Theapplied.evolution of temperature and precipitation in the study region is shown in Figure 1.


Rev Mex Cienc Pecu 2022;13(4):1067 1078 1071
The counts made on the milk used for cheese making (Table 1) were 7.03, 7.02 and 4.9 (log10 CFU/ml of milk) for MaY, MAB and TC. The use of poor microbiological quality milk is a common practice during the production of artisanal raw milk cheeses and is attributed to poor milking practices. Similarly, the absence of a cold chain and poor transport conditions leads to the counts of MaY, MAB and TC(18)
MaY= molds and yeasts; MAB= mesophilic aerobic bacteria; Staph= Staphylococcus spp. TC= total coliforms; FC= fecal coliforms. 1 = log10 colony forming units / g of cheese or ml of milk. 2 = log10 most probable number / g of cheese. ac= different letters within a column indicate differences (P<0.05). SEM= standard error of the mean. ND: Not determined In both batches of cheese, it is observed that, in the first days of maturation, there is an increase in microbial counts (d 30), which decrease throughout the maturation process due to the biochemical and microbiological processes that occur inside the cheese, such as the reduction of water content, the concentration of solids, the increase in acidity and a reduction in pH caused by the action of lactic bacteria. This causes a microbial competition for nutrients(19) . The group of MaY (Table 1) had significant differences (P<0.05) between days of maturation. This is due to the physical retention of microorganisms in rennet and microbial multiplication during milk curdling and whey draining(18). The reduction of MaY from day
Table 1: Microbiological quality of milk and Zacazonapan cheese during maturation Milk / Cheese MaY 1 MAB 1 Staph 1 TC 1 FC 2 Milk 7.03 7.02 ND 4.9 ND Cheese maturation days 0 9.250b 9.499 a 9.090ab 9.468 a 3.040 a 30 9.632b 9.882 a 9.827a 9.854 a 3.040 a 60 9.628b 9.403 a 7.133b 7.276 b 3.040 a 120 9.908ab 8.858 b 8.438b 6.680 b 2.340 b 150 10.102a 8.900 b 7.797b 7.147 b 1.767 c Average 9.704 9.308 8.457 8.085 2.645 Cheese production season Dry 9.722 8.912 b 7.992 b 8.189 3.040 a Rainy 9.648 9.865 a 9.123 a 8.022 2.195 b Average 9.685 9.388 8.558 8.106 2.618 SEM 0.21 0.26 0.529 0.947 0.264
Rev Mex Cienc Pecu 2022;13(4):1067 1078 1072
60 is attributed to the fact that, as the maturation progresses, the center of the cheese becomes compressed, and the oxygen needed to microbial reproduction reduces(20) .
For example, the Tepeque aerated cheese had counts of 7.6 log10 CFU/g of cheese in the dry season and 7.7 log10 CFU/g of cheese in the rainy season; and when the Tepeque cheese was taken to maturity, it had 6.2 log10 CFU/g in the dry season and 6.4 log10 CFU/g in cheese matured in the rainy season(21)
NOM 243 SSA1, which indicates the sanitary provisions and specifications for milk and milk products(23), does not specify the determination of MAB as quality indicator microorganisms in cheeses, because this group includes lactic acid bacteria, which are desirable microorganisms in cheese maturation(24), which, due to their long term proteolytic and lipolytic activities, contribute to the development of flavor and aroma(18,20,22), providing the typical characteristics to the product of a region. In this study, MAB had significant differences (P<0.05) between days of maturation and between production periods. In this regard, the counts of the dry season cheese were 8.91 log10 CFU/g of cheese and that of the rainy season was 9.86 log10 CFU/g of cheese (Table 1). Microbiological counts increased in the first 30 d of maturation due to the presence of inherent lactic acid bacteria in the milk or rennet used to make the cheese, obtained from young calves from the region. The decrease in MAB counts from d 60 is attributed to the fact that the growth of these organisms during cheese maturation is controlled by some physicochemical factors such as water activity, salt concentration, pH, organic acids, temperature during maturation, oxidation reduction potential and presence of nitrates(25)
The population dynamics of MAB in this study are consistent with those of other cheeses. In artisanal pore cheese three days after being made, MAB were present with a concentration of 6.77 log10 CFU/g of cheese and after 12 d of being made, they increased to 7.44 log10 CFU/g of cheese(16). In the Tepeque aerated cheese, concentrations of 7.9 log10 CFU/g of cheese were reported in the dry season and 7.6 log10 CFU/g of cheese in the rainy season. In Tepeque cheese taken to maturity, the concentration in both the cheese produced in the dry season and in the rainy season was 6.1 log10 CFU/g of cheese(21). In the study
During the maturation of Kurdish cheese, fresh cheese starts with 5.6 log10 CFU/g of cheese, after 20 d it presents 5.95 log10 CFU/g of cheese, until reaching 9.28 log10 CFU/g of cheese at 40 d, then the load begins to decrease, reaching 9.06 log10 CFU/g of cheese on d 60(22). The same population dynamics were observed in the present study and are related to the depletion of lactose content due to the simultaneous use of lactic acid bacteria(18,20,22) .
The MaY counts observed in this study are consistent with those found in similar cheeses.
The group of Staph (Table 1) had differences (P<0.05) between days of maturation and between production periods. The average of the counts made to the dry season cheese was 7.99 log10 CFU/g of cheese and that of the rainy season was 9.12 log10 CFU/g of cheese.
carried out by Hernández et al(26) on the Zacazonapan aged cheese, the cheeses were matured at a temperature of 24 °C and at a relative humidity of 65 % and at 27 d of maturation, MAB were present at a concentration of 1.5 to 7.8 log10 CFU/g of cheese.
The presence of staphylococci and the appearance of enterotoxins in foods are important parameters in the evaluation of food safety(27) Staphylococcus aureus is often found in raw milk and in the environment of cheese plants (equipment and staff), is salt tolerant and can grow under a wide range of conditions; low acid production can allow staphylococci to grow and produce enterotoxins(16,27) . In artisanal pore cheese, it was found that S. aureus was present with an average concentration of 5.91 log10 CFU/g of cheese in three-day old cheese and 6.29 log10 CFU/g of cheese with 12 d of maturation(16). In Tepeque aerated cheese, the microbial load was 7.9 and 7.7 log10 CFU/g of cheese in cheese from the dry season and the rainy season, respectively(21). In Kurdish cheese, the concentration was 3.06 log10 CFU/g of cheese in fresh cheese and 1.12 log10 CFU/g of cheese at 40 d of maturation(22). Results similar to those found in this study indicate serious failures in the hygienic sanitary conditions of cheese factories(28) and, consequently, the consumption of this cheese can cause staphylococcal poisoning, representing a danger to the consumer(29) . Significant differences (P<0.05) were observed in the TC content between days of maturation, decreasing throughout the process. The average of both batches of cheese was 8.10 log10 CFU/g of cheese (Table 1). TCs are a good indicator of hygienic quality, their presence is undesirable because it causes structural defects in the cheese and are an indicator of fecal contamination and reflect lack of hygiene during the preparation or handling of the product and warn of the possible presence of other pathogens(30). During salting, there is a slow process of natural dehydration of cheeses, favoring the survival of these bacteria for longer(16)
Rev Mex Cienc Pecu 2022;13(4):1067 1078 1073
The bacterial load of TC in cheeses at day zero (Table 1) was similar to that reported in fresh cheeses(28,29). The minimum load observed in this study was 6.68 log10 CFU/g of cheese at 120 d, similar to matured Tepeque cheese(21). However, it exceeds the counts reported in aerated or controlled maturation cheeses, such as artisanal pore cheese(16) , Zacazonapan aged cheese(26) and Corrientes cheese(31), which makes clear the importance of controlling the maturation conditions of this type of cheese.
Rev Mex Cienc Pecu 2022;13(4):1067 1078 1074
The results of the analyses carried out for Salm and List during the maturation of the cheeses (Table 2) indicate that Salm was only detected in the cheeses of d 0 (fresh cheeses) and List was present throughout the maturation.
The presence of Salm in cheeses is related to the preparation of products with unpasteurized milk and it has been detected in fresh cheeses(29), in the first days of maturation(22,27,32). In cheeses with 7 d of maturation, Salm was not detected, and this is attributed to the accumulation of lactic acid and the decrease in pH (< 4.7)(27) .
The counts for FC (Table 1) showed significant differences (P<0.05) between production seasons, being higher in dry season cheeses (3.04 log10 MPN/g of cheese). The results of this study were lower than those found in Mexican tropical cream cheese made with unpasteurized milk from the region of Tonalá, Chiapas(24) and their presence in cheese indicates contamination by feces(32). The decrease in counts after 120 d of maturation in rainy season cheeses is due to the action of lactic acid bacteria(27)
The presence of List in cheeses (Table 2) suggests contamination when using milk contaminated by cows that suffer from subclinical mastitis(33). Bacteria of the genus List have been detected in equipment used in the manufacture of cheeses(34), in aerated and matured cheeses(21,28). Although the species was not determined, the risk to consumer health that List represents must be considered, since it can produce important alterations to the central nervous system and even death(34)
The results obtained in this research; the bacterial count of the studied groups exceeds what is allowed by NOM 243 SSA1(23). However, there is a worldwide trend of consuming artisanal products that are sought after for their taste and quality linked to the place of origin. Microbial diversity as well as interactions between populations are the main factors that contribute to the taste of traditional cheeses(16,20)
Table 2: Salmonella spp. and Listeria spp. during the maturation of Zacazonapan cheese Microbial group Batch Days of maturation 0 30 60 120 150 Salm Dry season P Rainy season P List Dry season P P P P P Rainy season P P P P P
Salm= Salmonella spp.; List= Listeria spp.; P= Present in 25 g of sample.
3. Licitra G, Carpino S. The microfloras and sensory profiles of selected protected designation of origin Italian cheeses. Microbiol Spectr 2014;2(1):1 12.
It is concluded that the maturation for 150 d of both batches of cheeses, as is traditionally done, is insufficient to inhibit the development of pathogenic microorganisms, although the rainy season cheese had a lower microbial load. The presence of bacteria of the genus List and Salm indicated a greater health risk, and it is not suitable for consumption. It is necessary to carry out actions throughout the cheese process, and it is suggested to implement good manufacturing practices for the production of cheese, and that a space of the cheese factory be adapted as a maturation chamber.
4. Soto VZ, Pérez LL, Estrada AD. Bacterias causantes de enfermedades transmitidas por alimentos: una mirada en Colombia. Salud Uninorte Barranq 2016;32(1):105 122.
1. Cardoso VM, Dias RS, Soares BM, Clementino LA, Araújo CP, Rosa CA. The influence of ripening period length and season on the microbiological parameters of a traditional Brazilian cheese. Braz J Microbiol 2013;44:743-749.
Acknowledgements and conflicts of interests Work funded by the projects FE016/2009 (COMECYT) and 3101/2011 (Autonomous University of the State of Mexico). The authors thank the National Council for Science and Technology (CONACYT, for its acronym in Spanish) for the grant to the first author in his postgraduate studies and the cheese producers of the municipality of Zacazonapan for the support provided for carrying out this research. The authors of this paper declare that there is no conflict of interest of any kind. Literature cited:
Rev Mex Cienc Pecu 2022;13(4):1067 1078 1075
5. Hernández MC, Hernández MA, Villegas de Gante AZ, Aguirre ME. El proceso socio técnico de producción de Queso Añejo de Zacazonapan, Estado de México. Rev Mex Cienc Pecu 2011;2:161 176.
6. Norma Oficial Mexicana NOM 109 SSA1 1994. Bienes y servicios. Procedimientos para la toma, manejo y transporte de muestras de alimentos para su análisis microbiológico. México: Diario Oficial de la Federación, 4 de noviembre de 1994.
2. Sicard M, Perrot N, Leclercq Perlat MN, Baudrit C, Corrieu G. Toward the integration of expert knowledge and instrumental data to control food processes: Application to Camembert type cheese ripening. J Dairy Sci 2011;94:1 13.
14. Norma Oficial Mexicana NOM 143 SSA1 1995. Bienes y servicios. Método de prueba microbiológico para alimentos. Determinación de Listeria monocytogenes. México: Diario Oficial de la Federación, 19 de noviembre de 1997.
17. Vázquez Fontes C, Sánchez Vera E, Castelán Ortega O, Espinoza Ortega A. Microbiological quality of artisan made Mexican Botanero cheese in the Central Highlands. J Food Saf 2010;30:40 50.
12. Norma Oficial Mexicana NOM 115 SSA1 1994. Bienes y servicios. Método para la determinación de Staphylococcus aureus en alimentos. México: Diario Oficial de la Federación, 20 de febrero de 1995.
Rev Mex Cienc Pecu 2022;13(4):1067 1078 1076
8. Norma Oficial Mexicana NOM 111 SSA1 1994. Bienes y servicios. Método para la cuenta de mohos y levaduras en alimentos. México: Diario Oficial de la Federación, 28 de abril de 1994.
13. Norma Oficial Mexicana NOM 114 SSA1 1994. Bienes y servicios. Método para la determinación de Salmonella en alimentos. México: Diario Oficial de la Federación, 28 de abril de 1994.
7. Norma Oficial Mexicana NOM 110 SSA1 1994. Bienes y servicios. Para la preparación y dilución de muestras de alimentos para su análisis microbiológico. México: Diario Oficial de la Federación, 28 de abril de 1994.
9. Norma Oficial Mexicana NOM-092-SSA1-1994. Bienes y servicios. Método para la cuenta de bacterias aerobias en placa. México: Diario Oficial de la Federación, 23 de marzo de 1994.
10. Norma Oficial Mexicana NOM 113 SSA1 1994. Bienes y servicios. Método para la cuenta de microorganismos coliformes totales en placa. México: Diario Oficial de la Federación, 28 de abril de 1994.
15. Minitab V.14. Statistical software. User´s guide II: Data analysis and quality tools, graphics, and Macros 2003; USA.
16. Alejo Martínez K, Ortiz Hernández M, Recino Metelín BR, González Cortés N, Jiménez Vera R. Tiempo de maduración y perfil microbiológico del queso de poro artesanal. Rev Iberoamericana Cienc 2015;2 (5):15 24.
11. Norma Oficial Mexicana NOM 112 SSA1 1994. Bienes y servicios. Determinación de bacterias coliformes fecales. Técnica del número más probable (NMP). México: Diario Oficial de la Federación, 10 de mayo de 1995.
22. Milani E, Shahidi F, Mortazavi SA, Reza Vakili SA, Ghoddusi HB. Microbiological, biochemical and rheological changes throughout ripening of Kurdish cheese. J Food Saf 2014;34:168 175.
28. Castro Castillo G, Martínez Castañeda FE, Martínez Campos AR, Espinoza Ortega A. Caracterización de la microbiota nativa del queso Oaxaca tradicional en tres fases de elaboración. Rev Soc Ven Microbiol 2013;33(2):105 109.
24. Romero-Castillo PA, Leyva-Ruelas G, Cruz-Castillo JG, Santos-Moreno A. Evaluación de la calidad sanitaria de queso crema tropical mexicano de la región de Tonalá, Chiapas. Rev Mex Ing Quim 2009;8:111 119. 25. Beresford TP, Fitzsimons NA, Brennan NL, Cogan TM. Recent advances in cheese microbiology. Int Dairy J 2001;11:259 274. 26. Hernández MC, Hernández MA, Aguirre ME, Villegas de Gante AZ. Physicochemical, microbiological, textural and sensory characterization of Mexican Añejo cheese. Int J Dairy Technol 2010;63(4):552 560. 27. Amran AM, Abbas AA. Microbiological changes and determination of some chemical characteristics for local Yemeni cheese. Jordan J Biol Sci 2011;4 (2):93 100.
Rev Mex Cienc Pecu 2022;13(4):1067 1078 1077
20. Marino M, Maifreni M, Rondinini G. Microbiological characterization of artisanal Montaisa cheese: analysis of its indigenous lactic acid bacteria. FEMS Microbiol Letón 2003;229:133 140.
18. Volken De SCF, Dalla RT, Zachia AA. Changes in the microbiological and physicochemical characteristics of Serrano cheese during manufacture and ripening. Braz J Microbiol 2003;34:260 266.
19. De Dea LJ, Bernini V, De Lorentiis A, Pecorari A, Neviani E, Gatti M. Parmigiano Reggiano cheese: evolution of cultivable and total lactic microflora and peptidase activities during manufacture and ripening. Dairy Sci Technol 2008;88:511 523.
21. Solís MAD, Martínez LR, Solorio SJ, Estrada FJG, Avilés NF, Gutiérrez IAT, Castelán OOA. Características del queso Tepeque de la tierra caliente de Michoacán: Un queso producido en un sistema silvopastoril intensivo. Trop Subtrop Agroecosystems 2013;16:201-214.
23. Norma Oficial Mexicana NOM 243 SSA1 2010. Productos y servicios. Leche, fórmula láctea, producto lácteo combinado y derivados lácteos. Disposiciones y especificaciones sanitarias. Métodos de prueba. México: Diario Oficial de la Federación, 27 de septiembre de 2010.
33. Meyer Broseta S, Diot A, Bastian S, Rivière J, Cerf O. Estimation of low bacteria concentration: Listeria monocytogenes in raw milk. Int J Food Microbiol 2003;80:1 15.
30. Sengul M, Ertugay MF. Microbiological and chemical properties of cheese Helva produced in Turkey. Int J Food Prop 2006;9:185 193. 31. Vasek OM, Mazza SM, Giori GS. Physicochemical and microbiological evaluation of corrientes artisanal cheese during ripening. Food Sci Technol 2013;33(1):151 160.
Rev Mex Cienc Pecu 2022;13(4):1067 1078 1078
34. Arguello P, Lucero O, Castillo G, Escobar S, Albuja A, Gallegos J, Carrascal A. Calidad microbiológica de los quesos artesanales elaborados en zonas rurales de Riobamba (Ecuador). Perspectiva 2015;16 (18):65 74.
32. Martins JM, Galinari E, Pimentel Filho NJ, Ribeiro JJI, Furtado MM, Ferreira CLLF. Determining the minimum ripening time of artisanal Minas cheese, a traditional Brazilian cheese. Braz J Microbiol 2015;46(1):219 230.
29. González Montiel L, Franco Fernández MJ. Perfil microbiológico del queso de aro consumido en la Cañada Oaxaqueña. Brazilian J Food Technol 2015;18(3):250 257.
Elizabeth Salinas Estrella a* María Guadalupe Ortega Hernández b Erika Flores Pérez b Natividad Montenegro Cristino b Jesús Francisco Preciado de la Torre a Mayra Elizeth Cobaxin Cárdenas a Sergio D Rodríguez a a Instituto Nacional de Investigaciones Forestales, Agrícolas y Pecuarias (INIFAP), Centro Nacional de Investigación Disciplinaria en Salud Animal e Inocuidad (CENID SAI), Carretera Cuernavaca Cuautla no. 8534, Col. Progreso, 62574, Jiutepec, Morelos, México. b Servicio Nacional de Sanidad, Inocuidad y Calidad Agroalimentaria (SENASICA), Jiutepec, Morelos, México. *Corresponding author: mvz.elisalinest@gmail.com, salinas.elizabeth@inifap.gob.mx
Antigen production and standardization of an in-house indirect ELISA for detection of antibodies against Anaplasma marginale
are important forthedetectionof specific antibodiesagainst infectious agents. Commercial indirect ELISA are costly and usually as effective as in house ELISAs. In the present work, it was prepared a batch of Anaplasma marginale crude antigen from infected blood, and tested it against official positive and negative serum controls and compared with an old batch of antigen. The new antigen batch showed an efficiency similar to the old batch. The sensitivity of the test was comparable between the new and old batches. Both, new and
1079 https://doi.org/10.22319/rmcp.v13i4.5976Technicalnote
Abstract Serologic:tests
Accepted: Anaplasmosis08/03/2022,causedby
the Gram negative bacterium Anaplasma marginale (Rickettsiales; Anaplasmataceae), is an infectious disease that affects cattle and wild ruminants(1). The disease has a high prevalence in tropical, subtropical and even temperate zones and causes jaundice, anemia, production losses of meat and milk, reproductive inefficiency, mortality and related therapeutic costs, as well as trade restrictions for the movement of positive reactors(2) Infection with A. marginale induces the production of antibodies that can be detected by laboratory tests(3,4,5) . Many serologic tests have been developed for the detection of specific anti A. marginale antibodies, including the card agglutination test(6) , complement fixation test(7) , indirect fluorescent antibody(8,9) and enzyme linked immunosorbent assay (ELISA)(4,5,10) . Serologic tests do not discern between infected and non infected animals but the presence of specific antibodiescanbeusedfortheeliminationofpositivereactors whenpurchasingorintroducing cattle within an anaplasmosis free herd or area. The efficiency of the test is of considerable relevance, and serologic data can also be valuable in evaluation of vaccine effectivity(4,11)
old antigen lots are being used at an excess. The new antigen lot is large enough to run thousands of tests at a more affordable price than commercial kits
TheTerrestrialManual,Chapter3.4.1oftheWorldOrganizationforAnimalHealth(OIE)(12) , recommends commercial ELISA kits for the detection of A. marginale antibodies. These include a competence ELISA (cELISA) based on a recombinant MSP5 protein(5,13,14) and a conventional indirect ELISA (iELISA) kit also based on rMSP5 (15). The Terrestrial Manual also recommends the use of in house iELISA and provides a protocol for preparation of the antigen and the assay(12) .
Received: 06/04/2021
.
Key words: Bovine anaplasmosis, Indirect ELISA, Serologic diagnostics.
Rev Mex Cienc Pecu 2022;13(4):1079 1094 1080
In house ELISA’s have been developed for serological diagnosis of many pathogens(16 20) At INIFAP, an in house iELISA kit was developed for the detection of antibodies against A. marginale in cattle serum. The assay is based on the use of initial bodies extracted from infected erythrocytes Although the production of this antigen requires an initial substantial investment, the quantity and quality and longevity of the antigen allows for the performance of thousands of tests over a long period This assay was standardized more than 20 yr ago(11) and the batch of antigen prepared then, is still in use. The procedure of A. marginale antigen
MEX 31 096 01 Anaplasma marginale Mexican strain Tizimín(11,26), was used as the source of the antigen. This strain is cryopreserved in liquid nitrogen as 50% packed cell volume in 10% PVP 40 at 17% infected erythrocytes. For monitoring, blood samples were drawn from the coccygeal vein using evacuated tubes with heparin as anticoagulant. Rectal temperature (RT), packed cell volume (PCV) estimated by the microhematocrit technique and percentage of infected erythrocytes (PIE, quantitated by observation of blood smears at the microscope) were recorded for analysis with each sample collection. Calf 1 was inoculated intramuscularly (IM) with 4 ml of just thawed Tizimín strain infected blood. Monitoring was carried three times a week until appearance of infected erythrocytes in Giemsa stained blood smears at which time, monitoring was performed daily. The contents of one CPD blood bag was drawn. Buffy coat and plasma were removed by centrifugation and aspiration (Hermle Labortechnik, Model: Z 400 K, Series: 50095021); sedimented cells were suspended at 50% in physiological saline (0.85% NaCl),and IMinoculatedtothesecondcalf.Thesameprocedurewasusedfortheinoculation of the third calf At PIE peak, blood from the third calf was drawn by puncture of the jugular vein in commercial CPD blood bags fitted with 16G needles, (450 ml + 10 % CPDA). Xylazine at an appropriate dose was applied as a sedative to avoid suffering and the animal was physically restrained using ropes.
Rev Mex Cienc Pecu 2022;13(4):1079 1094 1081 production was carried out again to ascertain the validity of the procedure and the test. The results in the present study are consistent for the serological diagnosis of anaplasmosis in experimental and field samples and at different antigen concentrations. Forthe present work it was produced an antigen lot following aprotocol originallydeveloped for the preparation of antigen for the card agglutination test (CAT Ag), and Complement fixation test and adapted for ELISA(9,21,22) The antigen was also tested for antigenicity, against control and field samples.
Black Aberdeen Angus calves from the Servicio Nacional de Sanidad, Inocuidad y Calidad Agroalimentaria (SENASICA) stock were used for replication of the microorganism At the beginning of the procedure all animals were negative at end point PCR for A marginale(23) , Babesia bovis and B. bigemina(24,25) as well for antibodies against all three pathogens. During the experimental period, animals were fed a balanced diet according to weight; water was provided ad libitum. Animals were maintained in isolation and handled under conditions that provided safety for both cattle and operators. Surgery, post-surgical treatment and care of cattle were performed according to the protocol approved by the Internal Committee for the Care and Use of Experimental Animals (CICUAE) of the CENID-SAI of INIFAP(27), based on the surgical technique described by Alexander(28) by certified veterinary personnel.
Rev Mex Cienc Pecu 2022;13(4):1079 1094 1082
The blood was filtered through sterile gauze and erythrocytes sedimented by centrifugation in 500 ml volumes at 2,500 rpm at 4°C for 20 min (Hermle Labortechnik, Z 400 K, Series: 50095021). The buffy coat and plasma were removed by aspiration. Erythrocytes (red blood cells or RBCs) were suspended at 50% in cold PBS pH 7.2 and washed by centrifugation a total of three times; in the last wash, the RBCs were suspended in PBS antibiotics (PBS Ab, penicillin 1,000 U/streptomycin 1 mg/ml). The erythrocyte suspension was disrupted in a microfluidizer (Microfluidics, Hc 8000, Series: 99100) at 7,400 PSI) The lysate was centrifuged at 10,000 xg (Hitachi, RPR 9 12 818 rotor) at 4 °C for 30 min; the supernatant was discarded and the sediment suspended with 30 ml of PBS Ab and homogenized by sonication (Omni Sonic Ruptor 400) for three cycles of 2 min at 50 % power in an ice bath with 1 min breaks to avoid overheating. The homogenate was processed in a high pressure homogenizerat1,200PSItoreleaseallthe initialbodiesthatremainedin thenon lysedRBCs and centrifuged at 16,300 xg, for 30 min at 4 °C Giemsa stained smears were made from the sediment of every step to monitor for white cell nuclei and RBC membranes. The Ag was adjusted to 4 % w/v in acetate buffer and homogenized by agitation with a magnetic stirrer for 30 min at room temperature. The protein in the Ag was quantified by the micro-Bradford (BioRad®) method using bovine serum albumin as the standard. The antigenicity of this new batch of A. marginale antigen (Ag 2018) was verified by comparing it with a batch in use (Ag 2012). Enough antigen of each lot was mixed with an equal volume of 0.1% SDS in H2O(29) and incubated for 30 min at room temperature (20 to 25 °C). The antigen SDS mixtures were diluted in carbonate bicarbonate buffer pH 9.6 to a final volume of 25 mL. Ag 2012 was routinely used at 1.07 µg/200 µL of protein/well. Both antigens were adjusted at the aforementioned concentration. For the purpose of this study, wellsinmicrotiterplatesreceived200µLvolumes perwellofreagentsandwashingsolutions at each step of the procedure. Plates received 1.07 µg of protein/well (1X concentration) and incubated overnight at 4 °C, plates were then washed three times with PBS pH 7.2 Tween 20 at 0.05 % (PBS T20) and blocked with 5% skim milk in PBS T20 pH 7.2 for 30 min. After three washes with PBS T20 control serum samples diluted 1:100 in PBS T20 were run either in duplicates or triplicates. The plates were incubated for 1 h at 37 °C, and washed three times with PBS T20 Rabbit anti bovine IgG alkaline phosphatase conjugate (Jackson ImmunoResearch Laboratories, Lot: 112108) diluted 1:10,000 in PBS T20 were placed in each well; plates were incubated for 60 min at 37 °C and washed as described; P nitrophenylphosphate 0.075% in Tris pH 9.5 buffer were added and allowed to incubate for 30 min at 37 °C The plates were read at 405 nm in a microplate absorbance reader (BioRad, iMark™) and the optical density (OD) values were recorded. Two wells containing all components, except for serum, were used as blanks. The mean absorbance of these blank wells was subtracted from the absorbance values of every other well in the plate. The mean and standard deviation of replicates and, positive and negative sera controls was also calculated.
Rev Mex Cienc Pecu 2022;13(4):1079 1094 1083
The new antigen was subjected to three assays to: a) verify its antigenicity in comparison to Ag 2012, against known control sera, b) define the limit of antigenicity and c) verify its sensitivity against field serum samples. To verify antigenicity, 12 positive and 10 negative control sera routinely used to carry out the iELISA and officially used in the Hemoparasite Laboratory of the National Center for Animal Health Verification Services (CENAPA), were ran in duplicates against each, Ag 2012 and Ag 2018 at the same protein concentration (at 1.07 µg/200 µL, 1X) The mean, standard deviation and error were calculated for each set of replicates to determine that the assay had no errors. To test for the antigenicity limit, four positive and four negative control sera were run in duplicate against each antigen at 2X (2.14 µg), 1X (1.07 µg), ½ X (0.535 µg) and ¼ X (0.268 µg) concentrations. The remainder of the assay was carried as described. To verify the antigenicity against field samples, twenty (20) unknown problem sera were tested against both antigen batches at 1X concentration; all samples were run in duplicates. The cutoff point (CP) was calculated as described.
Results are expressed as the OD value of the sample minus the value of the blank reading. The positivity index (PI) for each serum sample was calculated as the quotient of the mean absorbance divided by the CP value, where 1= positive; <1= negative. Results were subjected to analysis of variance (ANOVA) by applying the Student t test using Social Science Statistics available at https://www.socscistatistics.com/tests/anova/Default2.aspx
Using(https://www.medcalc.org/calc/diagnostic_test.php).theproceduredescribed,amaximal65.7PEIwas
reached in the last calf on d 7 with a26 %PCV. Fourteen 500 ml blood bags ofinfected blood were drawn from this last animal. Blood was processed and the antigen produced had a total yield of 144.26 mg of protein in a final volume of 210 ml, equivalent to 0.687 µg/µL of antigen. Ag 2012 which is routinely used at 1/200 dilution, was re quantified as it was used as reference; this batch had 0.494
Toµg/µL.verifyantigenicity, 12 positive and 10 negative control sera were run in duplicates against each, Ag 2012 and Ag 2018 at the same protein concentration (1.07 µg/well). The mean,
For the purposes of this report, the percentage that represents the value of the standard deviation (SD) from the mean of each pair of repetitions was used as error, in order to verify the performance of the operator. Whenever the error was 20, the result was discarded and the sample repeated. Means of field samples were subjected to χ2 analysis with the on-line tools VassarStats, (http://vassarstats.net), and Diagnostic test evaluation calculator
Rev Mex Cienc Pecu 2022;13(4):1079 1094 1084 standard deviation and error were calculated for each pair to determine that the assay had no errors. Analysis of variance and Student t test of mean values of each serum showed no significant differences (P≥0.5) with an F value of 0.99826 between positive control samples with either Comparisonantigen.ofnegative sera showed that the OD readings were slightly higher when tested against Ag 2012 (Figure 1); analysis of variance of negative OD means showed a significant difference (P>0.01) between the results for Ag 2018 vs Ag 2012 with an F value of From33.54294.thisfirst
comparison the calculated cut off point for the negative sera tested with Ag 2018 was 0.40, while for the same sera tested with the Ag 2012 it was 0.570. The mean positivityindex for all positive sera tested with Ag 2018 was 3.44, whereas for the same sera tested with Ag-2012 this was 2.73 (Figure 2).
Figure 1: OD values of control sera. Scatter distribution of 12 positive and 10 negative control sera tested against Ag-2012 and Ag-2018
All serum samples were diluted 1:100 and tested in duplicates. Antigens were used at 1.07 g / well.
0.0 0.2 0.4 0.6 0.8 1.0 1.2 1.4 1.6 1.8 2.0 0 2 4 6 8 10 12 14 CONTROL SERA DISTRIBUTION positives 2012 positives 2018 negatives 2012 negatives 2018
The mean PI value for all positive sera tested with Ag 2018 was 3.44 (dotted line); mean PI for the same sera tested with Ag 2012 was 2.73 (dashed line).
PI values for all positive sera (Figure 2) were calculated for their respective CP. The positivityindexes were2.69and 2.093with Ag 2018andAg 2012,respectively. Ifis divided the mean PI (2.69) for Ag 2018 by Ag 2012 PI (2.093), it gives a quotient of 1.28, this value indicates that Ag 2018 is 1.28 times better at discriminating positive sera than Ag 2012.
Figure 2: Positivity index (PI) scatter distribution. PI values 1= positive (red line); <1= negative
Determination of the antigenicity limit. The two antigens were tested at four protein concentrations against four positive and four negative control sera as described As observed, positive and negative sera showed similar distributions at decreasing concentrations against both Ag 2012 (upper panel) and Ag 2018 (lower panel, Figure 3) Analysis of variance within each antigen and between antigens was carried out taking the OD reading of each replica as an independent value. No significant differences were observed when comparing the results between antigens or by concentration against the positive sera; in the case of Ag 2018, when the values of the positive sera are taken, F test was not significant is observed, f = 0.56757 and a value of P= 0.639377, at P>0.05. Likewise, when the positive sera are tested against different Ag 2012 concentrations, no significant difference is observed either, f = 1.66871 and a value of P= 0.187871, which is not significant at P>0.05.
Rev Mex Cienc Pecu 2022;13(4):1079 1094 1085

Rev Mex Cienc Pecu 2022;13(4):1079 1094 1086 Figure 3: Antigenicity limit for AG 2012 and AG 2018
Four positive and four negative control sera were tested against (left to right) 0.25 X, 0.5 X, 1.0 X and 2.0 X antigen concentrations.
Upper panel shows the distribution of positive and negative control relation among the concentrations used for Ag 2012, while lower panel shows the respective for Ag 2018
Finally, in order to verify the efficiency of the antigens at discriminating field samples, 20 sera from field cases were tested against both antigens in parallel at 1.07 µg of protein per well. The sera were run in duplicates. Additionally, three negative and three positive control sera were run in the same plate. The cutoff point for each antigen was 0.446 and 0.354 for Ag-2012 and Ag-2018 respectively. 13/20 samples were positive and 7/20 negative against Ag 2012; in contrast to 12/20 positives and 8/20 negatives when tested against Ag 2018.
When applying ANOVA to the values of each positive sera for each concentration between antigens, there were significant differences. For example, when the results of the sera were compared at the two fold concentration (2.14 µg/well), a value of F= 18.56523 was obtained; the P value was 0.000342 which was significant for P>0.05.

Rev Mex Cienc Pecu 2022;13(4):1079 1094 1087
Additionally, two samples positive for Ag 2012 were negative for Ag 2018; on the other hand, one negative sample for Ag 2012 was positive for Ag 2018, thus, there was not 100 % coincidence between the two antigens (Table 1). However, when the results were analyzed by χ2 test, the Fisher exact test statistic value was 0.2049; thus, there was no significant difference at P>0.05 between the two antigens at discriminating positives from negatives. According to the diagnostic test evaluation calculator (Table 2), there was 100.00 % sensitivity, 87.5 % specificity, a positive predictive value of 92.31 % and a negative predictive value of 100.00% for the two tests (Table 2)
Table 1: Antigenicity verification against field samples. Both antigens were used at a protein of 1.07 µg/well Ag 2012 Ag 2018 Sera Mean PI Mean PI 1 0.514 1.15 0.365 1.03 2 0.449 1.01 0.386 1.09 3 0.466 1.05 0.386 1.09 4 1.123 2.52 1.167 3.30 5 0.350 0.79 0.269 0.76 6 0.397 0.89 0.310 0.87 7 0.491 1.10 0.356 1.00 8 0.464 1.04 0.328 0.93 9 0.967 2.17 0.937 2.65 10 0.462 1.04 0.335 0.95 11 0.353 0.79 0.279 0.79 12 0.509 1.14 0.435 1.23 13 0.424 0.95 0.376 1.06 14 0.368 0.83 0.316 0.89 15 0.414 0.93 0.319 0.90 16 0.466 1.04 0.431 1.22 17 0.999 2.24 0.973 2.75 18 0.691 1.55 0.583 1.65 19 0.497 1.12 13.0 0.444 1.26
Bovine anaplasmosis is an infectious disease that occurs mainly in tropical and subtropical regions, it is of global importance and, in Mexico, it is distributed throughout the national territory(30,31) causing considerable losses in cattle(2) . Serologic diagnosis of this disease is a useful tool for prophylaxis, treatment and control strategies at the individual and herd levels(4) . Several techniques have been adapted for the detection of antibodies against A. marginale but immunoassays are preferred because of their scalability, suitability for
Serum samples were diluted 1/100 and ran in duplicates. The test conditions were the same as those used for routine examination of unknown samples. Samples in yellow background are those with a positivity index ≥ 1. Table 2: MedCalc Diagnostic test evaluation. The 2 statistic is 7.2. The P value is 0.00729 Statistic Value(%) 95% CI Sensitivity 100.00 73.54 to 100.00 % Specificity 87.50 47.35 to 99.68 % Positive likelihood ratio 8 1.08 to 43.43 Negative likelihood ratio 0 1.28 to 50.04 Disease prevalence (*) 60.00 36.05 to 80.88 % Positive predictive value (*) 92.31 65.73 to 98.69 % Negative predictive value (*) 100.00 Accuracy (*) 95.00 75.13 to 99.87 % * This result is significant at P<0.01. The Yates corrected 2 statistic is 5. The P value is .025347. Not significant at P<0.01.
Rev Mex Cienc Pecu 2022;13(4):1079 1094 1088 20 0.370 0.83 0.306 0.86 Negative control 0.427 0.334 0.385 0.299 0.400 0.404 0.291 0.308 Positive control 1.114 1.051 1.125 1.023 1.132 1.124 1.123 1.066 Mean of negatives 0.404 0.308 SD 0.021 0.023 PC 0.446 0.354
automation, objectivity, and often higher sensitivity and specificity for the identification of asymptomatic bovines(3) . When an indirect ELISA test for bovine anaplasmosis diagnosis was developed and compared with the complement fixation test (CFT)(8,32), the iELISA showed several advantages over the CFT, such as objective interpretation and the ability to use hemoglobin tainted serum (not ideal but very common when working with field samples). Moreover, the iELISA is based on antibody antigen affinity and not antibody concentration. However, several adaptations to the technique have been made since. As the presence of both A. marginale and A. centrale is common in other countries the use of recombinant antigens in iELISA for the detection of antibodies against both agents have been incorporated(5) Absence of A. centrale in Mexico allows for the continued use of iELISA with crude antigen for the routine serological diagnosis of A. marginale. In addition, reports of a positive rate for an ELISA based on whole-bacteria that was significantly greater than the seropositivity rate for an ELISA were recombinant antigens are used(16,33,34) led to thehypothesisthatcrudenativeantigensallowforthedetectionofawiderrangeofantibodies as they present more than one epitope of the pathogen.
Rev Mex Cienc Pecu 2022;13(4):1079 1094 1089
In the present work, a batch of crude A. marginale antigen was produced starting from blood of an infected splenectomized steer. The production of crude antigens involves great effort in terms of man hours and costly disease free animals, furthermore, it requires surgeries in the experimental animals and the postoperative care during recovery.Through this procedure though, it was possible to reach 65 % infected erythrocytes in the last bovine, from which approximately 14 L of blood were exsanguinated. After a laborious extraction and washing process, 210 mL of antigen were obtained with a final protein concentration of 144.26 mg, equivalent to 0.687 µg/µL. This concentration is higher compared with recombinant protein concentrations(5) where the yield was 40 mg/L and 60 mg/L of culture for each recombinant protein used in that work. This supports theuseofcrudenativeproteins as thecoatingantigen for iELISA tests as its yield implies economic savings and more affordable prices for Tproducers.otesttofor antigenicity of the new antigen, 12 positive and 10 negative control sera were run against both antigens Mean OD readings of positive sera ran against Ag 2012 and Ag 2018 were not significantly different; in contrast, the OD values of the negative sera were higher when tested against Ag 2012 than with Ag 2018 (Figure 1). The mean of all negative sera was 0.314 for Ag 2018, while it was 0.450 when tested with Ag 2012. When the mean for positives was divided by the mean for negatives tested with Ag 2012, the quotient was 2.93 whereas that value was 3.79 for Ag 2018. Dividing 3.79 by 2.93 it gets a 1.28 value This indicates that Ag 2018 is 1.28 times better at discriminating positives from negatives.
Rev Mex Cienc Pecu 2022;13(4):1079 1094 1090
The present work provides evidence of the reproducibility in the production from one lot of antigen to another, even many years after being prepared, as long as the protocol is followed.
The only difference in the preparation of these two antigen batches was the use of newer technology for the disruption of the infected erythrocytes i.e., a microfluidizer, a device that facilitates the process in terms of larger volumes being disrupted and apparently less debris in the final preparation. These two batches of antigen are now in use at the Laboratorio del Departamento de Helmintos y Hemoparásitos of the SENASICA for the diagnosis of bovine anaplasmosis in the cattle of Mexican producers.
For the antigenicity limit test, antigens were assayed at 2X, 1X, ½X and ¼X protein concentration against a lot of four positive and four negative control sera. While there was a gradual decline in OD readings corresponding to antigen concentration, this decline was not statistically significant, indicating that both antigens were being used at an excess. The variations observed between concentrations of Ag 2018 were minimal, whereas the values of the same sera at the same concentrations of Ag 2012 were more heterogeneous even when they were not significantly different It was not known if these variations are due to ageing or presence of debris in the antigen lot yet reading with the new lot were more consistent.
Antigensproducedbya governmentallaboratoryhaveahigh qualitystandardandarereliable as they are regulated by international and international agencies. The need for commercially available ELISA kits is obviated when an in house iELISA is available reducing the costs and importing periods thus making testing more efficient and expeditious.
It was concluded that the new batch of antigen (Ag 2018) is as good as the old batch. Both batches need to be titrated to reduce the concentration in order to optimize the use of each batch, which will in turn reduce the cost of the test making it more affordable for producers.
In the third test, the efficiencyof the new antigen was tested against 20 field sera There were 13 and 12 positives for Ag 2012 and Ag 2018 respectively. While there was no 100 % coincidence (Table 1), the samples that did not coincide were different only by hundredths of a unit (PI), i.e., when they were positive for one and negative for the other, they were right above the PI and vice versa, when they were negative they were right below the PI. This givesan80%correlation between antigens.Yet,statisticalanalysisshowed 100%sensitivity (a remarkable improvement over previously reported for a similar antigen)(32) , 87.5 % specificity, 92.31 % positive predictive value, 100 % negative predictive value and 95 % accuracy (Table 2). These results in terms of sensitivity and specificity are comparable to more recently developed ELISA’s(3,5,17) . Thus, these results show that both antigen lots are equally reliable to routinely run the in house iELISA.
Rev Mex Cienc Pecu 2022;13(4):1079 1094
5. Sarli M, Thompson CS, Novoa MB, Valentini BS, Mastropaolo M, et al. Development and evaluation of a double antigen sandwich ELISA to identify Anaplasma marginale infected and A. centrale vaccinated cattle. J Vet Diagn Invest 2020;32(1):70 76. doi: 10.1177/1040638719892953.
8. Gonzalez E, Long R, Todorovic R. Comparisons of the complement fixation, indirect fluorescent antibody, and card agglutinationtests for the diagnosis of bovine anaplasmosis Am J Vet Res 1978;39:1538 1541.
Acknowledgments
6. Löhr KF, Ross JP, Meyer H. Studies on homologous and heterologous antibody responses to infections with Anaplasma marginale and A. centrale using the indirect fluorescent antibody and capillary tube agglutination tests. Z Tropenmed Parasitol 1973;24(1):86 95.
The results are part of the activities of the fiscal projects "Conservation of germplasm of the rickettsia Anaplasma marginale" (INIFAP 1162734713) and “Establishment of in vitro culture of Mexican strains of Anaplasma marginale in tick cells” (INIFAP 13341734501). Thanks to all facilities provided by SENASICA for the realization of this work. Literature cited: 1. Aubry P, Geale DW. A review of bovine anaplasmosis. Transbound Emerg Dis 2011;58(1):1 30.
3. Primo ME, Thompson CS, Valentini BS, Sarli M, Novoa MB, et al Development of a novel fusion protein with Anaplasma marginale and A. centrale MSP5 improved performance of Anaplasma antibody detection by cELISA in infected and vaccinated cattle. PLoS One 2019;14(1):e0211149. DOI: 10.1371/journal.pone.0211149
1091
7. Price KE, Brock WE, Miller JG. An evaluation of the complement fixation test for anaplasmosis. Am J Vet Res 1954;15(57):511-516.
4. Rodríguez PJL, Forlano RMD, Meléndez MRD. Dinámica de anticuerpos e infección activa por Anaplasma marginale en becerras. Rev Med Vet 2020;(40):35 44. https://doi.org/10.19052/mv.vol1.iss40.4
2. Rodríguez SD, García-Ortiz MA, Jiménez-Ocampo R, Vega y Murguía CA. Molecular epidemiology of bovine anaplasmosis with a particular focus in Mexico. Infect Genet Evo 2009;9(6):1092 1101. doi: 10.1016/j.meegid.2009.09.007.
18. Galo SS, González K, Téllez Y, García N, Pérez L, et al. Development of in house serological methods for diagnosis and surveillance of chikungunya. Rev Panam Salud Publica 2017;41:e56. doi: 10.26633/RPSP.2017.56.
9. González BC, Obregón D, Alemán Y, Alfonso P, Vega E, Díaz A, Martínez S. Tendencias en el diagnóstico de la anaplasmosis bovina. Rev Salud Anim 2014;36(2):73 79. 10. Barry DN, Parker RJ, De Vos AJ, Dunster P, Rodwell BJ. A microplate enzyme-linked immunosorbent assay for measuring antibody to Anaplasma marginale in cattle serum. Aust Vet J 1986;63(3):76 79. 11. Rodríguez CSD, García OMA, Cantó AGJ, Hernández SG, Santos CN, et al. Ensayo de un inmunógeno experimental inactivado contra Anaplasma marginale. Tec Pecu Mex1999;37(1):1 12. 12. OIE. Organización Mundial de Sanidad Animal. Manual de las pruebas de diagnóstico y de las vacunas para los animales terrestres (mamíferos, aves y abejas). 2004, Section 3.4.; Chapter 3.4. Bovine Anaplasmosis. NAPLASMOSIS.pdfhttps://www.oie.int/fileadmin/Home/eng/Health_standards/tahm/3.04.01_BOVINE_A.
14. Chung C, Wilson C, Bandaranayaka Mudiyanselage CB, Kang E, Adams DS, et al. Improved diagnostic performance of a commercial Anaplasma antibody competitive enzyme linked immunosorbent assay using recombinant major surface protein 5 glutathione S transferase fusion protein as antigen. J Vet Diagn Invest 2014;26(1):61 71. doi: 10.1177/1040638713511813.
15. Morzaria SP, Katende J, Musoke A, Nene V, Skilton R, et al. Development of serodiagnosticandmolecular toolsforthecontrolofimportanttick-bornepathogensofcattle in Africa. Parassitologia 1999;41 Suppl 1:73 80. 16. Ortona E, Riganoa R, Margutti P, Notargiacomo S, Ioppolo S, et al Native and recombinant antigens in the immunodiagnosis of human cystic echinococcosis Parasite Immunol 2000;22(11):553 539. doi: 10.1046/j.1365 3024.2000.00336.x.
17. Schweiger A, Grimm F, Tanner I, Müllhaupt B, Bertogg K, et al. Serological diagnosis of echinococcosis: the diagnostic potential of native antigens. Infection 2012;40(2):139 152. doi: 10.1007/s15010 011 0205 6.
13. Knowles D, Torioni de Echaide S, Palmer G, McGuire T, et al. Antibody against an Anaplasma marginale MSP5 epitope common to tick and erythrocyte stages identifies persistently infected cattle. J Clin Microbiol 1996;34(9):2225 2230. doi: 10.1128/jcm.34.9.2225 2230.1996.
Rev Mex Cienc Pecu 2022;13(4):1079 1094 1092
22. Amerault TE, Roby TO. A rapid card agglutination test for bovine anaplasmosis. J Am Vet Med Assoc 1968;153(12):1828 1834.
28. Alexander A. Técnica quirúrgica en animales y temas de terapéutica quirúrgica, 4th ed. México: Interamericana. 1979:170 172.
Rev Mex Cienc Pecu 2022;13(4):1079 1094 1093
27. Salinas EE, Preciado TJF, Rodríguez CSD, Cobaxin CME, Amaro EI, Quiroz CRE. Esplenectomía experimental en bovinos como apoyo en el estudio de Anaplasma marginale. INIFAP. 2019. Libro Técnico No. 20, ISBN: 978 607 37 1152 4
19. Alandijany TA, El Kafrawy SA, Tolah AM, Sohrab SS, Faizo AA, et al. Development and optimization of in house ELISA for detection of human IgG antibody to SARS CoV 2 full length spike protein. Pathogens 2020;9(10):803. doi: 10.3390/pathogens9100803
23. Torioni de Echaide S, Knowles DP, McGuire TC, Palmer GH, Suarez CE, et al. Detection of cattle naturally infected with Anaplasma marginale in a region of endemicitybynestedPCRandacompetitiveenzyme linkedimmunosorbentassayusing recombinant major surface protein 5. J Clin Microbiol 1998;36(3):777 782. doi: 10.1128/JCM.36.3.777 782.1998.
20. Sil BK, Jahan N, Haq MA, Oishee MJ, Ali T, et al. Development and performance evaluation of a rapid in house ELISA for retrospective serosurveillance of SARS CoV 2. PLoS One 2021;16(2):e0246346. doi: 10.1371/journal.pone.0246346.
24. Figueroa JV, Chieves LP, Johnson GS, Buening GM. Detection of Babesia bigemina infected carriers by polymerase reaction amplification. J Clin Microbiol 1992;30:2576 2582. doi: 10.1128/JCM.30.10.2576 2582.1992. 25. Figueroa JV, Chieves LP, Johnson GS, Buening GM. Multiplex polymerase chain reaction based assay for the detection of Babesia bigemina, Babesia bovis and Anaplasma marginale DNA in bovine blood. Vet Parasitol 1993;50;69 81. doi: 10.1016/0304 4017(93)90008 B. 26. Martínez Ocampo F, Quiroz Castañeda RE, Amaro Estrada I, Cobaxin Cárdenas M, Dantán González E, et al Draft genome sequences of Anaplasma marginale strains MEX 15 099 01 and MEX 31 096 01, two Mexican isolates with different degrees of virulence Microbiol Resour Announc 2019;8(45):e01184 19. doi: 10.1128/MRA.01184 19.
21. Rogers TE, Hidalgo RJ, Dimopoullos GT. Immunology and serology of Anaplasma marginale. I. Fractionation of the complement fixing antigen. J Bacteriol 1964;88(1):81 86. doi: 10.1128/jb.88.1.81 86.1964.
29. Winkler GC, Brown GM, Lutz H. Detection of antibodies to Anaplasma marginale by an improved enzyme linked immunosorbent assay with sodium dodecyl sulfate disrupted antigen. J Clin Microbiol 1987;25(4):633 636. doi:10.1128/jcm.25.4.633 636.1987.
32. Tello RM, Álvarez MJA, Ramos AJA, Aboytes TR, Cantó AGJ. La prueba de ELISA en el diagnóstico de la anaplasmosis. Téc Pecu Méx 1986;52:45 50.
Rev Mex Cienc Pecu 2022;13(4):1079 1094 1094
33. Ito A, Xiao N, Liance M, Sato MO, Sako Y, et al. Evaluation of an enzyme linked immunosorbent assay (ELISA) with affinity purified Em18 and an ELISA with recombinant Em18 for differential diagnosis of alveolar echinococcosis: results of a blind test. J Clin Microbiol 2002;40:4161 4165. doi:10.1128/JCM.40.11.4161 4165.2002. 34. Magnarelli LA, Bushmich SL, Sherman BA, Fikrig E. A comparison of serologic tests for the detection of serum antibodies to whole cell and recombinant Borrelia burgdorferi antigens in cattle. Can Vet J 2004;45(8):667 673.
30. Fragoso Sánchez H. 2do Seminario Internacional de Parasitología Animal. Memorias. 1991:153 160.
31. Preciado TJF, García Ortiz MA, Hernández Ortiz R, Rodríguez Camarillo SD. Anaplasmosis bovina en las cuencas lecheras de México. En: Milian SF, Hernández AL, Hernández OR. Situación epidemiológica de la ganadería lechera en México, CENID Microbiología animal, INIFAP. 2015:51 73.
Effects of acid whey on the fermentative chemical quality and aerobic stability of rehydrated corn grain silage Efectos del suero ácido sobre la calidad química fermentativa y la estabilidad aeróbica del ensilado de grano de maíz rehidratado Ediane Zanin, Egon Henrique Horst, Caio Abércio Da Silva, Valter Harry Bumbieris Junior.........… 943 Growth performance and carcass classification of pure Pelibuey and crossbred lambs raised under an intensive production system in a warm-humid climate Rendimiento productivo y clasificación de canales de corderos Pelibuey puros y cruzados criados bajo un sistema de producción intensivo en un clima cálido-húmedo Miriam Rosas-Rodríguez, Ricardo Serna-Lagunes, Josa�at Salinas-Ruiz, Julio Miguel Ayala- Rodríguez, Benjamín Alfredo Piña Cárdenas, Juan Salazar-Or�z 962
Factores de riesgo asociados a la seroprevalencia de lentivirus en rebaños ovinos y caprinos del noreste de México Risk factors associated with lentivirus seroprevalence in sheep and goat herds from northeastern Mexico Rogelio Ledezma Torres, José C. Segura Correa, Jesús Francisco Chávez Sánchez, Alejandro José Rodríguez García, Sibilina Cedillo Rosales, Gustavo Moreno Degollado, Ramiro Avalos Ramírez……………………………………………….... 995 Caracterización de los sistemas de producción familiar ovina en la Mixteca Oaxaqueña, México Family sheep production systems in the Mixteca region of Oaxaca, Mexico Jorge Hernández Bau�sta, Héctor Maximino Rodríguez Magadán Teódulo Salinas Rios, Magaly Aquino Cleto, Araceli Mariscal Méndez……………………… 1009
OCTUBRE-DICIEMBRE-2022846-1094,pp.4,Núm.13Vol.Pecu.Cienc.Mex.Rev.Pags. Rev. Mex. Cienc. Pecu. Vol. 13 Núm. 4, pp. 846-1094, OCTUBRE-DICIEMBRE-2022 ARTÍCULOS / ARTICLES
Efecto de la cobertura del suelo sobre el crecimiento y productividad del zacate buffel (Cenchrus ciliaris L.) en suelos degradados de zonas áridas Effect of soil cover on the growth and productivity of buffel grass (Cenchrus ciliaris L.) in degraded soils of arid zones Ernesto Herssaín Pedroza-Parga, Aurelio Pedroza-Sandoval, Miguel Agus�n Velásquez-Valle, Ignacio Sánchez-Cohen, RicardoTrejo-Calzada, José Alfredo Samaniego-Gaxiola………………………......... 866 Tipología de consumidores de miel con educación universitaria en México Typology of honey consumers with a university education in Mexico Fidel Ávila Ramos, Lizeth Paula Boyso Mancera, Mercedes Borja Bravo, Venancio Cuevas Reyes, Blanca Isabel Sánchez Toledano 879 Vertical and spatial price transmission in the Mexican and international cattle and beef market Transmisión vertical y espacial de precios en el mercado mexicano e internacional de ganado vacuno José Luis Jaramillo Villanueva…………………………………………… 894 Exploring bovine fecal bacterial microbiota in the Mapimi Biosphere Reserve, Northern Mexico Irene Pacheco-Torres Cristina García-De la Peña, César Alberto Meza-Herrera, Felipe Vaca-Paniagua, Clara Estela Díaz-Velásquez, Claudia Fabiola Méndez-Catalá, Luis Antonio Tarango- Arámbula, Luis Manuel Valenzuela-Núñez, Jesús Vásquez-Arroyo 910 Perfil fitoquímico, actividad antimicrobiana y antioxidante de extractos de Gnaphalium oxyphyllum y Euphorbia maculata nativas de Sonora, México Phytochemical profile, antimicrobial and antioxidant activity of extracts of Gnaphalium oxyphyllum and Euphorbia maculata native to Sonora, Mexico Priscilia Yazmín Heredia-Castro, Claudia Vanessa García-Baldenegro, Alejandro Santos-Espinosa, Iván de Jesús Tolano-Villaverde, Carmen Guadalupe Manzanarez-Quin, Ramón Dolores Valdez-Domínguez, Cris�na Ibarra-Zazueta, Reyna Fabiola Osuna-Chávez, Edgar Omar Rueda-Puente, Carlos Gabriel Hernández-Moreno, Susana Marlene Barrales-Heredia, Jesús Sosa-Castañeda 928
Effect of weight and body condition score from pregnant cows on the carcass characteristics of their progeny: Meta-analysis Efecto del peso y la puntuación de la condición corporal de vacas gestantes en las características de la canal de su progenie: Meta análisis Sander Mar�nho Adams, John Lenon Klein, Diego Soares Machado, Dari Celes�no Alves Filho, Ivan Luiz Brondani, Luiz Angelo Damian Pizzu�…………………… 981
REVISIONES DE LITERATURA / REVIEWS La hipocalcemia en la vaca lechera. Revisión
Hypocalcemia in the dairy cow. Review Carlos Fernando Arechiga-Flores, Zimri Cortés-Vidauri, Pedro Hernández-Briano, Renato Raúl Lozano-Domínguez, Marco Antonio López-Carlos, Ulises Macías-Cruz, Leonel Avendaño-Reyes…....... 1025 NOTAS DE INVESTIGACIÓN / TECHNICAL NOTES Comportamiento productivo y valor nutricional del pasto Pennisetum purpureum cv Cuba CT-115, a diferente edad de rebrote Productive performance and nutritional value of Pennisetum purpureum cv. Cuba CT-115 grass at different regrowth ages Gloria Esperanza de Dios-León, Jesús Alberto Ramos-Juárez, Francisco Izquierdo-Reyes, Ber�n Maurilio Joaquín-Torres, Francisco Meléndez-Nava……………………………….........………....……....……....……....... 1055 Evaluación bacteriana de queso artesanal Zacazonapan madurado bajo condiciones no controladas en dos épocas de producción Bacterial evaluation of Zacazonapan artisanal cheese matured under non-controlled conditions in two production periods Jair Jesús Sánchez-Valdés, Vianey Colín-Navarro, Felipe López-González, Francisca Avilés-Nova, Octavio Alonso Castelán-Ortega, Julieta Gertrudis Estrada Flores......……..………………..………...……....…. 1067 Antigen production and standardization of an in-house indirect ELISA for detection of antibodies against Anaplasma marginale Producción de antígenos y estandarización de un ELISA casero indirecto para la detección de anticuerpos contra Anaplasma marginale Elizabeth Salinas Estrella, María Guadalupe Ortega Hernández, Erika Flores Pérez, Na�vidad Montenegro Cris�no, Jesús Francisco Preciado de la Torre, Mayra Elizeth Cobaxin Cárdenas, Sergio D. Rodríguez…….........................………........………........………........………........………........………........………........………........………........………........………...............…………. 1079
CdeivistaReMexcanaienciasPecuarias Evaluation of morphological and yield traits in the populations of Vicia spp. Evaluación de rasgos morfológicos y de rendimiento en las poblaciones de Vicia spp. Hamideh Javadi, Parvin Salehi Shanjani, Leila Falah Hoseini, Masoumeh Ramazani Yeganeh.......……………………………………………………………………........………………... 846
Revista Mexicana de Ciencias Pecuarias CONTENIDOCONTENTS