
Wodonga Market Update 2nd Half 2025

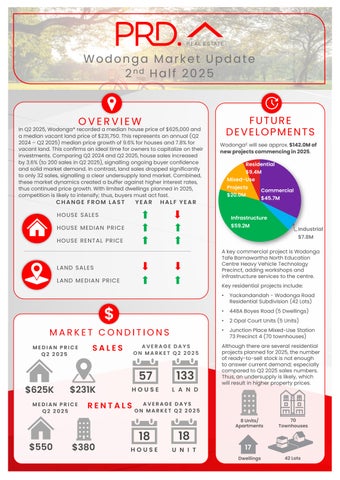
In Q2 2025,Wodonga* recorded a median house price of $625,000and a median vacant land price of $231,750.This represents anannual (Q2 2024– Q2 2025)median price growth of 9.6%for houses and 7.8%for vacantland. This confirms an ideal time for owners to capitalize on their investments. Comparing Q2 2024and Q22025, house sales increased by 3.6%(to 200 sales in Q2 2025), signalling ongoing buyer confidence and solid market demand. In contrast, land sales dropped significantly to only 32sales, signalling a clear undersupply land market. Combined, these market dynamics created a buffer against higher interest rates, thus continued price growth. With limited dwellings planned in 2025, competition is likely to intensify; thus, buyers must actfast.
CHANGE FROM LAST


Wodonga£ will see approx.$142.0Mof newprojectscommencingin2025
YEAR HALF YEAR
HOUSE SALES
HOUSE MEDIAN PRICE
HOUSE RENTAL PRICE
LAND SALES
LAND MEDIAN PRICE

MEDIAN PRICE Q2 2025

$625K $231K
MEDIAN PRICE Q2 2025
AVERAGE DAYS ON MARKET Q2 2025
57
AVERAGE DAYS ON MARKET Q2 2025


A key commercial project is Wodonga Tafe Barnawartha North Education Centre Heavy Vehicle Technology Precinct, adding workshops and infrastructure services to the centre.
Key residential projects include:
• Yackandandah - Wodonga Road Residential Subdivision (42 Lots)
• 448A Boyes Road (5 Dwellings)
• 2Opal Court Units (5 Units)
• Junction Place Mixed-Use Station 73Precinct 4 (70townhouses)
Although there are several residential projects planned for 2025, the number of ready-to-sell stock is not enough to answer current demand; especially compared to Q22025sales numbers. Thus,an undersupply is likely, which will result in higher property prices.


AVERAGE VENDOR DISCOUNT*
Average vendor discount reflects the average percentage difference between the first list price and final sold price. A lower percentage difference (closer to 0.0%) suggests that buyers are willing to purchase close to the first asking price of a property.


Average vendor discounts between Q2 2024and Q2 2025 have tightened to -1.8% forhouses but widened to -4.3% for vacantland. Market conditions in Wodonga* still favour buyers, as sellers are willing to accept below the listed prices. However, the narrowing discount forhouses signals a potential market shift towards a seller’s market. As a result, buyers in the housing market need to actquickly.
The suburb of Wodonga has historically been onpar with the wider Wodonga LGA in house and land median prices for the past 5 years. 2025# saw this trend continue, with median house price in the suburb and LGA growing in the same direction and pace.
In 2025#, most of the homes sold in Wodonga* were in the middle price brackets, with 31.5% sold between $550,000 and $650,000.Similarly, 52.1%of land sold were between $200,000and $250,000.That said, the most affordable price brackets is still available, with 12.6%of houses sold below $449,999and 12.2%of land sold below $149,999. this is good news for first home buyers. The premium market for houses have increased slightly, with 12.9%of stock sold above $750,000,which will benefit owners. The market comparison graph provides a comparative trend for median price of houses and vacant land over the past 5 years. The main LGA chosen was based on their proximity to the main suburb analysed, which is Wodonga.


MARKET COMPARISON
Wodonga (3690) House Wodonga LGA House Wodonga (3690) Vacant Land Wodonga LGA Vacant Land


Less than $149,999
$150,000 to $199,999
$200,000 to $249,999
$250,000 to $299,999
$300,000 and above
RENTAL GROWTH 2025€
House rental yields in Wodonga¥ were 4.3%as of June 2025, onpar with Wodonga LGA (4.2%) and higher than Melbourne Metro (3.1%). This is paired with a 10.4% growth in median house rental price in the past 12months to Q2 2025,to$550 per week; along with a -1.1% decline (to 173rentals in Q2 2025) in the number of houses rented. Overall, this suggests an undersupplied and competitive house rental market in Wodonga¥, which is beneficial to investors.
2+ bedroom houses have provided investors with +12.2%rental growth annually, achieving a median rent of $440per week.
Wodonga¥ recorded a vacancy rate of 0.5% in June 2025,significantly below Melbourne Metro’s 1.8%. Vacancy rates have increased slightly in the past 12months, indicating investors have returned to market. Moreover, a 0.5% vacancy rate is well below the Real Estate Institution of Australia’s healthy benchmark of 3.0%, indicating quicker occupancy of rental properties in Wodonga¥. This suggests a sustainable investment environment. With a more affordable entry price than Melbourne Metro, Wodonga¥ is an attractive investment alternative forinvestors.
RENTAL VACANCY RATES 2025

Wodonga (3690) Wodonga LGA Melbourne Metro REIA 'Healthy' Benchmark


Wodonga (3690)
PROJECT DEVELOPMENT MAP 2025 ₳

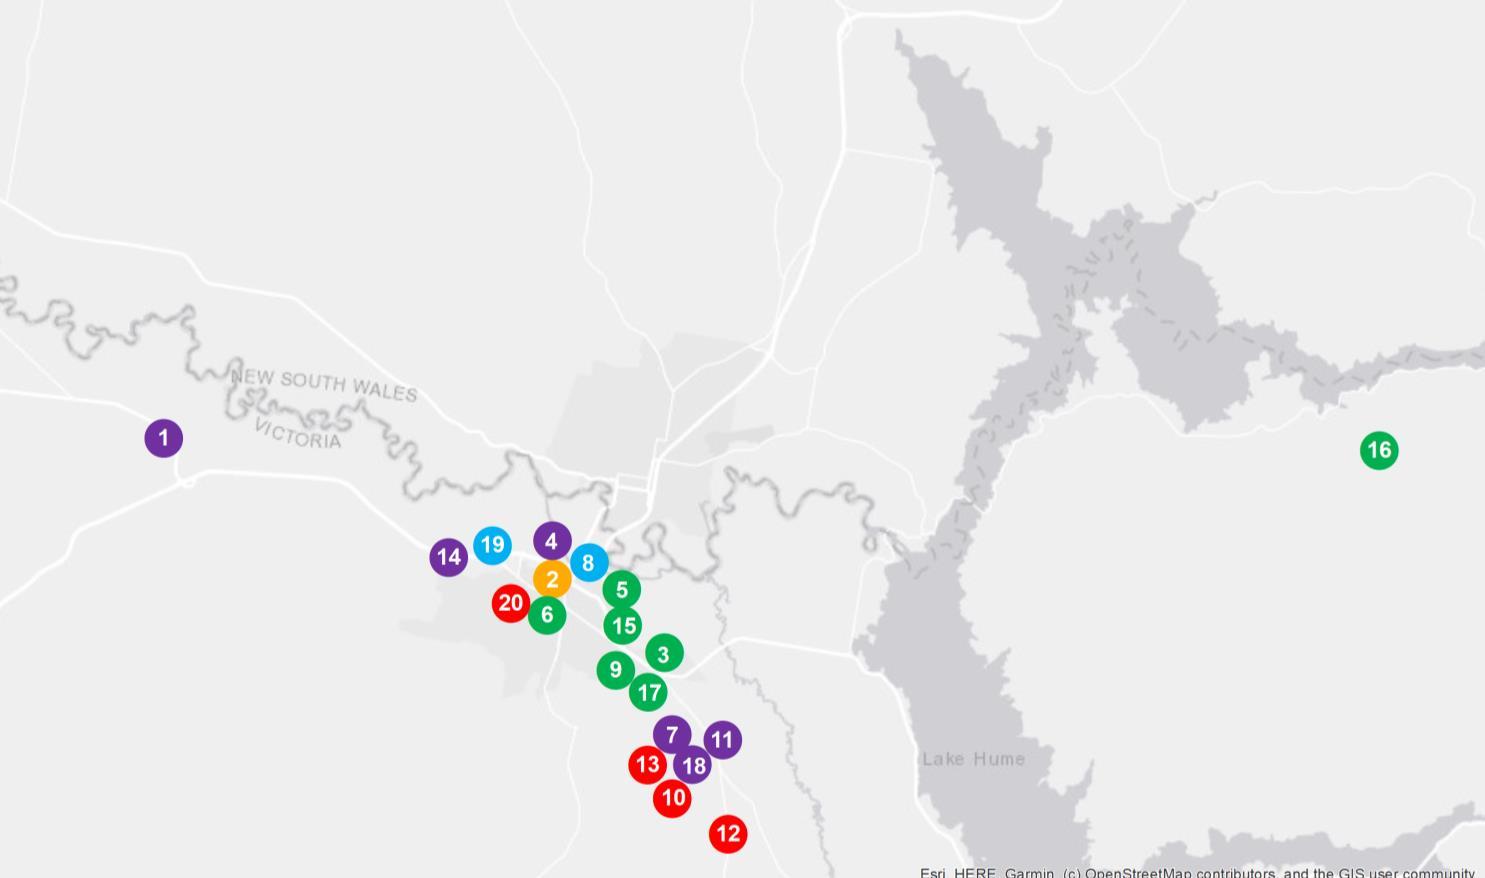
WODONGA


RESEARCH SERVICES
Our research services span over every suburb, LGA,and state within Australia; captured in a variety of standard and customised products, andinclude:
• Advisory and consultancy
• Market analysis including profiling and trends
• Primary qualitative and quantitative research
• Demographic and target market analysis
• Geographic information mapping
• Project analysis including product and pricing recommendations
• Rental and investment return analysis
OUR KNOWLEDGE
Access to accurate and objective research is the foundation of all good property decisions.
OUR PEOPLE
Our research team is made up of highly qualified researchers who focus solely on propertyanalysis.


REFERENCES
* Wodonga sales market data and key indicators encapsulates aggregate property market conditions within the Wodonga Local Government Area.
** Estimated values are based on construction value provided by the relevant data authority and does not reflect commercial and/or re-sale value.
# 2025 encapsulates sales transactions for 1st Half 2025 (01/01/2025 – 30/06/2025) only, other years encapsulates sales transactions for the full year (i.e 01/01 to 31/12 of the relevant year)
€ Annual rental growth is a comparison between Q2 2024 (01/04/2024 – 30/06/2024) and Q2 2025 (01/04/2025 – 30/06/2025) house median rent figures.
¥ Wodonga rental market data encapsulates aggregate property conditions within the postcode of 3690.
§ Rental yields shown are as reported as of June 2025.
₳ Project development map showcases a sample of upcoming projects only, due to accuracy of addresses provided by the data provider for geocoding purposes.
£ Projects refers to the top developments within the postcodes of 3690 and 3691.
µ Estimated value is the value of construction costs provided by relevant data authority, it does not reflect the project’s sale/commercial value.
ψ Commencement date quoted for each project is an approximate only, as provided by the relevant data authority, PRD does not hold any liability to the exact date.
Source: APM Pricefinder, Cordell Connect database, SQM Research, Esri ArcGIS.
Disclaimer: PRD does not give any warranty in relation to the accuracy of the information contained in this report. If you intend to rely upon the information contained herein, you must take note that the information, figures and projections have been provided by various sources and have not been verified by us. We have no belief one way or the other in relation to the accuracy of such information, figures and projections. PRD will not be liable for any loss or damage resulting from any statement, figure, calculation or any other information that you rely upon that is contained in the material.
Prepared by PRD Research. © All medians and volumes are calculated by PRD Research. Use with written permission only. All other responsibilities disclaimed. © Copyright PRD 2025.