
Whitsundays Market Update 2nd Half 2025

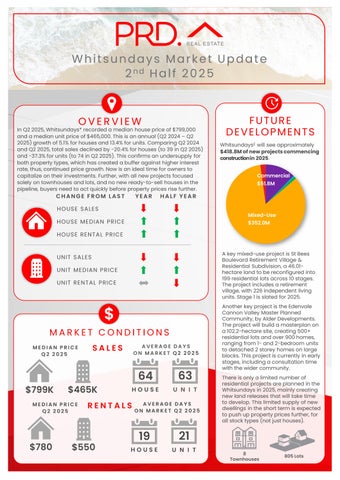
In Q2 2025, Whitsundays* recorded a median house price of $799,000 and a median unit price of $465,000.This is anannual (Q2 2024 – Q2 2025)growth of 5.1% for houses and 13.4% for units. Comparing Q2 2024 and Q2 2025,total sales declined by -20.4% for houses (to 39 in Q2 2025) and -37.3%for units (to 74 in Q2 2025). This confirms anundersupply for both property types, which has created a buffer against higher interest rate, thus, continued price growth. Now is an ideal time for owners to capitalize on their investments. Further, with all new projects focused solely on townhouses and lots, and no new ready-to-sell houses in the pipeline, buyers need to actquickly before property prices rise further.
CHANGE FROM LAST


Whitsundays£ will see approximately $418.8Mofnewprojectscommencing constructionin2025
YEAR HALF YEAR
HOUSE SALES
HOUSE MEDIAN PRICE
HOUSE RENTAL PRICE UNIT SALES UNIT MEDIAN PRICE
RENTAL PRICE

MEDIAN PRICE Q2 2025
$799K $465K
MEDIAN PRICE Q2 2025
AVERAGE DAYS ON MARKET Q2 2025


A key mixed-use project is St Bees Boulevard Retirement Village & Residential Subdivision, a 46.01hectare land to be reconfigured into 199residential lots across 10 stages. The project includes a retirement village, with 226 independent living units. Stage 1 is slated for 2025.
Another key project is the Edenvale Cannon Valley Master Planned Community, by Alder Developments. The project will build a masterplan on a 102.2-hectare site, creating 500+ residential lots and over 900homes, ranging from 1- and 2-bedroom units to detached 2 storey homes on large blocks. This project is currently in early stages, including a consultation time with the wider community.
64
63 $550 HOUSE UNIT
AVERAGE DAYS ON MARKET Q2 2025
19 21 $780
There is only a limited number of residential projects are planned in the Whitsundays in 2025,mainly creating new land releases that will take time to develop. This limited supply of new dwellings in the short term is expected to push up property prices further, for all stock types (not just houses).


AVERAGE VENDOR DISCOUNT*
Average vendor discount reflects the average percentage difference between the first list price and final sold price. A lower percentage difference (closer to 0.0%) suggests that buyers are willing to purchase close to the first asking price of a property.


Average vendor discounts between Q2 2024and Q2 2025 have tightened to -0.1% forhouses but widened to -2.8% for units. Market conditions still favourbuyers, as sellers are willing to accept below the first list prices; however just. Q2 2025saw the tightest discount for houses, which suggests a swing towards a seller’s market. With no new ready-to-sell houses planned, buyers need to act fast
The suburb of Whitsundays has outperformed the wider Whitsunday Local Government Area (LGA) for house prices for the past 5 years, and on-par for unit prices. This trend has continued in 2025#,for bothproperty types. The suburb of Whitsundays remain a premium suburb, even with a steadier price growth rate compared to 2024.
Most of the houses sold in Whitsundays* across 2025# were in premium price point of $950Kand above (25.0%). Thatsaid, there is a relatively balanced market overall, with the most affordable price point of less than $649,999 and the more affordable range of $650,000 - $749,999 recording the same proportion of sales (21.5%). For first home buyers, the more affordable price range of$400Kto $500Kis currently the dominant segment for units (24.0%).
MARKET COMPARISON
Whitsundays (4802) House
Whitsundays LGA House Whitsundays (4802) Unit Whitsundays LGA Unit
The market comparison graph provides a comparative trend for median price of houses and units over the past 5 years. The main LGA chosen was based on their proximity to the main suburb analysed, which is Whitsundays.


PRICE BREAKDOWN 2025


than $299,999
$300,000 to $399,999
$400,000 to $499,999
$500,000 to $599,999
$600,000 and above
RENTAL GROWTH 2025€
House rental yields in Whitsundays¥ were 5.4% as of June 2025, higher than the Whitsundays LGA (4.7%) and QLD North Coast (5.0%). Further, median house rental price in Whitsundays¥ increased by 8.3% in the past 12 months to Q2 2025,at $780per week However, the number of houses rented decreased by -28.6% (to 40 houses). This indicates an undersupplied and competitive house rental market in Whitsundays¥, which is beneficial to investors.
3+ bedroom houses have provided investors with +7.1%rental growth annually, achieving a median rent of $750per week.
Whitsundays¥ recorded a vacancy rate of 1.1% in June 2025,slightly above the Whitsundays LGA’s average of 0.9%and QLD North Coast’s 1.0%. Vacancy rates have decreased in the past 12 months, indicating an even tighter market. Furthermore, a 1.1% vacancy rate is well below the Real Estate Institution of Australia’s healthy benchmark of 3.0%, indicating quicker occupancy of rental homes in the Whitsundays¥. This creates a conducive environment for investors, even with a higher house and unit sales (thus entry) price in the past 12months toQ2 2025.

Whitsundays (4802) Whitsundays LGA QLD North Coast REIA 'Healthy' Benchmark

RENTAL VACANCY RATES 2025 RENTAL
Whitsundays¥

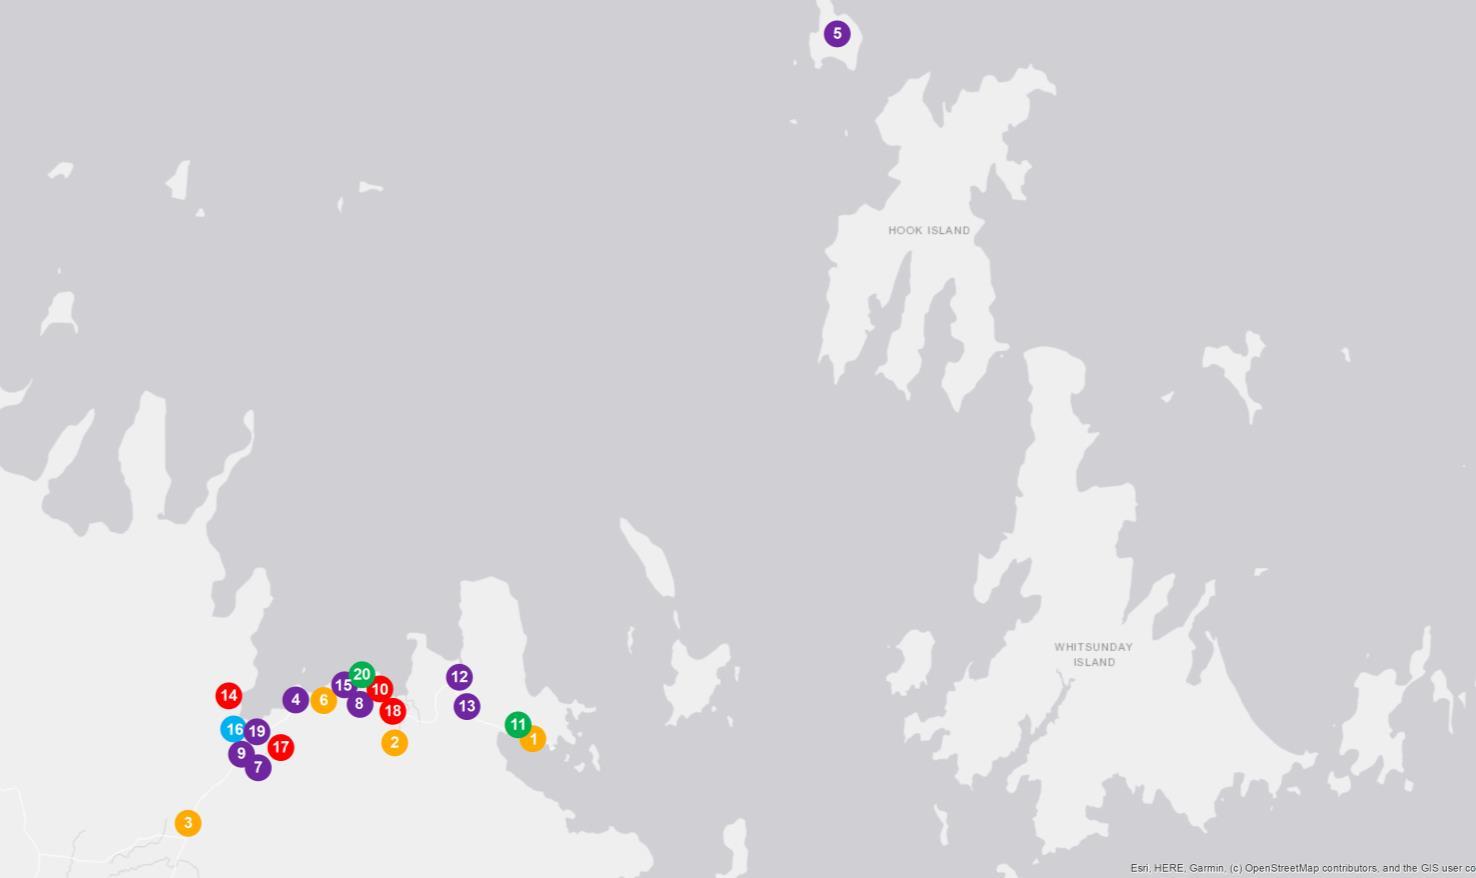
PROJECT DEVELOPMENT MAP 2025 ₳

WHITSUNDAYS


RESEARCH SERVICES
Our research services span over every suburb, LGA,and state within Australia; captured in a variety of standard and customised products, andinclude:
• Advisory and consultancy
• Market analysis including profiling and trends
• Primary qualitative and quantitative research
• Demographic and target market analysis
• Geographic information mapping
• Project analysis including product and pricing recommendations
• Rental and investment return analysis
OUR KNOWLEDGE
Access to accurate and objective research is the foundation of all good property decisions.
OUR PEOPLE
Our research team is made up of highly qualified researchers who focus solely on propertyanalysis.


REFERENCES
* Whitsundays sales market data and key indicators encapsulates aggregate property market conditions within the postcode of 4802.
** Estimated values are based on construction value provided by the relevant data authority and does not reflect commercial and/or re-sale value.
# 2025 encapsulates sales transactions for the 1st Half 2025 (01/01/2025 – 30/06/2025) only, other years encapsulates sales transactions for the full year (i.e 01/01 to 31/12 of the relevant year)
€ Annual rental growth is a comparison between Q2 2024 (01/04/2024 – 30/06/2024) and Q2 2025 (01/04/2025 – 30/06/2025) house median rent figures.
¥ Whitsundays rental market data encapsulates aggregate property conditions within the postcode of 4802.
§ Rental yields shown are as reported as of June 2025
₳ Project development map showcases a sample of upcoming projects only, due to accuracy of addresses provided by the data provider for geocoding purposes.
£ Projects refers to the top developments within the postcode of 4802.
µ Estimated value is the value of construction costs provided by relevant data authority; it does not reflect the project’s sale/commercial value.
ψ Commencement date quoted for each project is an approximate only, as provided by the relevant data authority, PRD does not hold any liability to the exact date.
Source: APM Pricefinder, Cordell Connect database, SQM Research, Esri ArcGIS.
Disclaimer: PRD does not give any warranty in relation to the accuracy of the information contained in this report. If you intend to rely upon the information contained herein, you must take note that the information, figures and projections have been provided by various sources and have not been verified by us. We have no belief one way or the other in relation to the accuracy of such information, figures and projections. PRD will not be liable for any loss or damage resulting from any statement, figure, calculation or any other information that you rely upon that is contained in the material.
Prepared by PRD Research. © All medians and volumes are calculated by PRD Research. Use with written permission only. All other responsibilities disclaimed. © Copyright PRD 2025.