
Albury Market Update 2nd Half 2025

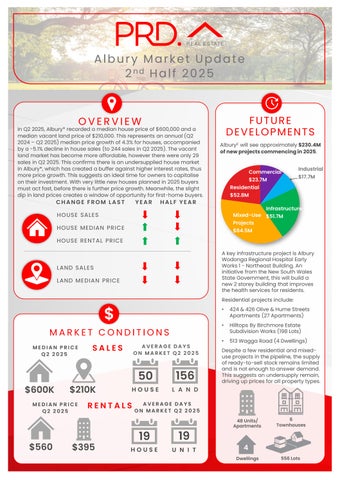
In Q2 2025, Albury* recorded a median house price of $600,000and a median vacant land price of $210,000.This represents an annual (Q2 2024– Q2 2025)median price growth of 4.3%for houses, accompanied by a -5.1% decline in house sales (to 244sales in Q2 2025). The vacant land market has become more affordable, however there were only 29 sales in Q2 2025. This confirms there is an undersupplied house market in Albury*, which has created a buffer against higher interest rates, thus more price growth. This suggests an ideal time for owners to capitalise on their investment. With very little new houses planned in 2025buyers must act fast, before there is further price growth. Meanwhile, the slight dip in land prices creates a window of opportunity for first-home buyers.
CHANGE FROM LAST


Albury£ will see approximately$230.4M ofnewprojectscommencingin2025
YEAR HALF YEAR

HOUSE SALES
HOUSE MEDIAN PRICE
HOUSE RENTAL PRICE
LAND SALES
LAND MEDIAN PRICE

MEDIAN PRICE Q2 2025

$600K $210K
MEDIAN PRICE Q2 2025
AVERAGE DAYS ON MARKET Q2 2025
50
AVERAGE DAYS ON MARKET Q2 2025


A key infrastructure project is Albury Wodonga Regional Hospital Early Works 1 - Northeast Building. An initiative from the New South Wales State Government, this will build a new 2 storey building that improves the health services for residents.
Residential projects include:
• 424& 426 Olive & Hume Streets Apartments (27Apartments)
• Hilltops By Birchmore Estate Subdivision Works (198 Lots)
• 513Wagga Road (4 Dwellings)
Despite a few residential and mixeduse projects in the pipeline, the supply of ready-to-sell stock remains limited and is not enough to answer demand. This suggests an undersupply remain, driving up prices for all property types.


AVERAGE VENDOR DISCOUNT*
Average vendor discount reflects the average percentage difference between the first list price and final sold price. A lower percentage difference (closer to 0.0%) suggests that buyers are willing to purchase close to the first asking price of a property.


Average house vendor discounts between Q2 2024and Q2 2025have tightened to -1.0%. Market conditions in Albury* still favourbuyers, as sellers are currently willing to accept below first listed prices. However, a tighter discount, and limited available and new planned stock signal a shift toward a seller’s market. Thus, buyers must act quickly.
The suburb of Albury has slightly outperformed the wider Albury LGA in house prices and remained onpar for vacantland over the past five years. This trend continued in 2025#, with the price difference between the suburb and the LGA narrowing even further.
Most of the houses sold in Albury* in 2024/2025#were in the premium priced point of $750,000and above (24.4%). Vacant land also saw the same pattern, with 43.2%of its sales in the premium price point of $275,000and above. This is encouraging for owners looking to capitalise on their investments. Affordable options are available, with 16.9%of houses sold under $449,999and 11.2%of vacant land sold under $199,999 Sales were evenly spread across various price points, reflecting a balanced market Overall, there is a home for buyers regardless of budget.
MARKET COMPARISON
(2640) House Albury LGA House Albury (2640) Vacant Land Albury LGA Vacant Land
The market comparison graph provides a comparative trend for median price


$450,000 to $549,999
$550,000 to $649,999
$650,000 to $749,999 $750,000 and above


Less than $199,999
$200,000 to $224,999
$225,000 to $249,999
$250,000 to $274,999
$275,000 and above
RENTAL GROWTH 2025€
House rental yields in Albury¥ were 4.0% as of June 2025, higher than Sydney Metro (2.7%). This is paired with a 2.2% growth in median house rental price in the past 12months to Q2 2025, at $560per week; and a -12.0% decline (to 198 rentals in Q2 2025)in the number of houses rented. The unit market showed the same pattern of higher rent and less units rented. These indicators confirm an undersupplied rental market in Albury¥, which is beneficial to investors.
2+ bedroom houses have provided investors with +10.3%rental growth annually, achieving a median rent of $430per week.
Albury¥ recorded a vacancy rate of 1.0%in June 2025,on par to Albury LGA’s 1.1% average but below Sydney Metro’s 1.6%. Vacancy rates have slightly decreased in the past 12months, which suggest an even tighter rental market. Further, a 1.0% vacancyrate is well below the Real Estate Institution of Australia’s healthy benchmark of 3.0%, indicating quicker occupancy of rental properties. This suggests a sustainable investment environment. With a more affordable entry price compared to Sydney Metro, Albury¥ is an attractive investment alternative for investors.
RENTAL VACANCY RATES 2025

Albury (2640) Albury LGA Sydney Metro REIA 'Healthy' Benchmark


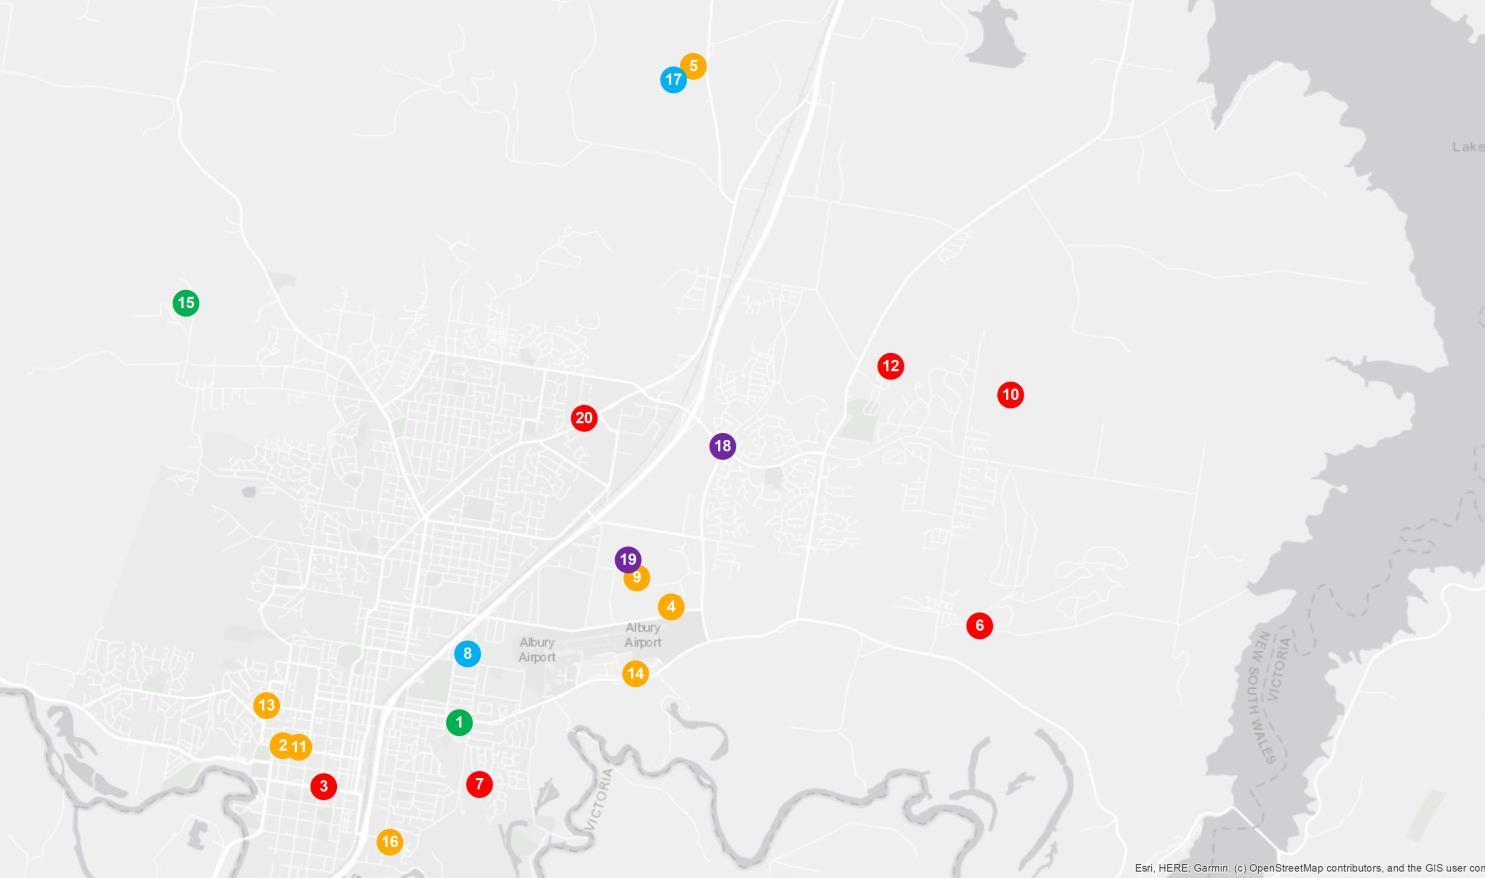
PROJECT DEVELOPMENT MAP 2025 ₳


RESEARCH SERVICES
Our research services span over every suburb, LGA,and state within Australia; captured in a variety of standard and customised products, andinclude:
• Advisory and consultancy
• Market analysis including profiling and trends
• Primary qualitative and quantitative research
• Demographic and target market analysis
• Geographic information mapping
• Project analysis including product and pricing recommendations
• Rental and investment return analysis
OUR KNOWLEDGE
Access to accurate and objective research is the foundation of all good property decisions.
OUR PEOPLE
Our research team is made up of highly qualified researchers who focus solely on propertyanalysis.


REFERENCES
* Albury sales market data and key indicators encapsulates aggregate property market conditions within the postcodes of 2640 and 2641.
** Estimated values are based on construction value provided by the relevant data authority and does not reflect commercial and/or re-sale value.
# 2025 encapsulates sales transactions for 1st Half 2025 (01/01/2025 – 30/06/2025) only, other years encapsulates sales transactions for the full year (i.e 01/01 to 31/12 of the relevant year)
€ Annual rental growth is a comparison between Q2 2024 (01/04/2024 – 30/06/2024) and Q2 2025 (01/04/2025 – 30/06/2025) house median rent figures.
¥ Albury rental market data encapsulates aggregate property conditions within the postcode of 2640.
§ Rental yields shown are as reported as of June 2025.
₳ Project development map showcases a sample of upcoming projects only, due to accuracy of addresses provided by the data provider for geocoding purposes.
£ Projects refers to the top developments within the postcodes of 2640 and 2641.
µ Estimated value is the value of construction costs provided by relevant data authority; it does not reflect the project’s sale/commercial value.
ψ Commencement date quoted for each project is an approximate only, as provided by the relevant data authority, PRD does not hold any liability to the exact date.
Source: APM Pricefinder, Cordell Connect database, SQM Research, Esri ArcGIS.
Disclaimer: PRD does not give any warranty in relation to the accuracy of the information contained in this report. If you intend to rely upon the information contained herein, you must take note that the information, figures and projections have been provided by various sources and have not been verified by us. We have no belief one way or the other in relation to the accuracy of such information, figures and projections. PRD will not be liable for any loss or damage resulting from any statement, figure, calculation or any other information that you rely upon that is contained in the material.
Prepared by PRD Research. © All medians and volumes are calculated by PRD Research. Use with written permission only. All other responsibilities disclaimed. © Copyright PRD 2025.