

Laurieton - Camden Haven Market Update 1st Half 2025

In Q1 2025,Camden Haven* recorded a median house price of $830,000 and a median unit price of $569,000.This is an annual (Q1 2024– Q1 2025) slight softening in prices, of -1.2% forhouses and -4.4% for units; which is most likely due to more homes being sold in the lower price point of the market. The number of sales is also quite small, with only 114house sales and 27-unit sales in Q1 2205, which can skew the data at times.Q1 2025 sales figures did hit a record high, suggesting a highly demanded market in Camden Haven*, but higher interest rates have also impacted property prices. There is now a slightly more affordable market in Camden Haven*, which opens a key opportunity for first home buyers and investors. 101 $830K $569K

HOUSE SALES
FROM LAST HOUSE MEDIAN PRICE HOUSE RENTAL PRICE
SALES


Camden Haven£ plans to see approx. $278.0Mofnewprojectscommencing constructionbetween2024and2026
HALF YEAR


There are several residential & mixeduse projects in Camden Haven* that are set to commence construction between 2024and 2026,including:
• Lake Cathie Bonny Hills Village Rainbow Beach (930 Land Lots)

MEDIAN PRICE Q1 2025 MEDIAN PRICE Q1 2025
AVERAGE DAYS ON MARKET Q1 2025
134
AVERAGE DAYS ON MARKET Q1 2025
• Catarina Estate (30 Dwellings)
• Hampton Shores (31 Dwellings)
• Rainbow Beach Estate (9 Units)
• Woodlands Estate (21 Land Lots)
• 201Ocean Drive (82 Land Lots)
There are several new ready-to-go housing stock planned, which will assist with current demand. Thatsaid, comparing the number of new houses planned (73) and sales in Q1 2025(114), this is not enough. This suggests that current softer property prices canbe temporary, and buyers must actfast


AVERAGE VENDOR DISCOUNT*
Average vendor discount reflects the average percentage difference between the first list price and final sold price. A lower percentage difference (closer to 0.0%) suggests that buyers are willing to purchase close to the first asking price of a property.


Average vendor discounts between Q1 2024and Q1 2025 have tightened slightly for houses and widened slightly for units, at discounts of -4.7% and -5.6% respectively. As of Q1 2025, the house and unit markets in Laurieton* continue to favourbuyers, as final sale prices remain below first listed price. However, with low number of ready-to-sell stock planned for construction, buyers should act fast.
The suburb of Laurieton has offered a slightly more affordable median house and unit price to the wider Port Macquarie-Hastings Local Government Area (LGA) in the past 4years into 2025#.This continued to be the case in 2025# forhouses; however, units have become a slightly more onpar compared to the wider LGA.
Most of the homes sold in the Camden Haven* in 2024/25# were in the premium price point of $1,000,000and above (28.1%). Thatsaid, almost an equal amount, of 24.7%, were in the most affordable price point of less than $699,999.Units, saw the most sales in the middle price bracket of $550,000 to $649,999(37.7%); with equal proportion (17.0%each) in the premium and most affordable price points. Overall, there are key opportunities for first home buyers. The market comparison graph provides a comparative trend for median price of houses and units over the past 5 years. The main LGA chosen was based on their proximity to the main suburb analysed, which is Laurieton.


MARKET COMPARISON
PRICE BREAKDOWN 2024/25#


$450,000 to $549,999
$550,000 to $649,999
$650,000to $749,999
$750,000and above
RENTAL GROWTH 2025€
House rental yields in the Camden Haven¥ were 3.4% as of March2025,higher than Sydney Metro (2.7%). Furthermore, median house rental price increased by 3.4%in the past 12months to Q1 2025,at $600per week. At the same the number of houses rented increased, by 4.8% (to 22 houses) in Q1 2025.The unit market shows a similar pattern, with median unit rental price increasing by 1.8% (to $458per week) but the number of units rented declining by -18.8%. This suggests a highly demanded rental market, in good news for investors.
3-bedroom houses have provided investors with +10.0% rental growth annually, achieving a median rent of $550per week.
The Camden Haven¥ area had a vacancy rate of 0.9%in March2025, above Port MacquarieHastings LGA’s average of 0.8%but below Sydney Metro’s 1.3%. Vacancy rates have fluctuated in the past 12 months, butoverall showed a slightly declining pattern, indicating an even tighter rental market. Further, a 0.9% vacancy rate is well below the Real Estate Institution of Australia’s healthy benchmark of 3.0%, thus quicker occupancy of rental homes in Camden Haven¥ .
RENTAL VACANCY RATES 2025

Laurieton (2443) Port Macquarie-Hastings LGA Sydney Metro REIA 'Healthy' Benchmark

RENTAL
YIELD 2025§
CamdenHaven (2443)¥

PROJECT DEVELOPMENT MAP 2024-2026 ₳
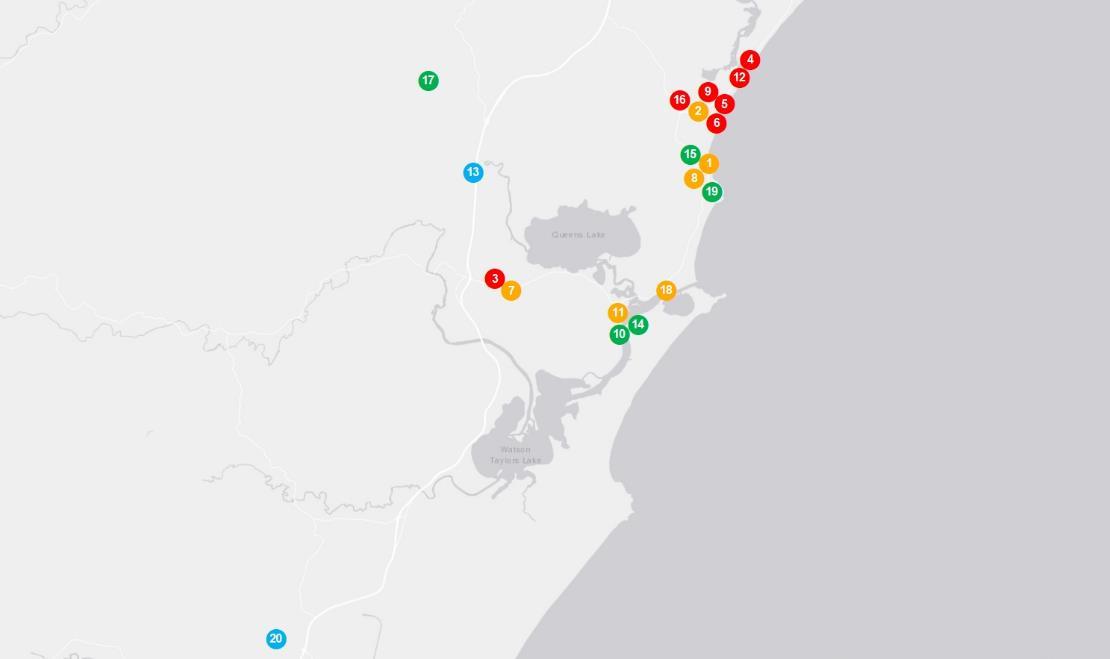

LAURIETON


RESEARCH SERVICES
Our research services span over every suburb, LGA,and state within Australia; captured in a variety of standard and customised products, andinclude:
• Advisory and consultancy
• Market analysis including profiling and trends
• Primary qualitative and quantitative research
• Demographic and target market analysis
• Geographic information mapping
• Project analysis including product and pricing recommendations
• Rental and investment return analysis
OUR KNOWLEDGE
Access to accurate and objective research is the foundation of all good property decisions.
OUR PEOPLE
Our research team is made up of highly qualified researchers who focus solely on propertyanalysis.


REFERENCES
* Camden Haven sales market data and key indicators encapsulates aggregate property market conditions within the suburbs of 2439, 2443, and 2445.
** Estimated values are based on construction value provided by the relevant data authority and does not reflect commercial and/or re-sale value.
# 2025 encapsulates sales transactions for Q1 (01/01/2025 – 31/03/2025) only, other years encapsulates sales transactions for the full year (i.e 01/01 to 31/12 of the relevant year).
€ Annual rental growth is a comparison between Q1 2024 (01/01/2024 – 31/03/2024) and Q1 2025 (01/01/2025 – 31/03/2025) house median rent figures.
¥ Camden Haven rental market data encapsulates aggregate property conditions within the postcode of 2443.
§ Rental yields shown are as reported as of March 2025.
₳ Project development map showcases a sample of upcoming projects only, due to accuracy of addresses provided by the data provider for geocoding purposes.
£ Projects refers to the top developments within the suburbs of 2439, 2443, and 2445.
µ Estimated value is the value of construction costs provided by relevant data authority; it does not reflect the project’s sale/commercial value.
ψ Commencement date quoted for each project is an approximate only, as provided by the relevant data authority, PRD does not hold any liability to the exact date.
Source: APM Pricefinder, Cordell Connect database, SQM Research, Esri ArcGIS.
Disclaimer: PRD does not give any warranty in relation to the accuracy of the information contained in this report. If you intend to rely upon the information contained herein, you must take note that the information, figures and projections have been provided by various sources and have not been verified by us. We have no belief one way or the other in relation to the accuracy of such information, figures and projections. PRD will not be liable for any loss or damage resulting from any statement, figure, calculation or any other information that you rely upon that is contained in the material.
Prepared by PRD Research. © All medians and volumes are calculated by PRD Research. Use with written permission only. All other responsibilities disclaimed. © Copyright PRD 2024.
