
Southport Market Update 2nd Half 2025

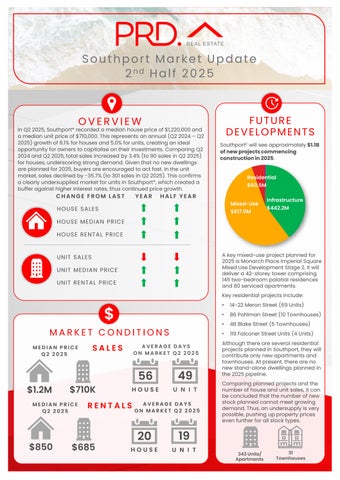
In Q2 2025, Southport* recorded a median house price of $1,220,000and a median unit price of $710,000.This represents an annual (Q2 2024 – Q2 2025)growth of 6.1% for houses and 5.0% forunits, creating anideal opportunity for owners to capitalise on their investments. Comparing Q2 2024and Q2 2025,total sales increased by 3.4%(to 90 sales in Q2 2025) for houses, underscoring strong demand. Given that no new dwellings are planned for 2025, buyers are encouraged to actfast. In the unit market, sales declined by -35.7% (to 301sales in Q2 2025). This confirms a clearly undersupplied market for units in Southport*, which created a buffer against higher interest rates, thus continued price growth.

HOUSE SALES YEAR HALF YEAR CHANGE FROM LAST HOUSE MEDIAN PRICE HOUSE RENTAL PRICE
SALES


Southport£ will see approximately$1.1B ofnewprojectscommencing constructionin2025


A key mixed-use project planned for 2025is MonarchPlace Imperial Square Mixed Use Development Stage 2. It will deliver a 42-storey tower comprising 145two-bedroom palatial residences and 80serviced apartments.
Key residential projects include:

• 14-22 Meron Street (69 Units)
• 86 Pohlman Street (10 Townhouses)
• 48 Blake Street (5 Townhouses)
• 119 Falconer Street Units (4 Units)
MEDIAN PRICE Q2 2025 MEDIAN PRICE Q2 2025
AVERAGE DAYS ON MARKET Q2 2025
56 $1.2M $710K
AVERAGE DAYS ON MARKET Q2 2025
Although there are several residential projects planned in Southport, they will contribute only new apartments and townhouses. Atpresent, there are no new stand-alone dwellings planned in the 2025pipeline.
Comparing planned projects and the number of house and unit sales, it can be concluded that the number of new stock planned cannot meet growing demand. Thus, an undersupply is very possible, pushing up property prices even further for all stock types.


AVERAGE VENDOR DISCOUNT*
Average vendor discount reflects the average percentage difference between the first list price and final sold price. A lower percentage difference (closer to 0.0%) suggests that buyers are willing to purchase close to the first asking price of a property.

Average vendor discounts between Q2 2024and Q2 2025 have swung from a premium to a discount of-2.3%for houses and -1.1% for units. Market conditions in Southport* now slightly favour buyers, with owners willing to accept below the initial listed prices. This creates an opportunity for buyers to enter, especially with higher median house and unit prices in the past 12months toQ2 2025.


The suburb of Southport has historically provided a more affordable market than the Gold Coast Local Government Area (LGA) in bothhouse and unit median prices for the past 5years. This continued tobe the case in 2025#, even whilst both the suburb and the LGA saw price growth.
The dominant proportion of homes sold in Southport* in 2025#were in the most affordable price point of less than $1,049,999(35.1%)for houses, in good news for first-home buyers. Meanwhile, 24.6%of units sold were in the middlerange price bracket $650,000 - $749,999.Notably, the premium price bracket in Southport* remain strong, with 31.0%of units sold above $1.35M and 23.3%of units sold above $850,000.This is good news forowners looking to capitalise ontheir investments in Southport*
MARKET COMPARISON
Southport (4215) House
Gold Coast City (LGA) House Southport (4215) Unit Gold Coast City (LGA) Unit
The market comparison graph provides a comparative trend for median price of houses and units over the past 5 years. The main LGA chosen was based on their proximity to the main suburb analysed, which is Southport.


PRICE BREAKDOWN 2025


Less than $549,999 $550,000 to $649,999
$650,000 to $749,999 $750,000 to $849,999 $850,000 and above
RENTAL GROWTH 2025€
House rental yields in Southport¥ were 3.8%as of June 2025, onpar with Gold Coast (3.8%) but higher than Brisbane Metro (3.2%). This is paired with a 6.3% growth in the median house rental price in the past 12 months to Q2 2025,to $850per week, and a -46.6% decrease in the number of house rented (to 86 rentals). Average days on the market has declined to a historical low level of 20 days. There is an undersupplied house rental market, benefitting investors.
4+ bedroom houses have provided investors with +15.2% rental growth annually, achieving a median rent of $1,140 per week.
Southport¥ recorded a vacancy rate of 0.8%in June 2025,below the Gold Coast Main average of 1.7% and Brisbane Metro’s 0.9%. Vacancy rates have increased in the past 6 months, due to invertors returning to the market. Thatsaid, a 0.8% vacancyrate is well below the Real Estate Institution of Australia’s healthy benchmark of 3.0%, indicating a tightrental demand and quicker occupancy of rental homes in Southport¥. This creates a conducive environment for investors, even if house and unit sale prices have increased in the past 12months to Q2 2025.
RENTAL VACANCY RATES 2025

Southport (4215) Gold Coast Main Brisbane Metro REIA 'Healthy' Benchmark


Southport¥
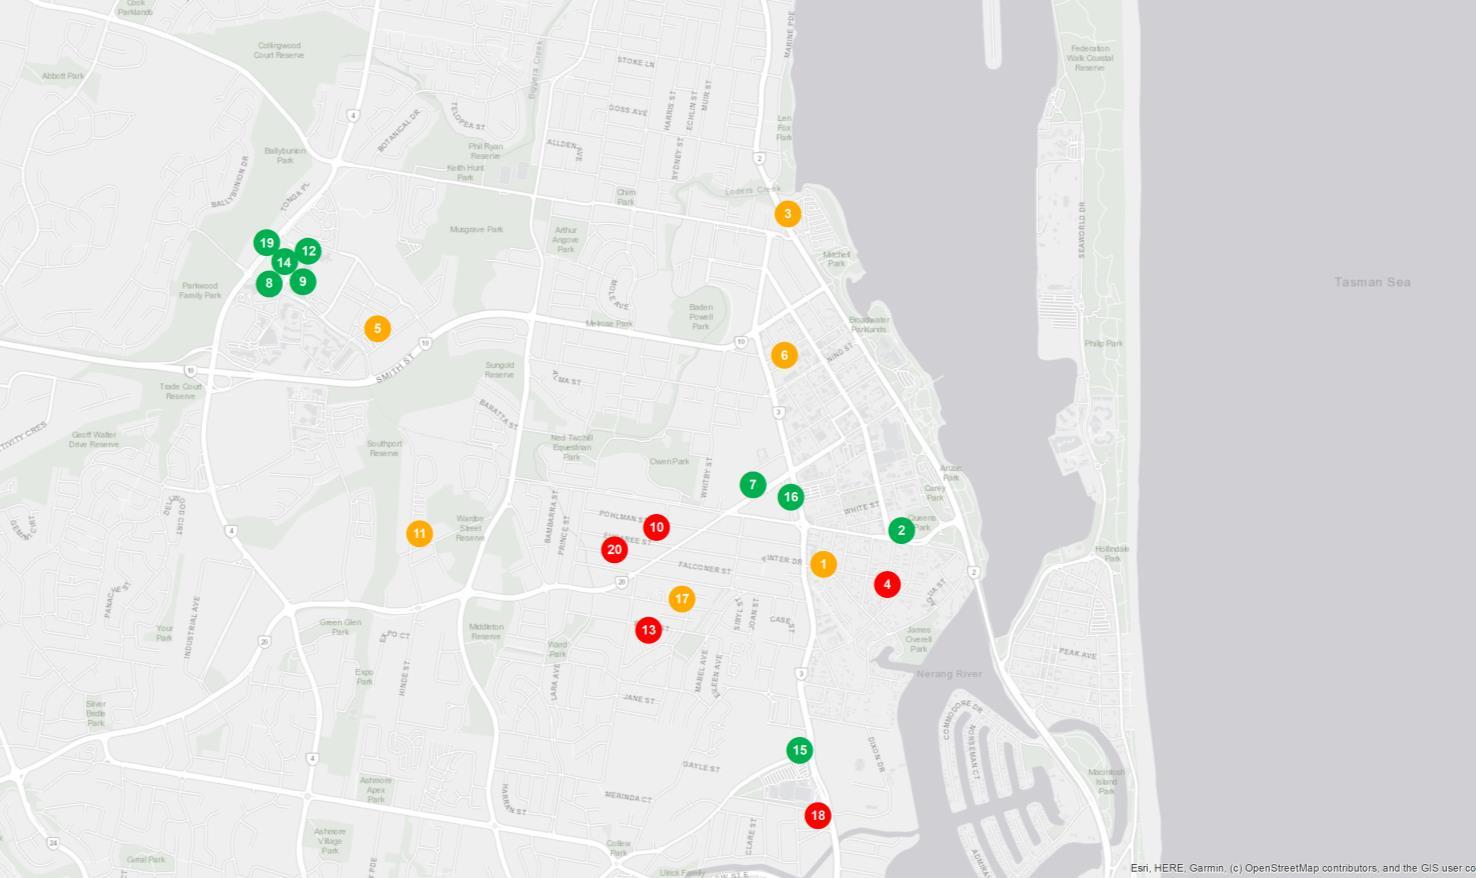
PROJECT DEVELOPMENT MAP 2025 ₳


RESEARCH SERVICES
Our research services span over every suburb, LGA,and state within Australia; capturedin a variety of standard and customised products, andinclude:
• Advisory and consultancy
• Market analysis including profiling and trends
• Primary qualitative and quantitative research
• Demographic and target market analysis
• Geographic information mapping
• Project analysis including product and pricing recommendations
• Rental and investment return analysis
OUR KNOWLEDGE
Access to accurate and objective research is the foundation of all good property decisions.
OUR PEOPLE
Our research team is made up of highly qualified researchers who focus solely on property analysis.


REFERENCES
* Southport sales market data and key indicators encapsulates aggregate property market conditions within the suburbs of Southport, Biggera Waters and Labrador.
** Estimated values are based on construction value provided by the relevant data authority and does not reflect commercial and/or re-sale value.
# 2025 encapsulates sales transactions for 1st Half 2025 (01/01/2025 – 30/06/2025) only, other years encapsulates sales transactions for the full year (i.e 01/01 to 31/12 of the relevant year)
€ Annual rental growth is a comparison between Q2 2024 (01/04/2024 – 30/06/2024) and Q2 2025 (01/04/2025 – 30/06/2025) house median rent figures.
¥ Southport rental market data encapsulates aggregate property conditions within the postcode of 4215.
§ Rental yields shown are as reported as of June 2025.
₳ Project development map showcases a sample of upcoming projects only, due to accuracy of addresses provided by the data provider for geocoding purposes.
£ Projects refers to the top developments within the suburbs of Southport, Biggera Waters and Labrador.
µ Estimated value is the value of construction costs provided by relevant data authority, it does not reflect the project’s sale/commercial value.
ψ Commencement date quoted for each project is an approximate only, as provided by the relevant data authority, PRD does not hold any liability to the exact date.
Source: APM Pricefinder, Cordell Connect database, SQM Research, Esri ArcGIS.
Disclaimer: PRD does not give any warranty in relation to the accuracy of the information contained in this report. If you intend to rely upon the information contained herein, you must take note that the information, figures and projections have been provided by various sources and have not been verified by us. We have no belief one way or the other in relation to the accuracy of such information, figures and projections. PRD will not be liable for any loss or damage resulting from any statement, figure, calculation or any other information that you rely upon that is contained in the material.
Prepared by PRD Research. © All medians and volumes are calculated by PRD Research. Use with written permission only. All other responsibilities disclaimed. © Copyright PRD 2025.