


Buying near Sydney doesn’t have to mean compromising on lifestyle or future value. This report highlights key suburbs within 20km of the CBD that strike a balance between value, strong rental yields, and access to everyday essentials like schools, transport, parks and shopping precincts.
Sydney Metro’s property market remains resilient. Over the year to Q1 2025:
• House prices rose moderately by 1.4%, now sitting at $1,474,750
• Unit prices eased slightly by 0.3% to $854,968
Quarterly trends (Q4 2024 to Q1 2025) reflect this softness in the unit market, with house prices rising just 0.5% and unit values falling 0.3%; a result of high interest rates and broader economic conditions. Sales volumes also declined:
• House sales dropped 4.4% (4,698 transactions)
• Unit sales fell 11.4% (9,143 transactions)
This drop in activity reflects tightening supply; particularly for detached houses.
Sydney is set to see $33.0 billion worth of new projects in 2025. Most are mixed-use developments, bringing 21,429 new units to market but only 599 stand-alone houses. This imbalance signals a continued shift toward higherdensity living.
For buyers, especially those seeking detached homes, this limited pipeline presents an opportunity to secure property before further price pressures build. Meanwhile, first home buyers may find more accessible options in townhouses (555) and residential land lots (1,034), which still offer entry-level affordability.
Whether you’re a first home buyer looking for a foothold or an investor seeking high-yield opportunities, this report provides data-driven insights to support smart, confident decisions. We combine on-the-ground expertise with indepth research to help you uncover real value in today’s market.


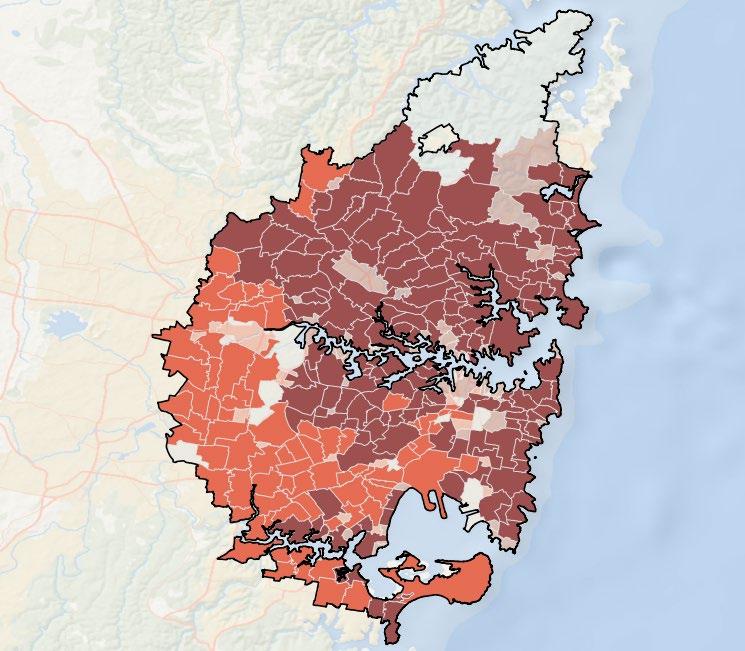
This report analyses all suburbs within a 20km radius of the Sydney CBD. The following criteria were considered:
• Property trends criteria: all suburbs have a minimum of 20 sales transactions for statistical reliability purposes. Based on market conditions, suburbs have either positive, or as close as possible to neutral, price growth between 2023 and 2024/25*.
• Investment criteria: as of March 2025, suburbs considered will have an on-par or higher rental yield than Sydney Metro and an on-par or lower vacancy rate.
• Affordability criteria: featured suburbs have a median price below Sydney Metro. We then calculate the percentage premiums that need to be added to the New South Wales (NSW) average home loan, which was $794,831** as of the March quarter of 2025. Premiums of 51.8% for houses and -33.9% for units were needed to reach the median price of key suburbs (3 for houses and 3 for units) highlighted in this report. This percentage is below what is required to reach Sydney Metro’s median prices (85.5% for houses and 7.6% for units). This ratio makes the key suburbs identified in this report more affordable to buyers, creating an opportunity for first home buyers.
• Development criteria: suburbs chosen have new developments commencing construction for 2025, with a high proportion of commercial and infrastructure projects. This ensures the suburbs chosen show signs of sustainable economic growth. Suburbs featured show a reasonable amount of new ready-to-sell stock planned for construction to ensure buyers have access to new housing supply.
• Liveability criteria: all identified suburbs have low crime rates, availability of amenities within a 5km radius (i.e., schools, green spaces, public transport, shopping centres, and health care facilities), and an unemployment rate on par or lower in comparison to the NSW average (as determined by the Department of Jobs and Small Business, December Quarter 2024 release).


In 2024/25, most houses sold in Sydney Metro (61.5%) were priced in the premium bracket of $1.8 million and above. Options below this threshold remain limited:
• Only 11.0% of houses sold were under $1.2 million
• The mid-range ($1.2M–$1.8M) made up a minor portion of transactions. For units, the price distribution is more accessible:
• 30.1% of units sold were priced under $699,999, offering relative affordability.
• 36.0% were sold at $1 million and above, aligning more closely with the premium housing segment.
This breakdown signals that while affordability remains a challenge in the standalone housing market, units present viable opportunities for firsthome buyers and value-seeking investors.


Less than $1,199,999
$1,200,000 to $1,399,999
$1,400,000 to $1,599,999
$1,600,000 to $1,799,999
$1,800,000 and above
As of Q1 2025, vendor discounts for houses in Sydney remain present, though they’ve moderated to an average of 3.9%, indicating sellers are still achieving close to their asking price.
In contrast, unit vendor discounts have shifted direction, moving from a premium to an average discount of -1.3%. This suggests that buyers in the unit market now have more room to negotiate, particularly as mid-2024 marked the start of discounting trends for units and this environment has continued into 2025.
These dynamics reflect a market that still favours sellers, particularly in the housing segment, where buyers are often required to pay above the listed price. However, for units, the emerging discount trend presents an entry point for buyers.


$699,999 $700,000 to $799,999 $800,000 to $899,999 $900,000 to $999,999 $1,000,000 and above


Data not available
$0 - $500,000
$500,000 - $800,000
$800,000 - $1,000,000
$1,000,000 - $2,000,000
$2,000,000+

As of March 2025, house rental yields in Sydney Metro stood at 2.7%, trailing behind Melbourne Metro (3.1%) and Brisbane Metro (3.2%). Despite the comparatively lower yield, Sydney's median house rent rose by 2.1% over the past year, reaching $955 per week, alongside a 26.0% increase in the number of houses rented (5,712 rentals in Q1 2025). A similar pattern is observed in the unit market, where the median rent increased by 1.7%, now sitting at $760 per week. The volume of units rented also surged by 35.2%, with 29,290 transactions recorded in Q1 2025. These trends point to sustained demand for both houses and units, making Sydney an increasingly appealing option for property investors.
In March 2025, Sydney Metro recorded a vacancy rate of 1.3%, slightly lower than Melbourne Metro (1.5%) but above Brisbane Metro (0.9%). Vacancy rates have fluctuated over the past year, influenced by changing investor activity. Still, Sydney’s figure remains below the Real Estate Institute of Australia’s 3.0% benchmark, suggesting strong rental uptake and quicker tenant placement. This tight vacancy environment, especially in the unit segment, reinforces Sydney’s appeal for investors seeking stable returns and steady demand. Among all dwelling types, 2-bedroom houses delivered the highest annual rental growth, rising +25.0% to $750 per week. On the unit side, 1-bedroom units offered the strongest rental return, despite a marginal decline of -4.4%, settling at $650 per week


Located
$1,147,500 $930,000 $1,087,500 $1,250,000


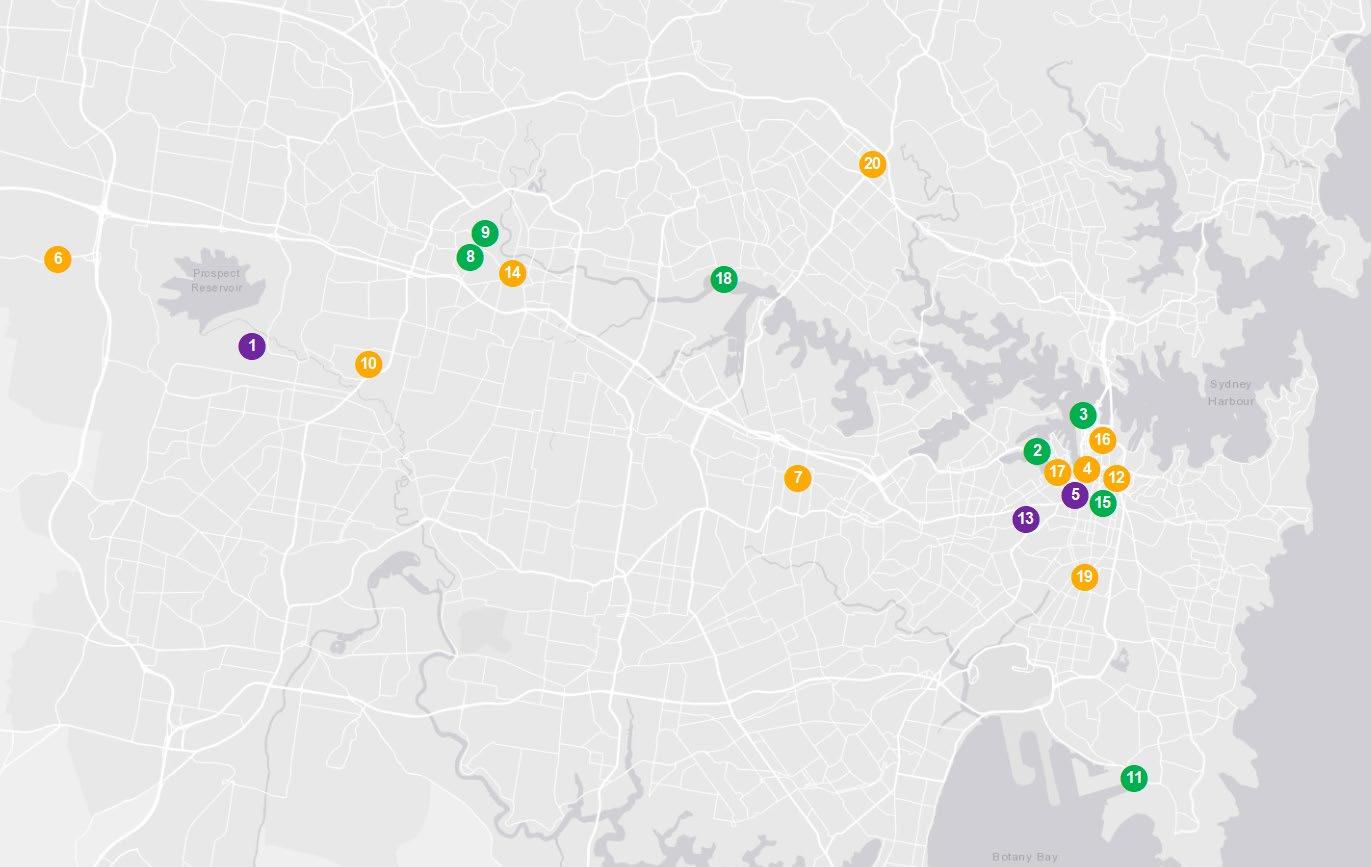


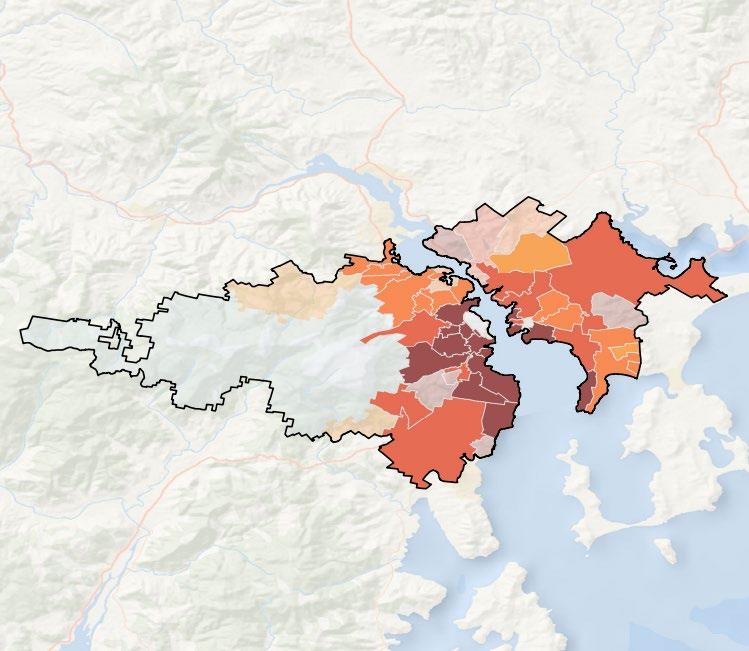
To provide more options for first home buyers, the following seven additional suburbs for houses and units offer affordable alternatives to Sydney Metro’s median prices. These are in addition to the top 3 affordable and liveable suburbs for houses (Guildford, Chester Hill and Granville), and units (Punchbowl, Lakemba and Harris Park) featured earlier in the report. While these suburbs didn’t meet all our criteria to be classified as ‘top suburbs’, they were selected using the same methodology and still represent strong value for buyers seeking more budget-friendly opportunities.


Melbourne’s property market is in transition; cooling in price, but rich in potential. Between Q1 2024 and Q1 2025, median prices declined:
• Houses: down 2.0% to $934,500
• Units: down 2.6% to $610,327
This shift follows the impact of 13 consecutive cash rate rises in 2022, which pushed up borrowing costs and reshaped buyer expectations.
Sales volumes have also dipped:
• House sales fell 7.1% (to 7,773)
• Unit sales dropped 6.0% (to 7,143)
This softer demand has reduced competition, opening a rare window for first home buyers and investors to enter the market under more favourable terms.
In 2025, Melbourne is set to see $68.0 billion in new developments, including:
• 5,587 units
• 3,419 townhouses
• 2,533 stand-alone houses
While this will help ease supply pressure over time, demand, especially for detached homes, continues to outpace available stock.
Right now, conditions favour buyers: price dips, less competition, and more supply coming. But with signs of resilience returning and development activity picking up, the window may not stay open for long.
Whether you’re:


• A first-home buyer looking for an affordable entry point
• An investor chasing strong yields and low vacancy rates
• Or a market-watcher seeking areas with long-term fundamentals
This guide highlights Melbourne’s most promising suburbs within 20km of the CBD, chosen for their accessibility, livability, and growth potential. Backed by hard data and local insights, this report will help you for navigate Melbourne’s ever-evolving property landscape.

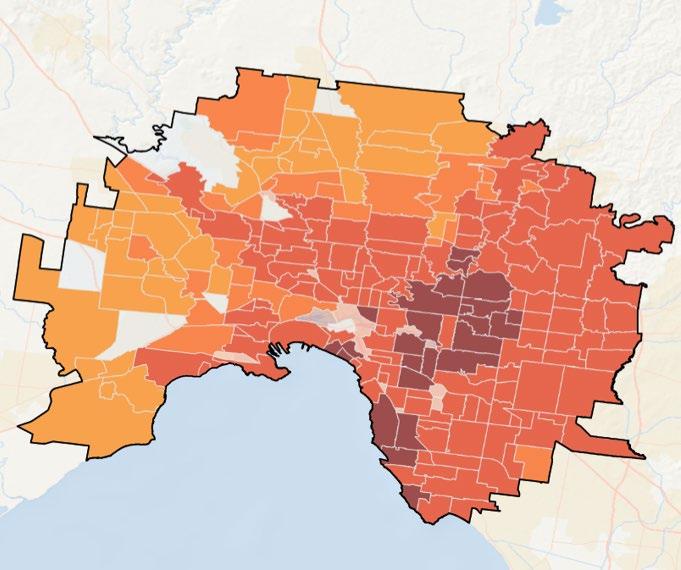
This report analyses all suburbs within a 20km radius of the Melbourne CBD. The following criteria were considered:
• Property trends criteria: all suburbs featured have a minimum of 20 sales transactions for statistical reliability purposes. Based on market conditions, suburbs have either positive, or as close as possible to neutral, price growth between 2023 and 2024/25*.
• Investment criteria: as of March 2025, suburbs chosen will have an on-par or higher rental yield than Melbourne Metro and an on-par or lower vacancy rate.
• Affordability criteria: chosen suburbs have a median price below Melbourne Metro. We calculated the percentage premiums that needed to be added to the Victorian (VIC) average home loan, which was $627,744** as of the March quarter of 2025. Premiums of 9.8% for houses and -21.9% for units were needed to reach the median price of top suburbs (3 for houses and 3 for units) highlighted in this report. This rate is below what is required to reach Melbourne Metro’s median prices (48.9% for houses and -2.8% for units). This makes the suburbs identified in this report more affordable to buyers, creating an opportunity for first-time home buyers.
• Development criteria: suburbs chosen have new developments commencing construction for 2025, with a high proportion of commercial and infrastructure projects. This ensures the suburbs show signs of sustainable economic growth. Suburbs chosen must also show a reasonable amount of new ready-to-sell stock planned for construction to ensure buyers have access to new housing supply.
• Liveability criteria: all identified suburbs have low crime rates, availability of amenities within a 5km radius (i.e., schools, green spaces, public transport, shopping centres, and health care facilities), and an unemployment rate on par or lower in comparison to the VIC average (as determined by the Department of Jobs and Small Business, December Quarter 2024 release).


Between Q1 2024 and Q1 2025, average vendor discounts widened to -1.4% for houses and -3.6% for units in Melbourne Metro. These discounts reflect a market still favouring buyers, with many sellers accepting slightly lower prices than initially listed.
The steepest discounts occurred in Q3 2024 for houses (-4.0%) and in Q4 2024 for units (-4.0%). With those peaks behind us and limited new stock projected for the near future, conditions may become more competitive, making this a key time for buyers to act.
A significant proportion of house sales (41.3%) were in the premium price bracket of $1,050,000 and above. For units, the largest share of transactions (32.5%) occurred at $750,000 and above, highlighting continued demand for higher-end properties even amid softer price conditions.
At the same time, first home buyers were active in more affordable brackets as 38.2% of houses sold for less than $749,999 and 22.9% of units were sold below $449,999.
These figures suggest that opportunities exist across both ends of the market, from premium investment-grade stock to accessible entry-level properties.


2,000 4,000 6,000 8,000 10,000 12,000 14,000
SOLD HOUSE S SOLD


$1,000,000
$2,000,000+
Melbourne Metro recorded a house rental yield of 3.1% as of March 2025, outperforming Sydney Metro (2.7%) and matching Brisbane Metro (3.2%). This strong result came alongside a 6.5% annual increase in the median house rent, which reached $660 per week in Q1 2025. The best performing rental property types were 2-bedroom houses with a +6.7% growth to $600 per week and 1-bedroom units with a +16.7% growth to $490 per week
These rental trends occurred despite an 11.1% decline in house rental volumes, down to 7,676 properties in Q1 2025. These figures reflect a tight and undersupplied rental market, where reduced availability is placing upward pressure on prices. The conditions present attractive opportunities for investors, particularly given Melbourne’s lower entry prices compared to Sydney.
As of March 2025, Melbourne Metro’s rental vacancy rate stood at 1.5%, slightly above Sydney Metro (1.3%) and Brisbane Metro (0.9%). Over the past six months, Melbourne has shown a clear downward trend in vacancy, highlighting a market that is tightening further. Importantly, Melbourne’s vacancy rate remains well below the Real Estate Institute of Australia’s healthy benchmark of 3.0%, signalling strong demand and rapid tenant turnover
These conditions create a favourable environment for investors, particularly those targeting more affordable housing or unit stock early in the year.
HOUSES UNITS


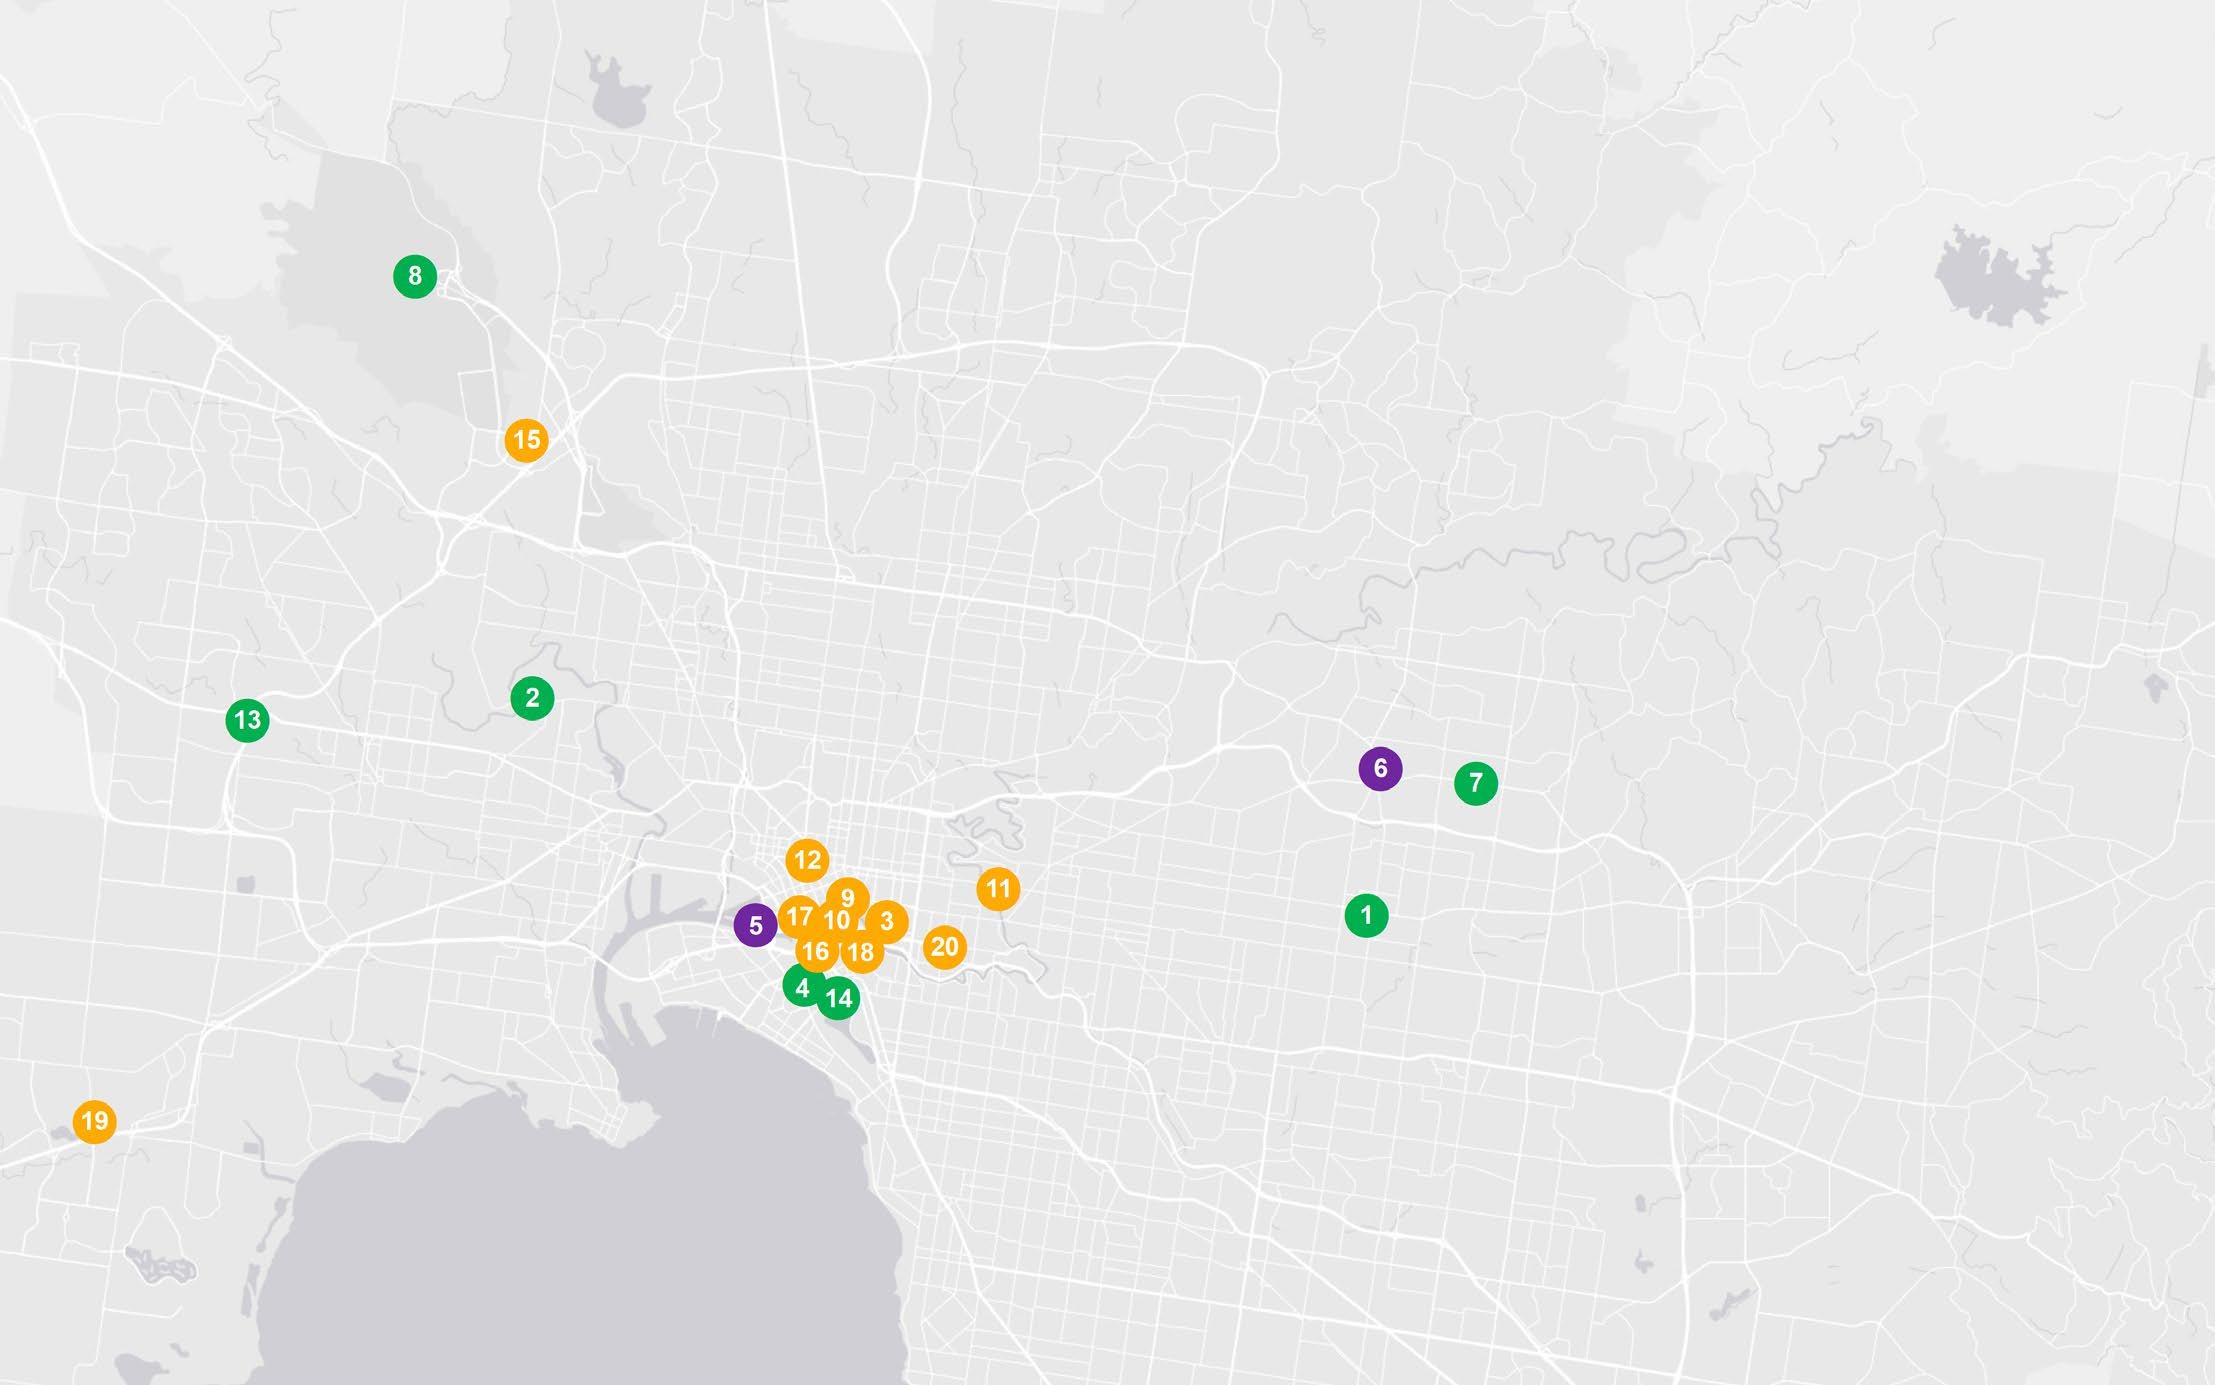


To provide more options for first home buyers, the following seven additional suburbs for houses and units offer affordable alternatives to Melbourne Metro’s median prices. These are in addition to the top 3 affordable and liveable suburbs for houses (St Albans, Epping and Sunshine West), and units (Williams Landing, Maribyrnong and Epping) featured earlier in the report. While these suburbs didn’t meet all our criteria to be classified as ‘top suburbs’, they were selected using the same methodology and still represent strong value for buyers seeking more budget-friendly opportunities.


Hobart Metro’s property market is showing quiet but important changes. Over the past 12 months:
• Median house prices rose 1.1% to $707,506
• Quarterly growth was slightly stronger at 1.4% (Q4 2024 to Q1 2025), highlighting the resilience of detached homes
• Unit prices, in contrast, fell 2.1% year-on-year to $530,640, and declined a further 1.1% in the last quarter, creating more accessible entry points for buyers
• House sales dropped 34.9% (403 sales in Q1 2025)
• Unit sales declined 39.0% (150 sales in Q1 2025)
This drop reflects a tight market with limited stock especially for houses. Despite fewer transactions, demand remains and prices are holding firm.
Falling unit prices and reduced competition offer new opportunities for first-home buyers. While house supply is still limited, affordability has improved in the unit segment, helping more buyers take their first step into the market.
Hobart is poised for a wave of development activity, with an estimated $1.7 billion in projects scheduled:
• 657 new houses
• 323 units/apartments
• 41 townhouses
• 261 land lots
This injection of supply should help balance the market, ease pressure on prices, and support future growth.
• First-home buyers seeking affordable entry points
• Investors watching vacancy trends and capital growth
• Anyone curious about Hobart’s evolving market Inside, we break down top-performing suburbs, rental trends, and key data to give you a clear view of what’s next without the guesswork.


This report analyses all suburbs within a 10km radius of the Hobart CBD. The following criteria were considered:
• Property trends criteria: all chosen suburbs have a minimum of 10 sales transactions for statistical reliability purposes. Based on market conditions, suburbs have either positive, or as close as possible to neutral, price growth between 2023 and 2024/25*.
• Investment criteria: as of March 2025, the suburbs considered have an on-par or higher rental yield than Hobart Metro and an on-par or lower vacancy rate.
• Affordability criteria: chosen suburbs have a median price Hobart Metro. We then calculate the percentage premiums that need to be added to the Tasmanian (TAS) average home loan, which was $487,020** in the March quarter of 2025. Premiums of 21.1% for houses and 6.8% for units were needed to reach the median price of the suburbs (3 for houses and 3 for unit) highlighted in this report. This is below what is required to reach Hobart Metro’s median prices (45.3% for houses and 9.0% for units). This makes the suburbs identified more affordable for buyers, particularly for first home buyers.
• Development criteria: suburbs chosen have new developments commencing construction for 2025, with a high proportion of commercial and infrastructure projects. This ensures the suburbs show signs of sustainable economic growth. Suburbs chosen must also show a reasonable amount of new ready-to-sell stock planned for construction to ensure buyers have access to some supply.
• Liveability criteria: all identified suburbs have low crime rates, availability of amenities within a 5km radius (i.e., schools, green spaces, public transport, shopping centres, and health care facilities), and an unemployment rate on par or lower in comparison to the TAS average (as determined by the Department of Jobs and Small Business, December Quarter 2024 release).


Between Q1 2024 and Q1 2025, average vendor discounts in Hobart Metro tightened to –0.2% for both houses and units. This indicates a market that continues to favour sellers, with properties still transacting just slightly below their initial listing prices.
The narrowing of discounts signals increasing competition, particularly for houses. With discounts now minimal, buyers may need to act swiftly as market conditions tilt further in favour of sellers.
Sales volumes for both houses and units declined in Q1 2025, consistent with tightening market conditions. Median house prices have remained above $700,000, while unit prices have hovered around $530,000; showing some softening over time. This data reflects an overall cooling in transactional activity but continued stability in pricing, particularly for houses.
Across the Hobart Metro in 2024/25, the largest share of house sales (30.9%) occurred in the $650,000–$849,999 bracket. 28.5% of houses were sold for less than $449,999, suggesting some affordable options remain in the lowerpriced segment.
For units, the most common price band was $700,000 and above, accounting for 25.6% of all unit sales and highlighting demand for premium stock. However, 24.7% of units sold in the $500,000–$599,999 range, and 23.2% fell between $400,000–$499,999, offering a variety of entry points across budgets. These figures suggest that buyers can find options at both ends of the market, with comparable proportions of houses and units occupying similar price tiers.


House Sales Unit Sales


$350,000 - $500,000
$500,000 - $650,000
$650,000 - $800,000
$800,000+
Hobart Metro led the nation in house rental yields at 3.6% as of March 2025, surpassing both Sydney (3.1%) and Melbourne (2.7%). Hobart’s performance was supported by a 3.5% rise in the median house rent over the past 12 months, reaching $590 per week in Q1 2025. This rise occurred alongside a 15.9% drop in house rentals, with only 588 transactions recorded in Q1 2025
A similar trend was observed in the unit market where the median rent for units increased by 5.3% (to $495 per week), while the number of unit rentals fell by 16.6% (down to 388 rentals in Q1 2025). The tightening of supply and rising rents highlight a competitive and undersupplied rental market, which are favourable conditions for property investors.
The strongest performing property type was 2-bed houses with a +4.2% increase to $500/week and 2-bed units with a +7.3% increase to $395/week. As of March 2025, Hobart Metro recorded a remarkably low rental vacancy rate of just 0.5%, which is well below Sydney Metro (1.3%) and Melbourne Metro (1.5%).
This places Hobart significantly under the Real Estate Institute of Australia's 'healthy' vacancy benchmark of 3.0%, reinforcing its reputation as a tight and investor-friendly market. Furthermore, over the past six months, Hobart’s vacancy rates have either remained stable or declined, reflecting reduced availability and increasing competition for rental properties. The environment is particularly favourable for investors, with strong yields and tight supply offering attractive, long-term returns.


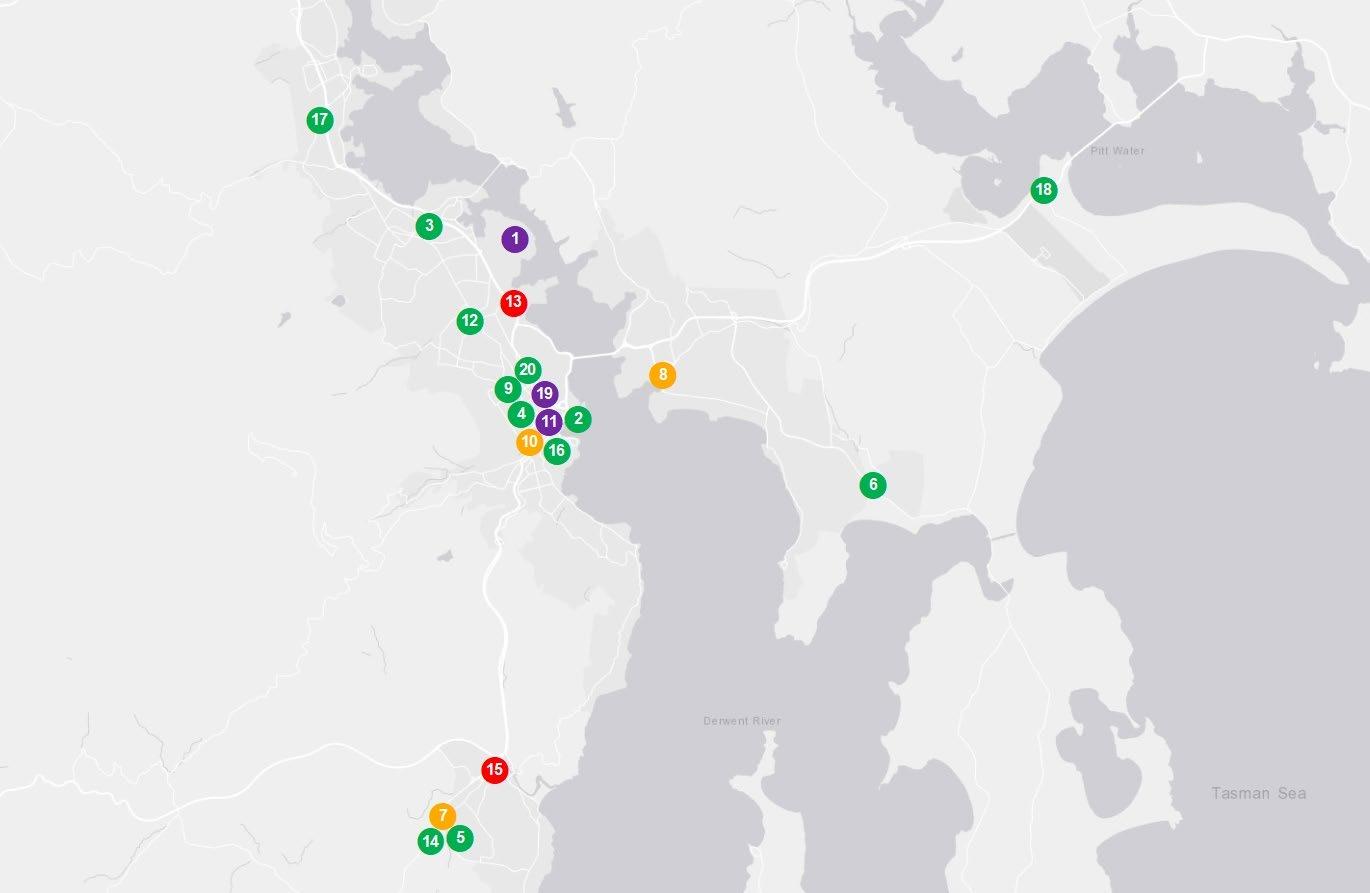


To provide more options for first home buyers, the following seven additional suburbs for houses and units offer affordable alternatives to Hobart Metro’s median prices. These are in addition to the top 3 affordable and liveable suburbs for houses (Berriedale, Rokeby and Risdon Vale), and units (Mount Nelson, Glenorchy and New Town) featured earlier in the report. While these suburbs didn’t meet all our criteria to be classified as ‘top suburbs’, they were selected using the same methodology and still represent strong value for buyers seeking more budget-friendly opportunities.


Brisbane's property market continues to show steady strength amidst changing economic tides. Over the past year (Q1 2024 to Q1 2025), house prices rose by a solid 6.8%, pushing the median value to $989,818. Units performed even more impressively, climbing 12.8% to a median price of $698,479.
That said, price momentum has started to cool in recent months. From Q3 2024 to Q1 2025, house prices grew by a modest 0.9%, while unit prices edged up by 1.6%. These figures are likely a reflection of broader economic uncertainty and elevated interest rates.
Despite rising prices, sales activity has taken a notable dip. Year-on-year, house sales dropped by 20.8%, with just 6,847 transactions recorded. Unit sales fell even further, down 23.5% to 3,725 transactions. This significant decline points to a persistent undersupply of available homes, driven by reduced turnover and affordability pressures. Put simply, there aren’t enough homes to meet demand, especially for buyers seeking a foothold in Brisbane’s increasingly competitive market.
In response to this growing demand, Brisbane Metro is preparing for a construction surge. Approximately $21.3 billion worth of projects are scheduled to begin in 2025, with a strong focus on infrastructure and mixed-use developments
But not all supply is created equal. The city’s next wave of housing will lean heavily toward higher-density living, with plans for:
• 10,108 new units
• 2,262 townhouses
• 13,194 residential land lots
By contrast, just 186 new stand-alone houses are in the pipeline, highlighting a trend that could extend the current shortage of detached homes and continue to drive prices up in this segment.
Whether you're a first home buyer, investor, or simply keeping an eye on the market, these shifts matter. Brisbane is evolving, fast. This guide can help you understand not just where the market is heading, but where the real opportunities lie. Dive deeper for suburb-specific insights, liveability scores, and investment hot spots. There’s plenty more ahead.

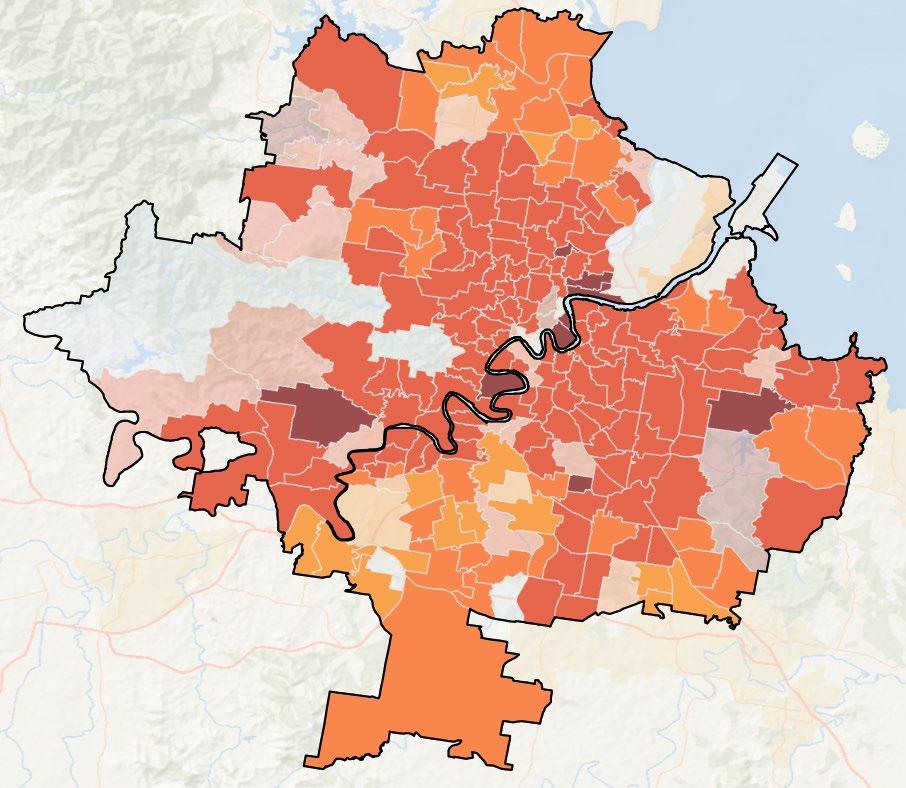
This report analyses all suburbs within a 20km radius of the Brisbane CBD. The following criteria were considered:
• Property trends criteria: all suburbs featured have a minimum of 20 sales transactions for statistical reliability purposes. Based on market conditions, suburbs have either positive, or as close as possible to neutral, price growth between 2023 and 2024/25*.
• Investment criteria: as of March 2025, suburbs chosen will have an on-par or higher rental yield than Brisbane Metro and an on-par or lower vacancy rate.
• Affordability criteria: chosen suburbs have a median price below Brisbane Metro. We calculated the percentage premiums that needed to be added to the Queensland (QLD) average home loan, which was $641,435** as of the March quarter of 2025. Premiums of 25.1% for houses and -15.8% for units were needed to reach the median price of the identified suburbs (3 for houses and 3 for units) in this report. This is below what is required to reach Brisbane Metro’s median prices (54.3% for houses and 8.9% for units). This makes the key suburbs identified in this report more affordable to buyers, creating an opportunity for first home buyers.
• Development criteria: suburbs chosen have new developments commencing construction for 2025, with a high proportion of commercial and infrastructure projects. This ensures the suburbs show signs of sustainable economic growth. Suburbs chosen must also show a reasonable amount of new ready-to-sell stock planned for construction to ensure buyers have access to new housing supply.
• Liveability criteria: all identified suburbs have low crime rates, availability of amenities within a 5km radius (i.e., schools, green spaces, public transport, shopping centres, and health care facilities), and an unemployment rate on par or lower in comparison to the QLD average (as determined by the Department of Jobs and Small Business, December Quarter 2024 release).


Between Q1 2024 and Q1 2025, average vendor discounts for houses shifted from premium (1.9%) to neutral (0.0%), indicating a balanced market where either buyers nor sellers hold a clear upper hand
In the unit market, properties are still selling at a premium, though the margin has reduced to 1.4%. While this segment continues to favour sellers, the reduction suggests that buyer sentiment is beginning to shift, especially as some house hunters explore units as more viable options.
This easing of premiums presents a window of opportunity for buyers, particularly those priced out of detached homes.
In 2024-2025, most of the homes sold in Brisbane Metro fell into more accessible price categories, with 43.8% of houses sold priced below $849,999, and 33.1% of units transacted for under $549,999. These figures indicate that affordable options are still available, especially in the unit segment.
That said, there is continued demand at the upper-end of the market:
• 30.0% of houses sold for $1.15 million or more.
• 19.7% of units were purchased at $850,000 and above.
These trends point to a diversified market where both affordability and premium segments are active, reinforcing positive prospects for both buyers and sellers.


$0
$500,000
$800,000
$1,000,000
$2,000,000+
In March 2025, Brisbane Metro recorded a house rental yield of 3.2%, outperforming Sydney Metro (2.7%) and slightly ahead of Melbourne Metro (3.1%). This yield was supported by a 2.8% increase in median weekly house rents over the past year, bringing the figure to $700 per week. Additionally, there was a significant 92.4% rise in the number of houses rented, reaching 5,567 transactions in Q1 2025. A similar pattern was observed in the unit market, where rising demand and strong competition helped boost values across most configurations. These trends collectively point to a favourable investment environment, particularly given Brisbane’s typically more affordable entry price compared to Sydney. In March 2025, Brisbane Metro’s vacancy rate stood at just 0.9%; well below Sydney Metro (1.3%), Melbourne Metro (1.5%)and significantly under the Real Estate Institute of Australia’s healthy benchmark of 3.0%.
Rental prices have increased across both houses and units ,reflecting sustained tenant demand. 3-bedroom houses delivered the highest annual rental growth for houses; up +4.0% to $650 per week, and 1-bedroom units outperformed all other configurations, with rents rising by +14.2% to $500 per week. Despite some short-term variation, Brisbane’s rental market has remained consistently tight, which supports quicker leasing activity. This resilience adds to Brisbane’s attractiveness as a longterm investment location


Located


To provide more options for first home buyers, the following seven additional suburbs for houses and units offer affordable alternatives to Brisbane Metro’s median prices. These are in addition to the top 3 affordable and liveable suburbs for houses (Inala, Slacks Creek and Lawnton), and units (Slacks Creek, Bowen Hills and Springwood) featured earlier in the report. While these suburbs didn’t meet all our criteria to be classified as ‘top suburbs’, they were selected using the same methodology and still represent strong value for buyers seeking more budget-friendly opportunities.
PRD’s property research division provides reliable and unbiased data, insights, and consultancy to clients in both metro and regional locations across Australia.
Our extensive research capabilities and specialised approach ensure our clients can make the most informed and financially sound decisions about residential and commercial properties.
Access to accurate and objective research is the foundation of all good property decisions. PRD shares on-the-ground experience and decades of knowledge to deliver innovative and effective solutions to our clients.
We take a holistic approach and focus on understanding new issues impacting the property industry; such as the environment and sustainability, the economy, demographic and psychographic shifts, commercial and residential design; and forecast future implications around such issues based on historical data and facts.
Our in-house research team is skilled in deriving macro and micro quantitative information from multiple credible sources, so we can ensure we provide strategic advice and financially sound direction regarding property and market performance.
Our research services span over every suburb, local government area, and state within Australia. We have the ability and systems to monitor market movements, demographic changes, and property trends. We use our knowledge of market sizes, price structure, and buyer profiles to identify opportunities for clients and provide market knowledge that is unbiased, thorough, and reliable.