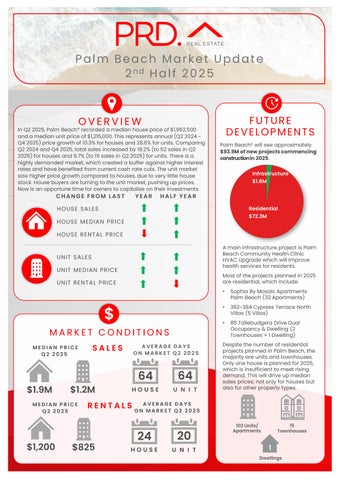

Palm Beach Market Update 2nd Half 2025

In Q2 2025, Palm Beach* recorded a median house price of $1,962,500 and a median unit price of $1,215,000.This represents annual (Q2 2024Q4 2025)price growth of 10.3% for houses and 28.6% for units. Comparing Q2 2024and Q4 2025,total sales increased by 18.2% (to 52 sales in Q2 2025)for houses and 6.7% (to 111 sales in Q2 2025)for units. There is a highly demanded market, which created a buffer against higher interest rates and have benefited from current cash rate cuts. The unit market saw higher price growth compared to houses, due to very little house stock. House buyers are turning to the unit market, pushing up prices. Now is an opportune time for owners to capitalize on their investments.


Palm Beach£ will see approximately $93.9Mofnewprojectscommencing constructionin2025
HOUSE SALES YEAR HALF YEAR
FROM LAST HOUSE MEDIAN PRICE HOUSE RENTAL PRICE
PRICE


A main infrastructure project is Palm Beach Community Health Clinic HVAC Upgrade which will improve health services for residents.
Most of the projects planned in 2025 are residential, which include:
• Sophia By Mosaic Apartments Palm Beach (32Apartments)
• 382-384Cypress Terrace North Villas (5 Villas)
• 85 Tallebudgera Drive Dual Occupancy & Dwelling (2 Townhouses + 1 Dwelling)
MEDIAN PRICE Q2 2025 MEDIAN PRICE Q2 2025
AVERAGE DAYS ON MARKET Q2 2025
64 $1.9M $1.2M
AVERAGE DAYS ON MARKET Q2 2025
24 20 $1,200
Despite the number of residential projects planned in Palm Beach, the majority are units and townhouses. Only one house is planned for2025, which is insufficient to meet rising demand. This will drive up median sales prices; not only for houses but also for other property types. 64 $825 HOUSE UNIT


AVERAGE VENDOR DISCOUNT*
Average vendor discount reflects the average percentage difference between the first list price and final sold price. A lower percentage difference (closer to 0.0%) suggests that buyers are willing to purchase close to the first asking price of a property.

Average vendor discounts between Q2 2024and Q2 2025 have swung from a premium to a discount of -2.5% for houses and widened to -1.7% for units. Market conditions in Palm Beach* still favour buyers, with sellers willing to accept below first list prices. This is good news for buyers, however, with a limited number of houses in the pipeline this may notlast long; thus, buyers need to act fast.


The suburb of Palm Beach has outperformed the wider Gold Coast Local Government Area (LGA) in both house and unit median prices for the past 5years, especially for house prices. 2025# saw this trend continue, with houses in Palm Beach becoming more of a premium market.
The dominant proportion of houses sold in Palm Beach* in 2025#were in the most premium price brackets, of $2.2M and above (34.1%). Interestingly the most affordable price brackets still showed a strong presence, with 27.8%of house sales below $1,599,999.For units, 46.3%were sold in the most affordable price point of $1,049,999and less, thus an opportunity for first home buyers. The premium unit market also remained strong, with 35.4%of units sold above $1.35M; benefitting owners.
MARKET COMPARISON
The market comparison graph provides a comparative trend for median price of houses and units over the past 5 years. The main LGA chosen was based on their proximity to the main suburb analysed, which is Palm Beach.


PRICE BREAKDOWN 2025*


than$1,049,999 $1,050,000to$1,149,999 $1,150,000 to $1,249,999 $1,250,000 to $1,349,999 $1,350,000 and above
Palm Beach (4221) Gold Coast City (LGA) Palm Beach (4221) Gold Coast City (LGA)
RENTAL GROWTH 2025€
House rental yield in Palm Beach¥ was 3.8%as of June 2025, on par with Gold Coast (3.8%) but higher than Brisbane Metro (3.2%). This is paired with a 9.1% increase median house rental price in the past 12months to Q2 2025,to$1,200per week, along with a 3.5% increase in the number of houses rented (to 88 rentals in Q2 2025). This suggests a strong demand and competitive house rental market, which is beneficial to investors.
4+ bedroom houses have provided investors with +15.4%rental growth annually, achieving a median rent of $1,500per week.
Palm Beach¥ recorded a vacancy rate of 0.9%in June 2025, below Gold Coast LGA average of 1.7% but on par with Brisbane Metro’s 0.9%. Vacancy rates have decreased in the past 12 months to Q2 2025,indicating an even tighter rental market. Further, a 0.9% vacancy rate is well below the Real Estate Institution of Australia’s healthy benchmark of 3.0%, indicating quicker occupancy of rental homes in Palm Beach¥ There is a conducive environment for investors, even if property prices (thus entry price) have increased in the past 12 months to Q2 2025.
RENTAL VACANCY RATES 2025

Palm Beach (4221) Gold Coast Main Brisbane Metro REIA 'Healthy' Benchmark


PalmBeach¥
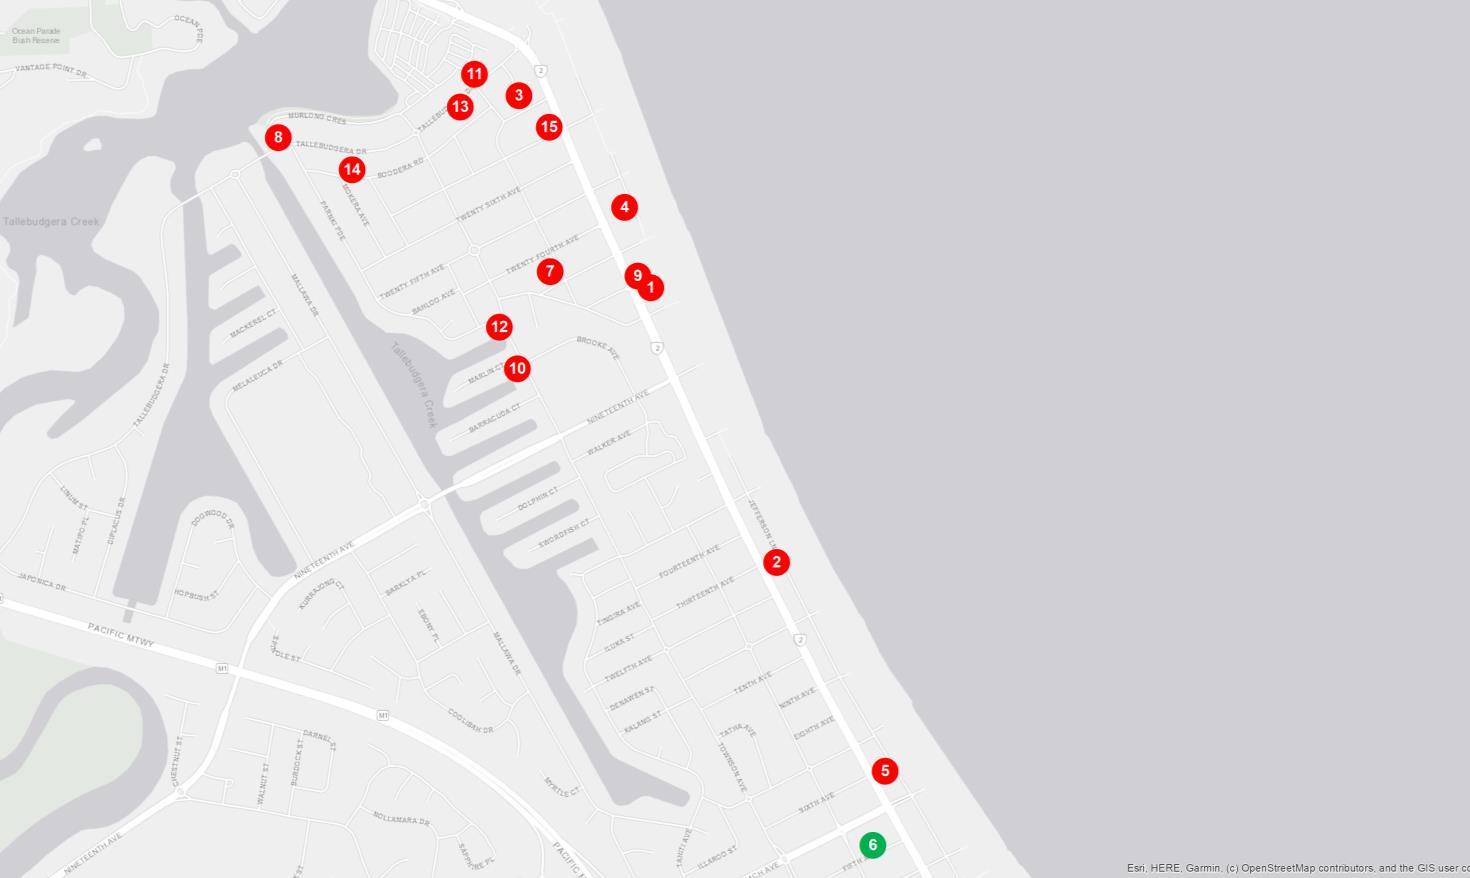
PROJECT DEVELOPMENT MAP 2025 ₳

PALM BEACH


RESEARCH SERVICES
Our research services span over every suburb, LGA,and state within Australia; captured in a variety of standard and customised products, andinclude:
• Advisory and consultancy
• Market analysis including profiling and trends
• Primary qualitative and quantitative research
• Demographic and target market analysis
• Geographic information mapping
• Project analysis including product and pricing recommendations
• Rental and investment return analysis
OUR KNOWLEDGE
Access to accurate and objective research is the foundation of all good property decisions.
OUR PEOPLE
Our research team is made up of highly qualified researchers who focus solely on propertyanalysis.


REFERENCES
* Palm Beach sales market data and key indicators encapsulates aggregate property market conditions within the suburb of Palm Beach.
** Estimated values are based on construction value provided by the relevant data authority and does not reflect commercial and/or re-sale value.
# 2025 encapsulates sales transactions for 1st Half 2025 (01/01/2025 – 30/06/2025) only, other years encapsulates sales transactions for the full year (i.e 01/01 to 31/12 of the relevant year)
€ Annual rental growth is a comparison between Q2 2024 (01/04/2024 – 30/06/2024) and Q2 2025 (01/04/2025 – 30/06/2025) house median rent figures.
¥ Palm Beach rental market data encapsulates aggregate property conditions within the postcode of 4221.
§ Rental yields shown are as reported as of June 2025.
₳ Project development map showcases a sample of upcoming projects only, due to accuracy of addresses provided by the data provider for geocoding purposes.
£ Projects refers to the top developments within the suburb of Palm Beach.
µ Estimated value is the value of construction costs provided by relevant data authority, it does not reflect the project’s sale/commercial value.
ψ Commencement date quoted for each project is an approximate only, as provided by the relevant data authority, PRD does not hold any liability to the exact date.
Source: APM Pricefinder, Cordell Connect database, SQM Research, Esri ArcGIS.
Disclaimer: PRD does not give any warranty in relation to the accuracy of the information contained in this report. If you intend to rely upon the information contained herein, you must take note that the information, figures and projections have been provided by various sources and have not been verified by us. We have no belief one way or the other in relation to the accuracy of such information, figures and projections. PRD will not be liable for any loss or damage resulting from any statement, figure, calculation or any other information that you rely upon that is contained in the material.
Prepared by PRD Research. © All medians and volumes are calculated by PRD Research. Use with written permission only. All other responsibilities disclaimed. © Copyright PRD 2025.