
Ingleburn Market Update 2nd Half 2025

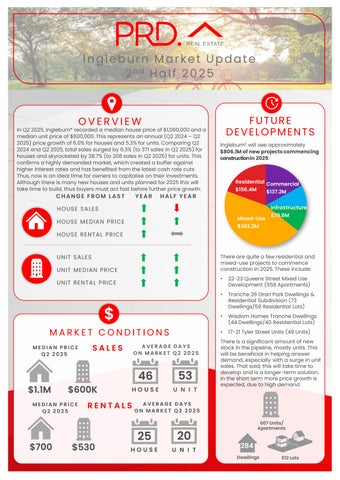
In Q2 2025, Ingleburn* recorded a median house price of $1,060,000and a median unit price of $600,000.This represents an annual (Q2 2024– Q2 2025)price growth of 6.0%for houses and 5.3%for units. Comparing Q2 2024and Q2 2025,total sales surged by 6.3% (to 371sales in Q2 2025)for houses and skyrocketed by 38.7% (to 208sales in Q2 2025) forunits. This confirms a highly demanded market, which created a buffer against higher interest rates and has benefited from the latest cash rate cuts. Thus,now is anideal time for owners to capitalise on their investments. Although there is many new houses and units planned for2025this will take time to build, thus buyers must act fast before further price growth.

HOUSE SALES
FROM LAST HOUSE MEDIAN PRICE HOUSE RENTAL PRICE


Ingleburn£ will see approximately $806.1Mofnewprojectscommencing constructionin2025
HALF YEAR


MEDIAN PRICE Q2 2025 MEDIAN PRICE Q2 2025
AVERAGE DAYS ON MARKET Q2 2025
46 $1.1M $600K
53
AVERAGE DAYS ON MARKET Q2 2025
25 20 $700
$530 HOUSE UNIT


There are quite a few residential and mixed-use projects to commence construction in 2025. These include:
• 22-23Queens Street Mixed Use Development (558 Apartments)
• Tranche 26 Oran Park Dwellings & Residential Subdivision (73 Dwellings/59 Residential Lots)
• Wisdom Homes Tranche Dwellings (44 Dwellings/40 Residential Lots)
• 17-21 Tyler Street Units (49 Units)
There is a significant amountof new stock in the pipeline, mostly units. This will be beneficial in helping answer demand, especially with a surge in unit sales. That said, this will take time to develop and is a longer-term solution. In the short term more price growth is expected, due to high demand.

Units/ Apartments


AVERAGE VENDOR DISCOUNT*
Average vendor discount reflects the average percentage difference between the first list price and final sold price. A lower percentage difference (closer to 0.0%) suggests that buyers are willing to purchase close to the first asking price of a property.


Average vendor discounts between Q2 2024and Q2 2025 have widened to -3.0% for houses and -4.2% for units. Market conditions in Ingleburn* are still favouring buyers, with owners willing to accept below the first list price. That said, Q2 2025average vendor discount is slightly tighter than 6 months ago (Q4 2024), suggesting a potential shift towards a seller's market. Thus,buyers should act fast.
The suburb of Ingleburn has tracked on par with the wider Campbelltown Local Government Area (LGA) in median house and unit prices for the past 5 years. This continued to be the case for units in 2025#.Houses however has seen an increase in price growth pace, now tracking at a slight premium compared to that of the wider LGA.
Most of the homes sold in Ingleburn* in 2024/25#were split between the most affordable price bracket of less than $899,999(28.9%) and the premium price point, of $1.2M and above (23.8%). This creates a unique opportunity for both buyers and sellers. Units had most sales in the middle price bracket of $550,000to $649,999(36.4%) with all other price brackets seeing similar sales counts. Overall, there is a home for every budget in Ingleburn*. The market comparison graph provides a comparative trend for median price of houses and units over the past 5 years. The main LGA chosen was based on their proximity to the main suburb analysed, which is Ingleburn.


MARKET COMPARISON


to $549,999
$550,000 to $649,999
$650,000to $749,999
$750,000and above
RENTAL GROWTH 2025€
House rental yields in Ingleburn¥ was 3.7% as of June 2025, onpar with Campbelltown LGA (3.8%) but higher than Sydney Metro (2.7%). Further, median house rental price increased by 2.2%in the past 12months toQ2 2025, at $700per week. At the same time, the number of houses rented increased slightly, by 0.4% (to 569houses) in Q22025. This indicates a highly demanded and competitive house rental market in Ingleburn¥, which is beneficial to investors.
3-bedroom houses have provided investors with +5.0% rental growth annually, achieving a median rent of $625per week.
Ingleburn¥ recorded a vacancy rate of 1.4% in June 2025, below the Campbelltown LGA average of 2.6%and Sydney Metro’s 1.6%. Vacancy rates have fluctuated slightly in the past 12months but overall showed a relatively stable pattern (1.3% in June 2024). Also, a 1.4%vacancy rate is still well below the Real Estate Institution of Australia’s healthy benchmark of 3.0%, indicating quicker occupancy of rental homes in Ingleburn¥. This creates a conducive environment for investors, even if house and unit prices (thus entry price) have increased in the past 12months to Q2 2025.
RENTAL VACANCY RATES 2025

Ingleburn (2565) Campbelltown LGA Sydney Metro REIA 'Healthy' Benchmark

Ingleburn (2565)¥

PROJECT DEVELOPMENT MAP 2025 ₳
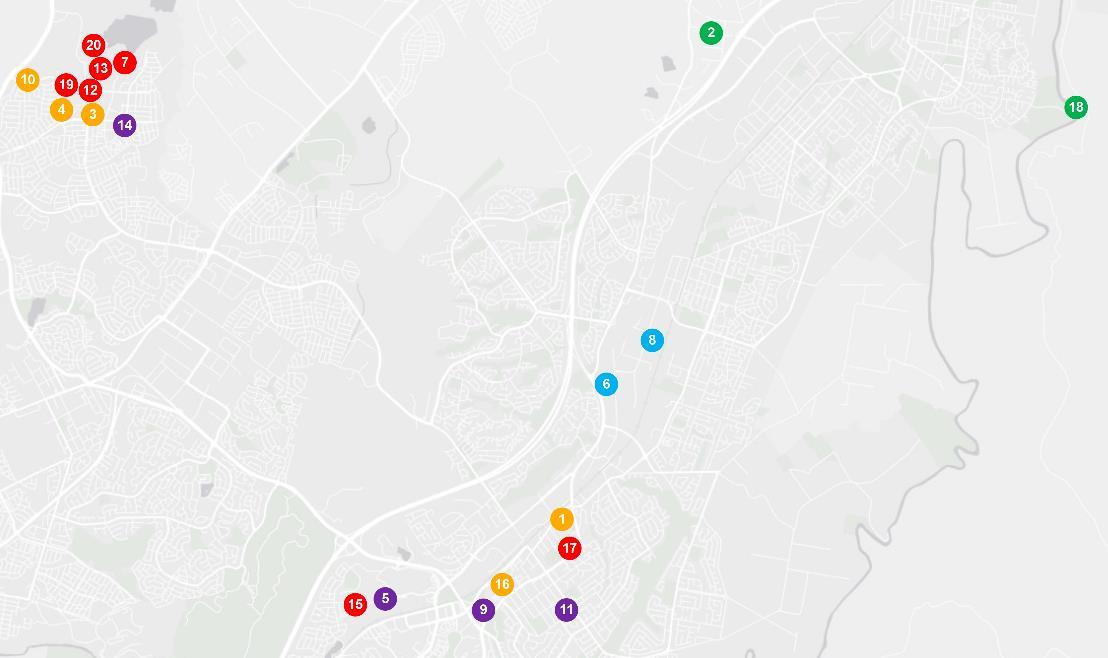
INGLEBURN


RESEARCH SERVICES
Our research services span over every suburb, LGA,and state within Australia; captured in a variety of standard and customised products, andinclude:
• Advisory and consultancy
• Market analysis including profiling and trends
• Primary qualitative and quantitative research
• Demographic and target market analysis
• Geographic information mapping
• Project analysis including product and pricing recommendations
• Rental and investment return analysis


OUR KNOWLEDGE
Access to accurate and objective research is the foundation of all good property decisions.
OUR PEOPLE
Our research team is made up of highly qualified researchers who focus solely on propertyanalysis.


REFERENCES
* Ingleburn sales market data and key indicators encapsulates aggregate property market conditions within the suburbs of Bardia, Ingleburn, Denham Court, Macquarie Fields, Minto, Campbelltown, and Oran Park.
** Estimated values are based on construction value provided by the relevant data authority and does not reflect commercial and/or re-sale value.
# 2024/25encapsulates sales transactions for the 2024 full year (01/01/2024 – 31/12/2024)and 1st half 2025 (01/01/2025 – 30/06/2025).
€ Annual rental growth is a comparison between Q2 2024 (01/04/2024 – 30/06/2024) and Q2 2025 (01/04/2025 – 30/06/2025) house median rent figures.
¥ Ingleburn rental market data encapsulates aggregate property conditions within the postcode of 2565.
§ Rental yields shown are as reported as of June 2025.
₳ Project development map showcases a sample of upcoming projects only, due to accuracy of addresses provided by the data provider for geocoding purposes.
£ Projects refers to the top developments within the suburb of Bardia, Ingleburn, Denham Court, Macquarie Fields, Minto, Campbelltown, and Oran Park.
µ Estimated value is the value of construction costs provided by relevant data authority, it does not reflect the project’s sale/commercial value.
ψ Commencement date quoted for each project is an approximate only, as provided by the relevant data authority, PRD does not hold any liability to the exact date.
Source: APM Pricefinder, Cordell Connect database, SQM Research, Esri ArcGIS.
Disclaimer: PRD does not give any warranty in relation to the accuracy of the information contained in this report. If you intend to rely upon the information contained herein, you must take note that the information, figures and projections have been provided by various sources and have not been verified by us. We have no belief one way or the other in relation to the accuracy of such information, figures and projections. PRD will not be liable for any loss or damage resulting from any statement, figure, calculation or any other information that you rely upon that is contained in the material.
Prepared by PRD Research. © All medians and volumes are calculated by PRD Research. Use with written permission only. All other responsibilities disclaimed. © Copyright PRD 2025.