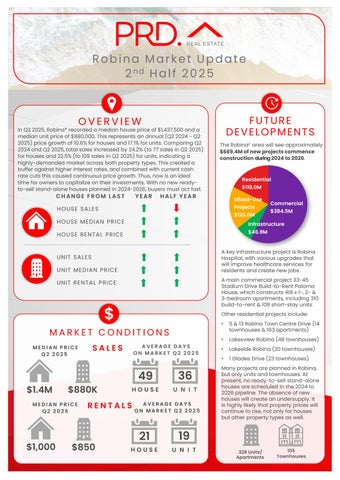

Robina Market Update 2nd Half 2025

In Q2 2025,Robina* recorded a median house price of $1,437,500and a median unit price of $880,000.This represents an annual (Q2 2024 - Q2 2025)price growth of 10.6%for houses and 17.1% for units. Comparing Q2 2024and Q2 2025,total sales increased by 24.2%(to 77sales in Q2 2025) for houses and 22.5% (to 109 sales in Q2 2025)for units, indicating a highly-demanded market across both property types. This created a buffer against higher interest rates, and combined with current cash rate cuts this caused continuous price growth. Thus, now is an ideal time forowners to capitalize on their investments. With nonew readyto-sell stand-alone houses planned in 2024-2026, buyers must act fast
CHANGE FROM LAST

HOUSE SALES
HOUSE MEDIAN PRICE
HOUSE RENTAL PRICE UNIT SALES UNIT MEDIAN PRICE
RENTAL PRICE

MEDIAN PRICE Q2 2025


The Robina£ area will see approximately $669.4Mofnewprojectscommence constructionduring2024to2026
YEAR HALF YEAR


A key infrastructure project is Robina Hospital, with various upgrades that will improve healthcare services for residents and create new jobs.
A main commercial project 33-45 Stadium Drive Build-to-Rent Paloma House, which constructs 418 x1-, 2- & 3-bedroom apartments, including 310 build-to-rent & 108short-stay units.
Other residential projects include:
CONDITIONS
AVERAGE DAYS ON MARKET Q2 2025
49
$1.4M $880K
MEDIAN PRICE Q2 2025
• 5 & 13Robina Town Centre Drive (14 townhouses & 163apartments)
• Lakesview Robina (48 townhouses)
• Lakeside Robina (20 townhouses)
• 1 Glades Drive (23 townhouses)
36 $850 HOUSE UNIT
AVERAGE DAYS ON MARKET Q2 2025
21 19 $1,000
Many projects are planned in Robina, but only units and townhouses. At present, noready-to-sell stand-alone houses are scheduled in the 2024 to 2026 pipeline. The absence of new houses will create anundersupply. It is highly likely that property prices will continue to rise, not only for houses but other property types as well


AVERAGE VENDOR DISCOUNT*
Average vendor discount reflects the average percentage difference between the first list price and final sold price. A lower percentage difference (closer to 0.0%) suggests that buyers are willing to purchase close to the first asking price of a property.


Average vendor discounts between Q2 2024and Q2 2025 have remained at a premium for houses, at a higher level of 0.9%for houses. This suggests buyers must offer even higher (than previous) onthe first list price. It swung from a discount toneutral for units (0.0%), thus, buyers must offer the asking price. Robina* is now a seller’s market, and with nonew houses planned, buyers must actfast
The suburb of Robina has outperformed the wider Gold Coast Local Government Area (LGA) in median house price for the past 5 years, but onpar in terms of median unit price. This trend continued in 2025#,with house prices increasing at a faster pace in the suburb of Robina.
Most of the homes sold in Robina* in 2025# were in the most affordable price brackets, with 40.6%of houses sold below $1,299,999and 35.5% of units sold below $749,999. This is good news for home buyers, especially considering median house and unit price growth in the past 12 months to Q2 2025.The premium market is still strong, with 23.4% of houses sold above $1.6Mand 11.4% of units sold above $1.05M,benefiting owners looking tocapitalize ontheir investments Overall, there is a home for every budget.
MARKET COMPARISON
The market comparison graph provides a comparative trend for median price of houses and units over the past 5 years. The main LGA chosen was based on their proximity to the main suburb analysed, which is Robina.


PRICE BREAKDOWN 2025


$749,999
to$849,999
$850,000 to $949,999
$950,000 to $1,049,999 $1,050,000and above
RENTAL GROWTH 2025€
House rental yields in Robina¥ was 4.2%as of June 2025,higher than the Gold Coast (3.8%) and Brisbane Metro (3.2%). This is paired with a 5.5% growth in the median house rental price in the past 12months to Q2 2025,to $1,000per week. During this time, the number ofhouse rented decreased by -25.5% (to 79rentals in Q22025). This indicates anundersupplied and highly competitive house rental market in Robina¥, which is beneficial to investors.
4+ bedroom houses have provided investors with a significant +7.0% rental growth annually, achieving a median rent of $1,150per week.
Robina¥ recorded a vacancy rate of 0.9% in June 2025, below Gold Coast Main average of 1.7% but on par with Brisbane Metro’s 1.0%. Vacancy rates have decreased in the past 12month since June 2024,indicating an even tighter rental market. Further, a 0.9% vacancy rate is well below the Real Estate Institution of Australia’s healthy benchmark of 3.0%, indicating quicker occupancy of rental properties in Robina¥. This creates a conducive environment for investors, even with a higher house and unit sales (thus entry) price in the past 12months toQ2 2025.
RENTAL VACANCY RATES 2025

Robina (4226) Gold Coast Main Brisbane Metro REIA 'Healthy' Benchmark


Robina¥
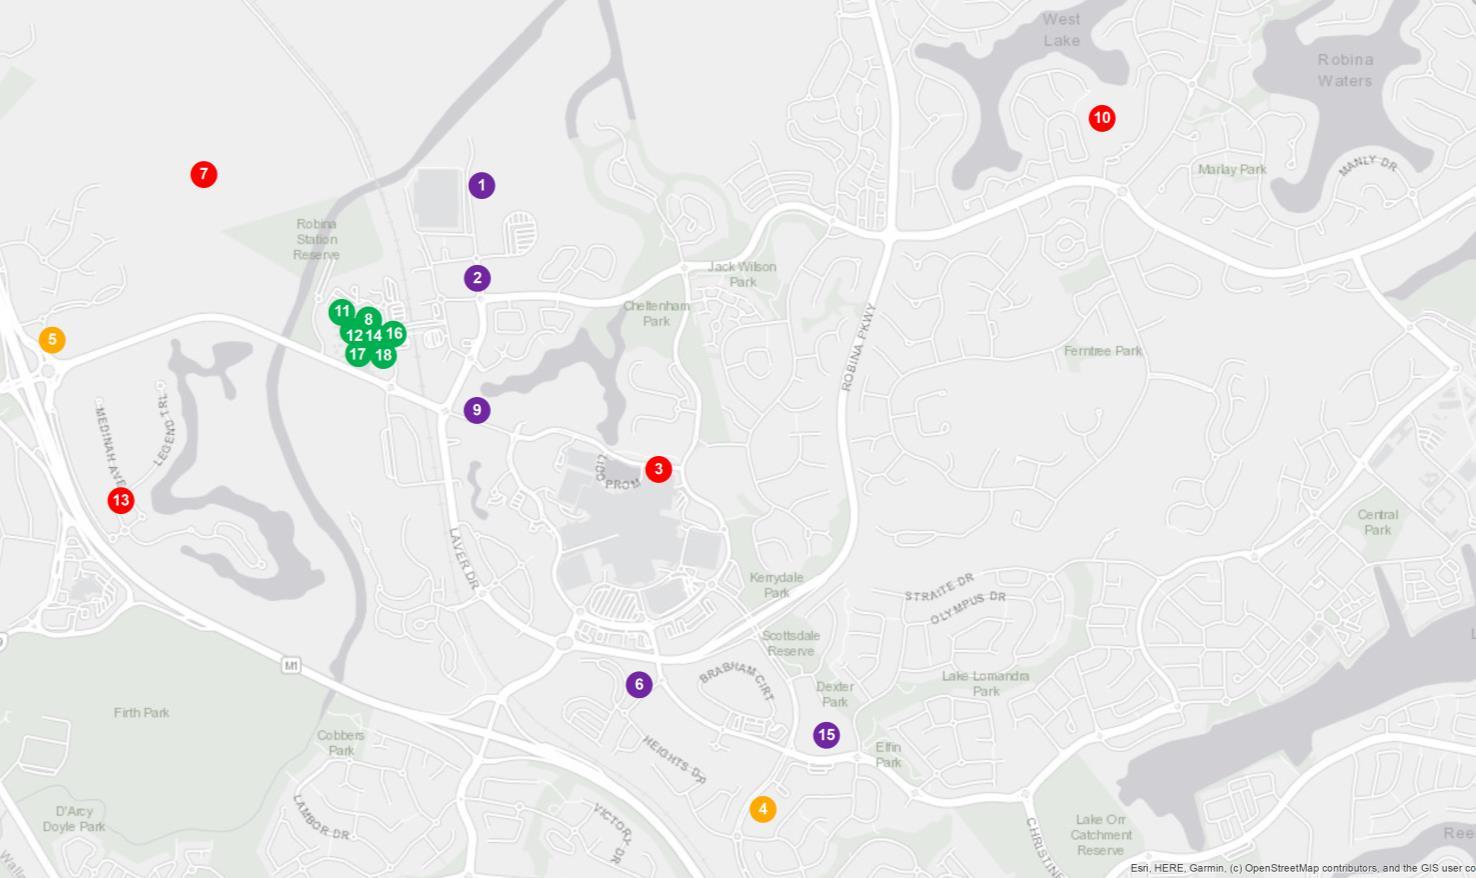
PROJECT DEVELOPMENT MAP 2024 -


RESEARCH SERVICES
Our research services span over every suburb, LGA,and state within Australia; captured in a variety of standard and customised products, andinclude:
• Advisory and consultancy
• Market analysis including profiling and trends
• Primary qualitative and quantitative research
• Demographic and target market analysis
• Geographic information mapping
• Project analysis including product and pricing recommendations
• Rental and investment return analysis
OUR KNOWLEDGE
Access to accurate and objective research is the foundation of all good property decisions.
OUR PEOPLE
Our research team is made up of highly qualified researchers who focus solely on propertyanalysis.


REFERENCES
* Robina sales market data and key indicators encapsulates aggregate property market conditions within the suburb of Robina.
** Estimated values are based on construction value provided by the relevant data authority and does not reflect commercial and/or re-sale value.
# 2025 encapsulates sales transactions for the 1st half of 2025 (01/01/2025 – 30/06/2025) only, other years encapsulated sales transactions for the full year (i.e 01/01 to 31/12 of the relevant year).
€ Annual rental growth is a comparison between Q2 2024 (01/04/2024 – 30/06/2024) and Q2 2025 (01/04/2025 – 30/06/2025) house median rent figures.
¥ Robina rental market data encapsulates aggregate property conditions within the postcode of 4226.
§ Rental yields shown are as reported as of June 2025.
₳ Project development map showcases a sample of upcoming projects only, due to accuracy of addresses provided by the data provider for geocoding purposes.
£ Projects refers to the top developments within the postcode of 4226.
µ Estimated value is the value of construction costs provided by relevant data authority, it does not reflect the project’s sale/commercial value.
ψ Commencement date quoted for each project is an approximate only, as provided by the relevant data authority, PRD does not hold any liability to the exact date.
Source: APM Pricefinder, Cordell Connect database, SQM Research, Esri ArcGIS.
Disclaimer: PRD does not give any warranty in relation to the accuracy of the information contained in this report. If you intend to rely upon the information contained herein, you must take note that the information, figures and projections have been provided by various sources and have not been verified by us. We have no belief one way or the other in relation to the accuracy of such information, figures and projections. PRD will not be liable for any loss or damage resulting from any statement, figure, calculation or any other information that you rely upon that is contained in the material.
Prepared by PRD Research. © All medians and volumes are calculated by PRD Research. Use with written permission only. All other responsibilities disclaimed. © Copyright PRD 2025.