
Coolangatta Market Update 2nd Half 2025

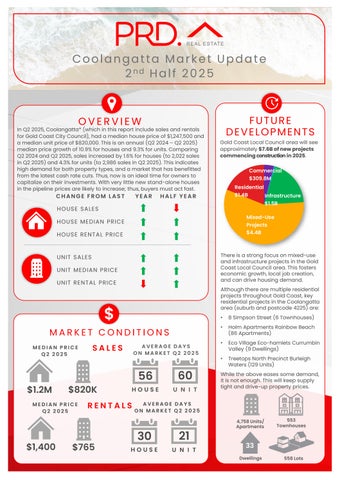
In Q2 2025, Coolangatta* (which in this report include sales and rentals for Gold Coast City Council), had a median house price of $1,247,500and a median unit price of $820,000.This is an annual (Q2 2024– Q2 2025) median price growth of 10.9%for houses and 9.3%for units. Comparing Q2 2024and Q22025, sales increased by 1.6% forhouses (to 2,022sales in Q2 2025) and 4.3% for units (to 2,986 sales in Q2 2025). This indicates high demand for both property types, and a market that has benefitted from the latest cash rate cuts. Thus,now is an ideal time for owners to capitalize on their investments. With very little new stand-alone houses in the pipeline prices are likely to increase; thus,buyers must actfast.


Gold Coast Local Council area will see approximately$7.6Bofnewprojects commencingconstructionin2025.


PRICE Q2 2025 MEDIAN PRICE Q2 2025
AVERAGE DAYS ON MARKET Q2 2025
56 $1.2M $820K
60
AVERAGE DAYS ON MARKET Q2 2025
30 21 $1,400
$765 HOUSE UNIT


There is a strong focus onmixed-use and infrastructure projects in the Gold Coast Local Council area. This fosters economic growth, local job creation, and can drive housing demand.
Although there are multiple residential projects throughout Gold Coast, key residential projects in the Coolangatta area (suburb and postcode 4225)are:
• 8 Simpson Street (6 Townhouses)
• Holm Apartments Rainbow Beach (86 Apartments)
• Eco Village Eco-hamlets Currumbin Valley (9 Dwellings)
• Treetops North Precinct Burleigh Waters (129 Units)
While the above eases some demand, it is notenough. This will keep supply tight and drive-up property prices.


AVERAGE VENDOR DISCOUNT*
Average vendor discount reflects the average percentage difference between the first list price and final sold price. A lower percentage difference (closer to 0.0%) suggests that buyers are willing to purchase close to the first asking price of a property.

$2,500,000
$2,000,000
$1,000,000 $1,500,000
$500,000
$0
Average vendor discounts between Q2 2024and Q2 2025 have widened to -1.9% for houses and -1.8% for units. The Coolangatta* market still favourbuyers, as owners are willing to accept below the first list price. This is welcomed news, as property prices have increased in the past 12 months. Thatsaid, Q2 2025house average discount is lower than 6 months ago(Q4 2024), and with notmany new houses planned; time is limited forbuyers.


The suburb of Coolangatta has outperformed the Gold Coast Local Government Area (LGA) in house prices for the past 5 years. This continued in 2025#,with median house price in Coolangatta increasing even further, thus presenting a premium market. There is slower growth in the unit market, which is in an opportunity forbuyers.
The dominant proportion of homes sold in Coolangatta* in 2025# were in the premium price bracket, with 55.7% of houses sold at $1.35M and above and 38.0%of units sold at $950Kand above. However, affordability remains, as 19.7% of houses sold were in the most affordable price point of less than $1,049,999and 24.7%of units sold at less than $649,999.This is good news for first-home buyers.
MARKET COMPARISON
Coolangatta (4225) House
Gold Coast City (LGA) House Coolangatta (4225) Unit Gold Coast City (LGA) Unit
The market comparison graph provides a comparative trend for median price of houses and units over the past 5 years. The main LGA chosen was based on their proximity to the main suburb analysed, which is Coolangatta.

PRICE BREAKDOWN 2025


$1,250,000 to $1,349,999
$1,350,000 and above


RENTAL GROWTH 2025€
House rental yields in Coolangatta¥ (postcode 4225) were 3.7% as of June 2025, below Gold Goast Main (3.8%). This is paired with an 86.7% growth in median house rental price in the past 12months to Q22025,at $1,400per week. During the same time, the number of houses rented fell by -20.0% (to only 8houses in Q22025). This confirms an undersupplied house rental market in Coolangatta¥ (postcode 4225). There is still roomfor investors toenter the market.
3-bedroom houses have provided investors with a significant +75.0% rental growth annually, achieving a median rent of $1,400per week.
Coolangatta¥ (postcode 4225) recorded a vacancy rate of 1.4% in June 2025,lower than Gold Coast Main (1.7%). Vacancy rates have fluctuated in the past 12months, but overall declined from 1.7% in June 2024,indicating an even tighter the market. Furthermore, a 1.4% vacancy rate is still well below the Real Estate Institution of Australia’s healthy benchmark of 3.0%, thus a quicker occupancy of rental homes in Coolangatta¥ (postcode 4225). There is a conducive environment for investors, even with a higher property sale price (thus entry price) in Q22025.
RENTAL VACANCY RATES 2025

Coolangatta (4225) Gold Coast Main Tweed Shire LGA REIA 'Healthy' Benchmark

Coolangatta¥ (Postcode4225)

PROJECT DEVELOPMENT MAP 2025 ₳
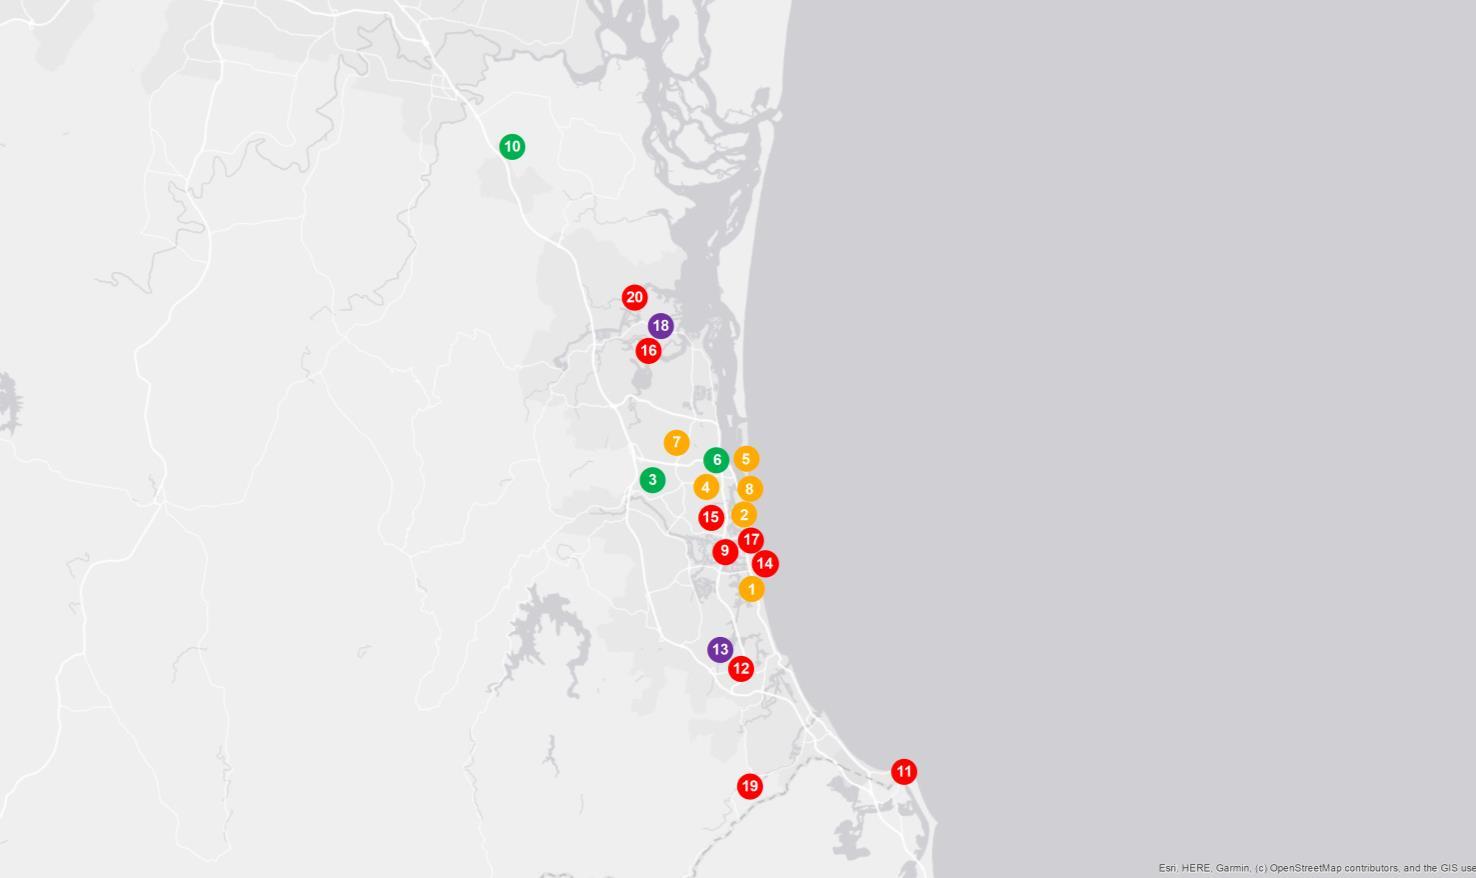

COOLANGATTA


RESEARCH SERVICES
Our research services span over every suburb, LGA,and state within Australia; captured in a variety of standard and customised products, andinclude:
• Advisory and consultancy
• Market analysis including profiling and trends
• Primary qualitative and quantitative research
• Demographic and target market analysis
• Geographic information mapping
• Project analysis including product and pricing recommendations
• Rental and investment return analysis
OUR KNOWLEDGE
Access to accurate and objective research is the foundation of all good property decisions.
OUR PEOPLE
Our research team is made up of highly qualified researchers who focus solely on propertyanalysis.


REFERENCES
* Coolangatta sales market data and key indicators encapsulates aggregate property market conditions within the Gold Coast Local Government Area.
** Estimated values are based on construction value provided by the relevant data authority and does not reflect commercial and/or re-sale value.
# 2025 encapsulates sales transactions for 1st Half 2025 (01/01/2025 – 30/06/2025) only, other years encapsulates sales transactions for the full year (i.e 01/01 to 31/12 of the relevant year)
€ Annual rental growth is a comparison between Q2 2024 (01/04/2024 – 30/06/2024) and Q2 2025 (01/04/2025 – 30/06/2025) house median rent figures.
¥ Coolangatta rental market data encapsulates aggregate property conditions within the postcode of 4225.
§ Rental yields shown are as reported as of June 2025.
₳ Project development map showcases a sample of upcoming projects only, due to accuracy of addresses provided by the data provider for geocoding purposes.
£ Projects refers to the top developments within the Gold Coast Local Government Area.
µ Estimated value is the value of construction costs provided by relevant data authority, it does not reflect the project’s sale/commercial value.
ψ Commencement date quoted for each project is an approximate only, as provided by the relevant data authority, PRD does not hold any liability to the exact date.
Source: APM Pricefinder, Cordell Connect database, SQM Research, Esri ArcGIS.
Disclaimer: PRD does not give any warranty in relation to the accuracy of the information contained in this report. If you intend to rely upon the information contained herein, you must take note that the information, figures and projections have been provided by various sources and have not been verified by us. We have no belief one way or the other in relation to the accuracy of such information, figures and projections. PRD will not be liable for any loss or damage resulting from any statement, figure, calculation or any other information that you rely upon that is contained in the material.
Prepared by PRD Research. © All medians and volumes are calculated by PRD Research. Use with written permission only. All other responsibilities disclaimed. © Copyright PRD 2025.