The Best Liquid Epoxy Solutions For Pipelines SCAN ME SCAN ME The Toughest HDD Coating on the Market HBE - The Best Performing Field Joint Coating ® Volume 23 Number 6 - June 2023
The leading innovator supplying cutting-edge integrity solutions. Together we can ensure sustainable decision-making. Our combination of advanced inspection systems and expert consultants delivers a comprehensive understanding of asset safety, lifetime, and performance.
Comprehensive Asset Integrity Management

www.rosen-group.com
C O NTENTS
03. Editor's comment
05. Pipeline news
PIPES Act proposal; ONEOK to buy Magellan Midstream Partners; construction updates from India, Africa, and the Middle East.

10. Delivering green hydrogen
The task of creating a green hydrogen economy is complicated by financial, technical and regulatory hurdles, says Gord Cope.
METERING AND MONITORING
38. Low-cost, low-orbit David Celine, Managing Director, Omniflex, Australia.

15. Natural gas vs hydrogen
Vicki Knott, CEO and Co-Founder, CruxOCM, USA, explores the similarities and differences between natural gas and hydrogen, as well as their energy potential in our existing transmission and distribution systems.
17. Rising to the challenge
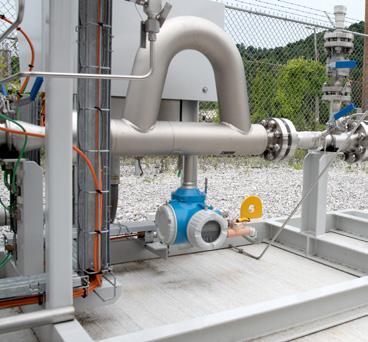
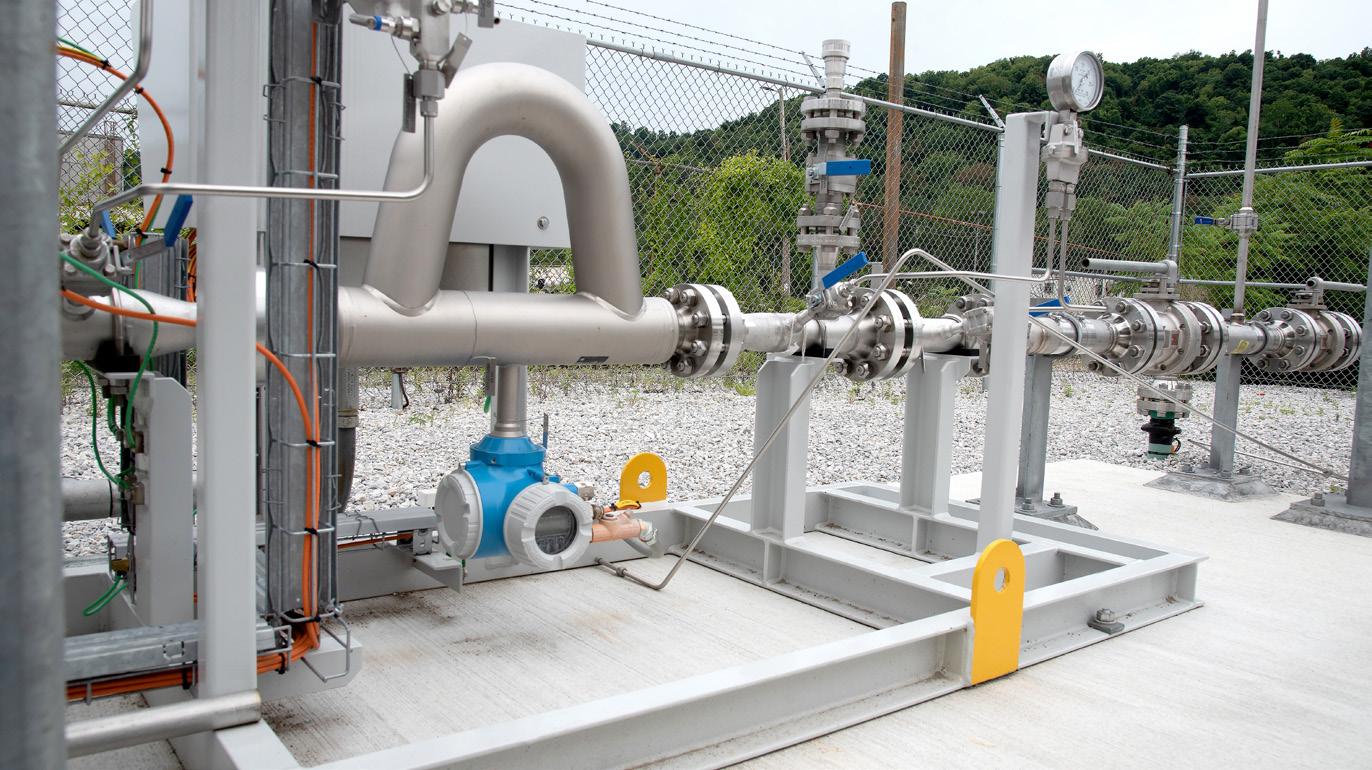
Natural gas blended with hydrogen is increasingly being seen as an important solution in the move toward a net-zero economy, says Rodrigo Quintero Bejarano, Expert Industry Manager, Endress+Hauser, Switzerland.
23. Optimising sustainability

John Anderton, Senior Simulation Consultant, Atmos International, UK, explores overcoming the sustainability challenges of hydrogen fuel transportation with leak detection.
INLINE INSPECTION
27. Monitoring pipeline movement
Daniel Bahrenburg and Roland Palmer-Jones, ROSEN, UK.
31. Detecting and sizing pinhole features
Alejandrino Ruiz, John Healy and Bradford Edwards, Pipecare US LLC, USA.
PIPELINE SENSING
43. High fidelity fibre optic monitoring
Ehsan Jalilian and Mike Hooper, Hifi Engineering, Canada.
SYSTEMS AND SOFTWARE
49. Before it breaks
Michael Ray and Greg Cameron, Emerson, USA.
COMPOSITE COATINGS

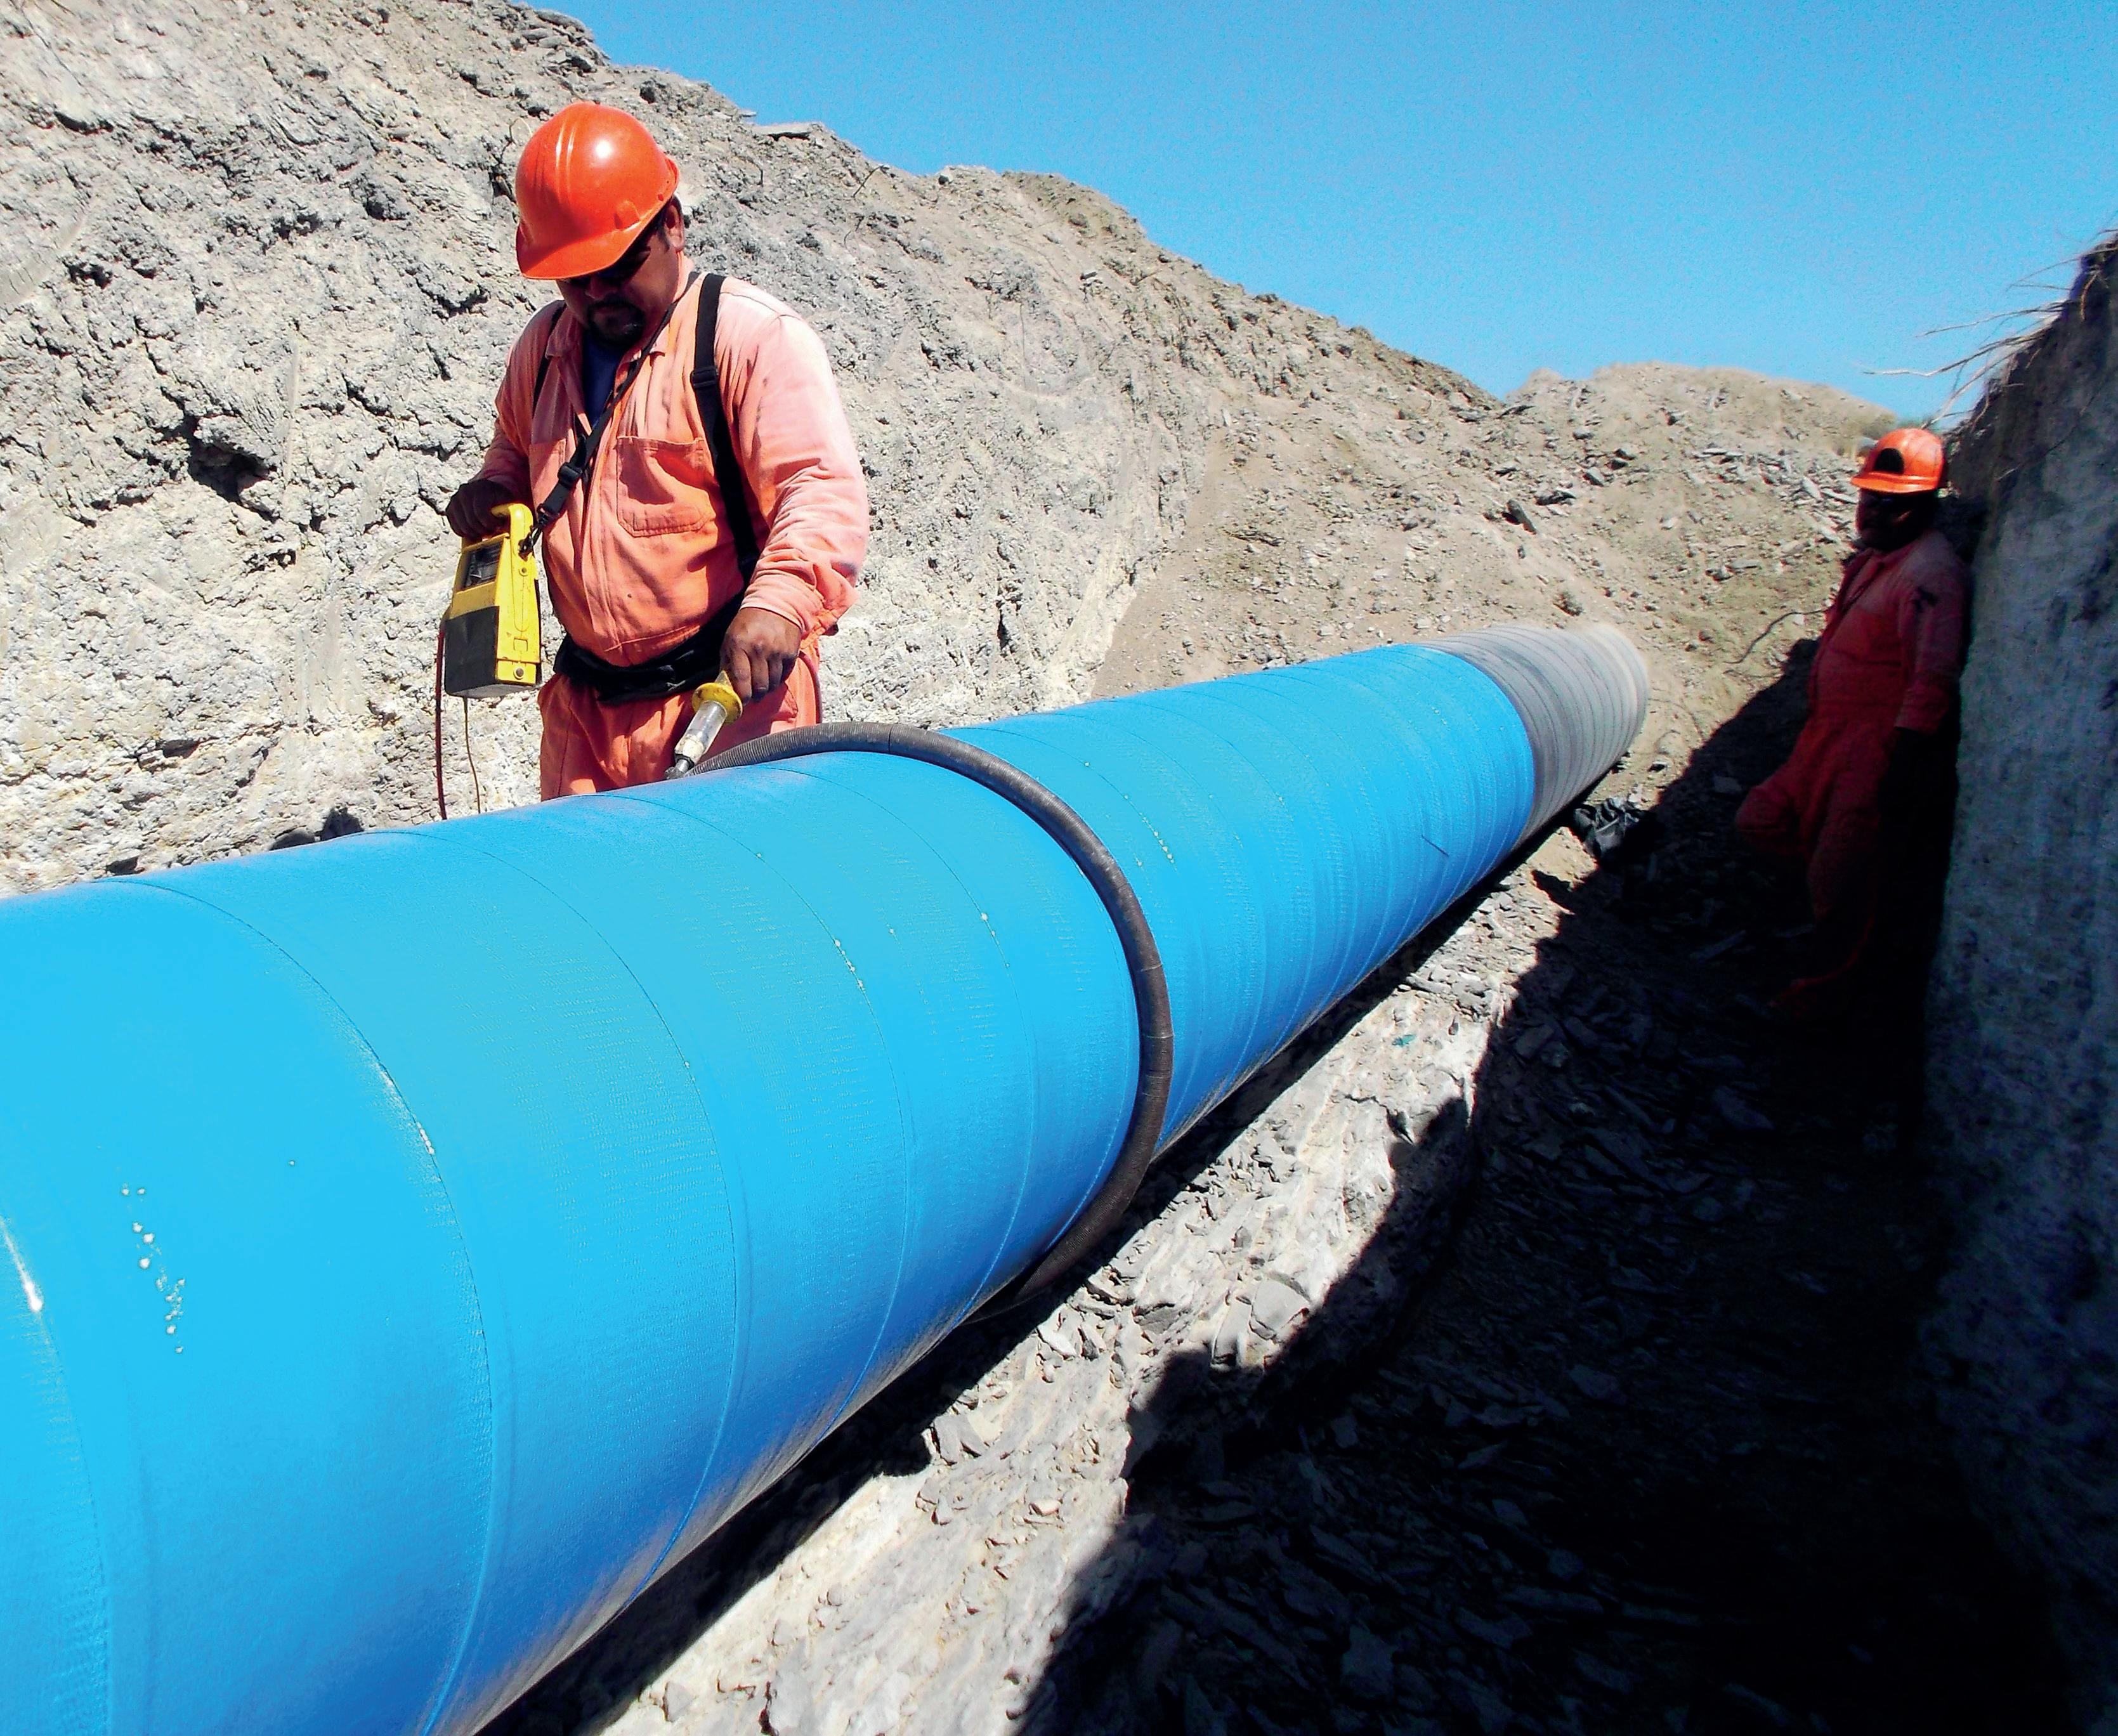
53. Eradicating external pipe corrosion
Hani Almufti and Yulman Flores, Cogbill Construction, USA.
57. Resin reinforcements
Yusuke Nishi, Senior Technical Service Engineer, Belzona, Thailand.
SUBSEA PIPELINES
61. Illuminating acoustic resonance technology
Pedro Rincon, Nathan Oliveira, Peter van de Camp, Mark Mateer, and Sean Legg, Shell, and Paul Chittenden, TSC Subsea.
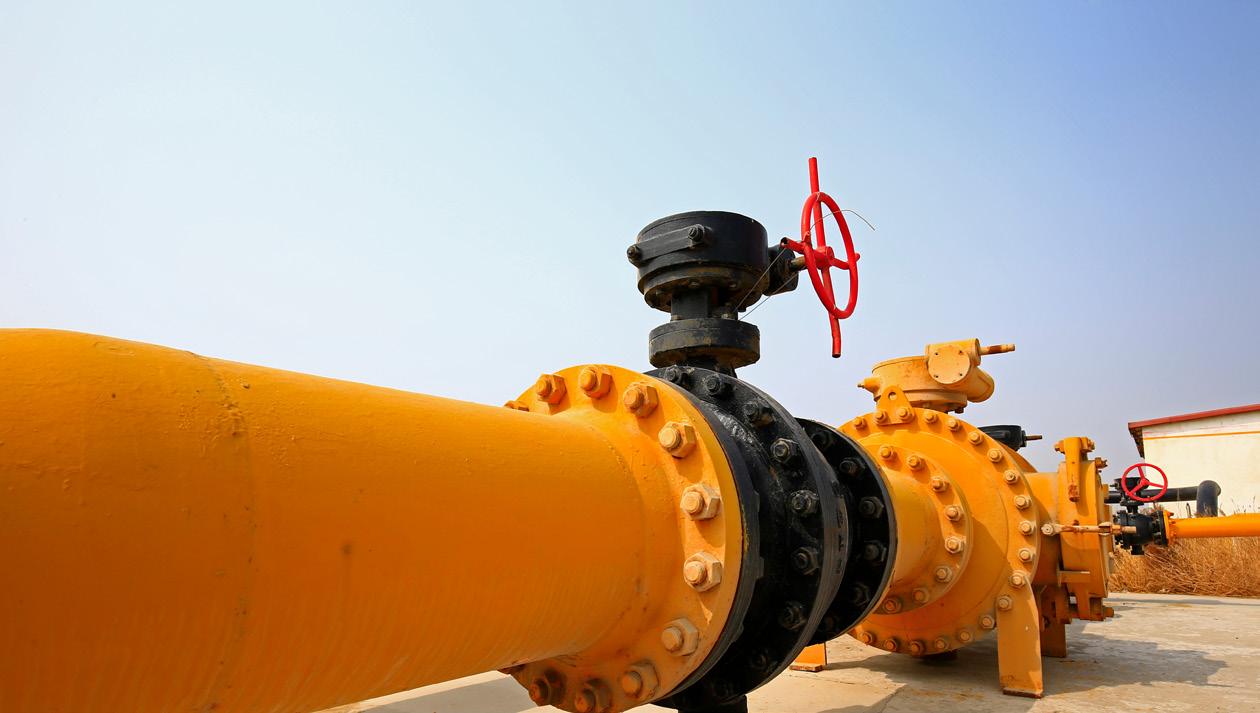
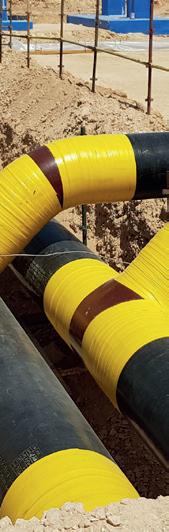
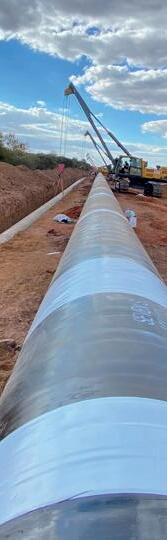
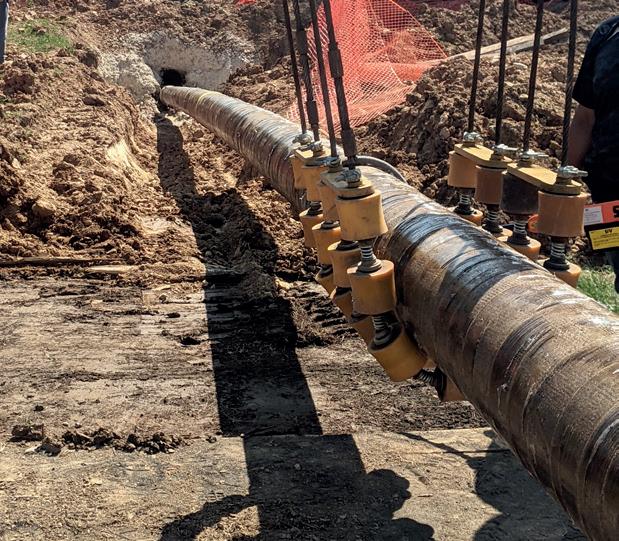
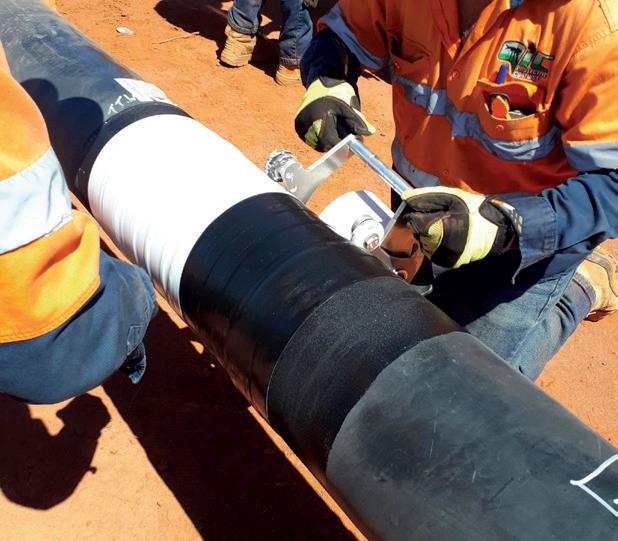
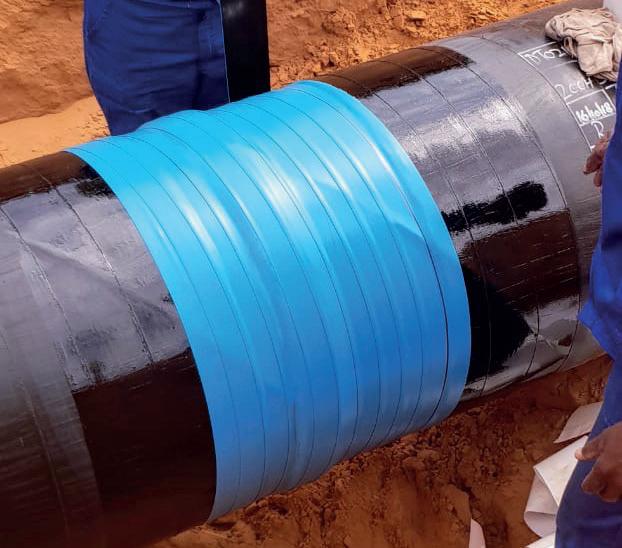
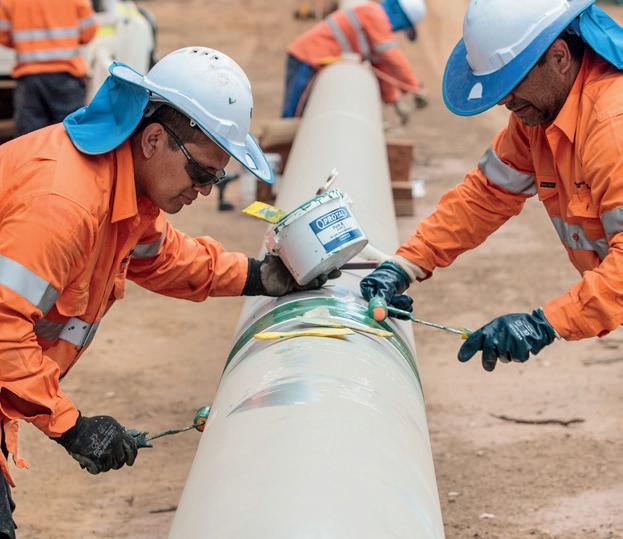
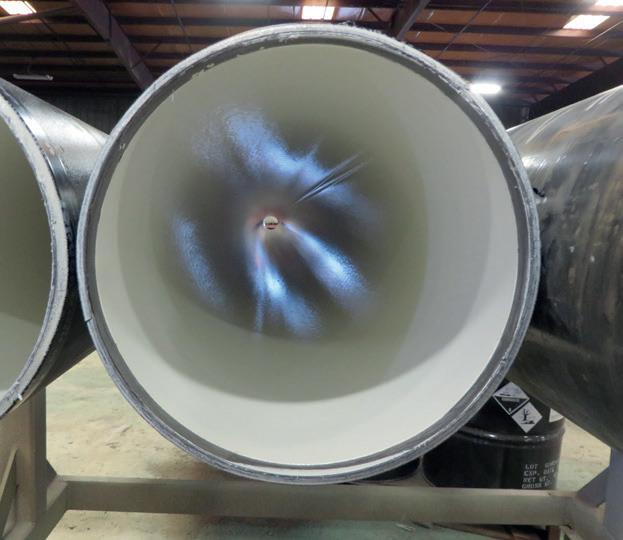
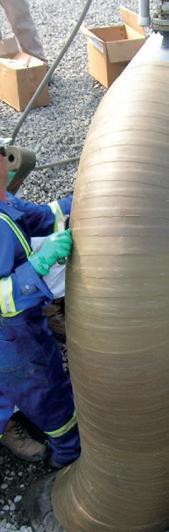
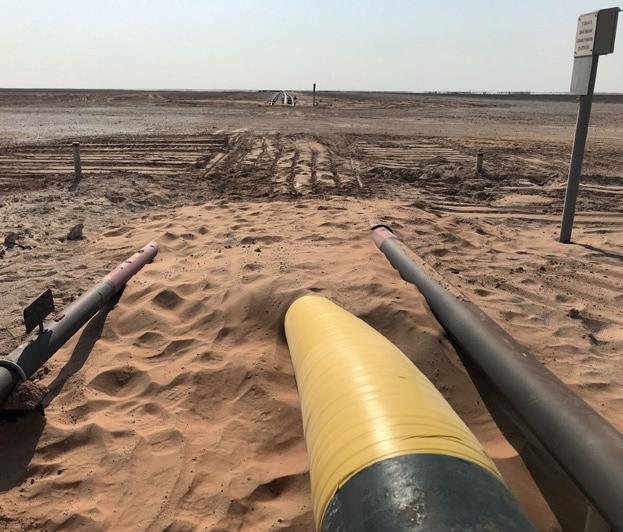
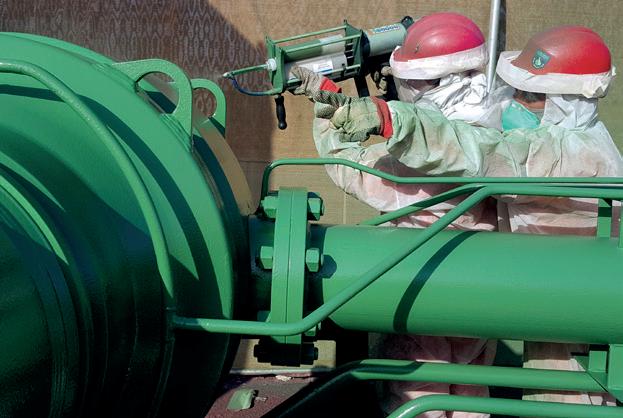
Seal For Life are home to the most comprehensive liquid epoxy line up in the industry. Combining industry-leading abrasion resistance with unmatched flexibility, our range of epoxy solutions are built tough, easy to apply and designed to last. Whether its HDD or field joint coatings, we’ve got the solution. For more information please visit www.sealforlife.com
ISSN 14727390 Member of ABC Audit Bureau of Circulations ON THIS MONTH'S COVER Reader enquiries [www.worldpipelines.com]
Copyright© Palladian Publications Ltd 2023. All rights reserved. No part of this publication may be reproduced, stored in a retrieval system, or transmitted in any form or by any means, electronic, mechanical, photocopying, recording or otherwise, without the prior permission of the copyright owner. All views expressed in this journal are those of the respective contributors and are not necessarily the opinions of the publisher, neither do the publishers endorse any of the claims made in the articles or the advertisements. Printed in the UK. WORLD PIPELINES | VOLUME 23 | NUMBER 6 | JUNE 2023
27 CBP006075 53
17 The Best Liquid Epoxy Solutions For Pipelines SCAN ME SCAN ME The Toughest HDD Coating on the Market HBE - The Best Performing Field Joint Coating ® Volume 23 Number 6 - June 2023
PAGE 38
segment anticipated to generate more than 22% of the global market share and will gain 90 basis points by the end of the forecast period [2022-2032].” Despite this, much of the innovation in impressed current cathodic protection (ICCP) systems has been limited to such as switch-mode based ICCP systems have become more popular for these applications because better suited to smaller currents driving more individual zones of protection. Switch-mode technology also In contrast, pipelines that run thousands of kilometres still tend to rely on simple yet reliable transformer/rectifiers (T/Rs) producing a single large output voltage, often the T/R is placed at pump stations situated along the length of the pipeline. Cables then run from the T/R to anode beds of high silicon cast-iron or mixed metal oxide, which are buried the ground short distance from T/Rs are oil-cooled, rather than air-cooled, especially for pipelines that are transporting hazardous materials like gas, oil or petrol, high levels of current over long distances, to overcome voltage drops to the anodes and maintain standard corrosion. For example, recent application quoted in the Middle East required around two dozen T/Rs each with power output of 10 kW This is relatively high output, given that most building-based applications require only 10 to protect against CP systems can experience significantly higher voltage drops than other accessible portions of overground David Celine, Managing Director, Omniflex, Australia, explains how inexpensive satellite technology is ushering in a new era for IoT based pipeline monitoring. 38 39 PAGE 10 G reen hydrogen hot. The ubiquitous element can be made anywhere using Unlike conventional hydrocarbon energy, consuming nations cannot be held hostage by energy-dense, and can be burned in fuel cells combustion engines (ICE), similar to gasoline emits nothing but water. Best of all, it can be economically transported by pipeline; Rystad Energy, a consultancy, estimates that there are over 90 hydrogen pipelines planned by 2035. But the infrastructure to create and deliver green cheap, with estimates quickly exceeding trillion of kick-starting the move to green hydrogen with Europe The EU has set goal of reducing greenhouse gases In the aftermath of the energy crisis related to the Ukraine war, it being generous with green hydrogen and €5.2 billion for Hy2Use (which will invest in applications in hard-to-decarbonise sectors such as dubbed the Hydrogen Bank, will help stimulate While onshore windfarms face uphill permitting swaths of sea in which to install renewable power assets. DNV, consultancy, is leading advocate in which it estimated that ‘North Sea hydrogen backbone’ consisting of 4200 km of pipelines could farms could generate an estimated 300 terawatt the estimated hydrogen consumption in 2050. GASCADE and Fluxys, transmission system operators based in Germany, are working to develop pipeline running from wind farms in the North Sea’s Dogger Banks to an energy hub on the Heligoland archipelago 60 km north of Schleswig-Holstein to the European Commission to have declared project of common interest (PCI). PCIs link energy procedures and funding from the Connecting Europe Facility (CEF). Bank of Aland announced major green hydrogen project, located in the Port of Långnäs, Finland. Two offshore wind farms with total of GW will complex where electrolysers will be used to create hydrogen and shipping fuels. (1 GW of capacity equals In March 2023, the Dutch government officially designated site for the world’s largest offshore de Waddeneilanden (the North of the Wadden Islands). The site, which has the potential for 700 MW of generation, will be connected to network. The announcement is part of the Dutch government’s contribution to the Esbjerg The task of creating a green hydrogen economy is complicated by financial, technical and regulatory hurdles, says Gord Cope. 10 11

Visit our website today: www.globalhydrogenreview.com The home for the latest hydrogen news, analysis and events
EDITOR’S COMMENT
CONTACT INFORMATION
MANAGING EDITOR
James Little james.little@palladianpublications.com
EDITORIAL ASSISTANT
Sara Simper sara.simper@palladianpublications.com
SALES DIRECTOR

Rod Hardy rod.hardy@palladianpublications.com
SALES MANAGER
Chris Lethbridge chris.lethbridge@palladianpublications.com
SALES EXECUTIVE
Daniel Farr daniel.farr@palladianpublications.com
PRODUCTION MANAGER
Calli Fabian calli.fabian@palladianpublications.com
EVENTS MANAGER
Louise Cameron louise.cameron@palladianpublications.com
DIGITAL EVENTS COORDINATOR
Stirling Viljoen stirling.viljoen@palladianpublications.com
DIGITAL CONTENT ASSISTANT
Merili Jurivete merili.jurivete@palladianpublications.com
DIGITAL ADMINISTRATOR
Leah Jones leah.jones@palladianpublications.com
ADMINISTRATION MANAGER
Laura White laura.white@palladianpublications.com
Palladian Publications Ltd, 15 South Street, Farnham, Surrey, GU9 7QU, UK
Tel: +44 (0) 1252 718 999
Website: www.worldpipelines.com
Email: enquiries@worldpipelines.com
Annual subscription £60 UK including postage/£75 overseas (postage airmail). Special two year discounted rate: £96 UK including postage/£120 overseas (postage airmail). Claims for non receipt of issues must be made within three months of publication of the issue or they will not be honoured without charge.
Applicable only to USA & Canada:
World Pipelines (ISSN No: 1472-7390, USPS No: 020-988) is published monthly by Palladian Publications Ltd, GBR and distributed in the USA by Asendia USA, 17B S Middlesex Ave, Monroe NJ 08831. Periodicals postage paid New Brunswick, NJ and additional mailing offices. POSTMASTER: send address changes to World Pipelines, 701C Ashland Ave, Folcroft PA 19032
At World Pipelines we’re paying close attention to pipelines for hydrogen transport, with the view that a hydrogen economy cannot be made a reality without sufficient infrastructure. One kilogram of hydrogen gas contains a lot of energy: you get a lot of bang for your buck. Hydrogen gas has a high gravimetric energy density and a low volumetric energy density: this means that it weighs almost nothing and is very energy dense but, per volume, the energy content of hydrogen is a lot lower than that of most other fuels and energy carriers. Storing or using hydrogen at atmospheric pressure and temperature requires a substantial amount of space. This means that hydrogen pipelines will be far more effective than vessels at moving hydrogen gas over short to medium range distances. In cases where hydrogen will be shipped (as hydrogen or its derivatives), it will eventually be distributed on land using hydrogen pipelines, which makes transport via pipelines a critical transportation mode for the gas.1
Over 4300 km of pipelines already exist for hydrogen transportation, with over 90% located in Europe and North America. Rystad Energy estimates that there are about 91 planned hydrogen pipeline projects in the world, totalling 30 300 km and due to come online by around 2035.2
A lot of talk about the subject centres around the idea of being ‘hydrogen-ready’. In mid-May, Italy’s Snam, Trans Austria Gasleitung (TAG), Gas Connect Austria (GCA) and German-based bayernets announced plans to combine hydrogen pipeline projects to create a 3300 km hydrogen-ready corridor. The SoutH2 Corridor will connect North Africa to central Europe, and could deliver 40% of Europe’s imported hydrogen demand by 2030.3 ‘Build it and they will come’ seems to be the aim here: the pipeline is designed to foster the production of renewable hydrogen in North Africa and southern Europe. It is estimated that Africa could produce 30 - 60 million t of hydrogen annually, and export up to two-thirds of that.
Plans for the H2Med pipeline (between France, Spain and Portugal) are a little further along: it is expected to be Europe’s first major hydrogen corridor, carrying 2 million tpy of hydrogen. Germany recently announced it is joining the project.
German energy firm RWE and Norwegian oil and gas producer Equinor signed an MoU in January to develop large-scale energy value chains between Germany and Norway which include renewable generation, hydrogen, and natural gas. The plans include hydrogen pipelines between the two countries.
Liberty Pipes has successfully passed trials to become the first UK producer of pipelines for the safe transportation and storage of hydrogen. Testing specialist Element Materials Technology has confirmed that Liberty’s 42 in. submerged arc welded (SAW) line pipe meets international requirements for hydrogen piping and pipelines. Liberty Pipes is one of only a handful of firms globally to confirm it can meet hydrogen standards.
Turn to p.10 for the special hydrogen section, which opens with World Pipelines correspondent Gordon Cope offering a broad overview of the task of delivering green hydrogen around the world. Vicki Knott at CruxOCM (p.15) compares hydrogen with natural gas. Endress+Hauser (p.17) considers safe blending of hydrogen and natural gas, and tackles accurate measurement of this tricky element. Finally, Atmos International (p.23) explores the sustainability challenges of hydrogen transportation.
1. www.demaco-cryogenics.com/blog/energy-density-of-hydrogen
2. www.rystadenergy.com/news/building-the-future-hydrogen-pipelines-start-to-materialize-in-europe
3. www.h2-view.com/story/italy-austria-germany-tie-up-on-hydrogen-pipeline-project-that-could-deliver-40-ofeuropes-imported-hydrogen-demand
SENIOR EDITOR Elizabeth Corner elizabeth.corner@palladianpublications.com
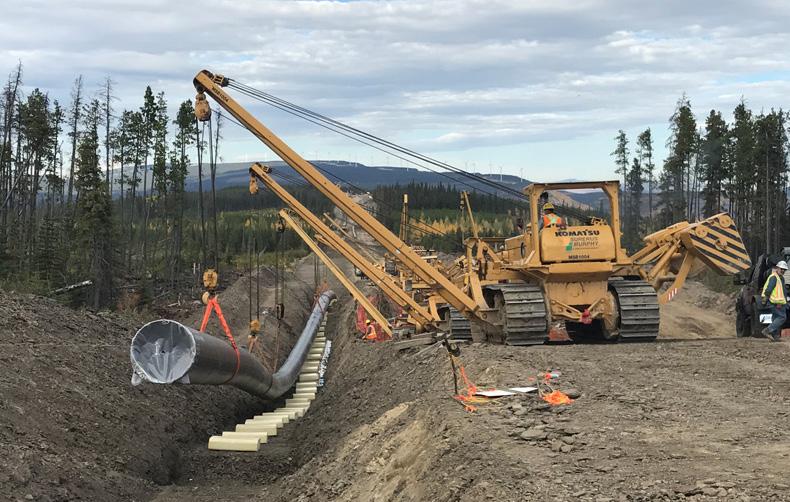
The welding and coating experts you can trust


Ensure the efficient, on-time delivery of your onshore and offshore projects with CRC Evans’ market-leading welding and coating services, technologies and integrated solutions, and extensive fleet of pipeline equipment
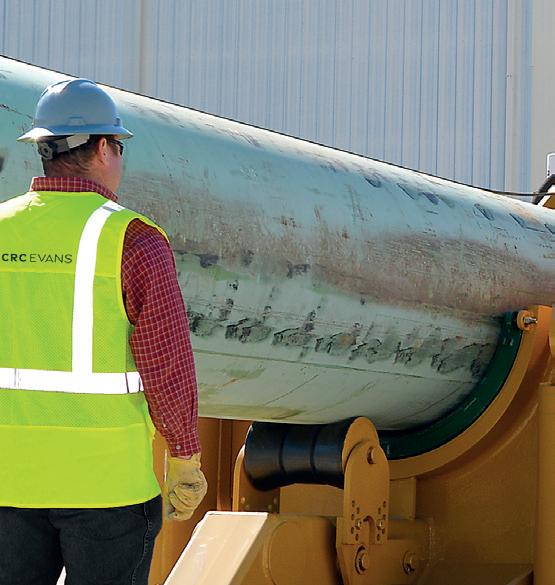
americas Europe Middle East Africa Asia Pacific crcevans.com enquiries@crce.com @crcevansglobal CONNECT WITH CRC EVANS
WORLD NEWS
USDOT announces bipartisan PIPES Act proposal
Following the Biden-Harris Administration’s historic announcement to invest US$196 million in grants for 37 pipeline modernisation projects spread across 19 states, the US Department of Transportation’s Pipeline and Hazardous Materials Safety Administration (PHMSA) has announced it is proposing a new rule to significantly improve the detection and repair of leaks from gas pipelines.
As directed by the bipartisan PIPES Act of 2020, the proposed rule would create good-paying jobs, deploy pipeline workers across the country to keep more product in the pipe, and prevent dangerous accidents. These actions, if finalised, would boost efficiency, cut harmful pollution and waste, and create an estimated up to US$2.3 billion annually in benefits.
The Notice of Proposed Rulemaking – transmitted to the Federal Register on 5 May – would enhance public safety and lower methane emissions and other air pollution from more than 2.7 million miles of gas transmission, distribution, and gathering pipelines; 400+ underground natural gas storage facilities; and 165 LNG facilities. The proposed rule will update decades-old federal leak detection and repair standards that rely solely on human senses in favour of new requirements that add an additional layer of safety by deploying commercially available, advanced technologies to find and fix leaks of methane and other flammable, toxic, and corrosive gases. These health and safety improvements will advance environmental justice in communities where gas pipeline infrastructure is disproportionately sited.
“Quick detection of methane leaks is an important way to keep communities safe and help curb climate change,” said US Transportation Secretary, Pete Buttigieg. “We are proposing a long-overdue modernisation of the way we identify and fix methane leaks, thereby reducing emissions and strengthening protections for the American people.”
Fixing wasteful and dangerous pipeline leaks is a core part of the Biden-Harris Administration’s US Methane Emissions Reduction Action Plan to cut energy waste and pollution, boost efficiency, and create good-paying jobs. In 2030 alone, this rule has the potential to eliminate up to 1 million t of methane emissions – equivalent to 25 t of carbon dioxide, or the emissions from 5.6 million gas-powered cars. Overall, the
rule would reduce emissions from covered pipelines by up to 55%. The proposal requires pipeline operators to establish advanced leak detection programmes aimed at detecting and repairing all gas leaks by:
) Strengthening leakage survey and patrolling requirements by increasing the frequency of surveys and requiring the use of commercially available, advanced leak detection technology – such as aerial or vehicle surveys, handheld detection devices, and continuous monitoring systems –with flexibility for operators to use a range of approaches to meet a minimum performance standard.
) Reducing the volume of gas released due to unintentional emissions like leaks and equipment failures and revising the reporting minimum threshold to detect smaller leaks sooner.
) Minimising intentional releases, such as those caused by equipment venting or blowdowns, associated with pipeline maintenance, repair and construction, and encouraging operators to consider cost-effective equipment that can capture the methane for later use.
) Establishing explicit criteria and timeframes for the timely repair of all leaks that pose a risk to public safety or the environment.
Section 113 of the bipartisan PIPES Act of 2020 mandated the issuance of a rulemaking requiring the development of advanced leak detection programmes capable of identifying, locating, and categorising natural gas leaks from pipeline infrastructure for timely repair. In June 2021, PHMSA issued guidance to gas and hazardous liquid pipeline operators that operators must update their operations and maintenance plans to minimise emissions, underscoring Congress’ new requirement in section 114 of the PIPES Act of 2020. In 2022, PHMSA fanned out across the country to inspect operations and maintenance plans to ensure compliance. The recently proposed rule builds on these actions by indicating exactly what pipeline operators must do to comply once the rule is finalised in the coming months.
ONEOK to buy Magellan Midstream Partners for US$18.8 billion
ONEOK Inc. agreed on 14 May to buy US pipeline operator Magellan Midstream Partners in a cash-and-stock deal valued at about US$18.8 billion including debt, bringing natural gas-focused ONEOK into transporting refined products and oil, reports Reuters.
ONEOK will pay US$25 and 0.6670 shares of ONEOK common stock for each outstanding Magellan common unit, representing a premium of 22% based on Magellan shares’ closing price on 12 May. The buyer will also assume Magellan’s US$5 billion debt pile.
The deal will give ONEOK, until now a transporter of NGLs
and natural gas, access to Magellan’s refined products and crude oil transportation business. The combined company will have 44% of its business in NGLs, and 21% in refined products, according to a presentation.
The deal, expected to close in 3Q23, should be accretive to ONEOK’s earnings per share beginning in 2024, with EPS accretion of 3 - 7% per year from 2025 - 2027.
The combined company will own more than 25 000 miles of liquids-oriented pipelines, with significant assets and operational expertise at the Gulf Coast and Mid-Continent market hubs.
JUNE 2023 / World Pipelines 5
USA
Tellurian Inc. announced that the US Federal Energy Regulatory Commission (FERC) issued the certificate on 21 April 2023 granting authorisation for Driftwood Pipeline, LLC’s Line 200 and Line 300, a US$1.4 billion natural gas transmission project to be located in Beauregard and Calcasieu Parishes, Louisiana.
CANADA
Pembina Pipeline Corporation has provided an update on the operational impacts of the wildfires in Alberta and British Columbia, Canada: all Pembina facilities previously shut down due to the wildfires have resumed operations.
UK
LIBERTY Pipes Hartlepool has successfully passed trials to become the first UK producer of pipelines for safe transportation and storage of hydrogen.
RUSSIA
Transneft said on Wednesday 10 May that a filling point on the Europe-bound Druzhba pipeline in a Russian region bordering Ukraine had been attacked.
AUSTRALIA
Caroline Cherry has been appointed Western Australian Director of the Australian Petroleum Production & Exploration Association (APPEA).
USA
Percepto has announced receipt of an unprecedented waiver from the Federal Aviation Administration (FAA). The approval allows the company to operate uncrewed aircraft systems (UAS) beyond visual line of sight (BVLOS) in shielded airspace, without humans onsite, and without ground-based or airborne detect and avoid (DAA) systems, for inspection and monitoring operations at critical and non-critical infrastructure sites nationwide.
WORLD
India to dominate upcoming trunk/transmission pipeline length additions in Asia
India is set to dominate the trunk/ transmission pipeline length additions for planned and announced projects in Asia 2023 - 2027, contributing around 46% of the region’s total planned and announced pipeline additions by 2027, according to GlobalData, the data and analytics company.
GlobalData’s latest report, ‘Oil and Gas Pipelines Length and Capital Expenditure (CapEx) Outlook by Region, Countries and Companies including Details of New Build (Planned and Announced) Projects and Forecast, 2023 - 2027’, reveals that India is likely to add a planned pipeline length of 27 543 km (projects that received all necessary approvals) and an announced pipeline length of 2208 km (projects yet to receive approvals) by 2027.
Bhargavi Gandham, Oil & Gas Analyst at GlobalData, comments: “Pipelines are an efficient and cheaper way of transporting oil and gas for large countries such as India. The
growing economy and strong demand for oil and gas are mainly driving pipeline additions in the country.”
Kandla-Gorakhpur LPG pipeline is the largest upcoming oil and gas pipeline project by 2027 in India, with a total length of 2809 km. The pipeline, which is set to begin operations in 2024, would serve LPG bottling facilities in the states of Gujarat, Madhya Pradesh, and Uttar Pradesh to meet the growing demand for the commodity.
Jagdishpur-Haldia Phase II gas pipeline ranks second in India in terms of length among the upcoming transmission pipelines by 2027. With a length of 1900 km, it is scheduled to start operations in 2023. The pipeline is part of the Indian government’s initiative to connect eastern states such as West Bengal with the national gas transmission network. GAIL (India) is the operator as well as the 100% equity owner of the project.
National Petroleum Corporation, Iraq’s Ministry of Oil, India’s Numaligarh Refinery Limited, and France’s TotalEnergies.
The longest pipeline projects under construction are the 1950 km Niger-Benin Oil Pipeline and the Paradip Numaligarh Crude Pipeline (PNCPL) in India, both slated to start operating in 2024. Canada is home to the third-largest pipeline project under construction, the 980 km Trans Mountain Expansion (TMX), expected to start in 2023 as an expansion to the existing Trans Mountain Oil Pipeline.
Half of all oil pipelines under construction are in Africa and Middle East Africa and the Middle East are home to 49% of all oil transmission pipelines under construction globally at a cost of US$25.3 billion, according to new data from Global Energy Monitor. The 2023 annual survey of data in the Global Oil Infrastructure Tracker shows that these regions together are building 4400 km of crude oil transmission pipelines at an estimated CAPEX of US$14.4 billion. An additional 10 800 km are proposed in these regions at an estimated cost of US$59.8 billion.
Globally, there are 9100 km of oil transmission pipelines under construction and an additional 21 900 km of proposed pipelines. These pipelines in development are estimated to cost US$131.9 billion in CAPEX.
The leading five countries in terms of in-development pipelines (proposed and under construction) are the US, India, Iraq, Iran, and Tanzania.
The top five parent companies developing oil pipelines are state-owned enterprises and private companies, including Iran’s Ministry of Petroleum, the China
Baird Langenbrunner, Project Manager for the Global Oil Infrastructure Tracker, said: “The crude expansion in Africa and the Middle East is pumped as a panacea to the chaos of global energy demand, which is driven in large part by Europe’s scramble for oil and gas outside of Russia. But the approach might entrench these regions to costly infrastructure that will in time need phasing out, saddling them with stranded assets. The solution is not to build more crude oil pipelines but to use that money and plan reliable, low-carbon energy systems and transmission networks.”
6 World Pipelines / JUNE 2023
NEWS IN BRIEF
PROTECTIVE OUTERWRAPS
HEAT SHRINKABLE SLEEVES
SOIL-TO-AIR INTERFACE
INTERNAL
DENSO™ are leaders in corrosion prevention and sealing technology. With 140 years’ service to industry, our mainline and field joint coating solutions offer reliable and cost effective protection for buried pipelines worldwide.


United Kingdom, UAE & India
USA & Canada
Australia & New Zealand
Republic of South Africa
FOR CORROSION PREVENTION
www.denso.net

www.densona.com
www.densoaustralia.com.au
www.denso.co.za
LIQUID EPOXY COATINGS
PETROLATUM TAPE WRAP SYSTEMS
BUTYL TAPE WRAP SYSTEMS
PIPE LININGS
BITUMEN TAPE WRAP SYSTEMS
A MEMBER OF WINN & COALES INTERNATIONAL
VISCO-ELASTIC COATINGS
CONTRACT NEWS
EVENTS DIARY
13 -15 June 2023
Global Energy Show 2023
Calgary, Canada www.globalenergyshow.com
8 - 10 August 2023
Rio Pipeline 2023
Rio de Janeiro, Brazil www.riopipeline.com.br
5 - 8 September 2023
Gastech 2023 Singapore www.gastechevent.com
5 - 8 September 2023
SPE Offshore Europe 2023
Aberdeen, Scotland www.offshore-europe.co.uk
11 - 15 September 2023
IPLOCA 2023 convention
Vancouver, Canada www.iploca.com/events/annualconvention/2023-convention
17 - 21 September 2023
World Petroleum Congress 2023
Calgary, Canada www.24wpc.com
21 - 22 September 2023
Subsea Pipeline Technology Congress (SPT 2023)
London, UK www.sptcongress.com
2 - 5 October 2023
ADIPEC 2023
Abu Dhabi, UAE www.adipec.com
Major contract win in East Coast Hydrogen Pipeline project
Fisher German, infrastructure consultancy, has won a contract to provide land services and initial consultation for the construction of a major hydrogen cluster scheme which will help the UK reach its net-zero targets.
Fisher German will work as part of a multi-disciplinary team including Worley, J. Murphy & Sons, SLR and Camargue to support the pre-FEED and FEED of Cadent’s East Coast Hydrogen Pipeline (ECHP), which will connect hydrogen plants to end users and other strategic networks in the east region. The multi-disciplinary team will be identifying the consenting regime and developing the consenting strategy in preparation for FEED.
The project, led by East Coast Hydrogen (ECH2), will connect 10 GW of hydrogen production from Humber and Teesside industrial hubs to the gas network. If completed, the project is set to convert up to 39 000 businesses over a 15 year timescale. It is also estimated to create tens
of thousands of jobs in the future hydrogen economy.
Mark Gilkes, Partner at Fisher German and its DCO Land Strategy Lead, said: “We are delighted to have been awarded the project to assist Cadent and the team with identification of landowners, land constraints and, in the future, to secure land rights for the East Coast Hydrogen Pipeline. Before any potential NSIP like this can make progress, landowners along the route of the pipeline must be consulted extensively and their views considered by the Planning Inspectorate.
Adam Knight, Cadent Project Director, said: “This is a major milestone not only in the commencement of the first stage of design, but setting down another marker in Cadent’s ambitions and efforts to transition from natural gas to low carbon hydrogen, supporting UK economic growth and playing an integral role in the decarbonisation of our networks.”
Corinth Pipeworks awarded contract for deepwater pipeline
Corinth Pipeworks has been awarded a contract to manufacture and supply approximately 15 km of 23 in. and 26 in. longitudinally submerged arc welded steel pipes for Equinor’s IRPA field development project.
The IRPA gas discovery is located in the Vøring Basin, the deepest field development on the Norwegian continental shelf (1350 m deep), and will be developed as tie-in project to Aasta Hansteen platform. This offshore tie-in project will contribute to increased gas supply to Europe and extend the lifetime of the platform.
The pipes will be manufactured at Corinth Pipeworks’ facilities in Greece, and offshore installation work will commence according to schedule within 2025.
Ilias Bekiros, General Manager of Corinth Pipeworks, commented “CPW has had a huge impact in offshore pipeline markets in recent years, and we are proud to have successfully delivered our pipes to 20 major projects in the North Sea region over the last 5 years. We are particularly delighted to be working with Equinor, one of the pioneering global IOCs, and their frame agreement partner Mitsui, on this project.”
THE MIDSTREAM UPDATE
• Wood and SGN accelerate UK hydrogen plans
• China continues to lead midstream project starts in Asia
• Sir Jim Ratcliffe: “I fear for the future of the North Sea”
• IMCA announces new CEO
• Pembina Pipeline reports 1Q23 results
• PHMSA proposes vital standards to enhance safety
• DTEK Oil&Gas digitises base fields
8 World Pipelines / JUNE 2023
Follow us on LinkedIn to read news articles and more linkedin.com/showcase/worldpipelines


Green hydrogen is hot. The ubiquitous element can be made anywhere using renewable power, water and electrolysis. Unlike conventional hydrocarbon energy, consuming nations cannot be held hostage by a belligerent producing country. Hydrogen is also energy-dense, and can be burned in fuel cells or converted to ammonia and used in internal combustion engines (ICE), similar to gasoline diesel and jet-fuel. When consumed as fuel, it emits nothing but water. Best of all, it can be economically transported by pipeline; Rystad Energy, a consultancy, estimates that there are over 90 projects with a total exceeding 30 000 km of new hydrogen pipelines planned by 2035. 1
But the infrastructure to create and deliver green hydrogen to industry, utilities and consumers is not cheap, with estimates quickly exceeding trillion of dollars. Governments around the world are therefore kick-starting the move to green hydrogen with a combination of subsidies and regulations.
Europe
The EU has set a goal of reducing greenhouse gases (GHGs) by at least 55% below 1990 levels by 2030. In the aftermath of the energy crisis related to the Ukraine war, it is being generous with green hydrogen subsidies, including €5.4 billion for Hy2Tech (an initiative that aims to perfect hydrogen technology), and €5.2 billion for Hy2Use (which will invest in applications in hard-to-decarbonise sectors such as cement, steel and glass). A further €3 billion subsidy, dubbed the Hydrogen Bank, will help stimulate demand.
While onshore windfarms face uphill permitting battles on the populated continent, the EU has vast swaths of sea in which to install renewable power assets. DNV, a consultancy, is a leading advocate for developing green hydrogen in the

North Sea. It recently released a study in which it estimated that a ‘North Sea hydrogen backbone’ consisting of 4200 km of pipelines could be built using existing technology at a cost of US$15.9 billion to US$23.3 billion. Offshore wind farms could generate an estimated 300 terawatt hours (TWh) of power, enough to create up to 15% of the estimated hydrogen consumption in 2050.
GASCADE and Fluxys, transmission system operators based in Germany, are working to develop the AquaDuctus project, an offshore green hydrogen pipeline running from wind farms in the North Sea’s Dogger Banks to an energy hub on the Heligoland archipelago 60 km north of Schleswig-Holstein (Germany). In early 2023, they submitted their project to the European Commission to have it declared a project of common interest (PCI). PCIs link energy systems in the EU, and the official designation can benefit projects with accelerated permitting procedures and funding from the Connecting Europe Facility (CEF).
In February 2023, OX2, based in Sweden, and the Bank of Aland announced a major green hydrogen project, located in the Port of Långnäs, Finland. Two offshore wind farms with a total of 8 GW will be connected to facilities in the Mega Grön Hamn complex where electrolysers will be used to create hydrogen and shipping fuels. (1 GW of capacity equals about 160 000 tpy of green hydrogen production). A dedicated pipeline is also planned for exports.
In March 2023, the Dutch government officially designated a site for the world’s largest offshore hydrogen production project; the Ten noorden van de Waddeneilanden (the North of the Wadden Islands). The site, which has the potential for 700 MW of generation, will be connected to Gasunie’s proposed offshore hydrogen pipeline network. The announcement is part of the Dutch government’s
10
The task of creating a green hydrogen economy is complicated by financial, technical and regulatory hurdles, says Gord Cope.

11
contribution to the Esbjerg Declaration that commits the Netherlands, Belgium, Denmark and Germany to achieve 20 GW of green hydrogen offshore capacity by 2030.
In December 2022, Spain and France announced H2Med, a €2.5 billion initiative to build a 450 km undersea hydrogen pipeline between the two countries. The pipeline, which had previously been intended to carry natural gas until hydrogen technologies had matured, will run from Barcelona to Marseille and deliver up to 10% of Europe’s expected hydrogen consumption by 2030. The hydrogen is expected to be produced by wind and solar facilities in Portugal and Spain, and be transported to Barcelona by land pipelines.
Most of the green hydrogen is initially slated to replace conventional usage in refineries and industry, but around 20% of energy consumption is used to heat homes. Because conventional gas distribution networks can handle up to 25% hydrogen without serious complications, it can piggy-back its way into homes. In late 2022, the UK’s Department for Business Energy and Industrial Strategy announced proposals to introduce hydrogen-ready domestic boilers, starting in 2026. The modifications would allow technicians to easily convert fuels from natural gas to hydrogen, or a mix of the two. The British Energy Security Strategy currently aims for 10 GW of domestic hydrogen production by 2030.
USA
The White House under the Biden administration has set out an ambitious target of promoting hydrogen as a clean fuel source, ear-marking billions of dollars to subsidise the cost of green hydrogen and develop infrastructure.
The US has approximately 1600 miles of existing hydrogen pipelines, most of which are located in the refinery and petrochemical corridor along the US Gulf Coast (USGC) in Texas and Louisiana. The majority of hydrogen is created using traditional, carbon-intensive processes, but the following plans are underway to create green hydrogen:
) Renewable fuels developer HIF Global has plans for a US$6 billion green hydrogen fuel plant in the Bay City area of Texas. When completed in 2026, the plant will produce 200 million gal./yr of green fuels.
) Air Products and partners are building a US$4 billion plant in Wilbarger County, Texas, to produce 200 tpd of green hydrogen.
) OCI N.V., based in the Netherlands, is constructing a US$1 billion blue hydrogen plant in Beaumont, Texas.
While output from the new hydrogen facilities will primarily flow through the dedicated lines currently servicing refineries, petrochemical and fertilizer plants, opportunities for pipeline expansion will arise as new facilities seek low-carbon feedstock and energy inputs.
Southern California Gas (SoCalGas) and San Diego Gas & Electric (SDG&E), have announced plans to experiment
with blending hydrogen and natural gas for customers in California. The US$35.3 million demonstration project would see a 5% hydrogen mix used by residential and commercial buildings.
SoCalGas is also developing Angeles Link, a dedicated, green hydrogen pipeline system that could deliver up to 25% of the company’s current gas capacity. Potential customers include electric utilities, heavy transportation and industry. The system has the potential to displace the equivalent of 3 million gal./d of diesel. The pipeline system would likely originate in the desert east of Los Angeles (LA) where contracted firms would generate hydrogen using abundant wind and solar power and electrolysers. The pipeline would terminate within the LA basin near current utility plants or the port of LA, where approximately 20 000 heavy-duty loading trucks could be converted to hydrogen fuel.
Asia
China is the world’s largest producer of hydrogen, with approximately 33 million tpy made from coal and natural gas. There are also several hundred km of existing dedicated pipelines that primarily supply refineries and petrochemical plants.
In March 2022, China’s government announced a multi-decade national plan to develop a hydrogen energy sector. The plan, which runs to 2035, seeks to coordinate a complete hydrogen value chain to support a green energy transition, including regulatory framework, production, distribution, fuel cells and vehicles; an initial goal of 100 000 tpy has been set for 2025.
While international investors are welcome to contribute in most aspects of the plan, many of the initial pilot phases will be met by state-players, including oil companies, utilities and regional governments. In November 2022, Sinopec announced that it was building a green hydrogen project in the Mongolian city of Ulanqab. The US$2.8 billion project is designed to produce 100 000 tpy of hydrogen from wind power: the output will be shipped by a 400 km dedicated pipeline to the company’s petrochemical complex in Beijing. The project is part of its massive US$15 billion investment in hydrogen.
In August 2022, Shanghai unveiled ambitious plans to become China’s leading city in clean hydrogen. The proposals include the manufacture of electrolysers, fuel cells and storage tanks, the production of hydrogen, filling stations for hydrogen-fuelled trucks and buses, a hydrogen trading platform and a dedicated pipeline network. No funding details have been announced, but the city is scheduling demonstration projects in its industrial zones to aid in planning.
Japan, which is heavily dependent on energy imports, announced plans in April 2023 to boost hydrogen supplies from 4 to 12 million tpy by 2040. The push will involve spending US$113 billion of private and public money over the next 15 years. In late 2022, Tokyo unveiled plans to supply the 14 million residents of the capital with a dedicated pipeline network that would deliver green
12 World Pipelines / JUNE 2023

hydrogen from the port of Kawasaki to residential and industrial customers throughout the metropolitan area. Studies are currently underway to gauge costs and scope of the project.
Problems
Hydrogen tends to make conventional steel crack and fail. In March 2023, investigations by the US Bureau of Safety and Environmental Enforcement (BSEE), revealed that the cause of an offshore leak at an oilfield in the Gulf of Mexico was due to hydrogen embrittlement. The 2020 incident occurred after the studs on a connecting flange failed due to contact with minute traces of hydrogen in the crude being pumped.
Norway-based DNV is coordinating H2Pipe, a jointindustry project to develop a new code that governs the safe design, construction and operation of offshore pipelines that carry pure and blended hydrogen. The first phase of the project was initiated in 2021, with a test programme to fill gaps in current knowledge regarding the degradation of mechanical properties in steel pipe. The results narrowed down the number of key variables for the main test programme in Phase 2. In March 2023, DNV launched Phase 2, which will involve greater in-depth testing in order to create a detailed guideline in the design and repurposing of offshore pipelines for hydrogen transport. DNV expects to publish its set of standards in 2025.
A dedicated hydrogen gas or liquid network might also be superseded by a new technology; liquid organic hydrogen carrier (LOHC). Molecules such as benzyltoluene, which has similar properties to diesel, can repeatedly absorb large volumes of hydrogen, which can then be transported in the existing systems used for crude and refined fuels. The technology is currently being commercialised.
The biggest hurdle is capital investment. Creating a new energy sector based on green hydrogen is reckoned to be exceedingly expensive when compared to other green alternatives. A 100 000 m 3 storage tank for green ammonia, for instance, costs approximately US$50 million, while a liquid hydrogen tank is close to US$200 million. The EU has estimated that it would cost US$430 billion to achieve a 14% hydrogen share of the continent’s energy demand in 2050. DNV calculates that global spending on producing green hydrogen will reach almost US$7 trillion, from now until 2050, with an additional US$180 billion on hydrogen pipelines.
Researchers are looking for ways to cut costs. Studies have shown that using existing gas grids for hydrogen transport is four times more cost-effective than constructing new pipelines. Lines made of unsuitable materials can be repurposed through relatively cheap reinforced thermoplastic pipes (RTP). In the UK, for instance, over 60% of the existing gas distribution ironpipe network has been upgraded by inserting an RTP lining; most of these networks are now considered suitable for future hydrogen use.
The future
Currently, electrolysis can produce hydrogen at a cost of US$5/kg; the goal is to reduce it to under US$2/kg, similar to conventional production. Research is focusing on commercially-available electrolysers to reduce capital costs and increase efficiency. Proton exchange membrane (PEM) electrolysers cost approximately US$1400 - 1700/kg of production, and use 52 kWh of electricity to produce 1 kg of hydrogen; developers are looking at ways to replace expensive platinum catalysts. Liquid alkaline electrolysers use less expensive nickel-based catalysts and cost roughly US$800 - 1000/kg output, but use 55 kWh of electricity; efforts are underway to increase electrode efficiency. Solid oxide electrolysers, currently in the development stage, essentially reverse the operation of fuel cells, leading to significantly lower energy input per kg of produced hydrogen.
Scientists at the US Department of Energy’s National Renewable Energy Laboratory (NREL), are also examining the potential for solar thermochemical hydrogen (STCH) production, which has the potential for being much more efficient than electrolysis. The process relies on focusing the sun’s rays to heat metal oxides to 1400˚C (2552˚F), which are then quenched with steam to split the water atoms into oxygen and hydrogen. Currently, research is underway to find the most efficient metal oxides.
Researchers at RMIT University in Melbourne, Australia have devised a method of separating hydrogen directly from seawater. Using a new catalyst compound called nitrogendoped porous nickel molybdenum phosphide, the process breaks down water into hydrogen and oxygen molecules using very little energy, and under room temperature conditions. The method also eliminates the byproduct of toxic chlorine gas, a problem with using seawater in electrolysis. The academics estimate that the process will produce hydrogen for under US$2/kg, making it competitive with conventional hydrogen.
Further down the road, natural sources might obviate the need for production entirely. Scientists are studying the formation of pure hydrogen deep in the mantle of the Earth, where temperatures approach that of the sun. This ‘white’, or naturally-derived hydrogen then percolates up to the near-surface, where it can be acquired using wells drilled into the substrate. Under certain geologic conditions, it can be captured as easily as natural gas and shipped directly to consumers.
In conclusion, the task of creating a green hydrogen economy is complicated by financial, technical and regulatory hurdles. But the potential benefits are also immense, and great strides are already being made around the world. The prospect holds out tremendous opportunities, and the energy transportation sector is well positioned to significantly participate and benefit over the coming decades.
14 World Pipelines / JUNE 2023
References 1. www.rystadenergy.com/news/building-the-future-hydrogen-pipelinesstart-to-materialize-in-europe
s the world is moving towards a more sustainable future, the energy sector is at the forefront of the transition. The shift from traditional fossil fuels towards renewable sources of energy is well underway, and this has put natural gas and hydrogen in the spotlight. Both of these energy sources are gaining attention, but how do they compare?
Size of the molecules
When comparing natural gas and hydrogen, one key difference is the size of their molecules. In terms of molecular weight, hydrogen (H2) is much lighter than methane (CH4), the primary component of natural gas. The molecular weight of hydrogen is 2 grams per mole, while the molecular weight of methane is 16 grams per mole. This means that the hydrogen molecule is eight times lighter than the methane molecule.
In terms of diameter, the van der Waals radius of a hydrogen molecule is about 120 picometers, while the van der Waals radius of a methane molecule is about 200 picometers. This means that
the hydrogen molecule is about 40% smaller in diameter than the methane molecule.
Lower and upper explosive limits

The lower explosive limit (LEL) is the lowest concentration of a gas or vapour in the air that can catch fire or explode if there is an ignition source. The LEL is an important safety consideration when handling and transporting flammable gases like natural gas or hydrogen.
The LEL of hydrogen is 4%. This means that if the concentration of hydrogen in the air is less than 4%, it is too lean to ignite and support combustion. However, if the concentration of hydrogen in the air is 4 - 75%, it is within the explosive range and can ignite and cause a fire or explosion if a spark or flame is present.
The LEL of natural gas can vary depending on the specific composition of the gas mixture. Typically, the LEL of natural gas is 4 - 5% by volume in air, and the upper limit is around 15 - 15.5%. In short, the explosive range of pure hydrogen is significantly greater
15
Vicki Knott, CEO and Co-Founder, CruxOCM, USA, explores the similarities and differences between natural gas and hydrogen, as well as their energy potential in our existing transmission and distribution systems.
than that of natural gas, which is why safety precautions are so critical when handling hydrogen.
How natural gas and hydrogen combust to create heat energy
When hydrogen gas is burned, it reacts with oxygen gas in the air to create water vapour and releases heat energy. Methane, the primary component of natural gas, combusts with oxygen in the air to produce carbon dioxide, water vapour, and heat. The combustion of natural gas releases CO2 emissions, which is why hydrogen as an energy source is so appealing – it produces no CO2 emissions.
Energy density
Energy density is a measure of the amount of energy that can be stored in a given volume or mass of fuel. The energy density of hydrogen is higher in its liquid phase compared to its gas phase. At standard temperature and pressure (STP), the energy density of hydrogen gas is about 0.010 M per litre (L). However, when hydrogen is cooled to its boiling point of -252.87 °C and compressed to its liquid phase, its energy density increases to about 8.5 MJ/L. This means that liquid hydrogen contains significantly more energy per unit volume compared to hydrogen gas.
The energy density of natural gas can vary depending on its composition and pressure, but on average, the energy density of natural gas is about 38 MJ/m³ or 38 000 MJ/L. If you consider the energy density in MJ/kg, then the combustion of hydrogen produces about 141.8 MJ of energy per kg of hydrogen. A common range for the energy density of natural gas is around 50 - 55 MJ/kg.
Technically, hydrogen has a much higher energy density than natural gas; however, the global distribution systems and our household appliances are built for gas, meaning that the apples-toapples comparison of hydrogen energy density to natural gas energy density is in the gas form and as such, the energy density of natural gas is much greater.
What are the types of hydrogen and why is it important?
Hydrogen has long been touted as a potential solution to our energy challenges, with its ability to produce electricity cleanly and efficiently without harmful emissions. However, not all hydrogen is created equal, and understanding the different types of hydrogen is crucial to unlocking its full potential.
One type of hydrogen that has been gaining attention in recent years is green hydrogen, which is produced using renewable energy sources like wind, solar, or hydropower. Unlike other types of hydrogen, green hydrogen production does not emit greenhouse gases (GHGs), making it a truly sustainable source of energy. While it is currently more expensive to produce than other types of hydrogen, the promise of this clean energy source has spurred efforts to reduce its cost and increase its adoption.
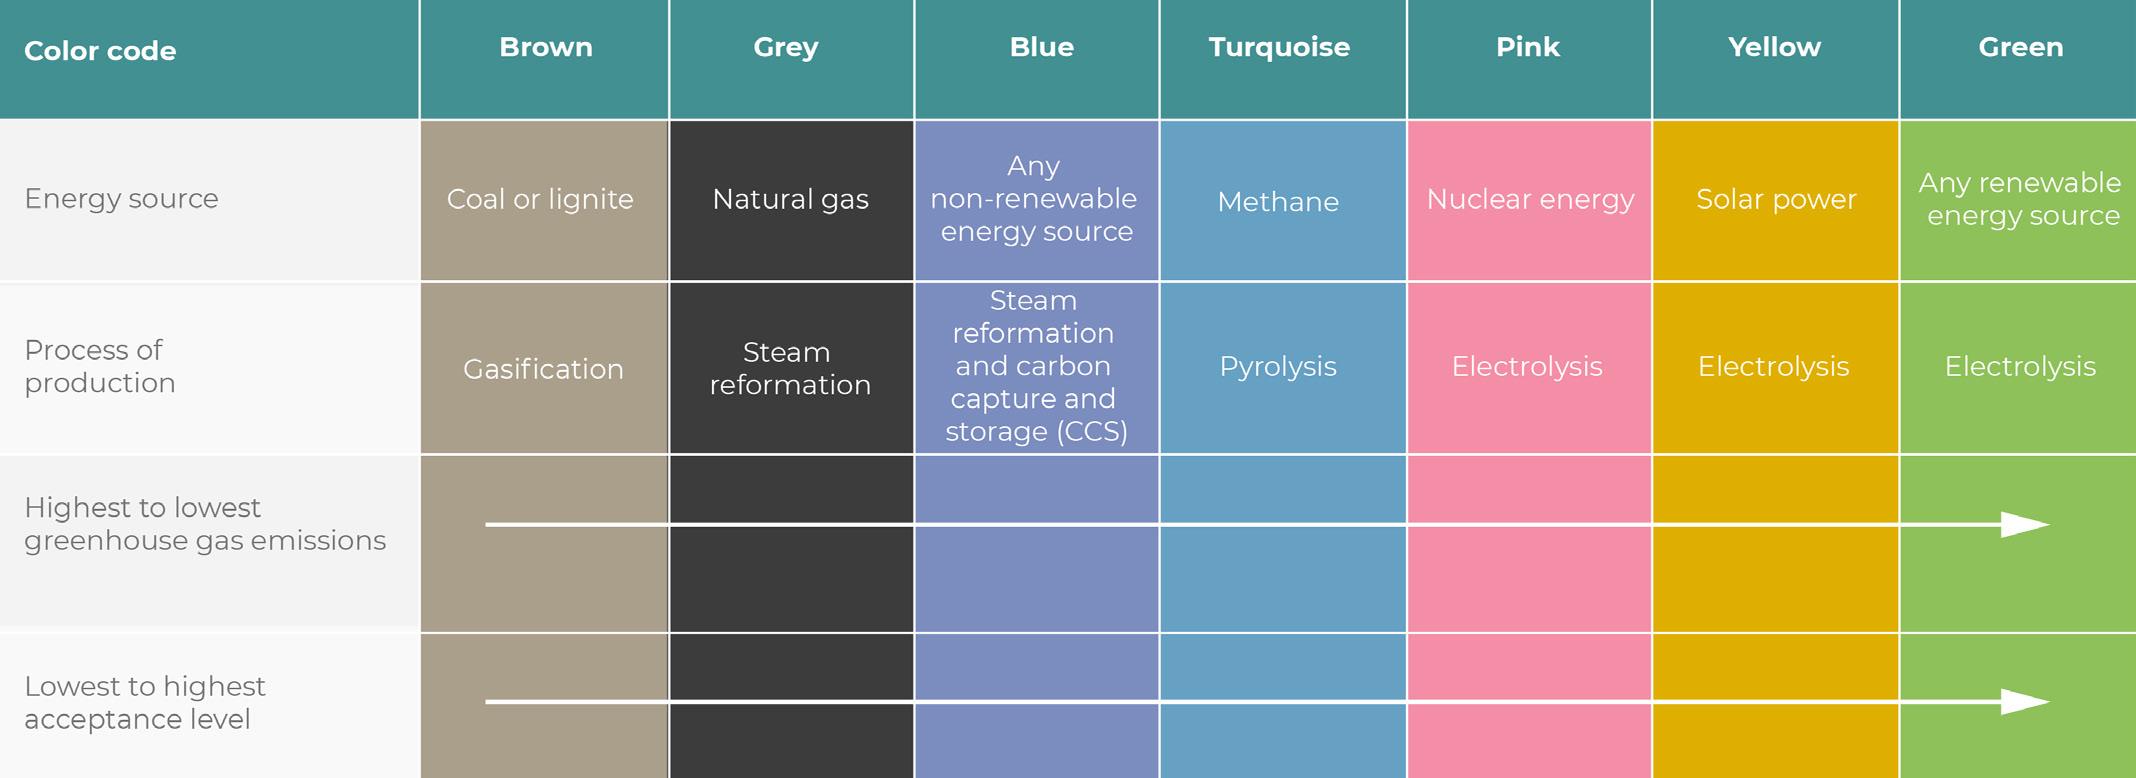
Another type of hydrogen is blue hydrogen, which is produced using fossil fuels like natural gas, coal, or oil. However, to mitigate the environmental impact of this production method, the carbon dioxide emissions are captured and stored underground, a process known as carbon capture and storage (CCS). Blue hydrogen offers a cleaner alternative to grey hydrogen, the most commonly produced type of hydrogen worldwide, which does not include CCS and therefore contributes to GHG emissions.
Understanding the different types of hydrogen and their environmental impact is crucial to developing a sustainable energy future. While grey hydrogen remains the most affordable option for now, the development and adoption of green and blue hydrogen technologies will be instrumental in reducing carbon emissions and mitigating climate change. As we move towards a more sustainable future, the classification of hydrogen will play a critical role in determining whether or not burning hydrogen as fuel can truly reduce CO2 emissions.
Hydrogen as an alternative to natural gases
Hydrogen is often seen as a promising alternative to natural gas, such as methane, due to its high energy density per kilogram, combined with the fact that it can be transported as a gas. At first glance, it appears to be an excellent alternative to the current CO2-emitting energy source of natural gas, assuming the hydrogen source is green or blue. However, the feasibility of hydrogen as a primary energy source is currently hindered by various factors.
Transporting hydrogen gas through existing natural gas transmission and distribution systems to homes for use as a primary energy source seems like an excellent solution in an energy utopia. Unfortunately, the size of the hydrogen molecule, explosive limits, and the energy density of the gas phase indicates that it is not feasible. The molecule is so small that it leaks more from existing infrastructure than natural gas does, and if it does leak in a home and is trapped, it is much more likely to explode than natural gas. It’s been a while but I’m sure folks can remember the Hindenburg Blimp; we want to avoid that at all costs in our homes. The energy density in the gas form is also much less than natural gas, requiring a lot more of it at higher pressure (or in liquid) to achieve the same results for heating homes or cooking. Blending in hydrogen gas is an option that has been proven to be safely transported in existing natural gas systems up to 10 - 15%, but this raises the question of whether it is reducing carbon emissions at the endpoint where the energy is created.
As a thought exercise, if adding 10 - 15% hydrogen into existing natural gas systems (assuming it’s green or blue hydrogen), imagine yourself as a hydrogen molecule and there are only 10 of you for every 100 natural gas molecules, you’re already at a disadvantage. On top of that, you’re 40% smaller than the natural gas molecules, so you tend to escape more easily through valves and other fittings. By the time you reach your destination to be burned on the stove, there may be only one of you left, and you’ll need to be backfilled by natural gas molecules to produce enough heat to boil water for dinner. As a result, the CO2 emissions reduction you thought you were getting by adding 10 - 15% hydrogen at the injection point isn’t what you’ll actually get by the time the water is boiled. With most of the hydrogen molecules escaping and the low energy density of hydrogen in gas form, it won’t effectively help mitigate climate change or contribute significantly to cooking dinner when utilised in our existing natural gas systems.
While green or blue hydrogen may have promise in other applications, unfortunately, it doesn’t seem to be a viable option as a reliable energy source for our homes through existing natural gas transmission and distribution systems. It’s unlikely to produce the desired results for reducing CO2 emissions when blended into natural gas, except perhaps to give a false sense of contribution to mitigating climate change to the people blending it at the source.
16 World Pipelines / JUNE 2023
Natural gas blended with hydrogen is increasingly being seen as an important solution in the move toward a net-zero economy, says Rodrigo Quintero Bejarano, Expert Industry Manager, Endress+Hauser, Switzerland.
s the world looks to accelerate the transition to a low-carbon future, many renewable energy sources are being developed to replace their more carbonintense predecessors. One such rising star in the new energy arena is clean hydrogen; a powerful, versatile alternative capable of producing electricity, power and fuel for transportation. When burned, its only byproduct is water – a significant advantage over traditional greenhouse gas emitters.
With such great potential for the decarbonisation of our society, producing and storing hydrogen safely and effectively is one of the challenges Endress+Hauser is currently helping its partners to solve. As the lightest element on earth, measuring hydrogen accurately is no easy feat, but, using the Coriolis effect or thermal mass, our flowmeters can achieve this; and now we have the tried-and-tested applications to show for it.
Experience in low pressure hydrogen flow
Over the last decade, Endress+Hauser has shipped over 750 thermal mass meters calibrated on low, laminar hydrogen flows for gas and steam turbine generators. The flow totaliser is used to monitor the hydrogen cooling loop that is critical to keep the generators working efficiently. For low pressure applications, this measurement principle will be able to measure hydrogen

17
better than other higher performance measurement principles, like a Coriolis flowmeter which relies on a minimum density of the fluid to make a good and reliable measurement.
With very few global facilities positioned to test flowmeters in hydrogen, third-party calibration data was tricky to source. Given the growing interest in the production, transfer, and storage of hydrogen, higher pressure applications are around the corner as new infrastructure is being built to support decarbonisation. Now, with several hydrogen measurement success stories across different applications and industries, we are able to share exciting results for higher pressure applications with the Coriolis flowmeter.
A measured approach: testing Promass Q onsite
At DNV’s H2 Loop in the Netherlands, we were able to test the Promass Q Coriolis flowmeter for a customer project within the scope of a qualification requirement. At the facility, we tested the sensor first using nitrogen and then later with hydrogen at 30 and 40 bar.
For hydrogen applications, these pressures are still considered low because the gas density is between just 2.3 and
3.1 kg/m3. So, the mass flowrates achieved by the facility were low compared to the maximum sensor capacity. This happens very often in hydrogen applications; sensors are operated at very low mass flowrates due to hydrogen’s exceedingly low density.
This was also the case during these tests, and yet, Promass Q performed excellently – even when all flow points fell within the trumpet part of the sensor’s error curve. All results were well within our specification. What’s more, we calibrated the sensor in our factory with water as standard, and the calibration factor did not need any adjustment during the tests. This shows that the Coriolis flowmeter water calibrations are also transferable to any gas type.
With the success of the application, we were able to prove the very high mass flow sensitivity of the Promass Q allows it to master hydrogen’s challenging low-density conditions. The tests gave the customer confidence that this flowmeter is highly suitable and a reliable component in their project.
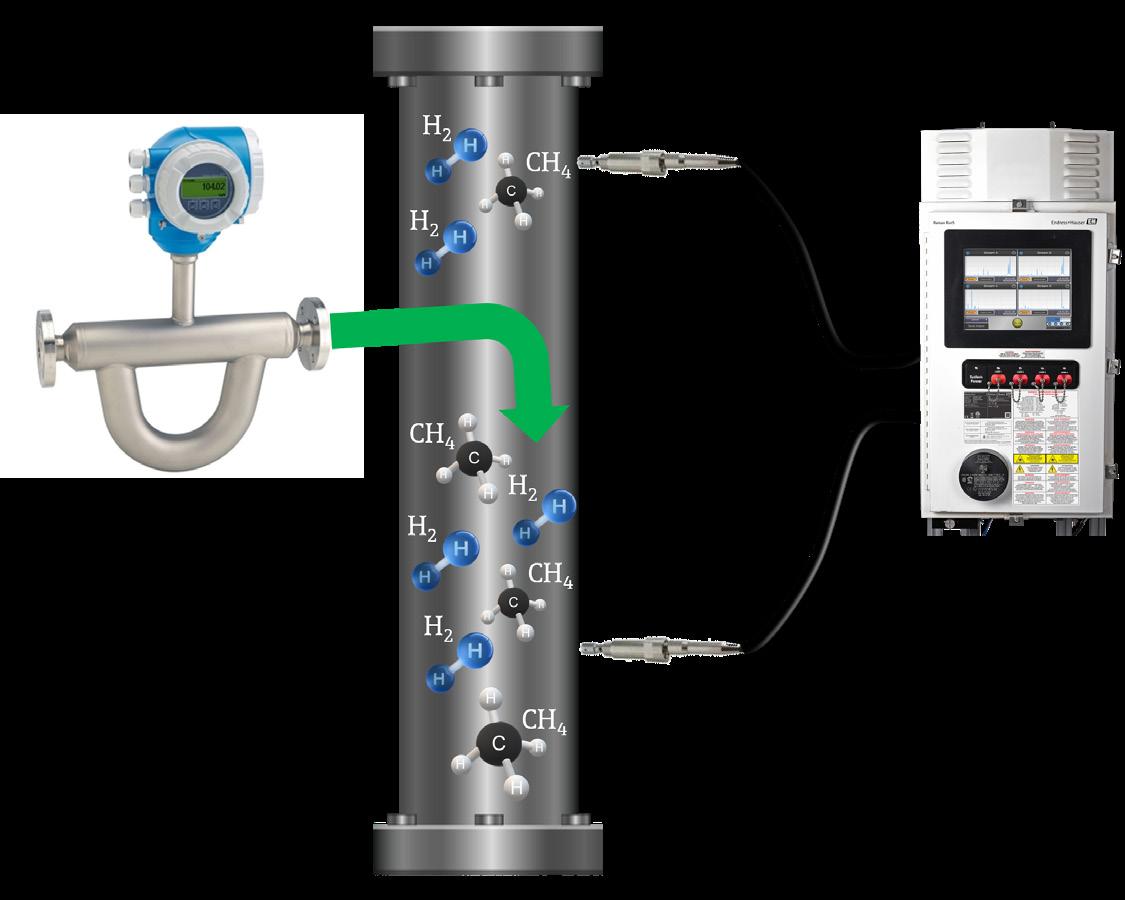
Adding more to the mix: measuring H2 gas blends
Natural gas blended with hydrogen is also increasingly being seen as an important solution in the move toward a net-zero economy. But blending hydrogen with natural gas poses an increased risk of explosion, and presents challenges around fire management as well as environmental impact. We were able to partner with our customer, Long Ridge Energy (LRE), to provide the instrumentation to facilitate safe and effective H2 blend production.
Tackling complexity with collaboration
Before injecting hydrogen into its existing natural gas grid infrastructure, LRE had to carefully mitigate the risks. At the same time, the company needed to find ways to reduce waste and increase efficiency, while making its fuel source more environmentally friendly. LRE stakeholders teamed up with Endress+Hauser to benefit from the breadth and depth of industry knowledge. Expert advice and reliable measuring instruments are essential to safely control the sensitive hydrogen-natural gas blend. By obtaining its hydrogen for injection from a local chemical manufacturer’s byproduct and relying on the process automation expertise of Endress+Hauser, LRE was able to accomplish its primary objectives.
The company has since completed four successful tests of injecting and controlling 5% blends of hydrogen into natural gas.
Equipped with industry-leading instruments
The Promass Q can measure natural gas or pure hydrogen, and now, a mixture
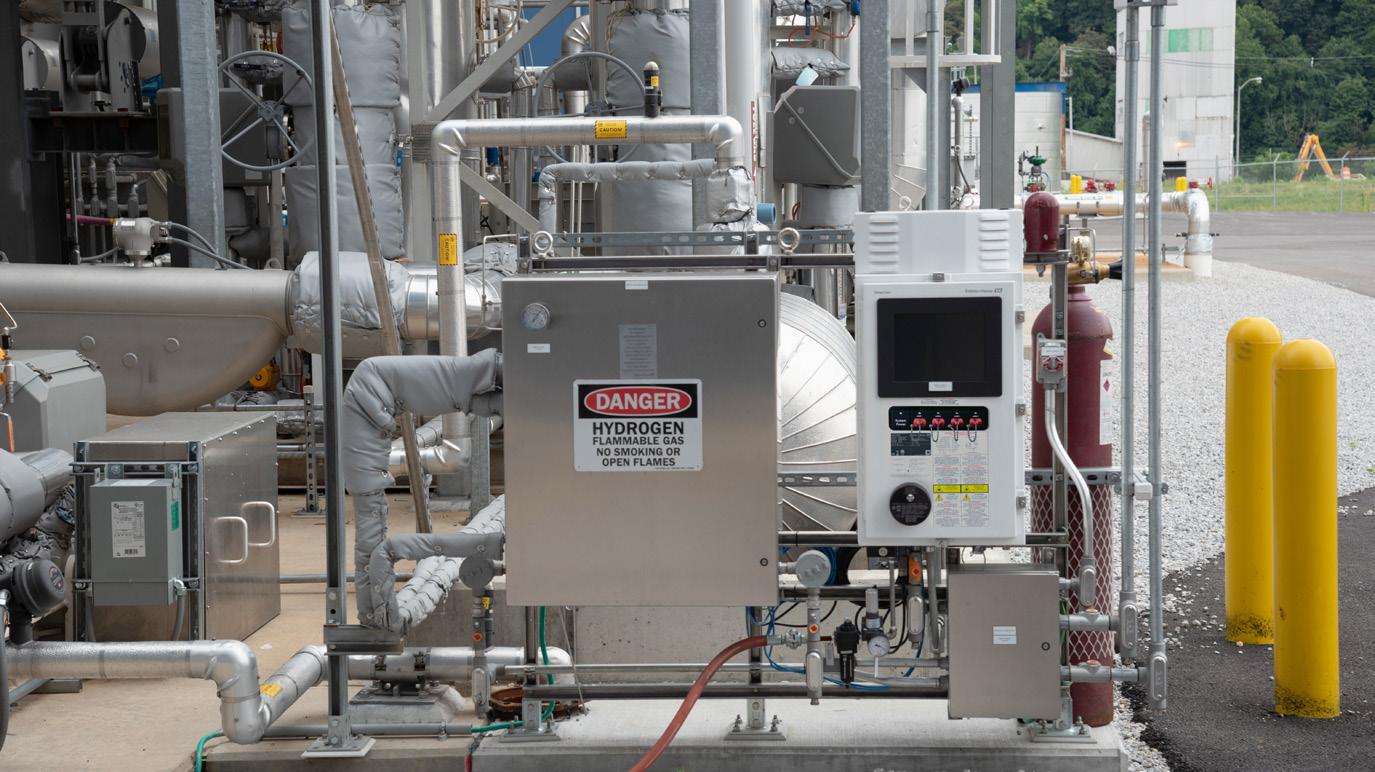 Figure 1. Promass Q flowmeter at Long Ridge Energy (LRE).
18 World Pipelines / JUNE 2023
Figure 2. Raman Rnx5 process analyser at LRE.
SAFE. RELIABLE. CERTAIN.
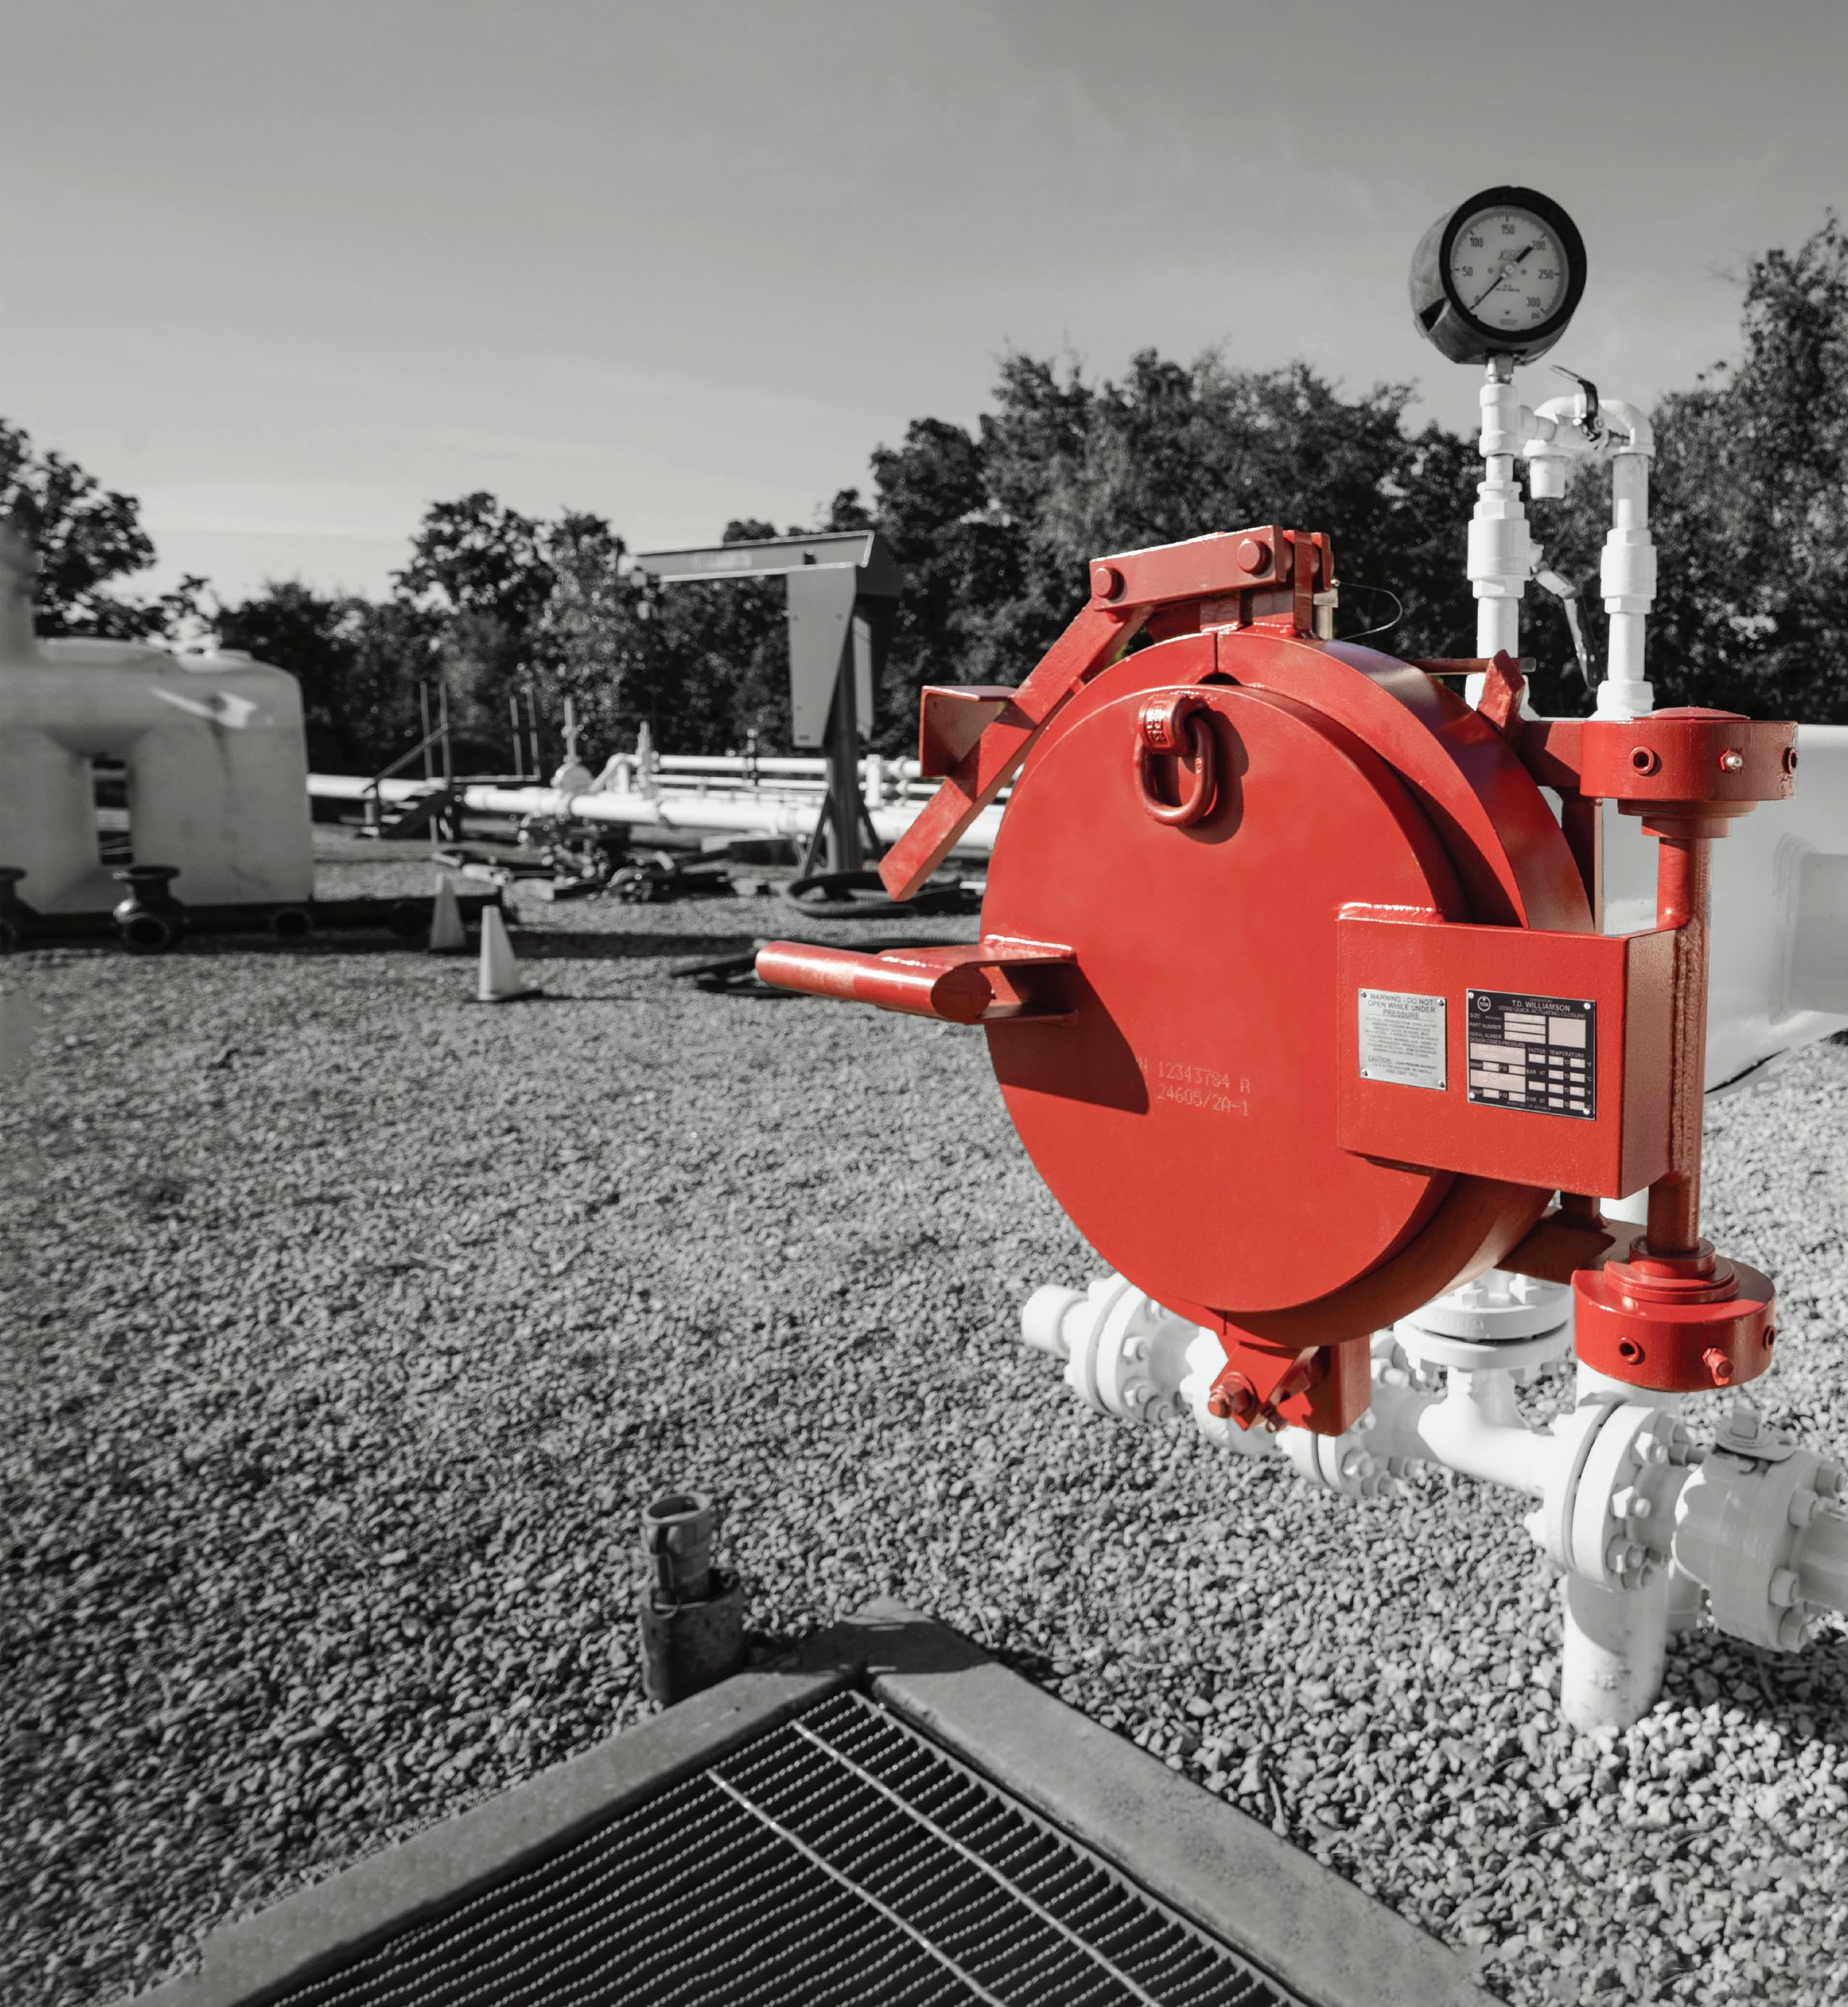
D2000 Quick-actuating closures with the
ProSeries™ advantage:
Opened or closed in a single motion while the operator stands safely to the side, the D2000 is the quick-actuating closure the industry depends on. Now, with the ProSeries™ advantage, the same features you trust are available for a broader range of applications, with shorter lead time, greater standard code compliance and, as always, the consistent quality you expect from T.D. Williamson.
THE MOST TRUSTED CLOSURE ON THE MARKET – MADE EVEN BETTER
tdwilliamson com
For the life of your pipeline. Shop online for pigs, closures and accessories. Scan the code and register to get started:

©2023 T.D. Williamson
of both. Implemented with the latest software update, the commissioning for customers who will be supplied with a mixture for their combustion processes has been simplified.
In this instance, LRE needed 316/316L wetted parts as well as best-in-class repeatability for an accurate injection rate of the hydrogen.
In mixtures like H2 and natural gas, Raman spectroscopy can also be used for effective and accurate measurement. Simple molecular gases (e.g. CO, CO2, H2, N2 and NH3) have simple Raman spectra, often a single peak. Raman scatter from each type of molecule present in a different wavelength (colour)
Product notes
H2 material compatibility is critical according to ASME B31.12.
316L and 904L
H2 is 100% compatible with any sensor made of 316L and 904L, e.g. Promass F, Promass Q, Promass E, Promass A, Cubemass, etc.
C22 and Super Duplex
H2 reduces the ductility of nickel-based alloys like C22 steels enough to cause concerns about its application in this service. Promass sensors made of C22 should be handled with caution, e.g. high pressure applications require explicit request and approval by customers.
Endress+Hauser’s online application wizard includes these recommendations and warnings, especially for ASME B31.12 pipeline applications.
of light emitted from the sample. The Endress+Hauser Raman Rxn5 process analyser measures all these gases simultaneously, separating them ‘by colour’. Simple spectra allow for the use of simple ‘method-based’ analysis of mixtures.
Raman spectroscopy: advanced optical analysis technology
In the last 50 years, a variety of gas analyser technologies have been developed around the ability of lasers to produce highly specific wavelengths of light across a wide spectrum. Various gases affect this radiation or are affected by the radiation, in characteristic and measurable ways, making it possible to detect and quantify gases of interest. Raman spectroscopy is one such technique. It utilises laser radiation to produce light in the visible or near-infrared wavelength regions to excite the vibrational modes of different gases in the sample. The resulting scattered radiation changes colour based on the type of chemicals in the gas.
A Raman analyser measures these scattered colours to determine the components in the gas, and the intensity of each colour to determine component concentrations. What started out as a single laser-generated colour now becomes its own rainbow since different gases in the sample produce specific wavelength spikes indicating their presence, and the relative intensity indicates relative concentration. The analyser looks for these specific spikes to create a chemical profile of the gas. When this concept is applied to an industrialised analyser, it uses a probe inserted into the gas stream that allows the gas to flow through a passage. Perpendicular to the gas passage is a miniature optical system. The green laser light shines through a lens and across the passage, where it strikes a reflector and passes back through the passage a second time. It now enters a detector where the resulting individual wavelengths are identified and quantified by the analyser. This approach has several critical advantages over other technologies such as mass spectrometers or gas chromatographs:
) The probe is located remotely from the analyser, so no sample is transported to the analyser therefore enhancing operator safety.
) The probe can handle pressures up to 70 bar and temperatures to 148˚C, with higher temperature solutions available.
) The output from the probe changes in real-time, and the analyser can take a snapshot in 15 - 30 sec.
) Both laser and detector are housed within the analyser and the light is carried to and from the probe via fibre optic cables over distances of 50 - 150 m with response times closer to 60 sec. The probe is designed for installation in Class 1, Division 1, or Zone 0 environments.
) A single analyser can support up to four probes, reading each simultaneously, so readings can be taken at multiple
20 World Pipelines / JUNE 2023
Figure 3. A Raman analyser that supports multiple probes gives it the ability to measure hydrogen before and after injection.
locations in the process stream for feedforward and feedback control loops.
) In addition to hydrogen content, a Raman analyser can also handle many of the commonly measured natural gas components.
Joined forces for safe blending pipelines

At present, the blending limit for hydrogen into pipeline gas is capped at 20%. However, since so much of the energy industry is currently in transition, there is little reason to believe this is a permanent limit.
But for the time being, let’s consider the case of a facility with a sizeable photovoltaic array which often finds itself with a surplus of power for much of the day. The facility installs a modest electrolyser with the intent of feeding the hydrogen it produces into the local gas pipeline. If the facility can measure the volume of pipeline gas moving through the local system, it can program its blending unit to feed in hydrogen such that it will not exceed 20% by volume. By using an Endress+Hauser
Proline Promass Coriolis flowmeter, it is a simple matter to measure, and ultimately control, the flow of hydrogen into the pipeline appropriately.
This works conceptually but with the assumption that no other gas blender is already adding hydrogen somewhere upstream. If the pipeline is already carrying 10% hydrogen, our hypothetical facility cannot add 20%. Additionally, it cannot
tell if the present content is changing as different blenders go online and offline.
Similarly, a gas turbine must operate differently for low heating value (LHV) conditions during start-up, so knowing the composition of the incoming fuel from the gas pipeline is critical, especially if there is additional H2 injection downstream within the fuel system of the power plant. To address these and other issues, a Raman analyser can be used to create a real-time signal indicating hydrogen content, which can then be used for regulating blending rates, monitoring Btu/Wobbe Index, or adjusting air-to-fuel mixture for combustion optimisation. When used in a closed-loop control strategy, the system can respond automatically to changing conditions.
With up to four-channel availability and fibre optic lengths up to 150 m, a Raman analyser can also monitor hydrogen composition over a long length of pipeline after being injected. This data can be used to monitor the mixing quality or be used to corroborate predictive models of how H2 will behave in the gas grid at scale. This is especially useful for gas utilities looking to meet renewable gas portfolio standards in their distribution networks, without compromising safety or quality for their customers and other stakeholders.
When combining Raman spectroscopy with a comprehensive control strategy, companies can maximise the injection of hydrogen into fuel systems and pipelines without compromising safety or efficiency, ultimately reducing overall carbon emissions.
The Best Liquid Epoxy Solutions For Pipelines
Combining industry-leading abrasion resistance with unmatched flexibility, our range of epoxy solutions are built tough, easy to apply and designed to last. Whether its HDD or field joint coatings, we’ve got the solution.
The Toughest HDD Coating on the Market
HBE - The Best Performing Field Joint Coating
SCAN ME SCAN ME
John Anderton, Senior Simulation Consultant, Atmos International, UK, explores overcoming the sustainability challenges of hydrogen fuel transportation with leak detection.
In an effort to accelerate decarbonisation and map out a route to net-zero emissions, hydrogen became a prominent conversation topic at the recent COP27 summit. With a focus on the introduction of a hydrogen economy to the developing world, hydrogen (and green hydrogen production in particular) has been suggested as the solution to stunted economic growth and trade relations. 1
Financial costs vs environmental savings

Just as there’s no shortage of hydrogen itself (it accounts for at least 70% of all atoms in the universe), there’s been
no shortage of literature on hydrogen following the COP27 summit. Whether it be in discussions about hydrogen’s role in the creation of nuclear fusion as an energy source, engineers in Australia identifying a process that uses soundwaves to boost green hydrogen production, or Rolls-Royce testing green hydrogen as jet fuel for the aviation industry, hydrogen can already be proven as a netzero substitute for conventional fuel. But do the financial challenges of hydrogen fuel production and transportation offset its environmental savings? 2,3,4
As mentioned at COP27, hydrogen is a sector that isn’t fully established, requires financing and has a complex
23
value chain, which raises questions about whether the energy industry is ready to start producing and transporting hydrogen fuel. 1 Additionally, the process for producing certain types of hydrogen, such as brown or grey hydrogen (Figure 1) can ultimately overshadow the net-zero emissions promised by the end product. 5 Pair this with the fact that there is debate surrounding the feasibility of hydrogen to heat UK homes, for example, and it raises questions into how sustainable hydrogen is as a universal carbon neutral fuel. 6
However, there are a number of uses for which hydrogen has already been identified as a suitable fit and, when it comes to new ways of producing energy, hydrogen remains one of the key areas gaining momentum. Part of the European Commission’s REpowerEU plan, for example, has an expectation that 20.6 million t/yr of hydrogen will be imported along pan-European pipeline corridors by 2030. 7
Taking this into consideration, I will work with an understanding that a transition to hydrogen fuel is inevitable, and look at how the sustainability challenges of hydrogen can be optimised through effective leak detection.
Sustainability challenges
While hydrogen energy has distinct advantages as a netzero solution, there are still risks involved in hydrogen fuel transportation.
Hydrogen molecules are smaller than natural gas molecules, for example, so hydrogen fuel can not only leak more easily but potentially leak more product. 8 It’s worth noting that the intended goal of hydrogen fuel can be partially counteracted in the event of leaked product too.
A recent study by the UK government’s Department of Business, Energy and Industrial Strategy (BEIS) details the implications on global warming if hydrogen fuel leakage occurs. Hydrogen not only becomes an indirect greenhouse gas (GHG) when it reacts with other GHGs, but it affects the composition of the atmosphere by way of climate warming and impacting air quality. A key finding in
this BEIS study suggests hydrogen is twice as powerful a GHG as was initially thought. 9
For this reason, those handling hydrogen fuel should consider the previously mentioned sustainability risks when considering how to transport the product, and look to the following as prerequisites to overcome those challenges.
What’s the safest way to transport hydrogen?
When it comes to transporting any gas or liquid, there exists a whole host of options for getting the product from A to B. Barges, tankers, and tugboats can transport fuel across a range of water sources, while railroad tankers utilise the existing railroad infrastructure to deliver product. Ultimately, pipelines consistently remain the safest means of transporting any gas or liquid due to their infrastructure that often uses the shortest and most economic route.
Pipeline infrastructure’s role
As hydrogen gas blends are introduced to gas pipelines, it’s important to consider what, if any, repurposing needs might be required to an existing network’s infrastructure. As previously mentioned, hydrogen has a significantly different molecular makeup to a natural gas and because hydrogen’s atoms are so small, they can be absorbed by the metal interior of the pipeline transporting it, causing cracks to emerge in the pipeline through a process called hydrogen embrittlement. For these reasons and many more, it’s vital that pipeline operators receive training to understand what impacts the shift to hydrogen will have on the pipeline.
Hydrogen has a much lower energy density than natural gas, so repurposing pipelines previously used for natural gas to transport hydrogen is not straight-forward as pipeline capacity will be impacted. Using simulation tools for both design and operation can mitigate the risks associated with the transition from natural gas to hydrogen.
Simulation software like Atmos SIM enables operators to model all aspects of the pipeline’s infrastructure, providing
24 World Pipelines / JUNE 2023
Figure 1. Colour chart detailing the different types of hydrogen and their production methods.
TRIDENT MULTI-HIT SMART GAUGE
Reduces vessel costs and saves time during pipelay and operations

Gauging multi-diameter pipelines
• Hinged multi-hit gauge plate system
• On-board logging and multiple gauging records
• Allows mainline gauging where reduced-bore PLET / PLEM
• Thru-wall comms and download
• Use as part of pre-ILI cleaning programme for scale and wax check
• Part of the Propipe Trident SMART range

927
FOREFRONT INNOVATION SERIES

A new, virtual, technical series from AMPP!


Forefront Innovation Series is a new and innovative web-based series from AMPP. Filled with the latest insights and technical developments, Forefront brings together subject matter experts from a wide variety of industries and professional backgrounds to discuss hot-button materials protection and performance related technical topics. Utilizing best practices, case studies, and lessons learned, these engaging sessions will shed light on challenges faced by different industries.
Top 5 reasons to attend:


• Gain insights to the New & Emerging Technologies
• Participate in Open Discussions about Future Innovations and Theories
• Engage with Subject Matter Experts to get your questions answered
• Network with peers & discuss hot-button materials protection and performance related technical topics


• Earn up to 6 Professional Development Hours per series

View our Calendar for Upcoming Events!
Visit www.ampp.org/events/forefront-innovation-series
Propipe Limited Queens Meadow Business Park, Hartlepool, England TS25
5TE
Propipe North America 27 Parker Street, Dartmouth, Nova Scotia, Canada B2Y 4T5
T: +44 (0)1429 872
E: groupsales@propipe.co.uk
propipe.co.uk LinkedIn
T: +1 (902) 499-2796 E: info@turbulentresearch.com
them with a better understanding of how the pipeline network will cope with the introduction of hydrogen fuel blends.
If we look to Figure 3 as an example, capacity for this pipeline network is restricted by supply locations, network topology, and demand pressure requirements. Capacity will also be affected by the transition from natural gas to
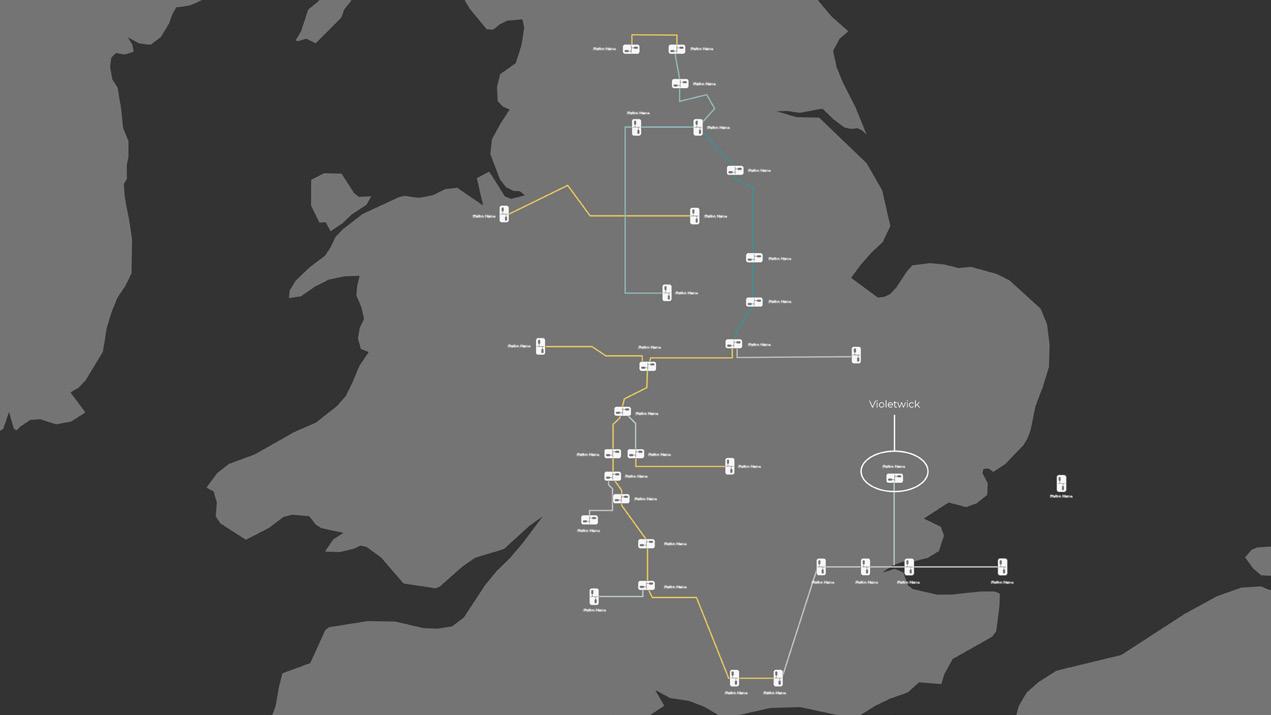
hydrogen, but simulation software can accurately predict future capacity for hydrogen and hydrogen blends.
The same simulation model can be used as an online decision support tool to accurately predict the current or, by using look-ahead models, the future state of the network.

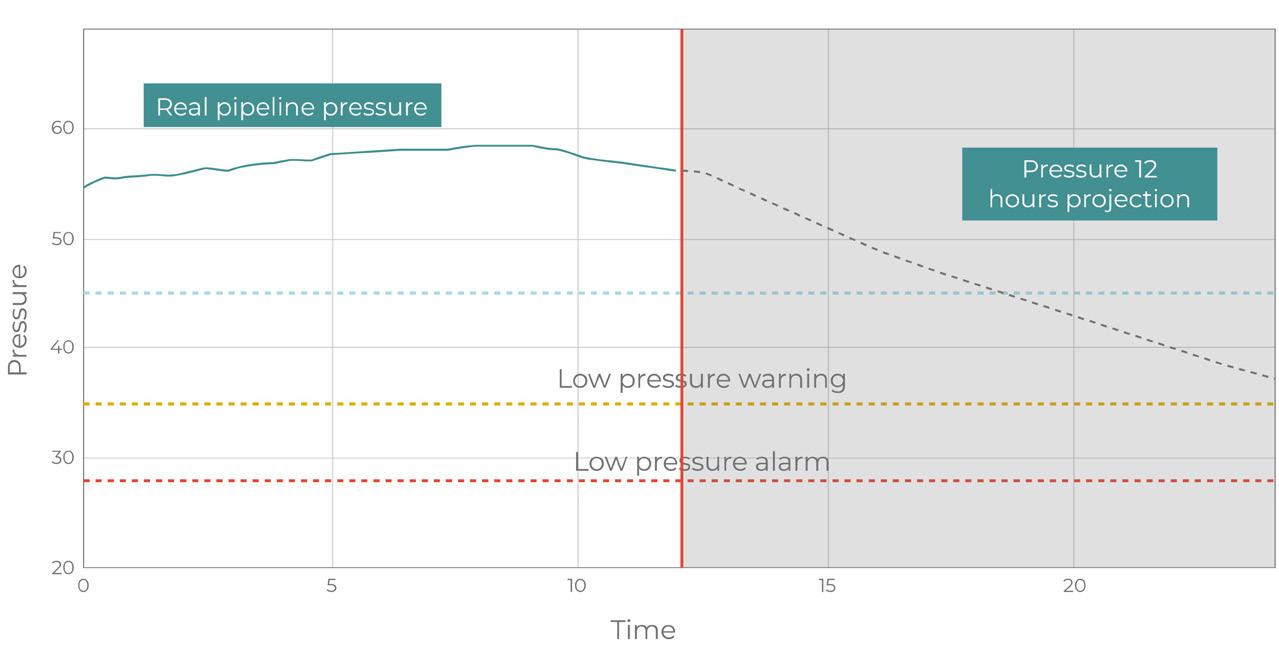
Figure 4 illustrates what would happen to the demand pressure on a pipeline if there is a supply interruption: the pressure continues to fall but hasn’t triggered any pressure warnings or alarms after 12 hours. If actions are taken before the alarm level is reached, the pipeline can continue to deliver gas to the customer without pressure violation.
Leak detection
A multitude of factors can cause a leak on a pipeline. There’s the possibility of corrosion (which has already been mentioned in the context of hydrogen embrittlement), excavation and outside force, operational causes, natural causes, and more.
Many leaks are identified by people on a liquid pipeline where the spilled products can be seen by the naked eye. In the case of hydrogen gas, it is odourless, colourless and flammable which, if left undetected during a leak event, can have catastrophic effects on the surrounding area and the atmosphere itself. For this reason, a real-time leak detection system made of advanced hardware and software is vital for safe hydrogen fuel transportation.
Leak detection software such as Atmos Wave can use negative pressure waves to detect leaks accurately and with a minimal false alarm rate during steady-state, transient and shut-in conditions. Additionally, simulation software like Atmos SIM can detect leaks effectively by incorporating the statistical algorithms used by Atmos Pipe, the world’s first statistical volume balance system.
References
1. hydrogencouncil.com/en/hydrogen-high-on-the-cop27agenda-hydrogen-council-reflects-on-sharm-el-sheikhconference
2. edition.cnn.com/2022/12/12/us/common-questions-nuclearfusion-climate/index.html
3. interestingengineering.com/innovation/sound-waves-boostgreen-hydrogen-production
4. arstechnica.com/cars/2022/11/rolls-royce-tests-hydrogenfueled-aircraft-engine-in-aviation-world-first
5. www.nature.com/articles/d41586-022-03693-6
6. www.thetimes.co.uk/article/hydrogen-too-costly-andinefficient-to-heat-homes-vlcf2wrkn
7. ehb.eu/files/downloads/ehb-report-220428-17h00interactive-1.pdf
8. www.atmosi.com/en/resources/technical-papers/differentways-to-reduce-greenhouse-gas-emission-in-pipelines
9. www.gov.uk/government/publications/atmosphericimplications-of-increased-hydrogen-use
Figure 4. A 12 hr forecast from a what-if look-ahead of a decrease in pressure in the event of a supply interruption.
Figure 3. A theoretical gas transmission network.
26 World Pipelines / JUNE 2023
Figure 2. Atmos SIM can use data delivered from the field through a supervisory control and data acquisition (SCADA) system for advanced applications on a gas pipeline, such as leak detection and batch tracking.
The recent atmospheric river events in California that have been in the news across the world brought widespread flooding, scour and landslides.1 In 2022, exceptionally heavy monsoon rain and glacier melt caused devastating floods and landslides in Pakistan.2 According to the US Environmental Protection Agency, it is likely that climate change is resulting in an increase in extreme rain events.3 The UK Meterological Office points out that warmer air can hold more water; so, as the climate warms, rainfall is increasing on average across the world.4
These increases in extreme rainfall, and the associated scour, landslides and floods, create more and more challenges for the pipeline industry. Geohazards are however, not a new phenomenon. As an industry, we have built and safely managed pipelines in geotechnically
difficult terrain such as the Andes, Rocky Mountains, or Caucuses, in areas of subsidence caused by historic coal mining and in geological fault zones for decades. Good practice in design, construction and integrity management can prevent failures. An example is the recent massive strike-slip earthquake in Turkey and Syria, which was devastating for the population with many buildings destroyed and lives lost. While there were pipeline failures where design and integrity management actively consider geohazard threats, TANAP and BTC survived with no loss of containment.
It is now widely recognised in the pipeline industry that good practice in the integrity management of pipelines subject to geohazard threats includes a combination of remote sensing (e.g. LiDAR), ground survey, internal geometry and mapping inspection, and site assessment.5,6

27
Daniel Bahrenburg and Roland Palmer-Jones, ROSEN, UK, explore new tools for managing pipeline integrity in areas affected by landslides.
In recent years the inline inspection (ILI) tool equipped with an inertial measurement unit (IMU) has proven itself to be indispensable for the detection and monitoring of geohazardinduced bending strain and pipeline movement. Typically, IMUs are integrated into ILI systems that include magnetic flux leakage sensors for detecting and sizing metal loss, and calipers for geometry measurement. The combination of these ILI technologies provides relevant information for geohazard threat evaluations; however, complex tools and expert resources are required for deployment. Utilising a dedicated
IMU platform offers a simple efficient option for monitoring geohazard threats at high frequency and short notice.
To make pipeline movement monitoring easier, ROSEN has developed the RoGeo PD (PipeDrift) system. This system integrates an IMU with a robust utility tool designed for excellent run stability and tolerance to high speeds, allowing an operator to deploy an IMU inspection with much less effort than would be required for a typical MFL/Geometry combination set-up, or even a stand-alone geometry inspection. The PipeDrift system was run multiple times in 2021 and 2022, proving the reliability and benefits of the approach, and has since been adopted as the primary platform for routine geohazards monitoring of a high-visibility natural gas pipeline system.
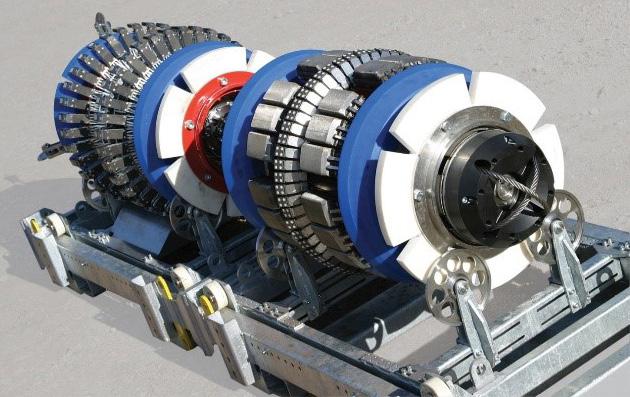
How it works
A baseline inspection with a minimum of high-resolution geometry and IMU technologies, together with accurate differential GPS surveyed above ground marker points is required for reference. This gives the most reliable picture possible of the position and shape of the pipeline. Subsequently, the dedicated IMU system can be deployed and, using the start and end points, along with characteristic patterns produced by inertial responses of pipeline features, the two datasets (baseline and IMU-only) can be distance aligned. This is needed as the IMU-only tool does not have odometer wheels and above ground markers will not be in place.
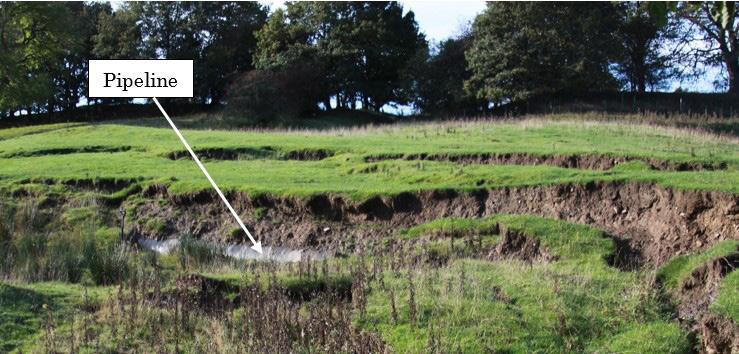
With the two datasets aligned, the rate of change of pitch and azimuth can be reviewed. Where there has been no movement between the two inspections, these rates of change will be consistent. There will of course be some variations due to noise in the data, typically caused by vibration of the tools as they travel through the pipeline. If there has been any movement, the rate of change of pitch and azimuth will not be the same between the baseline inspection and the following IMU-only run. In these cases, it is possible to calculate the new trajectory where it deviates from the original, typically considering a limited length of pipe, possibly 150 m (500 ft).
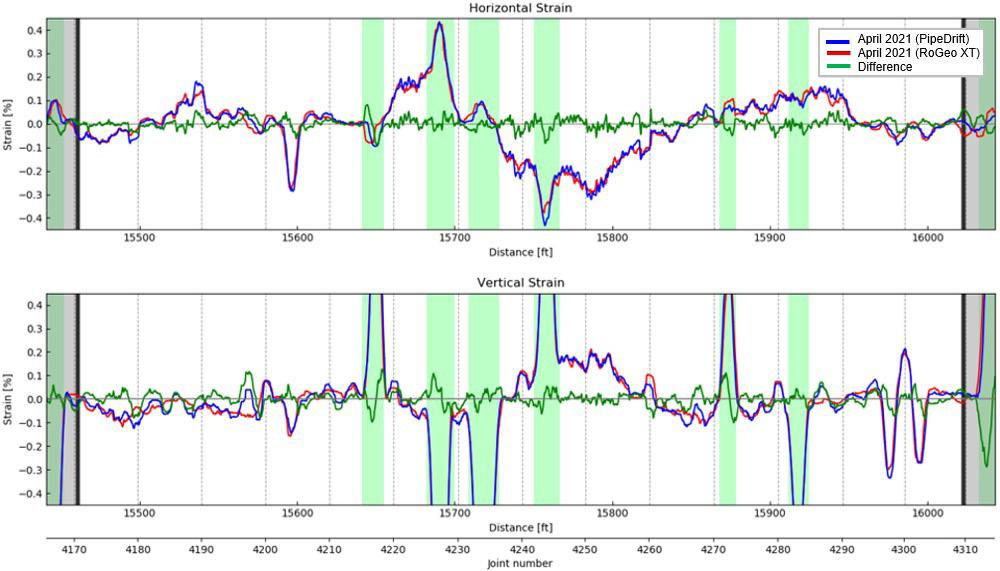
Case study
ROSEN has been working with multiple operators around the world helping them to identify active or incipient geohazard threats, and develop appropriate monitoring and mitigation plans. In one particular case, numerous combined geometry and IMU inspections were completed and a few locations of active pipeline movement were being monitored.7 The maximum strain levels in the sections being monitored remained low, and movement was slow. Sections with higher strains and faster movement had been mitigated by either stress relief and slope stabilisation, or re-routing away from the areas of active movement. The repeat inspection frequency for monitoring the pipeline was approximately every 2 or 3 months. PipeDrift was implemented as a trial with the aim of increasing the efficiency
Figure 2. Landslides may affect pipeline integrity, making monitoring or stresses essential.
Figure 1. XT tool.
28 World Pipelines / JUNE 2023
Figure 3. Bending Strain comparison XT vs PipeDrift for a known area of pipeline movement.
of monitoring and allowing an increased monitoring frequency if required. A geometry and IMU combination service (RoGeo XT) was performed first, immediately followed by an inspection with the dedicated PipeDrift IMU system. The post-processed datasets were analysed and compared to assess the accuracy of the PipeDrift monitoring system.
High quality IMU, when deployed in a geometry tool or MFL/ geometry combination, has been shown to deliver very consistent results with high repeatability.8 Some reduction in accuracy was considered likely when using a less sophisticated tool, without distance measurement. However, the results were very reassuring, showing a close correlation with minimal differences in horizontal and vertical bending strain, as illustrated in Figure 3.
Since confirmation of the system’s feasibility, several additional PipeDrift monitoring inspections have taken place to observe this area of historical movement. Each inspection has consistently detected the displacement occurring between the first IMUequipped inspection of the pipeline and the most recent ILI. This is clear to see in Figure 4, which reflects a total maximum strain change of 0.26% (corresponding to 5.2 ft of total movement) between a combined MFL-A/XT inspection and a PipeDrift inspection.
The dedicated IMU-only bending strain monitoring system was shown to give results consistent with a more traditional sophisticated combined highresolution geometry and IMU inspection systems. Changes in bending strain were identified, and movement was quantified, allowing the operator to make relevant integrity management decisions.
Some challenges were noted, in particular, any areas of re-routing between inspections need to be carefully checked as weld counts will be different and linear alignment can be difficult. Utilisation of third-party datasets should also be approached with caution and the reliability of provided coordinates and inertial measurements should be verified with the ILI vendor.
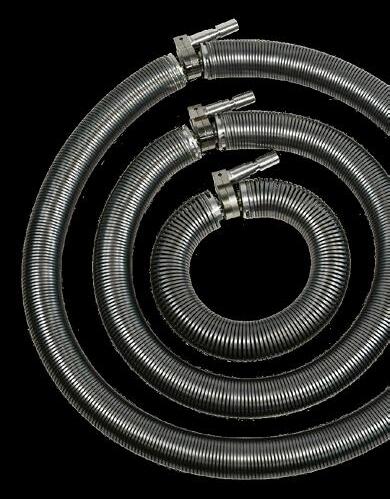
Conclusions
Energy pipeline operators have been utilising IMU tools to aid in the management of geohazard threats for many years. This has required the use of combination technologies, which are valuable tools requiring significant set-up, mobilisation and deployment effort.
PipeDrift is a dedicated IMU platform with a simple and robust design that can be deployed in piggable segments with
less operational impact than conventional ILI technologies. A particular advantage is that performance is good at high velocities (e.g. 7 m/sec.), meaning that gas flow rates can be maintained. The viability of this system for routine monitoring of geohazard threats has been demonstrated.
The datasets produced compare very well to both proven technologies and repeat PipeDrift inspections. IMU data quality was maintained even with average run velocities of up to 7 m/sec., and it is expected that higher velocities are achievable. The robust tool design also allowed for rapid redeployment of the system. Challenges associated with characterising trajectory deviations have been overcome by utilising the pitch and azimuth data with appropriate post-processing.
High voltage Holiday Detector
Detects pinholes and holidays using pulse DC
n Lightweight, ergonomic design provides comfortable all-day use, reducing operator fatigue
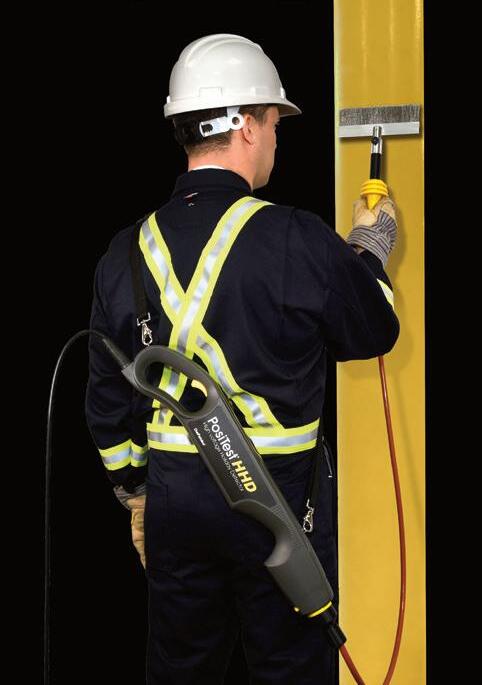
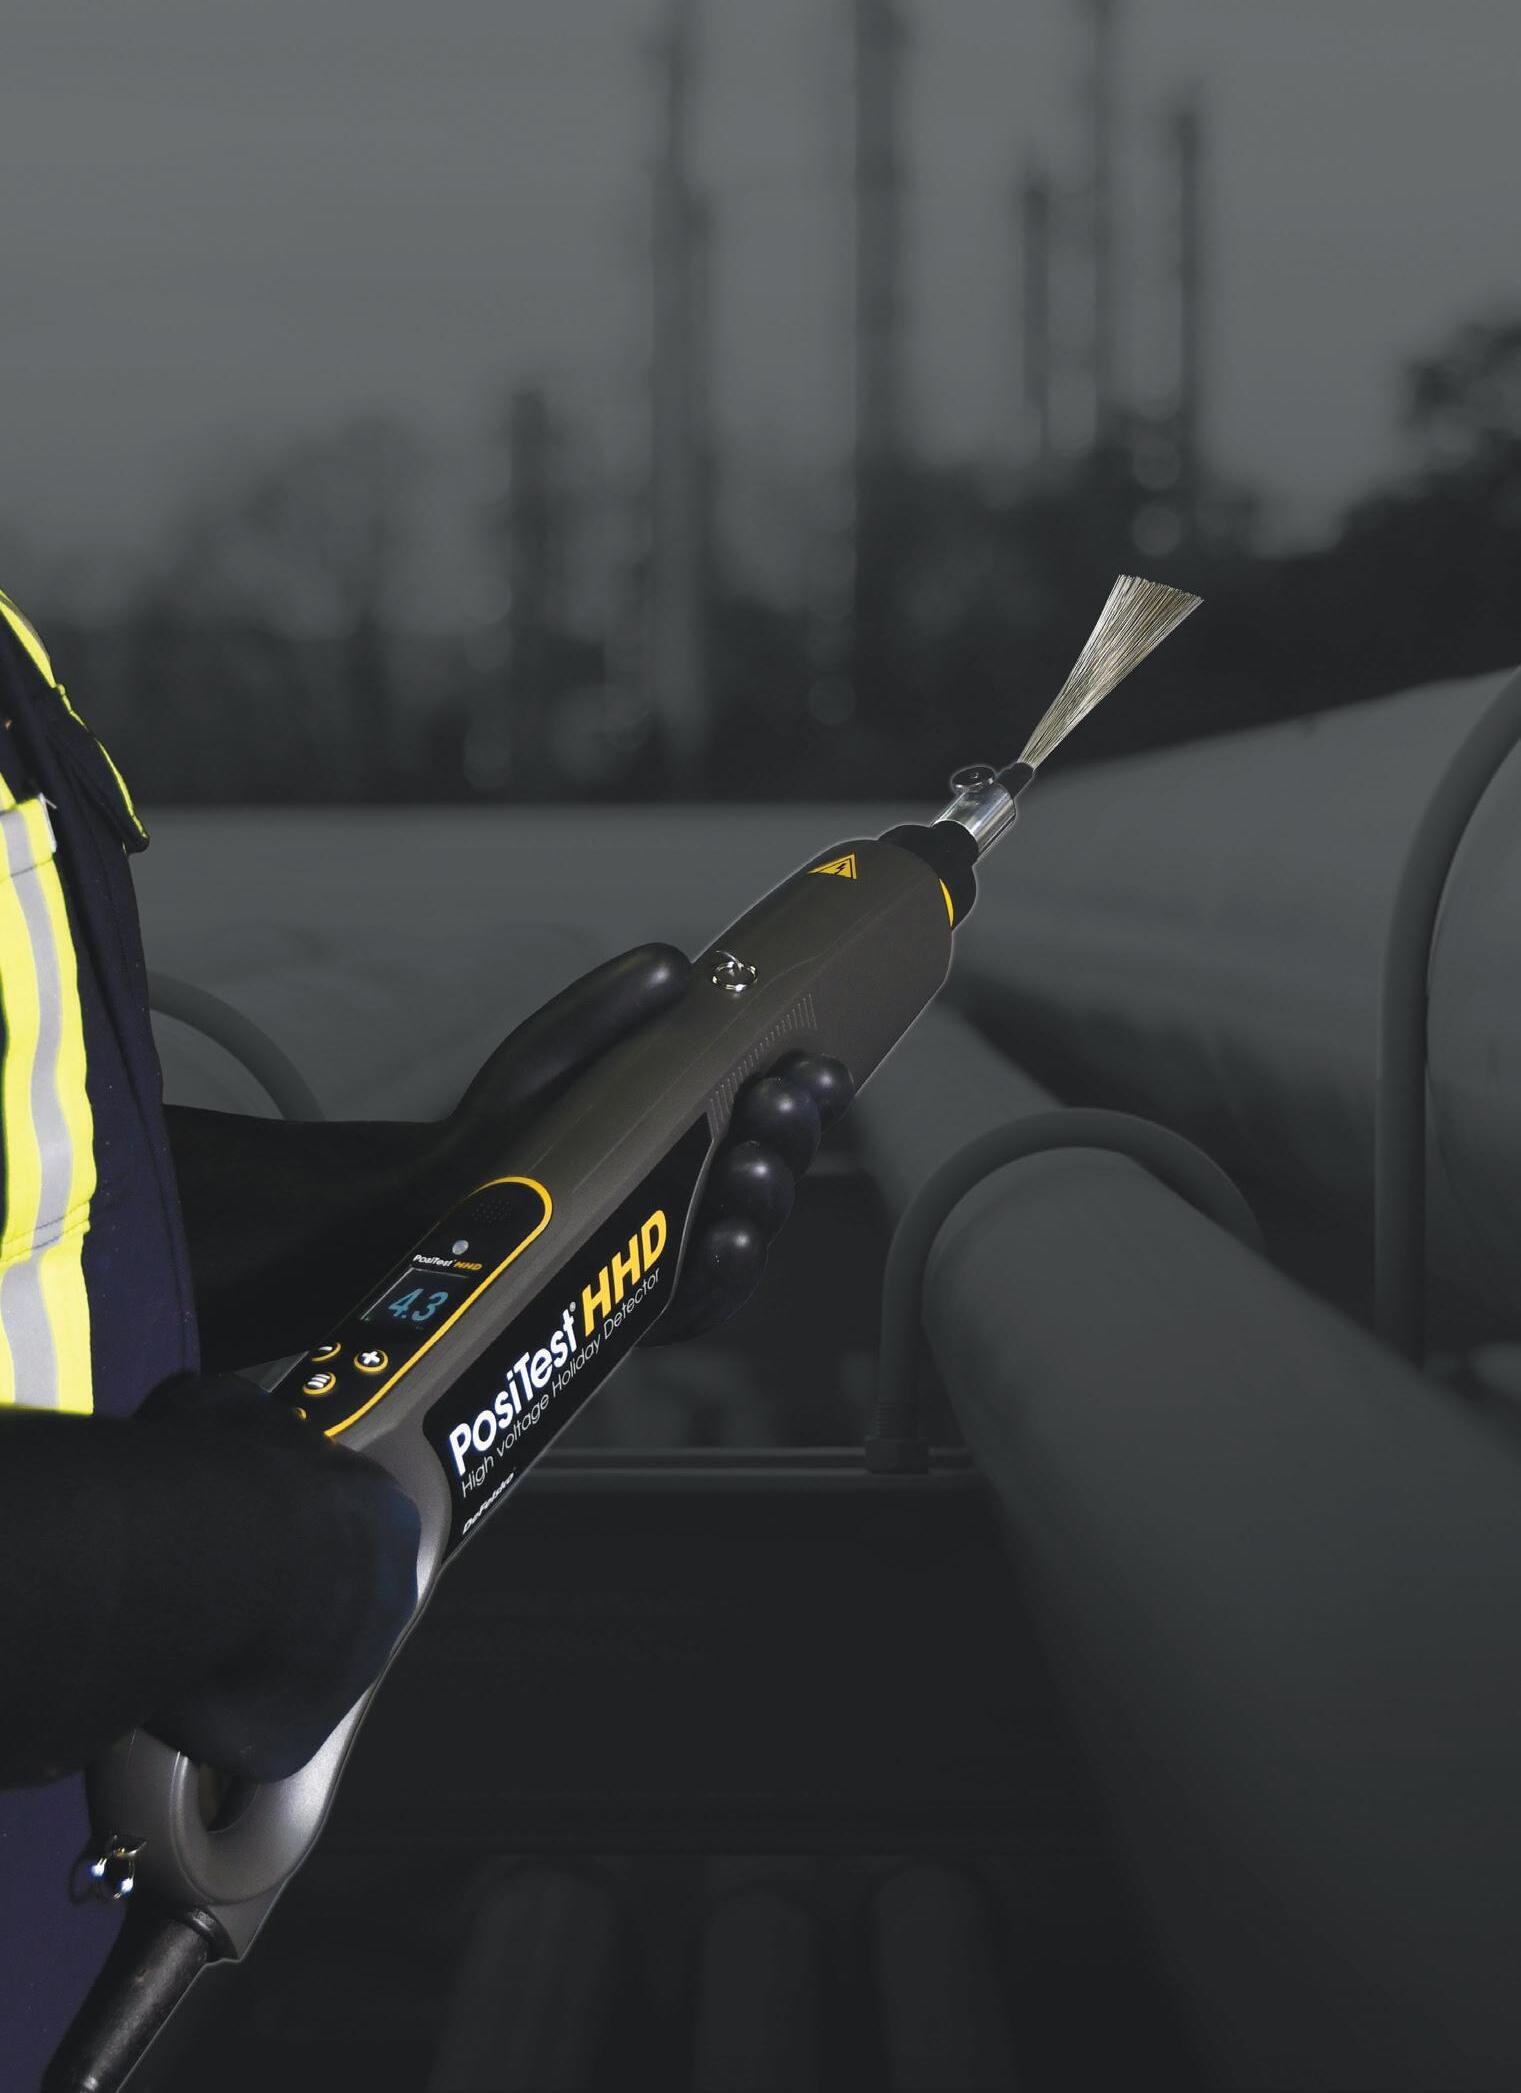
n Regulated pulse DC voltage output that won't change under load ±5% voltage accuracy
n Voltage calculator feature choose one of 11 international standards, and input the coating thickness to automatically calculate the required test voltage
n Long Form Certificate of Calibration included with each instrument
Optional
the detector into a wand configuration ideal for testing hard-to-reach areas DeFelsko Corporation l Ogdensburg, New York USA Tel: +1-315-393-4450 l Email: techsale@defelsko com Choose from a wide range of rolling spring and wire brush electrod custom sizes ava +1-315-393-4450
handheld wand accessor y converts
www.defelsko.com
Efforts are ongoing to improve the efficiency of data processing and evaluation of PipeDrift inspection data in support of pipeline movement identification, monitoring and assessment. Signal matching algorithms have recently been implemented as an enhancement for data alignment. Research into tool dynamics and interrogation of various post-processing methodologies have delivered more efficient and repeatable practices. The service will continue to improve, both the technology and process will evolve to maximise ease of deployment, efficiency, accuracy, speed of results delivery, and value to pipeline integrity.
References
1. www.cbsnews.com/news/california-flooding-landslides-asatmospheric-river-power-outages (Accessed on 20/03/2023).
2. www.worldweatherattribution.org/climate-change-likely-increased-extrememonsoon-rainfall-flooding-highly-vulnerable-communities-in-pakistan (Accessed on 20/03/2023).
3. www.epa.gov/climate-indicators/climate-change-indicators-heavy-precipitation (Accessed on 20/03/2023).
4. www.metoffice.gov.uk/weather/climate-change/effects-of-climate-change (Accessed on 20/03/2023).
5. THURAIRAJAH, A., Integrity Management Guidelines for Pipes in Potentially Unstable Soils , Paper 86987, International Pipeline Conference (September 2022).
6. BAHRENBURG, D., YOUNG, A, EDWARDS, J., SINGH, A., Above and Below: A Holistic Geohazard Monitoring Solution , Paper 53, Pipeline Pigging and Integrity Management Conference (February 2023).
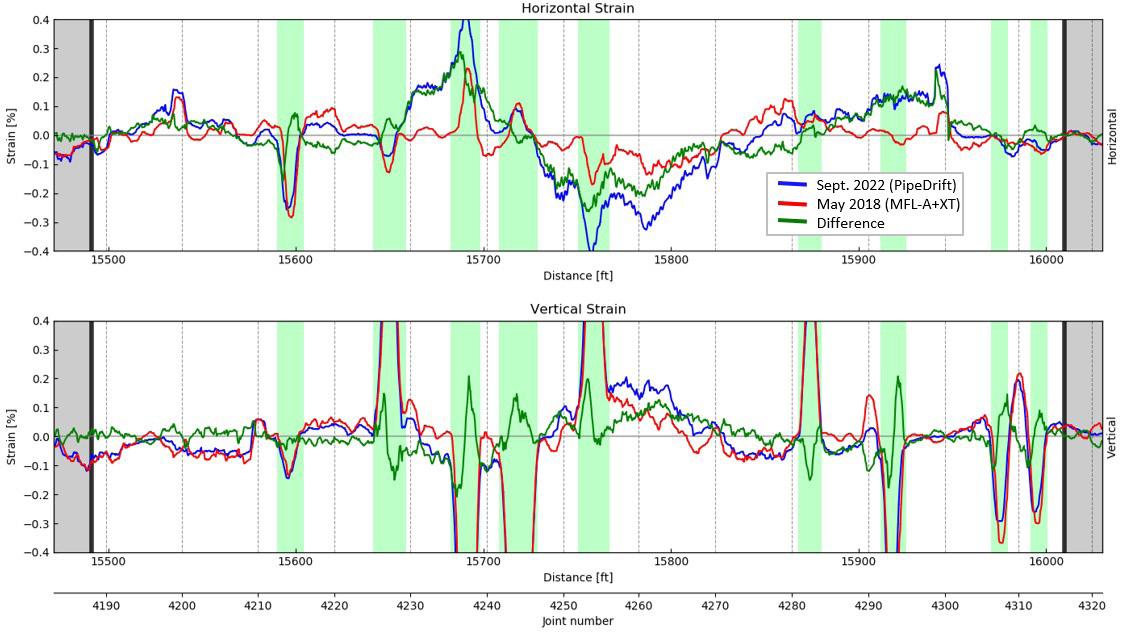
7. BAHRENBURG, D., TAYLOR, J., FIGGAT, C., CAMPBELL, P., Catch my Drift? The Big Implications and a Smaller IMU Platform , Pipeline Pigging and Integrity Management Conference (February 2022).
8. DOTSON, R., BROWN, A., TAYLOR, J., JACOBS, L., Beware the Shapeshifter: A Repeatability Study on Pipeline Movement and Bending Strain Assessments , Pipeline Pigging and Integrity Management Conference (February 2021).
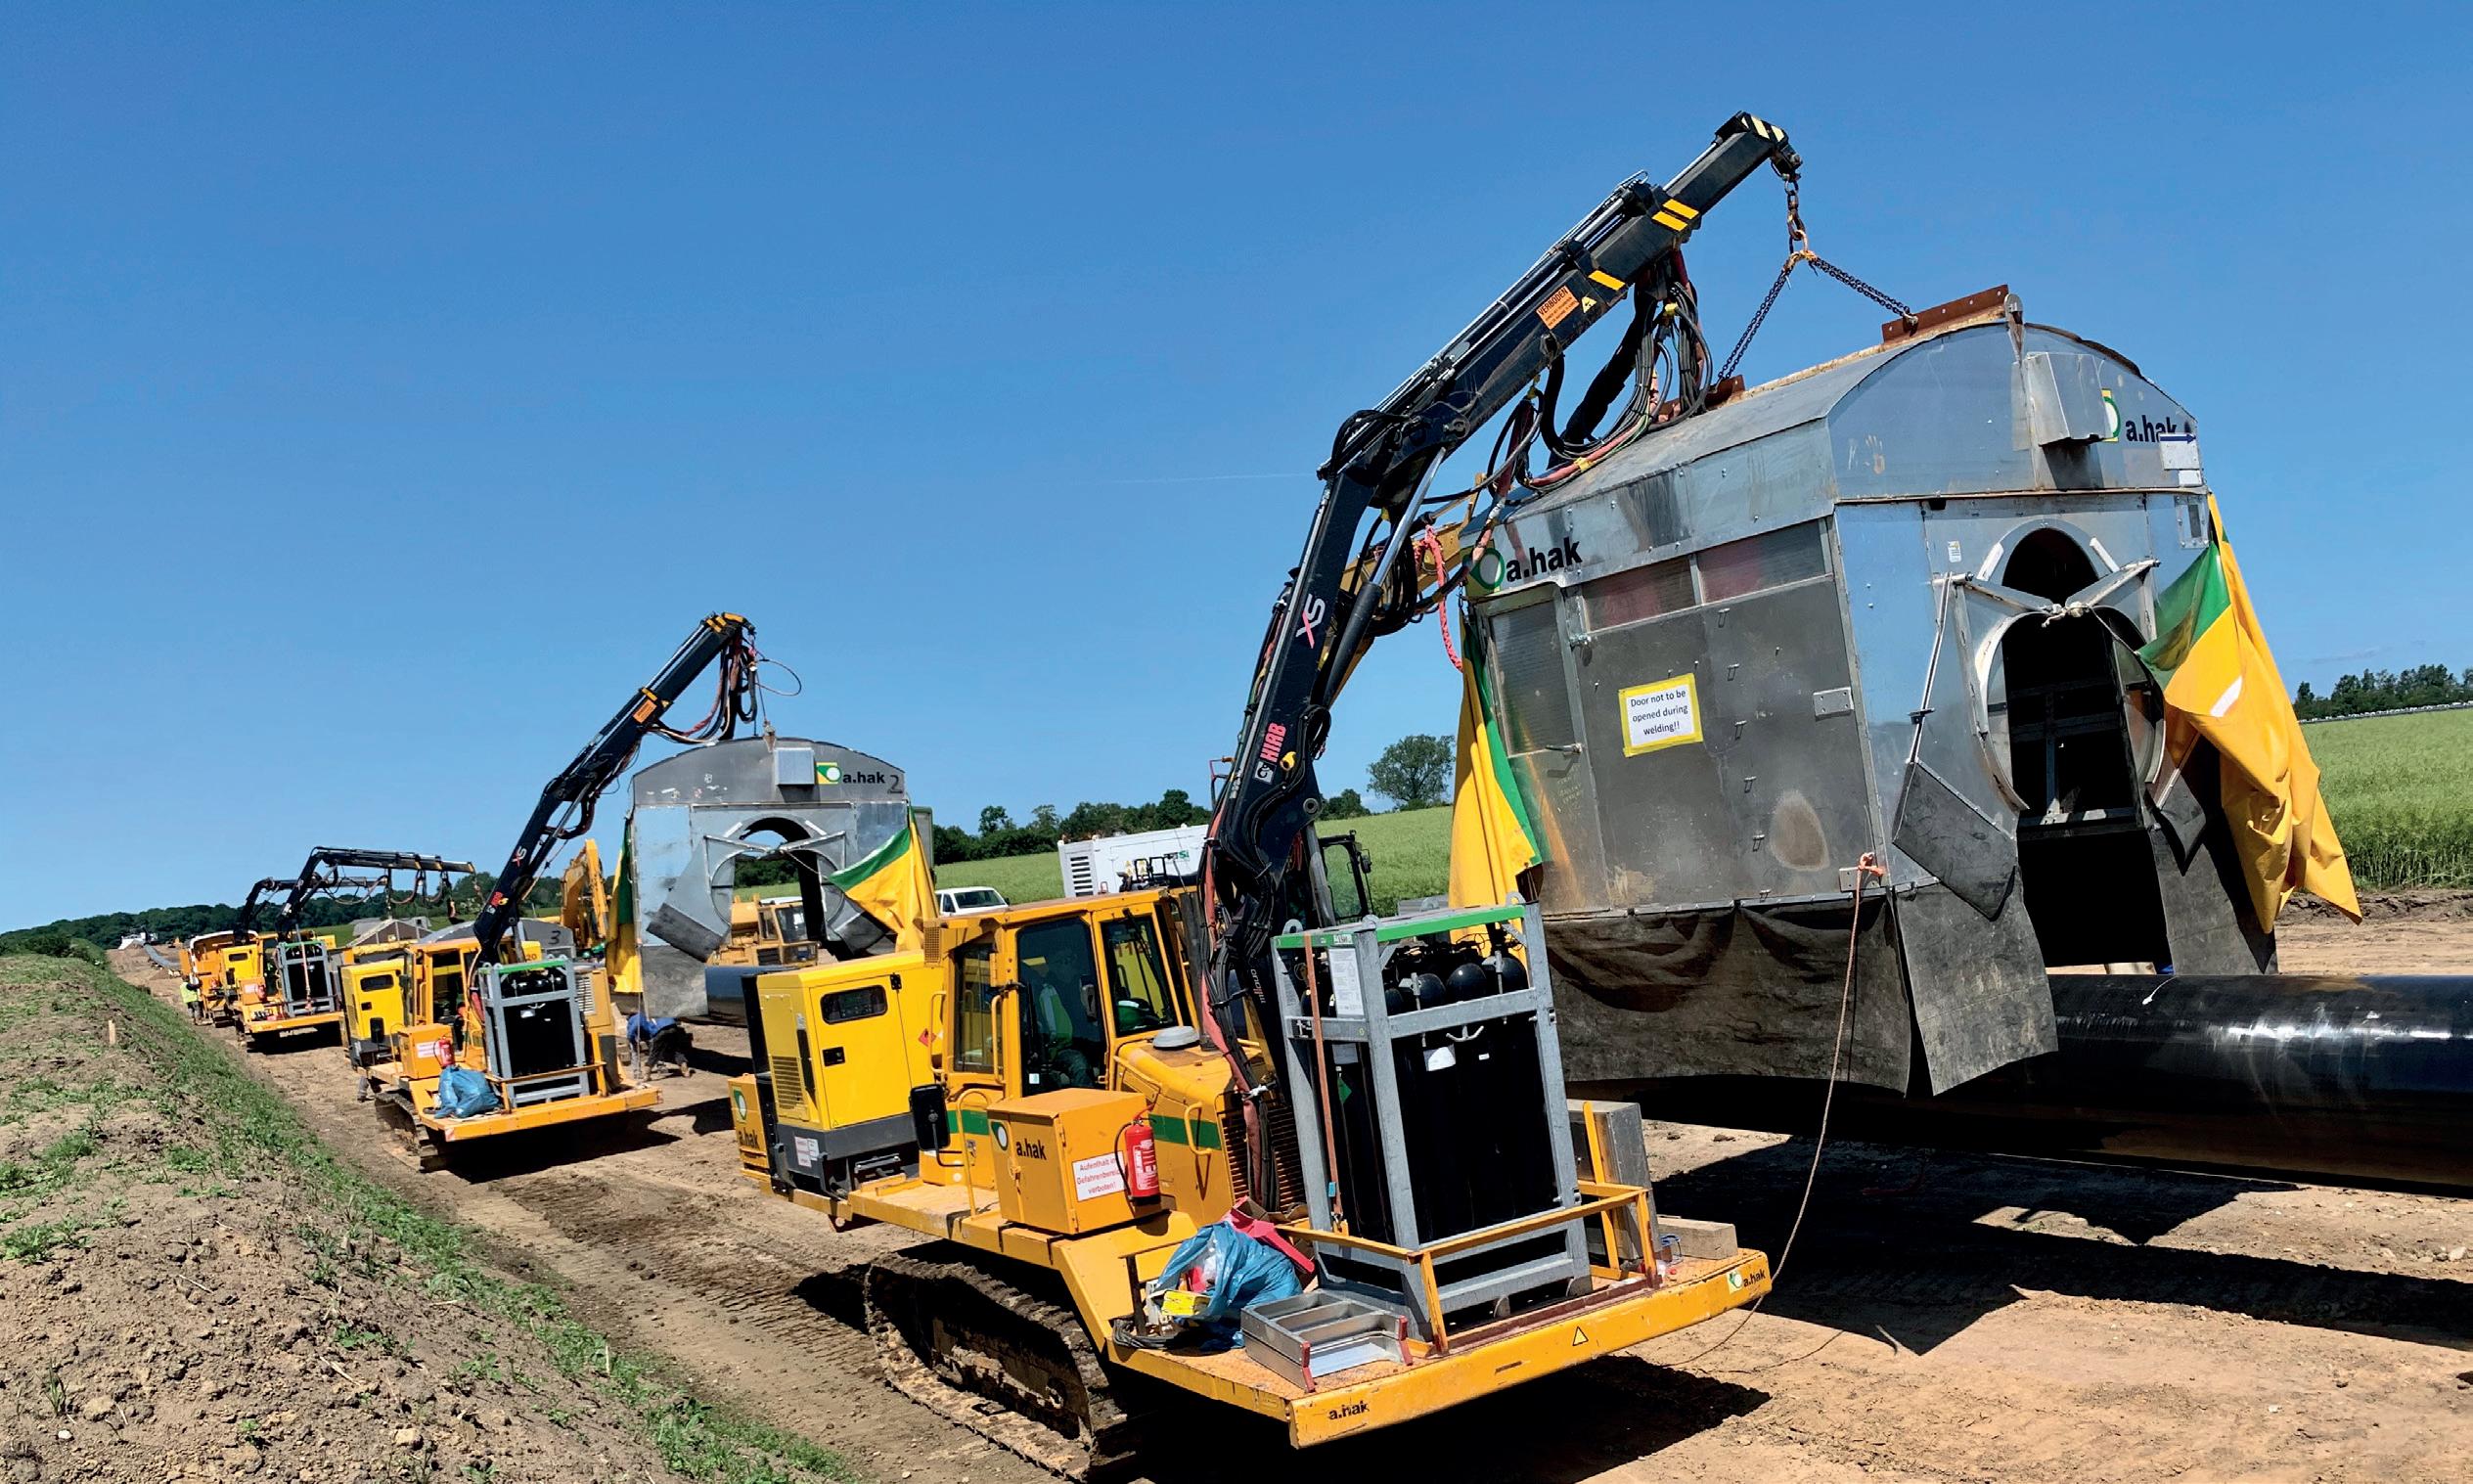
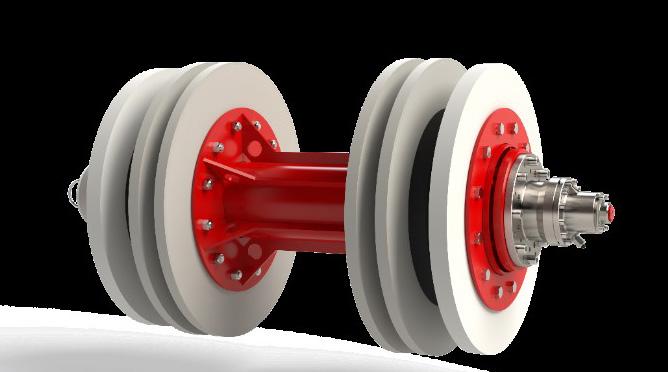 Figure 5. PipeDrift tool.
55th IPLOCA Annual Convention, ‘Together - Delivering Sustainable Energy Infrastructure’ 11-15 September 2023 - Vancouver, Canada Visit www.iploca.com to find out more Rewarding safety and quality in the pipeline industry
Figure 4. Bending strain comparison using PipeDrift for a pipeline movement area.
inhole and pitting corrosion are localised forms of corrosion which can be caused by corrosion mechanisms such as internal/external MIC, or externally in areas of disbonded pipeline coating and CP shielding. Pinhole features can also be caused from third party activity such as ‘illegal taps’ for product theft, manufacturing anomalies and girth welds defects.

Pinhole corrosion is often considered to be more critical with respect to pipeline integrity than uniform corrosion due to the high growth rates, and because the traditional MFL and UT inspection technologies had difficulty in reliably detecting and sizing pinhole features,
due to the low volume and small area of metal loss (ML). As defined by POF specification, a pinhole is a localised ML feature with surface dimensions smaller than 1 WT (1·t) or 10 mm whichever is greater in length and width direction. 1 Frequently such features are too small to be reported, with a resulting challenge for pipeline operators to manage the associated integrity risk.
Pinhole features tend to cause small leaks and are difficult to detect in operation. Therefore, detecting and sizing of such features is of considerable interest to the pipeline industry. Modern ultra-high resolution (UHR) MFL technology has been demonstrated to be capable of detecting such pinhole features, giving an in-depth analysis of
31
Alejandrino Ruiz, John Healy and Bradford Edwards, Pipecare US LLC, USA, discuss detecting and sizing small diameter ‘pinhole’ type defects.
the pipe wall status and improved reliability in detecting and sizing pinholes features.
A ‘blind’ flow through test
At the end of 2021, Pipecare conducted a ‘blind’ flow through test using an UHR MFL tool to detect, size, characterise, and locate small diameter ML features (POF dimension class ‘pinholes’), in an 8 in. flow string (test loop) located at PRCI-TDC facility in Houston, Texas, USA. After the completion of the MFL inspection and submission of the inspection report to the operator, the
pipeline was sectioned and the ML features present were characterised and sized (depth, width, length) using laser scanning. 2,3 The resulting database of 152 ML features in the test loop was provided to Pipecare to conduct a detailed review of the performance of the UHR MFL inspection.
Classification of ML features
Based on the database review, it was confirmed that the test loop incorporated several real ML features on the internal surface of the pipe wall. The internal ML features ranged from 0.04 - 1.25 in. dia., and depths ranged from 5 - 61% of nominal wall thickness (NWT).
Internal ML features were classified according to POF dimension classes and they are showed in Figure 1 and a summary, also, presented in Table 3. Considering this, most of the internal ML features (94%) in the test loop are related to pinhole features.
Features detected by Pipecare UHR MFL tool
A direct comparison of the internal ML features in the test loop and those reported by Pipecare MFL tool is shown in Table 2.
In general, this assessment showed good correlation between the MFL inspection and laser scanned data.
Based on the outcome of the review of the 152 ML features provided:
) 113 internal ML features in the test loop had dimensions below the detection and sizing capabilities of the UHR MFL tool (i.e., minimum pinhole diameter to report <0.7·t at POD = 90% if depth = 20%·t). 4
) The remaining 39 internal ML features were within the MFL detection specification.
Overall, the UHR MFL tool detected 69% (= 105/152) of the features provided, which represents:
) The tool reported all internal ML features which met the detection specification at a 90% POD.
) In addition, the tool also reported 66 internal ML features with dimensions below the detection specification, where the tool exceeded the specified 90% POD.
Review of UHR MFL inspection: sizing accuracy
The MFL feature dimensions reported vs feature dimensions measured (or verified) by laser scanning for the 105 internal ML features (matched) are shown in a unity plot in Figure 2 for the features depth, with the depth sizing tolerance bands according to POF anomaly classes and MFL tool specification.
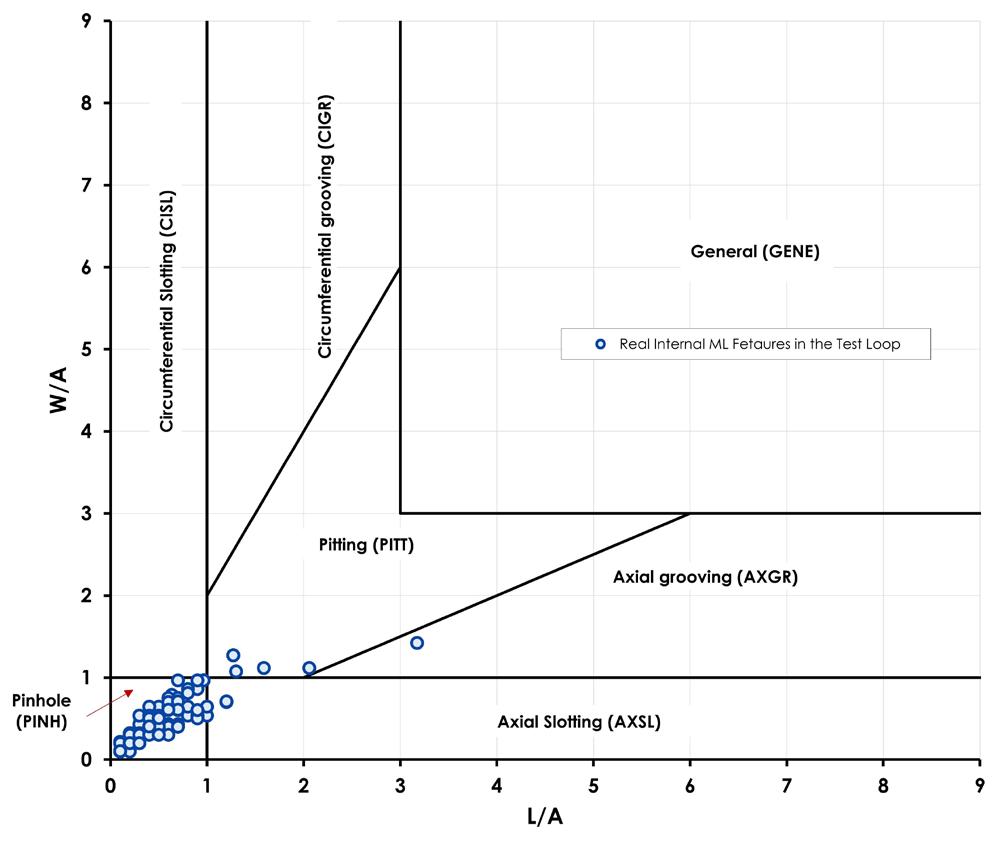
In addition, in Table 1 a comparison of ML features depth, length, and width: ILI reported vs verified is presented.
Considering it, the following was noticed with respect of the actual certainty of the ML features sizing accuracy:
) 95% of the ML features were reported within depth tolerance.
PITT AXGR PINH AXSL Total 6 1 143 2 152
Table 3. Summary of internal ML features according to POF
Description On testing loop Reported by MFL tool Comments External ML 0 0 06 additional internal ML features were reported for a total of 111 internal ML features reported by the
Internal ML 152 111
Oversized Inside tolerances Undersized Depth 3 100 2 Length 3 102 0 Width 15 90 0
Table 2. Qualitative comparison of ML features reported by MFL tool
UHR MFL tool
Table 1. Comparison of features dimensions: ILI reported vs verified
32 World Pipelines / JUNE 2023
Figure 1. Internal ML features according to POF dimension classes.
Expect A Higher Standard

) 97% of the ML features were reported within length tolerance.
) 86% of the ML features were reported within width tolerance.
Based on this, it is observed that the ILI performance based on depth and length exceeded the stated specification of 90%, achieving certainty levels of 95% and 97%, respectively. The ILI performance for width sizing
was slightly below the stated specification at 86% but nevertheless demonstrated the high performance of the Pipecare UHR MFL Tool.
Case study: a test run in a real pipeline
Based on the results obtained by the Pipecare UHR MFL tool for detecting and sizing pinholes defects in the test loop, the UHR MFL tool was tested again in a real pipeline to verify its performance and capabilities of the tool in a regular inline inspection (ILI).
In 4Q22, Pipecare conducted an ILI in an 8 in. crude oil pipeline using the UHR MFL tool. 6 For the validation of the ML features reported and tool performance evaluation of Pipecare MFL tool in accordance with API-1163, ML features were selected and verified in dig verifications (DV) activities by the pipeline operator. 5,7
Description of ML features from DV
After the completion of the MFL inspection and submission of the inspection report, the pipeline operator performed DVs. 7 The ML features that were found in the pipeline were characterised and sized (depth, length, and width) by visual inspection and by hydroform UT inspection.
The resulting database of 70 internal ML features from the verification activity was provided to Pipecare to conduct a detailed review, again, of the performance of the UHR MFL tool. Internal ML features were classified according to POF dimension classes, and they are showed in Figure 3 and a summary, also, presented in Table 4.
The Pipecare MFL tool specification indicates that the minimum pinhole diameter, to be detected at 90% POD with a depth of 20% NWT should be 0.70 times the wall thickness (t) of the pipe. 4
Based on this, only one pinhole feature was reported in the verification dig having a depth less than 20% NWT, the length and width of this feature is outside of the stated MFL tool specifications (pinhole diameter <0.7·t, see red dot on the POF plot in Figure 3).
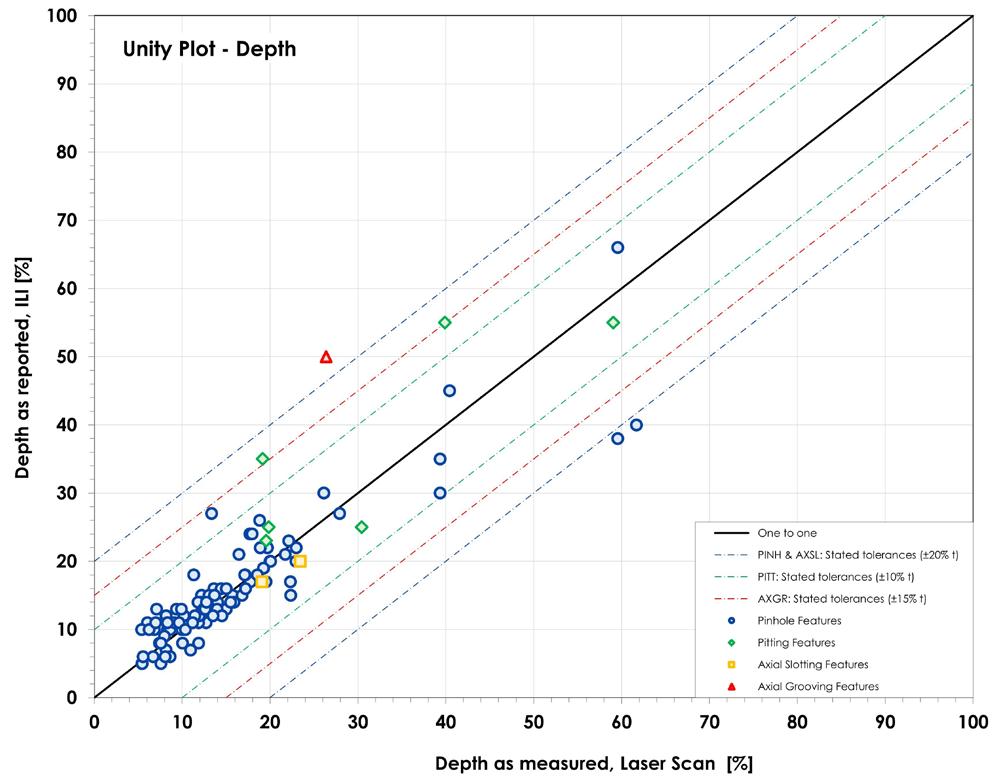
Features detected by Pipecare UHR MFL inspection
A direct comparison of the internal ML features reported in the DV and those features reported by Pipecare UHR MFL tool is shown in Table 5.
In general, all the ML features found and identified in the DV were matched to the ML features reported by the Pipecare MFL inspection.
Review of UHR MFL inspection: sizing accuracy
The reported MFL feature dimensions vs feature dimensions measured (or verified) for the 66 internal ML features are shown in a unity plot in Figure 4 for the features depth, with the depth sizing tolerance bands according to POF anomaly classes and MFL tool specification. In addition, the feature depth, length, and width reported by MFL inspection has been compared with those verified in field and a summary is presented in Table 7. 6,7
Based on API-1163, an estimate of the actual certainty can be obtained from the sampling process (i.e. the evaluation
PINH PITT AXSL AXGR CISL Undefined Total 26 7 30 2 1 4 70
Table 4. Summary of internal ML features according to POF
Description Reported by DV Reported by MFL tool Comments External 0 0 Sizing reported on 66 internal ML features from DV. On the remaining 4, sizing was not reported from DV due to their depths was less than 5% Internal 70 70 Table 6.
reported vs verified ρ (%) ρ (%) ρ upper (%) Criteria Depth 90 86 91 ρ upper ≥ ρ Length 90 94 96 ρ upper ≥ ρ Width 90 83 88 ρ upper< ρ
Table 5. Qualitative comparison of ML features reported by MFL tool
MFL tool performance for the sample of internal ML
34 World Pipelines / JUNE 2023
Figure 2. Unity plot ML features depth reported vs verified.
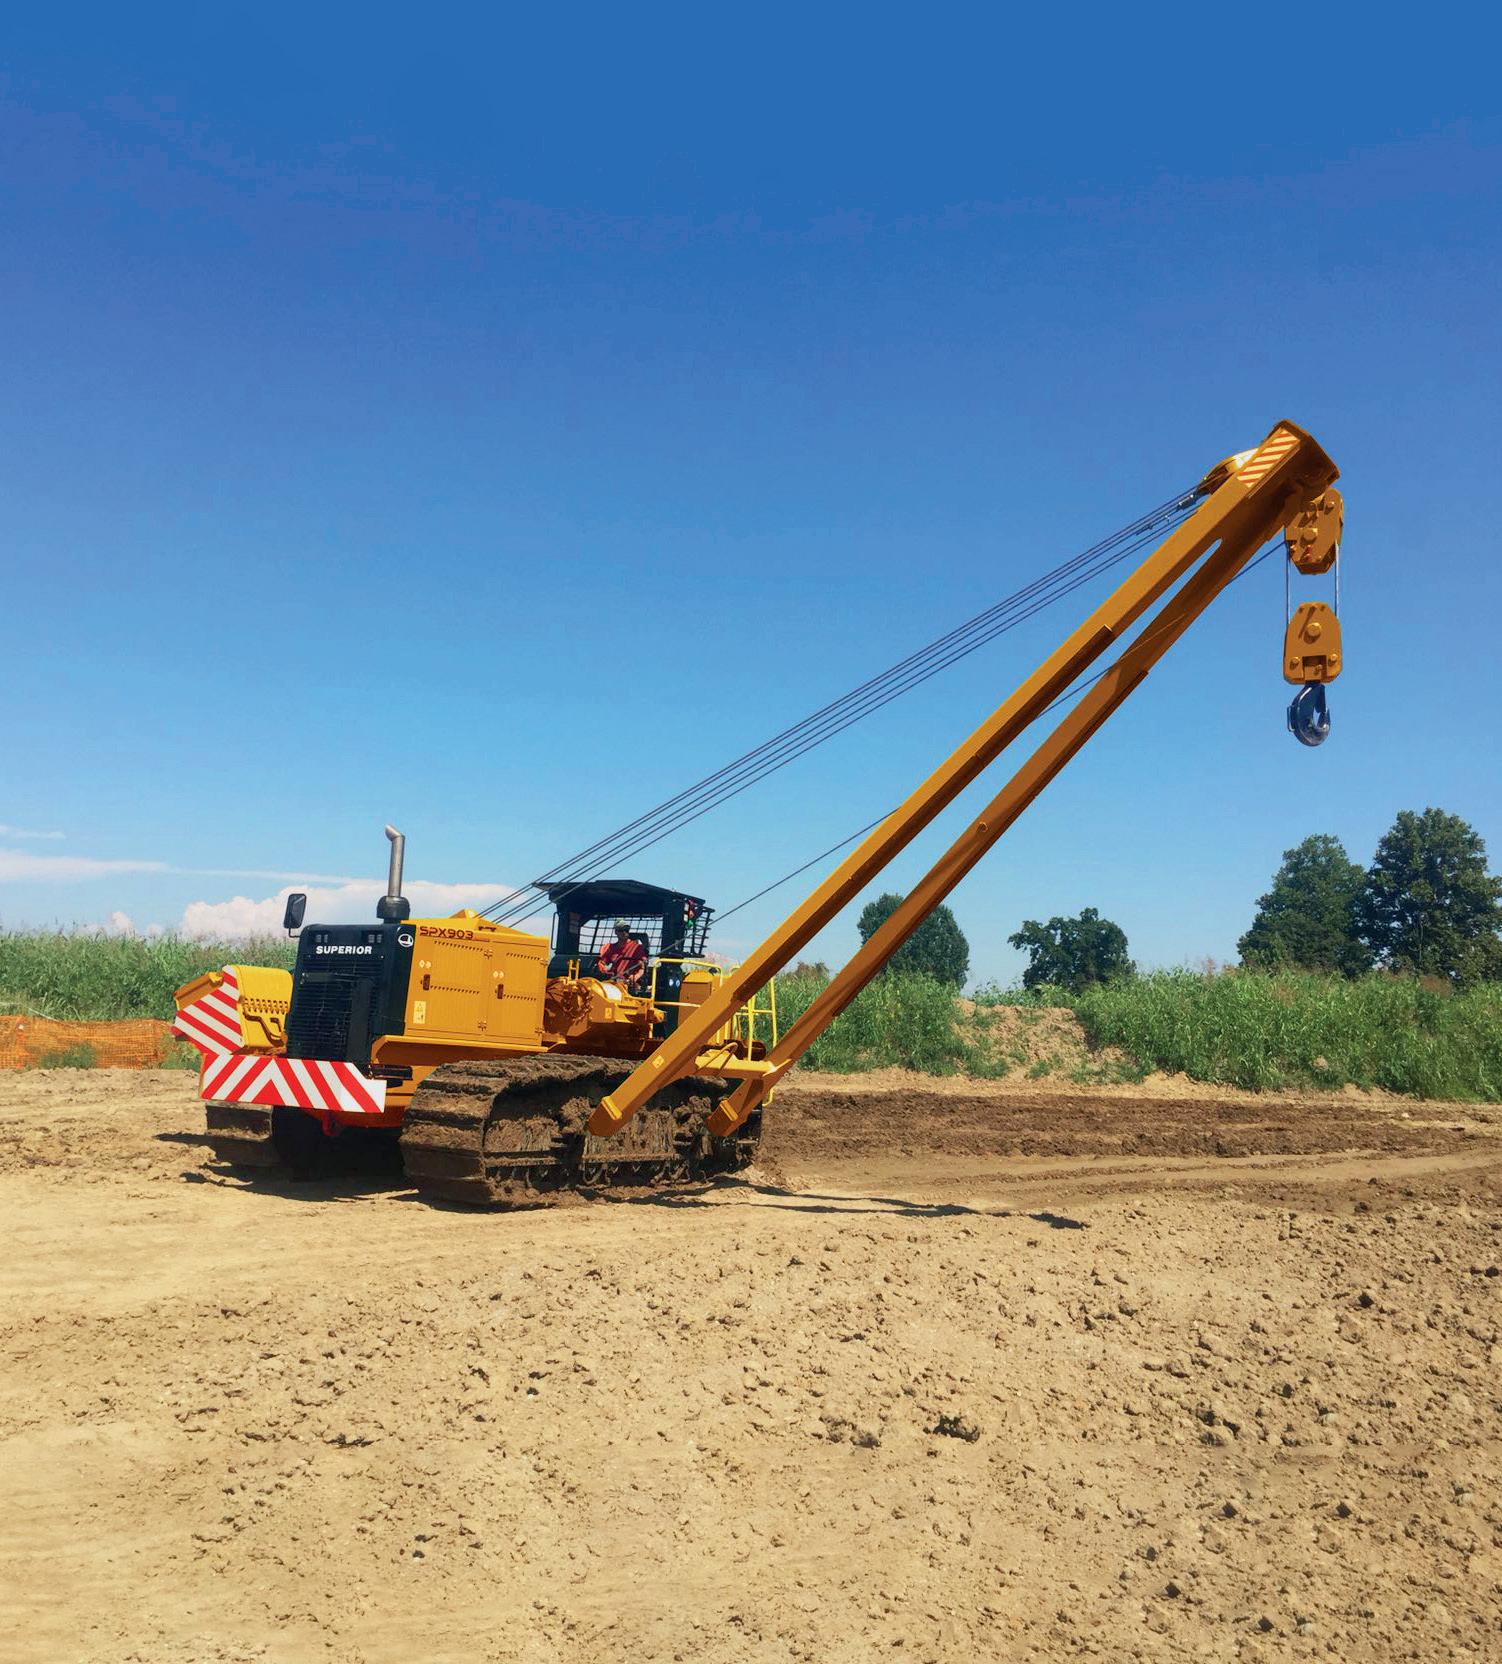


pipelayer machine INNOVATIVE AND CUSTOMIZED INNOVATIVE AND CUSTOMIZED SOLUTIONS FOR EVERY CHALLENGE since 1958 Parma, Italy spx - 903 FOR MORE INFORMATION SCAN HERE spx series 260 / 460 / 670 / 803 / 903 / 960 HYDROSTATIC TRANSMISSIONS ANTI-TIPPING SYSTEM www.scaipspa.com VARIABLE GAUGE (3M WIDTH) CLOSED CABIN WITH ROPS / FOPS
of matched ILI and field measurements), and it can then be compared to the specified certainty to assess the confidence level that can be associated with the specified performance. The ILI tolerances of the Pipecare UHR MFL tool are stated at 90% certainty (ρ ).
The actual certainty ( ρ ), or proportion of anomalies within tolerance, has been estimated. An upper bound ( ρ upper) estimate of the actual proportion of measurements within tolerance, has also been done. In this review, the
upper bound has been estimated for a 95% confidence level ( α ).
Thus, for a given sample of ILI and field measurements, the estimated upper bound on ILI certainty can be compared against the specified certainty p as follows.
• If ρ upper< ρ , the field measurements suggest that the ILI performance is worse than specified.
• If ρ upper≥ ρ , the ILI specification remains a plausible description of performance for the larger population of ILI measurements.
Table 6 shows the results of the estimation of the actual certainty from the evaluation of matched depth, length, and width by ILI (MFL inspection) and depth, length, and width field measurements (by UT).
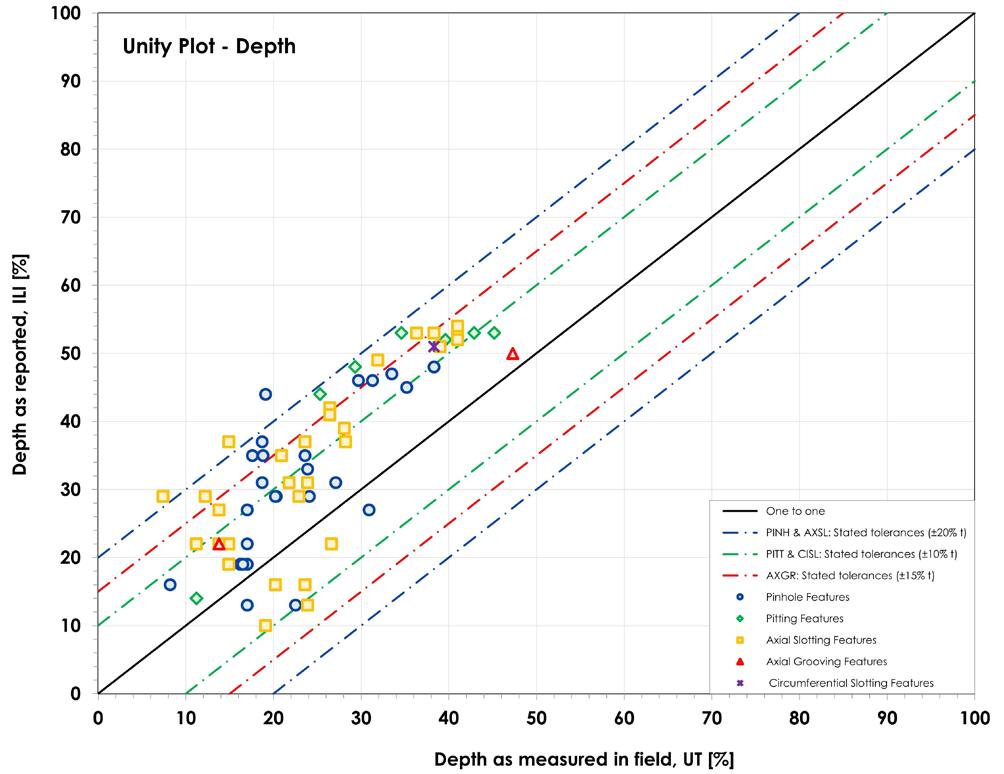
Based on this, and considering the given sample of ILI and field (depth and length) measurements, it is observed that the ILI performance based on depth and length exceeded the stated specification of 90%, achieving certainty levels of 91% and 96%, respectively.
The ILI performance for width sizing was slightly below the stated specification at 88% but nevertheless demonstrated the high performance of the Pipecare MFL Tool.
Conclusion
The results indicate that the UHR MFL tool detected all pinholes (and all other ML features) which met the stated detection specification and, also, some pinhole features that were below the detection specification could be detected.
The results also show the that the Pipecare UHR MFL tool exceeded the sizing specification for depth and length of small diameter ML features. However, the tool did not meet the sizing width stated specification, but it is understood it could be directly related on how the sensors are located circumferentially on the MFL tool and the space (distance) in-between them.
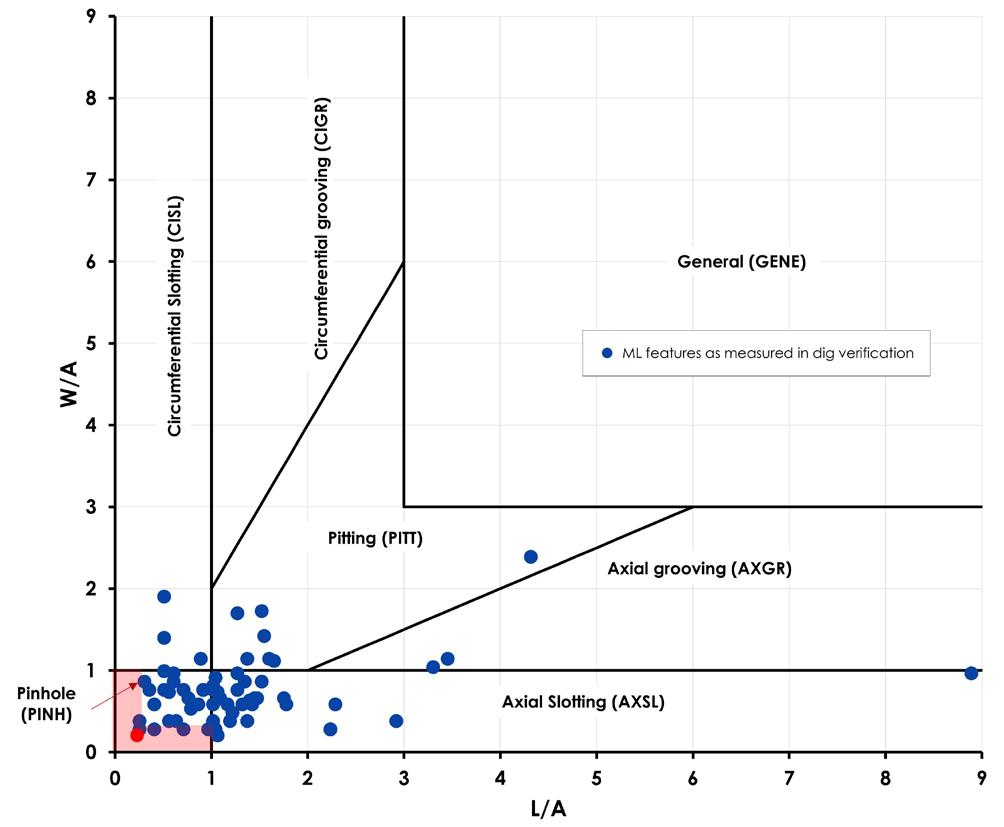
However, from a pipeline integrity perspective, as generally pinhole features would be expected to fail by through wall leak, then reliable detection and accurate sizing of feature depth and length provides the operator with the tools to manage the associate risk of such features being present in the pipeline.
References
1. ANON, ‘Specifications and requirements for in-line inspection of pipelines’, POF 100 (November 2021).
2. PIPECARE flow test report, MFL inspection on 8 in., PRCI FLOW TEST LOOP, 60 ft, conducted for pipeline operator (December 2021).
3. ANON, PIG Pipe NDE Report, NDE Data for pipeline operator (March 2022).
4. PIPECARE 8 in. MFL Performance Specification (2021).
5. ANON, ‘In-line Inspection Systems Qualification’, API STANDARD 1163, Second Edition (April 2013 and reaffirmed August 2018).
6. PIPECARE FINAL INSPECTION REPORT, COMBO [MFL+CLP+IMU] inspection on pipeline 8 in., 11.36 miles, conducted for pipeline operator (December 2022).
7. ANON, ILI Anomaly NDE Report, NDE Data for pipeline operator, Report No. NDE-…-0012/0013/0015/0017/0018. (January - February 2023).
Oversized Inside tolerances Undersized Depth 9 57 0 Length 0 62 4 Width 11 55 0
Table 7. Comparison of features dimensions: ILI reported vs verified
Figure 3. Internal ML features according to POF dimension classes.
36 World Pipelines / JUNE 2023
Figure 4. Unity plot ML features depth reported vs field verification.
TRI-CON SERIES FOR H2 APPLICATIONS

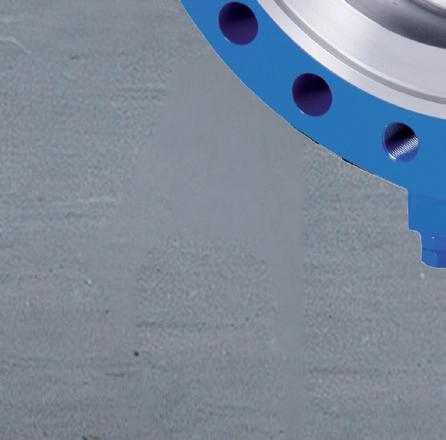
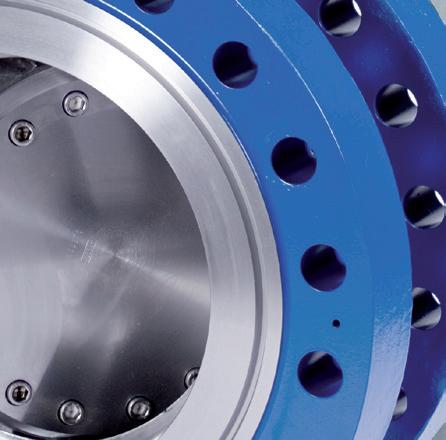
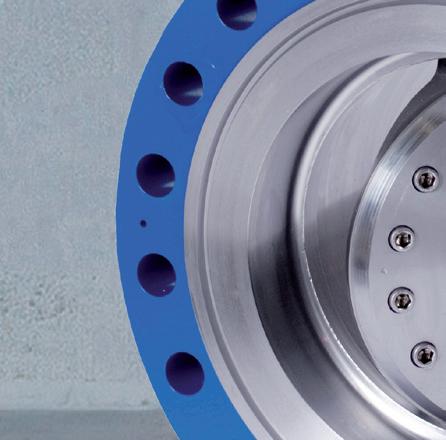
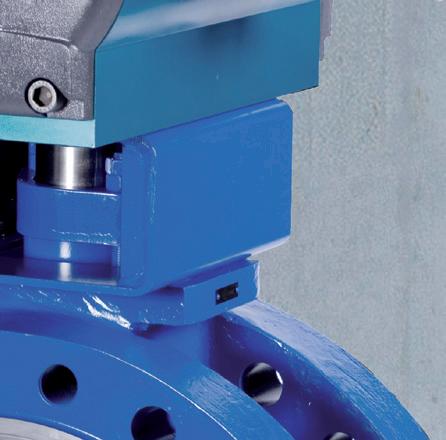

WWW.ZWICK-ARMATUREN.DE
H2-Ready!
ccording to Future Market Insights, “pipelines remain the top application in the global cathodic protection market. The segment is anticipated to generate more than 22% of the global market share and will gain 90 basis points by the end of the forecast period [2022 - 2032].”

Despite this, much of the innovation in impressed current cathodic protection (ICCP) systems has been limited to structures such as wharves, ports, bridges, tanks and other more complex concrete and steel buildings. New technologies such as switch-mode based ICCP systems have become more popular for these applications because it is better suited to smaller currents driving more individual zones of protection. Switch-mode technology is also more suited for use in concrete applications, where the current outputs are lower, and more zones are required to achieve more uniform protection over the structure.
In contrast, pipelines that run thousands of kilometres still tend to rely on simple yet reliable transformer/rectifiers (T/Rs) producing a single large output voltage, often hundreds of Amps, more suited to the single large structure of the pipeline. Here, the T/R is placed at pump stations situated along the length of the pipeline. Cables then run from the T/R to anode beds of high silicon cast-iron or mixed metal oxide, which are buried in the ground a short distance from the pipe dependent upon the resistivity of the soil. Sometimes the T/Rs are oil-cooled, rather than air-cooled, especially for pipelines that are transporting hazardous materials like gas, oil or petrol, for example to keep them explosion proof.
In either case, these T/Rs must deliver sufficiently high levels of current over long distances, to overcome voltage drops to the anodes and maintain a standard potential of 0.8 V below earth potential to supress corrosion. For example, a recent application quoted in the Middle East required around two dozen T/Rs each with a power output of 10 kW (100 V/100 A).
This is a relatively high output, given that most building-based applications require only 5 - 10 V to protect against large voltage drops. However, pipeline CP systems can experience significantly higher voltage drops than other applications. In most cases, for accessible portions of overground
38
David Celine, Managing Director, Omniflex, Australia, explains how inexpensive satellite technology is ushering in a new era for IoT-based pipeline monitoring.

39
pipelines, the voltages are ideally kept under 50 V to be deemed safe to touch.
Because longevity and reliability are essential in pipeline applications – and because any overhaul is prohibitively costly – many of these ICCP systems still rely on earlygeneration T/Rs. Despite the availability of newer-generation phase-control technology that allows the T/R’s output voltage to be adjusted linearly using a knob, many still rely on much older, simpler T/Rs where the output voltage is adjusted by using mechanical tap changers on the transformer that allow for variable turn ratios to be selected on the primary or secondary winding.
Measuring corrosion
Once the CP system is in place, one of the major challenges for operators is making sure that the pipeline is protected along its entire length. Suppressing the potential of the structure relative to earth using a T/R is not the difficult task; showing that it’s delivering ongoing protection is ultimately the more costly and time-consuming activity.
Firstly, the T/Rs need to be regularly inspected. Here, the feeds going from the T/R to each anode can be measured to
ensure that not only is the T/R producing current, but that there is continuity to each anode. It’s important to check the connection to the anode to check that it is receiving current, as it could have been damaged as a result of farming activity or have corroded to the point of requiring replacement. The technician will use this opportunity to also check T/R coolant levels and operating temperature, as many are oil cooled.
The second test that is carried out is an instant-off potential test, which measures the electrical potential along the pipeline relative to stable reference electrodes placed in the soil near the pipeline. The DC current applied to the pipeline from the T/R polarises the pipe’s surface and suppresses corrosion. To take the reading, the current is turned off, and the potential difference between the pipeline and reference electrode is measured at the instance of turn-off, after the current is turned off, but before the potential of the pipe has had a chance to change. This is called the ‘instant-off’ potential.
Typically, this requires a CP technician to drive the full length of the pipeline, perhaps as often as every few weeks depending on the product carried in the pipeline. As well as generally surveying the pipeline for visible signs of damage, such as fallen trees, evidence of leaks, vandalism and theft, the technician will take reference potential readings along the pipeline typically about every kilometre using test posts installed at regular intervals. A test post is often a 3 in. pipe that protrudes from the ground with a junction box on the top containing connections to the pipe and to a reference electrode buried in the soil near the pipe. By recording the potential of the pipe at these known intervals (often manually), a profile of the corrosion risks on the entire pipeline can be determined.
This measurement allows the true corrosion potential of the pipeline to be measured accurately without the influence of the polarising current, which can skew readings and not provide a true reflection of whether the structure is being protected. By comparing the instant-off potential to the initial potential measurement, the effectiveness of the cathodic protection system can be determined.

Traditionally, this instant-off measurement was achieved by cycling the T/R on and off, for example every 15 minutes, with the CP technician driving from one test post to another, using their watch to wait for the next off-cycle and taking the reading as soon as they detected a voltage drop. Thankfully, in recent years, this has been largely automated by using GPS receivers to allow a reading to be automatically taken at each test point and stored.
However, technicians are still needed to drive to each test-pole to manually retrieve the stored measurement data. This is because, while GPS receivers can be used to accurately take the reading, weak mobile reception in these often-remote locations means that conventional GSM technology can’t reliably be used to remotely relay the collected data.
This is no more apparent than in my home country of Australia. According to research from ClientSAT, “Mobile phone services currently reach 99% of the Australian population where they live. However, coverage is only available to around 27% of the Australian landmass.” This makes it difficult to
40 World Pipelines / JUNE 2023
Figure 1. The Omniflex C1 can fit inside a standard 3 in. test post.
obtain test measurements from areas of pipeline that don’t follow roads or are otherwise easily accessible.
Using IoT in pipeline CP
To date, using satellite communications has posed an expensive solution to the problem of remotely monitoring CP data from pipelines. Access to the subscription plans for these highorbiting satellite systems has traditionally been a barrier for pipeline operators, especially given the data only needs to be collected periodically. These plans typically start around AUS$35 per month but can be as high as AUS$99 per month to track a higher number of nodes with a higher messaging allowance.
However, recent advancements in satellite technology, such as those offered by companies like Astrocast, Myriota and Swarm, are for the first time enabling low-cost IoT applications to flourish. These so-called shoebox-sized satellites provide low-bandwidth satellite connectivity using ultra-small satellites in a low-orbit. The costs of these services can be as low as AUS$5 per month, making it feasible to monitor pipeline applications.
Also, because these satellites make use of a low-orbit, the ground-based transmitters don’t require large antenna systems or a mains power source to work. Mains power does not run the length of the pipeline and is only available at points such as pump stations, and having large antennas can put the system at risk of theft or vandalism. As such, it’s preferable to
have devices that can run on 10 year batteries and are made compact enough to fit inside the tube of the test-post.
It was this leap forward in satellite technology that allowed Omniflex to develop the PowerView C1 CP Test Point Monitor. This device is ideally suited to remotely monitoring test posts on CP pipelines. It’s small enough to fit inside the 3 in. testpost riser, runs on a 10 year lithium battery that would allow readings to be sent every two weeks, and can be remotely configured using the PowerView CP web portal.
The PowerView C1 CP can be set up to take different measurements, including pipe-to-soil, bond current, and foreign structure potential. Depending on the set-up, its input voltages range from -300 mV to +60 V AC and DC, making it ideal for pipeline applications. The device measures in at just 35 x 35 x 110 mm with a packed weight of just 150 g and has an ingress protection rating of IP67.

A new era of monitoring pipelines
These breakthroughs will increasingly eliminate the need for pipeline operators to send technicians out to manually collect measurements. Having more frequent access to CP data will also allow maintenance engineers to better manage their asset portfolio by only responding to events that require attention, thereby reducing their maintenance costs. These IoT solutions will also allow better management of more specialised CP applications like thickness testing on water pipelines, where the corrosion occurs on the inside surface of the pipeline.


Stay informed www.oilfieldtechnology.com Keep up to date with us to hear the latest in upstream oil and gas news
Ehsan Jalilian and Mike Hooper, Hifi Engineering, Canada, describe advances in machine learning-based event detection, as well as examples of their effective application beyond the realm of leak detection.
ipeline safety is a top concern for the general public, governments, and energy companies. Integrity failures can be caused by a host of instantaneous or gradual events including impact forces, one-time or accumulated strain and ground movement, and can manifest as major rupture events or more insidiously as low-rate, longduration leaks. Pipeline companies rely on a number of technologies such as mass balance systems, aerial surveillance, and inline inspection tools to monitor the integrity of their pipelines on a regular basis.
Fibre optic pipeline monitoring has the advantage of continuous monitoring in both time and space. Deploying the fibre optic cable on, near, or inside the pipe effectively transforms it into a powerful suite of distributed sensors. Hifi’s HDS technology utilises the power of high-fidelity fibre optic dynamic sensing to detect small changes in the optical path length
between two adjacent fibre Bragg gratings (FBGs), which are used as low angle wavelength reflectors. These perturbations are representative of the strain, vibration, acoustic, and thermal energy applied to the fibre optic sensor.
A variety of independent event identification algorithms are applied to the data acquired from the fibre optic sensors to detect the occurrence of pipeline integrity-related events such as leaks, flow anomalies, or excessive strain. Further algorithms are also used to track pigs in the pipeline, estimate flow rate, and pressure, etc.
Background
Artificial intelligence and machine learning (ML) are rapidly gaining prominence as the preferred methods of choice for event detection. Supervised learning approaches such as classification algorithms are

43
powerful tools that can utilise a large database of known events, for instance simulated leaks, to train a monitoring system to detect events such as pipeline leaks, pig runs, and flow anomalies.
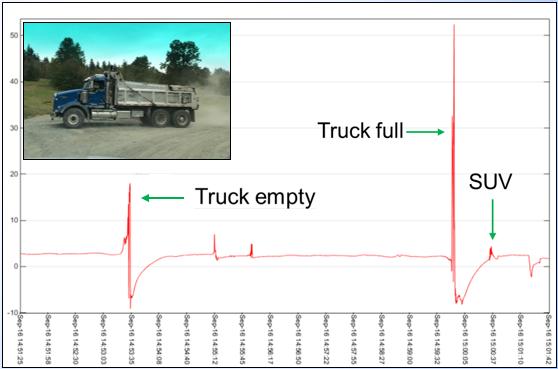
A robust approach to ML-based pipeline integrity monitoring employs multiple orthogonal algorithms which aim to identify specific events – leaks serve as excellent examples – using independent methods. One possible approach is supervised learning, where a labelled database of simulated events is utilised to train an algorithm on the specific signatures of a leak. These algorithms could be in the form of convolutional neural networks (CNN) that are well-suited to image recognition applications. In this case, the acoustic signature of the leak would be processed as an image. It is also possible to use supervised learning to train algorithms with time series data which may include features extracted from raw data, for example acoustic intensity, strain magnitude, signal power in various frequency bands, etc. Sequential neural networks are a common choice for algorithms of this nature.
Other independent leak detection approaches leverage anomaly detection and flow variation detection algorithms.
Unsupervised learning methods of this nature (such as cluster analysis) are useful in cases where insufficient training data exists for the event of interest, or where the available training data (i.e. simulated leaks) is not relevant to the specific deployment environment.
Anomaly-based algorithms do not directly target the detection of leak signatures, operating instead on the basis of extracting a number of features from the raw data and allowing the features of the incoming data to form natural clusters in the feature space. For instance, the acoustics from the normal flow of a pipeline and a nearby pump result in the formation of two distinct clusters in the feature space. During a baselining period of sufficient duration, various clusters are formed and become ‘known’ to the algorithm, i.e. the algorithm considers them normal even though it has not been directly trained to recognise or label them. The appearance of a new feature cluster indicates that an anomalous event has been detected. Anomaly detection algorithms can provide an additional layer of security by eliminating the dependency of the supervised learning algorithms on the availability of data from simulated events which are sufficiently representative of real-life leaks.
Among the value-added applications of pipeline fibre optic monitoring are pig tracking and flow, pressure, and density estimation. Pig tracking enables pipeline companies to know the exact location of the pig, along with its speed and estimated arrival time at the next pig catching station. Strain and acoustic data collected from previous pig runs (see Figure 4) can be used to train classification algorithms. Imposing postclassification selection criteria such as acceptable direction and speed bounds can be used to reject events such as cars travelling on roads parallel to the pipeline right of way (ROW).
A novel approach in testing the efficacy of leak detection algorithms is to use software-simulated (also known as deep fake) leaks. Using a database of
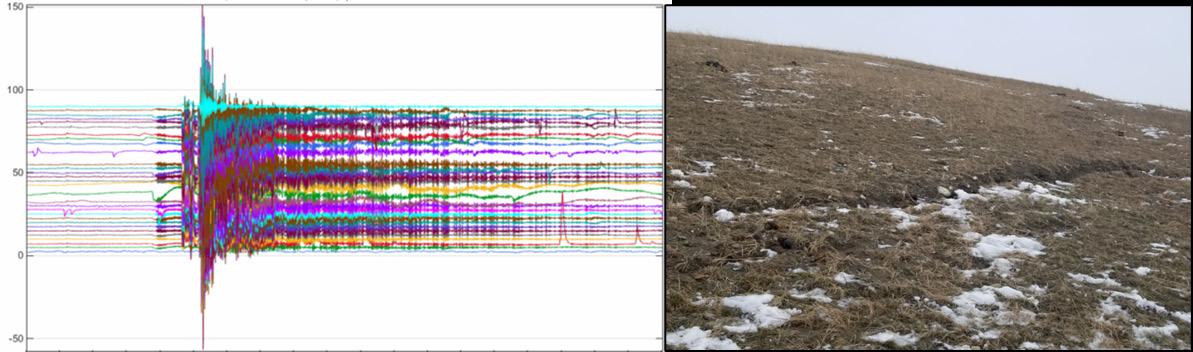 Figure 1. Abnormal strain monitoring for pipeline integrity.
44 World Pipelines / JUNE 2023
Figure 2. Geotechnical (earthquake) event signature (left) and ground disturbance (right).
SEEING IS

Take a look at our ABC Certificate. It shows our circulation has been independently verified to industry agreed standards. So our advertisers know they're getting what they paid for.


ABC. See it. Believe it. Trust it. To advertise email Chris Lethbridge and Daniel Farr at chris.lethbridge@worldpipelines.com and daniel.farr@worldpipelines.com


www.abc.org.uk
field-simulated (true) leaks, a generative adversarial network (GAN) can be used to create fake leaks that are effectively indistinguishable from the true leak signatures. These fake leaks can then be integrated with real data, for example, real-time data streaming from a distributed fibre optic sensing system deployed on a pipeline. The combination of real data with the fake leak can be utilised to test various leak detection algorithms.
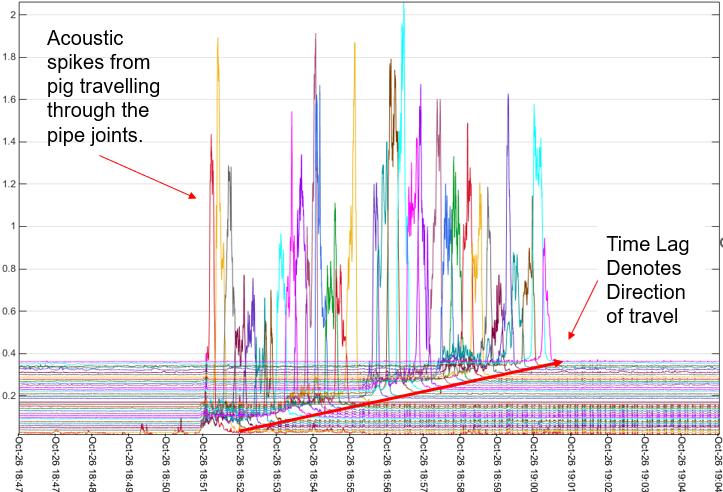
Lastly, another emerging field of data-driven pipeline integrity assurance relies on data fusion techniques to synthesise data acquired from a variety of independent sources to identify patterns that may serve as precursors to leaks or other pipeline failures. For instance, strain data acquired from distributed fibre optic sensors can be combined with data acquired from point strain gauges to form a clearer understanding of the geotechnical activity occurring on a pipeline ROW. Multi-source data fusion focused on geotechnical phenomena has been successfully
demonstrated in a case study performed on a pipeline in Western Canada.
Value added sensing applications
The range of potential applications supported by distributed fibre optic systems on pipelines is very broad, with functionality to provide significant value-added monitoring and operating capabilities. Familiar applications include high fidelity distributed sensing applications for leak detection, abnormal strain (Figure 1), ground disturbance and geotechnical events (Figure 2), slope stability, and thermal anomalies.
Other more operationally focused applications are also enabled through high-fidelity sensing for pipeline monitoring. These include pig detection/tracking/analysis, moving vehicle detection such as trains, and flow monitoring. The specialised fibre optic sensor is leveraged with ML as detailed herein to combine acoustics and vibration for successful characterisation of these operating conditions. Pig tracking (Figure 4) can be showcased on a user interface in real-time along with alarm conditions in the event the pig is slowing down or becomes stopped in the pipeline.
Similar approaches may be employed to leverage ML algorithms to support the estimation of fluid flow, based on correlation of acoustic signatures and independent measurements for varying operational parameters including flow rate, pressure and density (Figure 3). Intuitive examples include batch tracking, custody transfer, or detection of flow anomalies such as debris or paraffin buildup, or early onset of corrosion detected through pitting signatures from the fibre optic sensor.
Finally, distributed fibre optic data can be combined with other independent data sources to fill in both temporal
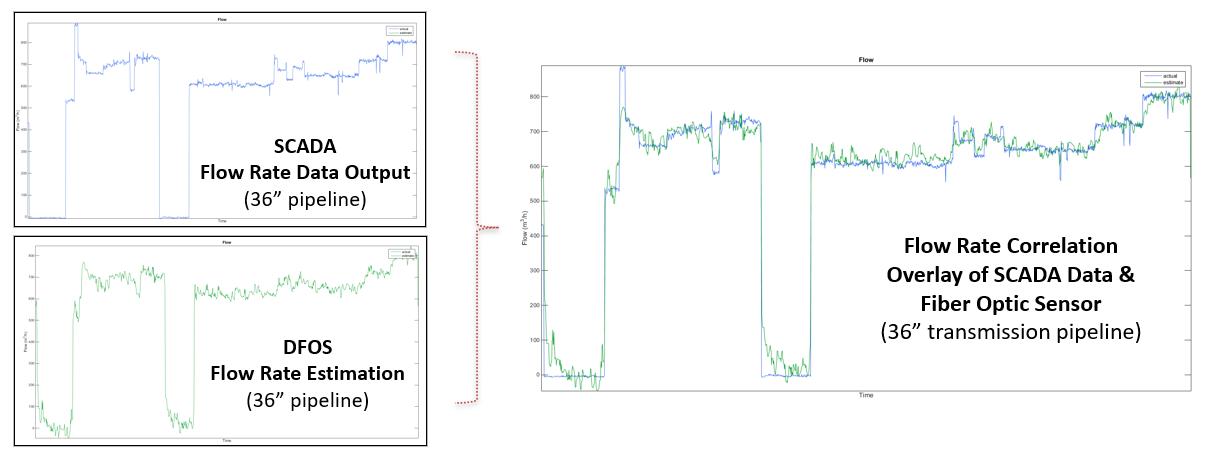 Figure 3. Flowrate correlation of SCADA data and fibre optic sensor.
46 World Pipelines / JUNE 2023
Figure 4. Pig detection and tracking.
AGRULINE XXL PIPES
HDPE piping systems for intakes & outfalls
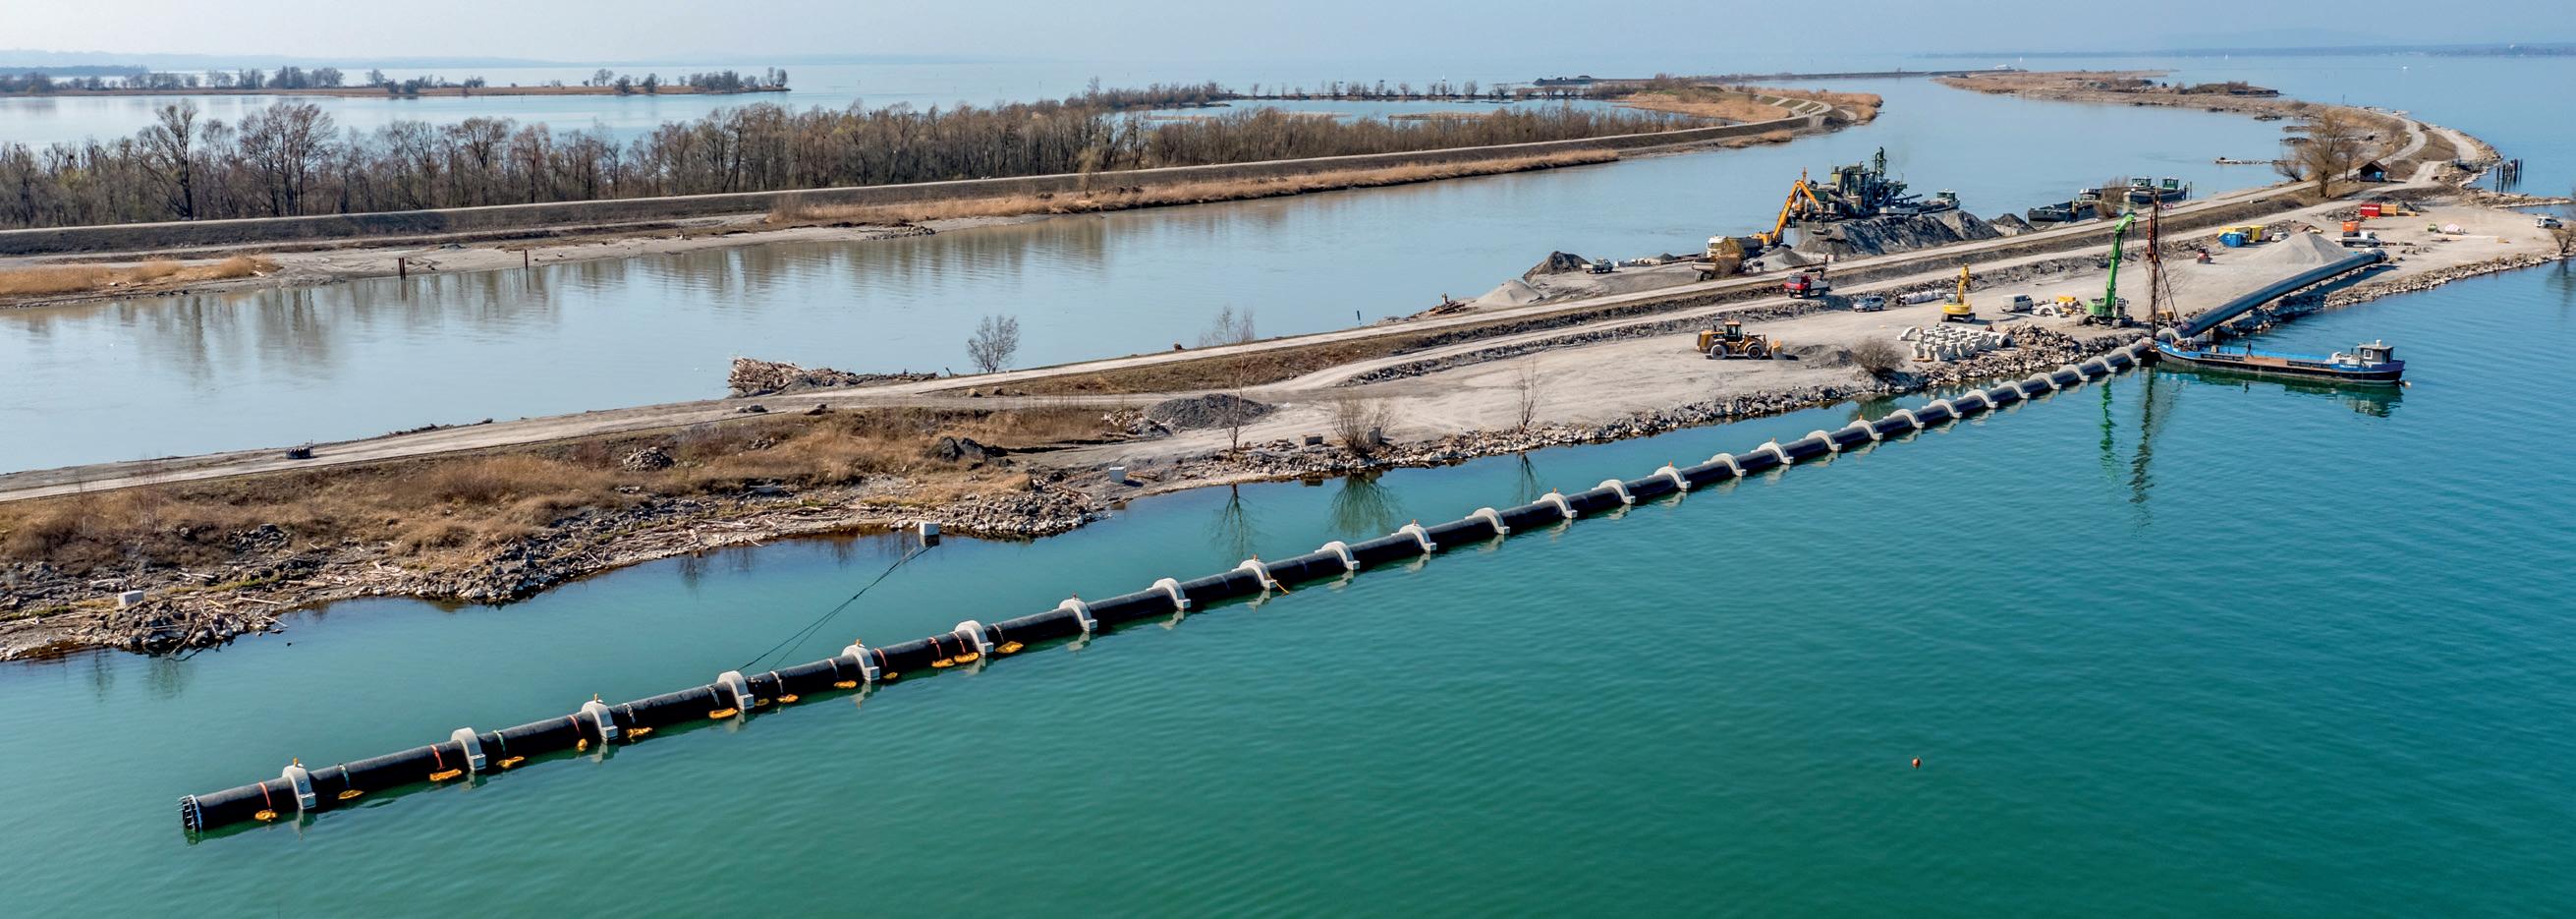
• OUTSTANDING LIFE SPAN
• FAST AND EASY INSTALLATION
• FOR HIGH-VOLUME FLOWS
• HIGH-QUALITY MATERIALS

• EXPERTISE IN PLASTICS PROCESSING

agru Kunststofftechnik Gesellschaft m.b.H. | Ing.-Pesendorfer-Strasse 31 | 4540 Bad Hall, Austria | www.agru.at |
Bild: Stiplovsek Dietmar
(i.e. periodic surveys) and spatial (i.e. point sensors) data gaps, as well as to provide a continuous, reliable reference dataset for the suite of existing measurements. Application of data fusion techniques to the synthesised data may also identify patterns serving as precursors to leaks or

other pipeline failures. For instance, strain data acquired from distributed fibre optic sensors can be combined with data acquired from point strain gauges to form a clearer understanding of the geotechnical activity occurring on a pipeline ROW, as will be illustrated via a recent case study.
Multi-year efforts with Husky Midstream and Stantec in Western Canada leveraged cumulative strain data captured by the HDS technology in this fashion, specifically identifying strong correlations between the Hifi HDS strain data and various other sensors such as slope inclinometers and strain gauges. Figure 6 shows the LiDAR image of the slope on which the NPS 16 pipeline was located, with multiple active geotechnical zones. In addition to the real-time HDS fibre optic monitoring, the pipeline was instrumented with various other sources of data such as discrete survey monuments, slope inclinometers, piezometers, and a local weather station.
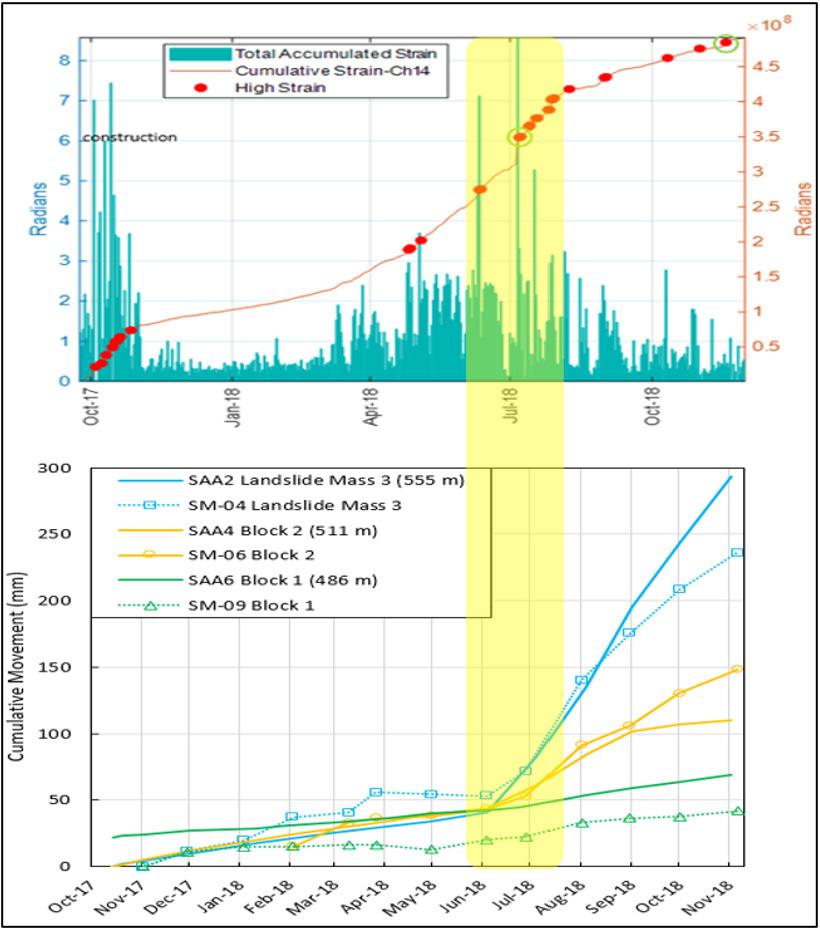
Figure 5 shows an example of the alignment between the HDS strain data and the slope inclinometers and survey monuments, where both independent sensors indicate increased strain/ movement in the pipe’s surrounding environment after heavy rainfalls in the summer of 2018.
Ultimately, the ability of the HDS technology to detect and effectively corroborate the geohazard risks associated with the NPS 16 pipeline proved key to supporting Husky’s decision to decommission and relocate this asset. This case study highlights a major value proposition of the HDS system, whereby the pipeline operators deploying high fidelity distributed fibre optic sensing can use the HDS cumulative strain data to identify areas of concern for long-term strain or ground movement, and if necessary, add discrete instrumentation such as strain gauges and slope inclinometers to those specific areas of concern.
Figure 6. LiDAR image with 1.5x vertical exaggeration of the NPS 16 pipeline, HDS fibre, and other instruments.
48 World Pipelines / JUNE 2023
Figure 5. Data fusion case study for geotechnical activity on pipeline ROW highlighting the alignment between HDS strain data and slope inclinometer and survey monument readings.
here’s much to be attained in navigating the inherently muddy waters of risk assessments. Examining a pipeline asset’s current characteristics, as well as external factors, must come into play.

Spatial risk assessment in the context of pipeline operations necessitates the use of robust software solutions that allow for data integration from across an enterprise. The development of complex risk algorithms, using modular threat and consequence models, is allowing for high-resolution risk analysis for pipelines.
A growing number of pipeline companies are using customisable risk-modelling solutions to make more informed decisions to effectively manage and deal with risk. By combining business logic, engineering best practices, operational expertise, and asset management strategies, pipeline operators can take an integrated approach to comprehensive risk assessments.
Data chiefs
MIT Technology Insights shared the results of a recent global survey including 351 Chief Data Officers, Chief Analytics Officers, Chief Information Officers, and other senior technology executives. They revealed how much weight companies have been giving an enterprise data strategy, in alignment around business objectives such as improving operational efficiency and maintenance of physical assets.
Almost half of the oil and gas respondents had already been evaluating or implementing a new data platform to enable enterprise-wide data strategy or solutions to address current
49
Michael Ray and Greg Cameron, Emerson, USA, outline a data-driven, evidence-based approach to modelling pipeline risk.
challenges. However, only 17% of oil and gas respondents rated their organisations as high achievers on their data strategy delivery. Obtaining greater visibility through data-based analytics and actionable insights is a very real and available possibility for oil and gas companies interested in managing risk from a more holistic pipeline integrity point of view. Data integration from various sources empowers users to quantify risk more accurately, and subsequently prioritise actions to mitigate it.
Risk assessment results are only as good as the input data; any risk modelling and mitigation strategy you choose should be designed to meet the needs of your assets and utilise the data you have available. Advanced GIS software tools create sophisticated, modular models to identify threats and assess pipelines, utilising design, operations, maintenance, and assessment records or spatial risk models.
The value of risk assessments
Risk can be defined in the context of a simple equation; the consequence of failure multiplied by the likelihood of failure. From a highly objective standpoint, pipeline operators must have a clear comprehension of what types of risk they will likely face. Risk mitigation in the context of safety, pipeline integrity and economic impacts is multifaceted in the oil and gas industry, and worthy of broader discussion.
Many risk models look at similar threats to a pipeline. Threats that should be considered in a risk model include, but are not limited to, external corrosion, internal corrosion, stress corrosion cracking, third party damage, incorrect operations, equipment failure, manufacturing defects, construction defects, and weather/ outside forces.
All around the world, there is a stable group of ever-present threats operating in various states of future potential to cause harm; effectively leveraging your pipeline data paradigm can provide a clearer, more comprehensive look at an asset or portfolio of assets, amid all the knowns and unknowns. Steps can and should be taken in advance to help protect pipelines based on insights gained from empirical evidence.
When left undetected, an issue with corrosion or other types of damage can become a critical problem, ultimately impacting a pipeline’s integrity and increasing the risk of failure. Of course, ageing pipelines become more susceptible to material degradation, wear and tear, and reduced operational efficiency.
Both timing and condition contribute heavily to the potential for undesirable events or outcomes. Furthermore, a lack of contemporary safety features and monitoring systems on older pipelines can equate to greater risk susceptibility, especially when considering the negative consequences associated with leaks, ruptures, or other incidents.
Solutions, such as Emerson’s RiskFrameTM software, provide engineers with a tool to integrate all available data into a single reference, where complex analysis and evaluation of these threats can be performed. Risk assessment systems provide a unique view of pipeline data. Because these tools are designed to integrate data about the pipeline with external data, such as environmental and populations, engineers can create models that evaluate real-world conditions and threats to the pipeline.

The results from risk analysis allow operators to make risk-based decisions regarding inspections, repairs, and threat mitigation. This capability will improve the safety and reliability of a pipeline.
Spatial risk and GIS
GIS and spatial data play an important role in developing risk models. Operators can gather a significant amount of information about their risk based solely on where their pipeline is located. Datasets such as seismic areas, soil conditions, hydrologic features, and population/structures should always be included when building the risk model. Spatial risk assessment in the context of pipeline operations involves the use of advanced software to integrate data from across the enterprise into a customisable risk-modelling environment. This type of cutting-edge risk modelling offers unparalleled flexibility in building and running spatial risk models.
The right technology partner helps ensure as few gaps as possible in the process. The optimal solution empowers operators to accurately quantify risk, prioritise actions, and develop robust mitigation plans. It allows users to create complex risk algorithms and generate risk scores for any location on the pipeline. The solution supports industry-standard data models and incorporates spatial processing tools to translate spatial features into locations on the pipeline, streamlining data management and integration.
Flexible scenario analysis enables users to model the impact of proposed changes in source data without committing actual changes, helping identify optimal remediation activities. Versatile
 Figure 1. Users create robust risk datasets by combining defined enterprise tabular and spatial data sets with existing data in Emerson’s RiskFrame software.
50 World Pipelines / JUNE 2023
Figure 2. High risk assets are quickly identified in Emerson’s RiskFrame software, enabling pipeline operators to maintain distribution system integrity.
reporting options facilitate data extraction, review, and sharing for mapping and online analysis.
This comprehensive approach provides valuable insights for pipeline operators to ensure the safety and integrity of their infrastructure.
Fit-for-purpose software enables users to comprehensively integrate pipeline data and GIS/spatial data. This level of integration allows for an overall highly effective risk model and assessment.
With scenario analysis and results mapping software, users can model ‘What-ifs’ – evaluating the impact of potential changes in source data, without editing the model or committing actual changes. Advanced software incorporates and builds on industryleading GIS mapping software components manufactured by Esri. For example, RiskFrame software is an Esri Gold Partner, supporting industry standard pipeline data models, including PODS and UPDM.
Users create sophisticated, modular models to identify threats and assess pipelines, utilising design, operations, maintenance, and assessment records or spatial data layers stored in your enterprise database.
Quantifying risk
Risk assessments generate a lot of information for a pipeline operator. The results are often very narrow segments of data along the pipeline, with all relevant attributes consumed by the model and any output risk scores.
Each of these segments could include attributes about the pipe design, operational data, or GIS/spatial data that has been dynamically segmented onto the pipeline. The segments would also include the results of the model itself, but the result could also include scores for individual models, such as a quantified risk score for external corrosion or third-party damage.
The risk results provide operators with a quantified score for risk and threats; a pipeline operator may assess the likelihood of a specific threat, based on past experiences, industry benchmarks, and environmental factors. In response, an occurrence that could have triggered a negative consequence is reconciled.


Mitigation measures can reduce risk. Activities such as improved external coating, cathodic protection, or possibly replacing the pipe can be implemented. Even before the activities are performed, most risk modelling software can examine the measure’s impact on reducing risk.
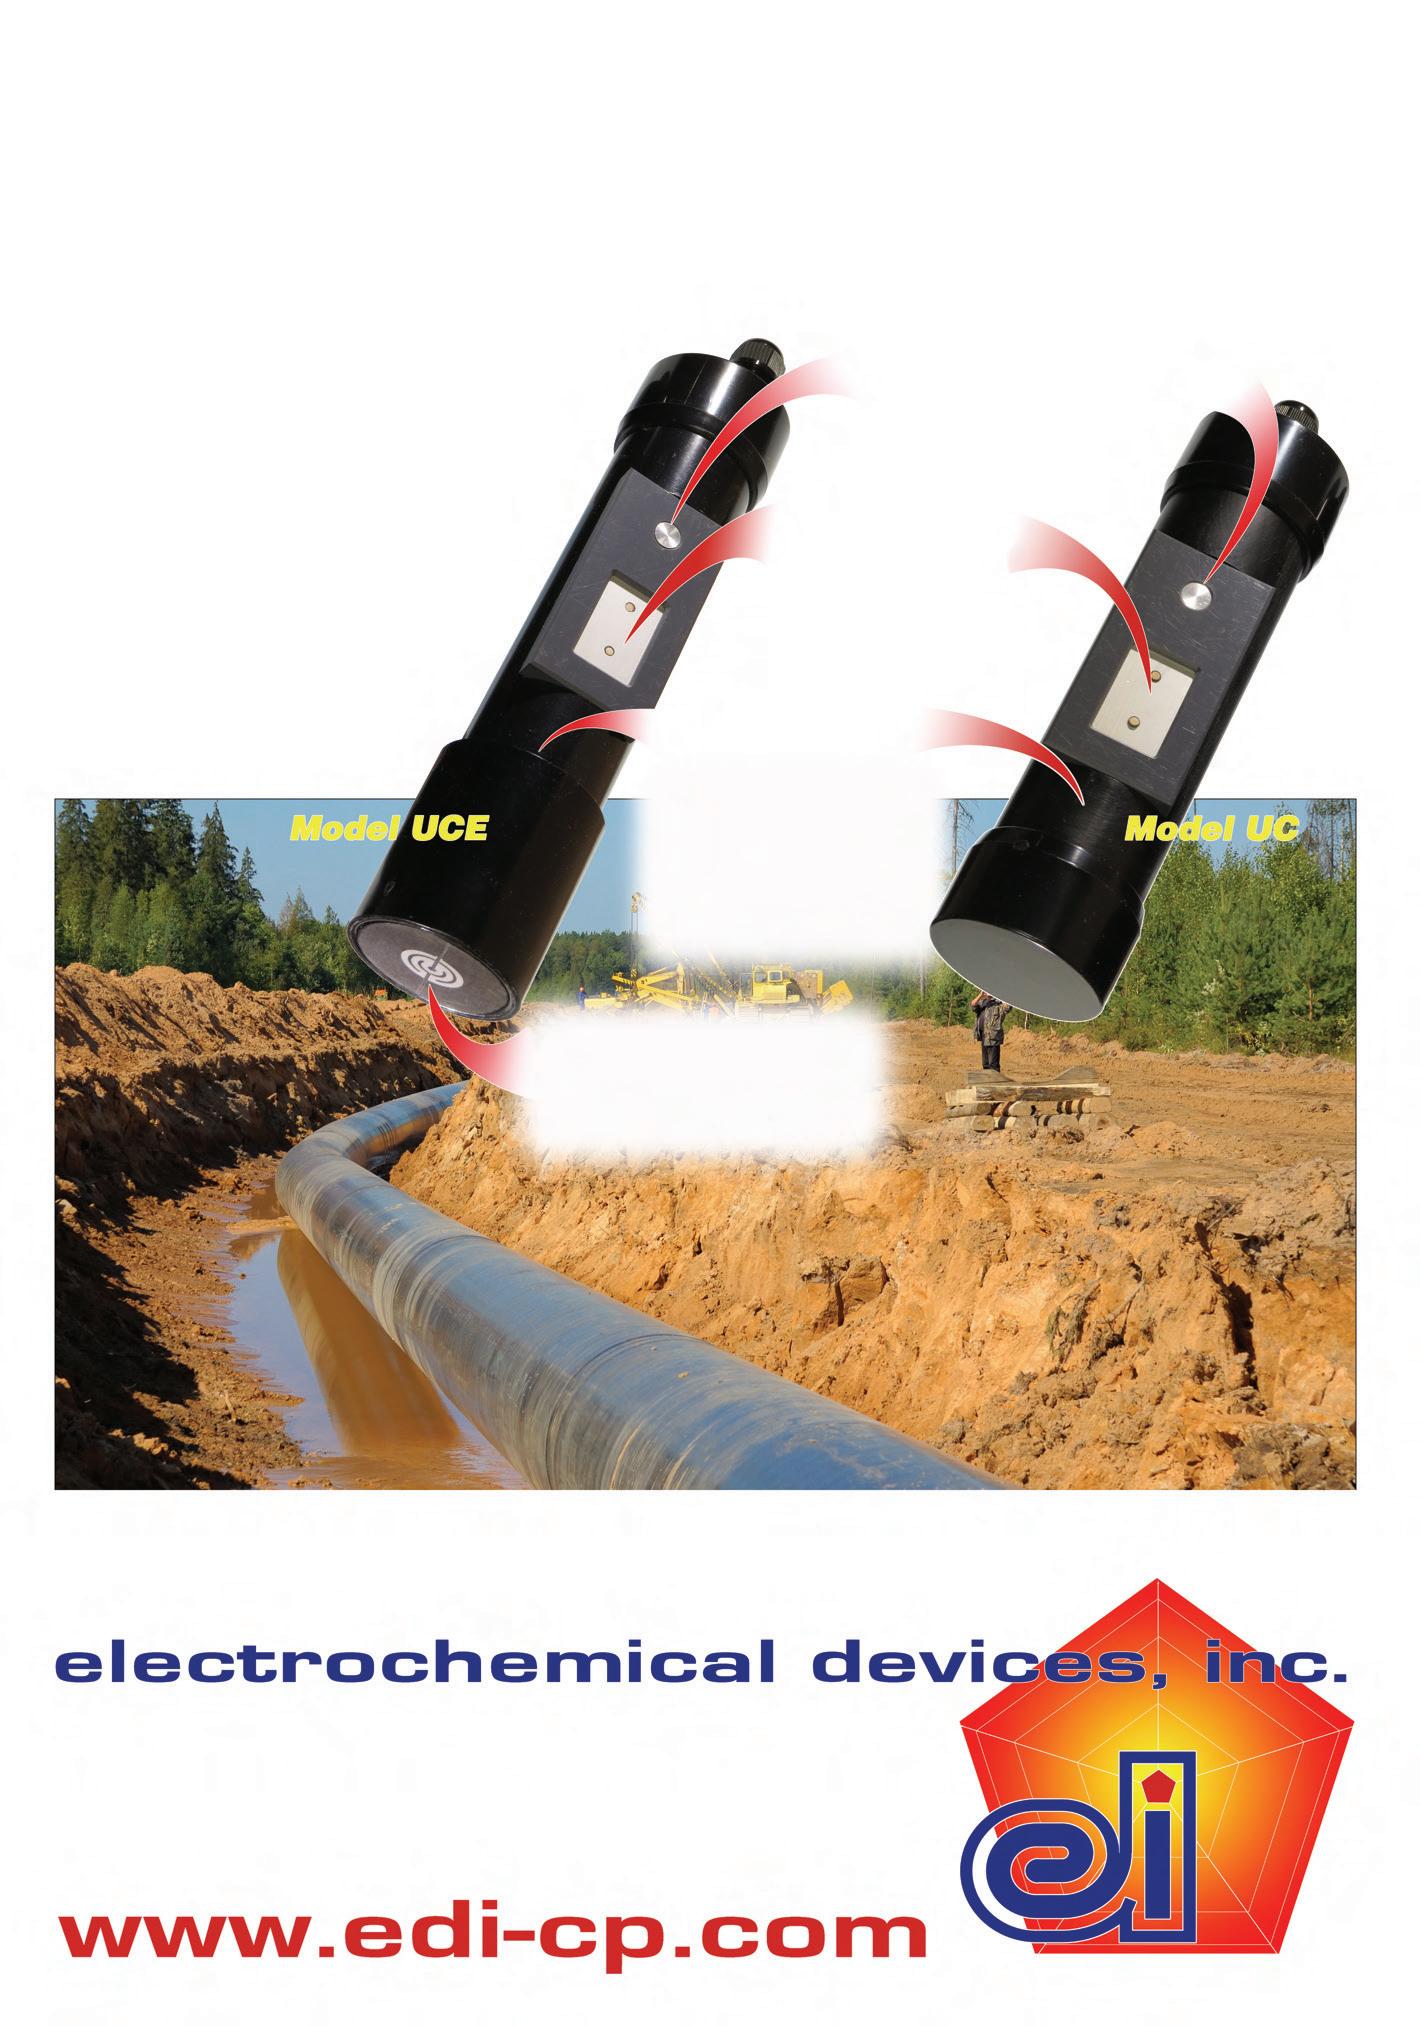
It should be noted that risk models can include historical data, trends, statistics, or other available information that could increase the likelihood of an event, and


the results of any risk analysis can become actionable items. Focus is typically given to the likelihood of negative events and what can be done to reduce risk. The same principles can be applied to consequence of risk.
Operators transporting natural gas will give more weight to the human population. By studying the population density along the pipeline right-of-way, operators can identify areas of higher risk. Mitigation measures such as increased patrols, line markers, and public awareness can be implemented to reduce risk.
Operators transporting liquids, such as crude oil, will model environmental impacts. Including data about environmental sensitive areas and waterways, pipeline operators will determine areas of higher risk due to environmental concerns. Risk models can determine where additional shutoff valves or pipeline modernisation can reduce risk.
Regardless of the product being transported by pipeline, operators will need to give attention to the consequence of any pipeline failures. A quantitative approach can easily model consequence of failure and determine the most effective measures to reduce risk.
The oil and gas industry is responsible for miles of pipelines that sprawl across vast, remote areas and intersect densely populated urban areas. Stakeholders expect a great deal of integrity to be built in. At the beginning of 2023, anticipation in the industry had been centred on growing energy demands and an expected ramp up of pipeline construction or development activities in places such as Asia and North America.
Success in pipeline operations is often built on mitigating such risks. Achieving such objectives may require or be aided by gaining a better understanding of the potential negative consequences of not effectively managing it, or not planning for risk in light of the possibility for a failure.
It may be helpful to consider the ability of RiskFrame software to layer on data sources – in other words, aggregate insights based on any number of diverse data sources associated with an existing pipeline, a newly proposed pipeline, or pipeline segment, and its surroundings. The software stands on top of an operator’s enterprise database of defined tabular and spatial datasets. Incorporated is a spatial processing tool to translate spatial features into tables which become part of the same data library utilised throughout the organisation.
Big consequences
No actual price tag can be put on the ability to help safeguard humans and protect their wellbeing, or the cost of unintentionally polluting the environment in which they operate. The economic cost of a pipeline break or failure, however, can be enormous. When
compared to the price tag of a pipeline’s fully anticipated usable lifespan being cut short prematurely, getting out in front of the potential threats and liabilities may appear more like a natural fit. How a release will impact an area requires an accurate assessment of the risk to fully understand the consequences. While various methods can be used to assess risk, advanced risk assessment systems are recommended for more complex pipeline networks.
Consequence of failure modelling is an advanced modelling method that allows for quantification of how an asset failure will impact an area. An accurate model requires numerous data points, including gas or liquid composition, flowrate, MAOP, and the number and location of instruments such as valves along the pipeline to accurately predict the various stages of a release. This type of holistic approach leads to greater insights and improved decision-making in regards to risk mitigation.
Conclusion
To fully and accurately assess risk, companies are leveraging advanced software that offers visualisation. Real-time measurement technology combined with simulation, modelling and overall digitalisation, is allowing for creation of digital twins, an actual digital representation of a pipeline or segment. The ability to leverage evidence-based analytics and real-time decision-making into overcoming challenges associated with the would-be disparate nature of pipeline integrity and asset management scenarios have been proven.
From the way data is integrated to how threats are identified, and risks are modelled – all the way to action steps taken to get out in front of it – there are many diverse and principal factors to consider when working to identify and overcome potential points of pain, deficit or fault along a pipeline – before it breaks.
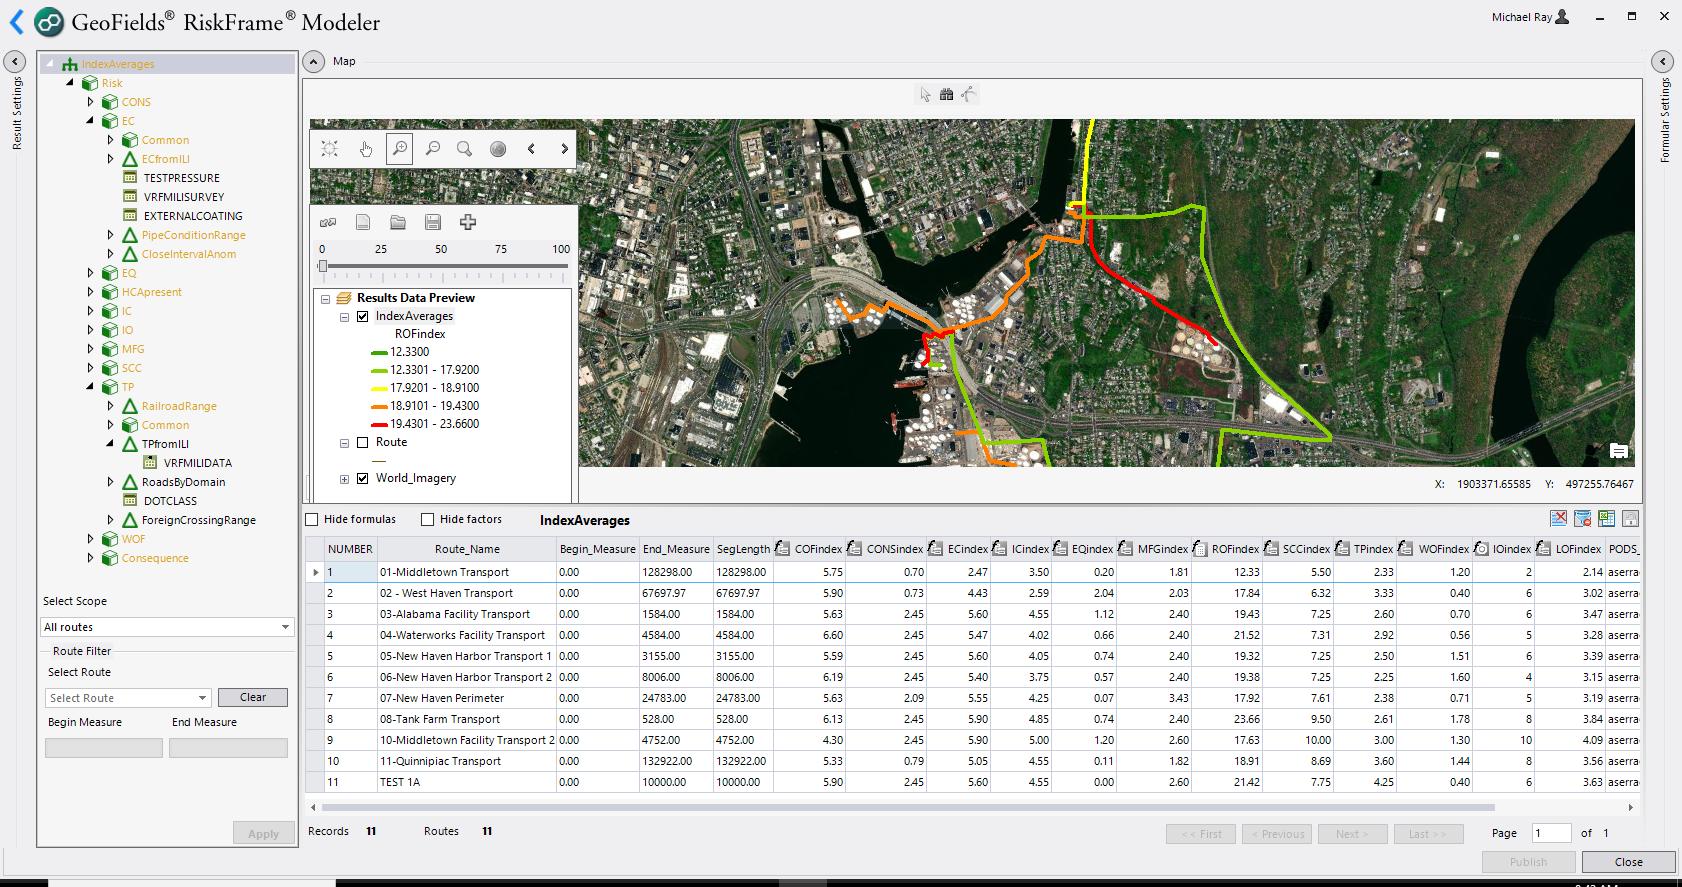
52 World Pipelines / JUNE 2023
Figure 3. Emerson’s RiskFrame software dynamically segments the pipeline based on real-time data links and evaluates each segment against user-defined verification logic.
raises it above its supporting structure, thus minimising moisture accumulation at these points of contact that


53
would otherwise promote corrosion. It also eliminates metal-tometal contact between a pipe and its support, thus preventing the formation of corrosion cells. Most importantly, it protects a pipe’s protective coating from friction and wear, a major element of protecting the pipe against corrosion. This is achieved by the following:
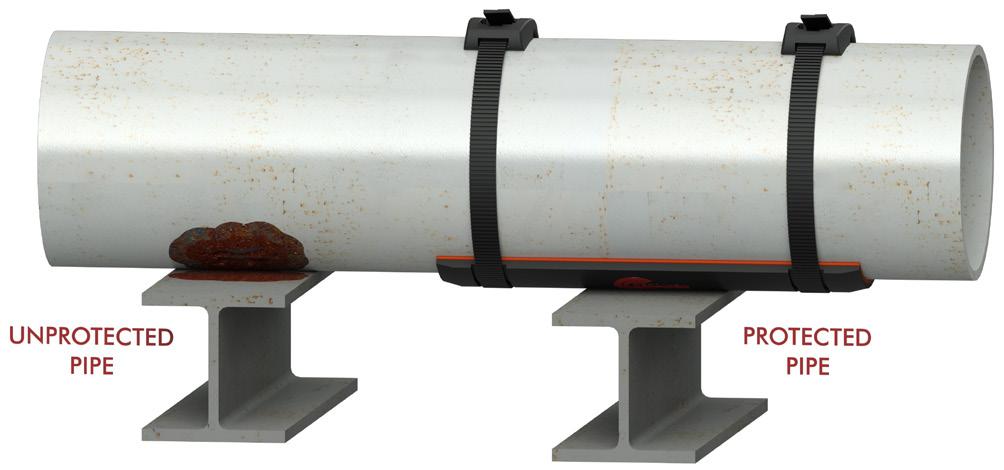
) The SmartPad’s shape cradles a pipe from beneath and protects its paint coating from erosion caused by friction between the pipe and its supporting structure.
) The pad seals and protects the contact surface of the pipe from its supporting structure.
) The pads raise the pipe above its supporting structure, thus improving ventilation.
) The SmartPad’s FRP exoskeleton prevents the formation of corrosion cells by eliminating metal-to-metal contact.
) The SmartPad System does not require epoxy or welding for installation. It uses a unique composite strapping system to allow installation, removal, and reinstallation in seconds. This, in turn, allows quick and inexpensive visual inspection for corrosion, instead of relying on more expensive inspection methods such as radiography, lasers, X-ray, etc.
Traditional FRP wear pads
The design of the RedLineIPS SmartPads resembles that of epoxy-bonded FRP wear pads. They are both made from the
same material and have the same shape that cradles pipes from beneath. Epoxied-on, or glued-on, FRP wear pads are a proven and effective solution to combat CUPS. The pads effectively separate and support the contact region of a pipe without point-loading and damaging the pipe over time. They also have no metallic components, and as such, they do not promote corrosion or require welding permits or line shutdowns. However, FRP wear pads do have a few drawbacks, especially when compared to the RedLineIPS SmartPads System, as follows:
) The pads are not a suitable solution if the pipe has already corroded, even if repaired, as it may have pits and valleys that cannot be fully filled out by the epoxy to allow proper bonding between pad and pipe.
) The installation process is laborious and can take 30 - 60 minutes, or more, depending on the experience of the installer and various environmental factors.
) The installation process requires an additional 24 hours of cure time for the epoxy to bond the pad to the pipe.
) Installation requires the epoxy to fully cover the inner surface of the pad, as well as a sealing perimeter bead around the entire pad. Therefore, this requires experienced and diligent installers, otherwise installation failures can occur.
) The use of epoxy is particularly cumbersome and messy in the summer and can be almost impossible to use in extremely cold weather conditions.
) Faulty installations are possible; installer experience is critical.
) The process may require a paint touch-up afterward – an added cost.
A new FRP wear pad
Cogbill’s SmartPad System is an innovative and patent-pending solution made from components and materials that have been on the market for many years. However, these components have either been physically redesigned, or are used as is but are combined in a new way to better solve the CUPS problem, at a fraction of the overall cost of competing solutions.
In short, the SmartPad System protects piping systems from external CUPS in the following manner:
) The SmartPads themselves are all-composite FRP wear pads with special design modifications, including two recessed grooves to allow our SmartBands to sit recessed into the pad’s body. The recesses anchor the bands firmly in place while protecting them from being damaged by the pipe’s supporting structure.
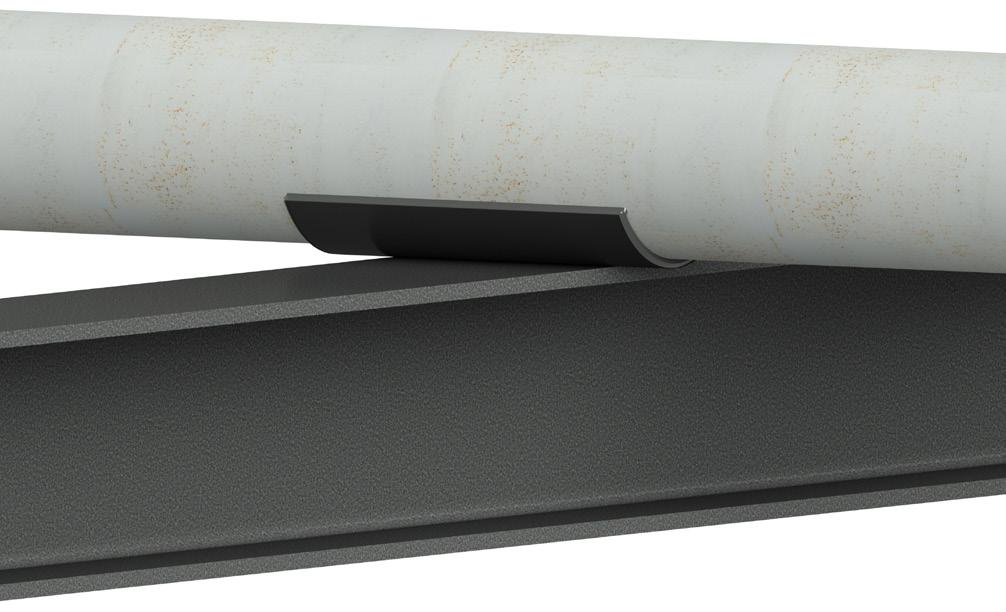
) A closed-cell Hydroseal gasket is pre-installed on the inner surface of each SmartPad. These gaskets are capable of offering NEMA 4-level watertight seal when compressed.
) The SmartPad, with its Hydroseal gasket, is placed underneath the pipe at the pipe support point, to isolate it from its supporting structure.
Figure 1. Traditional FRP pads cradle a pipe from beneath and require epoxy to be installed.
54 World Pipelines / JUNE 2023
Figure 2. Installed RedLineIPS SmartPad protects piping from external corrosion.
) The gasket, which resembles a memory foam mattress, protects new pipes as well as those that have pits and valleys due to remedied corrosion.
) Composite SmartBands are looped around each SmartPad into the recessed grooves, and composite buckles are attached to the SmartBands.
) Our SmartTool is then used to easily apply a high rate of tension to tighten the SmartBands, thus compressing the Hydroseal gasket. This, along with the pipe’s compressive load, cause the gasket to create a NEMA 4 watertight seal at the contact surface, effectively eliminating the possibility of moisture ingress between the pad and the pipe.
) Finally, the built-in clipping mechanism of the SmartTool is used to cut off excess banding.
) The installation process takes only seconds.
) The SmartPads can be removed in seconds to visually inspect the pipe for external corrosion by cutting off the SmartBands. They can then be reinstalled, again in seconds, using the original SmartPad and gasket, but new SmartBands, an inexpensive component.
Benefits
The SmartPad System is the latest of many competing solutions designed to solve the expensive problem of CUPS. While each solution has its pros and cons, the SmartPad System offers numerous advantages and benefits that no other solution offers or combines. Among such benefits are:
• Heavy-duty, all-composite material.
• Eliminates metal-to-metal contact.
• Prevents external corrosion in piping systems at the pipe support points.
• Epoxy-less and weld-less.
• Installs in seconds.
• Quick removal and reinstallation.
• 100% install success rate.
• Usable on pipes already pitted due to previously-remedied corrosion.
• NEMA 4 watertight seal between pipe and pad/gasket.
• Removable in seconds, allows visual inspections for corrosion at reduced costs.
• Reusable, making it a cost-effective and greener solution.
• A versatile solution that offers a wide range of gasket materials to

meet specific applications, including corrosive chemicals resistant options.
• Dampens vibration and noise.
• Installs on live lines.
• No welding permits or line shutdown required.
• -60°F to 400°F (-51°C to 204°C) operating temperature.
In operation in corrosive environments
The RedLineIPS SmartPad System has been in service since 2018 in facilities at or near the Gulf of Mexico. Currently, a few major customers are deploying the system in pilot programmes, for both assessment purposes and for full adoption. Among those customers
THE MOST SOPHISTICATED DECOUPLER IN THE WORLD
FEATURING CAMOUFLAGE TECHNOLOGY
Building on Dairyland’s proven history of industry-leading product lines, the PCRX® represents the next technological leap forward in decoupling technology. Using a sophisticated design, the PCRX’s new camouflage technology renders it virtually invisible to interrupted survey testing making it easier than ever to protect and maintain your CP system.
Scan to watch our on-demand webinar, Overcoming capacitive effects on interrupted surveys with PCRX technology

are Chevron, Formosa, and Nutrien, all located near the Gulf of Mexico or at offshore platforms.
Notably, a chemical plant at the Texas Gulf Coast, in immediate proximity to the Lavaca Bay, was faced with ageing and damaged pipelines due to exposure to humidity, caustic chemicals, and salty air. Numerous sections of the pipelines in the older units were installed directly on the supporting steel structures without any buffer material in-between to protect them from corrosion.
In this setting, the pipes’ protective paint coating, at the points of contact with the support steel structures, had eroded over time due to friction. Friction was caused by the pipes’ movement due to seasonal and daily temperature changes, as well as their connections to rotating equipment such as pumps and compressors. As such,
and as the pipes moved back and forth, and up and down, over the supporting steel, the paint coating was rubbed off until bare steel was exposed. The bare steel was left unprotected and exposed to the elements.
Over time, and in the areas of the pipes that are in contact with the supports, corrosion cells had grown to a point of great concern. Third-party inspections were performed to assess risk, and the plant was forced to perform serious maintenance to ensure the pipe walls were safe, especially those under high pressure. Steps to protect the pipes from further damage were also required. Failure to find a permanent solution would have significantly raised their insurance cost, increased the chance of premature and sudden failure of systems, and worst of all, exposed personnel to an elevated risk of injury, and possibly death.
Solution
This plant had been using epoxied-on FRP wear pads on new construction projects to help prevent CUPS. These FRP pads were bonded, using epoxy, to the pipes’ coated surface to protect them from corrosion. These pads had been effective and are commonly used for new piping systems, but major problems can arise if a pad is installed on a pitted surface, meaning a previously corroded pipe that had been remedied and repaired. For the adhesive to effectively seal such pads and prevent moisture traps, it requires an even, smooth surface. This was going to be a major challenge since the corrosion at the existing pipes had created an uneven surface that would have prohibited the epoxy from properly sealing the pad to the pipe. Grinding the surface down smoothly would require line shutdowns (due to sparks) and could further diminish the pipe’s wall, which was already thinning.
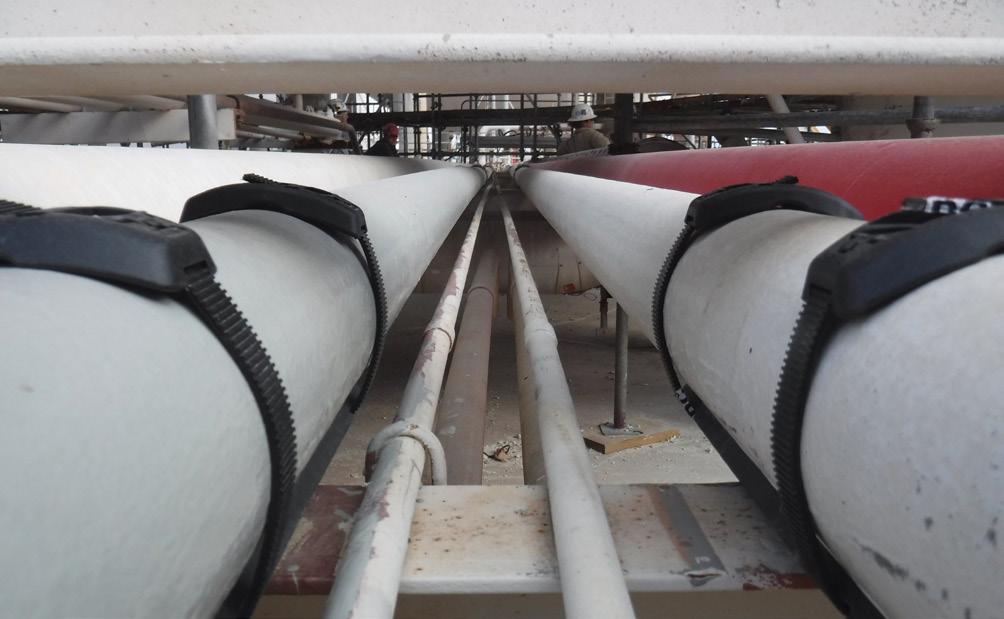
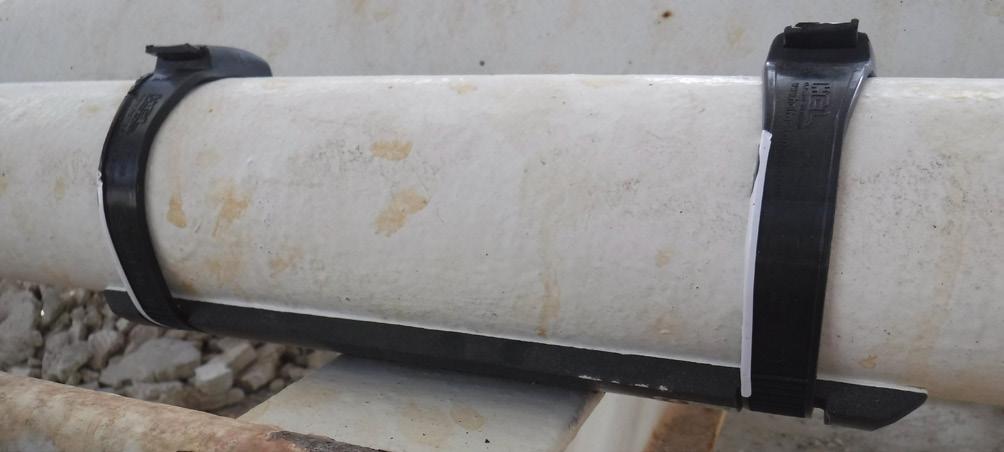
At that point, this chemical plant began to consider emerging technologies, and as such conducted a comprehensive evaluation of Cogbill’s RedLineIPS SmartPad System as a faster, easier, and safer method to mitigate their corrosion problem.

Cogbill’s SmartPad System incorporates a compressible gasket into its design that could conform to the uneven surface of a corroded pipe, which effectively seals any moisture or contaminants out of the damaged area. This would stop corrosion and prevent future damage, without the use of epoxy or welding or the need to shut the lines down to grind the pipes to a smooth surface condition.
Performance
The first set of SmartPads was installed in December 2019. The plant had planned on deploying the pads over three to four weeks since they did their planning using the typical time it takes to install glue-on FRP wear pads. Since the SmartPads are installed using a composite banding system, installation time was greatly reduced. There was also no need to wait for the epoxy to cure, so their installation crews were able to move from section to section rapidly.
Their first project using the SmartPad System was completed in one week, a quarter of the time they had anticipated. The response to the SmartPad system has been very positive, and SmartPads are now in use in two of the largest units in that plant. The SmartPads were used to protect an ageing line that was vital to multiple systems in various units. Thousands of SmartPads are now in use in that facility and are performing within their design parameters in corrosive gulf coast environments.
Figure 3. RedLineIPS SmartPad System components.
Figure 5. Standard SmartPads installed in a chemical plant in the Gulf of Mexico.
56 World Pipelines / JUNE 2023
Figure 4. Installed SmartPad with Teflon (white) strips to protect it from highly-corrosive chemicals.
Yusuke Nishi, Senior Technical Service Engineer, Belzona, Thailand, introduces an ISO/ASME compliant composite repair system for pipes.
ipelines, especially those of large diameter, can transport large volumes of liquids and gases over long distances at high efficiency. Operating over long distances through various landscapes, environments and conditions, pipelines can be subject to internal and external effects from numerous factors. Changes in temperature cause the pipe material to expand and contract, while differences in height cause internal pressure fluctuations. From these behaviours, pipelines are subjected to physical loads such as bending, shear, torsion and fatigue. At the same time, the pipe walls can be exposed to internal corrosion and chemical attack, depending on the chemical solutions involved in the media. Similarly,
under conditions of inadequate protection, pipes are also subject to external corrosion.


These effects, acting alone or in combination, can cause damage to the pipe wall in the form of metal loss and eventually lead to through-wall defects, leading to leakage problems. Leaks can result in disastrous consequences such as shutdowns and environmental impact. For this reason, facility owners and operators must take proactive precautions to guard against such damage before the worst occurs.
Composite repair
Belzona SuperWrap II is a pipe repair technology based on a polymer-based composite of epoxy resin and reinforcing fibres, using a wet-wrapping technique in which the resin-impregnated reinforcing fibres are wrapped directly around the pipe defect and cured.
Composite materials for the repair of wall thinning and leakage defects in pipes are reliant on two material properties: mechanical strength and stiffness. Mechanical strength depends on the maximum tensile stress that a
57
material can withstand without failure and is determined from its tensile strength. Stiffness, on the other hand, refers to the elastic deformation of a material when a force is applied and is defined by the Young’s modulus (also known as tensile modulus or modulus of elasticity). The mechanical strength and stiffness of polymeric composites depend largely on the properties of the reinforcing fibre. The resin is responsible for transferring the load between the reinforcing fibres. The resin must be integrated with the pipe substrate, making the material’s adhesive strength key to the success of a composite repair.
Several combinations of resins and reinforcing fibres were considered in the development of Belzona SuperWrap II. A two-component epoxy resin with 100% solids content, consisting of a phenolic novolac base (main agent) and an amine solidifier, was ultimately chosen. This was primarily due to the fact that epoxy resins can achieve better adhesion and mechanical strength compared to other functional polymer groups, including polyurethanes, methacrylates, alkyds, vinyls and polyesters. The
Belzona 1981 resin
Belzona 1982 resin
possibility of forming highly cross-linked polymer matrices, which are the basis for excellent heat and chemical resistance, should also be supplemented as one of the reasons for concluding that phenolic novolac epoxy resins are the best choice.
Epoxy resins are usually slow to cure at low temperatures, but the reaction is activated and the resin cures in a shorter time when heat is applied. Considering the temperature conditions at the time of application, which tend to be affected by climatic differences, two types of resin were initially developed (Belzona 1981 and Belzona 1982 resins), followed by Belzona 1983 resin with improved heat resistance (see Table 1). Today, a third type of resin has now been developed, allowing the user to select the most suitable material depending on the temperature conditions.
Belzona 1983 resin
The key considerations in choosing the most suitable reinforcing fibre material were the material’s mechanical strength and stiffness, as well as its workability (cutting, resin impregnation, onsite handling, etc). After analysing the benefits and drawbacks of each material, a combination of carbon fibre and glass fibre was chosen as a hybrid fibre, which is produced as Belzona 9381 to be an optimised reinforcement fibre sheet for Belzona SuperWrap II. Belzona 9381 reinforcing sheet has a two-layer construction, with carbon fibre on the front and glass fibre on the back, to maximise the benefits of both fibres, and to achieve the most efficient distribution and arrangement in terms of physical properties and workability. The glass fibre and epoxy resin layer are designed to act as an insulator to prevent corrosion currents from flowing through the conductive carbon fibre. The reinforcing fibre sheets are available in several different widths to accommodate different pipe diameters, with wider sheets being particularly useful for special geometries such as bends, tees, flanges, reducers, as well as the walls and roofs of large storage tanks.
Test items Details
Tensile properties Tensile strength, tensile modulus, Poisson’s ratio, strain to failure
Structural integrity Wrapped pipe with defect to survive short term pressure test
Energy release rate Toughness parameter for the repair/substrate interface
Long - term strength
Long-term (creep rupture) strength of the repair
Impact performance Low velocity 5 J impact performance
Thermal properties
Coefficient of thermal expansion
Glass transition temperature
In-plane shear modulus Shear modulus by V-Notched beam method
Lap shear adhesion strength
< Short-term condition > Shear adhesion strength of resin bonded to substrate
< Long-term condition > Measurement of lap shear adhesion strength after 1000 hours of exposure to immersion
Test methods
I SO 24817Annex B ASTM D3039
ISO 24817Annex C
ISO 24817Annex D
ISO 24817 -
Annex E
ISO 24817Annex F
ISO 11359
ISO 11357-2
ASTM D5379
EN 1465
EN 1465
After the resin-impregnated reinforcing fibres have been wrapped around the pipe, they are held in place while the resin is allowed to cure by a special consolidating film called Belzona 9382. Once the resin has cured, the film can be easily removed.
Compliance with standards
A high degree of reliability is needed for composite pipe repairs, especially for pipes carrying hazardous media or in the case of high-pressure piping systems. For this reason, rigorous third-party and in-house testing is carried out to demonstrate compliance with a series of requirements set out in ISO 24817 and ASME PCC-2.1,2 Plate specimens made of reinforcing fibre and each resin were used for tests aimed at assessing the mechanical properties of the materials. Meanwhile, a short pipe spool with pseudodefects of the specified dimensions was repaired with the system in the pressure resistance test aimed at evaluating durability of the system, followed by a pressure resistance test for confirmation. A summary of each test is given in Table 2.
Test results and verification
Table 3 shows some results of the physical property tests. In parentheses are the curing temperatures of the specimens. In the tensile shear bond strength test, the bond strength of the resins is measured in two ways, both using carbon steel as the adherent:
) 1) Cured for seven days at specified temperature conditions (short-term condition).
Table 2. Test items and test methods
Table 1 . Usable temperature ranges for each resin
Application temperature 5 ˜ 20˚C 20 ˜ 40˚C 5 ˜ 40˚C Max service t emperature 60˚C 80˚C 150˚C 58 World Pipelines / JUNE 2023
) 2) Immersion in water for 1000 hours at specified temperature conditions (long-term condition).
The effect of temperature changes to the resins’ adhesive strength can be seen by comparing the results of the low and high temperature tests. All the results comply with the requirements of ISO 24817 in two respects:
) 1) The tensile shear bond strength of each resin is >5 MPa for short and long-term conditions.
) 2) For each resin, the long-term values are at least 30% of the short-term values.
The temperature at which a polymer material begins to soften as it is heated is known as the glass transition temperature (TT). It is a common phenomenon for thermoplastics and its value is often referred to in assessing the thermal properties and thermal resistance of resin-based repair techniques. When the resin is heated while it is curing, the density of the cross-linking increases and the glass TT rises. When Belzona 1981 resin is cured at 60 °C, Belzona 1982 resin at 80˚C and Belzona 1983 resin at 150˚C, the glass TTs are 90˚C, 115˚C and 188˚C respectively (as shown in Table 3).
Piping systems under pressure are subject to the Poisson effect. Due to the circumferential stresses occurring inside the pipe, the diameter of the pipe increases slightly, but at the same time there is a contraction in the axial direction and the pipe becomes shorter. Therefore, a suitable material to restore the mechanical strength of a pipeline must possess a Poisson’s ratio close to the value of the pipe. The Poisson’s ratio of the Belzona SuperWrap II material is close enough to that of steel. This means that when a typical steel pipe is subjected to compressive or tensile loads, the accompanying SuperWrap II repair reacts similarly to the base metal.
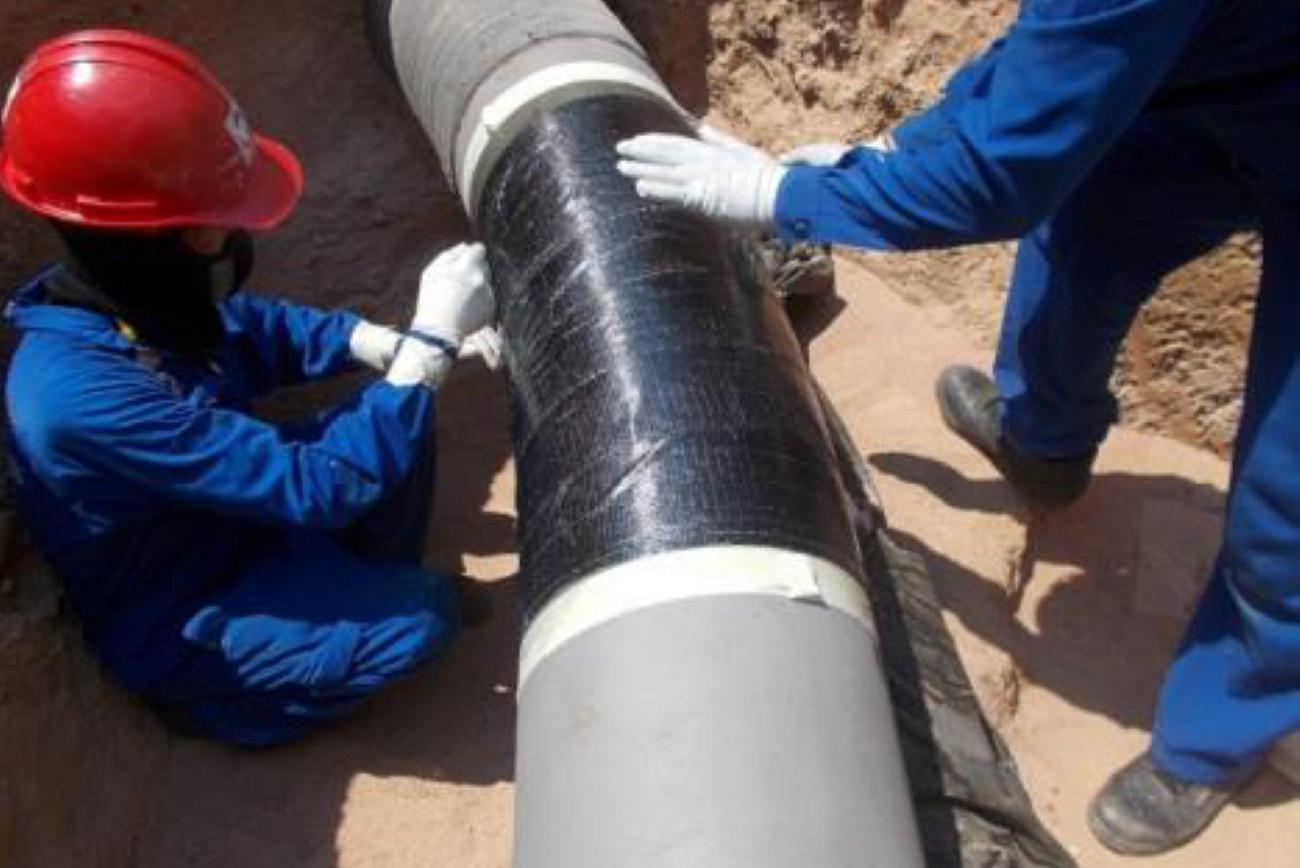
Young’s modulus (tensile modulus) is a measure of the stiffness of a material, and the SuperWrap II materials have high Young’s modulus of 37 - 39 GPa, meaning that the repair will have good stiffness and bending movement. From a practical point of view, the values of SuperWrap II materials are well above the desired 6895 MPa standard modulus, when assessing the performance of a composite pipe repair.3 On the other hand, considering that the Young’s modulus of ordinary steel is about 200 GPa, SuperWrap II materials, which have about one-fifth, are far more elastic than steel, and in this sense, it can be said that SuperWrap II repair has excellent elasticity and can easily follow the movement of the base metal.
The thermal expansion coefficient of a solid material indicates the extent to which its length and volume change when subjected to a change in temperature under constant pressure conditions. Piping generally undergoes repeated expansion and contraction as a result of temperature changes when operating in varied service conditions. Therefore, composite materials used to restore the mechanical strength of pipe materials must also be able to cope with thermal strain. The linear expansion coefficient of Belzona SuperWrap II materials cured at ambient temperatures are between 9.40 and 11.26 x 10⁻⁶ /K, which is close to that of ordinary steel (11- 12.5 x 10⁻⁶ /K).4 This means that the stress effect (thermal strain) on the adhered surface caused by the difference in thermal expansion between the composite materials and the base metal is minimal. Table 4 shows the conditions for durability testing of the SuperWrap II composite materials.
The short-term pressure test evaluates the performance of Belzona SuperWrap II against wall thinning defects (no penetration). The test is carried out on a short carbon steel spool with a pseudo-defect (wall loss) of a specified size, with the objective
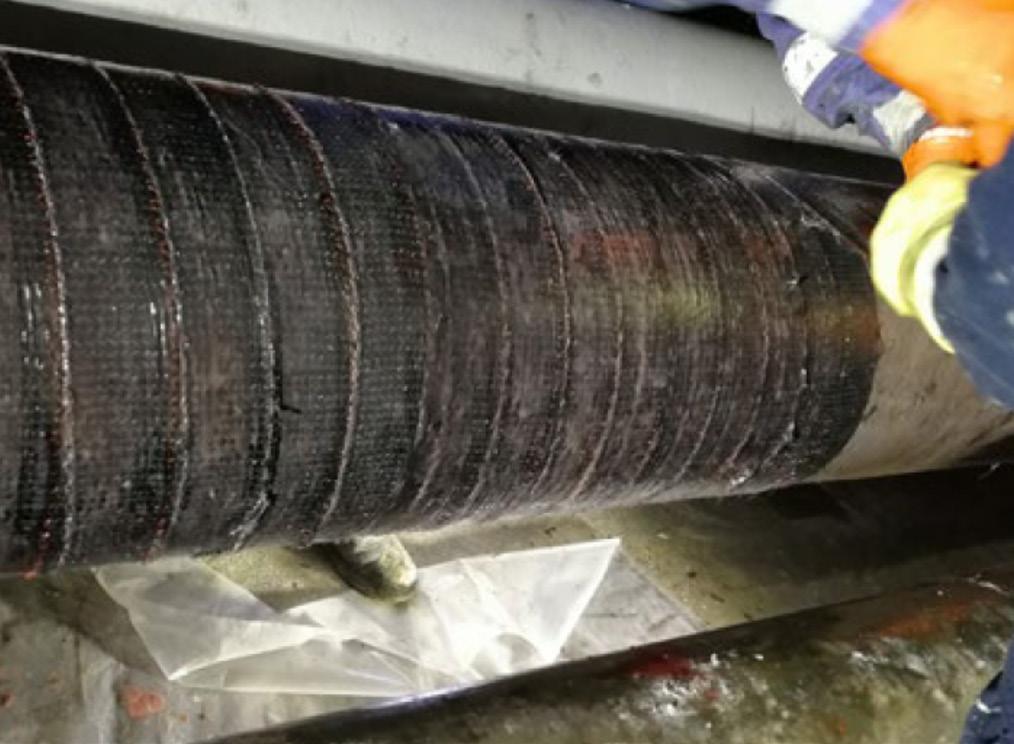
Table
Test items Belzona 1981 resin Belzona 1982 resin Belzona 1983 resin Short-term lap shear strength 15.5 MPa (20˚C) 15.0 MPa (80˚C) 11.2 MPa (150˚C) Long-term lap shear strength 15.5 MPa (40˚C) 19.0 MPa (40˚C) 10.3 MPa (150˚C) Glass transition temperature 90˚C (60˚C) 115˚C (80˚C) 188˚C (150˚C) Young’s modulus 38.8 GPa (20˚C) 38.6 GPa (20˚C) 36.9 GPa (150˚C) Thermal expansion coefficient 9.44 x 10⁻⁶ /K 11.26 x 10⁻⁶ /K 9.40 x 10⁻⁶ /K (20˚C) 5.19 x 10⁻⁶ /K (150˚C)
3. Composite properties assessment results
Figure 2. In-field application of Belzona SuperWrap II on a corroded pipeline.
JUNE 2023 / World Pipelines 59
Figure 1. After rebuilding the pipe to original profile using Belzona 1111, several wraps of Belzona 9381 were applied.
of determining the maximum level of wall thinning that can be repaired. The repair is designed to restore the yield strength of the original pipe wall. The test pressure was calculated as the yield pressure of the test spool in its original sound condition (test pressures indicated in Table 4). The difference in test pressure between the Belzona 1981/1982 resins and Belzona 1983 resin is due to the different test spools used. All the resins passed the test and the results demonstrate that the repair conforms to the design specification and is able to restore the durability of the pipe material.
The long-term pressure test also evaluates the performance of Belzona SuperWrap II against thin-wall defects, assessing the durability of the repair after 1000 hours of sustained loading by maintaining the pipe internal pressure at a constant level (test pressures indicated in Table 4). The test was deemed a pass, with no cracks, delamination or any other degradation observed.
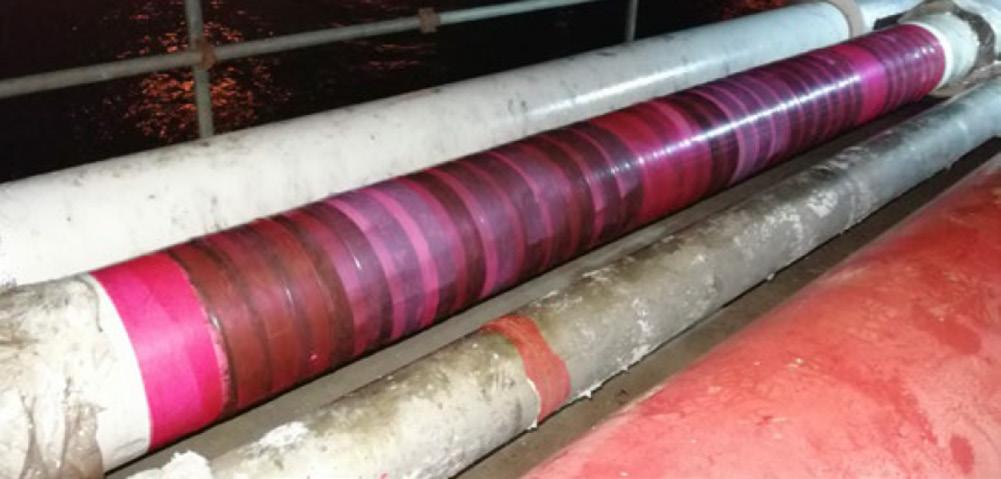
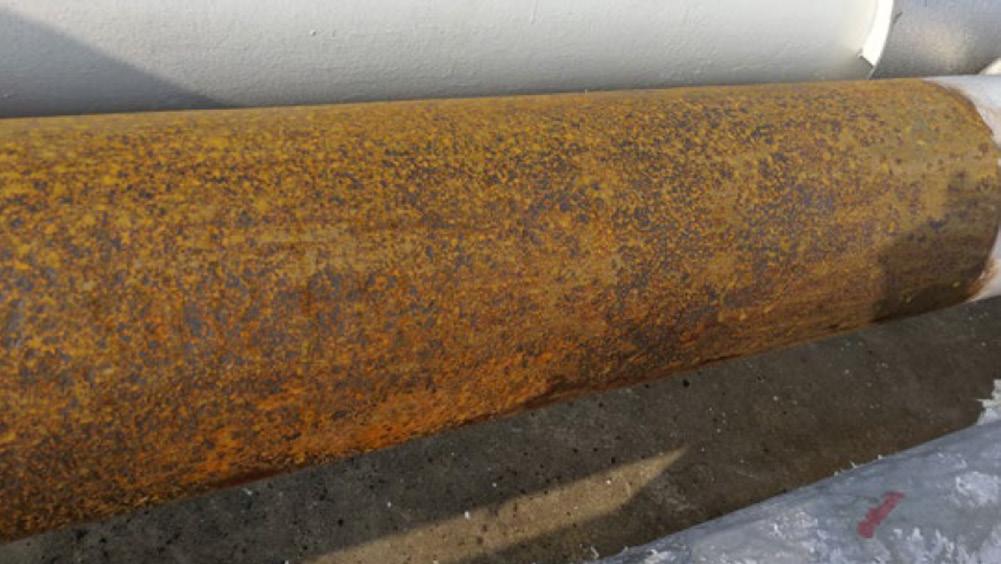
The impact endurance test examines the effect on the repair of a low velocity 5 J impact, simulating a tool drop such as a spanner being dropped on the repair. The objective of this test
is to determine the minimum thickness of the repair layer where external impact is concerned. In accordance with ISO 24817 Annex F, an impact of 5 J was applied to the pipe repair by dropping a weight from a height of 1 m, followed by a pressure test. No difference was found between the measured and calculated energy release rates, and it was concluded that this level of impact did not affect the integrity of the SuperWrap II repair system.
Requirements for application
Factors such as surface preparation method, pipe geometry, environmental conditions, operational/design pressures, etc are considered by strength calculations based on actual defective conditions of pipes in accordance with the ISO/ASME standards, which determine the repair design of Belzona SuperWrap II. The repair is then carried out following the design, but there are certain conditions that must be adhered to during the application.
Firstly, all Belzona SuperWrap II installers are required to attend and pass a validated training course to ensure a high quality of work. The course includes a practical test (and theory exam), in which participants are asked to repair a pipe spool with a simulated defect, which must then pass a certain pressure test.
As a strict rule, a compliant repair must always be conducted by trained installers. The ISO/ASME standards defines repair classes from Class 1 to Class 3. Class 1 is for low specification duties with least critical conditions, such as pressures of <2 MPa and temperatures of <40˚C. Since this is for systems that do not relate directly to personnel safety, the repair jobs can be handled by installers alone. However, Class 2 and 3 involve more critical scenarios, for example higher pressure and temperature conditions as well as systems transporting hazardous fluids; certified supervisors who have completed a higher level of training must supervise work in these cases. Periodic annual renewal of qualifications is also compulsory for the installers and supervisors to ensure that they maintain and improve their skills after certification.
All the inspection results, including environmental measurements, surface roughness achieved by surface preparation conducted, batch numbers of products used, and resulting repair thickness, are recorded in QA/QC documents for each project. This is collected on all projects, including information on which installer/supervisor was present.
Depending on the decision made by the asset owner, Belzona SuperWrap II repairs can be revalidated or decommissioned upon reaching its design lifetime. Belzona SuperWrap II repair solution is available worldwide through the network of Belzona International Distributors, and the applications can be carried out by trained and validated personnel from third parties as long as they fulfil the prerequisites. By allowing the asset owner to choose who would carry out the design and also who would apply the wraps onsite (as long as those parties are qualified as per the standard), the operator has the flexibility to appoint the contractors best suited, depending on the specific requirements of a project.
Test items Belzona 1981 resin Belzona 1982 resin Belzona 1983 resin Short-term survival 39.2 MPa 39.2 MPa 28.4 MPa Long-term survival 60.0 MPa 60.0 MPa 36.0 MPa Impact 5 J 5 J 5 J
Table 4. Testing conditions for composite performance
24817:2017, ‘Petroleum,
–
–
References 1. ISO
Petrochemical and Natural Gas Industries
Composite Repairs for Pipework
Qualification and Design, Installation, testing and Inspection’. 2. ASME PCC-2:2018, ‘Repair of Pressure Equipment and Piping’.
3. ALEXANDER, C., FRANCINI, B., ‘State of the Art Assessment of Composite Systems Used to Repair Transmission Pipelines’, ProceedingofIPC(2006).
4. www.engineeringtoolbox.com
Figure 3. Damaged pipeline after suffering from corrosion under insulation (CUI).
60 World Pipelines / JUNE 2023
Figure 4. The pipe repair before the removal of the release film.
nsuring safety and reliability of subsea pipelines is a top priority for all subsea asset owners. An effective integrity management plan encompasses simulation, analysis, inspection, testing, and mitigation. The results of these inspections such as close visual inspection, cathodic protection (CP) surveys, wall thickness surveys, and crack detection surveys are then fed back into the analysis to determine the performance of the pipelines or flowline system and the probability of failure – ensuring safe operation now and into the future.
Subsea pipelines have typically relied on intrusive inspection technologies for wall thickness inspections. The advantage of inline inspection (ILI) being the vast amount of data that can be collected over the full length of the pipeline system. However, the application of ILI technology is not always feasible in some systems, or it represents a significant challenge in terms of production deferment and HSSE risk. These unpiggable pipelines present a major gap in inspection data that can impair proper integrity management and safe operation, presenting a risk for operators of these unpiggable assets. External inspection technologies are a logical answer to the inspection gap for unpiggable subsea pipelines. Developing these technologies is a very difficult task due to the extreme pressures, various pipeline coatings, thick insulation systems, position of the pipelines and the need to perform the inspection remotely utilising an ROV system. Existing technology can come

61
Pedro Rincon, Nathan Oliveira, Peter van de Camp, Mark Mateer, and Sean Legg, Shell, and Paul Chittenden, TSC Subsea, discuss advanced high-resolution wall thickness for coated unpiggable subsea pipelines.
at a high cost, HSSE risk (if utilising a radioactive source), have difficulty inspecting through thick subsea coatings, and provide limited data. These challenges represented a significant need to develop an effective inspection technology that is fast, accurate, and able to scan through thick subsea coatings to allow for the collection of more data while lowering or staying within the same inspection budgets.
In 2017, Halfwave (now part of TSC Subsea) worked in partnership with a technology development consortium including Shell Technology Ventures on an ultrasonic-based inspection method that utilised acoustic resonance instead of conventional time of flight. The acoustic resonance technology (ART) proved to be an extremely reliable and accurate way to measure and map wall thickness of flowlines and risers, and did not appear to be restricted to the type of material.
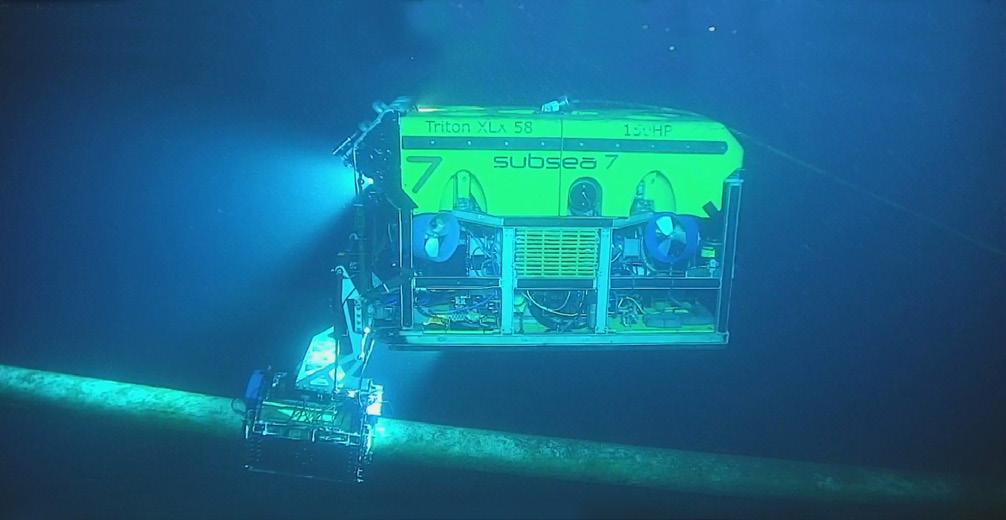
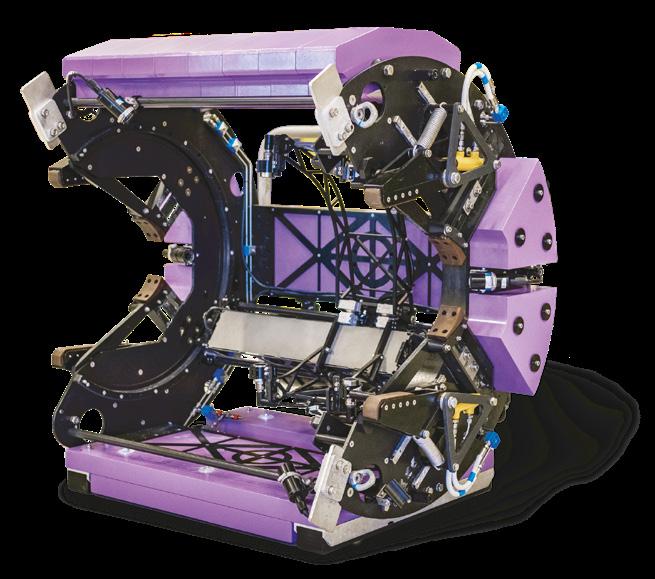
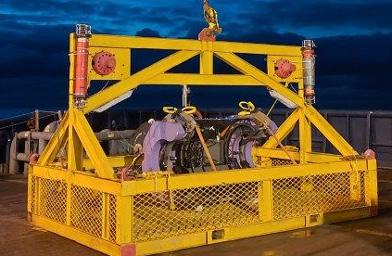
As the development of the ART technology progressed, the sensors were packaged into a deployment tool, named ARTEMIS® (acoustic resonance technology external measurement inspection system). The tool was designed with two important considerations in mind. The design of the deployment method would limit the amount of time per inspection while maximising the amount of data collected per inspection location. Inspection speed was maximised by both enhancing the speed of inspection and limiting the amount of dredging needed for the tool to access the pipe, a timely and costly operation. Secondly, the sensor carriage is able to collect a length of 700 mm x 360˚ at resolutions ranging from 1 mm x 1 mm to 5 mm x 5 mm.
ARTEMIS proved its value in obtaining high accuracy wall thickness in early field trials and was beginning to show significant cost savings in inspection and vessel time. However, the technology was not yet feasible for heavy insulated pipes. Shell challenged the ART technology with an accelerated inspection programme for high attenuative coatings such as IMPU, IMPP, GSPU, and Novolastic. These insulations and coatings used in deepwater range from a few millimetres to up to 100 mm (4 in.). The qualification and feasibility for inspection on pipes insulated with Novolastic were achieved with several controlled lab tests carried out in Norway that included a pressurised chamber.
The success of this lab testing led to the first field trial for Novolastic coated jumpers in Brazil while lab testing continued for the remaining high attenuative coatings. The field chosen for the field trials was the Shell operated ‘Parque das Conchas’, also known as BC-10. This ultradeep water development was undergoing pipeline integrity assessment studies at the time, a perfect candidate for the trials. The campaign was carried out using the asset dedicated support vessel, using a basket to deploy the tool and a subsea wetmating system to connect to the ROV at depth. During the first mobilisation for the acquisition of rigid jumper data, the team was able to gain several learnings and opportunities for improvement. Further testing led to hardware modifications, including improved sensors, which provided enough information to demonstrate the technology’s suitability for flowline and jumper insulation systems. After completing the qualification and defining the application window of the
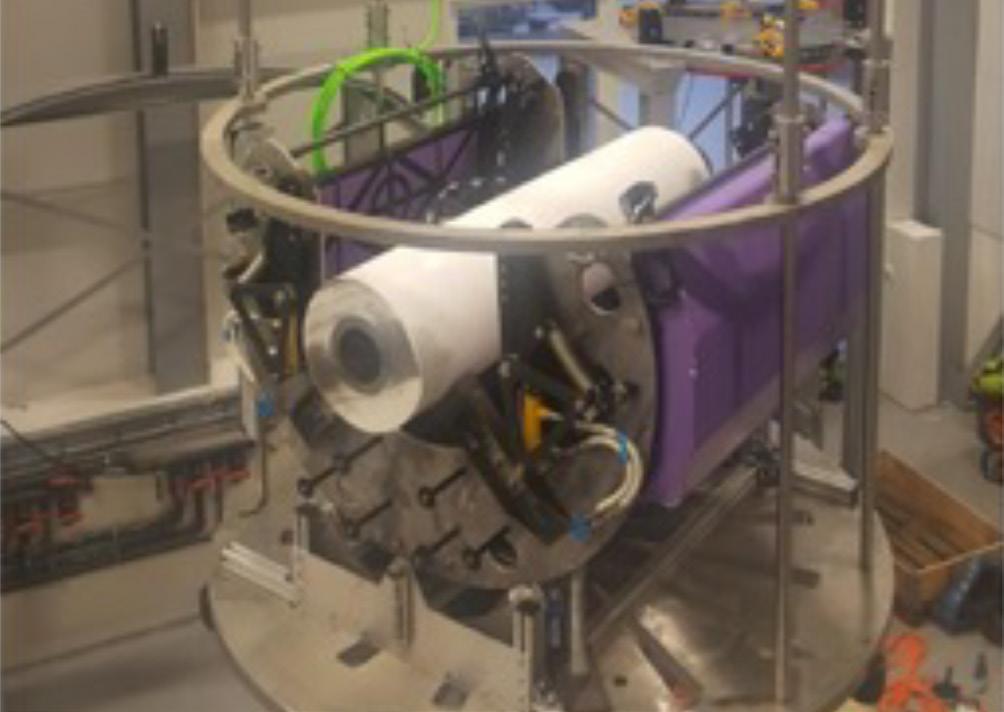 Figure 3. ARTEMIS ready for deployment.
Figure 4. ARTEMIS subsea pipeline and riser inspection system.
Figure 2. ROV positioning the ARTEMIS.
Figure 3. ARTEMIS ready for deployment.
Figure 4. ARTEMIS subsea pipeline and riser inspection system.
Figure 2. ROV positioning the ARTEMIS.
62 World Pipelines / JUNE 2023
Figure 1. Lab testing with thick insulation, up to 100 mm (4 in.).
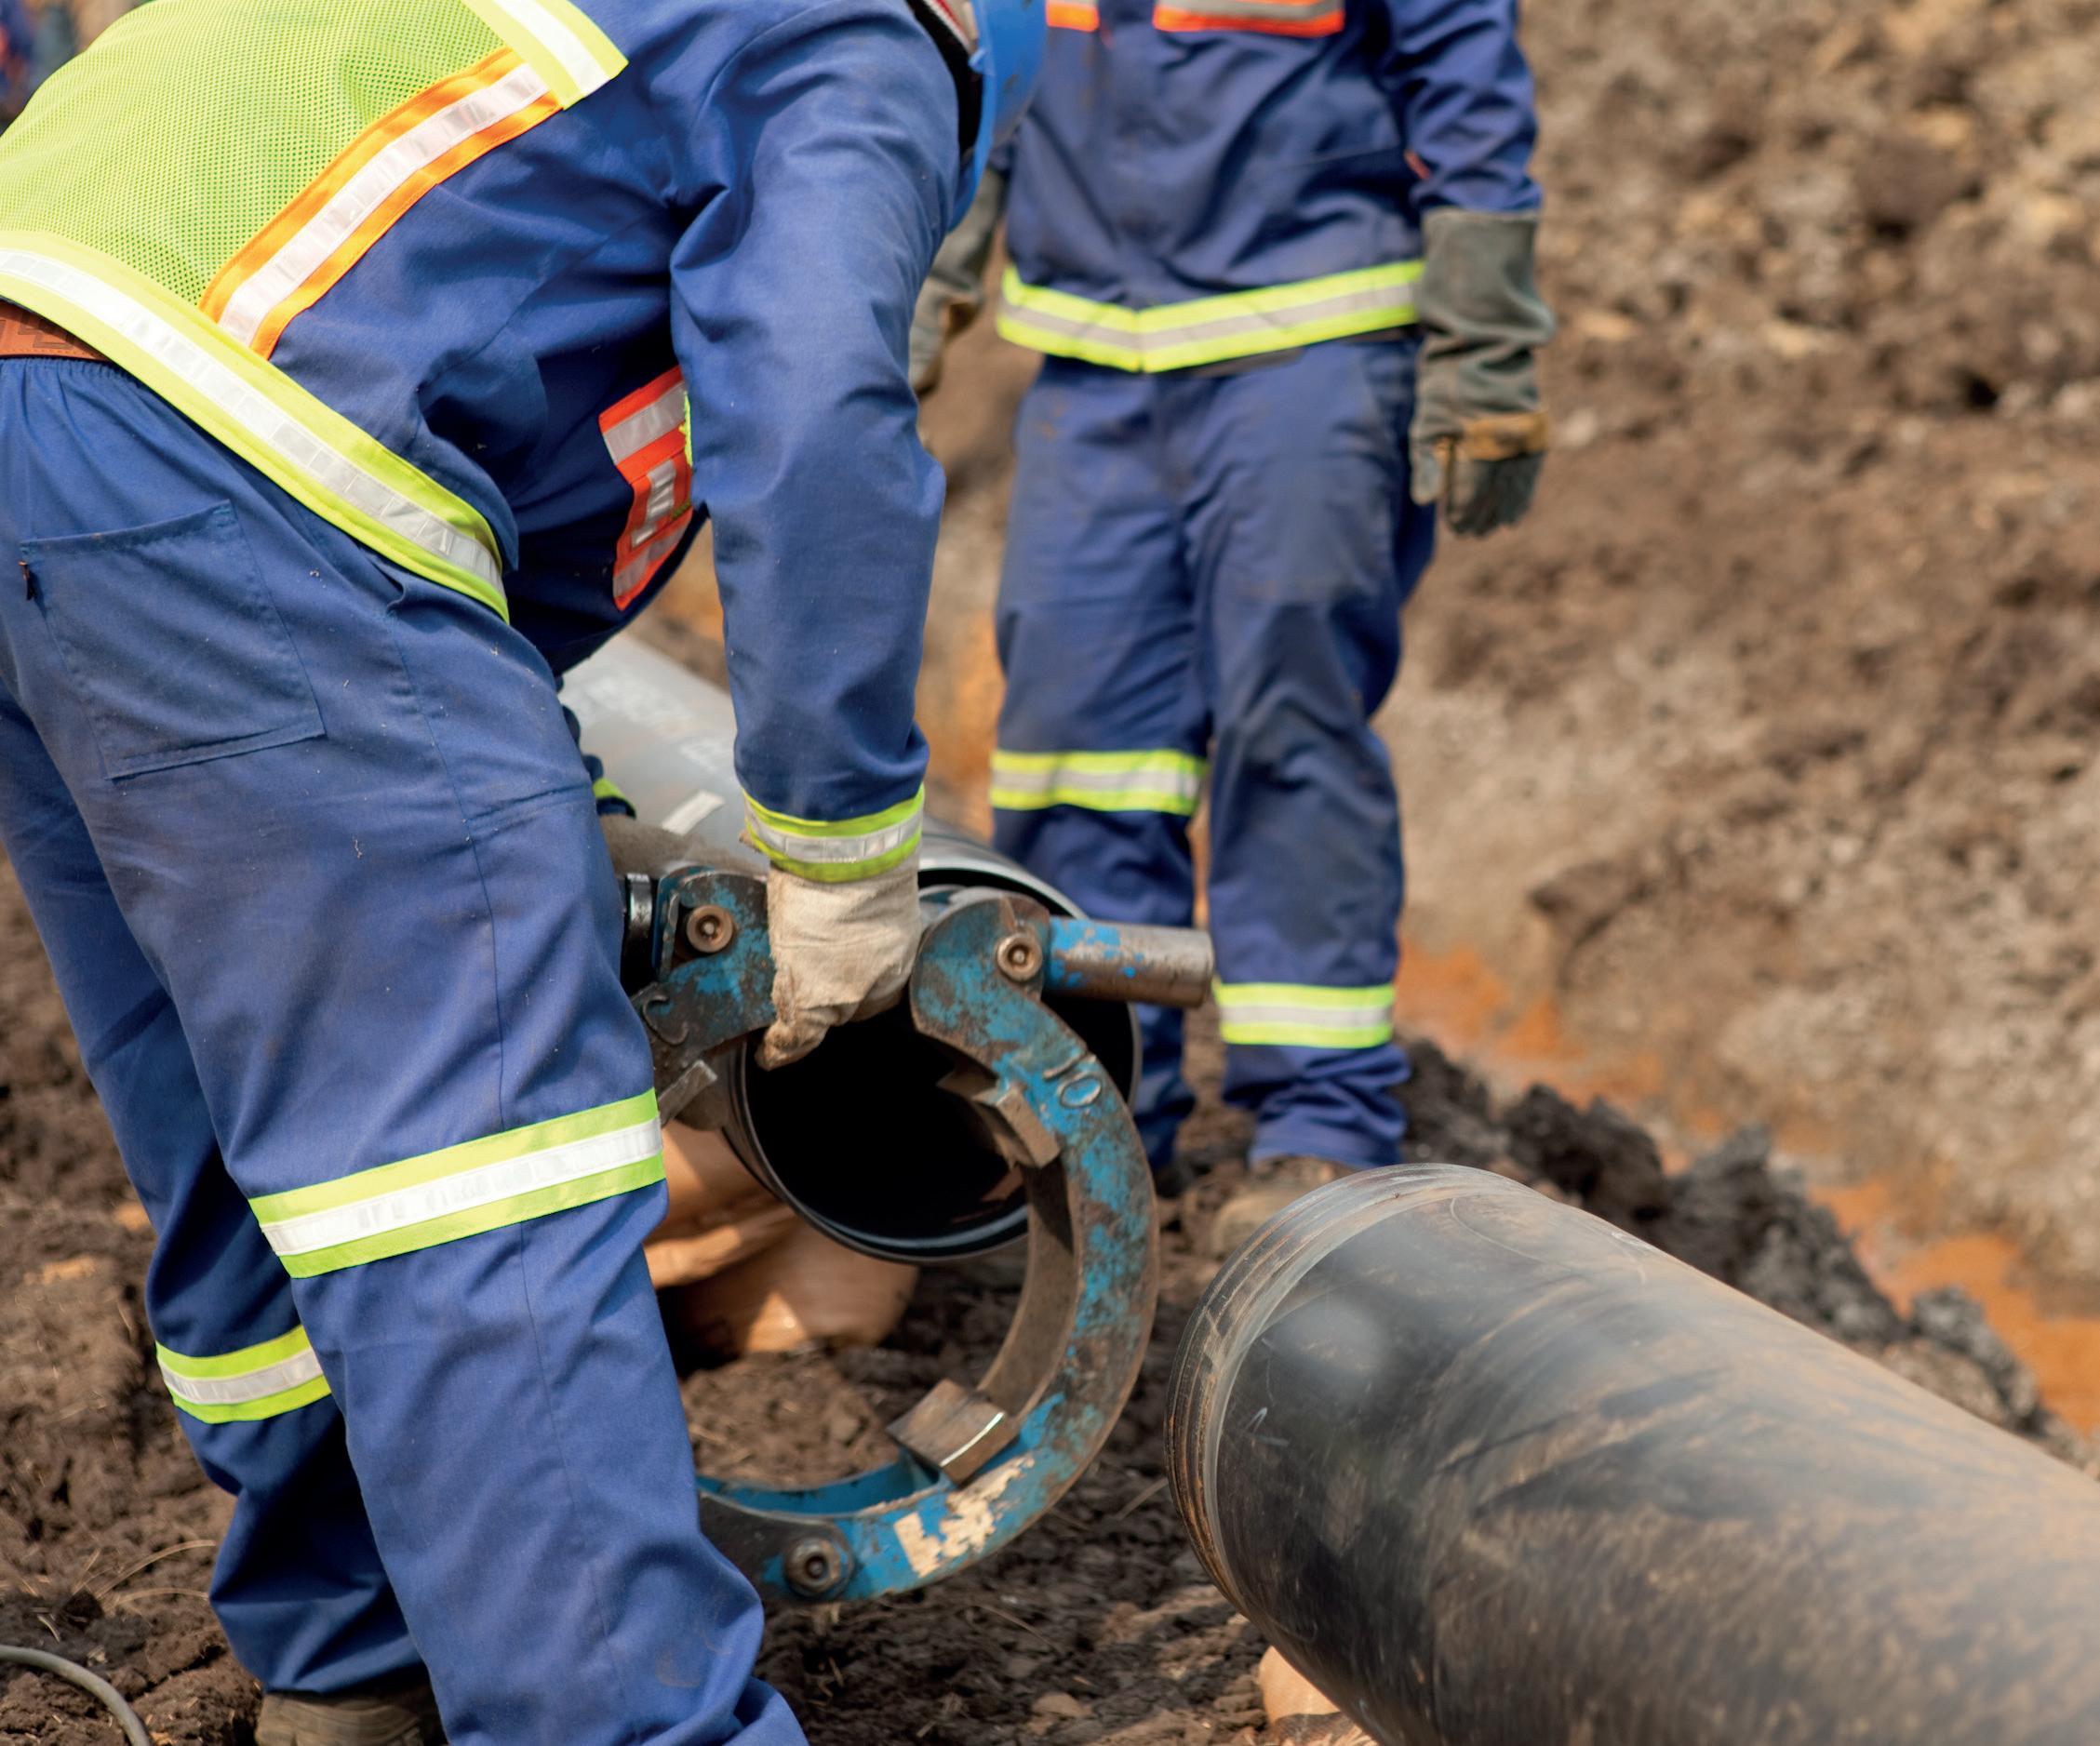

Register for free at: www.worldpipelines.com Worldwide coverage A global industry requires a global publication
ADVERTISERS’ DIRECTORY
technology, a second wave of inspections was targeted for months later, using a different vessel with direct deployment of ROV and tool, allowing for safer and more effective measurements, as well as a more efficient use of time, equipment, and personnel.
The second mobilisation targeted flowlines and risers coated with IMPP, IMPU, GSPP, and GSPU. Dredging was performed prior to the ARTEMIS mobilisation to provide access for the tool to engage and measure the pipe 360° for the flowlines and riser touchdown zones. The pre-dredging lasted for 10 days. This was a valid learning, which later saved several days of work.
After months of further development and testing, the team successfully deployed a new technology to accurately assess the wall thickness of subsea flowlines, risers, and jumpers with an emphasis on scanning speed to allow for the collection of more data while lowering inspection costs. Overall, four rigid production jumpers coated with Novolastic and three production flowlines and risers up to 12 in. OD and coated with up to 90 mm GSPP/IMPU were successfully inspected.
The BC-10 Brazil project achieved the first-ever highresolution UT scan on a deepwater fully insulated production flowline. Overall, the tool completed scans from 180 locations in the GoM and Brazil fields with an estimated US$5 million in savings and an unquantifiable increase on quality, confidence and reliability of data on corrosion status of subsea pipelines.
The ART technology and assessment procedures represent the latest in field-proven state-of-the-art technology and processes. Up to ~100 times more inspection data points per station were collected and analysed compared with the previous inspection tools used in the Gulf of Mexico (14 000 vs 1 300 000 data points per line). The results demonstrated that the ARTEMIS tool can provide high-resolution wall thickness measurements through subsea corrosion coatings to an accuracy of +/- 0.2 mm. The scans are faster and require less dredging, reducing inspection duration and costs. The high volume of data allows for much more valid statistical analysis, giving better predictions for the most severe wall loss.
Each local area data collection was completed five times quicker compared with the previous inspection method commonly used in the GoM, which was the only external local inspection technology available for deepwater production systems at that time.
Based on the success of ARTEMIS, TSC Subsea over the last three years has developed multiple ART-based inspection solutions covering a broad range of subsea applications and continues to grow its portfolio. These applications include flooded annulus detection of flexible risers, flow assurance inspection for hydrate blockage, flooded member detection (FMD) through heavy coating and ovality confirmation for ILI compatibility.
Advertiser Page ABC 45 AGRU 47 AMPP 25 API OBC CRC-Evans 4 Dairyland 55 Darby 33 DeFelsko 29 Denso Inc. 7 Electrochemical Devices, Inc. 51 Girard Industries 47 Global Hydrogen Review 2 IPLOCA 30 Oilfield Technology 42 Palladian Energy Podcast IBC Pigs Unlimited International LLC 21 Pipeline Inspection Company 41 Propipe 25 ROSEN IFC SCAIP S.p.A. 35 Seal For Life Industries OFC, 22 Stark Solutions 13 STATS Group 9 T.D. Williamson 19 World Pipelines 63 Zwick 37
Enhances

PIPELINE SAFETY MANAGEMENT SYSTEM ASSESSMENT PROGRAM
safety and operations
shared learnings and benchmarking across the industry
safety management systems for individual operators © 2023 – American Petroleum Institute, all rights reserved. API, Pipeline SMS, the API logo and the Pipeline SMS logo are trademarks or registered trademarks of API in the United States and/or other countries. API Marketing & Communications: 2023-108 | PDF To learn more about the Pipeline SMS Assessment Program and take your first step toward your assessment, visit: www.API.org/PipelineSMS A COMMITMENT TO A CULTURE OF SAFETY AND CONTINUOUS IMPROVEMENT
Provides
Strengthens
