For nearly 20 years, GeoCorr has met and exceeded your pipeline inspection needs. We deliver individualized, expedited, and accurate solutions with a wide range of technologies.
ADDITIONAL SERVICES:
Launcher/Receiver Rentals & Sales
AGM Rentals/Gauge Pig Rentals & Sales
Tracking/Survey and AGM Placement Inline Inspection Support & Project Management
C O NTENTS
03. Editor's comment
05. Pipeline news
Contract news and updates from Greece, East Africa, and South America.
KEYNOTE: FOCUS ON ARGENTINIAN
08. A reshuffle in South America
Vinicius Romano, Vice President, and Gabriela Sanches, Analyst, Rystad Energy, outline plans for the construction
in South America.
13. Bright future for Argentina Matteo Dondeo, Managing Director, Pipeline Business Solutions, Italy, explains how the midstream sector is transforming Argentina’s role in the global oil and gas market.
CYBER SECURITY UPDATE
19. A growing geopolitical weapon
Javvad Malik, Lead Security Awareness Advocate, KnowBe4.
HYDROGEN: PIPELINE CONDITION ASSESSMENT
23. Detect, protect – perfect
Jordan Ferguson, CEO, Pier Solutions.
TUBE AND PIPE
29. Simplifying monitoring for flare gas units
Brian Lawson, Senior Member of Technical Staff, Fluid Components International, Derik Hoover, President, Hoover Energy, and Mike Conn, President, ESquaredi.
33. Deeper dives and complex conditions
Nora Brahmi and Pierre Sutter, Vallourec, France.
ILI CASE STUDIES
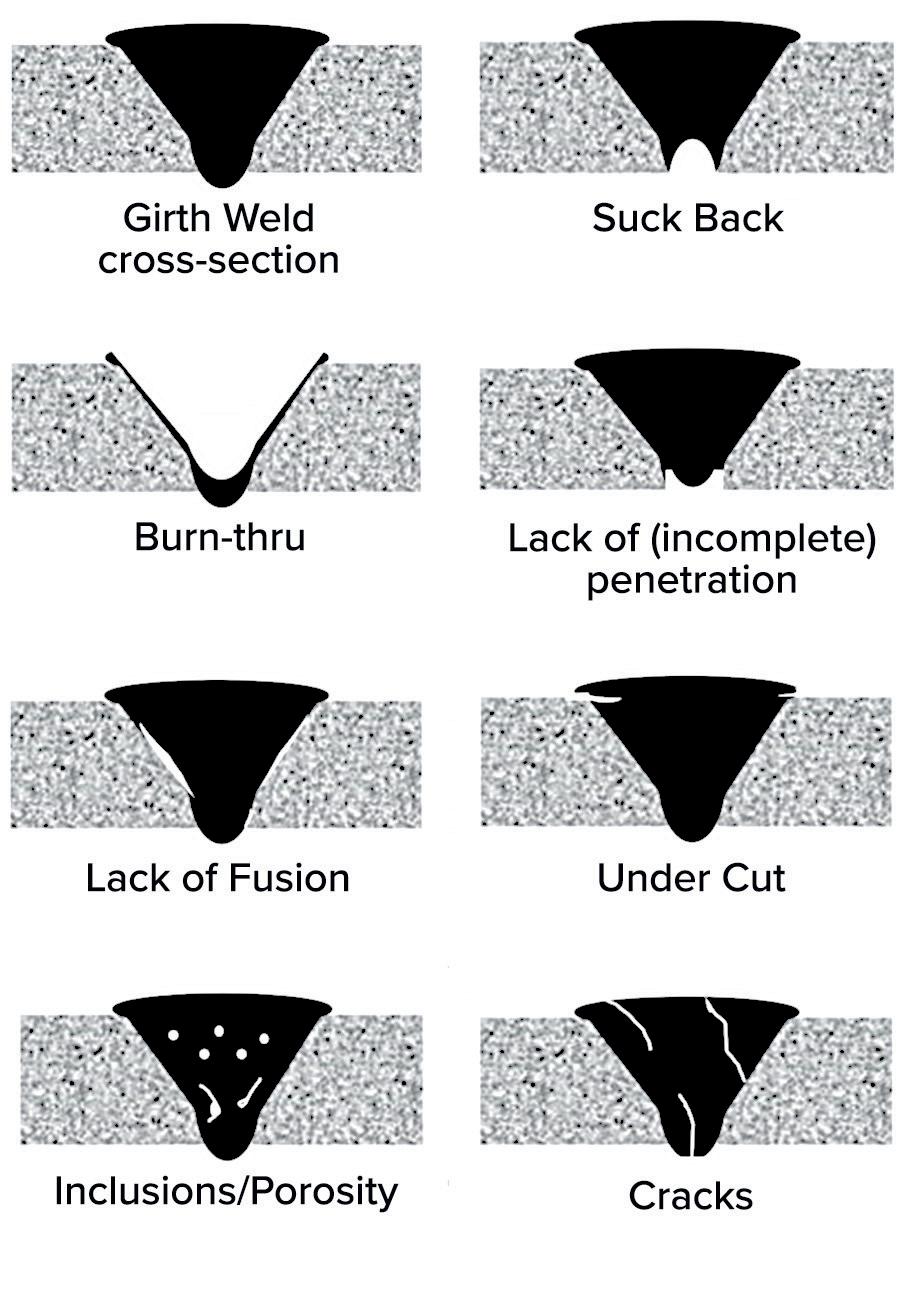
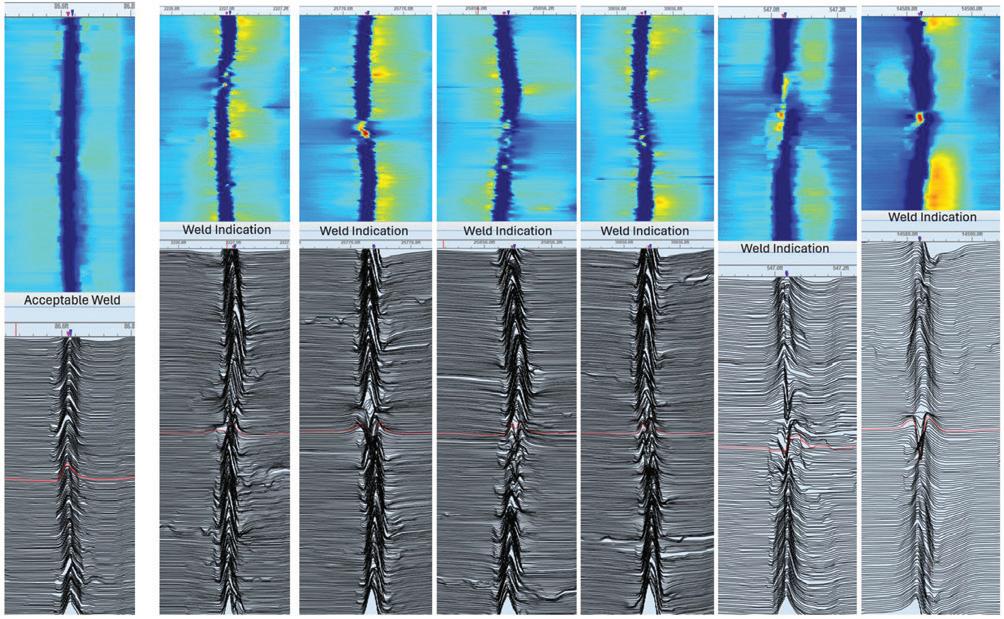
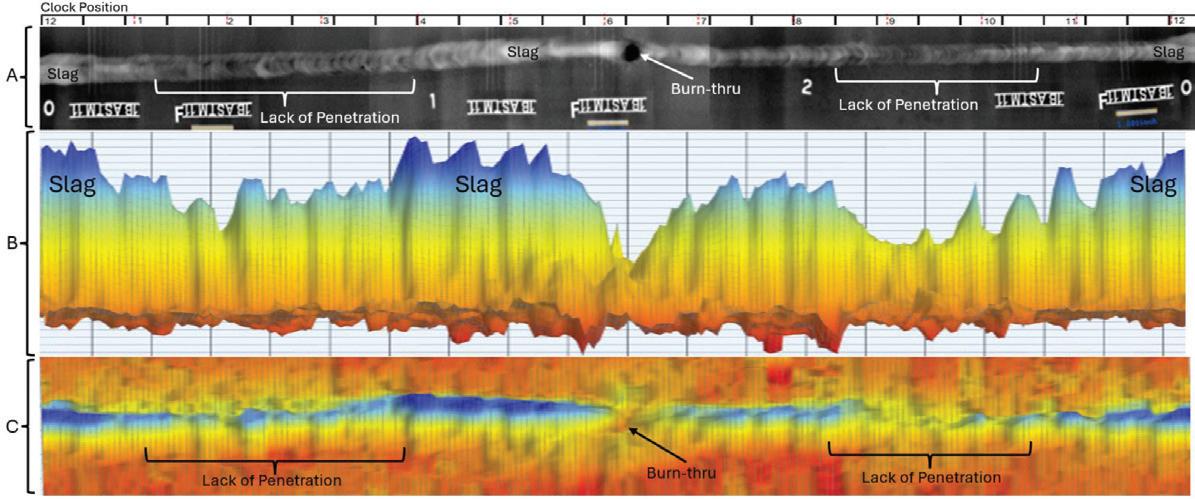
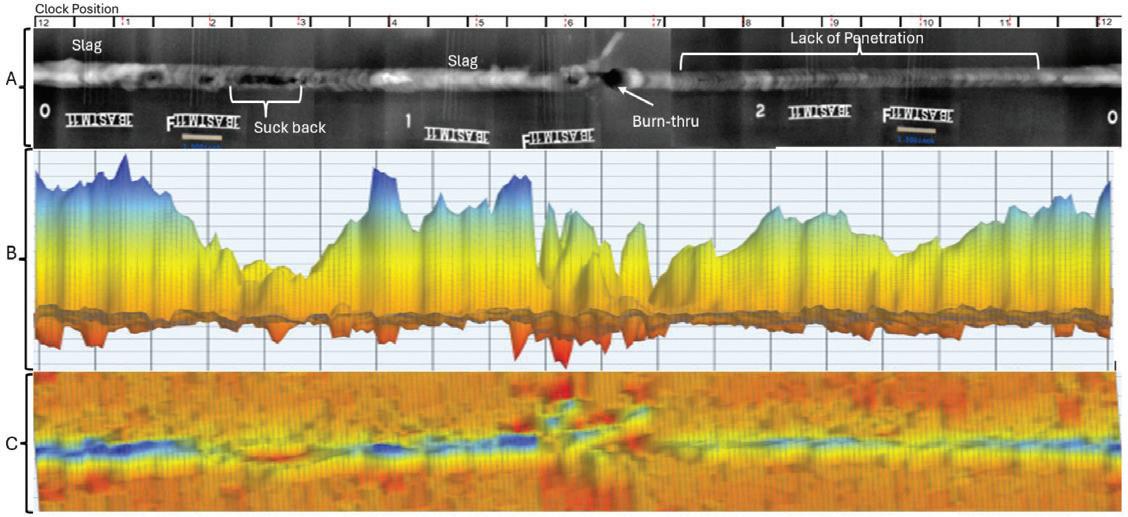
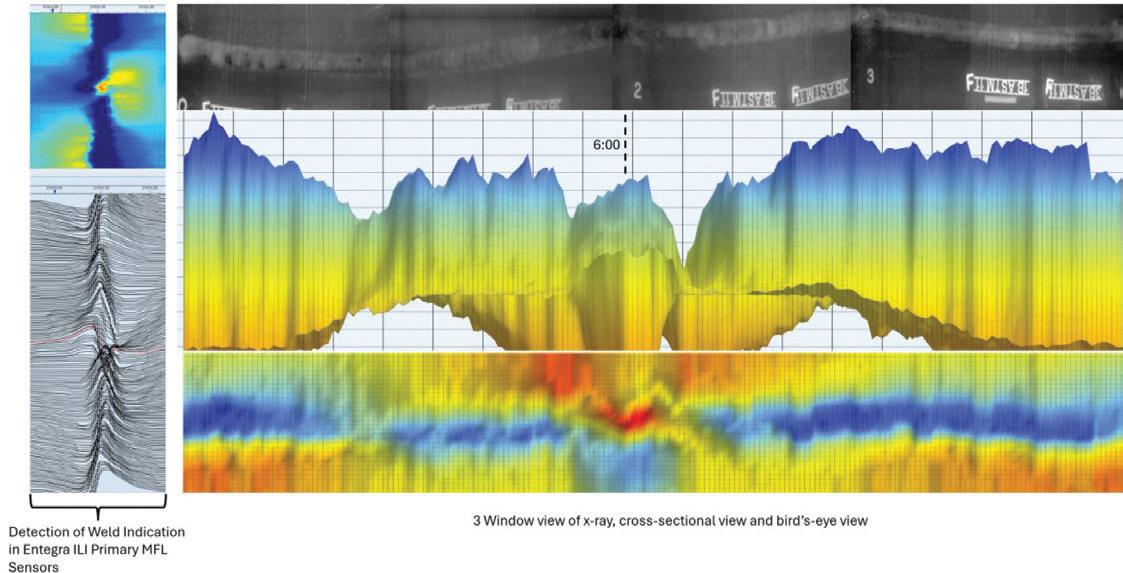
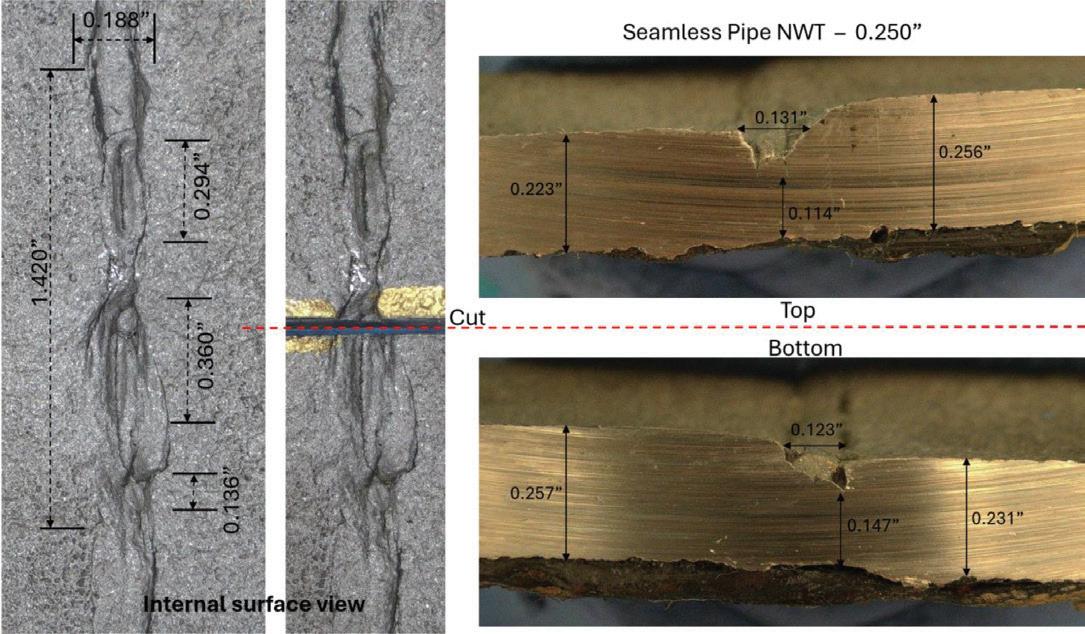
39. Understanding volumetric metal loss at girth welds
Rick Desaulniers, Principle Technical Advisor, ILI – ENTEGRA.
Annual subscription £60 UK including postage/£75 overseas (postage airmail). Special two year discounted rate: £96 UK including postage/£120 overseas (postage airmail). Claims for non receipt of issues must be made within three months of publication of the issue or they will not be honoured without charge.
Applicable only to USA & Canada: World Pipelines (ISSN No: 1472-7390, USPS No: 020-988) is published monthly by Palladian Publications Ltd, GBR and distributed in the USA by Asendia USA, 701C Ashland Avenue, Folcroft, PA 19032. Periodicals postage paid at Philadelphia, PA & additional mailing offices. POSTMASTER: send address changes to World Pipelines, 701C Ashland Avenue, Folcroft, PA 19032.
In October, the Columbia Journalism Review published an article called: ‘The Final Flight of the Airline Magazine’, about the demise of United Airlines’ in-flight publication. Hemispheres has now gone digital, marking the end of an era for Star Alliance travellers and their non-points-collecting counterparts.
The airline could do without the extra weight of the printed magazine onboard, and that’s before you consider how the wide availability of in-cabin WiFi, sophisticated personal devices, myriad seatback entertainment options, and a general post-COVID-19 hesitance to touch public surfaces and materials, have all contributed to the fate of the printed airline magazine.
Hemispheres, the last to fold of the printed magazines of the major US carriers, now resides online, offering a digital experience that can encompass translations in eight languages, and the option to enlarge text for easier reading.
As passengers, we strap ourselves in and must choose how to spend our time from a finite set of options. Despite recent press attention on an interesting subset of people who pride themselves on doing nothing but stare at the back of the seat in front for the duration of a flight (as some sort of mental challenge, I gather), most of us pass the time in more conventional ways.
I can see how it might be harder than ever to capture (and keep) the attention of passengers on a plane. When I think back on my own recent flight activity, I have made friends with my seatmate, read a book, watched downloaded Netflix shows on my tablet, and scrolled TikTok (tip: before you fly, you can pre-download up to 200 TikTok videos to watch without data, just navigate to ‘Offline videos’ in Settings), but I have not once reached for any airline-provided publications.
The onboard environment clearly lends itself to engagement with printed materials, but the titles must work hard to earn that attention. At the centre of everything we do at World Pipelines, is the belief that pipeline professionals seek highly curated and relevant content to enhance their work. Even though our readers are not physically captive like the passengers on a plane, their professional roles make them highly invested in finding content that supports their work and decision-making.
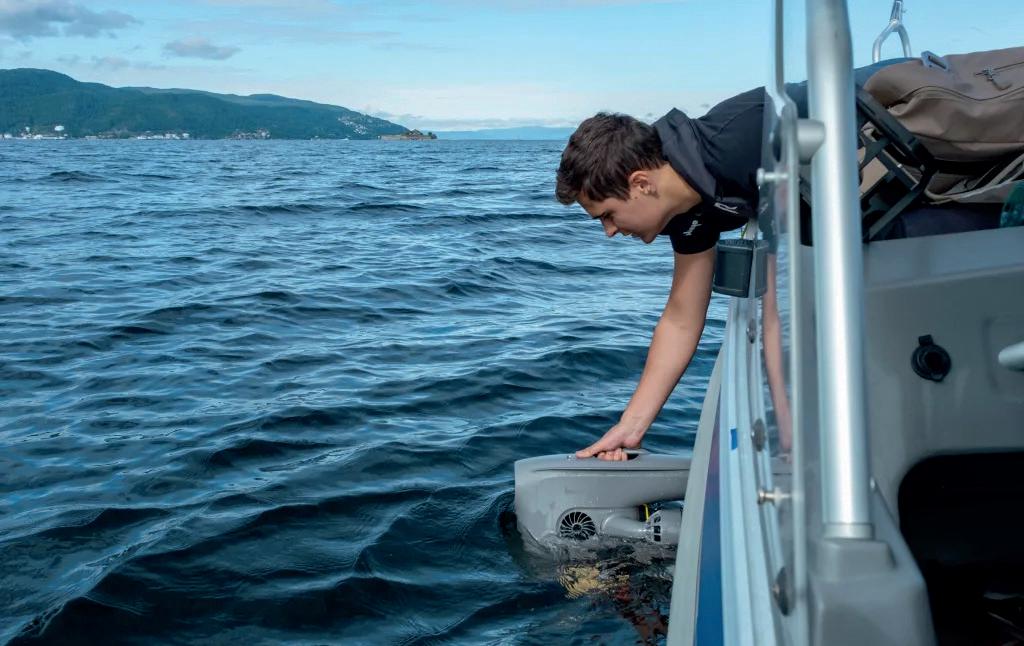
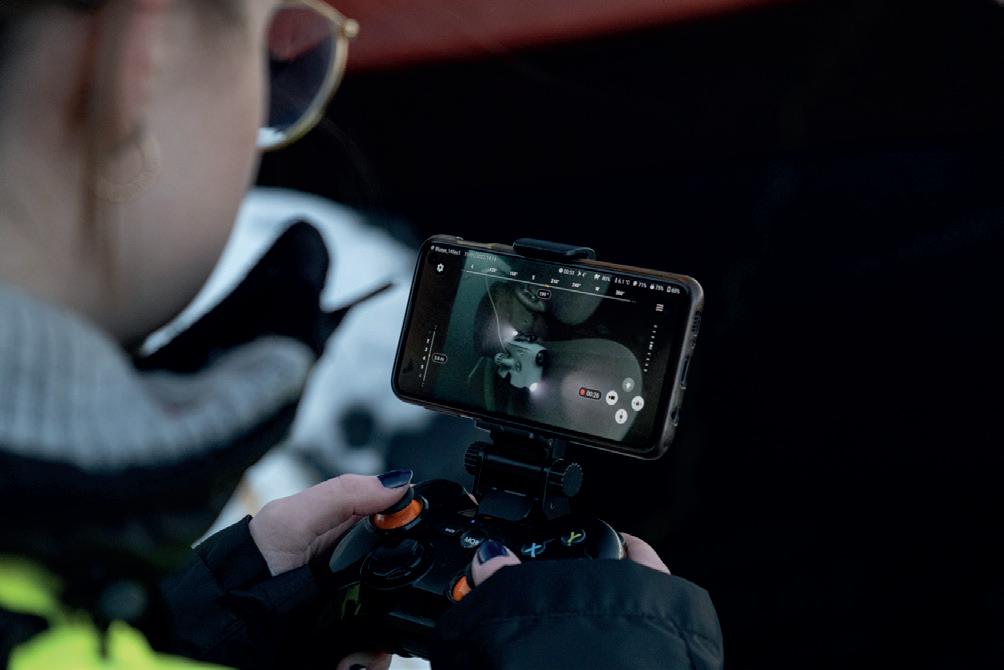
The most engaged audiences are those who feel they are part of a conversation, not just passive recipients of information. We recently celebrated gaining over 10 000 members for our World Pipelines LinkedIn group: by creating space for informed communities to share insights, foster innovation, and address sector-wide challenges such as sustainability and regulatory pressures, we help push the sector forward. And we strive to publish content that resonates with your needs, ambitions, and challenges. In this issue, we offer insight into: Argentina’s burgeoning midstream sector; the current threat level for cyberattacks on pipelines; key regulatory challenges for hydrogen pipeline safety; and case studies describing flare gas monitoring at compressor stations, understanding volumetric metal loss at girth welds, and ROVs for targeted inspections of midstream assets.
Wishing you a happy holiday season. Join us in 2025 for 14 issues of the magazine, webinars, interviews, the World Pipelines podcast, and more. And we don’t mind if you read the magazine (in print, or digitally) on the plane!
SENIOR EDITOR Elizabeth Corner elizabeth.corner@palladianpublications.com
Still pioneers.
WORLD NEWS
Brazil and Argentina agree to studies on gas exports from Vaca Muerta
Brazil and Argentina signed an agreement on 18 November 2024, to study the development of infrastructure for natural gas exports to Brazil, with Brazilian authorities saying the deal could lead to imports of as much as 30 million m3/d of gas by 2030, reports Reuters
The memorandum of understanding (MoU) will create a working group to identify the measures needed to make the supply of gas from Argentina to Brazil viable, with emphasis on gas from Argentina’s massive Vaca Muerta formation, Brazil’s Mines and Energy Ministry said in a statement.
Brazil is Latin America’s largest crude oil producer, but its gas output is insufficient to meet growing domestic demand, which made increasing gas supply a priority for Brazil President Luiz Inacio Lula da Silva.
East Africa pipeline hits 47% milestone
The East African Crude Oil Pipeline (EACOP) project has reached a critical milestone, with construction now 47.1% complete, bringing it closer to becoming a vital link for transporting Uganda’s oil to international markets via Tanzania.
The EACOP Coordinator from the Tanzania Petroleum Development Corporation (TPDC), Mr Asaidi Mrutu said the implementation of the project has already benefitted the local communities through direct and indirect employment and other related social-economic activities.
The EACOP is a strategic project implemented in collaboration of Tanzania and Uganda governments as well as TotalEnergies and China National Offshore Oil Corporation (CNOOC).
Tanzania TPDC holds 15% share, Uganda 15%, TotalEnergies 62% and CNOOC 8%. The project was initiated due to the discovery of significant oil reserves in Uganda estimated to be around 6.5 billion bbls of crude oil.
The pipeline will transport oil from Uganda’s oil fields to the port of Tanga in Tanzania enabling the export of crude oil to international markets.
Mr Mrutu outlined the benefits achieved from the project so far as compensating 9858 Tanzanians, with a total amount of 35.1 billion, equal to 99.3% of the targeted compensation.
He added that Tanzanians are also engaged in business and
Greece declares support for TAP pipeline expansion
Greek Prime Minister Kyriakos Mitsotakis has affirmed his country’s readiness to support the expansion of the Trans Adriatic Pipeline (TAP).
“I made a strategic commitment to ensure regional energy security,” Mitsotakis said during a ceremony of launching Greece’s pavilion at the COP29 climate conference in Baku, News.Az reports.
He highlighted the completion of TAP in 2020, which brings natural gas from Azerbaijan to Greece, Italy, Bulgaria, and Southeastern Europe.
Vaca Muerta is the world’s second-largest shale gas reserve and fourth-largest shale oil reserve. Argentina’s state oil firm YPF is leading activity there in hopes of turning the country into a major energy exporter. The working group will analyse possible routes for the gas to reach Brazil, the Brazilian ministry said.
Brazilian Mines and Energy Minister Alexandre Silveira told reporters the initial potential is for Brazil to import 3 million m3/d from Argentina, potentially reaching up to 30 million by 2030.
The routes to be analysed include the reversal of flow of Bolivia’s pipeline, a route going through Paraguay, and another one through Uruguay, according to the ministry.
Brazil and Argentina will also analyse the possibility of a direct connection at Uruguaiana, a Brazilian city that borders Argentina, it added.
accessed goods and services with the value of 821.1 billion.
He said the water supply project has benefited approximately 20 000 people. Moreover, the project has upgraded the water pipeline from Muheza – Tanga by increasing its diameter from 6 to 8 in., which now has the capacity to transport two million l./d of water.
Furthermore, the project has so far created 8694 jobs since its inception in 2022 and enabled the construction of 24 km pipeline with a 10 in. diameter, starting from Chongoleani with a capacity to transport 3 million l./d of oil.
Other benefits include improved electricity access, with the project upgrading power substations in areas such as Kibete (Kagera), Bulyanhulu (Shinyanga), Lusu (Nzega-Tabora) and Majani Mapana (Tanga).
“This construction is also accompanied by the development of new power transmission lines to connect the project areas which allowed local communities to access electricity,” said Mr Mrutu.
He added that the government generated revenue worth 50 billion from issuing land lease permits for the project, local authority fees and services such as electricity, water, waste disposal, security and taxes from companies involved in the project.
Mitsotakis added that Greece is ready to back the expansion of TAP if needed to meet growing energy demands.
Looking ahead, the Prime Minister also highlighted Greece’s focus on the future of energy infrastructure, noting that today’s gas pipelines could eventually be converted to transport hydrogen. “We must lay the foundations for such a transition,” he said.
Mitsotakis further emphasised the importance of considering electricity infrastructure in the broader vision for regional energy security.
CONTRACT NEWS
EnerMech announces multi-million-pound contract with major North Sea operator
27 - 31 January 2025
Pipeline Pigging & Integrity Management Conference (PPIM) 2025 Houston, USA
29th World Gas Conference (WGC2025) Beijing, China
https://www.wgc2025.com/eng/home
25 - 29 May 2025
Annual Pipe Line Contractors
Association of Canada (PLCAC) Convention Banff, Canada
https://pipeline.ca/
EnerMech has won a multi-million-pound contract to become the preferred provider of Flexible Hose Assembly (FHA) and Small Bore Tubing (SBT) management services for a major E&P organisation’s UK assets.
The minimum five year agreement focuses on the management, maintenance, and inspection of FHA and SBT systems, ensuring asset integrity, production up-time and operational efficiency. EnerMech’s services include monitoring the condition of hoses and small bore tubing in accordance with stringent safety and operational standards.
As the integrated technical specialist, EnerMech will optimise the overall performance of FHA and SBT services, including the management of all necessary repairs and replacements.
Charles ‘Chuck’ Davison Jr., EnerMech CEO,
Penspen awarded hydrogen blending contract from Latvian gas operator Conexus Baltic Grid
Penspen is expanding its energy transition project portfolio with the award of a hydrogen blending contract from Latvian Natural Gas Operator, Conexus Baltic Grid. Under this new contract, Penspen’s integrity team in the UK will assess the feasibility of introducing hydrogen blends into Conexus’ existing natural gas pipeline network, in alignment with industry international and national codes and regulations, to help optimise existing gas infrastructure in Latvia for a cleaner energy future.
Penspen will conduct studies to assess and provide recommendations to mitigate the effects of hydrogen on pipeline steel properties, as well as examine the potential interactions with existing defects, to ensure structural integrity and ongoing safe operations under blended conditions. Penspen will provide essential insights to support Conexus’ safe and sustainable transition to hydrogen and contribution to global decarbonisation efforts.
Ali Alani, Director of Asset Integrity at Penspen, commented: “We are very pleased to be awarded this project and excited to be working with Conexus Baltic Grid. The project scope aligns well with our materials engineering and pipeline analysis core strengths as well as our extensive knowledge of pipes from that age and region. This is a good addition to our growing H2 pipeline repurposing track record”.
said: “This award reflects our unwavering commitment to consistently delivering high-quality services to ensure asset safety and performance.”
EnerMech’s success in securing the contract was driven by its track record of excellence in FHA and SBT management, as well as the seamless integration with customer technologies, which ensures quality and reliability in every stage of service delivery.
David Farquharson, Head of Hydraulics at EnerMech, added: “Winning this contract following a competitive tender reinforces the strength of our integrated technical services and our role as a leading provider in the hydraulics market within Europe. We look forward to working with our client to maximise production up-time and efficiency of assets.”
ON OUR WEBSITE
• CRC Evans wins major contract with COOEC for Qatar’s Ruya LNG Expansion project
• Saipem: new offshore contract from TotalEnergies in Suriname for US$1.9 billion
• Perma-Pipe announces US$15 million in contract awards in the Americas and Middle East regions
• Sonatrach enters into contract to supply gas to Czech Republic
• Global oil and gas contract value declines in 3Q24
Follow us on LinkedIn to read more about the articles linkedin.com/showcase/worldpipelines
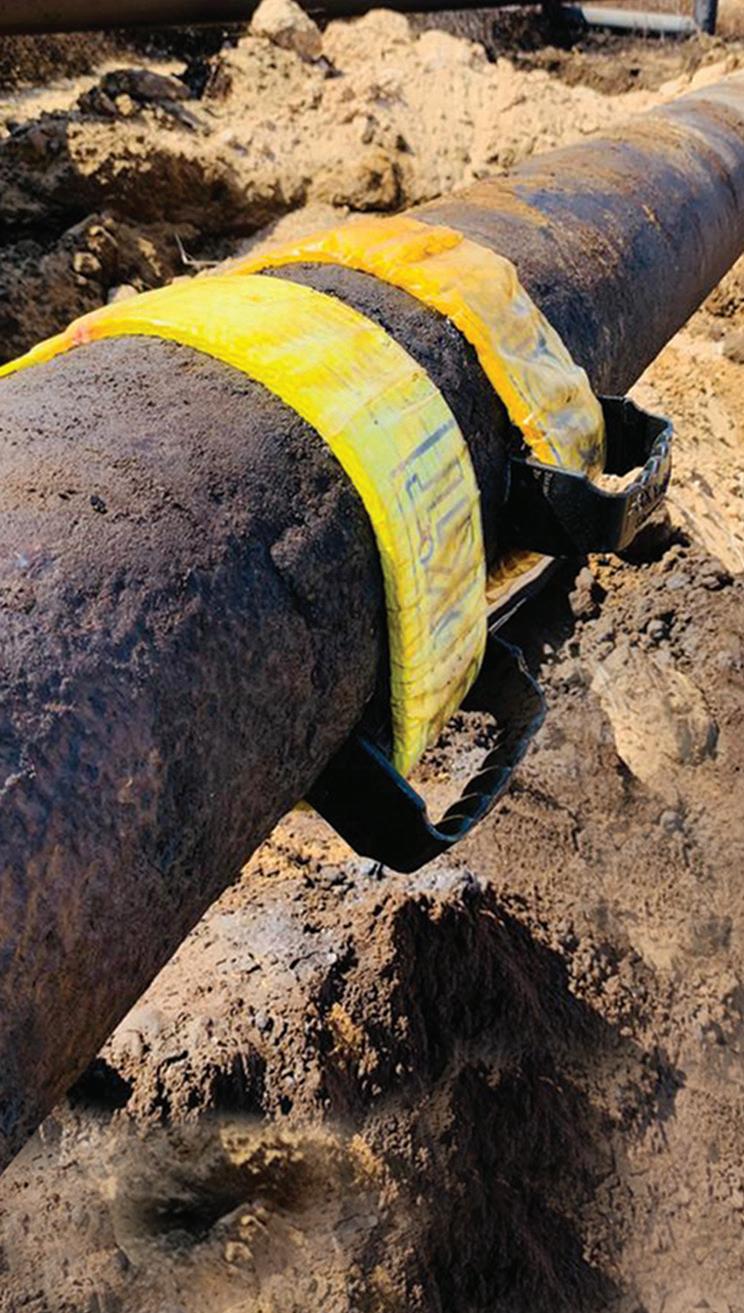
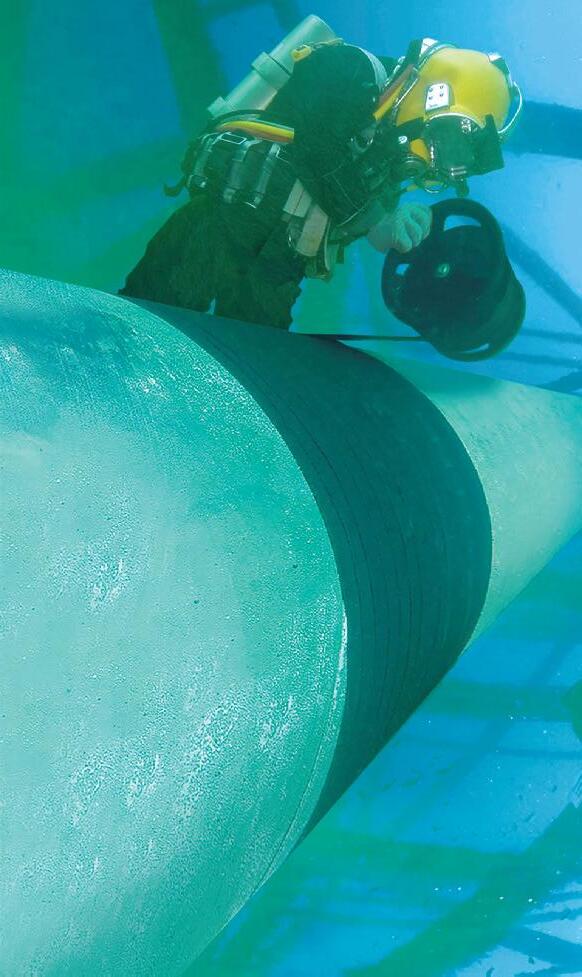
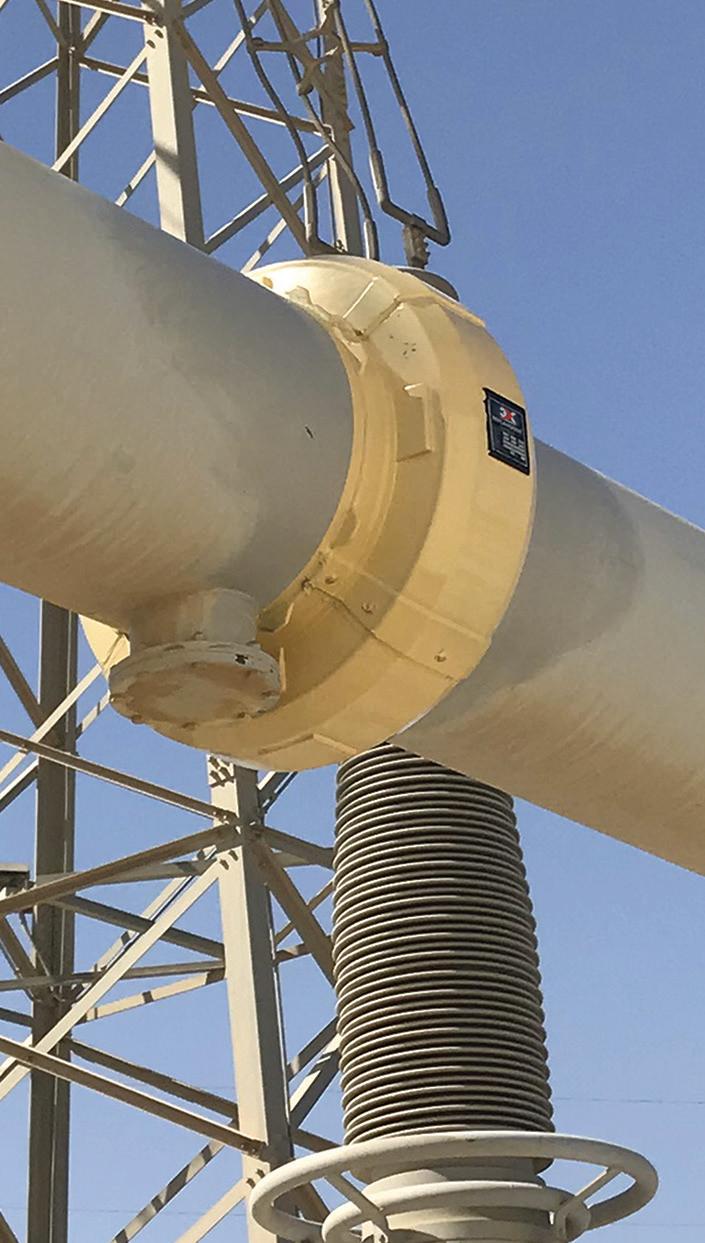
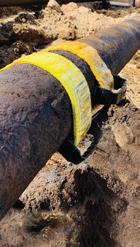
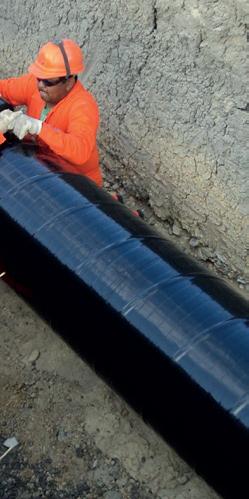
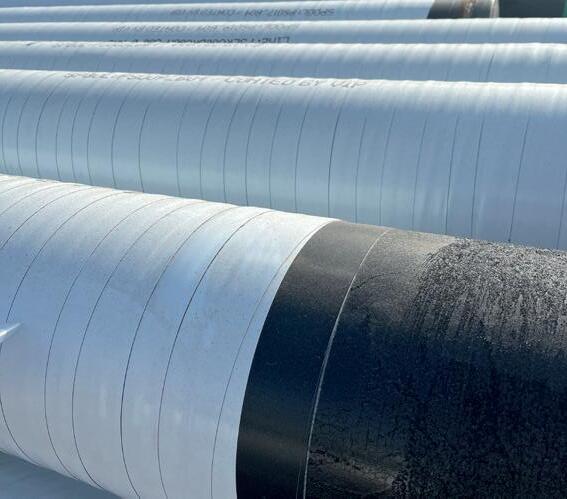
PROTECTIVE OUTERWRAPS
BUTYL TAPE WRAP SYSTEMS
LIQUID EPOXY COATINGS
PETROLATUM TAPE WRAP SYSTEMS
SOIL-TO-AIR INTERFACE
HEAT SHRINKABLE SLEEVES
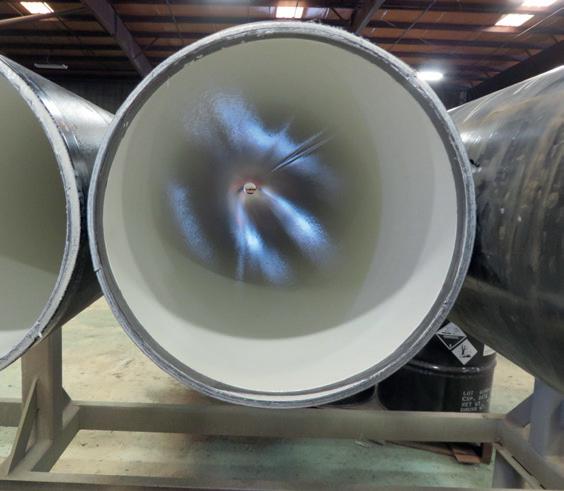
INTERNAL PIPE LININGS
BITUMEN TAPE WRAP SYSTEMS
Vinicius Romano, Vice President, and Gabriela Sanches, Analyst, Rystad Energy, outline plans for the construction of critical pipeline infrastructure in South America.
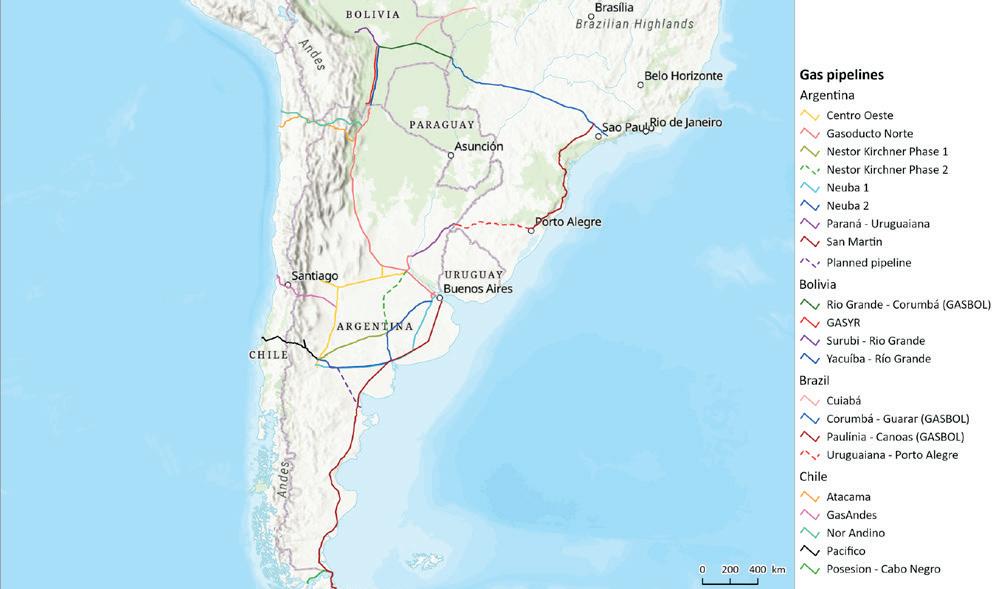
outh America is set to see a reshuffling of its gas-market dynamics from the end of this year, spurred on by gas wells drying up in Bolivia, seemingly endless gas production from Argentina’s Vaca Muerta shale deposit, and promising new deepwater reservoirs identified in Brazil’s pre-salt and Equatorial Margin offshore plays.
Brazil, Argentina, Bolivia and Chile are currently interconnected by a network of gas pipelines which help manage supply and demand balances between the four countries. Argentina and Brazil’s promising new gas resources could rejig this relationship in the coming years. The success of these plans depends on construction of critical gas transportation infrastructure, which could allow the region to be flooded with gas – or choked by bottlenecks if the pipelines fail to materialise. Argentina holds a key role in this new scenario. With reserves available for more than 100 years, Argentine producers plan to become major exporters as soon as they can, choosing between Brazil, Chile, or the rest of the world via LNG.
Current gas network – Brazil
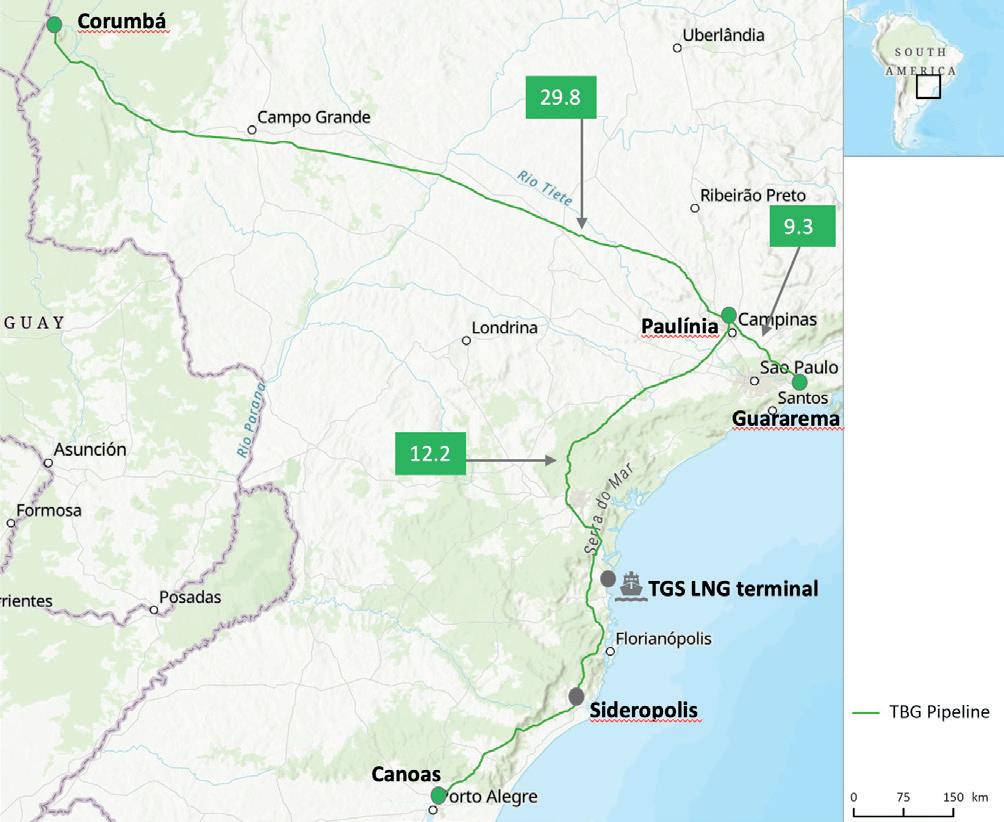
Brazil currently manages its gas imports and transits via three main transportation companies: Transportadora Brasileira Gasoduto Bolivia-Brasil (TBG), Nova Transportadora do Sudeste (NTS), and Transportadora Associada de Gas (TAG). TBG imports gas from Bolivia through Corumbá point A, with the main city gate in a refinery at Paulínia point B, which also is capable to transfer gas from TAG to NTS and supply Brazil’s southern region. In March 2024, TBG inaugurated a new pipeline connecting the Terminal Gas Sul LNG, operated by New Fortress Energy with a capacity up to 15 million m3/d, and enabled a new injection point on South of Brazil.
Pre-salt gas from the offshore pipeline Rota 2 enters TAG’s and NTS’s network at Cabiúnas point I, though almost half of the Rota 2 flows run north and connect to regasification terminals (Bahia point K and Pecem point O), the Camaçari industrial hub near point K, and onshore fields such as Carmopolis point L. TAG also supplies the state of Amazonas in northwestern Brazil via an isolated pipeline which connects an onshore production project to a power plant, which is the main offtaker.
In addition to Cabiúnas, Caraguatatuba point E is a second relevant entry point for NTS and is supplied by a mix of pre-salt and post-salt gas via the Rota 1 gas pipeline. This pipeline also supplies São Paulo and Rio de Janeiro, the states with the highest demand in Brazil. The Rota 3 offshore gas pipeline has recently started operations, becoming the third source of pre-salt gas to the NTS gas grid. The injections are in Rio da Janeiro state in the Complexo de Energias Boaventura and are expected to increase volumes through 2025.
There are two interconnections between the NTS and TBG grids: the higher capacity of 15 million m3/d in the Paulinia link and the lower-capacity, 7 million m3/d Guararema link. There is also an interconnection between the NTS and TAG networks at Cabiunas which passes through Petrobras’ processing plant, with construction work underway for a new external interconnection.
From south to north of TAG’s network, just one out of four planned compressors have been installed on the Gasene pipeline due to the current demand profile, meaning that just 9.4 million m3/d of gas is able to reach Catu (point K) from Cabiúnas (point I). TAG has proposed a US$155 million capacity expansion through new compressor plants in Catu and Itajuipe to enable up to 12.4 million m3/d flow from the southeast to the northeast region and reduce the grid reliance on the following supply sources.
The Bahia regasification terminal (TRBA) remedies this bottleneck by being able to supply up to 20 million m3/d to the network. A second regasification unit has been connected to TAG gas grid after a US$60 million project concluded in July 2024, including Sergipe LNG as a new potential supply source.
In the outermost part of the network, the Pecem LNG regasification terminal is mainly used to supply regional thermal power plants when capacity via Guamaré is too low to meet regional demand. The port currently does not have a regasification unit. Regional thermal power plant demand can be as high as 5 million m3/d and the current network restricts gas flows to just 2 million m3/d.
To improve this capacity, TAG concluded a US$75 million project in 2024 to expand the GASFOR II pipeline by reinforcing the first 83 km out of 300 km
planned in the network near Fortaleza state. A new compression station will also be added at Itajuipe in Gasene (Bahia state), which is expected to increase flows from Catu to the north from 9.5 - 14 million m3/d.
There are two main bottlenecks in the NTS grid that limits the volume of domestically produced Brazilian gas that can flow
into the existing network. The first is between Volta Redonda and Resende, and the second between Taubaté and Suzano. Actual transit capacity from Sao Paulo to Rio de Janeiro states is around 18.6 million m3/d but, due to different pipeline diameters, only 12.5 million m3/d is available from Rio de Janeiro to Sao Paulo. The company’s expansion plans include building new parallel pipelines and reinforcing compressors by 2028 to boost flow capacity to Sao Paulo, as well as sending an additional 10 million m3/d to the TBG interconnection.
Adding a US$150 million compressor station at Japeri will lift capacity to Sao Paulo from 12 - 20 million m3/d available to the market by end-2025. Expansion plans on the NTS network also entail potentially connecting two LNG regasification terminals to the grid: the Santos LNG terminal in Sao Paulo state by 2025 and the Porto Acu LNG in Rio de Janeiro state with Cabiunas point. The total investments planned by NTS could reach US$1.36 billion.
TBG’s gas network capacity is under-utilised, with flows this year ranging from 12 - 20 million m3/d of imported gas from Bolivia passing through Sao Paulo to Brazil’s southern region.
TBG bottlenecks start in the south of Sao Paulo state due to a diameter decrease. While Parana state is currently unaffected by capacity limitations, Santa Catarina and Rio Grande do Sul states have limited gas flows due to usage on earlier exit points, resulting in regional capacity differences between firm demand and flexible power plants in the region.
TBG has an ongoing expansion plan to create the new Sideropolis delivery point at Santa Catarina, which would add 0.64 million m3/d of exit capacity and increase regional capacity to receive gas. Despite gas demand falling in Brazil’s southern states between 2022 and 2024 due to lower industrial activity by the ceramics industry, the expansion is still needed for future regional demand growth and existing short-term variations. Another investment plan is to add new compressors to increase gas flows that can reach the southern region by adding up to 4 million m3/d of new capacity, which would lift total capacity on the existing pipeline to around 16.2 million m3/d.
Argentina’s network
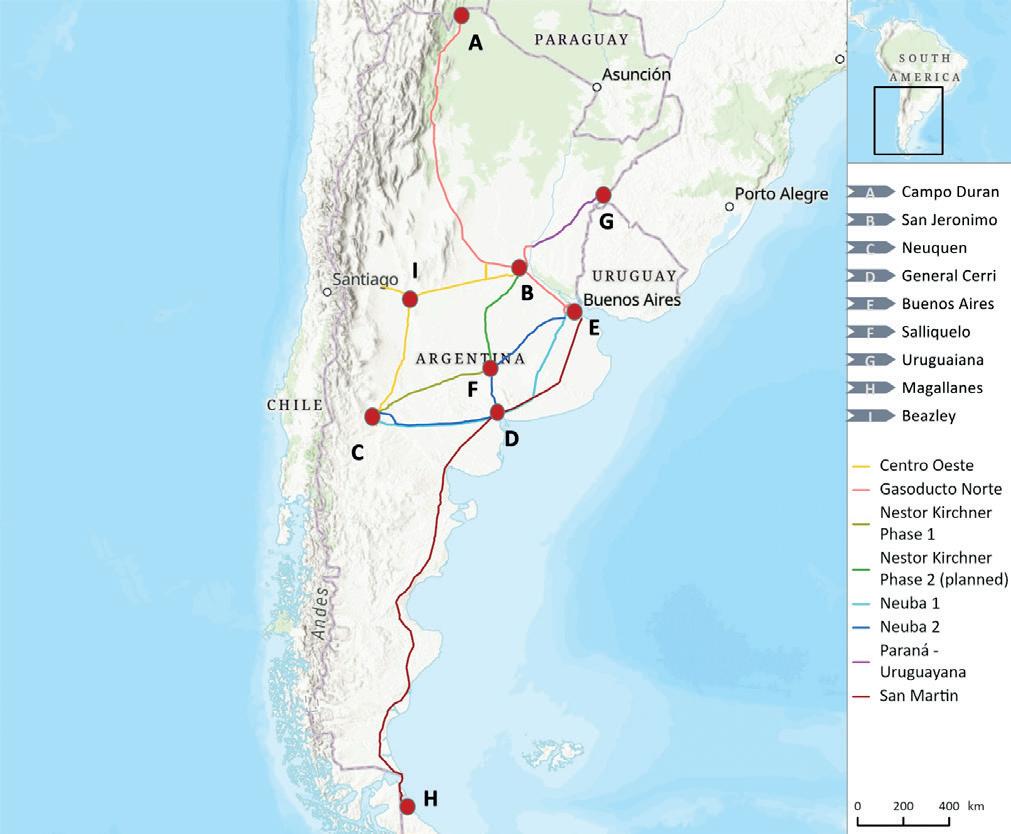
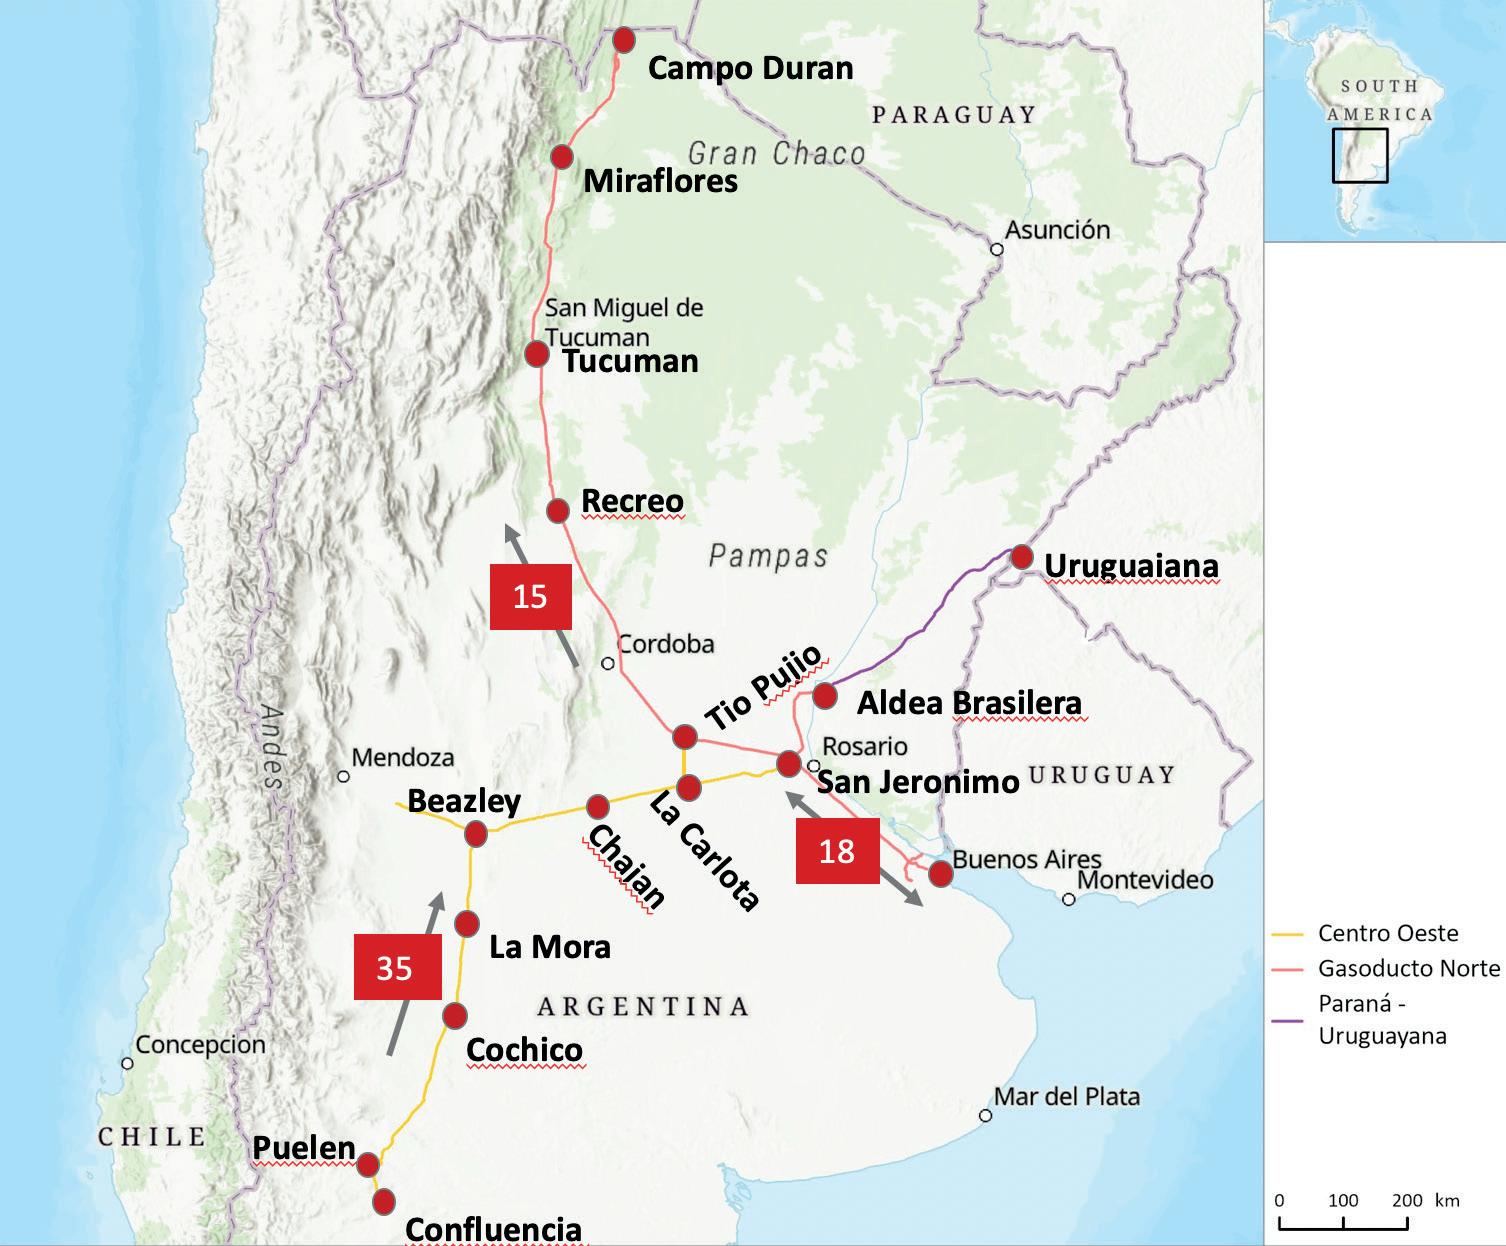
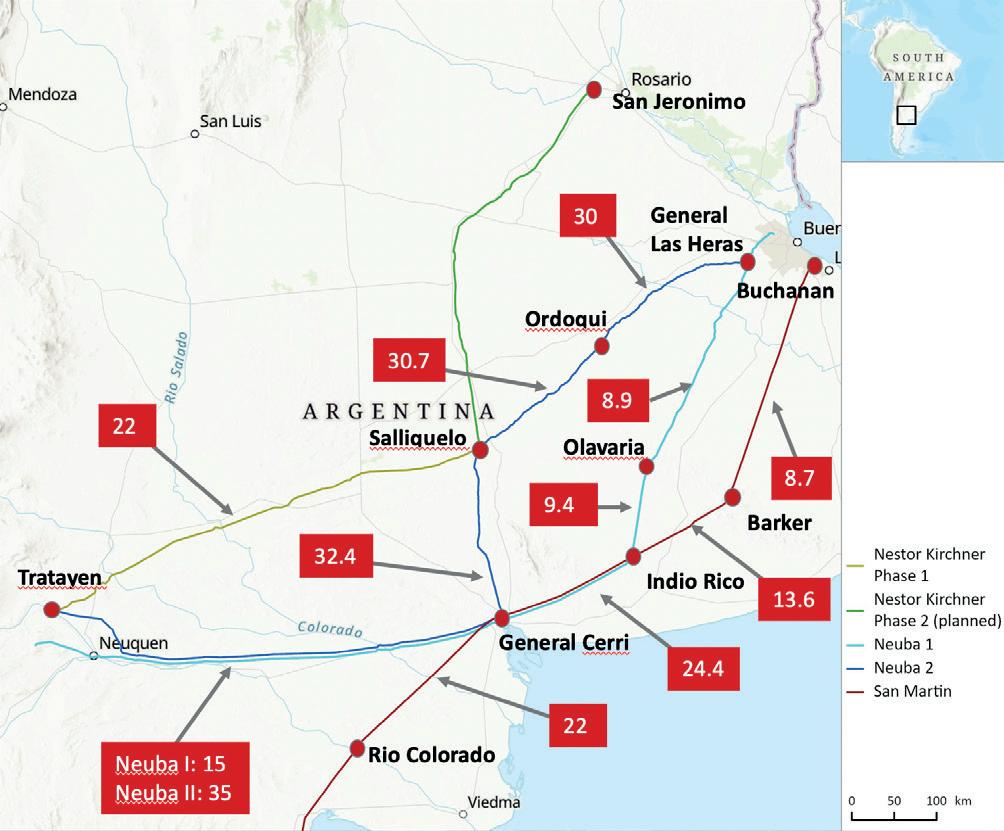
Argentina has two main gas transportation companies: Transportadora Gas del Norte (TGN) and Transportadora Gas del Sur (TGS). Argentina’s gas production dynamics have been changing in recent years as supply from conventional basins decreases while unconventional gas production from the Vaca Muerta shale play in the Neuquen Basin increases. Such is the importance of Neuquén to Argentina that three different routes connect it to the Buenos Aires region, where the main demand centres are located: the TGS and TGN networks and the recently renamed Francisco Pascasio Moreno pipeline (FPMGP, previously known as the Nestor Kirchner gas pipeline).
In October 2024, gas imports from Bolivia ceased as part of the Argentine government’s plan to increase domestic gas production and become self-sufficient in gas supply, while also exploring export opportunities.
Argentina has been exporting constant gas flows to Chile since October 2021 and has several gas pipelines along the entire border. Stating in the south, these supply the Magallanes region with a total capacity of 6.8 million m3/d that used to supply the regional methanol demand. Pipelines in the central region,
Figure 3. Overview of Argentina transmission pipelines.
Figure 1. Southcone pipeline grid.
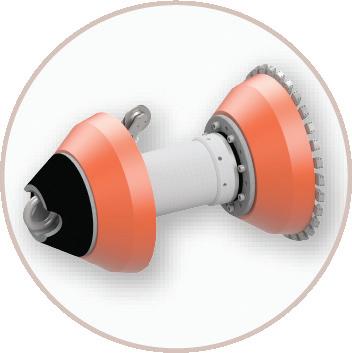
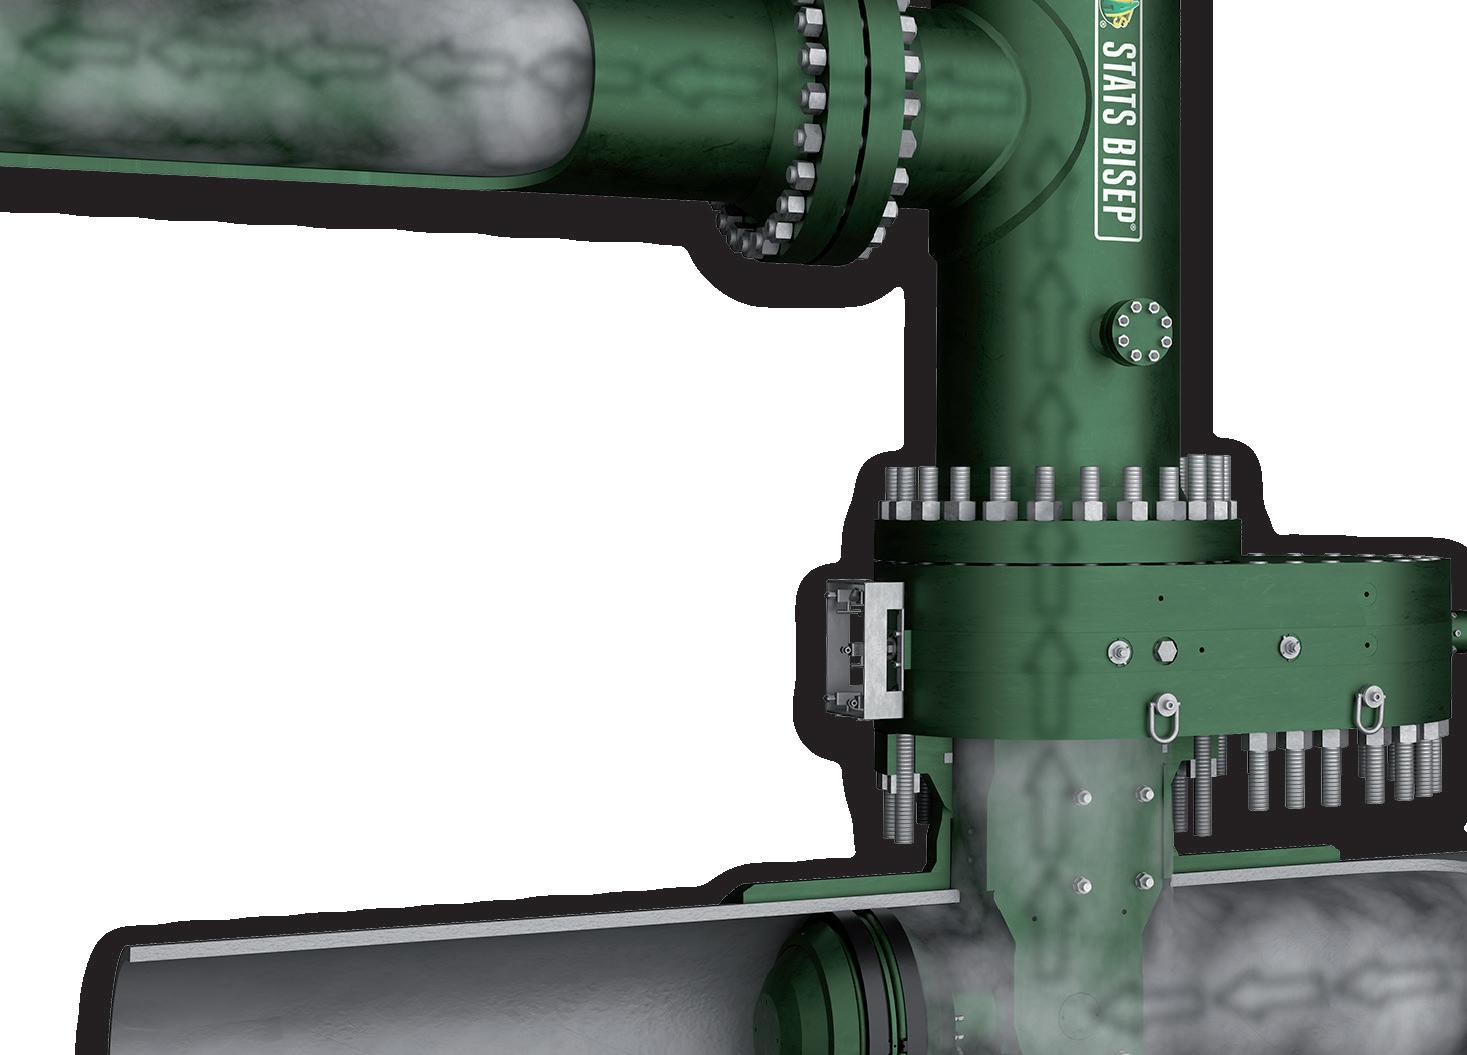
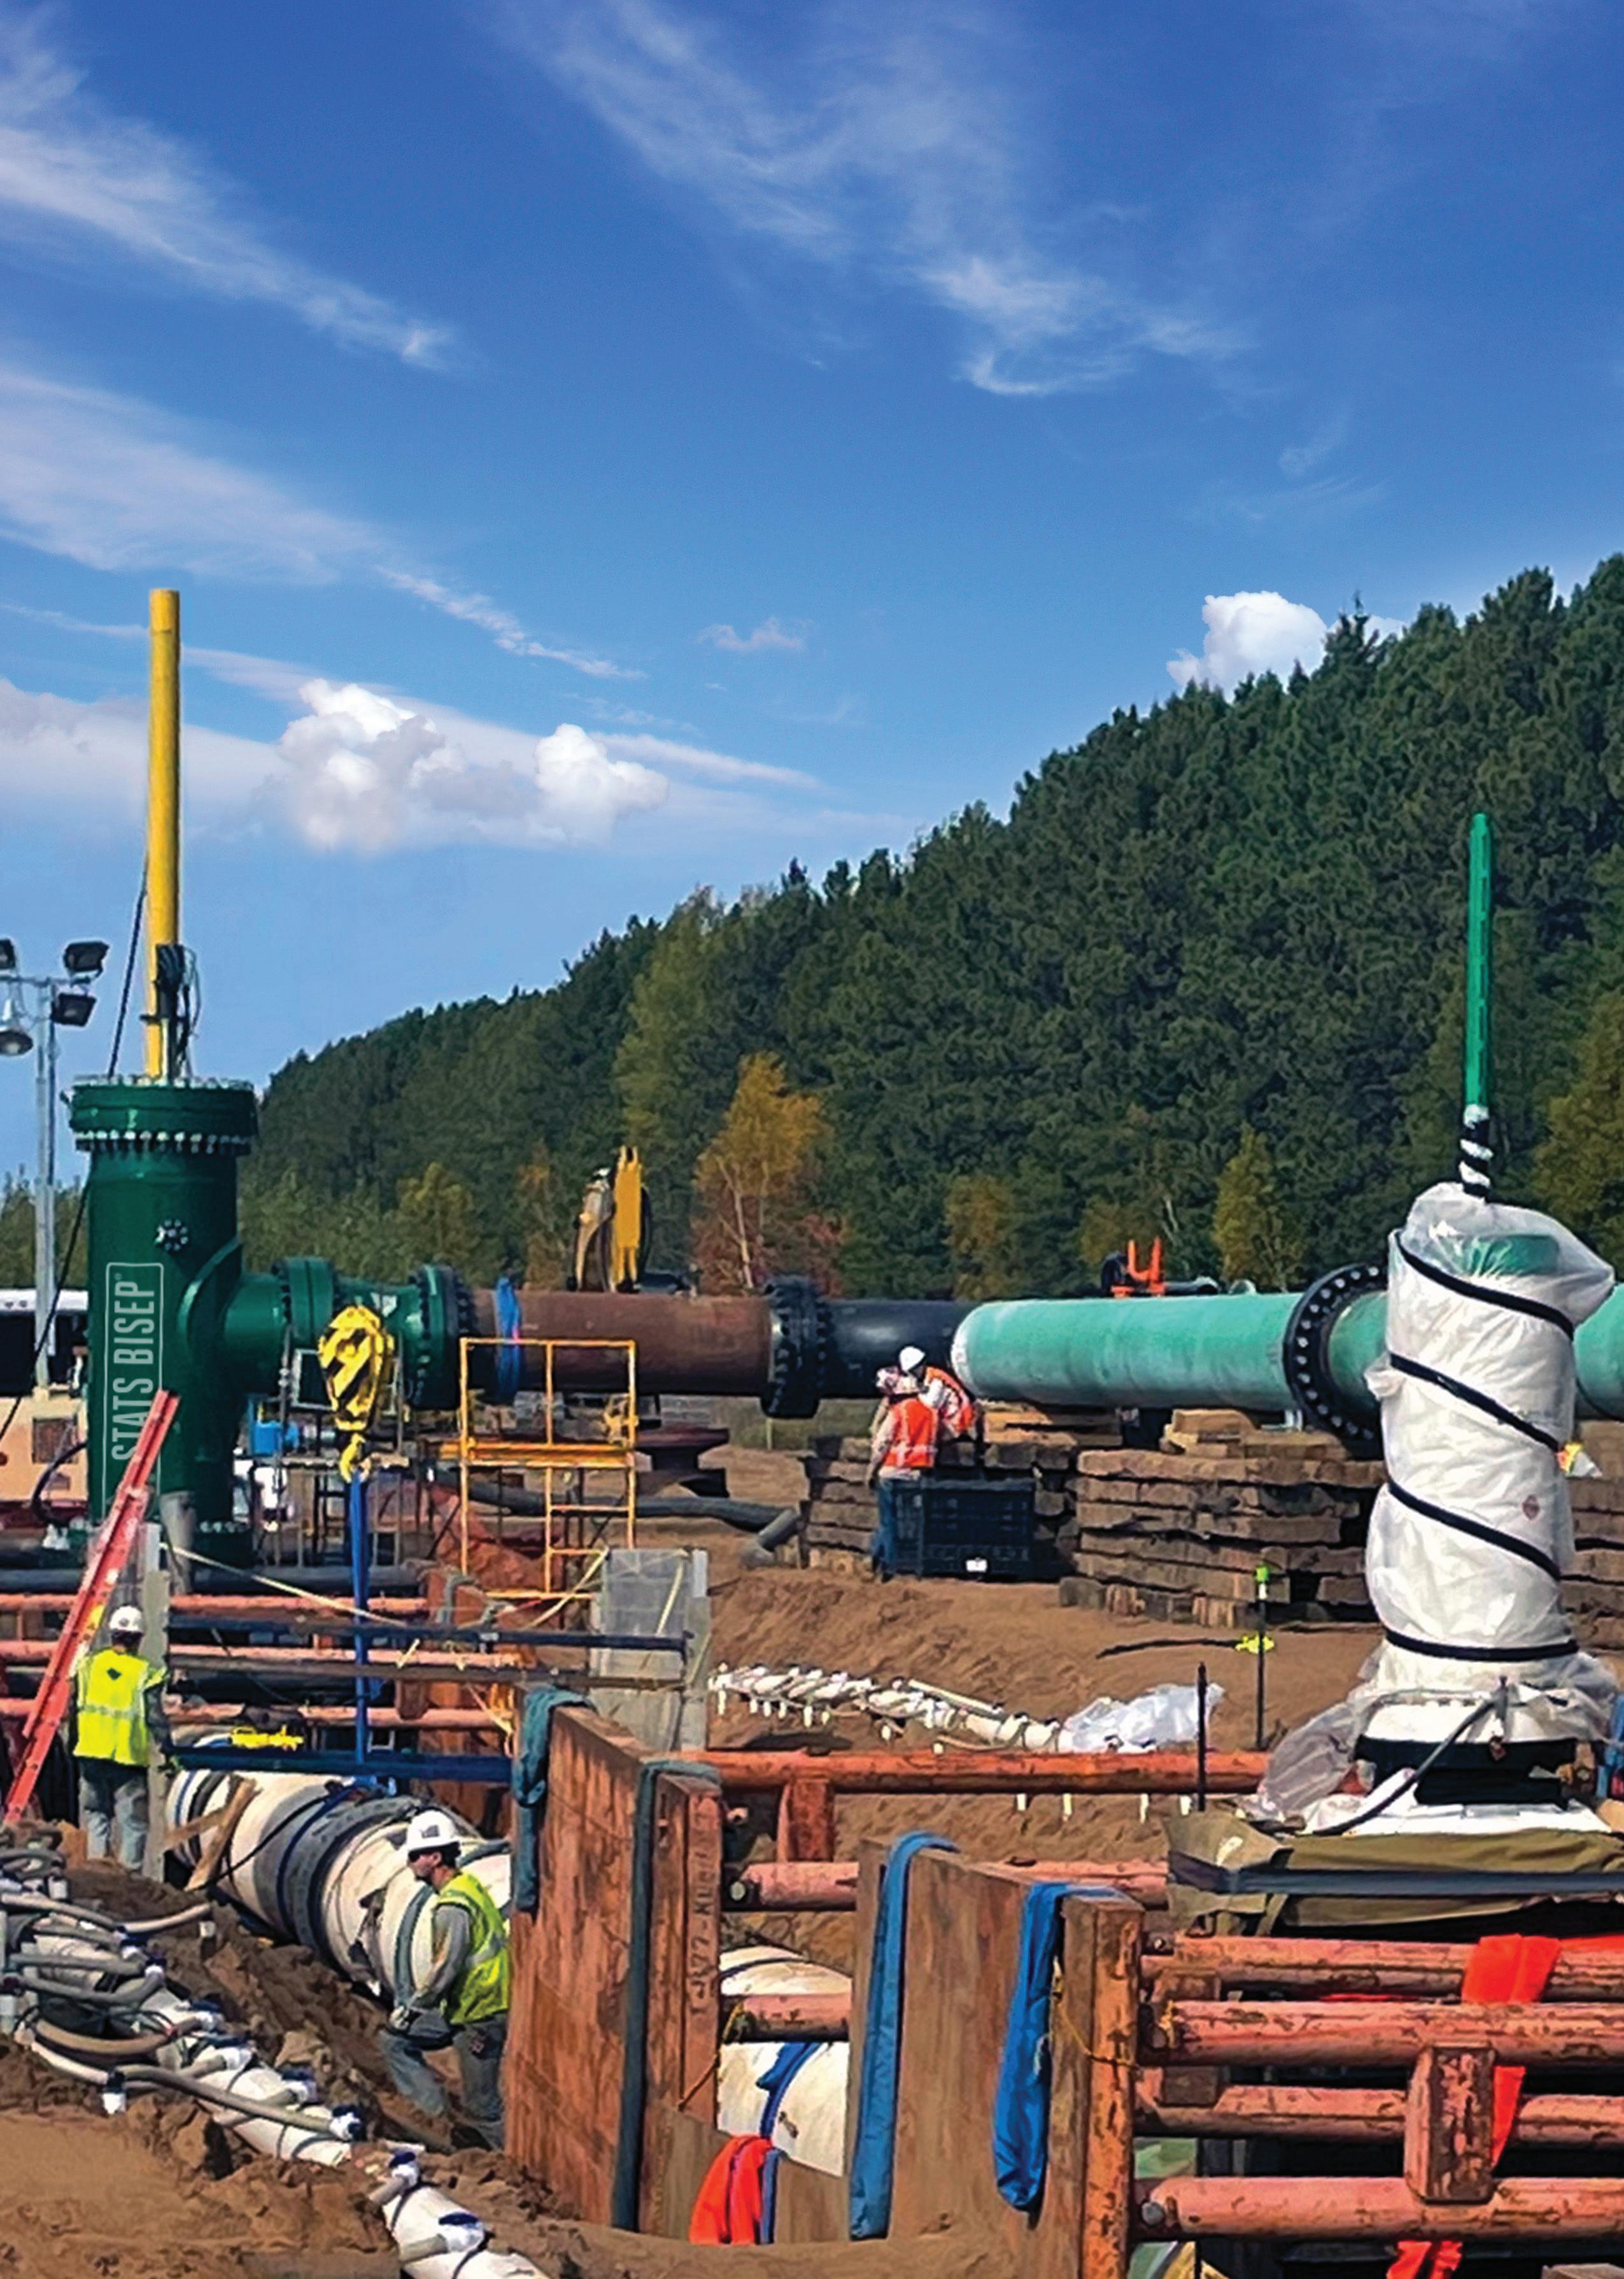
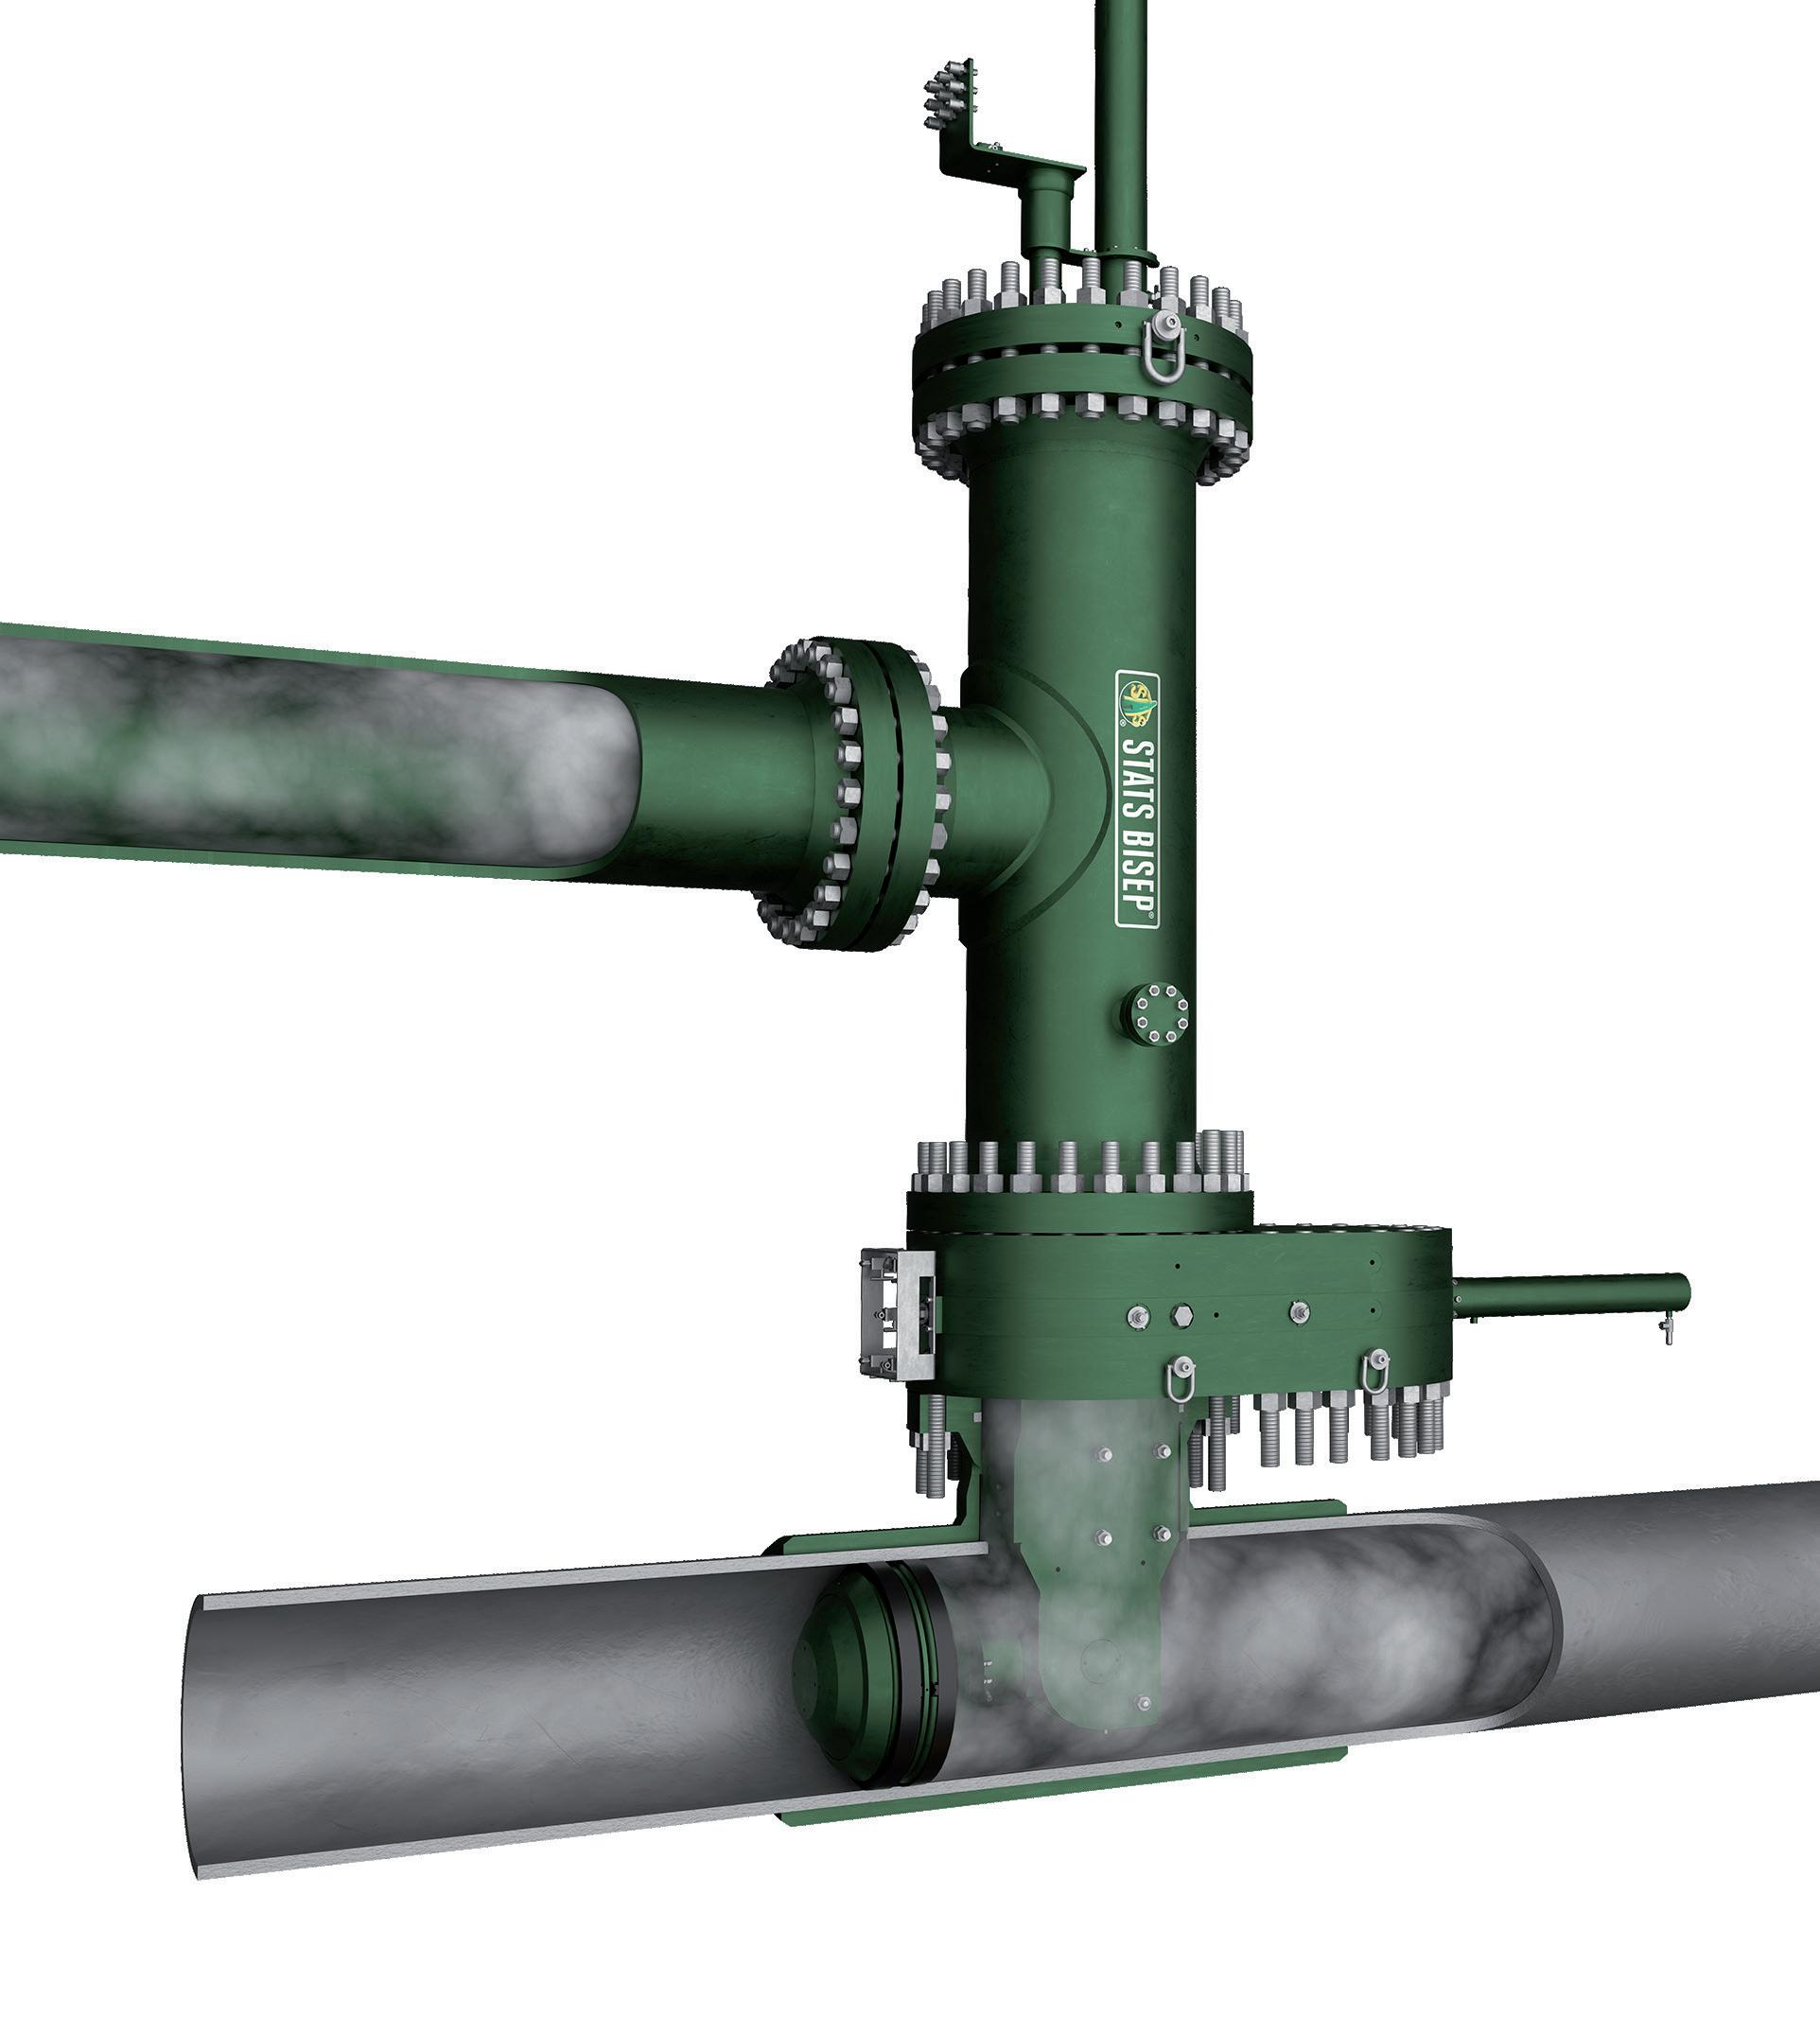
integrated bypass maintains production during isolation
Dual Leak-Tight Seals
Double Block & Bleed Isolation
Isolated Pipeline
Monitored Zero-Energy Zone
The BISEP® has an ex tensive track record and provides pioneering double block and bleed isolation while
dual seals provide tested, proven and fully monitored leak-tight isolation, ever y time, any pressure.
which has highest population density, provide a total capacity of 14.2 million m3/d. In the north, where there is strong demand from the mining and power sectors, the lines have supply capacity of 16.5 million m3/d. At the last G20 meeting, a memorandum was signed between Argentina and Brazil that established five possible gas-export routes between the two countries: ) Import through Bolivia, with the utilisation of Gasbol (BoliviaBrazil gas pipeline).
) Import through Paraguay, with the construction of a new gas pipeline through the Paraguayan Chaco.
) Direct interconnection between Brazil’s Rio Grande do Sul state and Argentina, through an expansion of existing pipelines from Uruguaiana.
) Interconnection between Rio Grande do Sul state and Uruguay through new pipelines.
) Imports of LNG which can supply other countries as well and are not limited to Brazil.
Argentina’s infrastructure for natural gas transportation was initially planned to guarantee the country’s energy sovereignty. In July last year, the FPMGP pipeline was inaugurated, connecting the Neuquén province to greater Buenos Aires and increasing takeaway capacity to 11 million m3/d, which allowed Argentina to reduce its gas imports.
The FPMGP, along with the northern gas pipeline reversion –which is now in the second phase to reverse its flows to the north – will allow gas left over from Buenos Aires and San Jeronimo to be transported to the northern part of Argentina, which has historically been reliant on imports from Bolivia.
Argentina’s latest announced pipeline projects are the new pipelines connecting Neuquén and Rio Negro province, where LNG export facilities are expected to be placed. Pan American Energy associated with Golar LNG should kick off Argentinian gas exports with a floating liquefaction facility utilising existing grid gas, while national oil company YPF is leading efforts to enable a project associated with the new pipelines. In total, three new pipelines of 40 million m3/d are planned. The execution of each will depend on Argentina’s success in finding offtakers for these planned export projects.
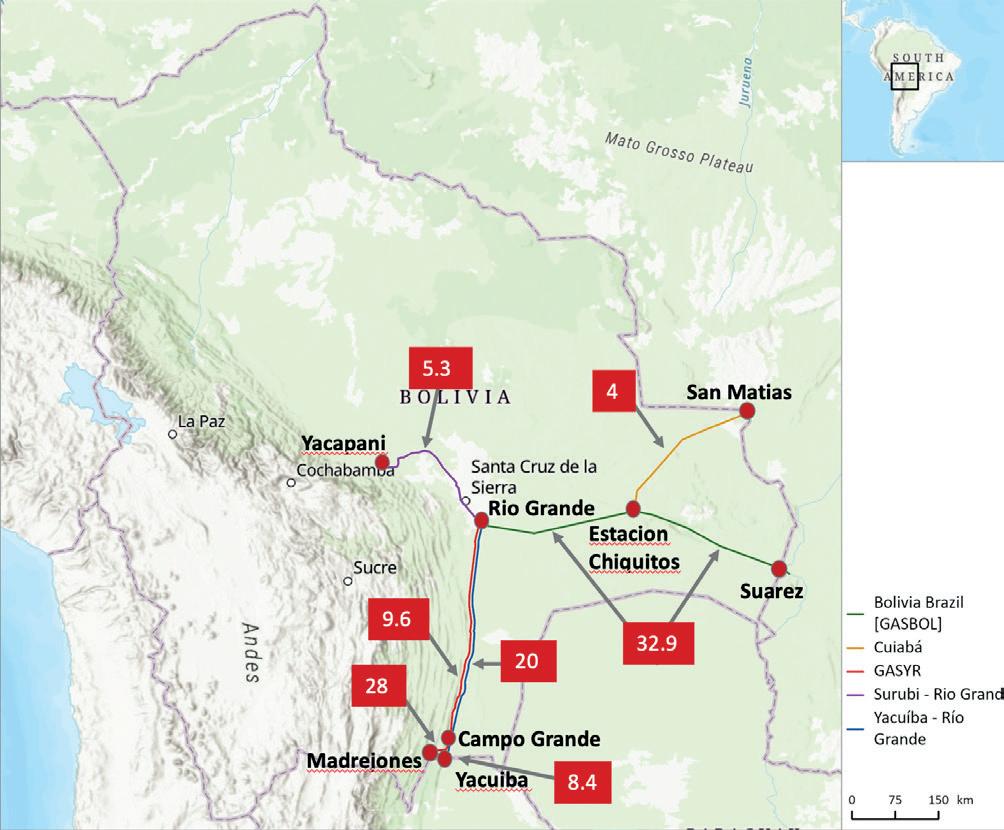
Bolivia’s transportation infrastructure is geared to exporting gas to neighbouring Brazil and Argentina. The main link is the 32.9 million m3/d Mato Grosso do Sul (Mutun-Corumba) pipeline to Brazil, with the smaller Mato Grosso link offering around 4 million m3/d of capacity. Bolivia connects to Argentina via the 28 million m3/d Yacuiba pipeline.
It is important to note that these three countries – Brazil, Argentina, and Bolivia – are connected not only via trade relations but also through infrastructure. This means that a gas-balancing decision made by one country inevitably ends up affecting the other two as well.
Note
All images courtesy of Rystad Energy research and analysis, Rystad Energy GIS Services.
Figure 5. Neuquén to Buenos Aires transmission pipelines (million m3/d).
Figure 6. Overview of Bolivian transmission pipelines (million m3/d).
Matteo Dondeo, Managing Director, Pipeline Business Solutions, Italy, explains how the midstream sector is transforming Argentina’s role in the global oil and gas market.
fter more than a decade of limited development in exploration and pipeline construction activities, the situation has been changing in the last few years in Argentina thanks to Vaca Muerta, which is considered the second-largest shale gas field and the fourth-largest shale oilfield in the relevant world rankings.
Several Argentinian governments in the past have focused resources to this huge field (whose area is almost equivalent to the surface of Belgium) with the result of a massive bump in exploration and production – almost 2200 wells and construction projects for the whole upstream transport infrastructure –needed to enhance the maximum potential of the oilfield.
Here, hundreds of kilometres of flowlines, treatment and compressor plants and pipelines (among other infrastructure projects) have been completed (or are currently under construction) – together with the development of the first LNG terminal, Argentina is set to become the leading country in South America for the oil and gas sector.
Development on this existing network aims to cover the increasing need of both the Argentinian population and its industries to export oil and natural gas on the global market.
Project framework
The first step to achieve these goals was the field expansion – implemented thanks to a massive drilling campaign that has led to an increase in the natural gas production managed by new flowlines and trunkline, treatment plants and other dedicated facilities. In this new era for Vaca Muerta, the most important player is Sacde (Sociedad Argentina de Construcción y Desarrollo), present in the entire value chain of the requested infrastructure, including the compressor station located in Tratayen, part of the new GPNK transportation system.
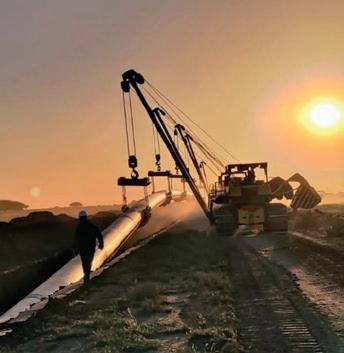
With that foundation, the following step was the construction of the President Nestor Kirchner Gas pipeline (known as GPNK, Gasoducto Presidente Nestor Kirchner in Spanish) – since the beginning, the aim was to have the line completed within the following winter, giving a time frame of less than one year to complete the most challenging project of this type over the last few decades in the country.
This pipeline stretches from the heart of Vaca Muerta Gas Field in the Neuquen province for 560 km towards the existing TGS Gas System, increasing its capacity by 22 million m 3 /d. It also includes two new compressor stations (one of them aforementioned) to boost natural gas in the new pipeline. The main companies to take on this responsibility were the JV Sacde – Techint and BTU for the pipeline, Sacde for Tratayen Compressor Stations and Contreras Hermanos for Salliquelo Compressor Stations.
The pipeline was the largest project of its kind in the last 40 years in Argentina and was developed in a record time span of 10 months by a 50/50 joint venture (JV) between Sacde and Techint, taking care of all the EPC (Engineering, Procurement and Construction) aspects of the project.
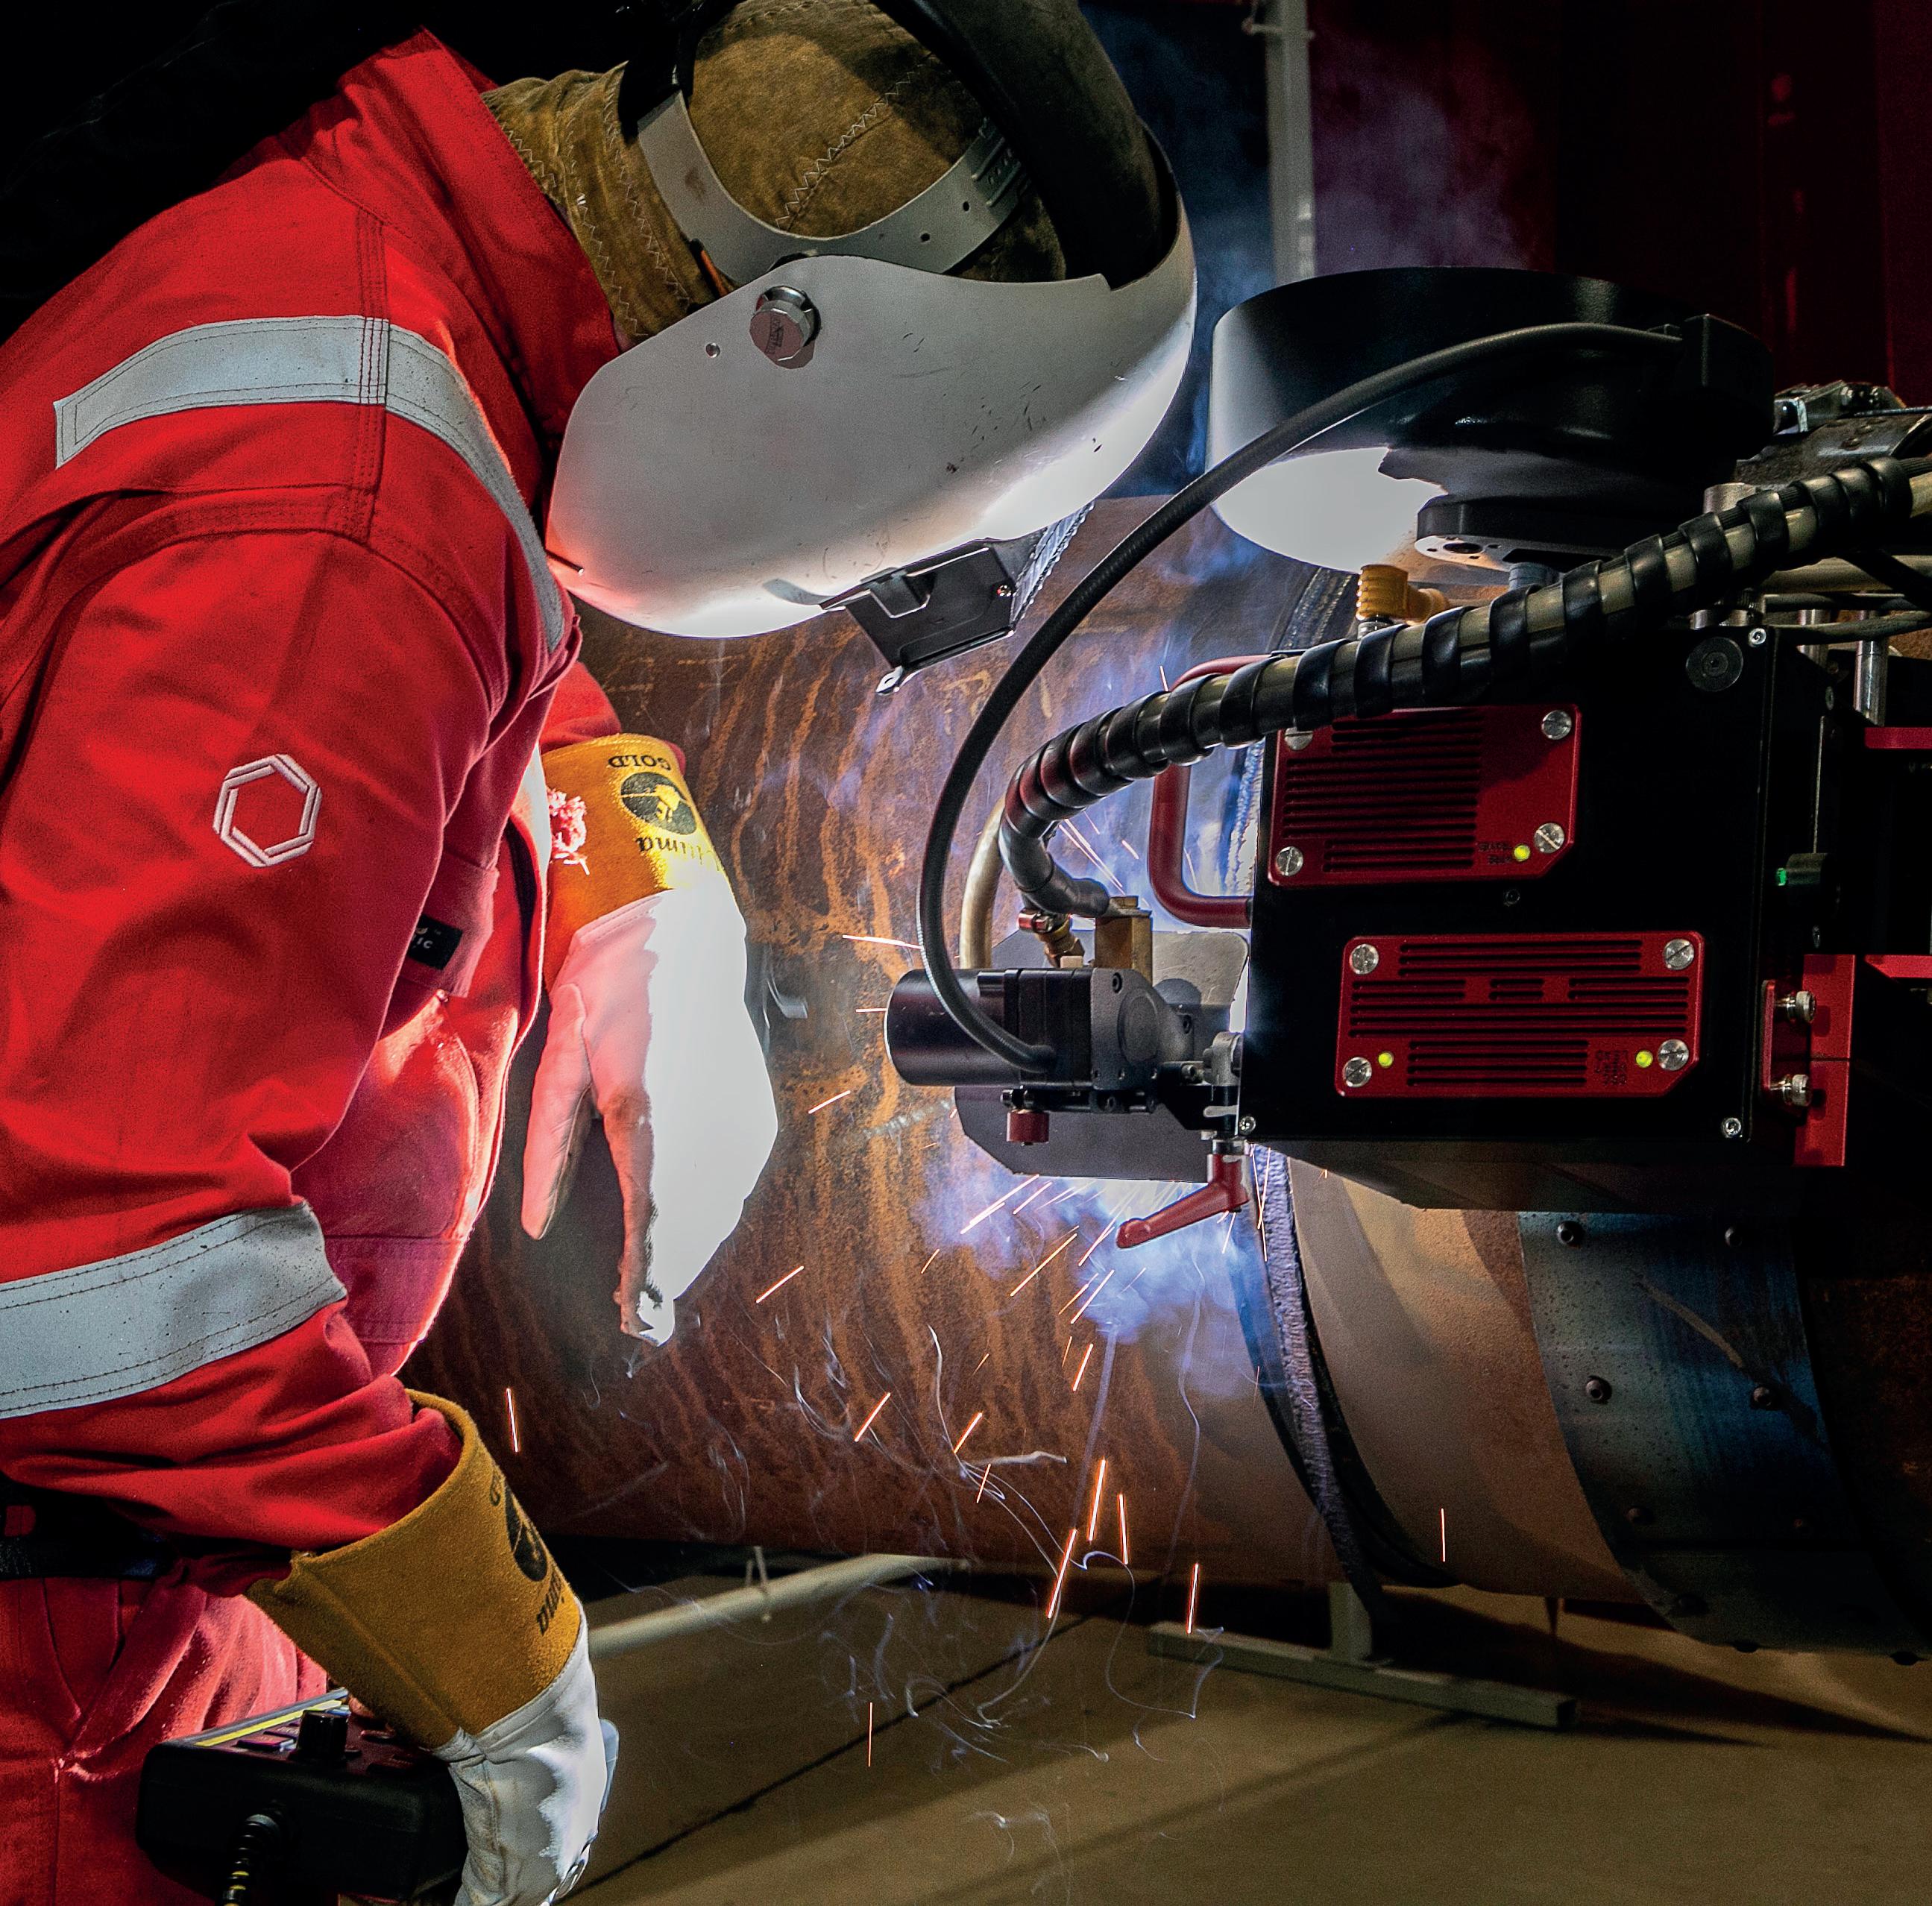
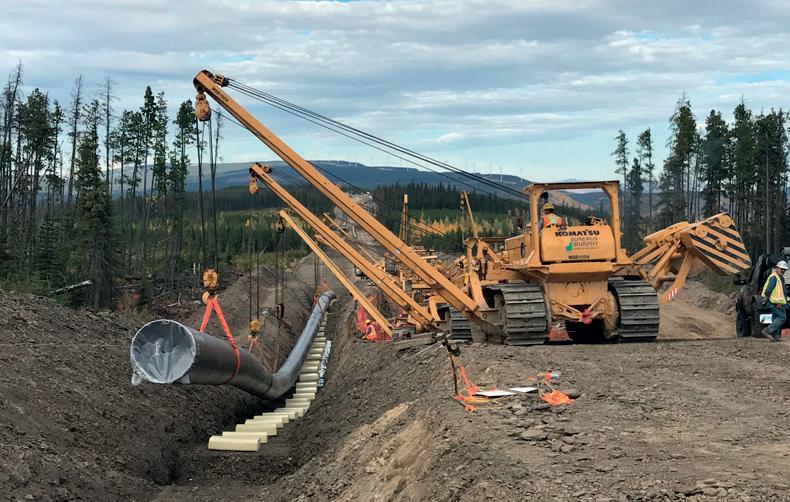
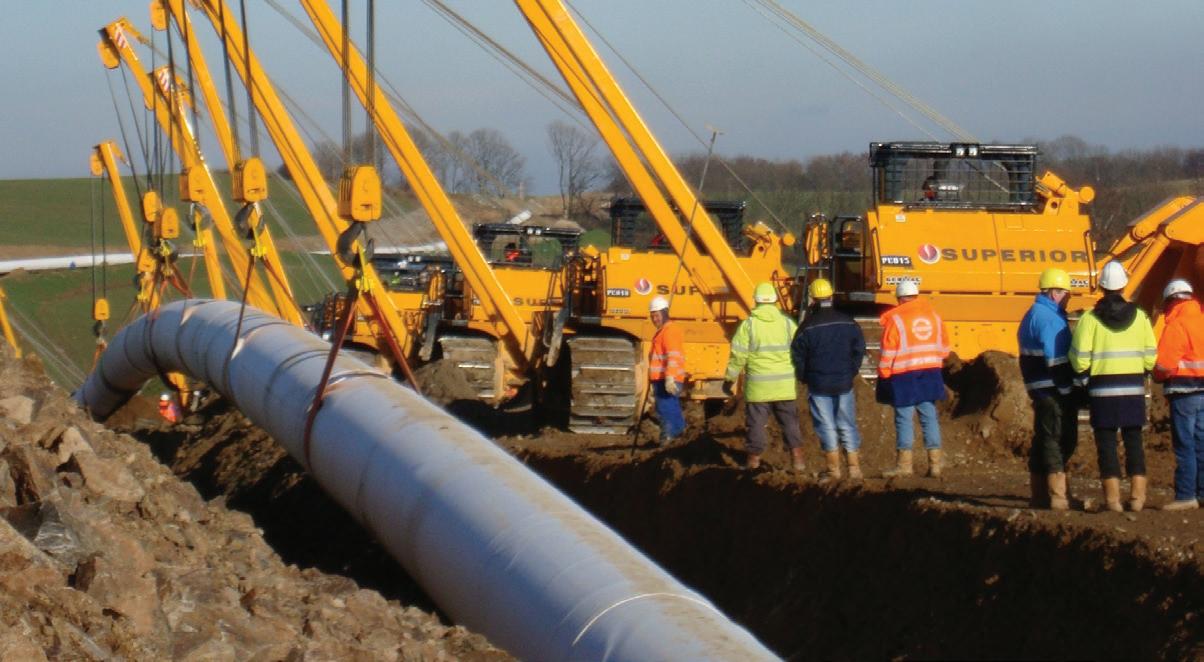
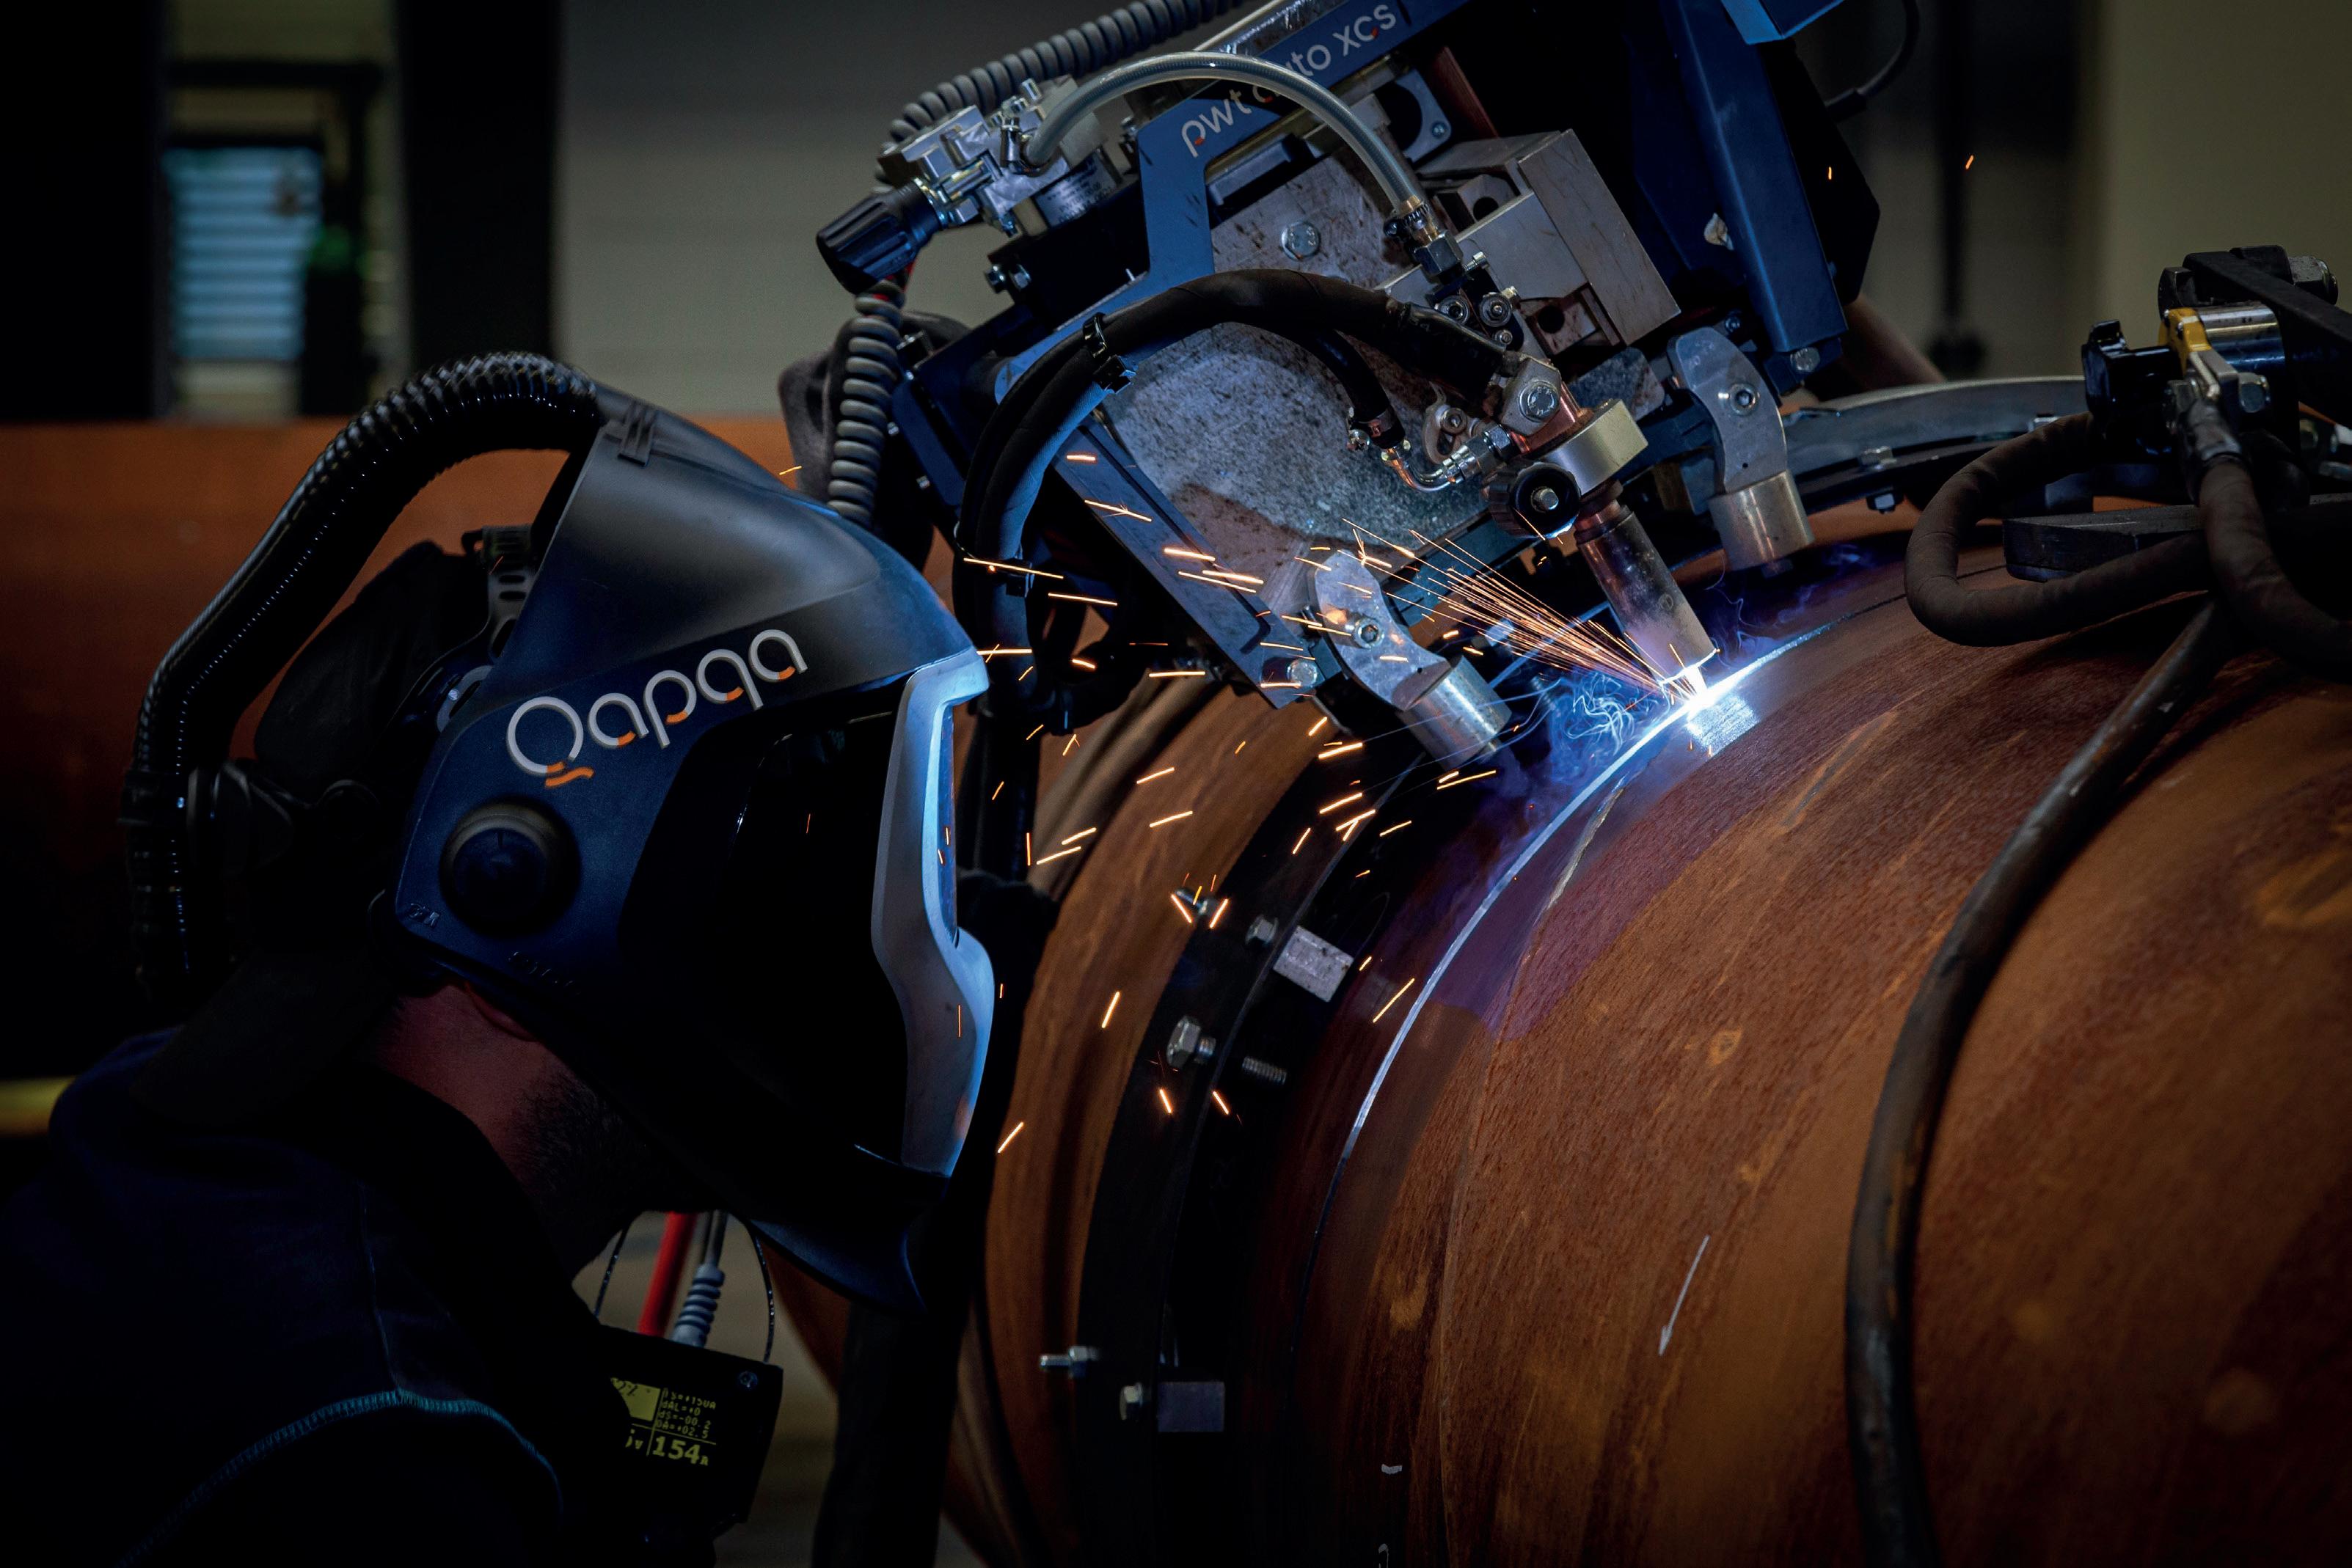
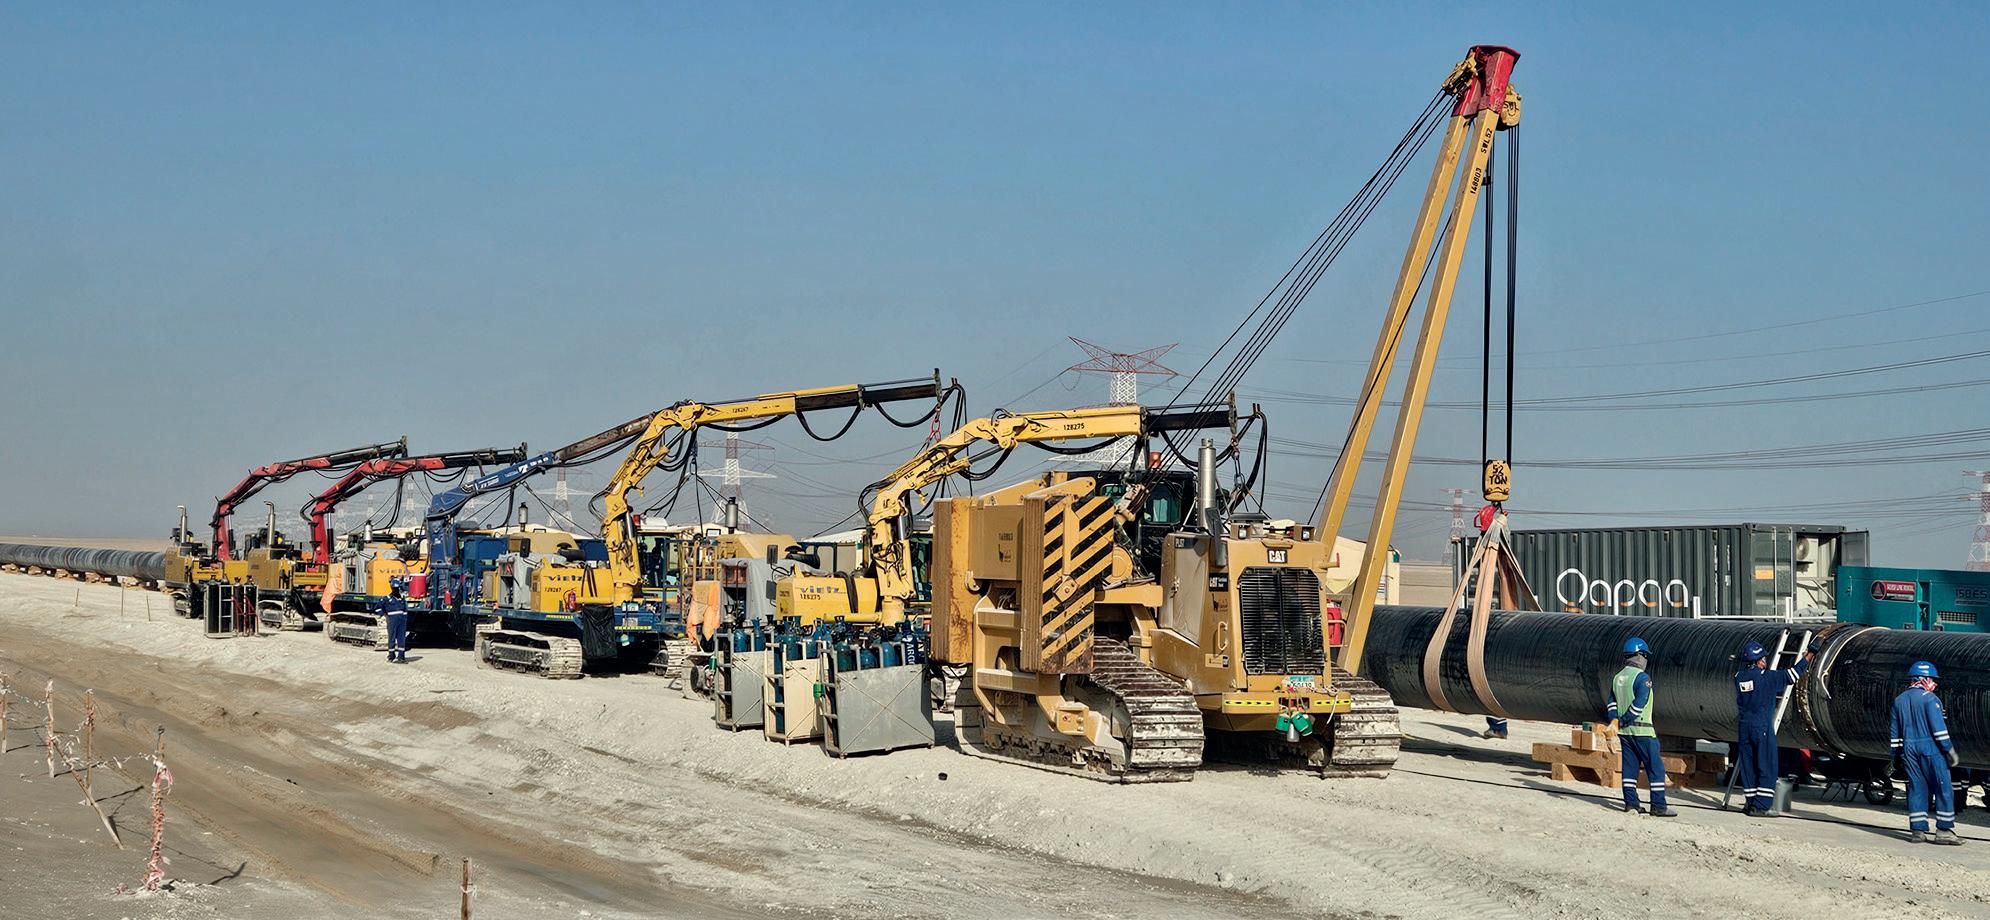
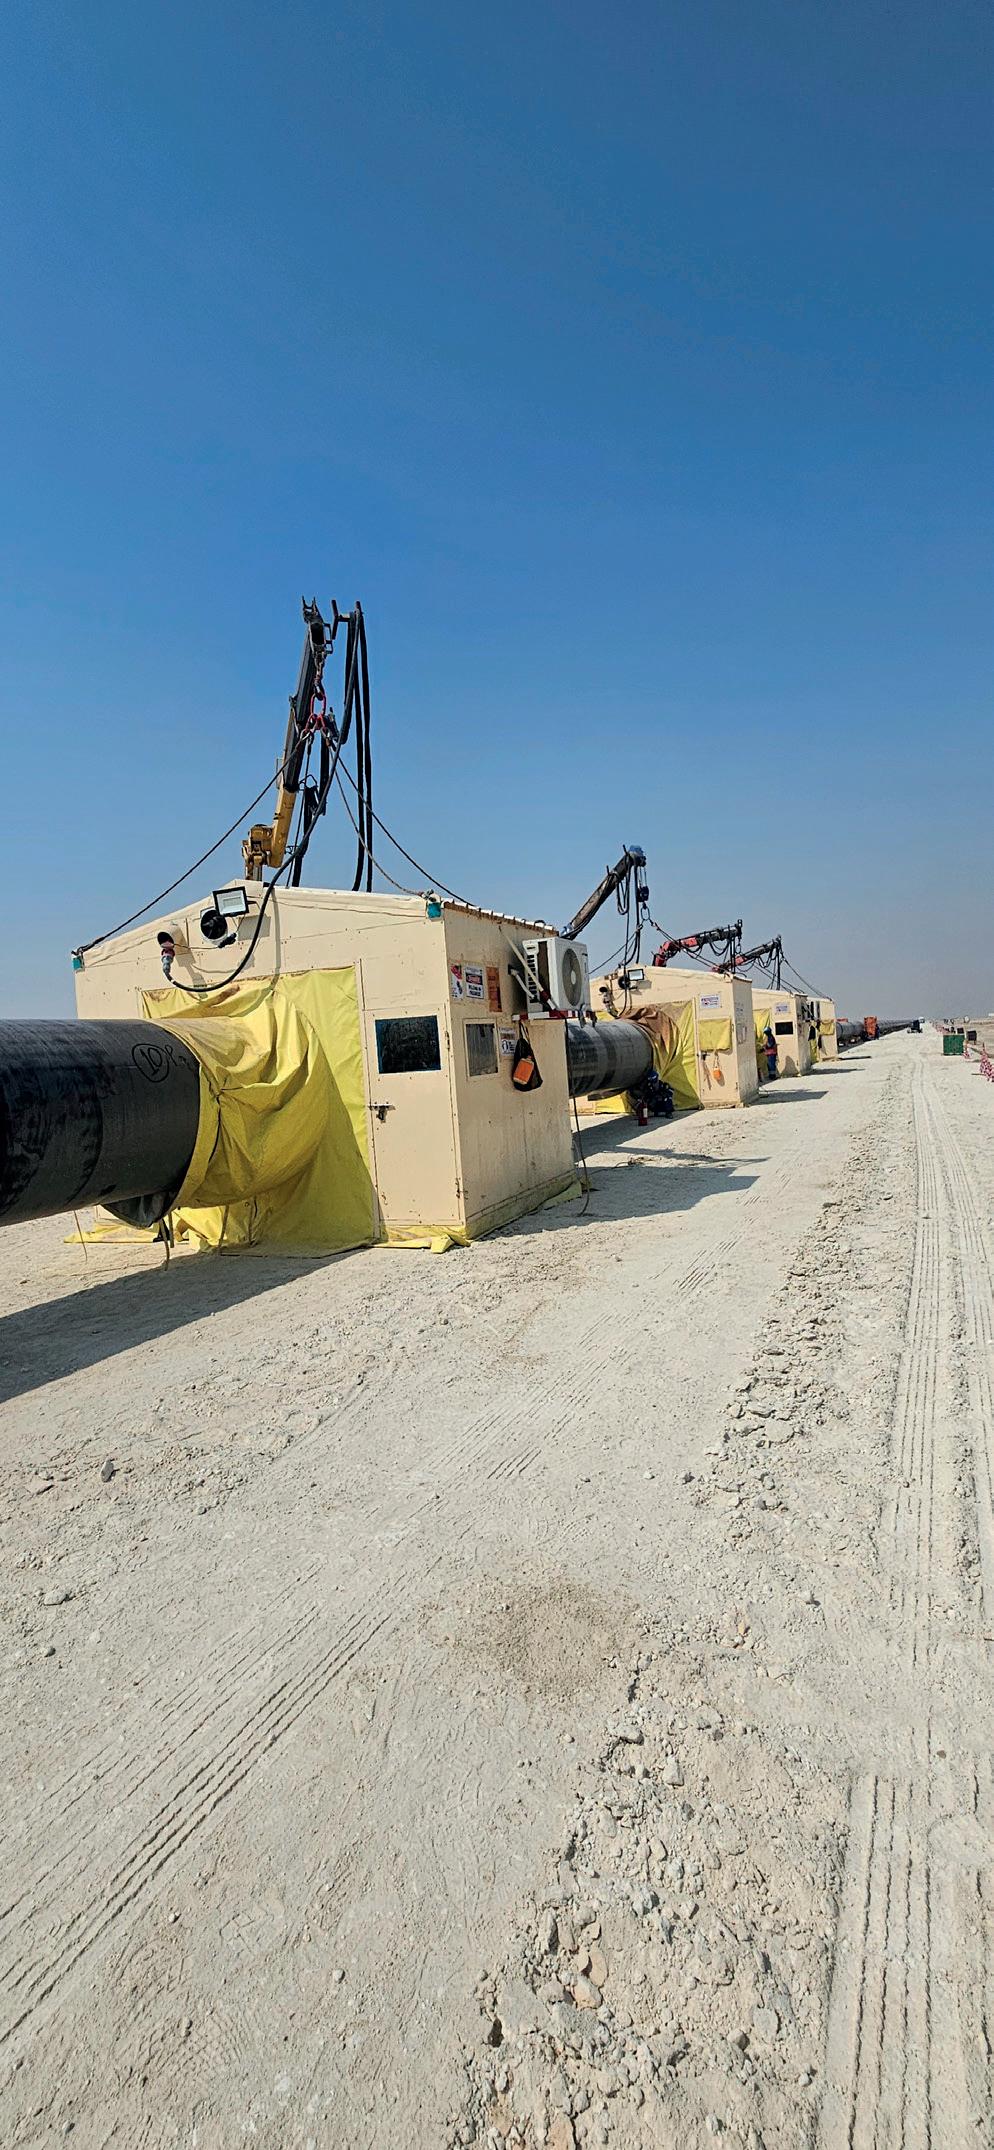
Sacde Head of Oil and Gas Business Unit, Carlos Coletto, explains the challenges faced and solutions put in place by the JV project team to complete the construction of the pipeline within the given schedule: “To achieve the completion of 440 km of 36 in. pipeline as a JV we decided to rely on the best available technologies on the market for all the construction phases of the line starting from automatic welding (to give the requested production of 100 joints per day on average), to AUT inspection to have the warranty of high quality welds, to the latest European technologies in terms of heavy equipment for pipelaying, bending, backfilling, etc… and cutting edge equipment for HDD crossing and special sections. Today the GPNK
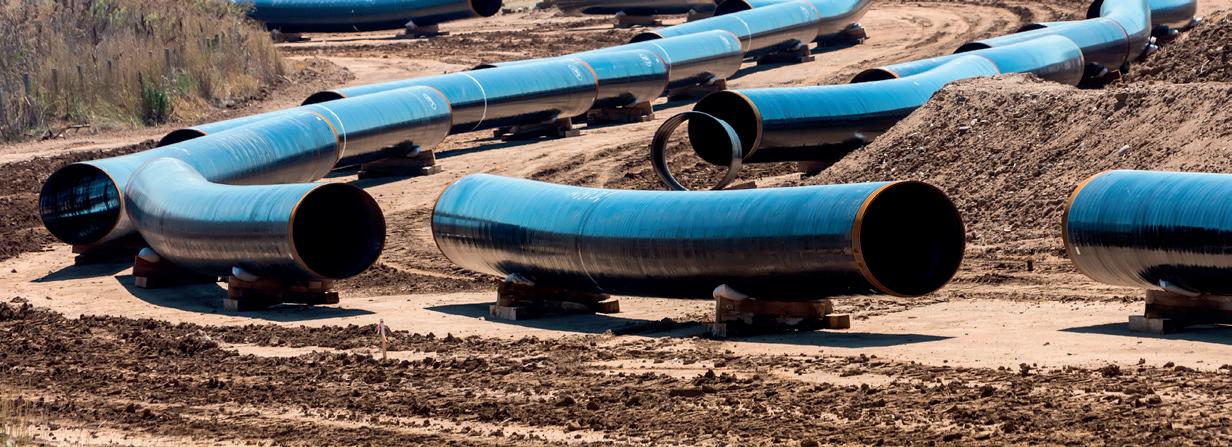
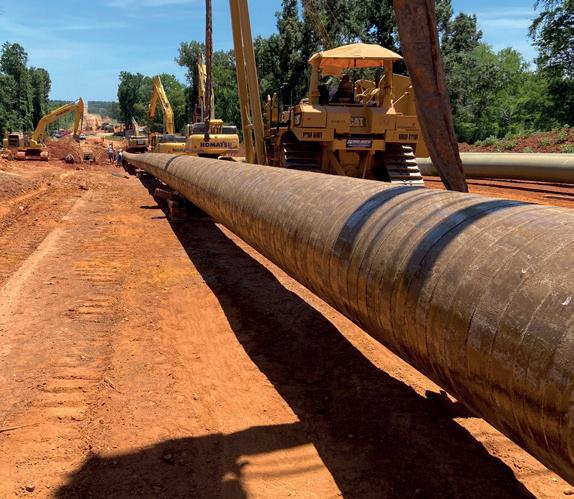
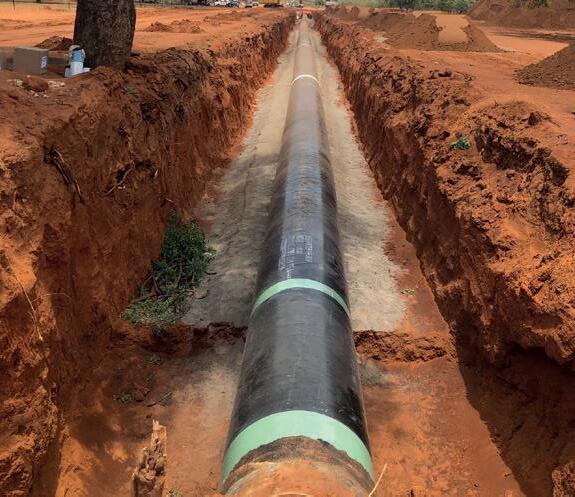
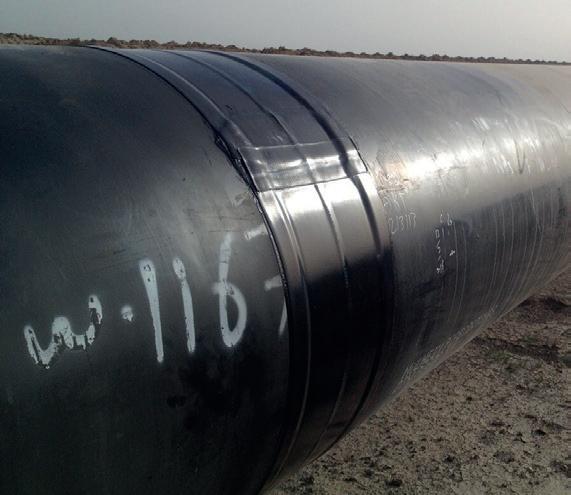
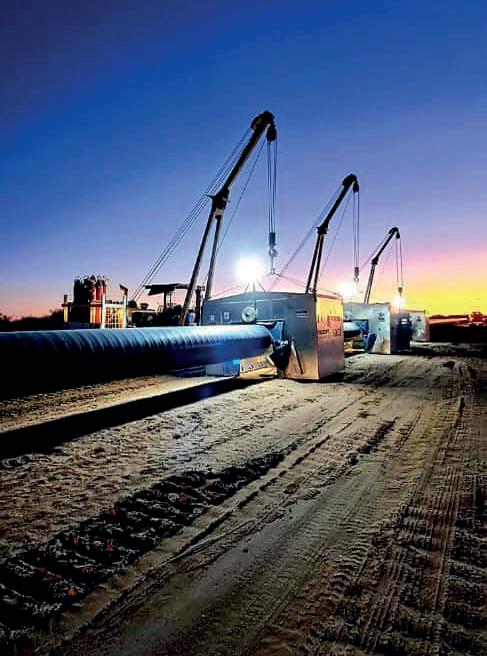
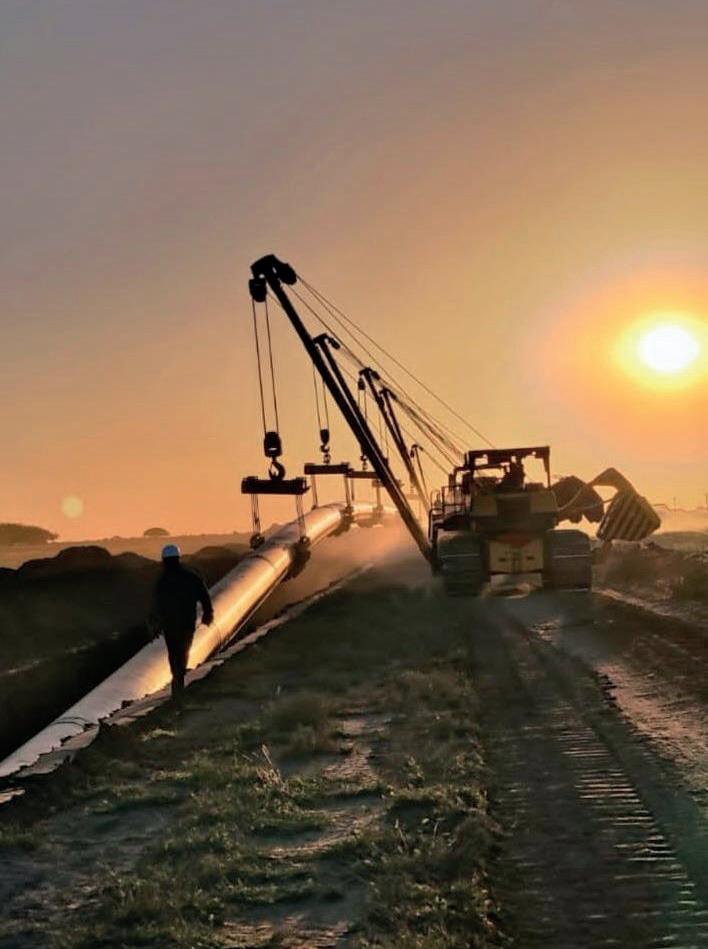
Figure 2. Laydown of the pipeline.
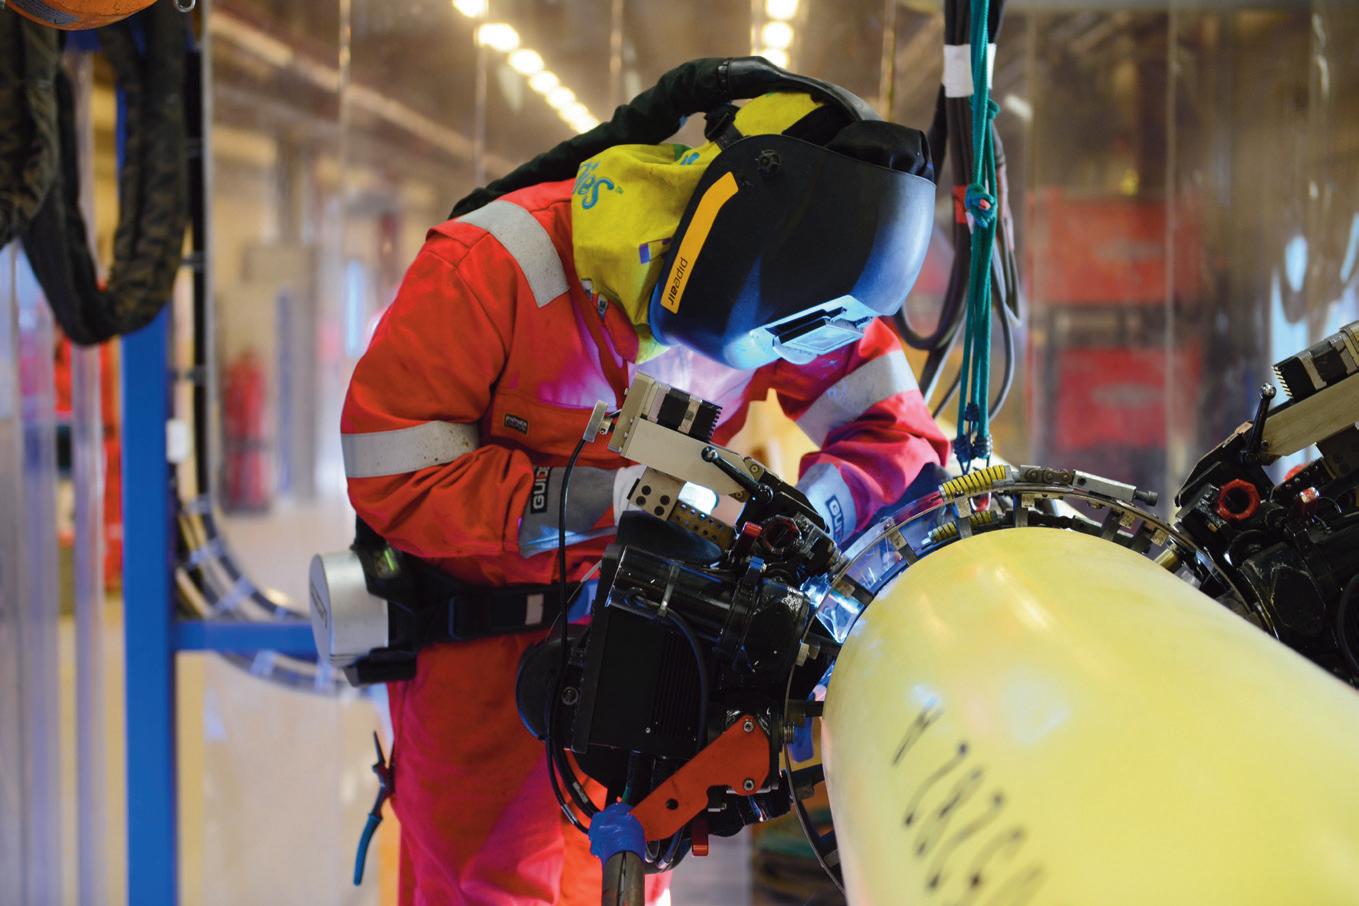
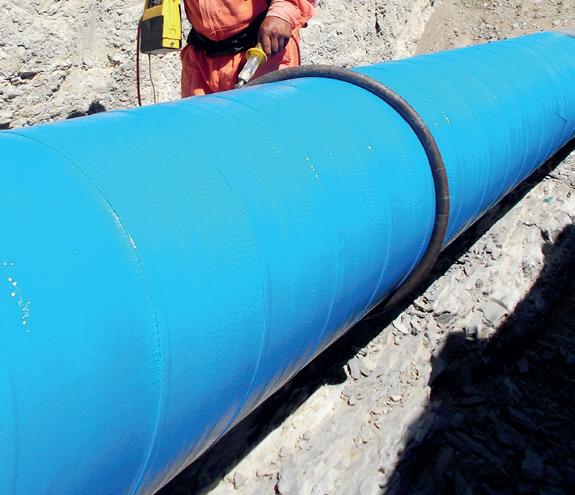
Figure 1. Mainline welding activities along the GPNK.
represents the most challenging and successful example of pipeline project in our region and we all so proud of the work done.”
Also in a side project related to this network expansion, the same JV team along with the same consolidated strategy, recently completed the ‘Reversion Gasoducto Norte’ gas pipeline, once again configured as a fast track
project: with the same proven site organisation used in the GPNK, it has been possible to improve the schedule and mark a new record, at least in the region, welding 151 joints in a single duty on a 36 in. diameter double jointed pipe of 24 m of length.
The key of the success was to execute this critical activity with the same strategic allies that they had in the GPNK such as CRC Evans (Automatic Welding System) and SCI (Automatic Ultrasonic Testing), among others.
Not only is natural gas important in Vaca Muerta, but since 2023 the infrastructure dedicated to crude oil has started its development to increase the relevant evacuation capacity. The JV Sacde – Techint is currently constructing a new 256 km pipeline with diameters of 24 in. and 30 in. between Vaca Muerta and Bahia Blanca (with an existing terminal at the south of Buenos Aires province) with the objective of doubling the capacity of oil pipelines for export abroad.
The second phase
What has been done up to today basically completes the first phase of the plan dedicated to natural gas, the premise for the second phase that focuses more on the crude oil infrastructure.
YPF (Yacimientos Petrolíferos Fiscales) launched a bid process for Vaca Muerta Oil Sur of 437 km and 30 in. of diameter connecting Vaca Muerta to Punta Colorada (Rio Negro province), where YPF will have ready a terminal and a port facility to export between 390 000 and 500 000 bbls to the market.
Following the positive wave of public investment in the oilfield, private companies are also considering investing in this project, as in the case of TGS (Transportadora Gas del Sur), a private company owned by Pampa Energy, that presented a plan for extra improvements to GPNK’s capacity to the Ministry of Energy. The proposed solution foresees a financed EPC project for the construction of three brand new compression plants supported by 20 km of pipeline loops and increases to the system’s capacity by empowering three other existing compression plants.
Strengthening the network with this solution will allow the perforation of 20 new wells which will deliver an additional 14 million m 3 of natural gas: enough to cut imports of LNG and gas oil from abroad necessary for domestic heating during winter time.
In fact, the pipelines and infrastructure developed up to now are the initial stage of a much wider development plan to position Argentina as the primary exporter of crude oil and natural gas in Latin America. Connections with Bolivia, Chile, and Brazil via cross country pipelines, as well as potential framework contracts with the rest of the world, being able to reach markets such as China, Europe and the US through the new LNG terminal, are giving a huge impulse to the industry. In the next five years, in order to launch and complete all of these foreseen projects, Argentina will become one of the focal points of the global oil and gas market.
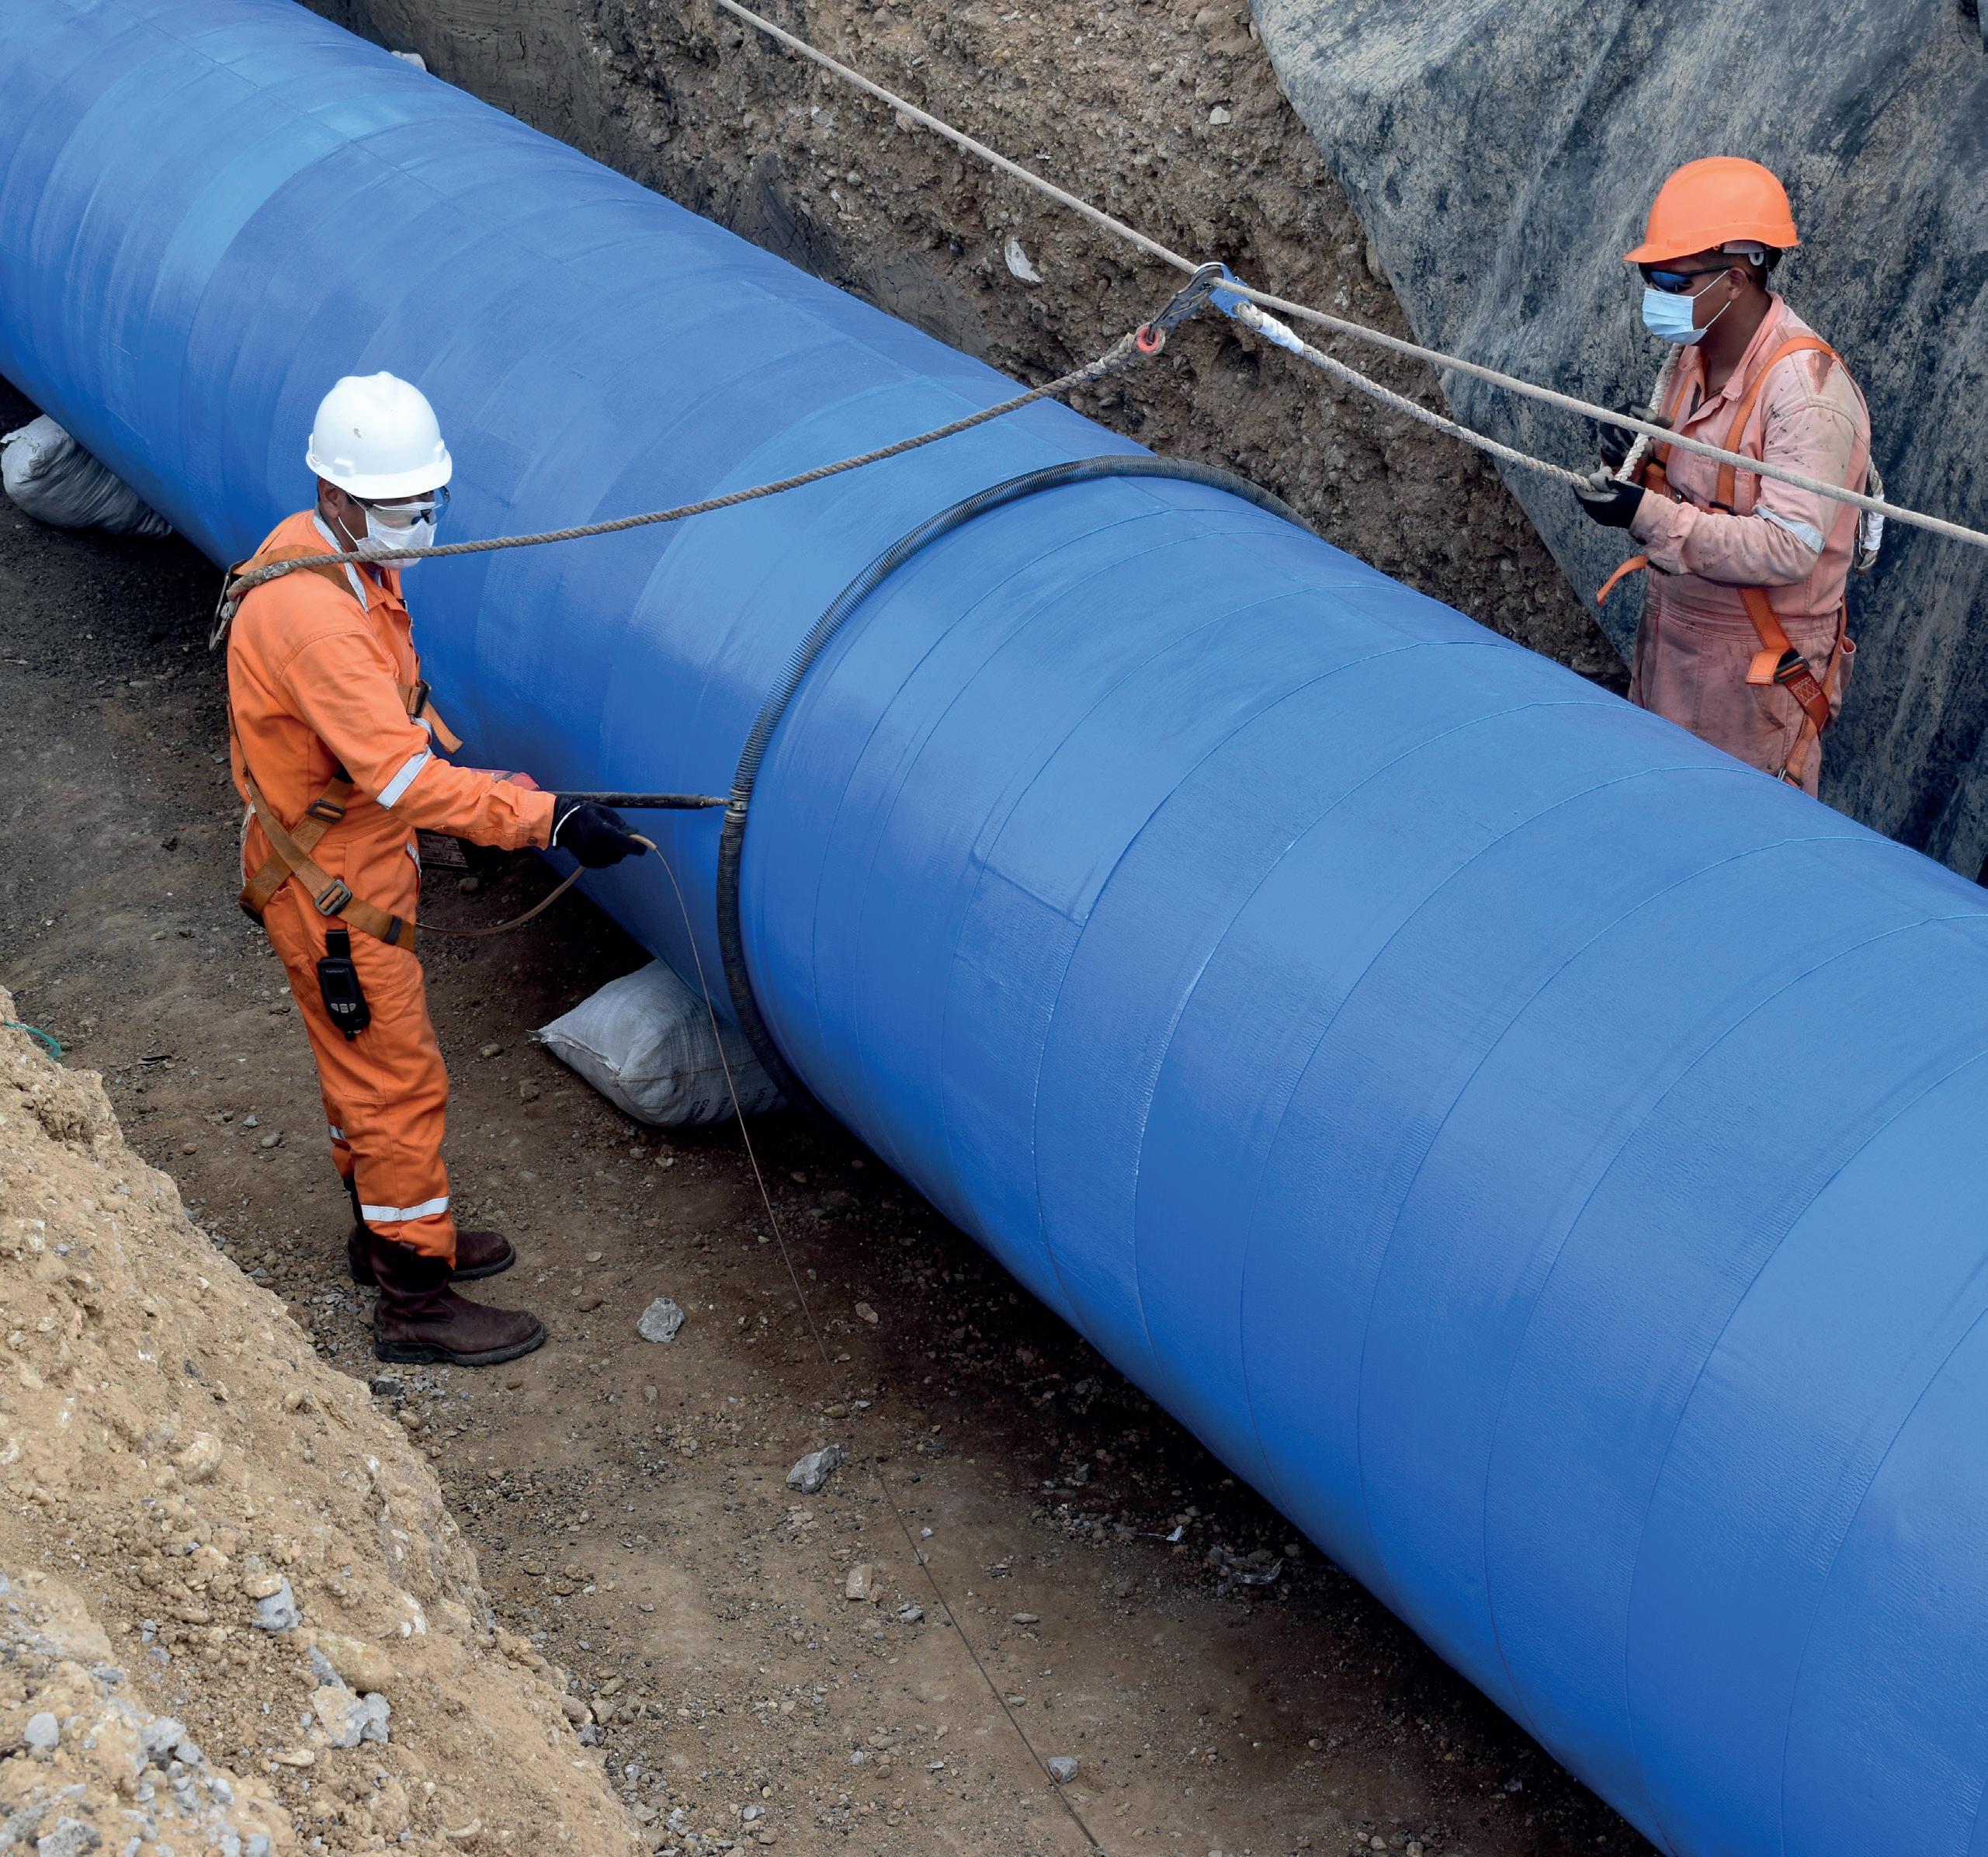
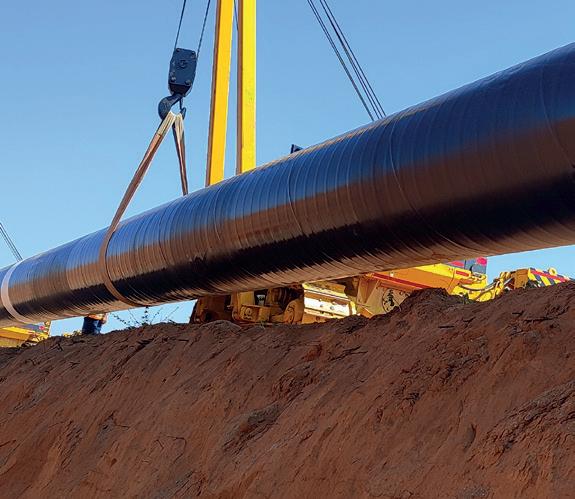
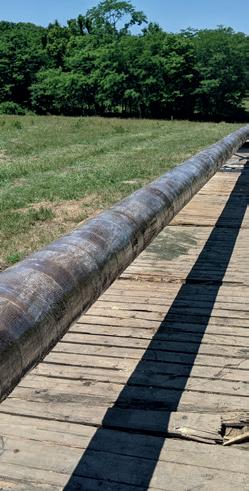
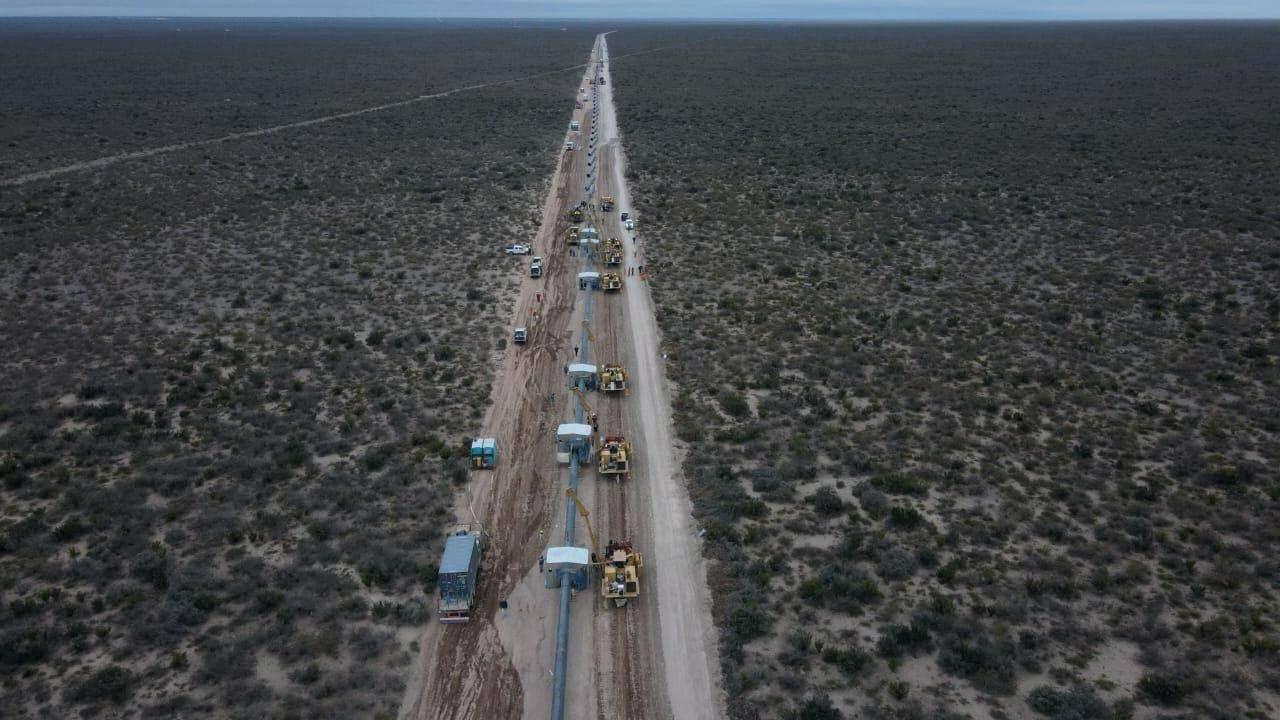
Figure 3. Aerial view of the pipeline in the Argentinian Pampa.
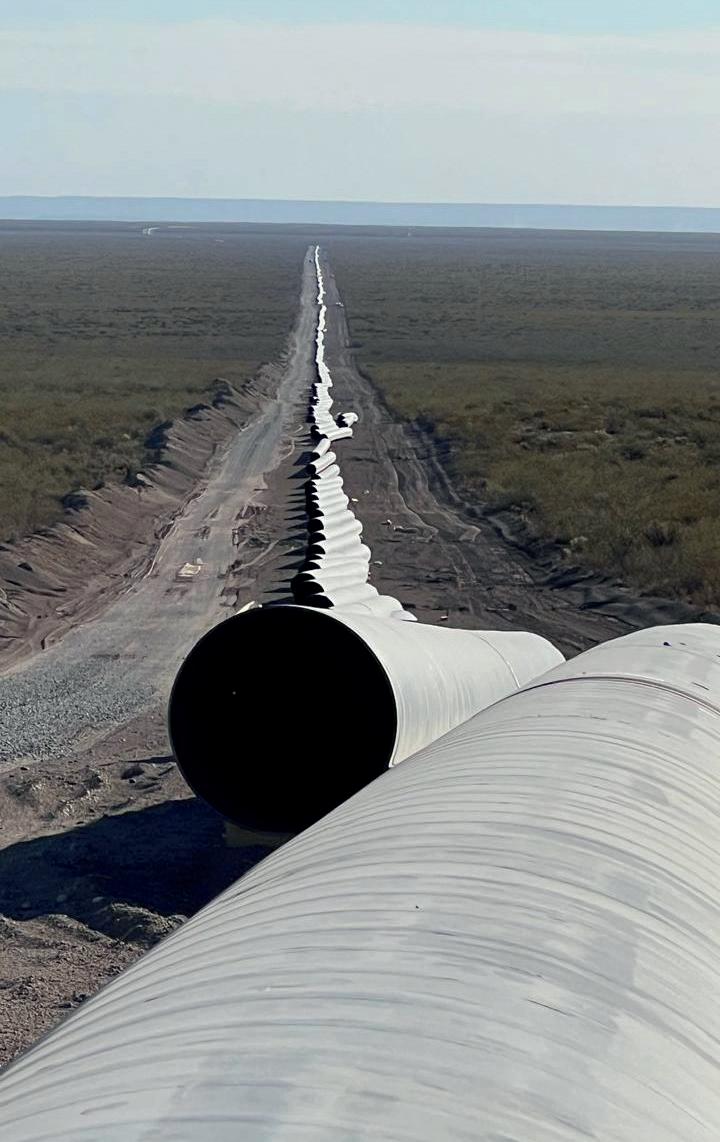
Figure 4. Hundreds of line pipes stringed and ready along the GPNK right-of-way.
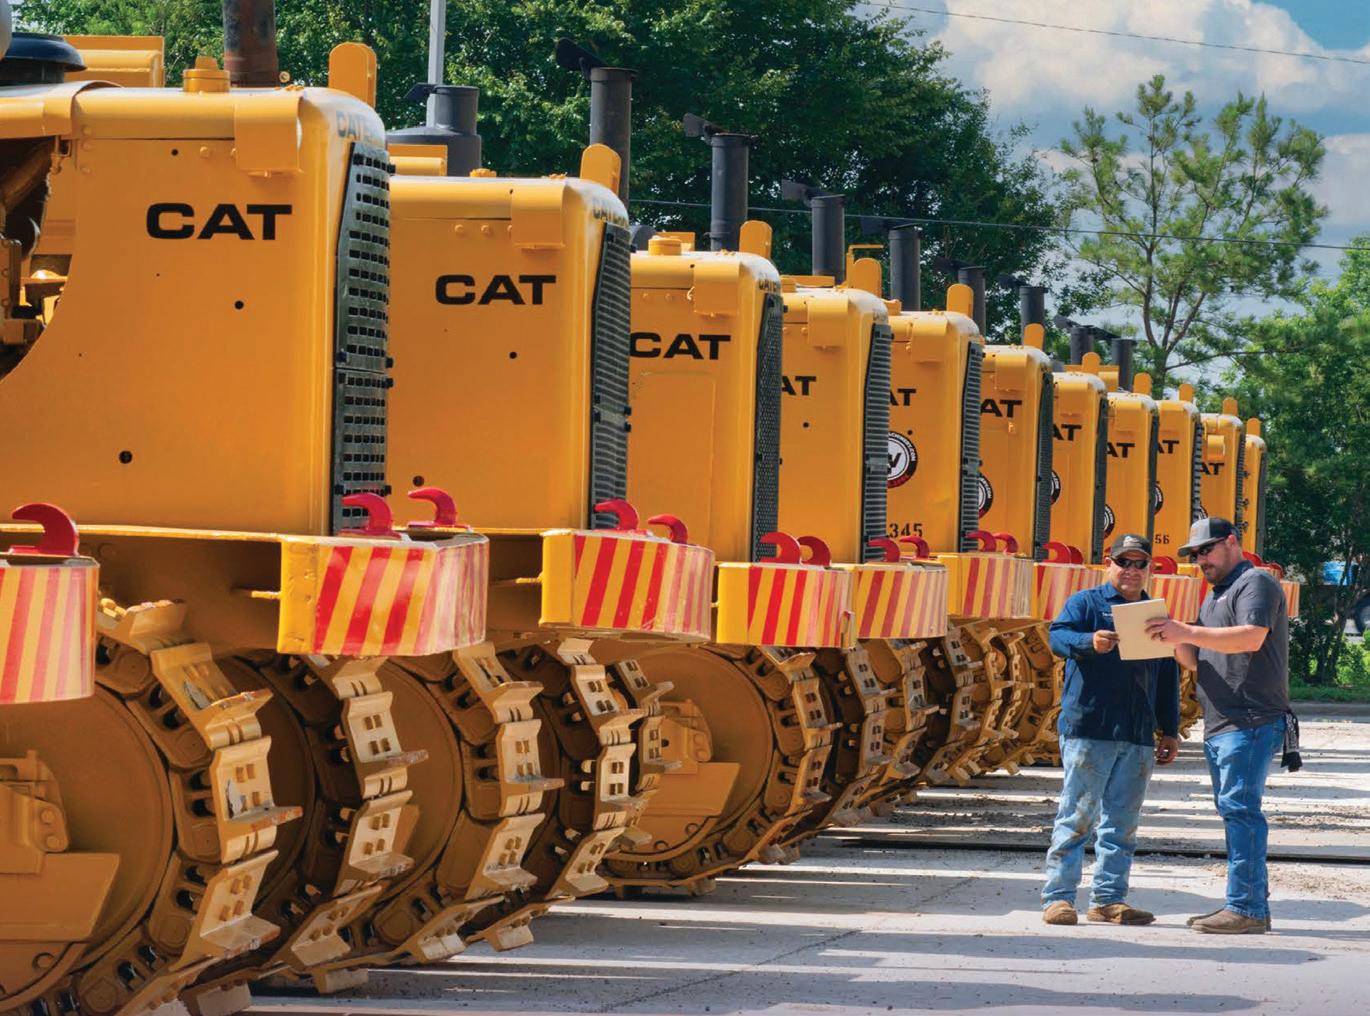
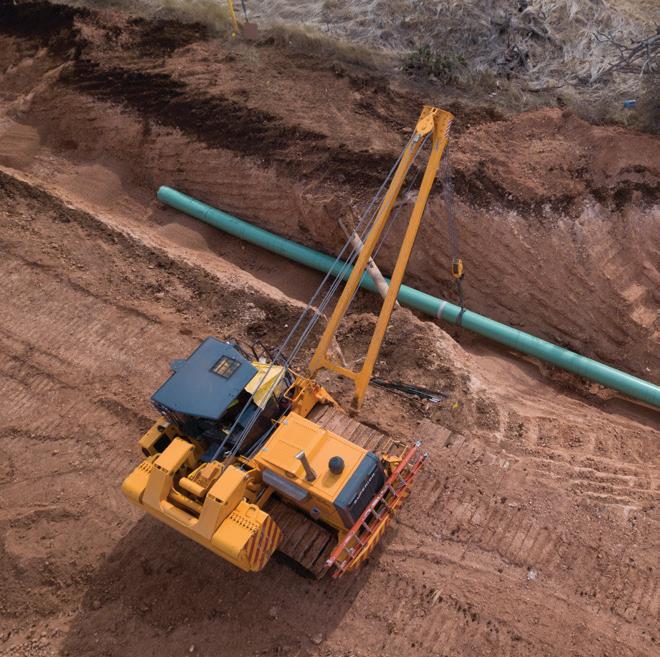
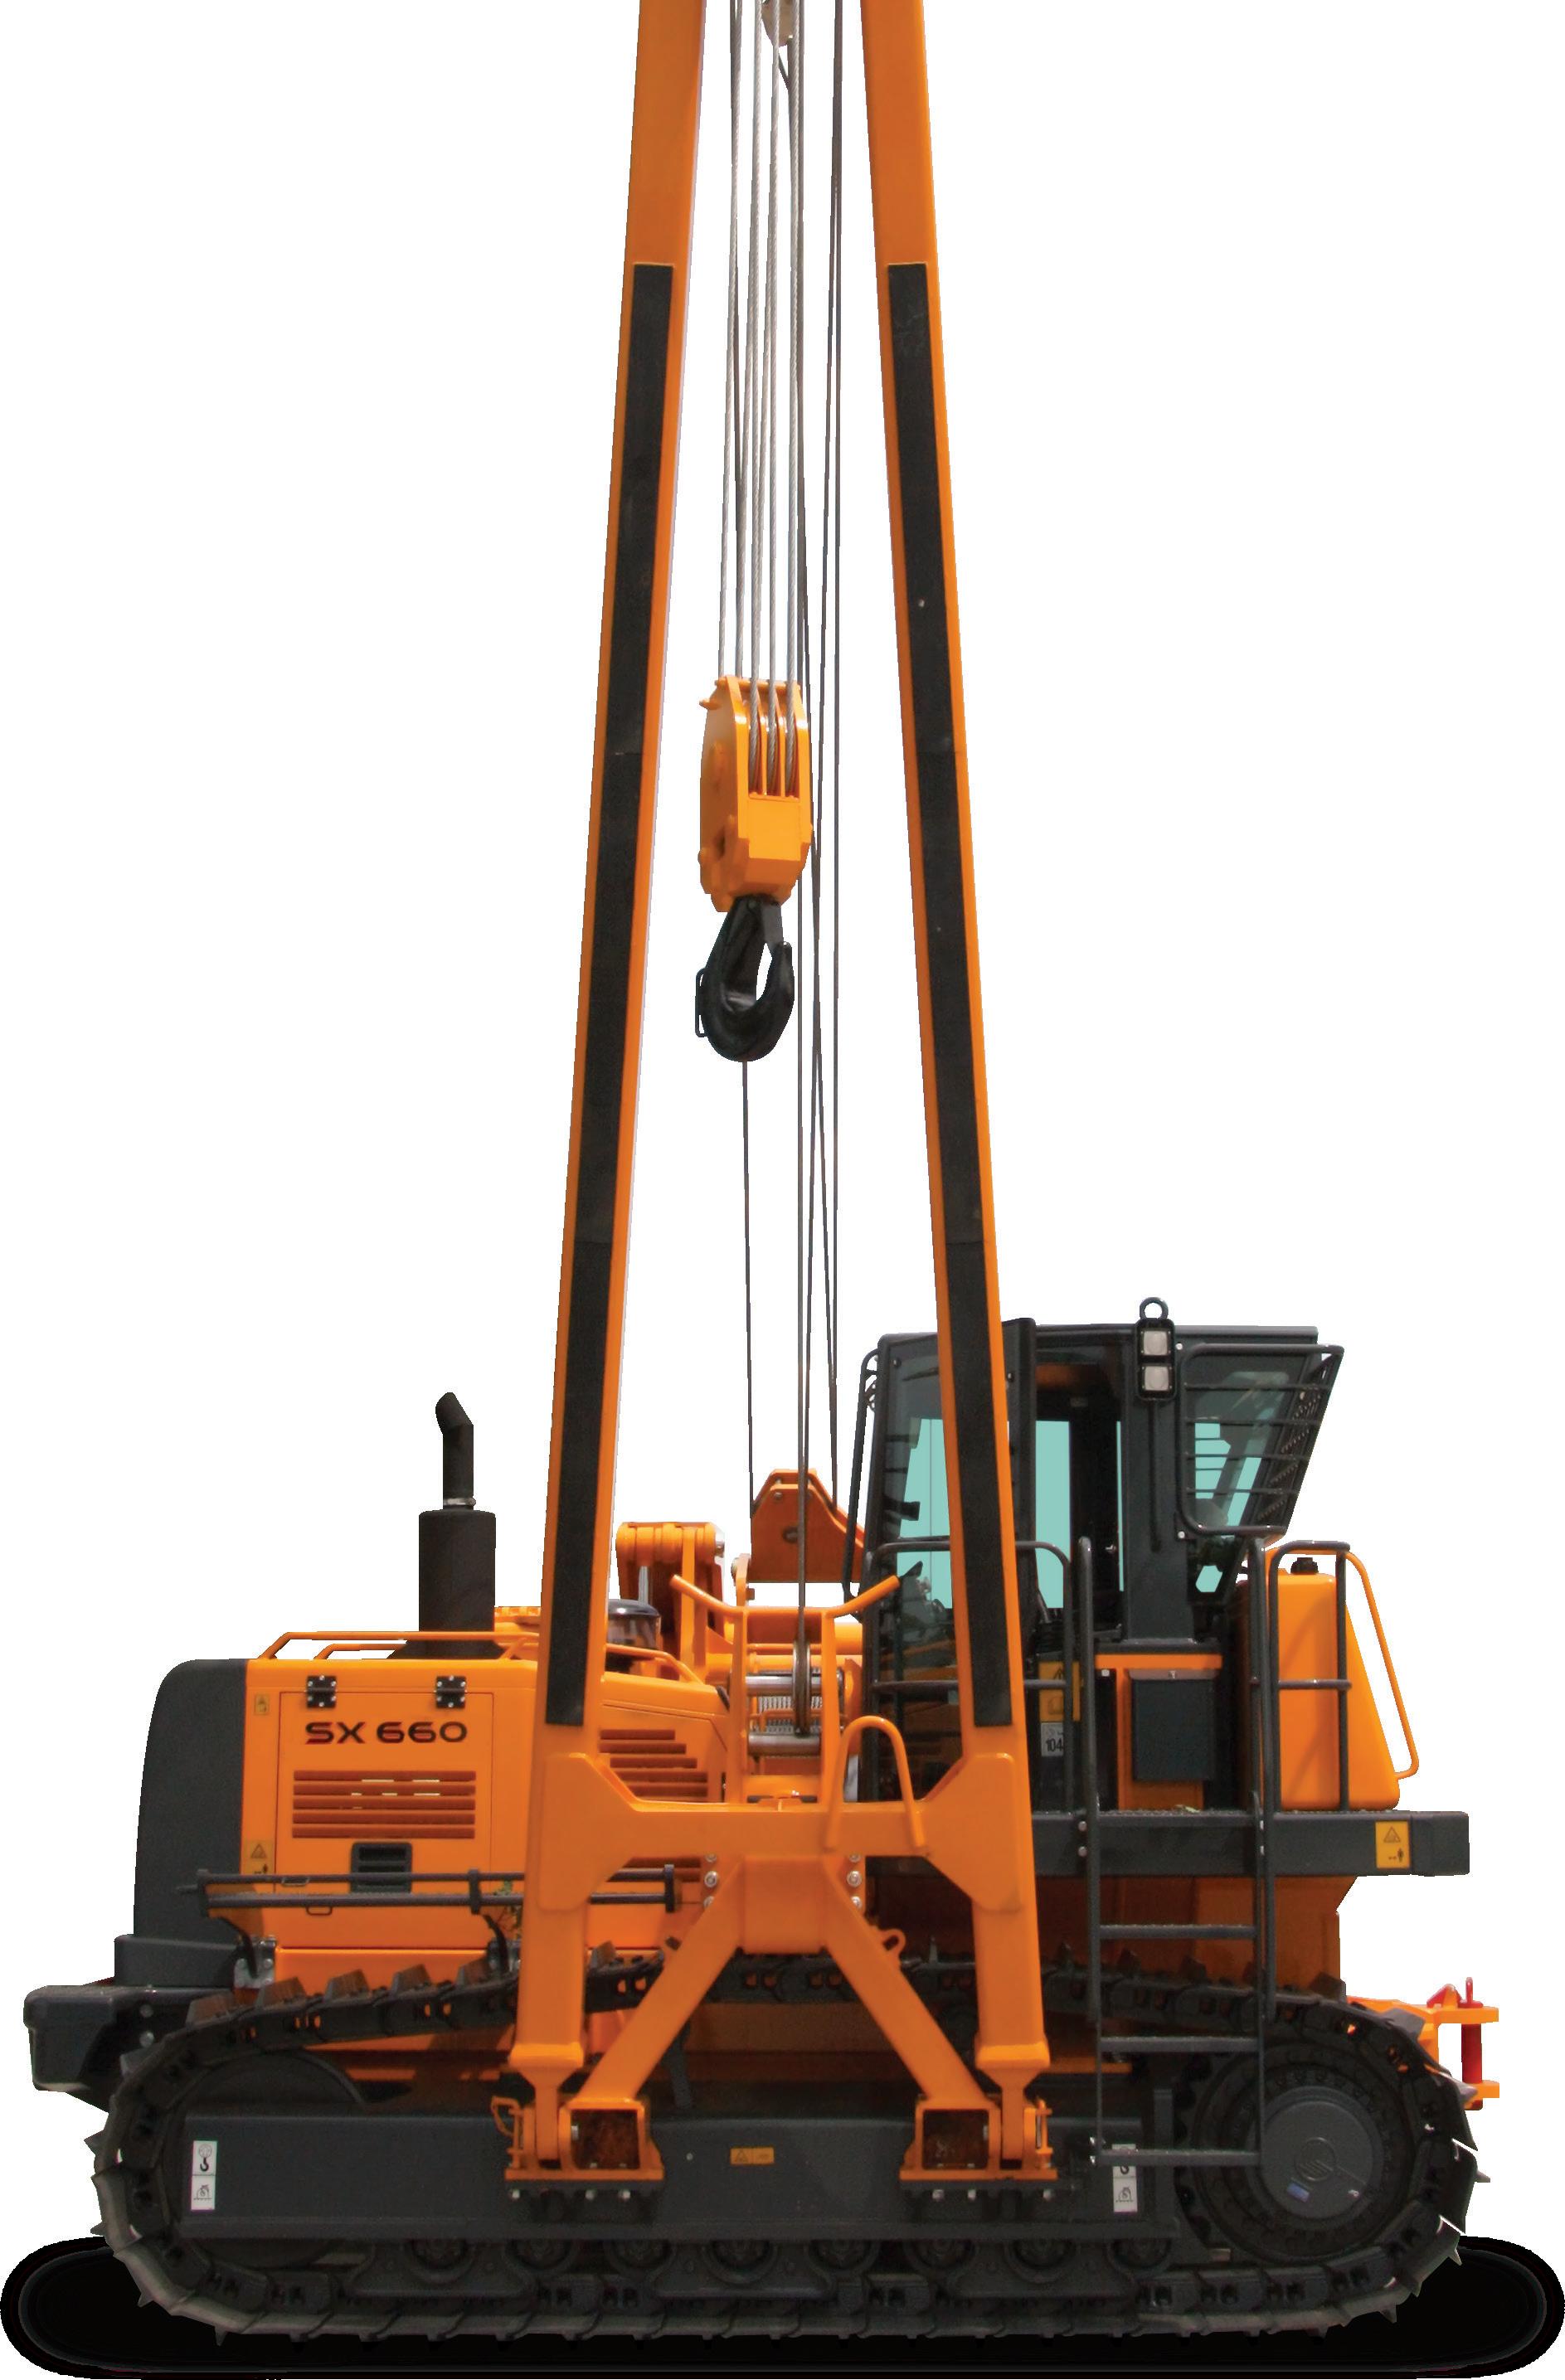
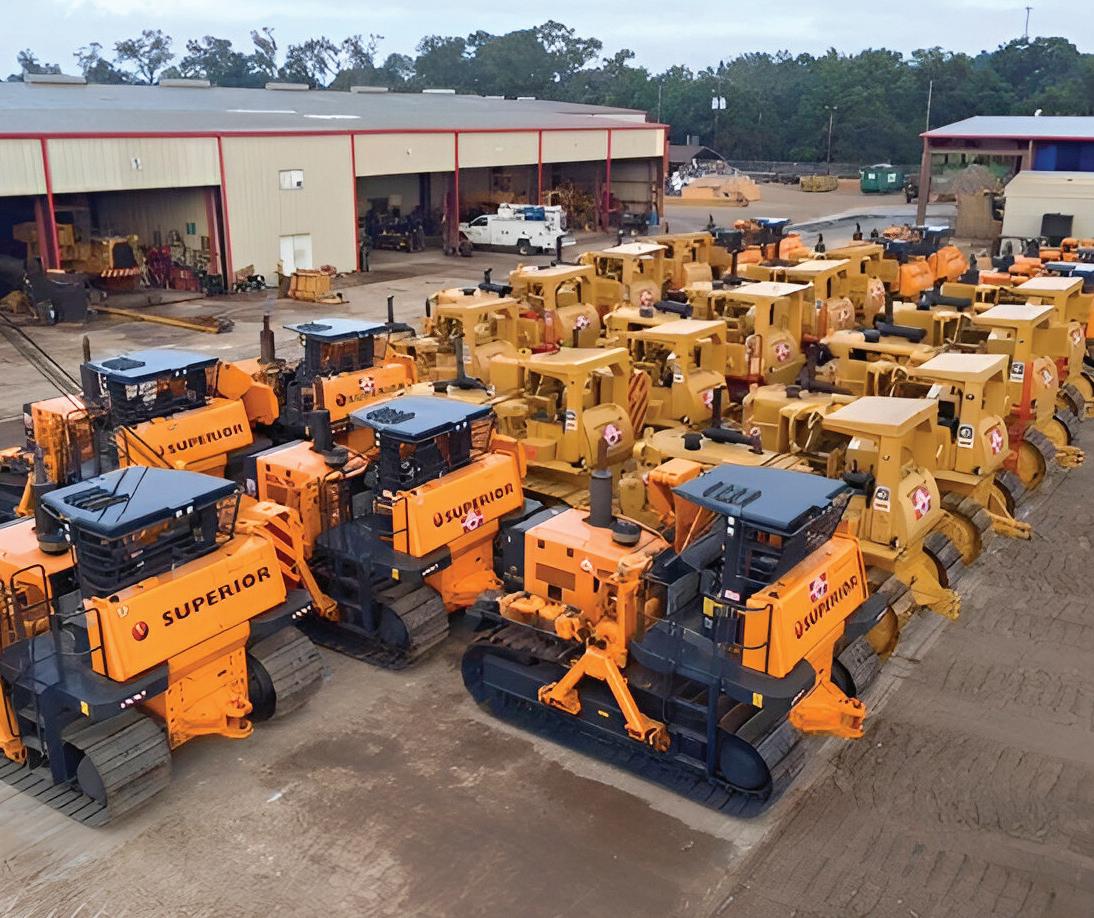
Explore our range of pipelayers, including premium SUPERIOR models and hydraulic-converted Caterpillar machines. We also offer conversion systems for mechanical pipelayers or dozers. All our equipment complies with regional regulations, featuring tier 3 or 4 engines, ROPS, and enhanced safety features. Scan QR code for the brochure!
The forum for the corrosion protection community, exploring pipeline coatings, hydrogen transportation, new technology and markets
Highlights from the 2025 agenda
Panel discussion Evening Networking event
Martin van Agteren Principal Advisor Asset Management
Gasunie
10 sponsors and exhibitors
Industry-leading speakers include:
Hassan Al-Sagour Chairman, Paints & Coatings Standards Committee Saudi Aramco
Talal Al Nabhani
Materials and Integrity Manager
Petroleum Development Oman
Also sponsored by: Media Supporters:
Expert speakers
Denis Melot
Expert Non-Metallic Materials & Coatings
TotalEnergies
Javvad Malik, Lead Security Awareness Advocate, KnowBe4, sounds the alarm bell about cyber attacks on critical national infrastructure, a growing geopolitical threat to the midstream sector.
he rise of cyberattacks against critical national infrastructure (CNI) has grown exponentially around the world, creating serious threats to national stability, economy and security. While the types of threats against CNI vary, including data breaches and ransomware attacks, they focus on gaining access to control systems with the intent of causing serious disruption, industrial or national espionage or for financial gain.
Certainly, all CNI sectors are now prime targets for cybercriminals and both state and non-state actors are using these attacks as strategic weapons in geopolitical
conflicts, fundamentally altering the dynamics of global power. Europe’s power grid is under a ‘cyberattack deluge’, inundated by thousands of attacks, according to Leonard Birnbaum, Chief Executive of E.ON, one of Europe’s largest utilities, who said in 2023 that “the crooks are becoming better by the day,” adding “I am worried now and I will be even more worried in the future.”
If disrupted or shut down, sectors that are integral to a nation’s functionality like utilities (oil, gas, water, energy), transportation and telecommunications, will bring serious disruption and raise safety concerns to citizens. This trend is expected to grow, given that these industries – particularly in developed nations – are increasingly integrated with digital technologies, which can often introduce new vulnerabilities. The potential fallout from such attacks is catastrophic, making them a valuable tool for geopolitical rivals in their digital warfare strategies.
Where CNI disruption can lead
As mentioned, disrupting just one CNI sector can paralyse large portions of society. For instance, a failure in transportation could prevent air traffic controllers from communicating with planes, while freezing port operations and shipping lanes would severely disrupt the flow of goods, leading to economic chaos. A power grid outage could leave millions without electricity, severing communication lines, blocking access to bank accounts, and closing hospitals. Any of these situations could easily spark widespread social unrest.
Widespread outages can interrupt essential services such as healthcare, emergency response, and government operations on a global level. Many hospitals may face difficulties accessing critical data, causing delays in appointments and surgeries. Cybercriminals are quick to take advantage of these situations, setting up phishing domains and posing as support personnel. As infrastructure sectors in developed countries have become more integrated with digital technologies, these advancements have boosted capacity and efficiency, but they have also introduced new vulnerabilities to cyberattacks.
Recognising the potentially devastating consequences of an attack on these critical targets, geopolitical adversaries are positioning themselves to exploit vulnerabilities in the sector, making cyberattacks on infrastructure a powerful addition to their digital arsenals.
One of the most alarming threats is an attack on the energy sector, which encompasses power generation, water treatment, electricity supply, and other interconnected systems. Such an attack could plunge communities into chaos; for instance, a sudden power outage could cripple the operations of hospitals, emergency responders, and military bases. This scenario is more realistic than we might hope.
A global issue
Cyberattacks have been well documented in the world news and the statistics surrounding the number of attacks against CNIs are concerning. A report from the International Energy Agency (IEA) revealed that the average number of weekly cyberattacks on utilities more than doubled globally between 2020 and 2022. By 2023, that number had doubled again.
For instance, in April 2024, the North American Electric Reliability Corporation (NERC) reported that vulnerabilities in the US power grid were increasing at a rate of approximately 60 points per day. In
2022, the number of vulnerable points rose from 21 000 to 22 000, and it now stands between 23 000 and 24 000. One of the most high-profile CNI attacks in recent years was against the US’s largest pipeline, Colonial Oil, which was hit in 2021 with a massive targeted ransomware attack. The pipeline, which supplied more than 45% of the gas, diesel, and jet fuel for the American East Coast, was forced to shut down and was offline for 11 days after paying US$5 million in ransom. The attack, which left 11 000 gas stations out of gas, caused states of emergency to be declared in four states, and spiked the cost of fuel to its highest in six years, was perpetrated by the Russian hacker group DarkSide.
In Europe, similar CNI attacks have been documented. In 2023, Denmark’s energy infrastructure was hit by a coordinated attack, where hackers successfully breached the industrial control systems of several companies. “The attackers knew exactly who to target and hit the mark every time,” the organisation reported. While Polish Deputy Energy Minister Ireneusz Zyska, recalled a visit to Poland’s grid operations centre, located three stories underground for protection against nuclear threats. “I was watching thousands of live attacks on our energy grid. It’s clear these attacks originate from the East – from Russia and other non-democratic nations,” he noted, adding that these countries “have established dedicated teams focused on cyberattacks against EU democracies to create chaos.”
In the UK, research has revealed that 45% of energy companies admitted that they have suffered disruption to their operations as a direct result of a cyberattack. According to the report, the energy sector is struggling to react quickly to cyber-incidents and mitigate the damage they cause.
The sheer numbers of attacks are accelerating every year. Between January 2023 and January 2024, global critical infrastructure faced over 420 million cyberattacks, with varying levels of severity, according to Forescout Research – Vedere Labs. This equates to 13 attacks per second, marking a 30% increase compared to 2022. These attacks have affected 163 countries, with the US being the most frequently targeted, followed by the United Kingdom, Germany, India, and Japan. China is home to the largest concentration of threat actors behind these attacks, followed by Russia and Iran.
Efforts to improve security
Cyberattacks on critical infrastructure by global adversaries reflect the shifting dynamics of modern warfare in the 21st century. Similar to how aerial bombings and military occupations affected civilian life during World War II, today’s digital conflicts have the potential to significantly disrupt daily life. Though we have not yet faced widespread devastation from these attacks, individuals and businesses alike must take proactive steps to protect their assets and operations.
While governments and international leaders work to reduce the risks of future cyber threats, building a unified security mindset across society remains one of the most powerful tools in defending against foreign cyber intrusions.
Several of the attacks mentioned above leveraged unsecured home routers to penetrate systems that manage safety checks and water security. If your home router lacks a strong password and proper security settings, it can provide an easy entry point for cybercriminals. Similarly, purchasing a router from an unknown source, like eBay, can pose significant risks if its security is
compromised. The same logic applies to an IT manager overseeing a small part of a nation’s infrastructure: relaxed security practices could inadvertently give adversaries access to critical national systems. These seemingly small security ‘gaps’ often serve as gateways for threat actors to infiltrate larger networks, sometimes remaining undetected for years while they collect data or plant malicious software.
Even if such intrusions aren’t immediately noticed, they can have far-reaching effects down the line, potentially impacting large groups of people. State-sponsored hackers and independent cybercriminals often rely on phishing and social engineering tactics to steal credentials or gather information, which then allows them to infiltrate systems. A lack of cybersecurity awareness within organisations and communities greatly increases the risk of such intrusions, as it leaves numerous vulnerabilities exposed. Building a robust security culture requires more than reports and discussions – it must be a shared responsibility, not something left solely to governments and large corporations.
Change to security culture
A good starting point is addressing the vulnerability of individual users, both at home and at work. For example, evaluating the online behaviours of users to determine how many, without security awareness training, are prone to clicking on malicious links in phishing emails.
Organisations also need to be prepared for cyber incidents and potential disasters. IT and cybersecurity teams should create
incident response playbooks that outline the steps to take during known attacks, reducing risk and minimising downtime. While it’s impossible to predict every potential crisis, disaster recovery programmes should have systems in place to restore operations as quickly as possible. These plans, often compiled into a ‘playbook’, should include recovery procedures, communication protocols, and essential information such as admin passwords and Bitlocker codes. It’s wise to keep secure hard copies in multiple locations to prevent a single point of failure. Regular training exercises, such as tabletop drills, involving IT, operational technology, and business teams ensure that all staff are prepared to act swiftly during an incident. Implementing fundamental cybersecurity measures, such as managing asset inventories, enabling multi-factor authentication (MFA), and fostering a strong security culture, can significantly strengthen an organisation’s defences – particularly for those in critical infrastructure sectors.
The rising number of cyberattacks targeting critical infrastructure presents a serious global threat, with the potential to cause significant social and economic disruptions. To counter these risks, organisations must adopt a comprehensive, multilayered defence strategy that integrates technology, well-defined processes, and trained personnel.
By embracing these practices, critical infrastructure organisations can greatly enhance their ability to withstand evolving cyber threats. As the threat landscape continues to shift, cybersecurity strategies must evolve accordingly to protect the essential systems that society relies on every day.
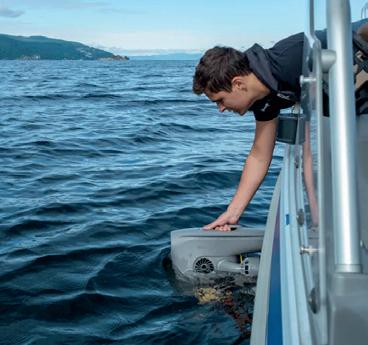
Jordan Ferguson, CEO, Pier Solutions, discusses the importance of hydrogen detection and safety in the pipeline market.
s the energy landscape evolves, the emphasis on hydrogen as a clean energy source is becoming increasingly prominent. This shift is particularly relevant in the pipeline sector, where the safe transportation of hydrogen poses unique challenges and opportunities. Hydrogen is a light, flammable gas that can lead to serious safety risks if not properly detected and managed. Consequently, the focus on hydrogen detection and safety in midstream
pipeline operations is paramount. This article explores the significance of early detection and monitoring for ensuring the safe operation of assets.
The growing role of hydrogen in the energy transition is key to global net zero goals and ambitions, hydrogen’s potential as a clean energy carrier has gathered significant attention in recent years. It can be produced from various sources, including natural gas, water, and biomass, and can play a vital role in reducing greenhouse gas emissions. As countries
strive to meet their climate targets, hydrogen is emerging as a key component of energy transition strategies. This increased reliance on hydrogen intensifies the need for effective detection and safety measures within the pipeline infrastructure that transports it.
There are constant unique challenges in the transportation of hydrogen through pipeline systems compared to traditional hydrocarbons. Hydrogen’s small molecular size allows it to permeate materials more easily, leading to potential leaks. Additionally, hydrogen can embrittle certain metals, increasing the risk of pipeline failures. These factors underscore the urgent need for robust detection systems capable of identifying leaks early to prevent catastrophic incidents.
Importance of early detection and monitoring
Early detection of hydrogen leaks is crucial for a multitude of reasons. The safety of workers and communities near pipeline infrastructure is paramount. Early detection systems can provide timely alerts, enabling quick responses to potential hazards. Also, hydrogen leaks can contribute to greenhouse gas emissions if not managed effectively. Monitoring systems help mitigate environmental impacts by ensuring prompt action in case of leaks. Furthermore, maintaining the integrity of pipeline assets is essential for reliable operations. Early detection can prevent costly failures and extend the lifespan of infrastructure. Then, there are regulations; governments and regulatory bodies are increasingly mandating stringent safety standards for hydrogen transport. Implementing effective detection systems ensures compliance with these regulations. Finally, preventing leaks and failures can save companies significant costs associated with repairs, legal liabilities, and regulatory fines. Proactive monitoring is a wise investment for long-term sustainability.
The role of advanced detection technologies
To address the challenges of hydrogen detection, the industry is turning to advanced technologies that offer improved sensitivity and reliability. These technologies include electrochemical sensors – these sensors detect hydrogen through chemical reactions, providing fast and accurate readings. They are suitable for both fixed and portable applications. There are also optical sensors, which, by utilising infrared spectroscopy, can detect hydrogen concentrations
over a wide area. Their non-invasive nature makes them ideal for continuous monitoring in pipeline systems. Furthermore, fibre optic sensor systems use fibre optic cables to detect changes in temperature and pressure, allowing for realtime monitoring of pipeline conditions. Finally, advanced software solutions can analyse data from multiple sensors, providing insights into potential leak sources and predicting maintenance needs.
Key regulatory challenges for hydrogen pipeline safety
Regulatory challenges are a constant battle between adopters, interrogators and end users. A few areas need to be addressed.
There are a lack of established standards – hydrogen is a relatively new focus in pipeline transport, leading to a scarcity of comprehensive safety standards and regulations specifically tailored for hydrogen pipelines. Existing regulations for natural gas or other hydrocarbons may not adequately address the unique properties and risks associated with hydrogen. There is also an issue of material compatibility. Hydrogen can cause embrittlement in certain materials commonly used in pipelines. Regulatory frameworks must evolve to ensure that materials used in hydrogen infrastructure are thoroughly tested and certified for compatibility. Also, ensuring that personnel involved in the operation and maintenance of hydrogen pipelines are properly trained and certified presents a challenge. Regulatory bodies need to establish training requirements that reflect the specific risks associated with hydrogen.
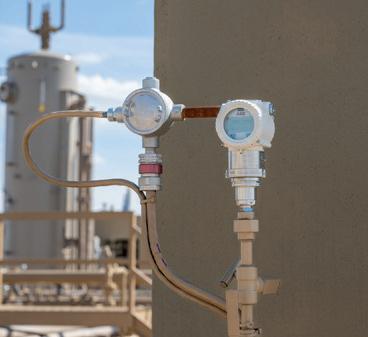
Leading the charge in hydrogen detection
Through its global partnership with H2scan, Pier Solutions is at the forefront of hydrogen detection technology, offering a range of products designed to enhance safety in pipeline operations. These solutions are engineered to provide reliable and accurate monitoring for hydrogen, ensuring that operators can respond swiftly to any potential hazards.
A significant aspect of Pier Solutions’ approach is its global partnership network. Collaborating with industry leaders allows them to leverage expertise and resources, enhancing the effectiveness of their products. This partnership model enables Pier Solutions to bring cuttingedge hydrogen detection technologies to market, supporting global safety initiatives.
This collaborative approach not only enhances product development but also fosters knowledge sharing across the industry, promoting best practices in hydrogen safety.
Commitment to global safety initiatives
Pier Solutions is dedicated to improving the safety of hydrogen transportation in line with global initiatives. Meeting international safety standards, its products ensure that operators can implement effective detection and monitoring systems that align with regulatory requirements. The company also engages in
Figure 1. A hydrogen plant.
INNOVATIVE SOLUTIONS FOR YOUR TOUGHEST PROBLEMS
Dairyland decouplers are critical to cathodic protection systems — keeping workers and valuable assets safe from AC faults, lightning, and induced AC voltage — all while optimizing your CP systems.
We were the first company to introduce solid-state decoupling products to the industry, replacing the unreliable and dangerous polarization cells that exposed workers to shock hazards and highly caustic chemicals. In the decades that have followed, our solution-focused team ha s continued to deliver innovative decoupling products, solving critical problems across numerous applications and industries.
For more than forty years, Dairyland has pioneered new technologies and set new standards in the market. And we’re not done yet. If a solution to your problem does not yet exist, we’ll work to find one.
Let us help you find the right solution to your problem.
outreach and education efforts to raise awareness about the importance of hydrogen safety. By providing training and resources to operators, Pier Solutions empowers them to effectively utilise their detection technologies, reinforcing a culture of safety within the industry.
To illustrate the effectiveness of advanced hydrogen detection systems, case studies highlight successful implementations in midstream operations.
Case study one
Enhanced monitoring in a hydrogen pipeline is crucial for ensuring safety, efficiency, and integrity. Given the unique properties of hydrogen, including its small molecular size and high diffusivity, effective monitoring systems must be robust and sensitive. H2scan and Pier Solutions provide real-time gas sensors for enhanced monitoring in hydrogen pipelines:
) Real-time hydrogen sensors: Hydrogen Specific Sensors are specialised sensors, provided by H2scan, that will detect hydrogen concentrations accurately and in realtime, enabling immediate responses to any deviations from safe levels.
) Regulatory compliance: enhanced monitoring helps ensure compliance with safety regulations and standards. Continuous data recording can provide necessary documentation for inspections and audits.
) Integration with SCADA systems: integrating monitoring systems with Supervisory Control and Data Acquisition (SCADA) systems allows for centralised control and management of the pipeline, enhancing response times to any detected issues.
During a recent blending project with a major European pipeline operator, Pier Solutions supplied H2scan’s HY-OPTIMA hydrogen-specific analysers with a gas blending metering system. The sensors were installed at critical points along
the infrastructure, allowing for continuous monitoring of the hydrogen-in-natural gas mix. Within a few days of initial testing, the analyser detected a change in the mixture that may have otherwise gone unnoticed. The early alert enabled the operator to address the issue promptly, avoiding potential environmental and safety risks as well as increased costs and repairs.
Enhanced monitoring in hydrogen pipelines is vital for safety, efficiency, and regulatory compliance. By leveraging advanced technologies and real-time data analytics, operators can ensure the integrity of the pipeline, minimise risks, and optimise operations in the growing hydrogen economy.
Case study two
Blending hydrogen with natural gas is an increasingly important process in the energy sector, especially as the push for cleaner energy sources grows. H2scan technology has been chosen by many energy utilities companies to play a crucial role in this process across Europe as it provides the following benefits:
) Hydrogen measurement: H2scan sensors provide accurate real-time measurements of hydrogen concentration in the natural gas stream. This measurement is essential for maintaining the desired blending ratio and ensuring that the mixture remains within safe and effective limits.
) Safety monitoring: hydrogen has a lower ignition energy, and a wider flammability range compared to natural gas. Continuous monitoring of hydrogen levels helps prevent the risk of creating explosive mixtures, ensuring that safety protocols are being followed and maintained.
) Quality control: maintaining a specific hydrogen-to-natural gas ratio is crucial for end-use applications, such as power generation or heating. H2scan ensures that the blending process meets quality standards and specifications required for effective combustion and performance.
) Operational efficiency: real-time data helps optimise the blending process, allowing many operators to make immediate data-driven adjustments. This can lead to more efficient use of resources, reducing costs and improving overall system performance.
) Impact on combustion: blending hydrogen with natural gas can alter combustion characteristics, such as flame temperature and emissions. This technology helps monitor these changes, ensuring that the blended fuel performs as expected in various applications.
Future directions in hydrogen detection
As the demand for hydrogen continues to grow, the pipeline industry must adapt to meet new challenges. The Internet of Things (IoT) will play a significant role in enabling real-time monitoring and data
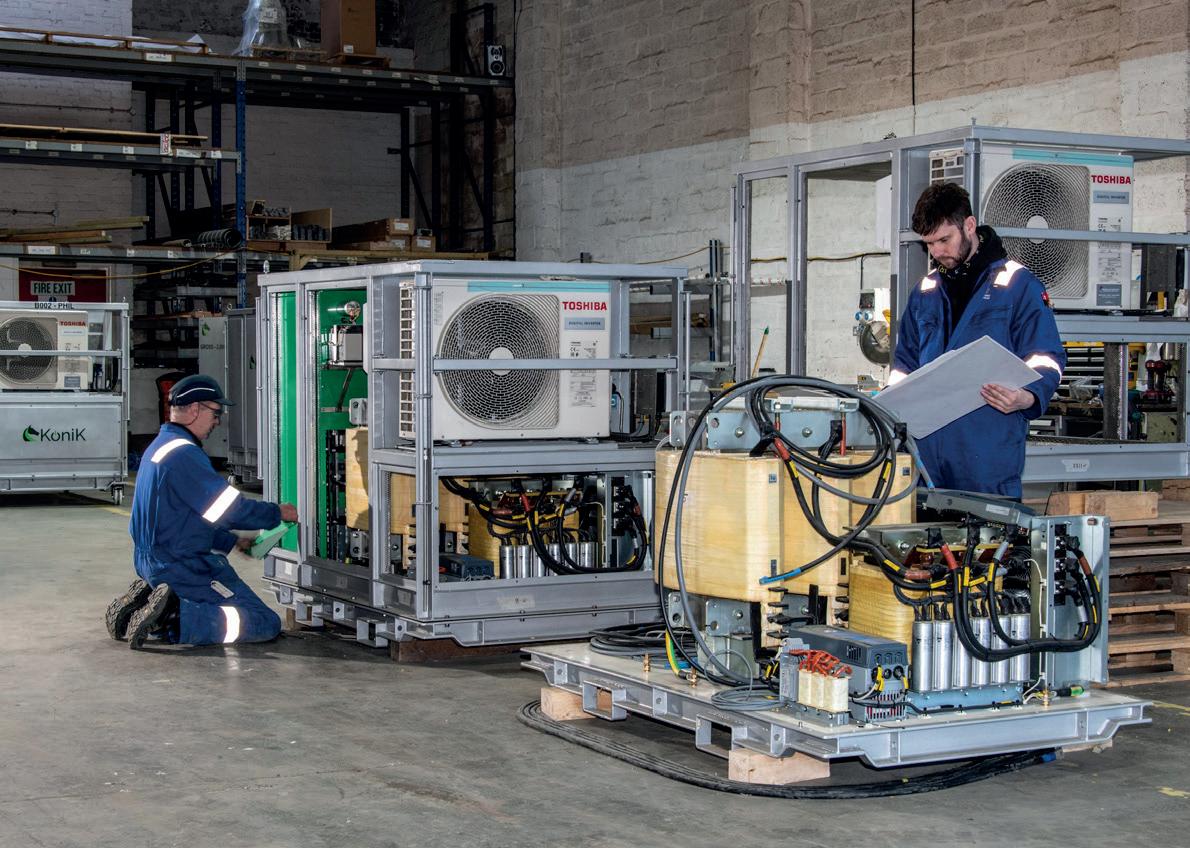
Figure 2. Building a containerised solution.
sharing across pipeline networks, enhancing overall safety and operational efficiency. Machine learning algorithms will improve the predictive capabilities of detection systems, allowing for more accurate risk assessments and maintenance scheduling. As hydrogen infrastructure expands, regulatory frameworks will evolve to ensure safety standards keep pace with technological advancements.
Pier Solutions and H2scan technology supports the transition to a hydrogen-blended natural gas future by ensuring safety, efficiency, and compliance in blending processes. This integration can enhance the viability of hydrogen as a cleaner energy source while leveraging existing natural gas infrastructure. Current emergency response plans may not account for the specific hazards posed by hydrogen, such as its flammability and potential for rapid dispersion. Regulations need to address the development of tailored emergency response strategies for hydrogen incidents. Regulatory frameworks must balance safety with the need for public transparency. Ensuring that communities are informed about hydrogen infrastructure and risks while maintaining operational security is a complex issue. Hydrogen safety regulations often require coordination among various regulatory agencies, including those overseeing energy, environmental protection, and transportation. Ensuring harmonisation among these agencies can be challenging. Many hydrogen projects involve
retrofitting existing natural gas pipelines. Regulations must provide clear guidelines on how to safely integrate hydrogen into these systems without compromising safety. As hydrogen production and transport can have environmental impacts, regulatory frameworks must address sustainability and environmental protection while ensuring safety. As hydrogen transportation expands globally, aligning domestic regulations with international safety standards becomes crucial. This can be challenging due to differing regulatory approaches and practices.
Addressing these challenges is essential for the safe and effective integration of hydrogen into pipeline systems, supporting the broader transition to a hydrogen economy.
Conclusion
The focus on hydrogen detection and safety within the pipeline market, particularly in midstream operations, is more critical than ever. Early detection and monitoring play a vital role in ensuring the safe transportation of hydrogen, protecting personnel, the environment, and pipeline assets. Pier Solutions stands at the forefront of this effort, leveraging advanced technologies and global partnerships to enhance safety in hydrogen transport. By investing in robust detection systems, the industry can navigate the challenges of hydrogen transportation and contribute to a sustainable energy future.
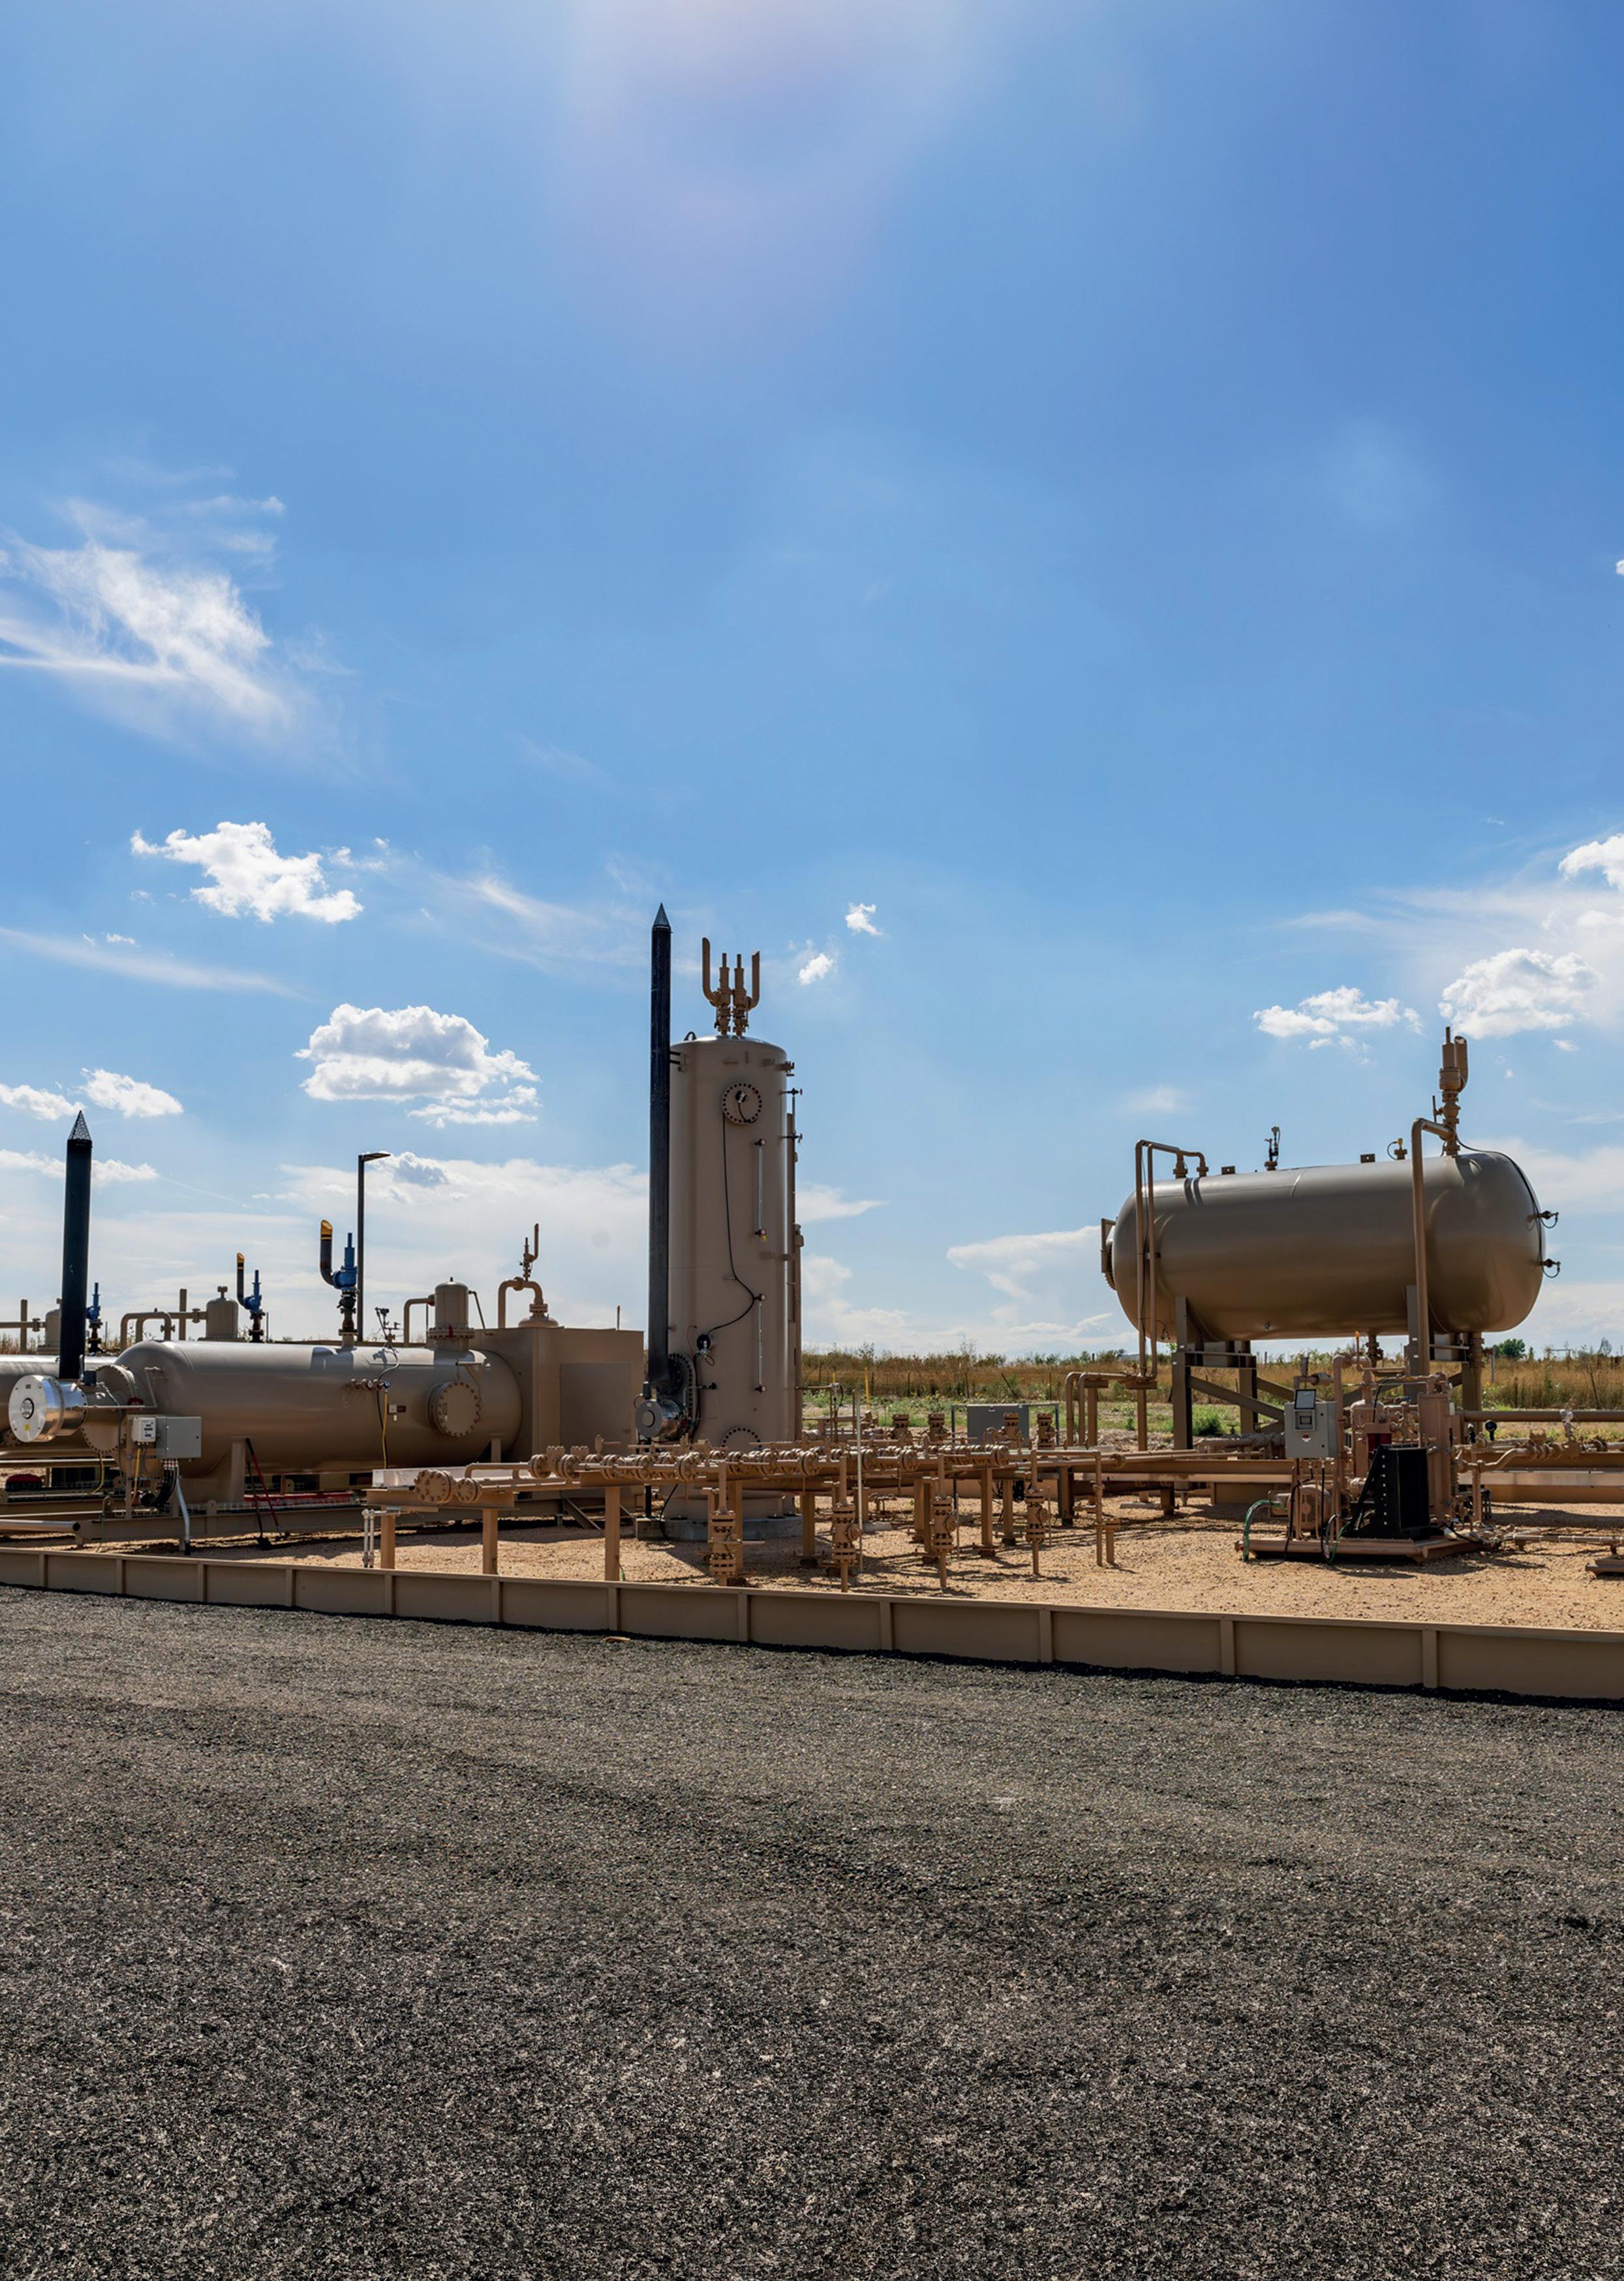
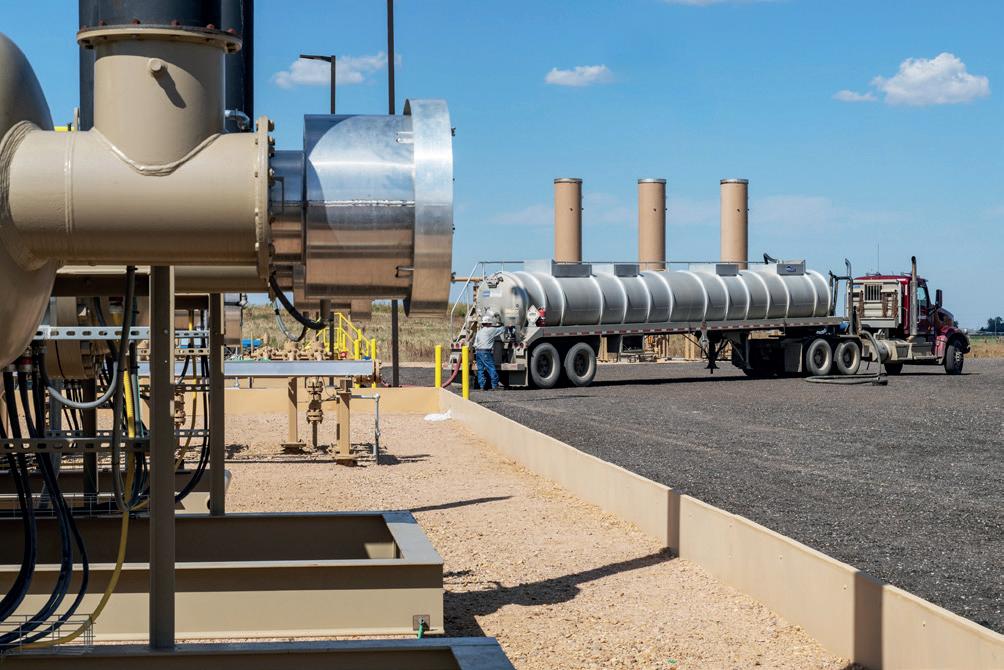
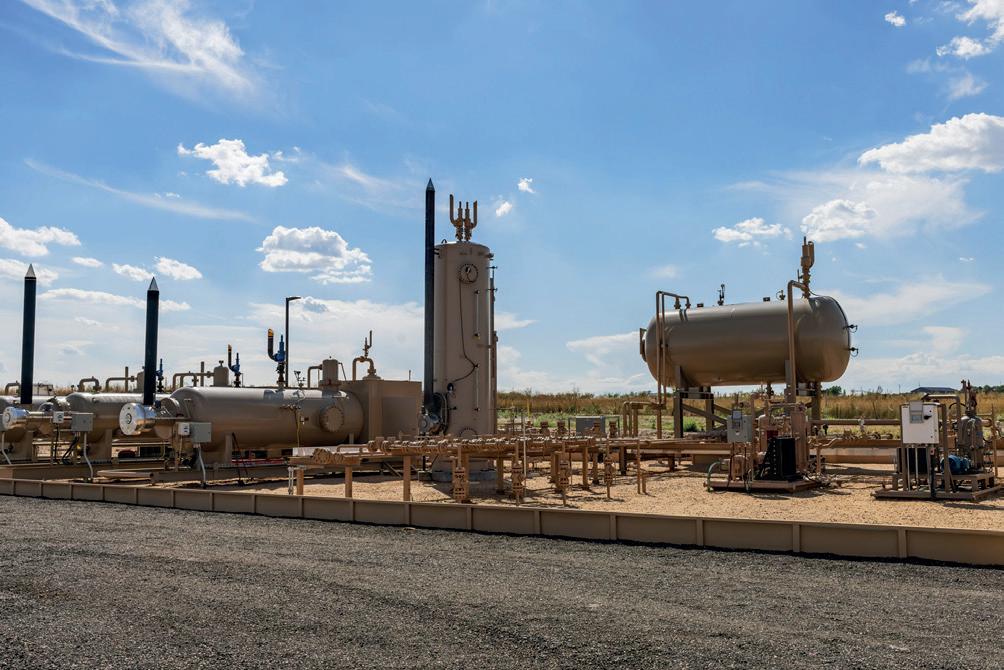
atural gas pipeline booster compressor stations require careful monitoring, maintenance and emissions reporting to ensure the safe, efficient and environmentally compliant processing and transport of natural gas from production fields and refineries over long distances to end users. This process starts when the gas is refined and first cleaned to remove liquids, impurities and any solids that damage equipment in the transportation process or at end-user facilities (Figure 1).
Brian Lawson, Senior Member of Technical Staff, Fluid Components International, Derik Hoover, President, Hoover Energy, and Mike Conn, President, ESquaredi, analyse how a thermal flowmeter with multi-calibration groups has simplified a portable monitoring system for flare gas units.
Booster or compressor stations play an essential role in the natural gas pipeline network. Once the gas is cleaned, then it is typically compressed and sent out through the pipeline, but distance, friction, elevation differences and other factors reduce pressure and then slow the movement of the gas. Multiple pipeline compressor stations must be placed carefully along the pipeline route to maintain sufficient pressure and flow to transport the gas to end users.
Natural gas production fields, refineries and booster stations are a complex network of pipes flowing raw gas first to scrubbers, filters and then onto the compressors. There is also always some amount of waste gas that is unusable for assorted reasons, which must be flared for safety reasons and must be reported to various local, state and federal regulators who are concerned about greenhouse gas emissions (GHG) and the global warming phenomenon.
For all these reasons, from plant efficiency to plant safety to plant emissions, the measurement of gas sent to flare units is extremely important. This task requires rugged, high accuracy flow instruments featuring global safety and measurement approvals to ensure the pipeline network maintains the pressure and flow of gas to end market users.
The problem
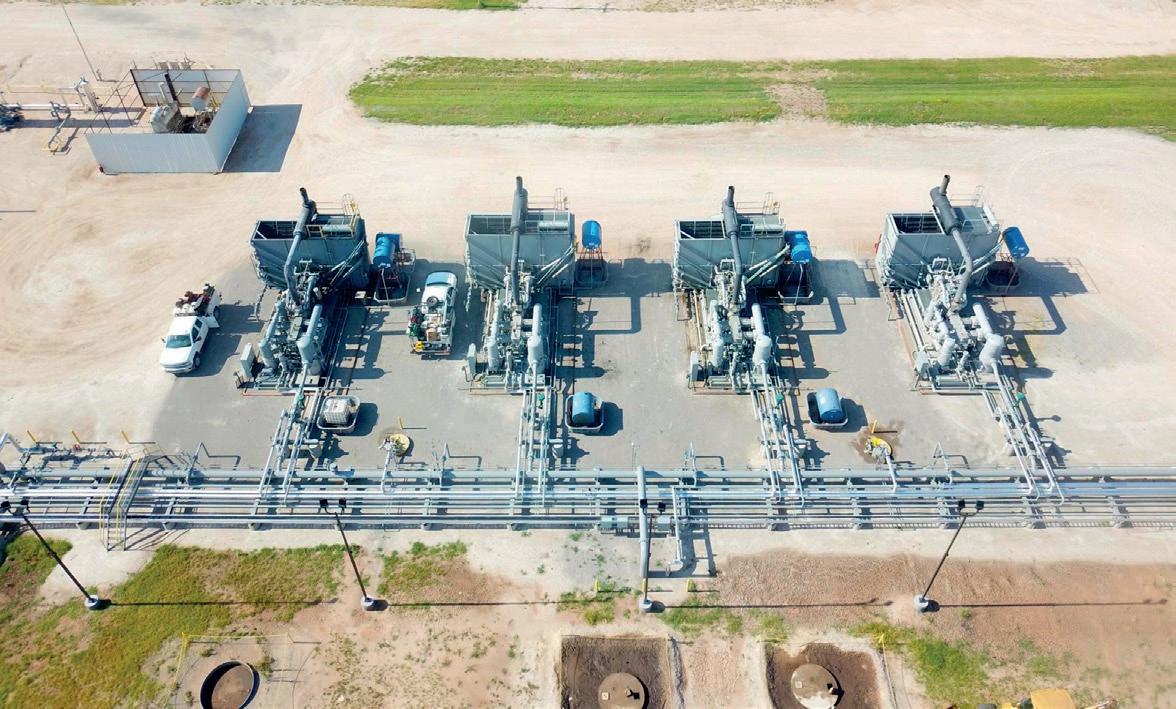
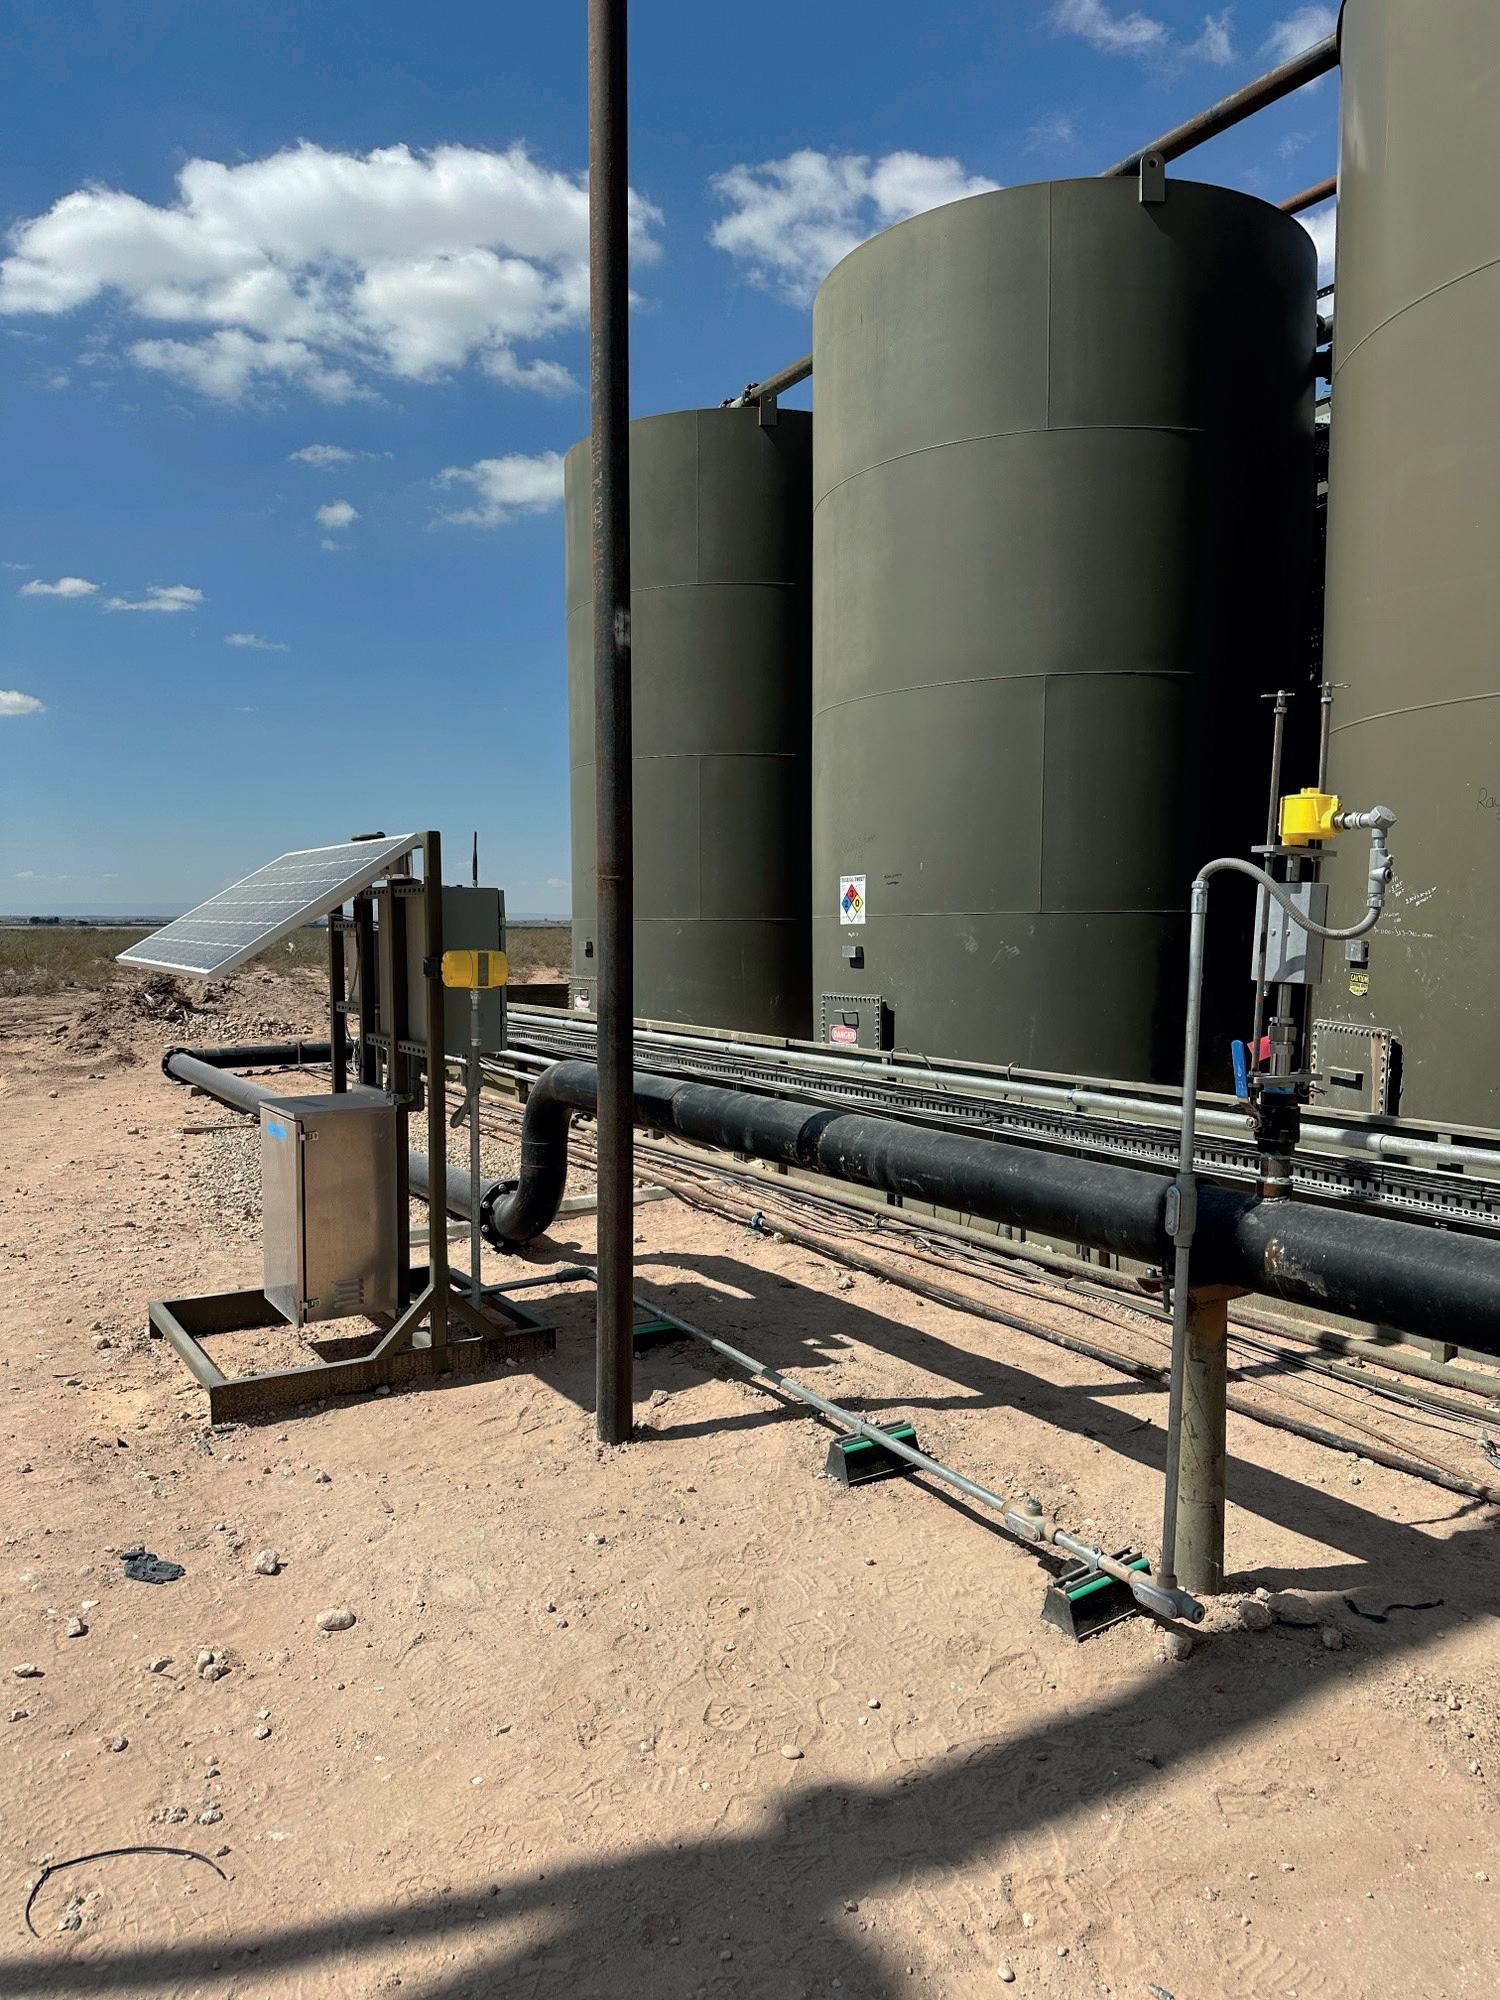
Hoover Energy, located in Artesia, NM, develops and operates portable flare gas monitoring skid systems that report flare unit activity to ensure operators that their equipment is functioning as intended by process and plant engineers to meet all safety and environmental monitoring regulations (Figure 2). Hoover Energy specialises in gas flow and temperature measurement and related instrumentation, as well as industrial electrical equipment, communications and automation. Hoover’s portable flare gas monitoring systems run either on full solar power or on local shore power, and in the event of a power loss on location then the skid switches seamlessly over to solar without ever shutting down. They feature sophisticated communications capabilities including SCADA monitoring. With additional IO modules, the system provides flare temperature data and indicates flare valve open/closed status. A camera also can be added to the system for full flare visualisation. In fact, they can function as a full flare reporting system.
These rugged systems are operated by Hoover Energy at multiple sites across eastern New Mexico and west Texas, as well as Wyoming. Hoover’s portable gas monitoring systems utilise thermal mass flowmeters because of their accuracy, repeatability, ease of installation and low maintenance. Thermal technology provides direct mass gas flow measurement and is among a small number of flow sensing technologies approved for this demanding application by the International Organisation for Standardisation (ISO), the American Petroleum Institute (API) and the American Gas Association (AGA).
Technicians from Hoover Energy are responsible for flare system flow monitoring and testing at multiple locations for a large compressor station facility operated by Luger Energy of Artesia, New Mexico, which serves several midstream gas processing companies including Matador and Targa. The network of pipelines feeding into the main facility is large and covers many square miles, which frequently requires Hoover Energy’s technicians to drive several hours to install its portable
Figure 1. Natural gas refinery pipleine compressor and flare unit.
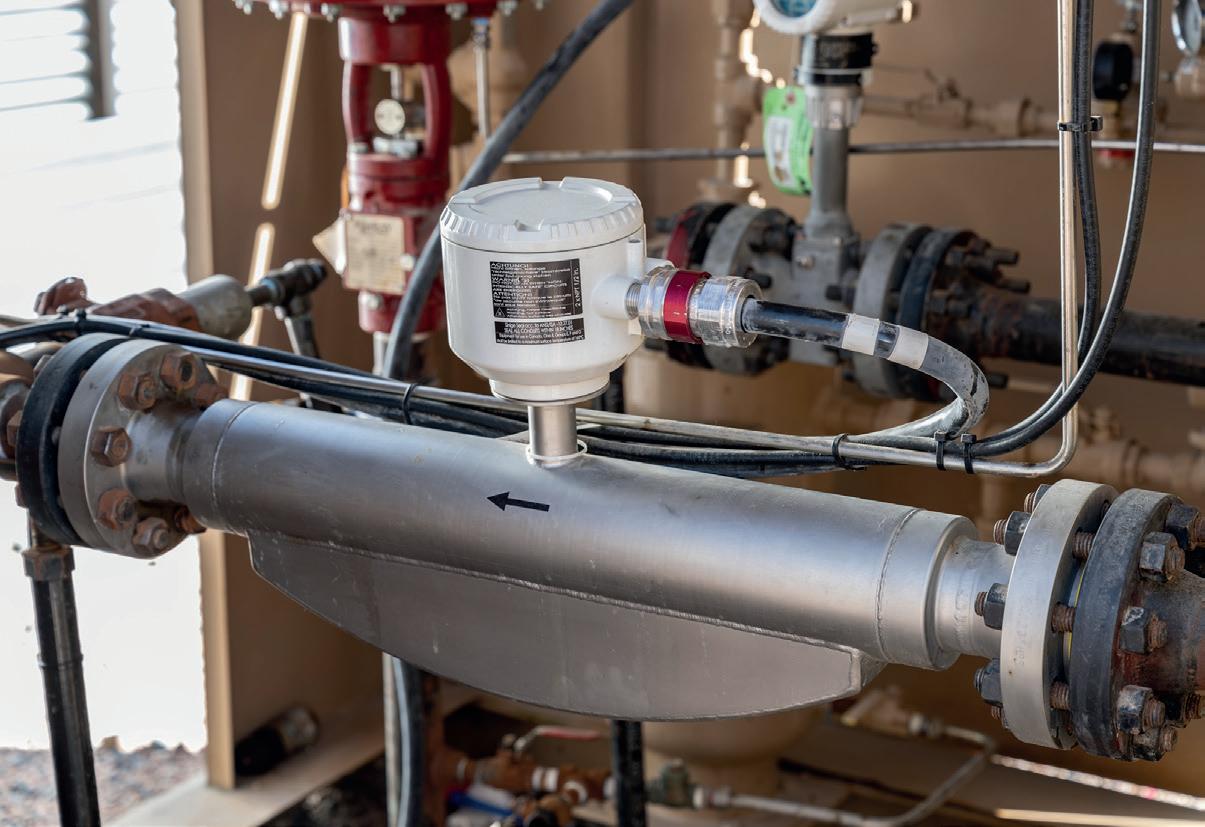
Figure 2. Hoover Energy portable flare gas monitoring skid with FCI flowmeter.
flare gas flow monitoring skid systems at critical process measurement points.
These measurement points, which are in various line sizes of 4, 6, 8 or 10 in., are also often near valves and elbows, which can affect gas throughput as well as accurate gas flow measurement. Flowmeters are sized according to pipeline size so that the flow sensor is located optimally within the pipe and then calibrated to the specific gas flowing in the pipeline for accurate measurement. That meant the technicians needed to know in advance the size pipe in which they would be measuring gas or risk having wasted precious travel time to the site only to find out they had brought their portable flare monitoring system with the wrong flowmeter installed.
This requirement also means that while in the field that the technicians were limited in what they could do – limited by the pipe line size and calibration of the meter they brought to the site with no flexibility to install the system in other locations with different line sizes. To solve this frustrating problem, Hoover Energy contacted ESquaredi, a manufacturer’s representative, who suggested that the ST100A Thermal Flow Meter from Fluid Components International (FCI) could help solve these issues.
Flare gas measurement issues
The accurate measurement and disposal of flare gases is essential to manage potentially hazardous combustible, flammable and toxic gases. Accurate measurement allows them to be processed efficiently to protect people and equipment. The combustible and flammable properties of hydrocarbons make their handling a highly regulated process, requiring flowmeter design certifications from multiple international approval agencies including FM, FMc, ATEX and IECEx to name a few.
Measuring flare gas is challenging for several reasons. These issues include mixed gas compositions, highly variable flowrates, multiple line sizes, lack of available pipe straight-run, limited access for installation or maintenance, and the effects of corrosion. Only a few flowmeter sensing technologies are robust enough to meet these
many demanding requirements while providing accurate, repeatable gas flow measurement.
The solution
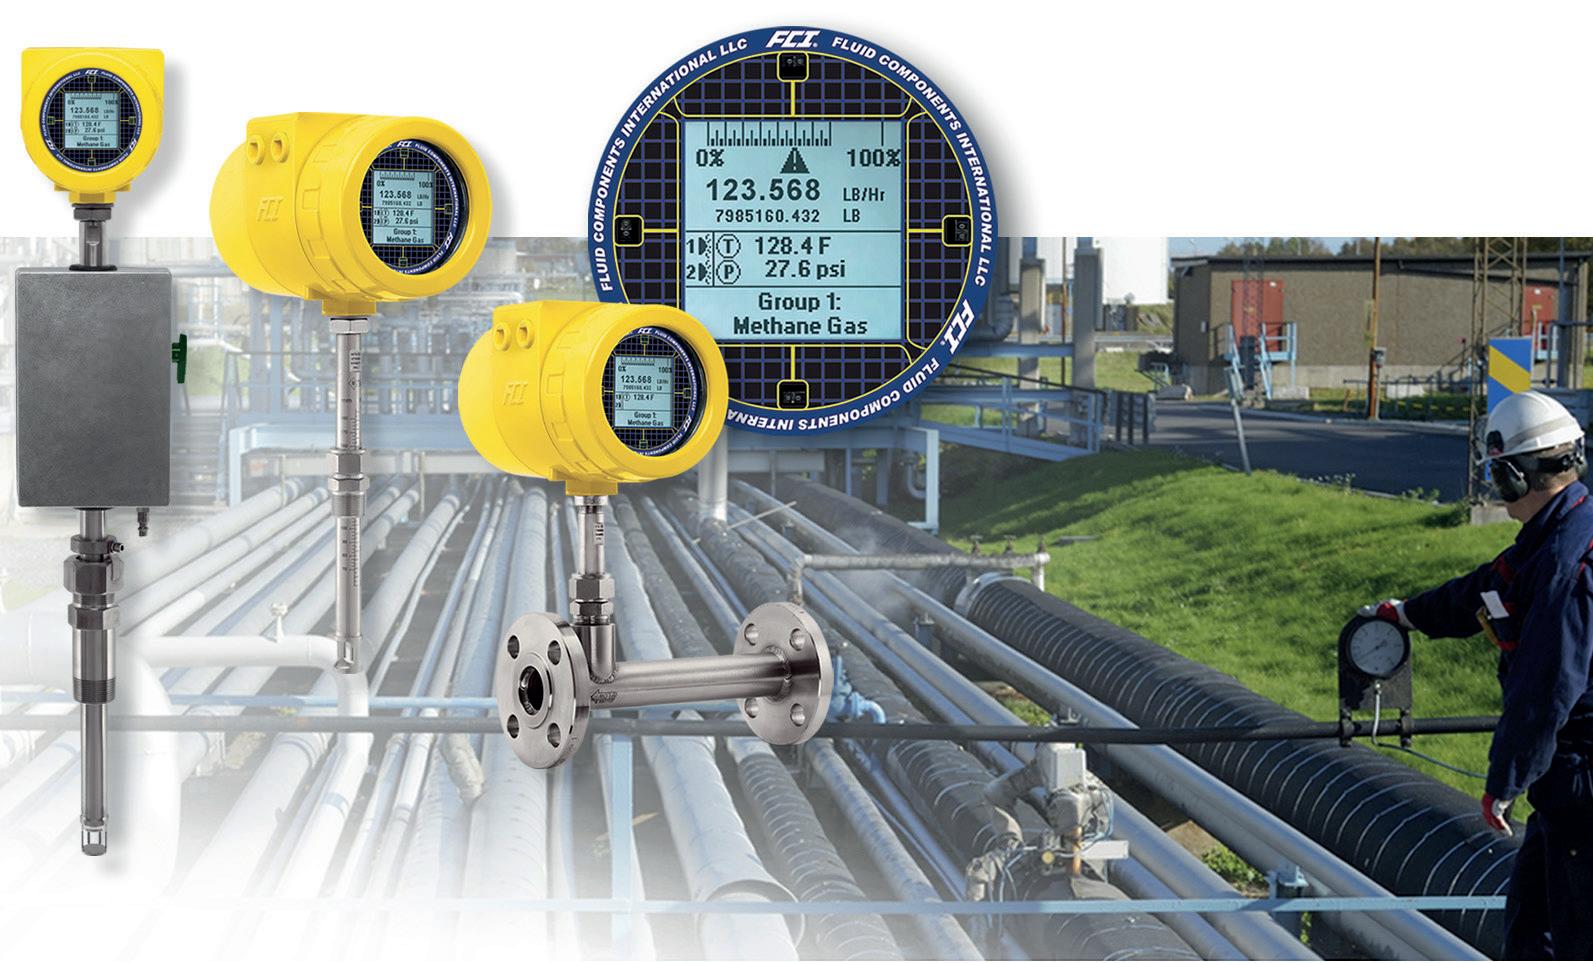
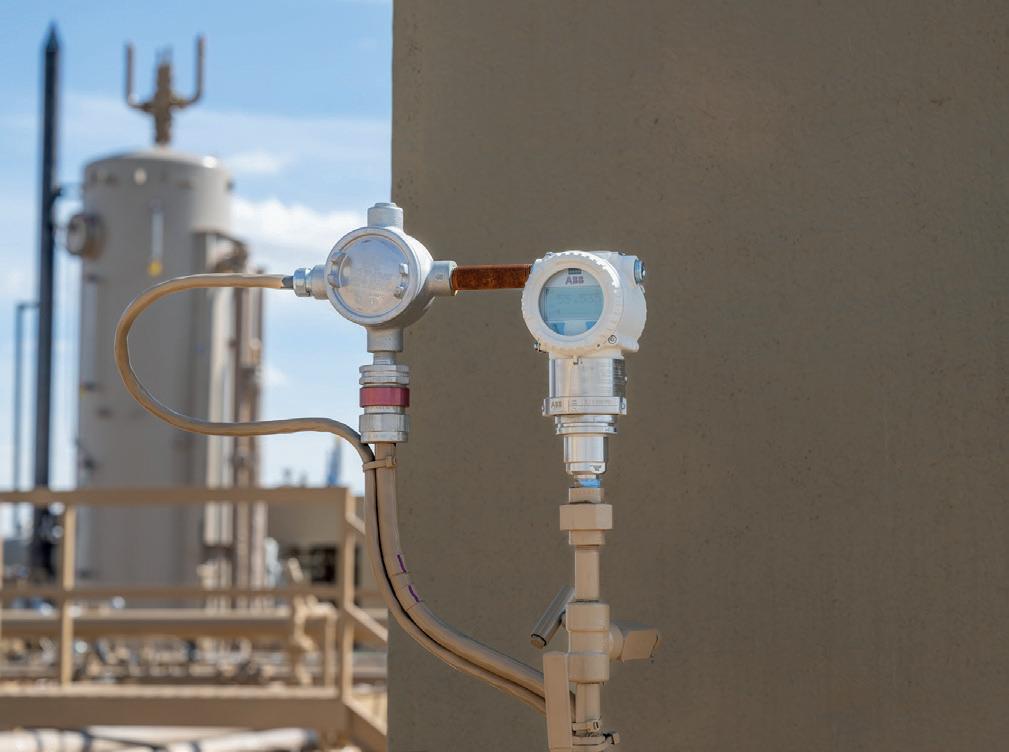
The FCI application engineers recommended to Hoover Energy the ST100A Series Thermal Flow Meter. FCI’s proven thermal dispersion, EPA Quad O compliant ST100A Flow Meters (Figure 3) offer highly accurate and repeatable gas flow measurement in hazardous areas to assist in compliance with environmental mandates. They are direct mass flow measuring devices, producing flow rate and totalised flow output signals and readouts in lb. (kg), or t of emitted gases for monitoring and reporting.
FCI’s versatile thermal mass gas flowmeters are internationally deployed in air pollution monitoring and other industrial air/gas measurement and control applications across many different industries including oil/gas refineries and chemical plants. They offer ease of installation, require little to no maintenance and offer a long life, which provides for an exceptionally low cost of ownership.
The ST100A Series Flow Meters combine ultradependable and feature-rich electronics for fast response and range-ability. They operate over a wide range: the insertion style measures flow from 0.25 – 1000 f/s (0.07 to 305 m/s); the inline meter measures flow from 0.0062 – 838 f 3 /min. (0.01 – 1425 m 3 /hr.) with turndown ratios up to 1000:1.
The ST100A transmitter’s outputs are a match to existing plant DCS, PLC, SCADA, recorder, or alarm systems. For local display, the ST100A Meter features a graphical, backlit LCD that is unmatched in showing what is happening in the pipe. Flowrate, totalised flow, and temperature are continuously displayed in both a digital and bar graph presentation, while alarms and/or diagnostic messages will display as needed to alert operators. Their large screens and intuitive displays make it easy for field technicians to perform instrument set-up and continuously monitor the process data.
The ST100A Meters insertion style meters require only a simple, single tap point into a pipe to install. Instruments are available for line sizes from 0.25 to more than 100 in. Furthermore, FCI’s accuracies of ± 1% reading, ± 0.5% of full scale exceed the stated acceptable accuracy within the newest US EPA regulations and reporting requirements.
The results
The new ST100A Flow Meters were the accurate, flexible, reliable solution needed by technicians at Hoover Energy. This thermal flowmeter provided them with a flexible, accurate, safe gas flow measurement instrument. Highly dependable and repeatable measurements with the ST100A
Flow Meters helped Hoover Energy’s customer process and plant engineers meet their flare gas environmental monitoring and reporting requirements while at the same time safely and efficiently moving gas through their pipelines.
After a period of time, the engineers at FCI suggested the technicians at Hoover Engineering consider switching to the newer ST110A Series with multiple gas calibration groups. This feature allows the user to store up to five separate gas calibrations in a meter, which in this case Hoover chose to program for each of the typical line sizes encountered in the field: 4, 6, 8 and 10 in. lines along with the in situ VeriCal flowmeter calibration verification feature.
All FCI products are tested and calibrated to rigorous standards prior to customer shipment to ensure users get the instrument that does the job they specified. They are calibrated to real world gas compositions rather than to air equivalencies, which are frequently inaccurate under installed field conditions. To design and produce the highest quality flow instrumentation, FCI operates its own world-class, fully NIST traceable flow calibration laboratory that is certified to meet such stringent standards as MILSTD 45662A and ANSI/NCSL Z-540.3.
Many flare meter installations, either per plant requirement or for compliance with environmental regulations, require regular periodic validation of flowmeter gas calibrations. Traditionally, this has required a tedious and costly project to remove the meter from service and return it to a calibration laboratory, which is particularly frustrating if the meter is found to still be within its original calibrated specifications.
FCI’s exclusive VeriCal option eliminates the need for unnecessary de-installations, shipping and time delays. The VeriCal system provides a simple-to-use built-in tool to verify the FCI flowmeter is still within calibration without extracting the meter from pipe. There is no need to retract or remove the meter from the process piping or to suspend operations.
The VeriCal self-test feature initiates an electronic, three point calibration drift self-test. In the test mode, the meter automatically and sequentially substitutes three precision resistors into the measuring circuit and compares the resulting measurements against the same measurements at factory calibration.
Technicians have been using the highly flexible ST110A Flow Meters with multiple line size calibration groups and the VeriCal feature now for several years. There have been no incidents or problems with the meters, and best of all the technicians say there have been no more wasted trips to the field only to discover they did not have the correct meter they needed on their skid system to complete their mobile testing and data reporting projects.
Figure 3. FCI ST100A Series flowmeter.
Nora Brahmi and Pierre Sutter, Vallourec, France, highlight the engineering challenges that arise with expanding offshore projects as higher hydrostatic pressures, longer risers and intricate installations require adaptable and reliable solutions.
he rapid expansion of offshore projects into deeper waters and increasingly complex conditions is reshaping the line pipe material technical requirements. Higher hydrostatic pressures, deeper waters and longer risers, and intricate installations create unprecedented engineering challenges that call for innovative, adaptable and reliable solutions. Vallourec, a world leader in premium seamless tubular solutions, directly addresses these challenges with its X80 line pipe grade, specifically engineered to endure harsh offshore environments while providing a cost-efficient,
high-performance solution. Purpose-built to perform under the extreme pressures and stresses of offshore development, Vallourec’s X80 seamless line pipe grade offers outstanding mechanical resistance and weldability properties, delivering essential benefits to operators in the most demanding conditions.
Meeting
the demands of deep offshore development
Vallourec designed the X80 seamless line pipe grade to address the pressing needs of offshore operators, whose work environments are becoming increasingly challenging. With extreme hydrostatic pressures, extended riser lengths, complex layout requirements, and corrosive conditions, operators face an array of engineering hurdles. These demands necessitate line pipe solutions that deliver high strength, flexibility, and durability for diverse, high-stakes applications. Vallourec’s X80 seamless line pipe grade meets these needs with advanced technical characteristics that combine exceptional material strength and toughness in a way that simplifies both design and installation.
X80’s high-strength grade allows for a reduction in wall thickness of up to 20%, compared to standard X65 line pipe grades at similar design pressures, offering a significant advantage by lowering the pipe’s weight while retaining structural integrity and safety. This lighter pipe design brings an array of benefits, including the ability to shift to simpler configurations, for instance changing from Steel Lazy Wave Riser to Steel Catenary Riser, which reduces buoyancy requirements and optimise vessel tension. By streamlining the design, the X80’s reduced weight also helps operators decrease installation costs and vessel top-tension demands, ultimately delivering a solution that minimises overall project expenses and environmental impacts.
Robust mechanical performance and versatility
In addition to its strength and lighter design, Vallourec’s X80 seamless line pipe grade’s adaptability allows it to perform well
across various offshore configurations. It’s compatible with S-Lay, J-Lay, and Reel-Lay installations, making it a versatile choice for offshore varied installation techniques. A critical factor enabling this versatility is Vallourec’s X80 line pipe grade proven weldability, an essential quality in offshore line pipe projects. It has been successfully tested for girth welding using a Gas Metal Arc Welding (GMAW) process that requires a minimum preheating temperature of only 125°C, reducing setup time and streamlining on-site welding. Overmatching is achieved with an optimised combination of filler material and pre-heat temperatures.
Vallourec’s X80 seamless line pipe grade’s mechanical performance has been verified through extensive testing, showing outstanding toughness properties at low temperature. It exhibits an average impact toughness of 300 J (220 ft·lbf) in the pipe body and over 100 J (73 ft·lbf) in heat-affected zones (HAZ) at -30°C, a level that exceeds the requirements of the DNV-ST-F101 standard. This performance level assures operators of Vallourec’s X80 line pipe grade’s suitability for severe offshore environments, where extreme conditions are common. The actual available size range for Vallourec’s X80 seamless line pipe grade covers outer diameters from 219.1 mm to 406.4 mm (8.625 to 16 in.) and wall thicknesses between 25.4 mm and 40 mm (1 to 1.6 in.), allowing operators to select dimensions tailored to their specific project requirements.
Enhanced performance in sour service conditions
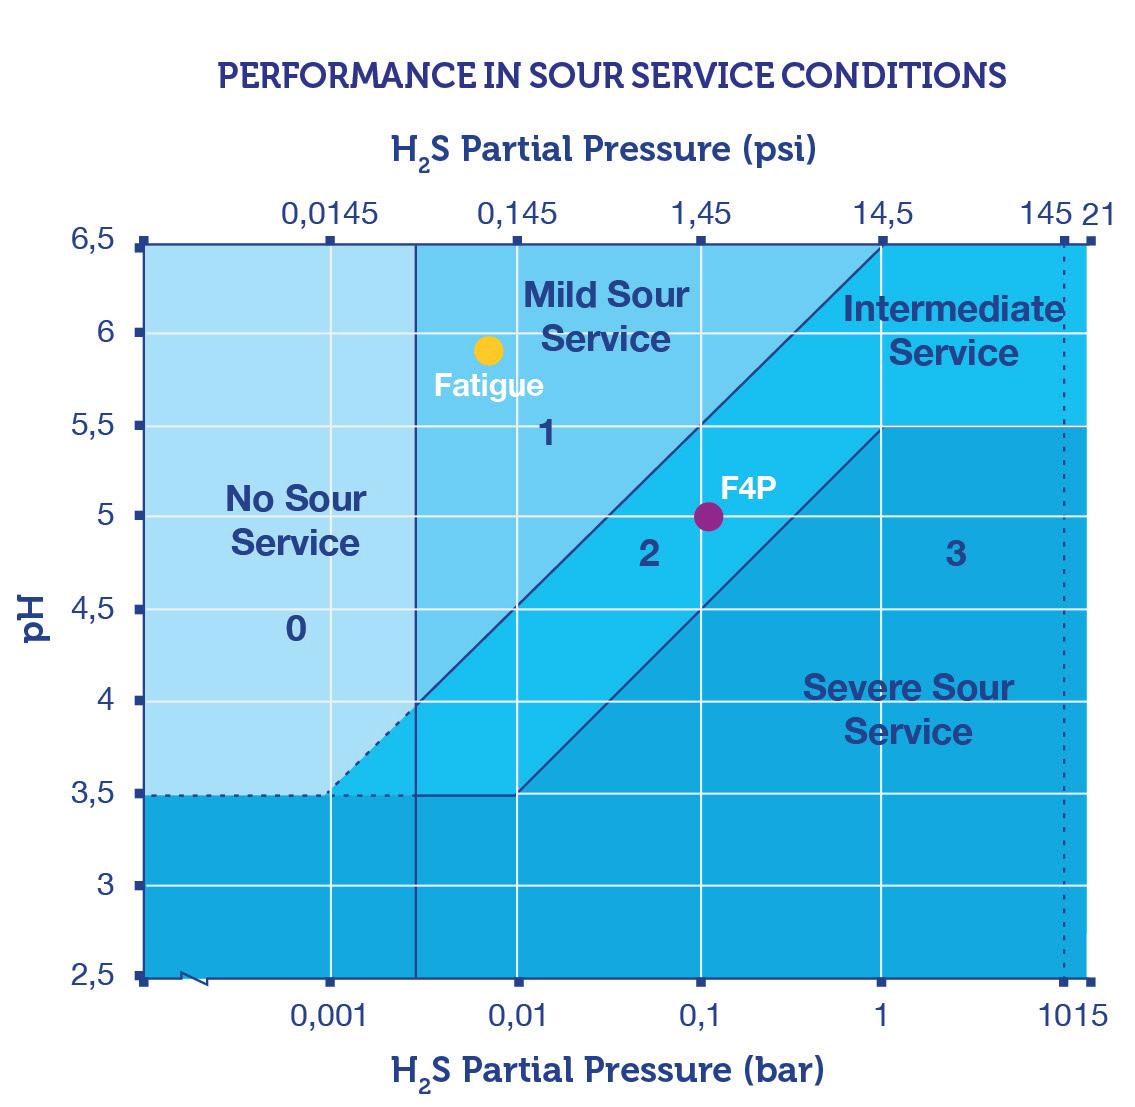
Beyond the challenges related to mechanical performances posed by offshore environments, operators also face additional constraints for applications in corrosive environments where hydrogen sulfide (H2S) is present. Vallourec’s X80 seamless line pipe grade addresses these risks with reliable resistance to Sulfide Stress Cracking (SSC), making it a robust choice for applications in mild and intermediate sour service environments (corresponding to regions 1 and 2 of the domain diagram defined in NACE MR 0175/ ISO 15156-2). Seamless pipe base material and girth welds samples have been tested in static loading as per NACE TM0316 using fourpoint bend test specimens and considering root left intact for the girth weld. No SSC crack occurred at pH 5.0/1.45 psi H2S/85% SMYS in NACE TM0177 solution B (region 2).
In cyclic mechanical loading conditions (corrosion fatigue in presence of H2S), both seamless pipe base material and girth weld samples demonstrates comparable performance to the widely used X65 grade in mild sour conditions, offering assurance for operators with offshore projects in areas exposed to H2S. Vallourec’s X80 line pipe grade strong performance in these environments makes it a dependable solution for the complex realities of sour service environments.
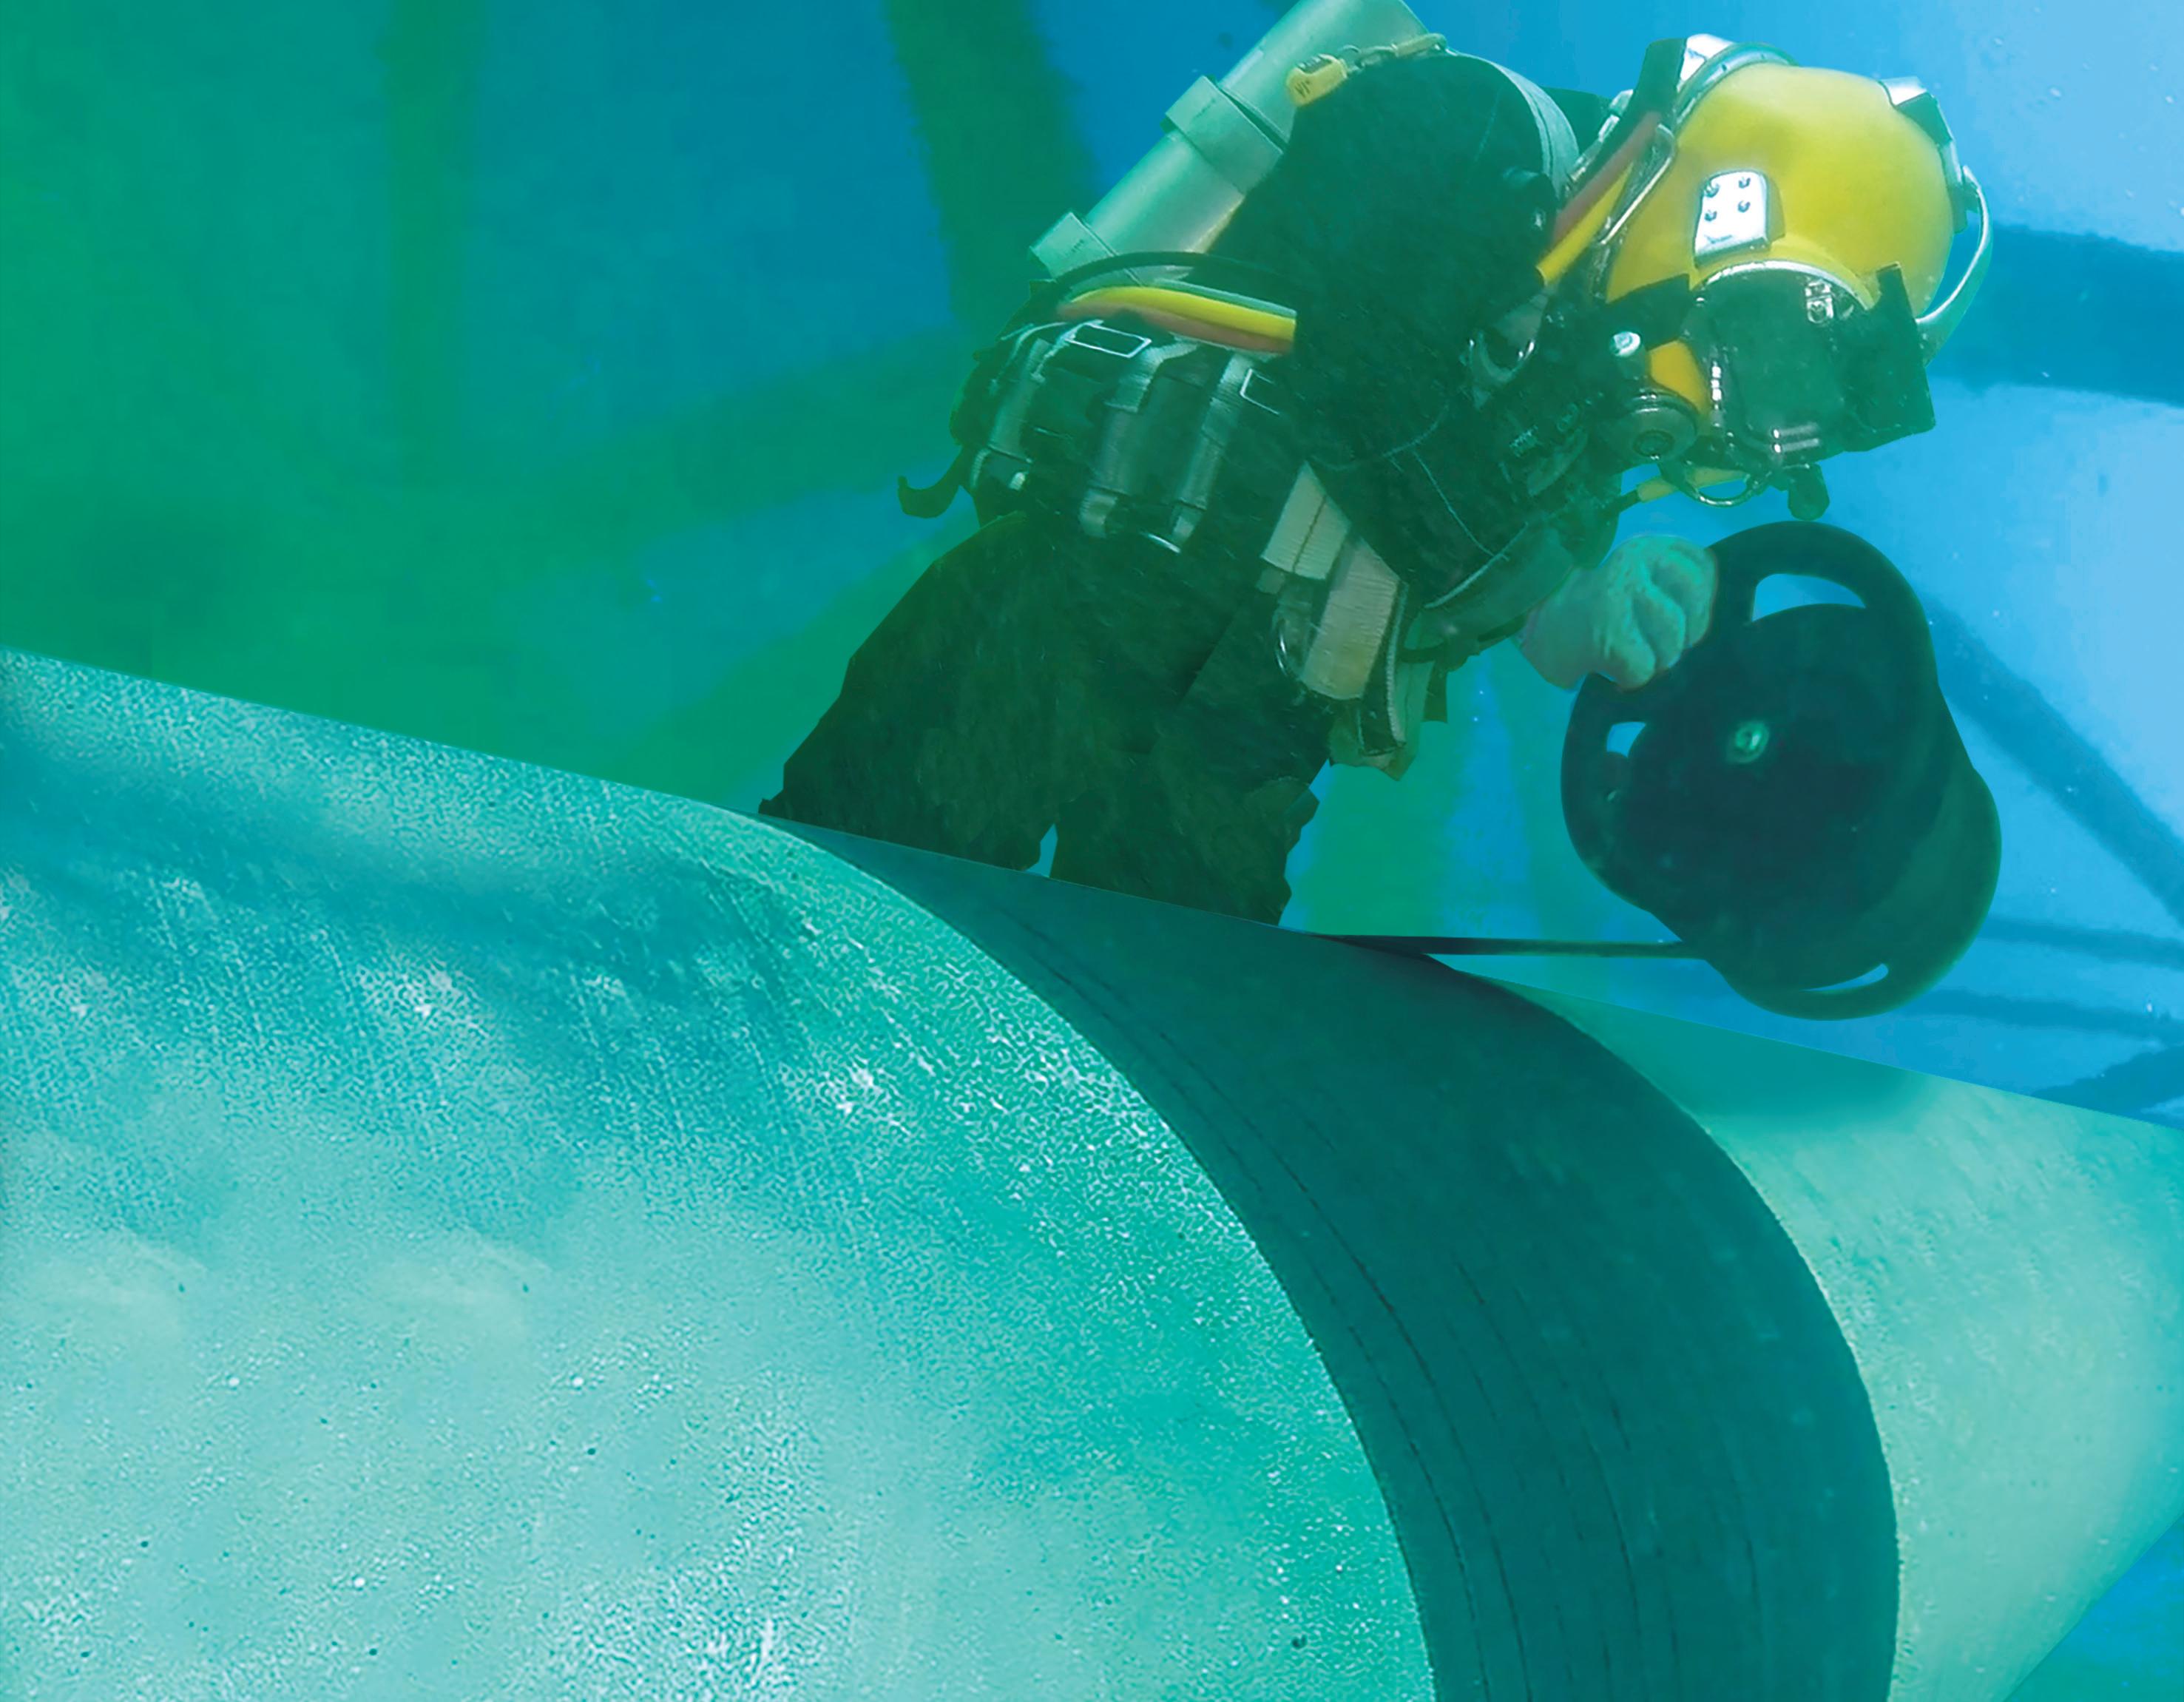
Case study: South American offshore development
In 2023, Vallourec’s X80 line pipe grade played a crucial role in a South American offshore development, highlighting the grade’s unique advantages in real-world applications. This project required seamless line pipes that could endure extreme pressures and depths while withstanding sour service conditions due to H2S presence in the reservoir. Vallourec supplied over 2000 t of X80 seamless line pipe to fulfill the project’s demands, taking advantage of X80’s reduced weight, high strength, and resistance to corrosive conditions to ensure pipeline integrity and operational efficiency.
Figure 2. X80 is resistant to mild and intermediate sour environments (NACE Regions 1 and 2).
Expect A Higher Standard
One key benefit realised in this project was the lighter weight of X80 seamless pipes, which directly reduced installation costs by enabling the operator to use a Steel Catenary Riser configuration. This configuration minimised the need for additional buoyancy modules, which, combined with reduced vessel top-tension requirements, led to substantial cost and time savings. Vallourec’s X80 line pipe grade ability to perform consistently under the high-pressure, high-corrosion environment of the South American project underscored its effectiveness in complex offshore applications and cemented Vallourec’s role as a leading partner for offshore solutions.
Bertrand de Rotalier, Senior Vice President of New Energies, Project Line Pipe, and Process Piping business lines, observed, “Vallourec’s X80 grade represents a major advancement for the offshore industry, enabling operators to meet the most demanding challenges while reducing costs. The results from our projects in South America demonstrate the value X80 brings in addressing both technical and economic demands.”
Sustainable production and certified project management
In addition to its superior technical performance, Vallourec’s X80 line pipe grade is manufactured with a commitment to sustainable practices. Production takes place at Vallourec’s Jeceaba seamless pipe facility in Brazil located in the state of Minas Gerais, where the company has implemented a low-carbon footprint
manufacturing route supported by its extensive forest estate used for production of the charcoal involved in the steel making process. This forest acts as a large carbon sink, offsetting CO2 emissions and further aligning Vallourec’s operations with the global shift toward sustainable practices. As a result, the carbon footprint of line pipe products manufactured in Vallourec facilities in Brazil is 1.03 t of CO2e per t of tube.1 By adopting this low-carbon footprint approach, Vallourec not only reduces the environmental impact of its production processes but also helps operators meet their sustainability targets.
Moreover, Vallourec supports each X80 seamless line pipe deployment with certified project management that adheres to ISO 21502 and 21503 standards. This certification ensures a streamlined project process from start to finish, with Vallourec providing a single point of contact for each project to coordinate every step, from contract review through production to delivery. With this structured approach, Vallourec is able to boost project efficiencies, reduce risks, and ensure on-time delivery – all of them being critical factors for operators working within tight timelines in offshore environments.
Future developments and expanding applications
Vallourec is working on an extension of the capabilities for its X80 seamless line pipe grade, ensuring it remains a leading solution for offshore projects. This includes ongoing industrial trials to extend the available size range and research and development project to enhance the resistance to even more stringent sour service conditions, addressing the needs of operators as they move into progressively more challenging environments. Vallourec’s R&D teams are also actively collaborating with industry partners to assess X80 seamless line pipe’s potential applications in deeper, more extreme conditions, solidifying the grade’s adaptability in offshore settings.
Through these continued advancements, Vallourec aims to position its X80 seamless line pipe grade as the standard for highstrength, corrosion-resistant line pipe solutions for deep offshore developments. As offshore operators increasingly prioritise materials that can perform reliably under harsh conditions while offering cost-effective solutions, Vallourec’s commitment to X80 seamless line pipe grade’s evolution aligns with the industry’s future directions, providing operators with a proven, forwardlooking solution.
Transforming offshore line pipe solutions
Vallourec’s X80 seamless line pipe grade represents a significant advancement for the offshore oil and gas industry. Combining high strength with reduced weight and robust corrosion resistance for sour service, X80 effectively addresses the pressing needs of operators in deep and harsh environments. As an enabler for lighter design, it allows for more efficient installation configurations, which, coupled with its superior performance in sour service conditions, makes X80 a standout solution for offshore projects requiring both high mechanical performance and cost-efficiency.
References
1. Environmental Product Declaration: Vallourec PLP Solutions South America 2024.
Figure 3. X80 welding can be performed using Gas Metal Arc Welding process at a minimum preheating temperature of 125˚C.
nline inspection (ILI) systems are developed with complexity in mind. This is evident whenever additional features exist in a pipeline, such as welds, casings, complex corrosion, or mechanical damage. In this article we will explore how a true Ultra-High Resolution MFL ILI system, utilising advanced datasets paired with experienced data analysts, tackles one of these additional features: girth welds.
Rick Desaulniers, Principle Technical Advisor, ILI – ENTEGRA, analyses the key aspects of dealing with the problem of volumetric metal loss at girth welds.
Volumetric loss and girth welds
While all weld areas are cause for deeper evaluation, girth welds are known to show volumetric loss resulting from both corrosion and welding procedures. The most common type of volumetric metal loss at a girth weld is corrosion, which rightfully demands attention. In this article we examine a case study when an operator asked ENTEGRA® to focus on the unique indicators of volumetric metal loss produced by the welding procedure itself. The operator was interested in testing for the best possible ILI technology to detect these flaws and asked ENTEGRA to partner on the project. This welding anomaly is not unique: pipelines of various ages may contain girth weld flaws that have initially passed hydrostatic tests despite the flaws.
Before we begin to discuss some of the work performed in this case study, you can see a brief visual description of the various weld types in Figure 1, which shows seven of the most common weld indications compared to a normal girth weld cross section.
Attacking the problem proactively
Historical identification of girth weld flaws by MFL ILI tools and the failure of girth welds in a small handful of pipelines has led some pipeline operators to proactively investigate these flaw types. Throughout the past year, ENTEGRA has examined a series of girth weld flaws as a part of a case study with a pipeline operator, often through cut-outs. This extended focus gave the ENTEGRA Data Analysis team an opportunity to provide categorisation of these feature types by comparing these cut-outs to Ultra-High Resolution ILI data. As technology and expertise progresses, differentiating metal loss/corrosion and girth weld anomaly types has become easier utilising our visualisation software (Envision).
When we issued the ‘Girth Weld Report’, ENTEGRA marked anomalies believed to be from the construction process as “Girth Weld Indications,” or more simply, “Weld Indications.” First, we gave an example of an acceptable weld, pictured alongside welds that have detectable volumetric features.
Once we compiled a list of Weld Indications, further evaluation was required to determine more precisely the severity of the weld indication and, if possible, the origin or identification of the anomaly type. To determine severity, the width (circumferential direction) and signal strength (amount of flux leakage measured by tool) were taken into consideration. Length (longitudinal direction) is not a major factor when evaluating girth welds because length is always going to be at a maximum: the thickness of the girth weld or something slightly less. Possible origin (type of weld indication) was determined by the nature (pattern) of the signal and width. For example, a porosity issue, described as small pinhole-type voids in the mid-wall of the weld, will not have considerable width, whereas a suck back or lack of penetration can have measurable width.
Once we finished evaluating the welds, the operator was offered a ranking of the welds to prioritise the anomalies, called a Girth Weld Assessment. These classifications are defined as Weld Indication 1, Weld Indication 2, and Weld Indication 3. A Weld Indication 1 is considered a higher priority or greater severity ranking anomaly relative to the other classification types. Then we generated a list defining these girth welds anomalies if they fell into one of these rankings.
Figure 3. Sample weld X-rayed and correlated with ILI findings.
ENTEGRA provided this list to the pipeline operator, paired with a detailed discussion. Next, we worked with the operator to put a plan in place to determine which sites to excavate. Ideal targets were selected for validation. Then, the results were correlated.
One thing to know is that when excavating for validation, the process may not be as straightforward from a visual perspective as one would like. In most circumstances the target feature is found on the internal surface, which causes the operator to rely upon UT and X-ray devices for an understanding of the origin of the feature and severity of the anomaly.
Next, correlation
As we pursued correlation of girth weld metal loss with the pipeline operator, the first step the operator took was to make the initial correlation of the feature by aligning the X-ray of the girth weld with the ENTEGRA ILI data to identify positive presence of the volumetric features, before any further examination happens. When beginning correlation, it is important to be certain that the girth weld exposed is the same girth weld identified in the ILI report.
An example of the correlation set up by the operator in Figure 3 shows how the X-ray was matched to the ILI data. This example is taken from a test weld set up by a pipeline operator to develop confidence in the ability of the tool
• Propipe provides a suite of services to ensure a successful project including full pipeline review, cleaning pigs and Trident SMART gauge.
• Propipe pigs all designed pipelinespecific for best performance.
• Trident pig tracking and APEX AGM plus SMART Gauge and Datalogging for full data assessment.
Figure 4. Sample weld X-rayed and correlated with ILI findings.
to detect weld indication-type flaws before engaging in a full inspection programme.
In Figure 3, there are three windows aligned, A, B, and C, representing the full circumference of the girth weld:
) Window A is an X-ray of the complete circumference of the girth weld, taken by the NDE technician.
) Window B is generated by ENTEGRA to obtain a cross-section of the height of the girth weld, relative to the overall height around the circumference as recorded by the ENTEGRA ILI tool.
) Window C is a bird’s-eye view of the girth weld.
In the X-ray images, greys or blacks indicate less material or voids in the weld, while bright whites indicate excess material (slag) at the girth weld. In the ILI data images (windows B and C), window B is the cross-section slice indicating the relative material thickness (height) at the girth weld. The darker blues indicate more volumetric material while areas without blue along the weld pass represents less material (less height). In the bird’s-eye view, this image provides similar colour breakdown as seen in the cross-sectional view. The weld flaw types (i.e. slag, burn-thru, etc.) are labelled in the X-ray image.
When the two ILI images are aligned to the X-ray, a direct correlation can be achieved defining areas where excess material (slag), lack of penetration, and burn-thru are present. Figure 4 shows another example of an X-ray image paired with the corresponding ILI data, indicating the ILI tool detected volumetric material changes at the girth weld, indicated by the different colours in the data. Once again, the flaws are labelled in the X-ray and correlation was achieved.
At the completion of this test involving approximately 20 girth welds, the correlation results were used to determine the confidence of ENTEGRA’s results. In each example, relative thickness of the girth weld was mapped quite accurately with the intended anomalies in the pull-test pipe.
Real-world experience
After seeing the successful correlation tests, the pipeline operator utilised a live run to identify and classify the girth welds. Once this survey was completed, ENTEGRA submitted a report containing a summary of the anomalies present with severity ranking classifications.
A total of nine welds were short-listed due to the potential for them to present a greater severity of volumetric loss. All nine were X-rayed, and four of the nine were cut out. The X-rays were completed prior to pipe being cut out to ensure volumetric anomalies were present at the target locations and then submitted to the lab for more detailed quantification of the results. An example of one of the X-rayed welds compared to ENTEGRA ILI data is presented in Figure 5. It is displayed in a similar fashion as the layout seen in Figures 3 and 4.
At the 6:00 position on the pipe a noticeable void was evident in the X-ray and correlated well with the indication seen in the ILI data (painted in red). The pipe was cut out and examined within a laboratory setting to better understand the volumetric feature first reported by the ENTEGRA ILI tool.
The findings from the lab are laid out in Figure 6, revealing the details of the location. The pipe was examined on the external and internal surface and sliced through the middle for a side profile view of the anomaly.
Correlation of the anomaly from the ENTEGRA ILI data set was achieved. Each one of the four cut-out sections showed similar findings as seen in Figures 5 and 6. At each location a volumetric metal loss anomaly was present, created from the construction of the girth weld. In most of the cases the findings revealed lack of penetration and voids as the source of the volumetric loss in metal.
Future findings
ENTEGRA plans to build on the knowledge gathered through this experience. Future tests will attempt to size the metal loss within the girth welds. ENTEGRA has learned through these digs and other correlation tests that the predicted depth of the metal loss is more accurately represented when the thickness of the weld bead is compared to the depth of the metal loss at the time of the excavation. If the adjacent body wall thickness is used to calculate percent depth, this could lead to a predicted depth that would result in an oversizing of the anomaly by the ILI tool.
As we continue to expand upon this work, Girth Weld Indications will become more detailed. The depth measurements used for comparison to the weld bead will also be used to further classify weld flaw type. Another example could be that anomalies that contain more circumferential width may lead to a classification of lack of penetration or suck-back type features.
MFL tools are very good at detecting volumetric changes in metal, regardless of if there is additional or reduced metal within the wall thickness of the pipe. This applies not only to the body wall of the pipe, but also to the weld regions within the pipe such as the girth welds discussed here. The probability of detection (POD) for metal loss features in welds exceeds the 90% threshold, provided the features meet the minimum dimensional classifications as defined in the performance specification. Utilising the ENTEGRA true UHR tool – with highdensity sampling and sensor spacing and a flexible design that keeps sensing devices in contact with the weld – improves the opportunities to accurately report features at the weld. With the significance and complexity of welds and their role in a pipeline, operators can utilise this detailed reporting to make proactive choices when developing their integrity plan.
Figure 6. Weld indication examined internally and cut for side profile.
Anupama Pantheeradiyil, Blueye Robotics, discusses safer and efficient methods for inspecting offshore infrastructure and how ROVs are reshaping how pipeline, FPSO, and confined-space inspections are carried out.
ipeline infrastructure, especially in the oil and gas industry, is vast and essential for the safe and efficient transport of resources. Regular inspections are crucial to prevent damage, leaks, and costly downtimes. Traditionally, these inspections have relied on human divers or large remotely operated vehicles (ROVs), or work-class ROVs but advancements in compact ROV technology, underwater drones from Blueye Robotics are changing how these inspections are conducted.
Pipeline inspections, particularly for long-distance pipelines, present several challenges. These pipes can stretch for thousands of metres and often include sensors, valves, and critical junctions that require close monitoring. Large ROVs, while effective in open areas, are not always suitable for specific, confined sections of the pipeline, especially near platforms or at pipe intersections. Blueye ROVs – such as the Blueye X3 – are designed to navigate and inspect specific points like leg platforms, fixed platforms, and wellheads with minimal risk to the structure.
Frequent inspection of hard-to-reach areas
Because traditional ROVs can’t always reach confined sections, one of the core advantages of Blueye ROVs is their ability to inspect pipeline sections that divers and larger ROVs cannot access easily. Areas such as platform legs, mooring systems, and confined spaces within cooling or ballast tanks often remain difficult to inspect, creating risks if problems go undetected. The small size and agility of Blueye ROVs allow for inspection within tight structures, including intricate pipeline systems and standing platforms.
This capability enables operators to perform more frequent, quick-check inspections of pipeline end terminals or junctions –critical points where leaks, biofouling, or structural defects might emerge. With a Blueye ROV, crews no longer have to wait for a scheduled large-scale ROV deployment and can instead monitor pipelines proactively. This increased frequency of inspections minimises downtime and helps operators maintain the structures through timely maintenance. The ROVs are designed for single person use, are portable, and can be easily operated; they take only minutes to connect and deploy, making them an excellent tool for everyday tasks and operations.
For instance, Noble Corporation recently used the Blueye X3 for a critical thruster inspection on a drill ship in Ghana, where fishing nets were suspected of entangling the aft thruster. By deploying the X3 underwater drone, Noble confirmed the thruster was clear, saving significant operational time and preventing a costly drilling stoppage, which would have cost up to US$200 000. This efficiency can be applied to pipeline-specific issues, where time-sensitive inspections are crucial for preventing shutdowns.
Targeted inspections of pipeline transit points and FPSO components
The unique vertical design of the ROV, with its low centre of gravity and balanced buoyancy, provides excellent stability for underwater maneuvering and recording. This stability allows it to efficiently inspect critical points like platform legs, valves, and junctions – where large ROVs struggle to maneuver.
Congested and complex environments, like pipeline intersections near rigs or inside Floating Production Storage and Offloading (FPSO) units, which process and store oil and gas in deep water, require routine and frequent inspection to ensure safety. Blueye ROVs can smoothly access these specific points without risking damage to infrastructure.
Real-time damage assessment and leak detection
Timely detection of leaks or structural damage is crucial for the safe operation of offshore pipelines. The Blueye X3, equipped with the advanced Oculus M750D Sonar, allows operators to quickly
Figure 1. The Blueye X3 ROV.
Figure 2. First conductor guide taken with the Blueye ROV.
Figure 3. Drone footage from a ballast tank inspection. Image courtesy of Dean Duric, Noble Corporation.
Figure 4. Screenshot from the thruster inspection footage, showing that the thruster was clear of fishnets or entangled ropes. Image courtesy of Noble Corporation.
XXL PIPES
HDPE piping systems for intakes & outfalls
• OUTSTANDING LIFE SPAN
• FAST AND EASY INSTALLATION
• FOR HIGH-VOLUME FLOWS
• HIGH-QUALITY MATERIALS
• EXPERTISE IN PLASTICS PROCESSING
agru Kunststofftechnik Gesellschaft m.b.H.
Ing.-Pesendorfer-Strasse 31 | A-4540 Bad Hall
Quality cutting heads from Bor-it slice through rock, clay, sand or dirt and are built with only the best materials available today. Sizes range from 4” to 60” in diameter. With Bor-it earthbounding machines, heavy duty rock cutting heads and augers, you can get earth shattering results too! Visit us aw www.bor-it.com
identify and assess damages, such as cracks, corrosion, or sediment buildup that could affect pipeline integrity. The sonar technology provides visibility up to 120 m, which enables operators to detect issues over larger areas.
For example, the Blueye X3 ROV equipped with sonar and positioning systems was used to locate the damaged Nord Stream 1 pipeline. Using the sonar viewer with a range up to 120 m, the Blueye team confirmed that the blast impacted a larger part of the pipeline.
This real-time feedback enhances inspection accuracy and supports prompt maintenance actions, ultimately reducing the chances of more severe damage. Additionally, the integration of sonar with the ROV’s onboard cameras improves visibility in murky conditions, helping operators get a clear and comprehensive view of the pipeline’s state.
Enhancing safety and risk mitigation for pipeline inspections
Blueye ROVs are designed to enhance inspection safety, especially by reducing the need for divers in hazardous underwater environments. Confined or dangerous spaces, such as sea chests, ballast tanks, and restricted areas near FPSO units, pose a high risk for human divers. In these challenging environments, Blueye ROVs can take over the inspection tasks, reducing the need for divers to be exposed to these conditions and significantly decreasing the chance of accidents.
In pipeline inspections specifically, these ROVs can monitor areas requiring regular assessments and contributing to safer operations and lower operational costs over time.
User-friendly, efficient operation, and comprehensive reporting
Blueye ROVs are designed to be user-friendly and can be deployed within a minute, making them practical for quick, unscheduled inspections. With a diving capability up to 305 m (1000 ft) and the option for custom depths, Blueye ROVs offer up to five hours of operational time, supporting extended or repeated inspections during a single deployment.
The reporting feature further supports inspection teams by consolidating dive data into comprehensive reports that can easily be shared with colleagues or stakeholders. Inspectors can annotate findings, highlight critical issues, and ensure thorough documentation of underwater operations. This reporting tool improves communication, enhances decision-making, and simplifies follow-up actions, making it an invaluable resource for teams managing multiple pipelines or coordinating maintenance tasks across departments.
About the company
Blueye Robotics is a Norwegian company based in Trondheim with roots in the highly renowned Centre for Autonomous Marine Operations and Systems (AMOS) at NTNU. Since 2015, the overarching design goals have been exceptional ease of use, portability, and robustness. The first underwater ROV model was launched in 2019. Since then, Blueye Robotics has developed a range of advanced underwater ROVs to meet diverse industry needs. Today, the company offers three models: the Blueye Pioneer, the Blueye X1, and the Blueye X3.
Figure 5. Trond Larsen from Blueye Robotics looking for the damaged Nord Stream 1 pipeline with the help of sonar.
Figure 6. Leak from a gas pipeline captured using the Blueye X3 with sonar. Leakage can be seen in the sonar imagery too.
Figure 7. Person launching the Blueye X3 ROV from boat to water.
Figure 8. Person inspecting using the Blueye X3.
he need to ensure exact custody transfer of oil and gas from producer to customer calls for equipment that can offer the highest levels of measurement accuracy. With even a slight inaccuracy potentially resulting in losses of hundreds of thousands of dollars for either the vendor or the purchaser, the need to safeguard against errors is of paramount importance.
Without a precise account of what’s been delivered, operations cannot accurately charge for their services, potentially resulting in major financial implications. As well as lost
David Bowers, ABB, explains the benefits offered by Coriolis mass flowmeters for custody transfer installations and the key factors involved in selecting a flow computer to calculate measured values.
revenue, these implications can also include potential breach of contract and incorrect calculation of the taxes that need to be paid on the transaction, which could incur penalties from the relevant authorities.
For this reason, custody transfer measurement is closely monitored, with a number of industry bodies regulating standards around the world.
With accuracy key to correct custody transfer, it is vital to pick the equipment that will be able to offer the highest levels of measurement performance.
A typical custody transfer installation will comprise of flowmeters, pressure and temperature transmitters, installed in a pipeline close to the point of delivery. These devices will be connected to a flow computer that will combine the various measured values to calculate the quantities of oil or gas that are being transferred.
Choosing the right flowmeter
As the primary method of measuring flows of oil and gas from the pipeline to the customer, flowmeters effectively constitute the front end of a custody transfer system. The need for high measurement accuracy, coupled with the characteristics of oil and gas flows necessarily restricts the range of available flowmetering technologies to a handful of choices.
Of the various flow measurement technologies on offer, those most appropriate for use in custody transfer application can be divided into five main categories. Four of these – differential pressure flowmeters, turbine flowmeters, positive displacement (PD) flowmeters and ultrasonic flowmeters, operate on the volumetric flow principle, measuring the volume flow of liquids or gases.
The fifth category, Coriolis flowmeters, operate on the mass flow measurement principle.
For the purposes of this article, we will look at the advantages of Coriolis mass flowmeters and how they can be used in conjunction with the latest flow computer technologies to offer high accuracy measurement in custody transfer applications.
Commercially introduced in the 1980s, Coriolis mass flowmeters have become one of the most versatile and reliable means of measuring the flow of liquids or gases. Their main strength is in their ability to measure multiple attributes over sustained periods with high repeatability and very little maintenance.
The mass appeal of mass flow measurement
Although liquids and gases can be measured using both volumetric and mass flow measurement, mass flowmeters are increasingly finding favour for high accuracy applications, as the measurement is mostly unaffected by the effects of temperature or pressure. Coriolis mass flowmeters use the momentum of the fluid to directly determine the mass flow.
The high accuracy of Coriolis mass flowmeters means they are ideal for liquid mass flow measurement applications, especially those subject to variations in product density or where a product is priced by weight. In addition, Coriolis meters also provide direct density measurement. Eliminating the need for an inline density meter, this capability is invaluable for product quality assurance purposes by enabling improved measurement of the composition of liquid and gas flows.
Fundamental versatility
Coriolis meters work by measuring the mass flowrate, fluid density and temperature of a fluid as it flows through a vibrating tube. Other measurement values can be derived from this information, such as the volumetric flow rate and percent concentration.
By measuring mass flow, density, concentration and temperature, a single Coriolis meter can effectively do the work of multiple instruments, eliminating the cost of purchasing separate devices and minimising the requirement for spare parts and overall maintenance.
Coriolis meters are steadily being adopted in growing numbers in upstream oil and gas applications. One reason for this is their resistance to the wear and tear that can cause other measurement techniques to lose accuracy over time and increase the frequency of inspection and maintenance.
With no moving parts that come in direct contact with the measured substance, whether gas or fluid, they require little maintenance or upkeep. This is particularly beneficial in the remote locations typical of many oil and gas installations, where it may take several hours for an engineer to travel to site to carry out any necessary inspection or maintenance work.
With repeatability equally as important as accuracy in custody transfer applications, another key benefit offered by Coriolis flowmeters is the stability of calibration. Once calibrated at the factory, Coriolis meters tend to remain calibrated throughout their lifecycle. Although this can make them comparatively more expensive than other flowmetering technologies, any additional costs are more than offset by the benefits that stable calibration can bring during their operational life through a reduced need for checking and maintenance.
Figure 1. A typical custody transfer installation combines flow, temperature, and pressure measurement devices to supply data that is used to calculate the quantities of oil or gas being transferred.
Figure 2. Even a slight inaccuracy in custody transfer measurements can mean potential losses of hundreds of thousands of dollars, making it vital to safeguard against errors.
In addition, because Coriolis is the only principle capable of measuring mass flow of gas and liquids without any calculation, results are independent of changes in temperature or pressure. The use of Coriolis flowmeters also allows for density measurement, making them a true multi-variable metering solution capable of handling conditions that limit the effectiveness of other technologies.
One example is in applications with turbulent flow. Where flow is turbulent, other metering technologies may require a run of straight pipe to smooth the flow before it’s measured. With no need for such measures, Coriolis meters can be installed in a small footprint, with the added option of the meters being able to work equally well when mounted either horizontally or vertically. For operators, this not only minimises the space required for installation, but can also help save money through reduced expenditure on pipework alterations and overall engineering.
Choosing the right flow computer
The next step is to turn flow information into cash. In this respect, flow computers are effectively the cash register in custody transfer applications. A flow computer is an electronic device that takes inputs from the flowmeter and pressure and temperature sensors to compute a corrected volume flow.
How this is done depends on whether the flow is a gas or a liquid. Where gas is being measured, some form of gas quality analyser will be used to provide information about gas composition, while for liquid measurements, the density is typically measured by the Coriolis meter or, for other type of flow meters, by a separate inline density meter. In addition, or alternatively, an inline sampling system may be used to obtain a representative sample for further analysis.
The flow computer corrects the measured volume at the reference pressure and temperature. The reference pressure is the atmospheric pressure, while the typical reference temperature is normally 15˚C (60°F). Other reference temperatures of 0, 20 or 25˚C may also sometimes be used.
Besides the corrected volume, the flow computer also calculates the mass and energy quantities.
Many devices claim to be a flow computer or to have flow computing capabilities. However, in application such as custody transfer where accuracy is critical, a true flow computer should not be a general-purpose control device like an RTU, a PLC or a DCS.
Instead, any flow computing device used for custody transfer should be specifically designed for the purpose and should have been rigorously tested for immunity against electrical and magnetic disturbances. Where selecting a flow computer is concerned, there are five key factors to consider, specifically: accuracy, traceability, security, regulatory compliance and whether a liquid or gas flow computer is required. The importance of each of these, and how they are addressed is covered in outline below.
Accuracy
A flow computer incorporates special features that are not provided by other types of computing device. The need to obtain the most precise data means that flow computers for custody transfer applications utilise highly accurate analogue to digital input circuits.
Flow computers use the most accurate algorithms to calculate fluid properties such as density and heating value. They also offer accurate real-time and differential time measurement capabilities and can calculate the corrected flow rates and fluid properties at least once a second.
32-bit versus 64-bit floating point accuracy
Most calculation devices used in the process industry use 32-bit, single precision floating point variables. Without going into the technicalities of floating point numbers, 32-bit floating point calculations are accurate up to seven digits. In most cases, this is almost always sufficient, as the requirements for accuracy are rarely more than 1%.
This is not the case for custody transfer metering applications, however. In these applications, eternal totalisers are used. These totalisers store big numbers, typically running to nine digits or more, and are rarely, if ever, reset. These figures are normally included in daily measurement reports and so need to be as exact as possible. If 32-bit arithmetic is used to subtract two eternal totalisers to derive a flow measurement for a given period, significant errors can occur. Using 64-bit arithmetic will prevent such errors, as these calculations are accurate to up to 15 digits.
This accuracy can be further enhanced by utilising instruments such as ABB’s CoriolisMaster flowmeters which operate on a 64-bit Modbus output. By enabling 64-bit arithmetic to be used throughout, the risk of errors caused by rounding of extremely large totalisations is eliminated.
Traceability
Traceability of data is another important consideration. A flow computer for custody transfer should be able to keep track of additional information such as the weighted averages of field inputs and fluid data, as well as any alarms or events that occurred and any changes to its configuration. The information should be recorded
Figure 3. The high accuracy of ABB’s CoriolisMaster mass flowmeters, together with their ability to provide direct density measurement, makes them ideal for custody transfer applications.
January 27-31 • Houston
The industry’s only forum devoted exclusively to pipeline pigging for maintenance and inspection
This event will draw engineering management and field operating personnel from both transmission and distribution companies concerned with improved operations and integrity management.
INTERNATIONAL CONFERENCE
Technical papers will cover ILI data assessment, prioritization of repairs, new tools, improving tool performance, external coating inspection with ILI tools, pig launch and receiving systems, new regulations and much more.
EXHIBITION
Visit one-on-one with the world’s top providers of pigging, ILI, and integrity management services – over 170 companies will be represented.
TECHNICAL TRAINING COURSES
13 in-depth, technical pipeline training courses will be held prior to the conference and exhibition. Upskill your workforce for 2025.
with a timestamp and user identification, which allows for future verification and, if needed, correction of the production totals.
Security
As protection against unauthorised access and tampering that could affect the calculation of the transaction value, custody transfer flow computers should incorporate a high level of security. Regulations around flow computer security require the inclusion of a metrological switch to prevent any unauthorised modification to the flow computer’s measurement functions. Operators should also be required to provide a logon password using either the controller’s local access keypad or over a communication network, thus enabling data to be collected on anyone who accesses the device, together with the time and date they accessed it. Functions should also be included to ensure that production data records and reports are encrypted and signed, such that any unauthorised attempts at modification can be quickly and easily pinpointed.
Compliance with regulations and standards
The importance of flow computers in custody transfer applications means they are subject to a raft of standards and regulations. In the EU, the Measurement Instruments Directive (MID) sets down the essential requirements for flow computers. This includes EN12405, which stipulates the requirements and tests for devices that are used to determine the corrected volume and energy of fuel gases, including flow computers; and OIML Recommendation 117 for liquids other than water. MID also refers to Welmec 7.2, which provides guidance on software requirements and validation relating to the use of electronic volume conversion devices such as flow computers.
Welmec 8.4 and 8.8 set the requirements for the production, testing and fitness for purpose of electronic flow computers and their intended use as a calculating and indication device in gas and liquid measuring systems.
With custody transfer of oil and gas taking place in countries worldwide, there are also many other different national and company specific standards for flow computers. One example is Chapter 21 of the American Petroleum Institute’s (API) Manual of Petroleum Measurement Standards, which sets out best practice
and requirements relating to the use of electronic gas and liquid measurement systems.
Other provisions also relate to the way in which liquid and gas flows are measured and calculated, including specific calculations set down by the API, the American Gas Association (AGA) and the Groupe Européen de Recherches Gazières (GERG)’s GERG-2008 multi-parameter equation of state for the prediction of natural gas mixture properties.
The need to demonstrate that flows were accurately measured in line with these requirements makes it vital to ensure that the flow computing device being used is fit for purpose. However, it can be difficult to find suppliers offering equipment capable of satisfying all these standards and requirements.
Do you need a liquid or gas flow computer?
A liquid flow computer provides additional features over a gas flow computer. Foremost amongst these is the inclusion of the many different API tables for the calculation of liquid properties such as density and vapor pressure. Because the transfer of liquid products is based on batch transactions, a liquid flow computer also maintains batch data in addition to period data.
A liquid flow computer needs to be able to recalculate batch totals based on laboratory analysis of liquid samples. Liquid flow meters used for custody transfer are typically calibrated in the field by a stationary or mobile proving system.
The liquid flow computer controls the proving sequence and calculates the new meter factor in accordance with the different API standards for meter proving. Furthermore, liquid flow computers are used for controlling the flow through the meter, the line-up of meters for proving and the sampling system.
Similarly, a gas flow computer also incorporates the necessary calculations to enable accurate metering and calculation of gas flows. These should include the calculations set out by the ISO (International Organisation for Standardisation) and/or American Gas Association (AGA) for the measurement of natural gas flows using different types of metering technologies. Specific provisions for custody transfer applications include: ISO6976 (calculation of calorific value and density from composition); AGA8 parts 1 and 2 (calculation of variations in gas compositions and determination of uncertainties); and AGA11, covering the measurement of natural gas flows using Coriolis flowmeters.1
Conclusion
With oil and gas companies needing to adapt to meet the requirements of a changing market, the need to be able to charge correctly for their products is of paramount importance. This, coupled with the need to minimise total ownership costs and address problems caused by the absence of skilled engineering and maintenance staff, is calling for solutions that can offer the highest levels of accuracy and reliability.
The inherent benefits of Coriolis flowmeters, especially when used alongside a correctly specified flow computer, can help to address these needs and substantially reduce the risk of any discrepancies that could impact on custody transfer transaction calculations.
Figure 4. A well-designed system that uses proven, accurate and best-in-class technologies is key to ensuring compliance with the tight legal requirements for custody transfer applications.
Paul Stockwell, Process Vision, sets out the implications of new process imaging technologies for the measuring of gas quality, and in particular what it means for the traditional reliance on hydrocarbon dewpoint as the standard measure.
or decades, hydrocarbon dewpoint has been the standard measure for determining whether a gas is ‘wet’ or ‘dry’ – crucial in natural gas transmission, storage, and distribution. Traditionally, hydrocarbon dewpoint has served as the benchmark for gas quality, with many commercial agreements specifying that gas supplies must stay below a certain dewpoint to avoid penalties or product rejection. Indeed, gas is bought and sold on a dry gas basis. However, recent developments are challenging this traditional metric’s reliability, particularly with the advent of new process imaging technologies.
Unveiling the truth inside gas pipelines
The advanced pipeline camera system, LineVu offers realtime video insights into gas flows, revealing that traditional methods often fall short. These cameras are mounted on gas pipelines using standard tapping points, and they stream live images that allow operators to see exactly what is happening inside the high-pressure pipe. By identifying mist or stratified
flows of liquids that are otherwise undetectable, these systems provide a clearer understanding of gas conditions than the hydrocarbon dewpoint ever could.
15 years ago, a project led by a major transmission system operator sought to understand why liquid contamination was entering the gas network without triggering alarms with any gas analysis system.
This ultimately led to the development of LineVu, which uses image processing and machine learning to monitor and trip alarms when liquid carryover is detected. The technology has proven itself at custody transfer points, revealing a reality that hydrocarbon dewpoint calculations often miss substantial liquid quantities in pipelines that should theoretically be carrying dry gas.
The financial impact of liquid carryover
The cost of liquid carryover in gas pipelines is significant for all stakeholders, from gas suppliers to end-users like power stations. Liquids such as natural gas liquids (NGLs), compressor oil, or glycol, when undetected, can wreak havoc on systems, increase maintenance costs, and lead to substantial financial losses. For example, power stations dependent on natural gas turbines suffer when liquid carryover blocks fuel nozzles, causing imbalances in fuel burn and operational failures.
The losses compound further when considering the sheer volume of liquids escaping detection. Just 0.1% of liquid volume fraction in a 100 million f 3/d gas stream could translate to over 10 000 gal./d of NGLs lost equating to millions of dollars in revenue losses annually. This is particularly problematic when conventional hydrocarbon dewpoint readings suggest the gas is dry, yet substantial mist or liquid flow is visibly present within the pipeline. Figure 1 shows examples of liquid flow regimes observed in real-world, large diameter gas pipelines in the USA, Europe and the Middle East.
) Clear view: this shows no mist flow or stratified flow (liquid on the pipe wall) and shows that the gas is dry. This image will normally move around when that gas is at pressure. This is due to the ‘heat haze’ effect that is more prevalent in dense fluids.
) Mist flow: this image shows a totally obscured pipe floor. The brightness and the amount that the pipe floor is obscured vary depending upon the severity of the mist.
) Stratified flow: in this instance multiple streams of liquid are present. The flow is normally arranged to move from left to right. These types of flow indicate a light liquid probably NGLs.
) Stratified flow: this ‘caterpillar’ like flow is of compressor oil. In this instance the installation was a short distance from two bends. This flow is moving due to friction with the gas stream above it and has climbed 3 m vertically just before the position of the camera.
) Mixed stratified flow: in this example both light and heavy liquids exist in a stratified flow. They have separate flows within the pipe.
) Mixed stratified flow: in this second example of mixed stratified flow, a few of the small liquid flow streams are darker than the others indicating that there are at least two liquids in the flow.
Figure 1. The variety of flow regimes observed in ‘dry’ gas streams.
Figure 2. Phase envelope results spanning 186˚F (103.6˚C) for the same gas.2
Table 1. Typical pipeline gas analysis
Hydrocarbon dewpoint’s inaccuracy in real-world conditions
Recent work has highlighted the inconsistency of hydrocarbon dew point calculations 1. Table 1 shows the gas constituents of a typical natural gas stream that meets gas quality specifications. Table 2 and Figure 2 shows calculations for the crycondentherm dewpoint temperature for the gas in Table 1, using six different industry approved methods. The results span 186°F (103.6°C).
This wide discrepancy demonstrates that the hydrocarbon dew point alone is not a reliable indicator presence of liquid in gas. Moreover, gas sampling techniques outlined in API 14.1 and ISO 10715 specifically exclude two phase flow, which further complicates accurate gas quality assessments for its dewpoint and calorific value (Btu).
Adding to this complexity is the fact that even small amounts of heavy hydrocarbons can create major operational challenges. It was shown by Embry and May that as little as three parts per billion (PPB) of heavy hydrocarbons can create excessive pressure drop across an LNG heat exchanger within 30 days, leading to expensive operational downtime.
A new paradigm: seeing is believing
The breakthrough technology behind LineVu is redefining how the gas industry approaches liquid detection. Instead of relying solely on hydrocarbon dewpoint, operators can now visually monitor gas flows to identify mist and stratified liquid flows in real time. This visual confirmation provides a far more reliable indication of gas quality, ensuring that suppliers and buyers are on the same page when it comes to liquid content in the gas stream.
For gas processing plants and pipeline networks, this is a game-changer. The ability to stream live video to control rooms allows for immediate adjustments, optimising system maintenance, reducing losses, and ensuring that liquids do not inadvertently pass through custody transfer points. In many cases, LineVu’s findings have helped operators significantly reduce liquid carryover, resulting in improved operational efficiency and greater financial returns.
The future of gas quality measurement
As the industry moves toward more precise and actionable data, systems like LineVu are becoming indispensable. The traditional reliance on hydrocarbon dewpoint as a definitive measure of gas quality is no longer sufficient when these visual technologies reveal significant errors in reported hydrocarbon dewpoint.
Figure 3 shows an example, on the left the baseline image of the dry pipeline. On the right a still shot of NGL type flow on the pipe wall. In this example the ambient temperature was 77°F (25°C) and with liquids present the gas has
clearly exceeded its dewpoint by 3 - 7 °F making the actual dewpoint around +82°F (27.8°C). The reported dewpoint was -48.5°F (-44.7°C) and operator were under the impression that this was a dry gas flow until the liquid flows were observed.
Concerns were raised further during this study when the gas flow was temporarily stopped for around 4 hours and the hydrocarbon dewpoint increased from -48.5°F to -22.5°F.
Figure 4 shows the increase in C6+ while the gas was static. It is believed that hydrocarbon liquids are
Table 2. Six different industry-approved methods for calculating the cricondentherm dewpoint temperature Characterisation
only
Low sep exp N-C16 +2.0 (-16.7)
C9+ as C10 N-C10 +5.1 (-14.9)
C6+/C9+ Exp N-C16 +93.5 (+34.2)
Figure 4. Chart of gas flow vs C6+ content.
Figure 3. Significant stratified flow vs the dry pipeline baseline image.
ADVERTISERS’ DIRECTORY
evaporating and the gas phase above the liquid has time to reach equilibrium with the liquid phase. Investigation of gas constituents obtained from gas chromatography data at the time showed an increase in the gas phase of all hydrocarbon constituents above methane (C2 and higher) during the period of static gas (Figure 5).
Btu also increased by over 1% from 1075 to a 1088 during the stoppage. The i nference is that the gas phase is not in equilibrium with the liquid phase during flow conditions and therefore measuring or calculating hydrocarbon dewpoint would not necessarily reveal the presence of liquids.
While hydrocarbon dewpoint remains an important parameter, its limitations in detecting liquids in gas streams make it an unreliable sole indicator for pipeline operators and gas processors alike.
By incorporating advanced visual monitoring tools alongside existing measurement technologies this will become the new standard for ensuring gas quality, validating Btu and flow measurements, and preventing costly liquid carryover events. With LineVu the industry is entering a new era where operators can truly see what is happening inside their pipelines – and act on it.
Conclusion
The gas industry has long relied on hydrocarbon dewpoint as a key metric for determining gas quality. However, as advanced technologies like LineVu reveal, this metric often falls short in identifying liquid carryover, which can cause significant operational and financial issues. Visual monitoring systems are transforming how gas quality is assessed, ensuring that operators have real-time, accurate data to maintain efficiency, reduce losses, and optimise gas processing operations.
Figure 5. % increase of hydrocarbon constituents when gas flow is stopped.