March 2024
•Cracked Gas • Ethane Feed Gas
•LPG, Naphtha, & Light Condensate Feed Liquid
•Regen. Gas from Cracked Gas Driers
•Light Olefin Gas from FCC Units
PROVEN PROCESS – PROVEN PRODUCTS
•AntiMercure® Process Engineering
•MERSORB® mercury adsorbent pellets
AntiMercure® is a Registered Trademark of Selective Adsorption Associates, Inc. for its Process Engineering Services
MERSORB® is a Registered Trademark of NUCON International, Inc. for its mercury adsorbent pallets
With MERSORB® mercury adsorbent pellets
•PROVEN RELIABLE – EVEN IN CRACKED GAS
•HIGH MERCURY CAPACITY – HOT, COLD, WET or DRY
•MORE PELLET SIZES – MORE PROCESS DESIGN FLEXIBILITY
•LOW MOISTURE – FAST START-UP
•40 YEARS EXPERIENCE – ADSORPTION PROCESS DESIGN
MERSORB®
www.mercuryadsorbents.com

Optimized Mercury Removal
Inc.
mercury adsorbent pellets – a Trademark of Nucon International,
(NUCON®)
Mercury Removal
Your Experts for
–in Ethylene Plants

03 Comment
05 Guest comment
07 News
12 US markets: unseen recovery
Nancy Yamaguchi, Contributing Editor, discusses US economic recovery, the gradual control of fuel prices and the long-term oil market outlook.
21 Facilitating and quantifying industry improvements
Colin Frazier, American Petroleum Institute (API), explains how the API’s Process Safety Site Assessment Program (PSSAP®) can help hydrocarbon processing plants improve the safety of operations.
26 Revolutionising performance
Richard Caulkin, Tim Michalec and James Esteban, UNICAT Catalyst Technologies LLC, explore how revolutionary scientific modelling allows tailored optimisation of filtration grading and loading profiles to deliver 50% improvements in catalyst bed life.
33 Meeting enhanced quality demands
Ashley Ashford and Rahul Singh, Topsoe, explain the importance of hydrocracking based technologies in producing high quality, sustainable lubricants.
40 Collaborative control of SOx and NOx emissions
Dongyue Zhao, Chunfang Chen, and Haitao Song, SINOPEC Research Institute of Petroleum Processing Co. Ltd, alongside Xianyao Liang and Xianglong Xu, SINOPEC Beihai Refining & Chemical Co., explain how a novel additive can relieve the conflict between NOx and SOx removal efficiency.
45 Optimising fired heater operations
Tim Haugen, Quest Integrity, explores how advanced coil cleaning and inspection techniques can help plants optimise the performance of their fired heaters.


THIS MONTH'S FRONT COVER
49 Reliability and longevity
Jim Lines, Graham Corp., USA, explains how the life of steam surface condensers can be maximised.
56 The path forward: capitalising on decarbonisation opportunities
Dr. Cecilia Mondelli and Stephen Shields, Sulzer Chemtech, look at the most promising CCUS technologies, which offer multiple benefits that go further than compliance with environmental regulations.
61 Facilitating the transition
Dr Chris Mills, TÜV SÜD National Engineering Laboratory, UK, discusses how flow measurement will play a fundamental role in carbon capture, utilisation and storage (CCUS).
65 CO2 pipelines: challenges and threats
Dr. Sameera Naib and Dr. Daniel Sandana, ROSEN, evaluate the challenges and threats to consider when deciding whether to repurpose existing pipelines or build new pipelines for the transportation of carbon dioxide.
71 Playing a pivotal role
Klaus Reischl, SERO PumpSystems GmbH, Germany, highlights the important role played by side channel pumps in carbon capture and storage (CCS) processes.
74 A necessary culture shift
Tim Gale, 1898 & Co., reveals why a change in the culture of engineering is required to achieve security of industrial control systems.
79 Industrial cloud transforms the refinery of the future
Soni Malik, Alessandro Speranza and Rolando Gabarron, KBC (A Yokogawa Company), discuss how IIoT technologies optimise operations to improve efficiency and reliability.
83 Staying ahead
Ivan Kovtun, Endress+Hauser, Switzerland, explains how leveraging advanced digital technologies can transform the efficiency of inventory monitoring in the oil and gas industry.
87 A new era in plant digitalisation
Aleix Monteso, Inprocess Technology, Spain, details the advantages of using digital twin technologies for plant optimisation.
UNICAT’s Out Of This World Filtration ‘AFS’ is revolutionising performance. Optimised uniform flow channels create non-restrictive flow distribution and maximise foulant capture. AFS increases catalyst bed life by 50%+ and can capture any size particulate.

CBP019982 Hydrocarbon Engineering Like Join Hydrocarbon Engineering @HydrocarbonEng Follow CONVERSATION JOIN THE 2024 Member of ABC Audit Bureau of Circulations Copyright© Palladian Publications Ltd 2024. All rights reserved. No part of this publication may be reproduced, stored in a retrieval system, or transmitted in any form or by any means, electronic, mechanical, photocopying, recording or otherwise, without the prior permission of the copyright owner. All views expressed in this journal are those of the respective contributors and are not necessarily the opinions of the publisher, neither do the publishers endorse any of the claims made in the articles or the advertisements. Printed in the UK. CONTENTS March 2024 Volume 29 Number 3 ISSN 1468-9340

Cut your CO2 emissions in half with ET Black™
Carbon Black Technology
ET Black™ is a state-ofthe-art technology that complies with the most stringent environmental regulations now and in the future.
Plus, the flexibility to produce all ASTM grades, and specialty grades, in a single plant. ET Black™, the technology of reference for producing carbon black obtained by thermal decomposition of highly aromatic oils.
Find out more at: www.igoforETBlack.com


CONTACT INFO
MANAGING EDITOR James Little james.little@palladianpublications.com
SENIOR EDITOR Callum O'Reilly callum.oreilly@palladianpublications.com
EDITORIAL ASSISTANT Poppy Clements poppy.clements@palladianpublications.com
SALES DIRECTOR Rod Hardy rod.hardy@palladianpublications.com
SALES MANAGER Chris Atkin chris.atkin@palladianpublications.com
SALES EXECUTIVE Sophie Birss sophie.birss@palladianpublications.com
PRODUCTION MANAGER Kyla Waller kyla.waller@palladianpublications.com
EVENTS MANAGER Louise Cameron louise.cameron@palladianpublications.com
DIGITAL EVENTS COORDINATOR Merili Jurivete merili.jurivete@palladianpublications.com
DIGITAL CONTENT ASSISTANT Kristian Ilasko kristian.ilasko@palladianpublications.com
DIGITAL ADMINISTRATOR Nicole Harman-Smith nicole.harman-smith@palladianpublications.com
ADMIN MANAGER Laura White laura.white@palladianpublications.com
CONTRIBUTING EDITORS
Yamaguchi Gordon Cope

CALLUM O'REILLY SENIOR EDITOR
Casual observers of American football will understand why the word ‘Swiftie’ was named as a finalist in the Oxford University Press’ 2023 ‘Word of the Year’ competition. This year’s Super Bowl attracted an estimated 123.4 million viewers in the US, making it the most watched broadcast since the Apollo 11 Moon landing in 1969. And, unless you’ve been hiding under a lunar rock, you’re probably aware that the record-breaking viewing numbers have been partly attributed to an army of Swifties (devoted Taylor Swift fans) who tuned in to watch the popstar’s boyfriend, Travis Kelce, in action for the Kansas City Chiefs. According to the Oxford University Press, the word Swiftie was more than 10 times more common in September 2023 than a year before, and its rise in prominence is evidence of a population that is influenced more than ever by public figures.
Another finalist for word of the year was ‘prompt’. Although not the eventual winner (I’ll let you google the definition of ‘rizz’, if you’re not already familiar with the word), ‘prompt’ caught my attention as it refers to “an instruction given to an artificial intelligence (AI) program, algorithm, etc., which determines or influences the content it generates.” Oxford University Press notes that words relating to AI were particularly prominent in its data in 2023. And there is further evidence of this in a selection of other ‘Word of the Year’ winners announced by different organisations. The Collins English Dictionary selected ‘AI’ as its top word, while both the Cambridge Dictionary and Dictionary.com plumped for ‘hallucinate’, meaning when AI produces false information and presents it as if true and factual.
The team at Cambridge Dictionary explains that hallucinate was chosen as its word of the year as it gets to the heart of why people are talking about AI: “Generative AI is a powerful tool but one we’re all still learning to interact with safely and effectively.” Creating new language to understand this new technology is just one step in the process of learning how best to utilise AI while being aware of its potential weaknesses (and dangers).
The latest edition of Airswift’s ‘Global Energy Talent Index’ (GETI) shines a light on current attitudes towards AI in the energy sector. The annual energy workforce trends report, which surveyed nearly 12 000 energy professionals in 149 countries, highlights a cautious approach to AI adoption in the oil and gas sector. The report suggests that 24% of oil and gas professionals currently use AI, with 47% of respondents very optimistic about the future impact of AI. The majority of professionals expect AI to result in an uplift in their personal productivity (71%) and increase their job satisfaction (58%). Interestingly, AI uptake in the petrochemicals sector seems to be a little higher, with 30% of professionals already using AI and 82% of professionals feeling positive about the future impact of AI.
The report also indicates an awareness amongst workers that AI will increase demand for skills, with 62% of oil and gas professionals expecting AI to increase pressure on them to acquire new skills.
While it is positive to see the energy industry embracing the prospect of AI, the sector faces a difficult challenge to ensure that its workforce is equipped with the necessary skills to harness the full potential of this exciting new technology. As Janette Marx, CEO of Airswift, wisely points out in the GETI report, there is a delicate balance to be struck between technological advancement and nurturing the skills of the sector’s workforce.
SUBSCRIPTION RATES Annual subscription £110 UK including postage /£125 overseas (postage airmail). Two year discounted rate £176 UK including postage/£200
airmail).
CLAIMS Claims for non receipt of issues must be made within 3 months of publication of the issue or they will not be honoured without charge. APPLICABLE ONLY TO USA & CANADA Hydrocarbon Engineering (ISSN No: 1468-9340, USPS No: 020-998) is published monthly by Palladian Publications Ltd GBR and distributed in the USA by Asendia USA, 701C Ashland Avenue, Folcroft, PA 19032. Periodicals postage paid at Philadelphia, PA & additional mailing offices. POSTMASTER: send address changes to HYDROCARBON ENGINEERING, 701C Ashland Ave, Folcroft PA 19032.
South Street, Farnham, Surrey GU9 7QU, UK
+44
1252 718 999 COM MENT
Nancy
overseas (postage
SUBSCRIPTION
15
Tel:
(0)


GUEST COM MENT
ROB BENEDICT VICE PRESIDENT OF PETROCHEMICALS AND MIDSTREAM, AMERICAN
FUEL & PETROCHEMICAL MANUFACTURERS (AFPM)
Plastics derived from petrochemicals enable incredible things in our lives it is impossible to imagine a modern hospital, grocery store, school or workplace without them. They are light, durable, energy efficient, and are responsible for less GHG emissions throughout their lifecycle than alternative materials. They provide the global population with a high quality of life and enable economies to thrive sustainably. It’s essential, though, that these products be re-used, recycled and recovered correctly.
AFPM believes ending plastic pollution requires multiple solutions. First, we must promote sustainable consumption and production of plastics. We also must continue to develop well-designed plastic products that are more easily reused and recycled. And, most importantly, we must create universal access to environmentally sound waste collection and management. Without improving waste collection and management, we cannot maximise the potential of recycling technologies that are critical to achieving circularity. We have to think differently and replace our linear economic model where plastic products have limited uses and are discarded as waste with a circular one, where used plastics are no longer perceived as waste but as feedstocks for recycling.

the end of 2024. We are committed to helping meet the agreement’s goals of eliminating plastic pollution, while also recognising the tremendous societal benefits of plastics.
Some are calling for limitations or bans of the production of certain polymers. These are not viable solutions to combating plastic pollution because they would deprive society of plastics’ benefits and negatively impact numerous supply chains, all while ignoring waste management issues that are the root cause of plastic pollution. Restrictions and bans also slow progress toward global sustainability goals.
We have to think differently and replace our linear economic model where plastic products have limited uses and are discarded as waste with a circular one, where used plastics are no longer perceived as waste but as feedstocks for recycling.
This is why the members of the American Fuel & Petrochemical Manufacturers (AFPM) support the United Nations (UN) development of a global agreement that helps end plastic pollution, unlocks innovation and accelerates a global transition to a circular economy. As an accredited organisation by the UN Environmental Program, AFPM is participating in negotiations aimed at developing a global agreement on plastics pollution by
Achieving the UN’s Sustainable Development Goals (SDGs) is simply not possible without petrochemicals and the plastics derived from them.
Instead, we need policies that promote innovation across the plastics value chain and do not stifle it. This includes policies that help to develop a circular economy by unlocking the potential of technologies like advanced recycling, which is critical to increasing the universe of recyclable products. We also need policies that improve waste collection and management across the world. But we also must allow individual nations to develop regionally appropriate strategies to eliminate plastic waste that are supplemented by global standards and metrics.
By working together to keep waste out of the environment, increase recycling rates and create a more circular economy for plastics through the advancements of technologies like advanced recycling, we can reach our shared goals of eliminating plastic pollution.
March 2024 HYDROCARBON ENGINEERING 5
MORE BUSINESS LESS CARBON NATURAL GAS, FUTURE READY.
The case for blue hydrogen is clear.
Topsoe is ready to help you scale up and bring emissions down using natural gas resources.
Take the lowest energy route to ultra-low carbon intensity hydrogen with Topsoe’s industry-leading reforming technologies and integrated carbon capture. Find out how: topsoe.com/bluehydrogen

WORLD NEWS
Qatar | QatarEnergy and CPChem celebrate construction start of Ras Laffan petrochemicals project
QatarEnergy and Chevron Phillips Chemical (CPChem) have celebrated the commencement of construction of a US$6 billion integrated polymers complex in Ras Laffan Industrial City, Qatar.
The 435 acre project site will include an ethane cracker with a capacity of 2.08 million tpy of ethylene, making it the largest ethane cracker in the Middle East and one of the largest in the world.
It will also include two high-density polyethylene derivative units with a total capacity of 1.68 million tpy.
The facility is designed to use energy-saving technology which, along with other measures, is expected to result in lower greenhouse gas emissions intensity than similar global facilities.
Site preparation began in June 2022, and startup is expected in late 2026.
Italy | KT (MAIRE) awarded contract by Eni
MAIRE has announced that its subsidiary KT - Kinetics Technology has been awarded an EPC contract by Eni to build a hydrogen production plant at Eni’s Livorno refinery.
The value of the contract is €123 million, and the project is scheduled for completion in 2026.
The plant will process natural gas and biogenic feedstocks to create hydrogen for the production of
biofuels for mobility at the Livorno site processing various biogenic feedstocks, mainly waste such as cooking oils and animal fats, and residues from the agribusiness industry.
The plant is designed so that a residual CO2 capture unit can be implemented at a later stage.
The construction of the new unit is part of Eni’s project to convert its Livorno plant into a biorefinery.
USA | Delek refinery selected for pilot carbon capture project
Delek US Holdings Inc. has been selected by the US Department of Energy (DOE)’s Office of Clean Energy Demonstrations to negotiate a cost-sharing agreement in support of a carbon capture pilot project in the Big Spring refinery, Texas, US.
The DOE Carbon Capture Large-Scale Pilot Project programme provides 70% cost-share for up to US$95 million of federal funding to support project development.
The project will deploy Svante Technologies Inc.’s second-generation carbon capture technology at the refinery’s fluidised catalytic cracking unit (FCCU), while maintaining existing production capabilities and turnaround schedule. Expectations for the project are to capture 145 000 tpy of carbon dioxide (CO2), as well as reduce pollutants, such as SO x and particulate matter. CO2 is expected to be transported by existing pipelines for permanent storage or utilisation.
China | Successful startup of Axens’ residue hydrocracking unit and high conversion hydrocracking unit at Shenghong’s integrated refinery
Axens’ hydrocracking unit, distillates hydrocracking unit and naphtha hydrotreating unit were successfully started at Shenghong Refining & Chemical complex in China’s province of Jiangsu.
These single train units aim to maximise naphtha production as well as improve the coker’s feed quality while processing steam cracker py-oil, diesel, vacuum gas oil, coker gas oil and vacuum
residue as feedstocks within this integrated complex.
In 2019, Shenghong selected Axens to provide the residue hydrocracking/HCK/NHT solutions for boosting naphtha production from its integrated refinery and petrochemical complex at Lianyungang City.
As part of these solutions, Axens delivered the complete process design package, high-performance catalysts,
proprietary reactor internals, specialised design of spiral tube heat exchangers (ZPJE), and full technical services from plant personnel training to plant start-up.
Jacques Rault, Executive Vice President, Technology and Technical Support, Axens, said: “We are extremely grateful to Shenghong for [its] collaborative approach and exceptional support provided during the design, commissioning and startup phases.”
March 2024 HYDROCARBON ENGINEERING 7

WORLD NEWS
DIARY DATES
02 - 04 April 2024
Sulphur World Symposium
Charleston, South Carolina, USA www.sulphurinstitute.org/symposium-2024
03 - 05 April 2024
26th Annual International Aboveground Storage Tank Conference & Trade Show Orlando, Florida, USA www.nistm.org
29 April - 03 May 2024
RefComm Galveston, Texas, USA
www.events.crugroup.com/refcomm
06 - 08 May 2024
ILTA Conference & Trade Show Houston, Texas, USA www.ilta.org
14 - 16 May 2024
Asia Turbomachinery & Pump Symposium Kuala Lumpur, Malaysia atps.tamu.edu
10 - 14 June 2024
ACHEMA Frankfurt, Germany www.achema.de/en
11 - 13 June 2024
Global Energy Show Canada Calgary, Alberta, Canada www.globalenergyshow.com
26 - 27 June 2024
Downstream USA Galveston, Texas, USA events.reutersevents.com/petchem/downstream-usa
20 - 22 August 2024
Turbomachinery & Pump Symposia Houston, Texas, USA tps.tamu.edu
17 - 20 September 2024
Gastech Houston, Texas, USA www.gastechevent.com
22 - 25 September 2024
GPA Midstream Convention San Antonio, Texas, USA www.gpamidstreamconvention.org
UK | Centrica agrees deal with Repsol for 1 million t of LNG to supply the UK
Centrica Energy and Repsol have announced the signing of a deal that will improve the UK’s energy security in the coming years. The deal will see Centrica purchase 1 million t of LNG shipments between 2025 and 2027. All of these cargoes are expected to be delivered to the Grain LNG import terminal in Kent.
The deal marks an additional move by Centrica to build further resilience in the UK’s energy security. It follows a 15 year, US$8 billion deal with Delfin Midstream in July 2023, a three-year supply agreement with Equinor that will heat 4.5 million UK
homes through to 2024, and the reopening and expansion of the Rough gas storage facility in October 2022 and June 2023, respectively. Rough now provides half of the UK’s total gas storage capacity with the potential to store over 50 billion ft3/d of gas, enough to heat almost 10% of UK homes throughout winter.
Cassim Mangerah, Managing Director, Centrica Energy, said: “One of the key pillars of our successful and growing LNG business is our partnership approach. Our new deal with Repsol will complement the Atlantic leg of our diversified and flexible portfolio.”
Germany | Air Liquide to reduce emissions
Air Liquide and Dow have renewed their industrial gas supply agreement in Stade, one of the largest chemical production sites in Lower Saxony, Germany. In this context, Air Liquide will supply industrial gases under a long-term agreement and invest close to €40 million in the modernisation of its assets, enabling operational efficiency and reducing CO2 emissions.
As part of the agreement, Air Liquide will modernise its existing production
assets – two air separation units (ASU), as well as one partial oxidation (POX) plant, to which it will add a new CO2 recycling solution. This will enable a circular use of the CO2 produced, reducing emissions by around 15 000 tpy, which represents 80% of direct CO2 emissions of the Air Liquide site. The modernisation of these assets will be completed in 2024. Air Liquide has been supplying industrial gases to Dow in Stade for more than 20 years.
USA | TotalEnergies converts feedstocks from plastic waste into circular polymers
TotalEnergies has converted feedstocks from plastic waste into circular polymers at its polypropylene plant in La Porte, Texas, US. The La Porte plant, one of the world’s largest polypropylene sites, will produce sustainably certified polymers suitable for a wide range of applications, including food grade packaging.
The petrochemical feedstock was provided by New Hope Energy’s ISCC+ certified advanced recycling
facility in Tyler, Texas. The feedstock was converted into monomers at the BASF TotalEnergies Petrochemicals (BTP) facility – a 60/40 joint venture (JV) between BASF and TotalEnergies based in Port Arthur, Texas – before being transformed into circular polymers at TotalEnergies’ polypropylene plant in La Porte, Texas.
Both the La Porte and BTP facilities received their ISCC+ certification in 2022.
March 2024 HYDROCARBON ENGINEERING 8


SPENT CATALYST RECYCLING MADE SUSTAINABLE


Become part of the best solution


low
Our state of the art processes and technologies and the use of renewable energy (hydropower), enable us to recycle base metals from spent catalysts with an unrivaled low carbon footprint: 85% lower CO 2-emission, compared to conventional mined metals.


Lower your footprint?
Contact us!


moxba.com
Recycling made Sustainable

©2024 Halliburton. All Rights Reserved. halliburton.com Superior Process and Water Treatment Solutions Driven by Service Excellence PROTECT ASSETS & MAXIMIZE VALUE
COMPLETE SOLUTIONS
Halliburton Multi-Chem offers a broad selection of chemistries, equipment, services and automation to ensure successful results.
COLLABORATIVE APPROACH
Through onsite technical service and engineering support, Halliburton Multi-Chem collaborates with you to deliver solutions to your challenges.
Improving reliability, increasing throughput and enhancing the efficiency and flexibility of operating units is important to you.
We are here to help.

12 March 2024 HYDROCARBON ENGINEERING
Nancy Yamaguchi, Contributing Editor, discusses US economic recovery, the gradual control of fuel prices and the long-term oil market outlook.

As the new year commences, there are abundant signs of recovery and renewed vigour in the US economy. Most of the public has yet to see this, or perhaps is unable to believe it. After the COVID-19 pandemic, markets collapsed, and recovery came in fits and spurts. Economists kept predicting recession, and the only hope seemed to be a distantly possible ‘soft landing’. Inflation hit new heights. The Federal Open Market Committee (often referred to as ‘the Fed’) steadily raised interest rates to contain it, with a long-term goal of 2% inflation. In February 2022, the federal funds effective interest rate was a mere 0.08%, having been slashed repeatedly to support the economy during the pandemic. Beginning in March 2022, the Fed began to raise rates, announcing seven rate increases in 2022 and five in 2023.1 Millions of people felt the pinch of
March 2024 13 HYDROCARBON ENGINEERING
inflated prices for goods, fuel, and food. Fed bashing became nearly as popular as generic government bashing. Mistrust of institutions has become reflexive. It is difficult to see that the economy is finally improving, particularly since there are no rapid fixes and smooth curves in recovery. The American attention span is ill-suited when it comes to policies and programmes that take years to bear fruit. For example, inflation has been coming under control, but the latest data released in mid-February showed that inflation ratcheted up again in January. This caused renewed doubt and even a bit of panic – the Dow Jones Industrial Average dropped 500 points. The Fed takes a long view. Already in January 2024, the Fed announced that it would not begin reducing interest rates until more data becomes available, clearly understanding that the battle against inflation has not yet been won.
The US is the world’s largest oil market and the largest economy, and therefore has a massive impact on the global economy and oil market. Has it fully recovered from the pandemic? This article discusses the US economic recovery, the rise and gradual control of fuel prices, the impacts on demand, and the long-term outlook.
US economic recovery
The path to economic recovery has been slow since the COVID-19 pandemic. It has relied upon hundreds of measures affecting millions of people. Unfortunately, the loud divisiveness of US politics detracts from the successes being achieved. The Fed steadfastly worked on monetary policy. The Biden Administration adopted a multi-pronged approach of ‘investing in people’ to rebuild the economy from the ground up. Congress passed major laws providing relief to citizens, businesses, and state and local governments suffering from the COVID-19 pandemic. These initiatives have taken time, but they are working: unemployment is at historic lows, jobs are being created, wages have grown, inflation is cooling, productivity and GDP are rising, fuel demand has grown. Table 1 provides an overview of key economic indicators in the post-COVID
years 2020 - 2023, with data for January 2024 included when available.
The US Bureau of Labor Statistics (BLS) reported that the US added 353 000 jobs in January 2024, detailed in its Employment Situation report, also known as ‘the Jobs Report’.2 This was nearly twice what had been expected. The unemployment rate in January 2024 remained at only 3.7%. The unemployment rate averaged historic lows of 3.6% in 2022 and 2023. In contrast, the COVID-19 pandemic caused unemployment to spike to 14.7% in April 2020.
Not only are more people finding jobs, wages are rising as well. According to the BLS, US average earnings were US$29.36/h in 2020. This rose to US$33.72/h in 2023, and they kept rising to US$34.55/h in January 2024. The BLS data show that wages are increasing more quickly than inflation, so people’s purchasing power is going up. The Consumer Price Index (CPI), the most widely used measure of inflation, rose by 4.7% in 2021 and 8.0% in 2022, before being brought down to 4.1% in 2023. This level remains higher than desired, but it is progress nonetheless, and it is difficult to contain inflation when oil prices are high.
The high cost of energy was a key culprit in overall CPI increases. WTI crude spot prices jumped from US$39.16/bbl in 2020 to US$68.13/bbl in 2021, and prices spiked to US$94.90/bbl in 2022. WTI prices eased somewhat to US$77.58/bbl in 2023, and they fell to US$73.56/bbl in January 2024.
The pandemic caused petroleum product demand to drop by -14.3% in 2020. Demand bounced back by 9.6% in 2022, then grew more slowly at 1.2% in 2022 and 0.6% in 2023.
The US Bureau of Economic Analysis (BEA) reported that GDP growth in 2019 was 2.5%. COVID-19 caused GDP to shrink -2.2% in 2020. GDP bounced back by 5.8% in 2021, then continued to grow at 1.9% in 2022 and 2.5% in 2023 – back to its pre-pandemic level. The BLS forecasts that US GDP will continue to grow at a rate averaging 1.9% each year between 2022 and 2032.3
Notes: unemployment rate, average hourly earnings, and CPI are per US Bureau of Labor Statistics. GDP per US Bureau of Economic Analysis.
March 2024 HYDROCARBON ENGINEERING 14
2020 2021 2022 2023 January 2024 Unemployment rate (%) 8.1 5.4 3.6 3.6 3.7 Average hourly earnings (US$) 29.36 30.61 32.26 33.72 34.55 CPI, annual increase (%) 1.2 4.7 8.0 4.1 GDP (% change) -2.2 5.8 1.9 2.5 Index of Consumer Sentiment 81.5 77.6 59 65.4 79 WTI spot price (US$/bbl) 39.16 68.13 94.90 77.58 73.56 Petroleum product demand growth (%) -14.30 9.60 1.20 0.60
Table 1. Improvement in US key economic indicators
Index of Consumer Sentiment
WTI spot price and petroleum product demand per EIA; 2023 data
January - November.
is per University of Michigan http://www.sca.isr.umich.edu/.
are
Get active with Valor ®
The solution for FCCs with high vanadium feeds

Want to get active?
Learn what Valor ®, BASF’s latest vanadium trapping technology, can do for you!
Less Sulfur + More Vanadium = More Conversion Cat/Oil Ratio Conversion, wt. % 76 72 68 64 Valor ® Conventional V-Trap 2 4 6
The Index of Consumer Sentiment, published by the University of Michigan, plummeted from 81.5 in 2020 to 59 in 2022. It recovered slowly, reaching 65.4 in 2023, then it surged to 79 in January 2024. According to the Surveys of Consumers Director: “Consumer sentiment confirmed its early-month reading, surging 13% to reach its highest level since July 2021, reflecting improvements in the outlook for both inflation and personal incomes. January’s gain has been exceeded only five times since 1978, one of which was last month at an even larger increase of 14%.”4
Consumer confidence is rebounding at last, most strongly at the end of 2023 and the beginning of 2024. To add a note of caution, however, the recovery was overdue, and it had to claw its way back from a deep trough: consumer confidence of 59 in 2022 was the most miserable in the history of the index, which has been published since 1952.
US demand recovery
Although consumer confidence is not boundless, it is climbing, and its recovery is based on ample evidence of improved economic conditions. People are working,
travelling, shopping, and seeking entertainment again. Fuel demand is recovering, though demand for key fuels has not regained pre-pandemic levels. Some of this was expected. Gasoline and diesel demand, for example, are forecast to gradually decline over time, so they would not be expected to regain former levels and grow again from that higher baseline. Programmes have been underway for years to improve fuel efficiency, promote the use of alternatives and renewables, and increase sales of electric vehicles. The COVID-19 pandemic also brought some changes that are considered structural and permanent, including a more widespread acceptance of and desire for a work week that includes at least some remote work.
Focusing on the years since the pandemic, has demand for key fuels bounced back? Figure 1 tracks annual demand for gasoline, jet fuel, and diesel fuel from 2019 to the January - November period of 2023, as reported by the US Energy Information Administration (EIA). Demand for gasoline and jet fuel was hit hard by the pandemic. Gasoline demand of 9.309 million bpd in 2019 collapsed to 8.049 million bpd in 2020, a drop of 1.26 million bpd. To place this huge volume in perspective, the EU as a whole used 1.531 million bpd of gasoline in 2022, according to the Energy Institute and BP.5 US gasoline demand bounced back to 8.816 million bpd in 2021, flattened to 8.81 million bpd in 2022, and grew to 8.952 million bpd in January - November 2023. Year 2023 demand was approximately 357 000 bpd below its pre-pandemic level.
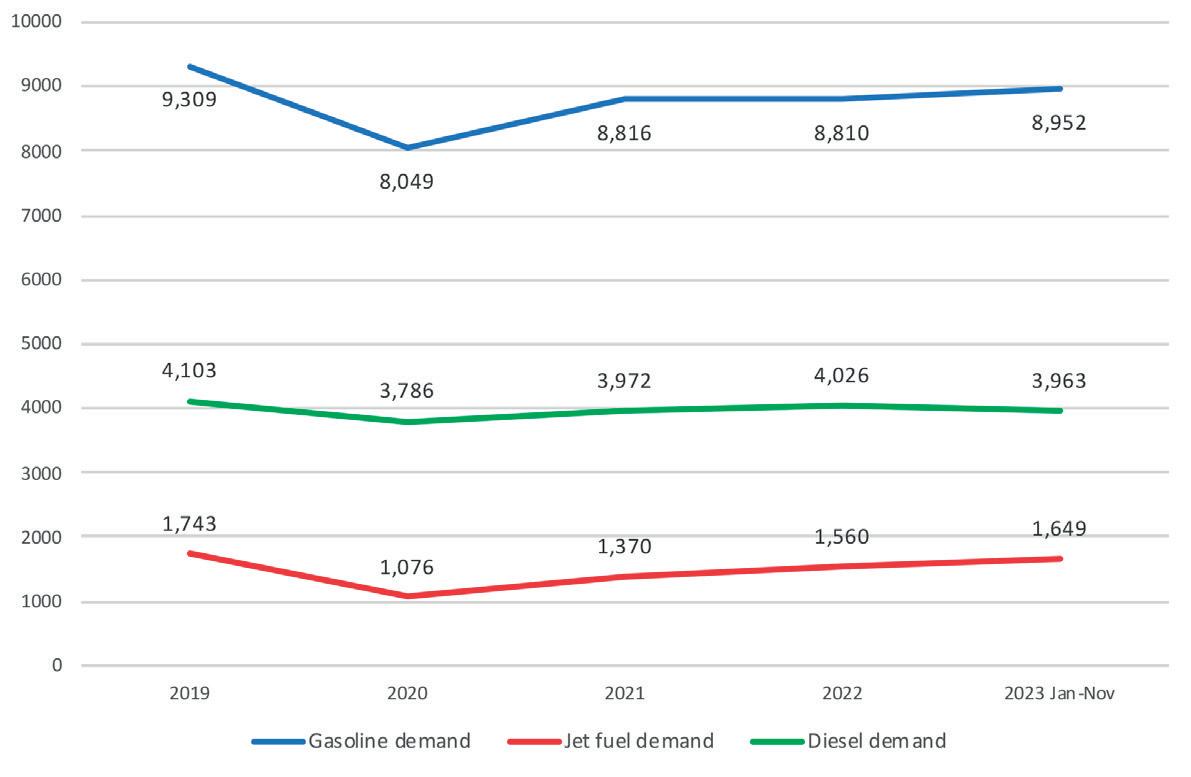
US demand for jet fuel plummeted in 2020 as travel bans were instituted. Demand of 1.743 million bpd in 2019 plunged to 1.076 million bpd in 2020, a drop of 667 000 bpd, or 38%. Demand recovered to 1.37 million bpd in 2021, 1.56 million bpd in 2022, and 1.649 million bpd in 2023 (January - November). Demand in 2023 was 94 000 bpd below its 2019 level.
Diesel demand fell from 4.103 million bpd in 2019 to 3.786 million bpd in 2020, a drop of 317 000 bpd. Demand recovered to 3.972 million bpd in 2021, 4.026 million bpd in 2022, and then declined again to 3.963 million bpd in January - November 2023. Diesel demand in 2023 was 140 000 bpd below its pre-pandemic level.
Totalling these three key fuels, demand in 2020 dropped 2.244 million bpd below its 2019 level. Demand grew in 2021, 2022 and 2023, but 2023 demand remains 592 000 bpd below its 2019 level.
Price-demand relationships
Energy prices were a major contributor to the soaring prices and inflation experienced in the US in recent years. Energy is a key ingredient to essentially every type of economic activity, and high energy prices have knock-on effects across all economic sectors. As the US emerged from
March 2024 HYDROCARBON ENGINEERING 16
Figure 1. US demand for key fuels since the COVID-19 pandemic (‘000 bpd). Source: US Energy Information Administration.
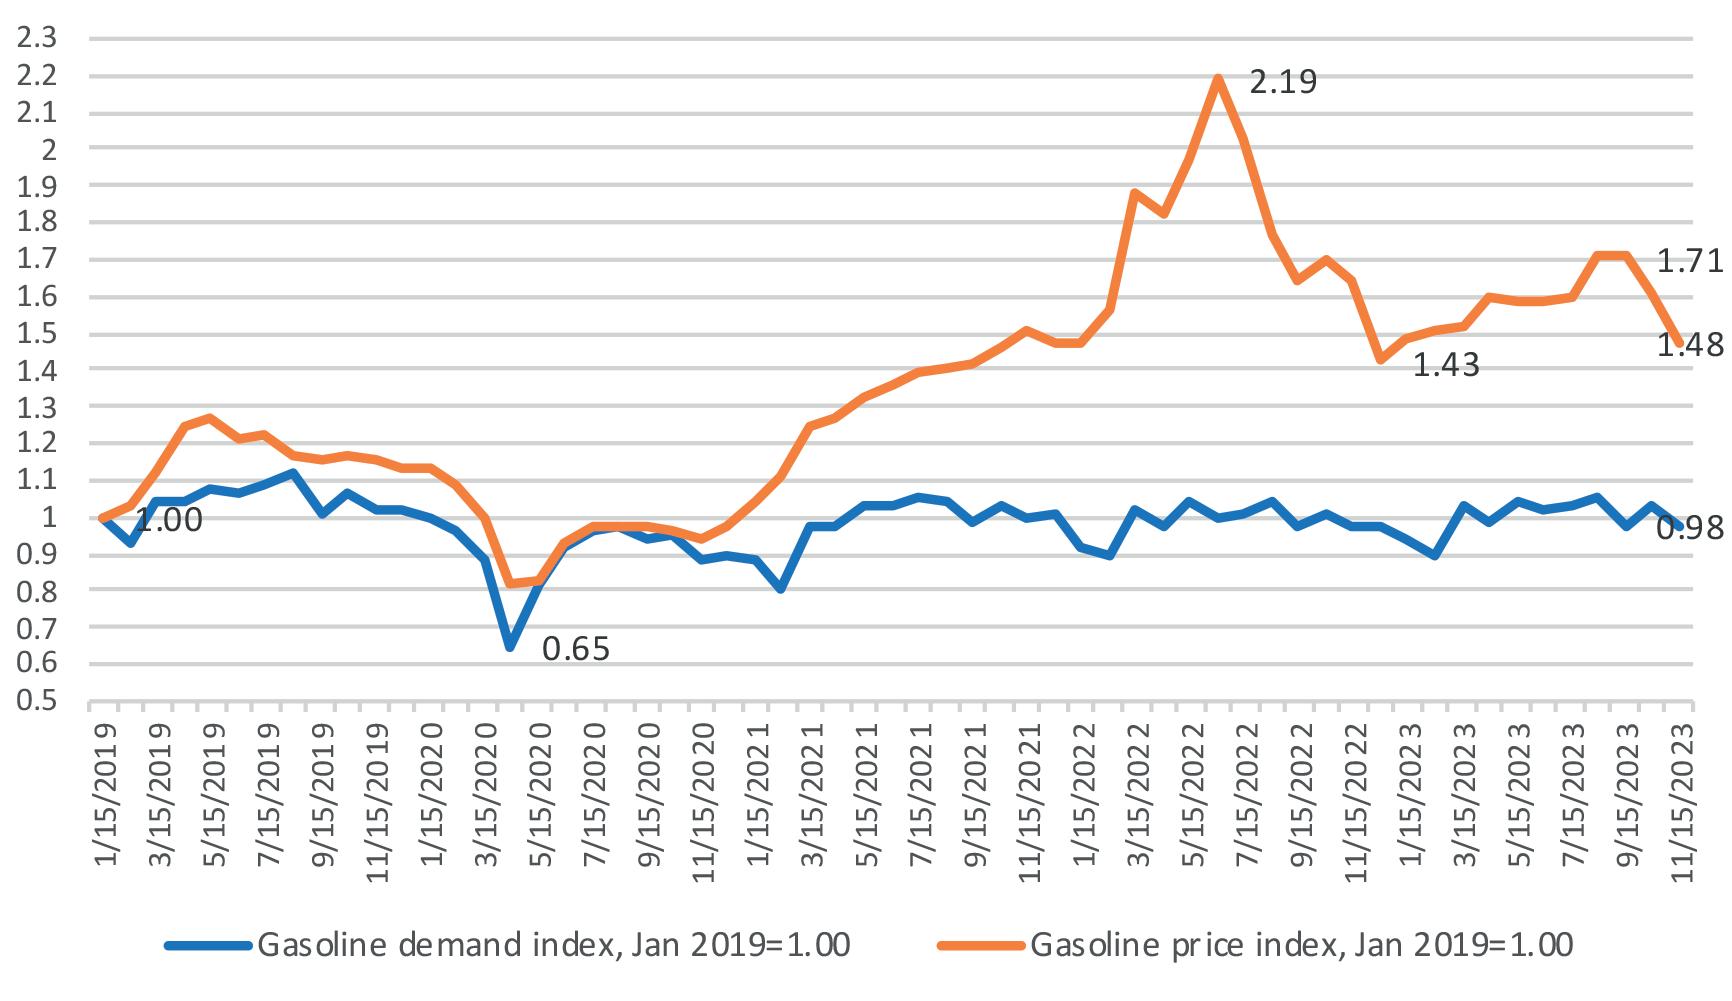
Figure 2. Gasoline demand vs price, indexed, Jan. 2019 = 1.00.

Capturing green opportunities
Carbon capture and storage or utilization (CCS/CCU) is a key strategy that businesses can adopt to reduce their CO2 emissions. By selecting the right technologies, pressing climate change mitigation targets can be met while benefitting from new revenue streams.
Sulzer Chemtech offers cost-effective solutions for solvent-based CO2 absorption, which maximize the amount of CO2 captured and minimize the energy consumption. To successfully overcome technical and economic challenges of this capture application, we specifically developed the structured packing MellapakCC™. This packing is currently applied in several leading CCS/CCU facilities worldwide, delivering considerable process advantages.
By partnering with Sulzer Chemtech – a mass transfer specialist with extensive experience in separation technology for carbon capture –businesses can implement tailored solutions that maximize their return on investment (ROI). With highly effective CCS/CCU facilities, decarbonization becomes an undertaking that can enhance sustainability and competitiveness at the same time. For more information: sulzer.com/chemtech

Visit us at ACHEMA in Frankfurt Hall 4 Stand D48
the pandemic, pent-up demand placed pressure on supply, and supply chain hiccups stymied recovery. Oil and energy prices and demand had fallen so low that investment had fallen, and it took time for supplies to come back onstream. The high prices, in turn, stifled demand and recovery.
Oil prices also rose, and remain high, because of geopolitical risk. The Russian invasion of Ukraine in early 2022 launched a protracted, grisly, and expensive war that continues to this day. It has dramatically changed the flow of oil. Adding to this, October 2023 brought armed conflict between Israel and Hamas-led forces in the Gaza Strip. Tensions have spread throughout the Middle East, adding risk to oil shipping lanes. It is not possible for oil markets to be calm with wars ongoing in Europe and the Middle East. High prices are expected to remain until peaceful resolution is found.
Figure 2 tracks the monthly changes in US gasoline demand and retail price. It allows side-by-side comparison of price and demand by calculating an index, with
January 2019 as the starting basis equal to 1.00. In April 2019, after many areas launched stay-at-home mandates, gasoline demand fell to 0.65 of the January 2019 starting point. Demand crept back up by mid-2021, but it has stagnated since then. This is explained in part by comparing the demand index with the retail price index. Retail gasoline prices slumped to 0.82 in April 2020, and they remained below 1.00 while the COVID-19 lockdowns remained in force. By 2021, however, gasoline prices began to rise, sharply breaking the link with demand.
Gasoline prices surged strongly when Russia invaded Ukraine, hitting a peak of 2.19 (219%) in June 2022. Although prices have moderated since then, the price index in November 2023 was 1.48; that is, prices were 48% higher than they had been in January 2019. In dollar terms, US retail gasoline prices (regular grade, all areas) were US$2.248/gal. in January 2019. They dropped to US$1.841/gal. in April 2020 during the lockdowns. Prices then spiked to an all-time high of US$4.929/gal. in June 2022. They dropped to an average of US$3.318/gal. in November 2023, and they fell again to US$3.134/gal. in December 2023. Although prices have fallen, they remain US$0.886/gal. above the starting price in January 2019.
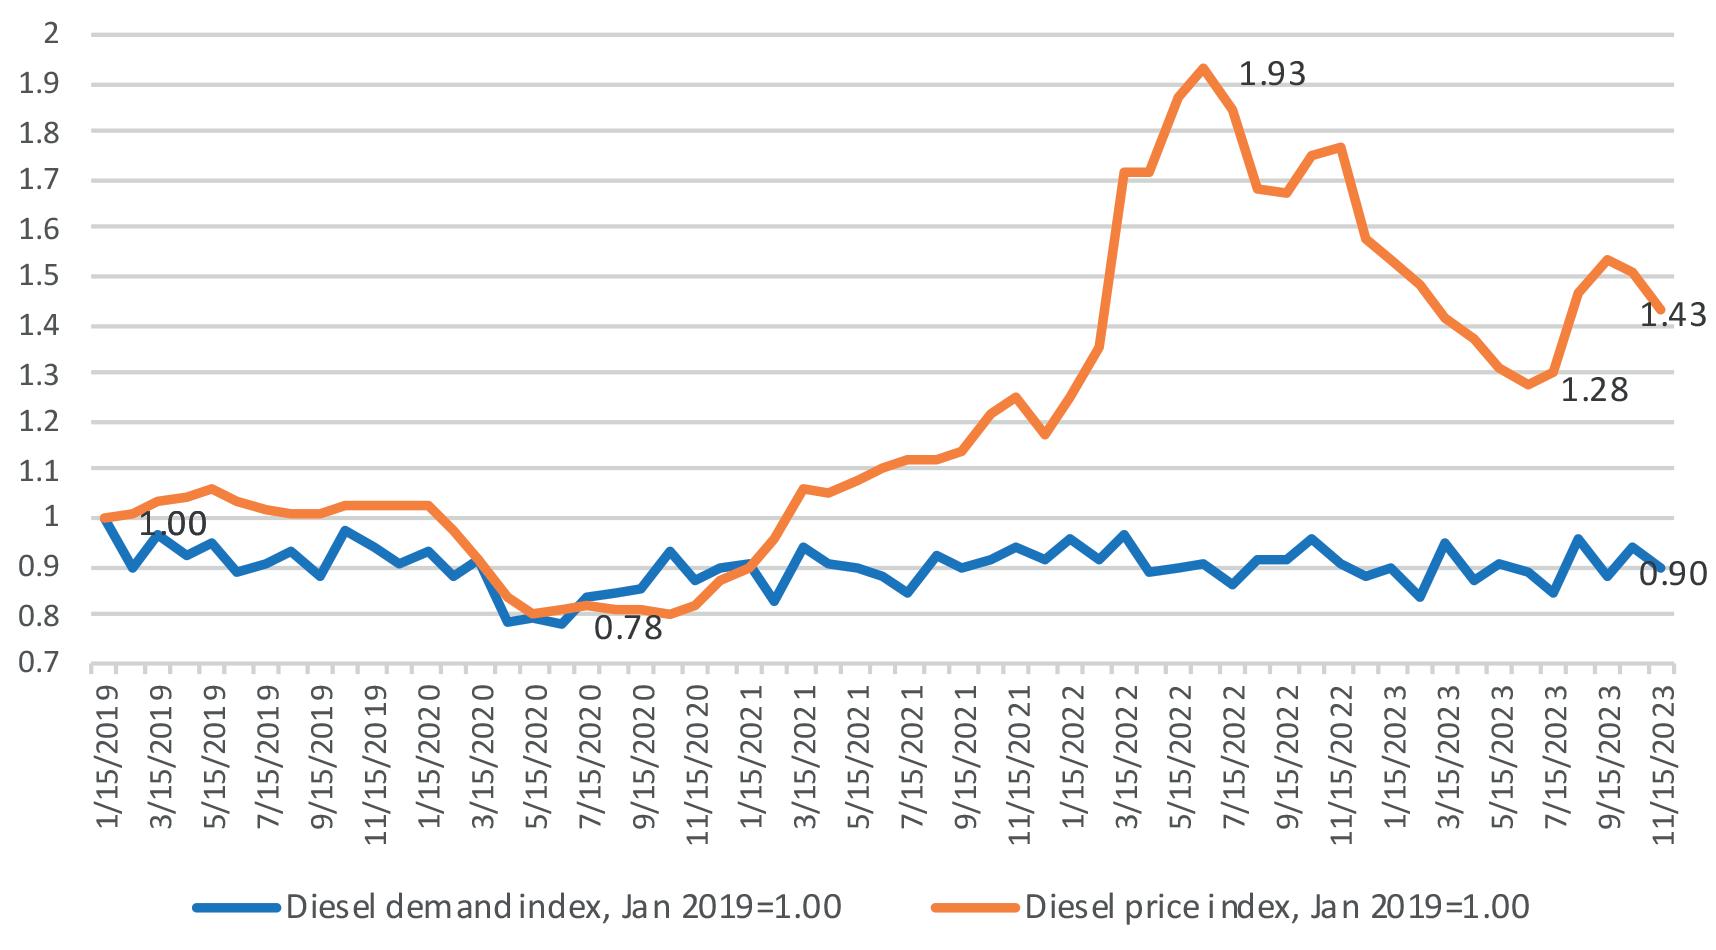
Figure 3 compares monthly changes in diesel demand with changes in price. The pattern resembles the one seen in the gasoline index, though it is less dramatic. Diesel demand fell to 0.79 in April 2020 relative to January 2019, while prices dropped to 0.84. Diesel demand has never regained its level of January 2019, hovering mainly in the range of 0.85 - 0.95, and averaging 0.90 in November 2023. As with gasoline, diesel prices began to pull away in 2021, and they spiked to 1.93 in June 2022. Diesel prices have eased since the peak, yet in November 2023 they remained 1.43 times as high as they were in January 2019. In US dollar
Source: US Energy Information Administration
March 2024 HYDROCARBON ENGINEERING 18
Figure 3. Diesel demand vs price, indexed, Jan. 2019 = 1.00. Source: calculated based on US EIA data.
capacity (‘000
(%) Refinery inputs Operable crude capacity Operating crude capacity Idle crude capacity Refinery utilisation (%) 2019 16993 18808 18439 370 90.4 2020 14723 18662 17989 674 78.9 2021 15674 18108 17403 704 86.6 2022 16485 17963 17806 157 91.8 2023 JanuaryNovember 16451 18237 17989 249 90.2 2020 - 2019 -2270 -146 -450 304 -12 2023 - 2019 -541.5 -571.1 -450.2 -121.3 -0.2
Table 2. US refinery inputs and
bpd), and utilisation
terms, US retail diesel prices (on-highway, all areas) were US$2.98/gal. in January 2019. Prices fell to US$2.492/gal. in April 2020, and they dropped to a nadir of US$2.389/gal. in October 2020. Subsequently, diesel prices skyrocketed to record highs of US$5.754/gal. in June 2022. Prices eased to US$4.254/gal. in November 2023, and fell again to US$3.972/gal. in December 2023.
Refinery utilisation and inputs
On the global front, the Russia-Ukraine war and the Israel-Hamas war are elevating oil prices. Crude oil feedstock costs are the largest element in US retail prices for fuel. There are also downstream issues supporting high retail prices. When fuel demand fell in early 2020, refinery utilisation and throughput also fell. In April 2020, US refinery utilisation sagged to 70.2%, after having been as high as 94.8% in August 2019. After the pandemic, economic activity and growth returned, but restarting the economy was a struggle, and restarting refineries was a struggle as well. Some refineries lagged in their ability to raise throughput to meet recovering demand, particularly during summer driving season. Some refineries had been placed in maintenance mode, and they subsequently were idled. It was impossible to predict when and if profitability would return. Refiners were reluctant to flood the market with refined fuel when US demand was depressed, and storage tanks were full. US refiners have grown more reliant on export markets, but the pandemic hit many of these markets as well, and bumping up refinery runs to expand exports seemed risky.
Table 2 provides details on US crude refinery inputs, capacity, and utilisation in the years 2019 through 2023 (January - November) according to the EIA. In 2019, US operating crude distillation capacity was 18.439 million bpd. Operating capacity was cut to 17.989 million bpd in 2020, and cut again to 17.403 million bpd in 2022, a loss of 1.036 million bpd of capacity. Utilisation rates were 90.4% in 2019, dropping sharply to 78.9% in 2020. Utilisation rates improved to 86.6% in 2021, partly because of capacity closures. Utilisation rates rose to 91.8% in 2022 and declined slightly to 90.2% in 2023. Operating capacity recovered to 17.806 million bpd in 2022 and 17.989 million bpd in 2023. Thus, although refinery utilisation rates in 2023 have returned to pre-pandemic levels, this has been achieved by cutting operating capacity by 450 000 bpd.
Refinery throughput plunged by 2.27 million bpd between 2019 and 2020, falling from 16.993 million bpd in 2019 to 14.723 million bpd in 2020 – the lowest level since 2009, in the midst of the Great Recession. Throughput averaged 16.451 million bpd in 2023, still 541 500 bpd below its 2019 level.
The future: AEO long-term forecast
The 2021 - 2023 years brought significant recovery from the COVID-19 slump. The US GDP is growing, job formation and wage growth have been excellent,
The Leading Simulator for CO2 Capture
Solvents:
• Primary, secondary, promoted amines
• CESAR1 (updated with data from DOE partnership & tested within EU-funded consortium “SCOPE”)
• Amino acid salts
• Enzyme catalysed & amine-promoted carbonates
• Ionic solvents
• High strength piperazine
• Chilled ammonia Applications:
• Stationary power generation
• CO2 capture from LNG-fueled ships

• Renewable methane from landfill gas and organic waste

• Hydrogen production via reforming Ferrybridge Pilot Plant, Ferrybridge, UK, 100 TPD
Reliable:
• New CESAR1 model updated with cutting edge lab and plant data from DOE partnership
• Thoroughly tested as part of EU-funded research consortium “SCOPE”

Contact
for a free trial Optimized Gas Treating, Inc. www.ogtrt.com +1 512 312 9424 Let ProTreat® Be
us
Your Guide
demand is recovering, and inflation is gradually coming under control. Refinery inputs and utilisation rates have improved. Oil prices are high, but down from their peak in the summer of 2022. What will the future bring?
Gasoline and diesel demand have recovered from the trough seen in 2020, but they are not back at their pre-pandemic levels. In November 2023, gasoline demand was approximately 90% of January 2019 demand. Diesel demand in November 2023 was approximately 98% of demand in January 2019. As noted, however, this recovery in demand occurred despite high prices, suggesting that this level of demand is robust and price-insensitive. Although volumes sold in 2023 were lower than they were in 2019, this is consistent with the long term expectations of demand.
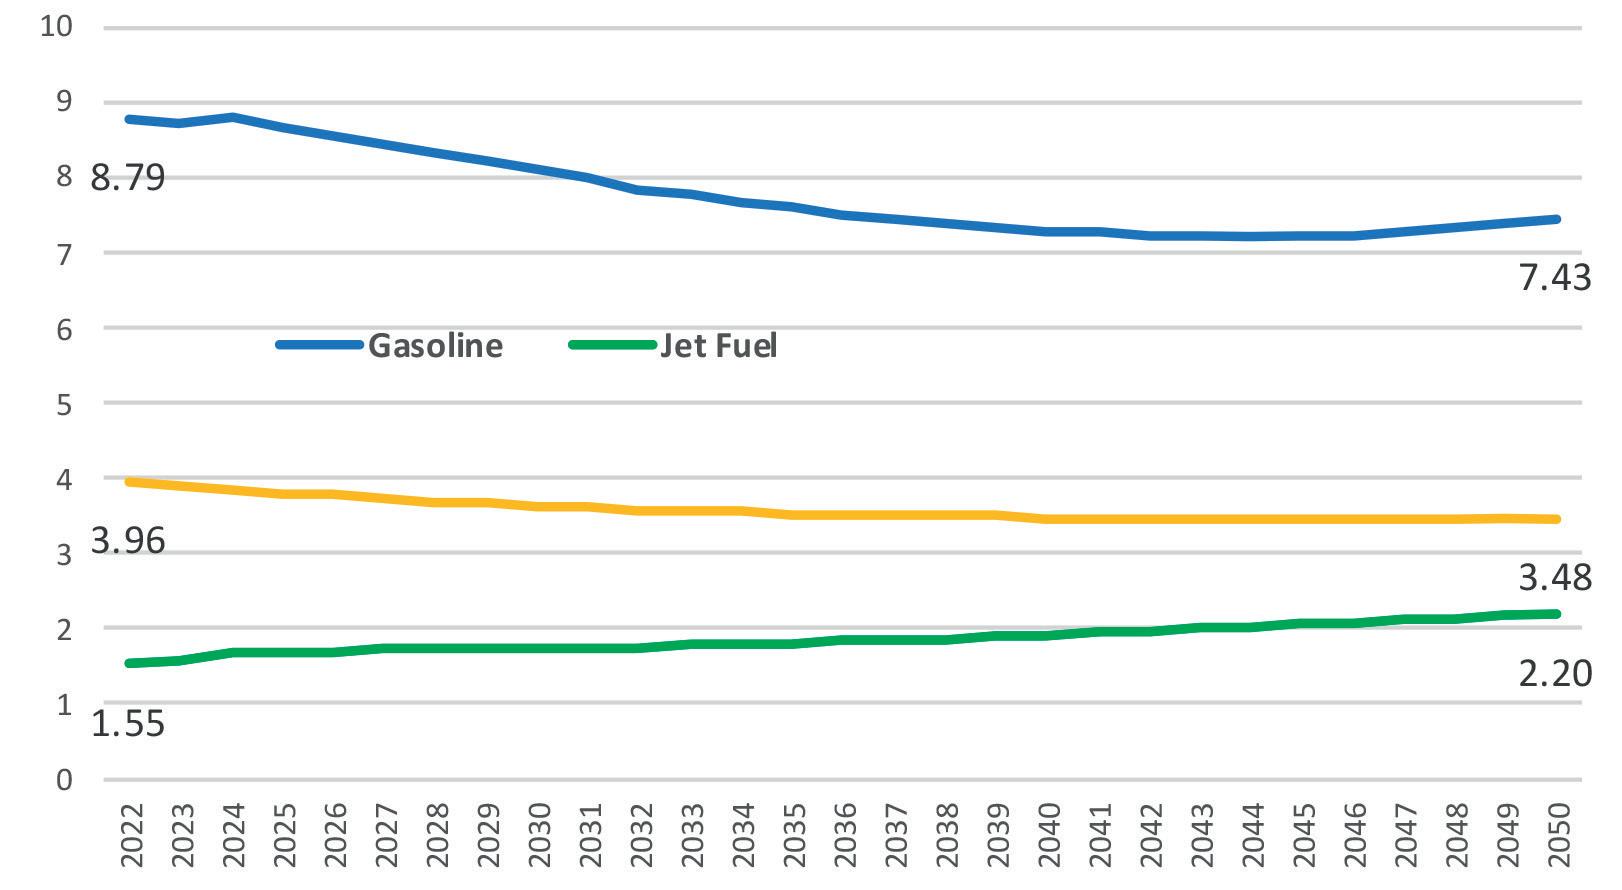
Figure 4 presents the long-term (2022 - 2050) forecast of gasoline, diesel, and jet fuel demand presented in the EIA’s Annual Energy Outlook (AEO.)6 The AEO forecasts that US gasoline will shrink by -0.6%/yr on average between 2022 and 2050. In volume terms, demand of 8.79 million bpd in 2022 will slide to 7.23 million bpd in 2024, then level off and increase slightly to 7.43 million bpd in 2050. Demand in 2050 will be 1.36 million bpd below demand in 2022.
Diesel demand is forecast to decline at an average rate of -0.46%/yr, falling from 3.96 million bpd in 2022 to 3.48 million bpd in 2050, a loss of 0.48 million bpd.
Only jet fuel demand is forecast to continue to grow. Demand of 1.55 million bpd in 2022 is expected to increase at an average rate of 1.27%/yr, with demand reaching 2.2 million bpd in 2050.
The AEO forecast does not include dramatic changes in oil prices. The reference case forecast assumes that the spot prices for WTI crude will rise from US$86/bbl in 2023 to US$91/bbl in 2024, so high prices are expected throughout this year. However, the AEO forecasts that WTI prices will subside to US$85/bbl in 2025, then begin a gradual climb to US$90/bbl in 2034, US$95/bbl in 2044, and US$98/bbl in 2050. Between 2022 and 2050, this will amount to a crude oil price increase of a mere 0.1%/yr. In contrast, refined product prices are forecast to decline between 2022 and 2050: gasoline by -0.8%/yr, diesel by -1.0%/yr, and jet fuel by -0.7%/yr. Therefore, the AEO is not assuming that fuel demand will be pressured down by
high prices; rather, the long-term decline will be structural and intended. For example, fuel efficiency is expected to increase by 0.8 - 1.4% depending on the type of vehicle, while the use of electricity in the transport sector is forecast to grow at 9.7%/yr between 2022 and 2050.
Conclusion: US recovery becoming visible
COVID-19 wrought havoc in the US and the world. The Centers for Disease Control and Prevention (CDC) reports that nearly 6.8 million people in the US have been hospitalised to date, and over 1.17 million have died. Stay-at-home orders were launched in 2020 to slow the spread of the disease. Even with this, there were weeks in 2020, 2021, and even 2022 with death tolls in the tens of thousands. The 2020 lockdowns closed businesses, and millions of people lost their jobs. The Bureau of Labor Statistics reported that 0.21 million people filed initial jobless claims during the week of 7 March 2020, consistent with historic averages. This skyrocketed to 6.87 million jobless claims during the week of 28 March 2020, after the lockdowns were launched. The Bureau of Economic Analysis reported that US GDP shrank -5.3% in 1Q20 and -28% in 2Q20.
At last, the US is recovering. The economy is expanding. Job formation has exceeded expectations. People are working, and their wages have increased. This has helped purchasing power keep up with inflation. Oil prices, and therefore prices for many goods and services, remain high. Much of this is attributed to the Russia-Ukraine war and the Israel-Hamas war.
US refineries are running at healthy utilisation rates, though capacity and throughput are below their 2019 levels. Fuel demand has risen, though it remains below its 2019 level. The AEO forecast anticipates that gasoline and diesel demand will gently decline in coming decades. Jet fuel demand has rebounded the most successfully, and demand is expected to continue to grow. The recovery of fuel demand has occurred despite high prices, indicating that a certain level of demand is robust and largely price-insensitive.
The US is the world’s largest economy, and its myriad parts function in mysterious and interconnected ways. The pandemic caused economic wounds that have taken years to heal. It is not easy to see signs of recovery. Yet they are all around, and at last becoming visible. If the country is able to stay the course, 2024 should continue to bring recovery.
References
1. https://www.federalreserve.gov/data.htm
2. The Employment Situation, January 2024, US Bureau of Labor Statistics, https://www.bls.gov.
3. https://www.bls.gov/opub/ted/2023/slower-growth-isexpected-in-the-population-labor-force-and-gross-domesticproduct-through-2032.htm
4. http://www.sca.isr.umich.edu/
5. Energy Institute and BP, Statistical Review of World Energy.
6. www.eia.gov/outlooks/aeo
March 2024 HYDROCARBON ENGINEERING 20
Figure 4. AEO forecast of demand for gasoline, jet fuel, and diesel (million bpd). Source: US EIA.
Colin Frazier, American Petroleum Institute (API), explains how the API’s Process Safety Site Assessment Program (PSSAP®) can help hydrocarbon processing plants improve the safety of operations.
With a history of safety advocacy dating back to 1924, the American Petroleum Institute (API)’s commitment to enhancing safety practices in the natural gas and oil industry is a proactive and continuous attempt to continually enhance safety benchmarks. This commitment has been shaped by evolving industry needs, reflecting a deep commitment to safety. In response to this commitment, API introduced the non-profit and voluntary Process Safety Site Assessment Program (PSSAP®) for the hydrocarbon and chemicals processing sector in 2012, which has been helping processing plants worldwide improve their process safety management programmes. Appropriate for any site that processes hydrocarbons or chemicals, PSSAP’s industry-created good practice protocols help sites guide their continuous improvement

efforts, whilst also providing necessary benchmarking that allows them to compare the maturity of their programmes with those of their peers.
Programmatic benchmarking efforts
PSSAP is applicable to any site that processes hydrocarbons, chemicals, or is otherwise regulated by OSHA’s Process Safety Management (PSM) regulations. While API does not conduct regulatory audits, PSSAP addresses many of the same areas covered by OSHA’s PSM. However, PSSAP diverges in its approach by drawing on industry expertise to inform what good practice looks like globally, aiming to help sites mature their process safety management programmes far beyond what is required by OSHA’s PSM.
March 2024 21 HYDROCARBON ENGINEERING
In addition to bringing expertise to these sites to help them understand industry good practices, API benchmarks these site-specific programmes. This quantification of site-specific maturity gives sites the ability to compare their performance, in a blinded and anonymous way, with the maturity of other sites. After their assessment, sites are given a readout of their performance and benchmarking information that provides them with a statistical-based analysis of their performance across the industry. Additionally, they can discuss with the assessors how to better mature programmes relative to the 600+ requirements contained in the PSSAP protocols, which can help sites populate continuous improvement plans.
Since 2012, API has conducted over 180 PSSAP assessments at sites around the world. These comprise refineries, petrochemical plants, LNG processing, tank farm operations (both adjacent to refineries and standalone), and chemical plants of varying sizes and throughput volumes. PSSAP is successful at assessing sites of all sizes, from small plants with relatively small throughput, all the way up to the largest refineries in the world with the highest throughput. As a result of the programme’s success at assessing such a large number of sites, API has confidence that the benchmarking is representative of the industry and can therefore be used to understand larger industry trends. API and the Advancing Process Safety Initiative (APS), a joint initiative to improve process safety with the American Fuel and Petrochemical Manufacturers (AFPM), analyse the
benchmarking data for both trends in industry-wide improvements and in areas that require further attention from industry to help improve performance.
When PSSAP first analysed the benchmarking data, it was discovered that some specific topics within the mechanical integrity umbrella could use more specific emphasis and industry tools. As a result, APS began programmatic efforts to address walk-the-line topics, creating and distributing tools widely across the industry. Because of these efforts, PSSAP was able to quantify how well these programmes were improving across the industry in subsequent years. These walk-the-line efforts by APS were followed by an increase in the industry benchmarking average for the topic by approximately 40%.
With the focus of walk-the-line efforts, a larger focus on mechanical integrity topics followed, and these combined efforts produced a benchmarking average increase of 10% across the entire mechanical integrity topics on average (Figure 1).
While these technical topics rarely get the attention they deserve, these stories are integral in explaining the industry’s commitment to continuous improvement in process safety management. Mechanical integrity is a foundational and arguably paramount topic in process safety management, and seeing this amount of improvement in the average industry benchmarking scores in less than a decade is a testament to the industry’s commitment to ensuring process safety at processing facilities.

PSSAP as a continuous improvement driver at sites
One of the questions API is continually asked by industry is: “Should we be doing these assessments at any particular cadence?”
Because these assessments are voluntary in nature, API’s advice has always been as follows: when you think you have made progress toward your continuous improvement plans, conduct a repeat assessment to assess and quantify those efforts. This considers that meaningful improvements to these process safety management programmes often take several years to plan and implement, as they take substantial resources, and sometimes face changes in company culture and/or company policies and procedures. This often takes time and diligence when working in large corporate management systems.
However, in 2023, API analysed sites that conducted repeat assessments to glean insights around repeat assessment cadence and when repeat assessments would be most beneficial. At the time of the analysis, 11 sites had conducted repeat assessments. Benchmarking data was reviewed to look for any areas of improvement, the time between these assessments, and other factors that could contribute to a site’s scoring changes. Below is an excerpt of a paper presented at ADIPEC in Abu Dhabi, UAE, in October 2023:
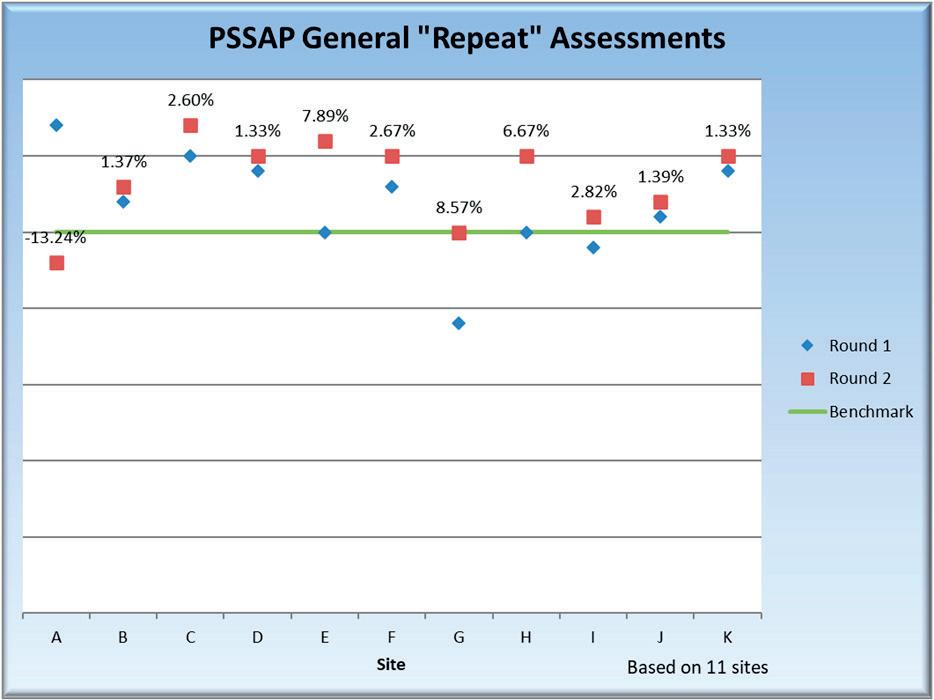
“As seen in Figure [2], all sites except for one, showed an increase in the scoring seen in subsequent assessments. The increase in scoring ranges from 1.33% to 8.57%. Additionally, it should be noted that all
March 2024 HYDROCARBON ENGINEERING 22
Figure 1. Average mechanical integrity performance scoring, comparing average scores seen from 2012 - 2015 with average scores seen from 2016 - 2019.
Figure 2. PSSAP assessments comparing total performance of a site’s first assessment with their second assessment as a percentage (%) of improvement.

The new 6X radar level sensor is so easy to use, it’s simply a pleasure. Because we know customers value not just ‘perfect technology’, but also making everyday life better and less complicated. We wouldn’t be VEGA if measurement technology was our only value.
PRECISION, SIMPLICITY, COMPATIBILITY. THE 6X ®. OUT NOW!
HOME OF VALUES.
VEGA.
GET TO KNOW THE 6X® www.vega.com/radar
sites, except for the one, scored above the overall ‘benchmark’. The benchmark in Figure [2] refers to the average score achieved by all the sites that have conducted assessments (average calculated in 2023). This is to say, the 10 sites who saw an improvement are performing better than the industry average in 2023.
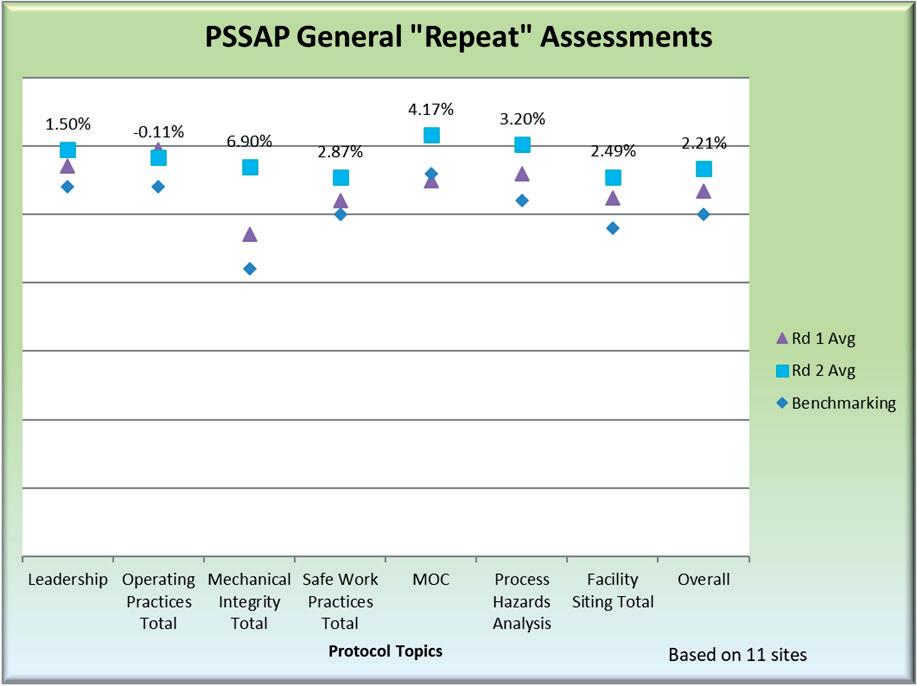
“This analysis presents some interesting findings: all protocols saw an increase in the average scoring per protocol, except for the operating practices protocol, which saw a decrease of 0.11%. Because the magnitude of change is so low, we do not believe there is a meaningful decrease in performance for that protocol. Conversely, those that saw improvement saw a much larger magnitude of change, ranging from a 1.5% average improvement to a 6.9% average improvement.
Of the improvements seen here, the mechanical integrity protocol is the most interesting, as it represents a key component of process safety management, one that PSSAP views as being weighted more heavily than others.”2
This aligns with the performance improvements across PSSAP that are being seen in the mechanical integrity assessment protocol, and it is good to see repeat assessments echo this trend. A 6.9% average improvement in scoring across 11 sites is a large increase, given the large scope and effort that mechanical integrity programmes represent.
Finally, of the 11 sites, those that saw the largest percentage improvements in their overall scores conducted repeat assessments between three and six years following their first assessment. This confirms API’s assumption that sites need time to truly implement meaningful change in these programmes. As a result, API can confidently assert that repeat assessments are effective at quantifying these improvements on a triennial cycle, assuming that sites dedicate the necessary resources to fulfil their commitments in their continuous improvement plans.
PSSAP’s future in the face of regulatory uncertainty
While PSSAP is not based on OSHA’s PSM regulation, and the API’s assessments are not regulatory audits, the topics covered as part of assessments are similar, albeit more focused on prevention rather than response. While API does not base assessment protocols on regulatory requirements, it is aware of how changes in regulations can impact industry and their management of programmes that are a component of regulatory compliance.
The American hazard materials processors are currently awaiting OSHA action in revising the PSM regulations; publication is expected soon. The refineries that API represents are no exception to this, and API is poised to comment on this regulation when it is proposed in the federal register. However, there will likely be implications that will need to be considered by PSSAP: if some good practices found in API protocols are made into minimum requirements, how will the programme change these requirements to ensure compliance is not the target? Should industry good-practice implementation be put on hold until we are comfortable with the new and/or changed requirements (just to name a few)?
PSSAP is committed to being a resource for companies in helping them continuously improve. PSSAP administrators are hopeful that participation in the programmes and pushing continuous improvements more broadly will help lessen the burden of compliance with the new OSHA PSM regulations. However, API and PSSAP will do what is necessary to evolve the programme to ensure it continues to be effective in the face of these upcoming changes.
API is planning one major change in 2024 that will ensure PSSAP continues to compliment OSHA PSM compliance efforts. A new offering involves a site licensing PSSAP protocols for their own use. This addition will help ensure that sites can conduct their OSHA PSM audits (separate from PSSAP) alongside PSSAP assessments. API has received considerable feedback that having to conduct these assessments separately presents resource strains. Conducting them side-by-side will help operators achieve their regulatory compliance goals while also using PSSAP to ensure that sites are looking at industry good practices simultaneously so that continuous improvements can continue to occur.
API believes this addition will inspire more sites to request assessments and will put good practice protocols in front of a more diverse audience.
Regardless of regulatory action, API and PSSAP are committed to being a key industry resource, sharing good practices and measuring site and industry-wide improvements so that the entire industry raises the bar on its performance expectations.
References
1. https://www.osha.gov/process-safety-management.
2. FRAZIER, C. M., and MENG, R. D., ‘Process Safety Site Assessment Program (PSSAP®): Do Repeat Assessments Help Assure Success?’, paper presented at ADIPEC, Abu Dhabi, UAE, October 2023, doi: https://doi.org/10.2118/216049-MS.
March 2024 HYDROCARBON ENGINEERING 24
Figure 3. Repeat assessment analysis focused on percent changes in average performance of all 11 sites which have conducted repeat PSSAP general assessments.
API’s
PARTICIPANTS
ENHANCING SAFETY PERFORMANCE ACROSS THE INDUSTRY PSSAP ® © 2024 – American Petroleum Institute, all rights reserved. API, PSSAP and the API and PSSAP logos are trademarks or registered trademarks of API in the United States and/or other countries. API Marketing & Communications: 2023-147 | PDF
learn more about PSSAP and take your first step toward your assessment, visit: ®
Process Safety Site Assessment Program (PSSAP®) demonstrates a commitment to a culture of safety and continuous improvement at refining, petrochemical and chemical sites.
www.API.org/PSSAP To
BENEFIT FROM SHARED LEARNING, INDUSTRY BENCHMARKING, EXPERIENCED
AND MORE
ASSESSORS

Richard Caulkin, Tim Michalec and James Esteban, UNICAT Catalyst Technologies LLC, explore how revolutionary scientific modelling allows tailored optimisation of filtration grading and loading profiles to deliver 50% improvements in catalyst bed life.
26 March 2024 HYDROCARBON ENGINEERING

Hydroprocessing is a crucial process in the refining and petrochemical industries, essential for producing high-quality fuels and meeting environmental standards. Included in the family of hydroprocessing applications are hydrotreating, hydrocracking, and hydroisomerisation, all of which play a key role in producing renewable fuels. During hydrotreating, raw feed streams react with hydrogen in fixed bed reactors that perform hydrodesulfurisation (HDS) – sulfur removal, hydrodenitrification (HDN) – nitrogen removal, hydrodemetallisation (HDM) –contaminant metals removal, and/or hydrodeoxygenation (HDO) – oxygen removal. Hydrocracking and hydroisomerisation processes also use fixed catalyst bed reactors that reconfigure hydrocarbon molecules through cracking and isomerisation reaction mechanisms. These catalyst beds operate at around 225 - 425°C and 30 - 150 bar, depending on the feed quality and processing conditions. These processes increase the efficiency of fuels and reduce harmful environmental contaminants in final products. Since these reactor systems have fixed catalyst beds, pressure drop across hydroprocessing reactors can be a challenge to maximising the overall life cycle of the catalyst materials.
High pressure drop in hydroprocessing reactors can lead to suboptimal catalyst performance, decreased reactor efficiency, feed maldistribution, shorter operating cycles, and increased operational, catalyst and maintenance costs. This article explores the use of UNICAT’s Advanced Filtration System (AFS) as a solution to mitigate pressure drop and enhance overall reactor performance.
In addition to commercial data, a computational modelling case study of a generic hydroprocessing reactor is presented, highlighting comparative differences between reticulated ceramic and AFS filtration medias discussed.
Pressure drop discussion
High pressure drop in hydroprocessing reactors can negatively impact performance due to maldistribution of reactant streams, decreased conversion rates, shorter run cycles, and increased energy consumption. These issues not only impact the economic viability of hydroprocessing units, but also have negative environmental and regulatory impacts. Shorter operating cycles lead to increased spent catalyst disposal costs, lost revenue, and higher maintenance costs.
In hydroprocessing applications, the development of catalyst bed pressure drop is associated with catalyst bed fouling from a variety of potential causes including, but not limited to: feed stream contaminants, deposition of foulants, formation of coke, adverse side reaction products, and the deposition of feed poisons. These foulant materials can be deposited steadily throughout the operating cycle or during sudden unplanned events of adverse operating conditions, e.g. emergency shutdowns. Reactor pressure drop increases as the available void space in the catalyst bed is packed with foulant materials. New catalysts used in hydroprocessing applications have an available void space of approximately 35 - 40%. This available void space provides suitable volume for reactant vapour and liquid streams to evenly distribute across the catalyst bed, as well as provide longevity of performance and some tolerance for fouling over the cycle. As the available void space is decreased, pressure drop across the reactor increases and distribution of the reactant streams can be disrupted. This is where pressure drop mitigation grading plays a crucial role in catalyst bed protection. UNICAT’s AFS catalyst bed grading offers filtration that has nearly twice the available void space of fresh catalyst and is designed to evenly distribute foulants throughout the graded filtration media, as well as provide continuous flow channels to prevent the disruption of evenly distributed reactant streams.
March 2024 27 HYDROCARBON ENGINEERING
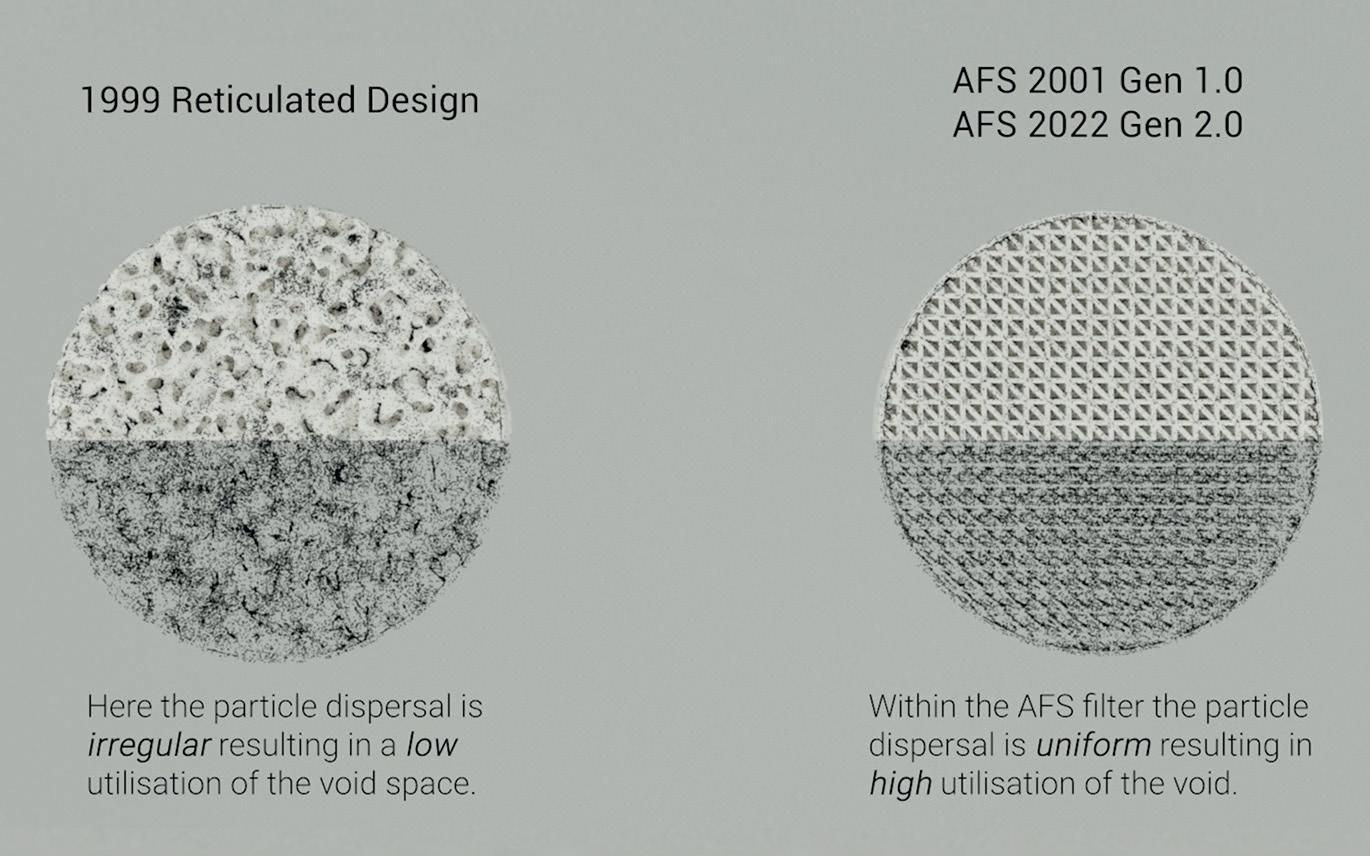
It is especially important to highlight that the distribution of reactant gas and liquid streams in mixed-phase applications is set by the reactor internal components. There are several case studies that highlight the importance of proper distribution achieved by modern reactor internals and the value associated with subsequent catalyst utilisation from upgrades in the mechanical components installed in these reactor systems. To maintain proper distribution, it is important that flow paths be maintained and not disrupted by either catalyst materials and/or foulants as they deposit in the reactor voids (Figure 1). UNICAT’s AFS is designed to provide high available void space to capture foulants, but also with uniform flow channels to allow for the retention of flow distribution to avoid poor catalyst utilisation (Figure 2). This results in greater catalyst utilisation over the entire lifecycle of the catalyst and a retention of even distribution.
Graded bed design
Implementing a well-designed grading system is one of the most effective ways to avoid long-term pressure drop increases. Initially, catalyst companies developed top bed grading systems to filter out fouling contaminants with varying degrees of success. These initial designs contained smaller spherical support balls, ‘wagon wheels’, and rings layered at the top of the bed. The
rings sat directly on top of the catalyst bed, which consists of cylinder or lobed catalyst particles. Using wagon wheels and rings was fairly successful, but it was limited due to internal void space in rings which are too large to filter the smallest contaminants. Particulates subsequently become trapped at the interface between graded ring layers – primarily between the final ring layer and the top of the catalyst bed. This area often has the only void spaces small enough to capture the smallest particulates. As these transition regions become packed, the overall cross-sectional open space is compromised, resulting in an increase in pressure drop, which can ultimately lead to premature shutdowns. Improvements in pressure drop protection from reticulated ceramics resulted in additional pressure drop protection.
The AFS has fixed triangular openings that provide enhanced particulate and contaminant trapping benefits. It offers high available void, high crush strength, optimised packing efficiency, low pressure drop and high particulate pick-up capacity. This deep bed filtration technology leads to longer cycles and improves unit profitability (Table 1).

UNICAT has combined commercial experience with detailed dynamic simulation technology to develop a new model for graded bed design. While AFS provides high capacity for particulate removal, it remains important that a complex model to complement this technology will provide optimal bed designs. Modelling applications demonstrate an increase in capacity for similarly sized graded beds with only traditional rings to AFS of up to 200%, and from reticulated ceramics to AFS of up to 150%. Due to the open design of AFS, effective capture volume is greater, which provides increases in catalyst cycle life by 1.5x to 2x respectively. Modelling enables bed grading designs to be optimised with cycle life targets and maximum catalyst activity without customers needing to wait multiple cycles before changing layer volumes. Historically, the primary method for graded bed design optimisation was to react in response to spent catalyst samples. The reality is that changes in design take one to two change out cycles before the collected evidence can be used to make improvements to the loading scheme. UNICAT combines historical performance with computational fluid dynamics (CFD) modelling to provide instant optimisation. This is important as processing objectives can change, and the company can respond to new operating targets for each operating cycle.
Case studies
The model used to generate data referenced within this case study is a packing prediction simulation tool, to which CFD can be applied to simulate fluid movement within the generated packing structures.
Within the model, both objects and the packing space are represented as collections of 3D pixels (voxels), with objects able to move independently of each other. As such, shapes of any complexity can be simulated, provided the resolution is sufficient to characterise the objects accurately.
In the case study reported, the external dimensions of AFS and reticulated pieces were roughly
March 2024 HYDROCARBON ENGINEERING 28
Figure 1. Cut-away images of (right) AFS 4510 and (left) reticulated ceramic filter media generated from UNICAT’s Revolutionary Computer Modelling Software.
Figure 2. Showing the particle dispersal in Reticulated Design as irregular vs AFS being uniform.

equal; there is a 6% difference in total free void space between the graded AFS and the reticulated filter beds. However, internal capture volume differs by 33% in favour of AFS (Table 2).
CFD simulations performed on the respective packings elucidated start of run pressure drops for the filter beds at different flow rates (Figure 3).
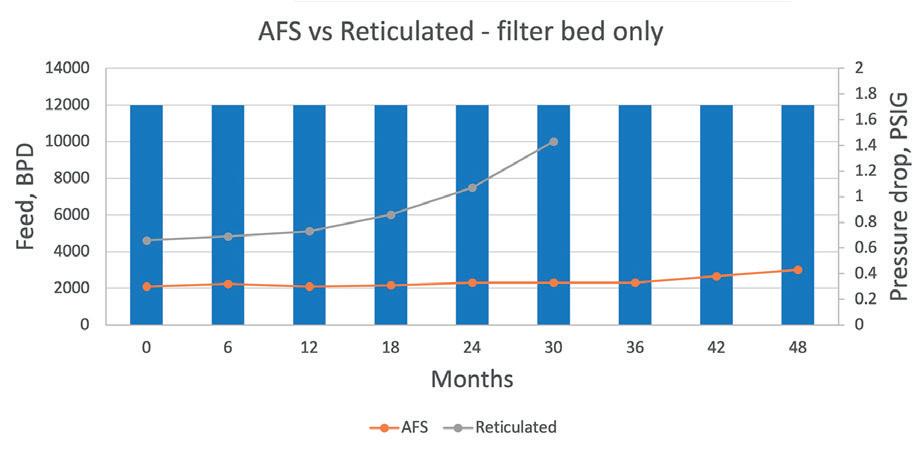
Modelling was undertaken to better understand how foulant of a specified particle size distribution and feed rate behaves when introduced to both filtration units over a typical
Reticulated ceramic AFS
Loading Reticulated ceramic various sizes AFS with silica-uptake rings
Lifetime Standard run 50% + run length for AFS
Note: both the loadings had equal grading volumes
internal capture volume, AFS
cycle (Figure 4). Solids were introduced in the reactor at a uniform rate of 5 mg/m3 over the life span, with the feed consisting of scales and flakes (> 1000 µm), coke (100 - 800 µm), iron sulfide fines (10 - 100 µm) and solid silica (10 - 50 µm). Particle size distribution was skewed to the fine size and was identical for both examples.
Pressure drop was measured incrementally at 6 month equivalent intervals over both filter beds. Both beds had a foulant removal efficiency of >98%.
Modelling demonstrated the differences between AFS and reticulated beds in terms of pressure drop stability vs onstream time. The highly tortuous internal paths within the reticulated pieces mean that foulants can block the void spaces relatively quickly, and do not fill each piece uniformly. Loading in each piece tends to occur quite high within the individual reticulated pieces, preventing effective filling of lower regions and preventing the full utilisation of the capture volume. Therefore, effective reticulated capture volume is around 50% of that of AFS (as opposed to the 33% measured), leading to increased pressure drop and greater feed maldistribution over a shorter cycle.
In the real-world data provided above, pressure drop begins to increase notably after 18 months for reticulated ceramics, compared to 36 months for the same feed conditions with AFS.
In order to provide a robust sense check for the CFD model, over the last two years UNICAT has had several optimised commercial applications which have validated the modelling software prediction tools within a 3% predictability range.
Conclusions
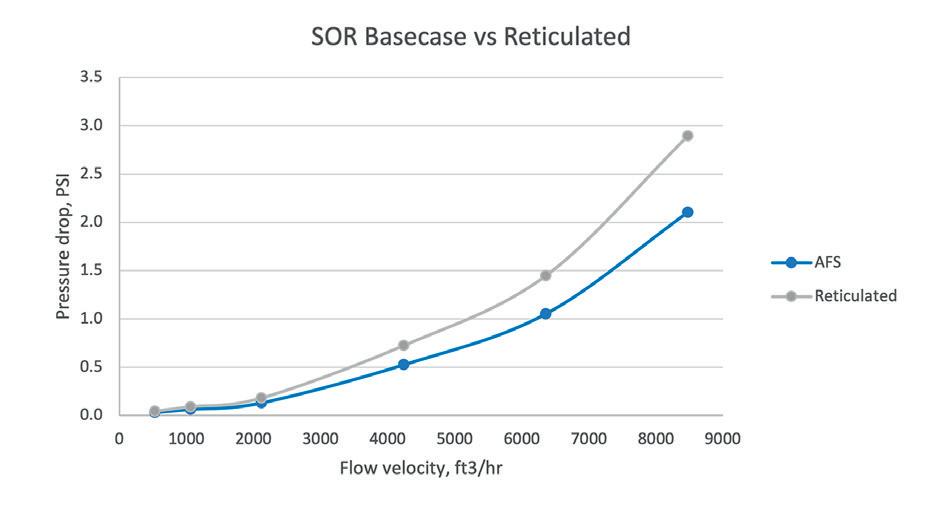
There is a clear correlation between the maximisation of catalyst bed lifecycle in hydroprocessing services and the application of pressure drop protection technologies for optimisation of overall process unit performance. In fixed bed reactor applications, AFS demonstrates several advantages leading to excellent performance regarding pressure drop protection and mitigation. AFS provides improvements in overall capture volume and initial pressure drop, which result in both lower SOR pressure drop, as well as sustained lower pressure drop. This results in a 150 - 200% lifecycle improvement.
AFS incorporates continuous uniform flow channels which are designed to improve both the even distribution of foulants as deposition occurs, as well as preserve the flow distribution set by the reactor internals. Preservation of flow channels provides maximisation of catalyst usage by supporting the even distribution of reaction components. The even distribution of foulants permits higher overall loading, optimal graded bed sizing, and reduction of catalyst change out cycles. This performance advantage is highlighted in the case study provided, demonstrating an overall longer operating cycle, as well as sustained lower pressure drop throughout the extended cycle.
Coupled with the experience of many commercial applications, UNICAT has developed a complex packing model for the simulation of performance and to develop predictive modelling capabilities. Scientific modelling allows tailored optimisation of graded bed requirements and loading profiles based on current reactor feed conditions. This provides a high level of confidence in the optimisation of process unit operating cycle life, as well as a real time method for performance predictions.
March 2024 HYDROCARBON ENGINEERING 30
Table 1. AFS vs reticulated ceramic
Bed height (in.) Reactor volume (ft3) Internal capture volume (ft3) AFS 211 999 194 Reticulated 211 999 139
Table 2. Comparison of
vs reticulated disc
Figure 3. AFS pressure drop vs reticulated over differing feed rates, start of run (SOR) for reactor Rx.
Figure 4. Predicted pressure drop vs time for an average feed rate of 12 000 bpd (2800 ft3/h or 80m3/hr).


Textured
agcat


www.globalhydrogenreview.com The Winter issue of GlobalHydrogenReview is out now Read the issue here Subscribe for free:
Lubricants, the finished product from base oil production along with special additives, touch nearly every aspect of our daily lives. Conventional solvent refining follows various chemical and physical separation methods, while modern hydroprocessing based technologies incorporate hydrogen environments for molecular rearrangement and selective cracking for maximum premium base stock production. The conventional lube manufacturing process includes multiple process steps of distillation and solvent extraction for VI upgrading, deasphalting to remove asphaltenes, solvent dewaxing for pour point improvement, hydrofinishing for colour control, and hydroprocessing for higher quality of base stocks produced. The distinction is usually that Group I base stocks are produced via conventional solvent-based technologies, while production of premium base stocks, i.e., Group II and III, utilises modern hydrotreating and/or hydrocracking technologies. The demand of premium base stocks will continue to grow in the future. The new capacities added to produce base oils are hydrocracking based technologies, which are expected to continue to play a substantial role in producing high quality lubes in the future. Emerging economies and growing industrialisation place a continually greater demand on lubricant yields and quality standards. Lube manufacturing technologies have advanced over time to support this requirement. According to market research, the 2023 lubricant market was valued at US$53 billion in 2022, with expected CAGR to be 3.9% from 2023 to 2030.1 This growth will be further fuelled by focus on energy efficiency and environmental sustainability, accelerating new innovations in lubricant composition. The lube oil feedstocks being derived from the bottom of the crude barrel present an inherent challenge of feed difficulty, therefore requiring advanced saturation, lube selective cracking, and dewaxing catalysts leading the way to produce high quality lubes.
Lube properties requirement
The base oil component largely dictates the performance characteristics of the finished lubricant. For perspective, up to 70% of automotive and diesel engine oils, and upwards to 99% in some industrial oils, is the base

Ashley Ashford and Rahul Singh, Topsoe, explain the importance of hydrocracking based technologies in producing high quality, sustainable lubricants.
March 2024 33 HYDROCARBON ENGINEERING
oil portion. There is a generally accepted classification of base oil groups set by API and outlined in Table 1.2 The idea is that within a group, base stocks of various viscosities, but compliant to these criteria, will be interchangeable without affecting performance.
Group I through III are derived from crude oil and the quality will largely depend on the refining process. Group II base oils are the first hydroprocessed category that may include a conversion catalyst, while Group III will certainly involve a conversion catalyst for the more stringent saturate and viscosity index (VI) requirements. The quality terms of greatest focus for Group I and II base oils are:
n Viscosity: a measure of fluidity.
n Viscosity index (VI): the ability to resist change in fluidity with changes in temperature.
n Volatility: a measure of oil loss due to evaporation.
n Pour point: the lowest temperature at which lubricants resist flow.
n Oxidation resistance: essential to prevent formation of harmful sludge.
n Solubility: the ability to dissolve additives used in formulating the lubricant and to suspend contaminants.
n Toxicity: a critical product safety measure.
n Stability: to resist changes in the presence of light or heat.
The conversion chemistry of the hydrocarbons found in crude oil determines the base oil, which ultimately governs the property of the finished lubricant. Table 2 shows the effect of molecules on the properties of base oil. A good lubricant should have high VI, low pour, and high oxidation resistance and solubility. From a molecular perspective, normal paraffins or waxy straight chains will contribute an excellent VI, but a very poor pour point. Isoparaffins are excellent compounds for lubricants. Aromatics, apart from having a good solubility capacity, are not desirable in lube stock. Therefore, molecular influence becomes a focal point for lube refiners when considering equipment and process targets.
The consistent overall goal of a lube hydrotreater or hydrocracker is to increase VI and reduce pour point of the unconverted oil (UCO) or base stock. Based on the feed slate and operating conditions, conversion and cut points can be adjusted to target a specific VI, saturation, and yields structure followed by dewaxing requirements in a lube unit. The typical goal is minimum feed conversion for maximum base oil production while meeting the product standards. A lube hydrocracker generally consists of a pretreat catalyst to saturate sulfur, nitrogen and aromatics present in the feed, lube selective cracking catalyst to achieve conversion targets to meet specific lube yields and additional saturation, occasionally a dewaxing catalyst for pour point reduction, and a noble or base metal saturation catalyst downstream to provide final saturation for colour or oxidation resistance requirements. Therefore, the choice of catalyst activity and selectivity becomes a critical criterion to meet the lube hydrocracker objectives for Group II and III base stock depending on the process layout.
VI uplift and nitrogen slip
Maximising VI uplift over the hydrotreating and/or hydrocracking catalyst will play a critical role in producing Group II or Group III base oils. Catalysts providing a
March 2024 HYDROCARBON ENGINEERING 34
Category Sulfur (%) Saturates (%) Viscosity index Group I (solvent refined) >0.03 <90 ≥80 to <120 Group II (hydrotreated) ≤0.03 ≥90 ≥80 to <120 Group III (hydrocracked) ≤0.03 ≥90 ≥120
Table 1. Base oil categories and product requirements
Component VI Pour point Oxidation n-paraffin ++++ + ++++ Isoparaffin ++++ +++ +++ Single naphthenic ring +++ +++ +++ Multi naphthenic ring ++ ++++ +++ Aromatic ring + + +
Table 2. Effect of components on the base oil properties
Figure 1. Dependence of VI of baseoil on nitrogen slip from the pretreater into the hydrocracker.
Figure 2. Comparison of saturates in the product for two cycles.
Real-time Emissions Monitoring


Visual MESA® Greenhouse Gas Emissions Management software continuously monitors emissions and energy consumption across the entire plant operations, giving you accurate, real-time data and alerts for decision making.
Whether you choose cloud-based or on-premise, this solution with automated, auditable reporting enables you to both optimize energy and analyze Scope 1 and 2 emissions to identify and implement operational improvements for energy savings and to meet your emissions reduction targets.
Discover how your industrial plant can save over 25k tonnes of CO₂ per year. www.kbc.global/emissions-management


saturation boost within the operational constraints and conditions will be the favourable choice of a lube producer. TK-6001 HySwellTM, an ultra-high activity NiMo catalyst based on advanced technology for maximum saturation activity, is finding an excellent application in lube units with strict product saturate and VI requirements. Nitrogen is inherently present in fossil based feed and detrimental to aromatic saturation activity, liquid yields, product properties and cycle length. It becomes necessary to address these issues using ultra high hydrodenitrogenation (HDN) activity treating catalysts.
Topsoe investigated the effect of feeds processed in a particular lube oil refiner’s lube hydrocracker to demonstrate that the HDN activity of a pretreat catalyst is essential to ensure maximum saturation overall. Like many lube units, this unit operates in block mode, processing a variety of feedstocks for largely Group II stock. To understand the impact of N slip on the lube properties, the performance of TK-6001 HySwell and a lube selective cracking catalyst, TK-927 EM, was studied in detail.
TK-927 EM was chosen to maximise base oil production while boosting hydrogenation functionality. The feed had a nitrogen content of approximately 900 wtppm.
Figure 1 shows that the VI uplift (product VI – feed VI) of the finished base oil increased with a drop in the nitrogen slip from the TK-6001 HySwell to the TK-927 EM. This suggests that lower organic nitrogen in the pretreat effluent has a positive effect on the saturation performance of the overall treating and cracking system. Lowering the organic nitrogen content in the pretreat
effluent facilitates a saturation boost of the aromatics present in the lube feed. The enhanced base oil product quality allows the client the flexibility to evaluate the need for a second pass (additional treatment) operation based on blending ability, rather than a required second pass as a procedural rule. This flexibility provides cost saving opportunities for the refinery as multiple pass operation can be quite expensive. Nitrogen is an inhibitor of the acidity of zeolites present in the cracking catalyst. Ring opening reactions occur on acid sites while saturation reactions occur on the metal sites. Therefore, a lower nitrogen slip to the cracking catalyst enhances ring opening of the naphthenes into n-paraffins, enhancing the VI of the product. Ultimately, the goal is aromatic hydrogenation to naphthenes, followed by naphthenes ring opening to paraffins with the focus of preserving the molecules in the base stock boiling range to the greatest extent possible. This is an attractive way of enhancing the VI of the premium base stocks and maximising the lube yields with the use of treating and cracking catalysts.
In addition to this, TK-6001 HySwell was employed as a hydrofinishing catalyst downstream for the final saturation of unsaturated molecules, resulting in an exceptionally high product stability. This was reflected in the product colour being well below quality requirements. Residual aromatics can oxidise, causing the produced base oil to darken over time. By incorporating the maximum activity of TK-6001 HyBRIMTM for hydrofinishing, temperatures were maintained low to stay within equilibrium limitations to ensure favourability for near complete saturation of these molecules. In summary, a base oil product with a VI and colour within target was obtained for a wide range of process conditions.
Maximising saturates in the lubes
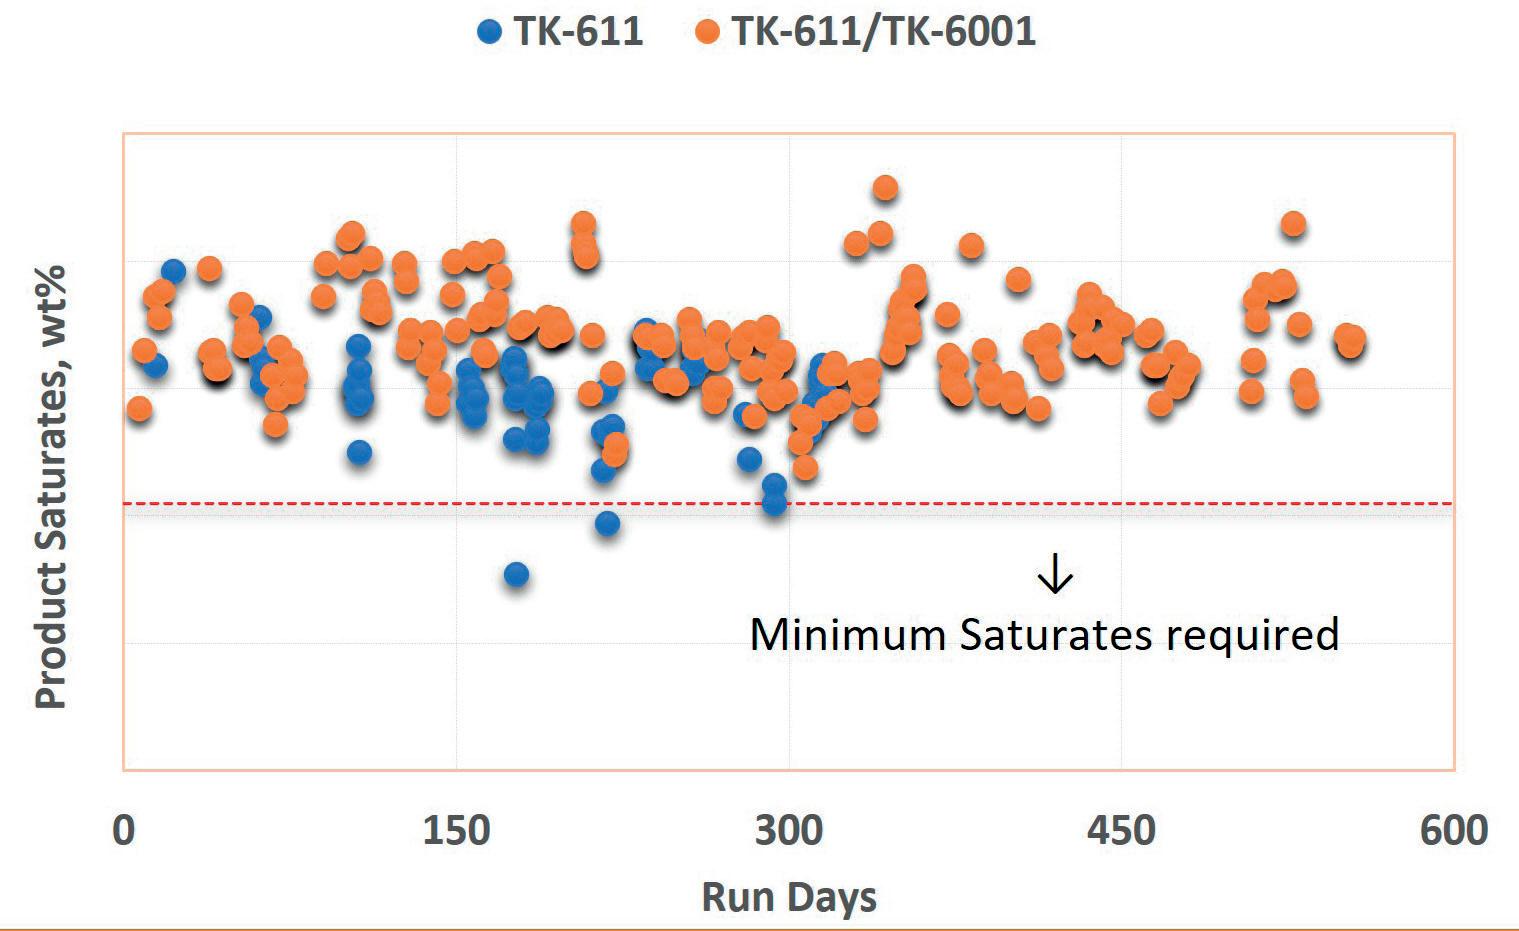
A specific lube refinery has a catalytic dewaxing unit in combination with a separate lube hydrotreating unit operating in a block mode manner. The challenge of this unit is to achieve a low aromatic content or a conversely high saturation requirement for the specialty lubricants being produced on their most refractive feeds. In a previous cycle, TK-611 HyBRIMTM was installed in the unit and exceeded the saturation requirements Towards the end of this cycle, additional processing challenges of more severe feedstocks and competing hydrogen environment with the lube hydrocracker occurred. A comparison of the operating conditions is shown in Table 3. Compounding, these more severe feedstocks ultimately resulted in a requirement for more hydrogen and the lube hydrocracker naturally took priority in the refinery. The adverse operating conditions of a lower hydrogen to oil ratio and hydrogen partial pressure reduced the driving force for all of the metal catalysed reactions. Hence, to ensure the product quality, TK-6001 HySwell was the catalyst chosen to boost the overall hydrogenation activity of the system, facilitating mitigation of the greater operational severity required for this unit. Utilising the catalyst in the load lowered the operational weighted average bed temperature (WABT) requirement as evidenced by Figure 2. A higher concentration of product saturates in the produced base oil
March 2024 HYDROCARBON ENGINEERING 36
Lube feed block averages Compared to previous cycle Feed rate (bpd) ↔ H2 partial pressure (psia) ↓ Feed severity (SG, S, N) ↑ Hydrogen/oil (SCFB) ↓ %HDS (%HDN) ↑
Table 3. Comparison of operating conditions of current vs previous cycle
Figure 3. WABT comparison for two cycles.


for the current cycle was achieved at a lower WABT and adverse process conditions (Figure 3). This observation suggests that the higher degree of aromatic saturation activity of the stacked catalyst system of TK-611 HyBRIM/TK-6001 HySwell allowed the unit to exceed the product quality and cycle requirements. The refiner has recently increased the saturation requirement further, which has confidently been addressed by further finetuning of the stacked load for the next cycle. This is evidence of the importance of maximising the performance of the hydroprocessing section of the lube refinery.
Upgrading speciality lube oil
Refiners producing the specialty oils for the pharma or consumer industry require the highest hydrogenation power to achieve very strict product quality targets. A client in North America operates a specialty lube oil plant consisting of a hydrotreater processing a range of specialty oils with very low aromatic content for pharma and food grade application. Historically, products have been processed more than once to increase the residence time and cleaned downstream with various stabilisation methods to improve the colour and ageing tendency of the products. This is an extremely expensive approach due to high disposal costs of the acid sludge produced in the process.
Prior to the loading in the commercial unit, a pilot plant was utilised to test the combination of TK-6001 HySwell and TK-921 EM to meet the client’s requirements for its specialty oil products. This catalyst selection was based on highest hydrogenation activity to shift the equilibrium between naphthene and aromatics to facilitate a higher saturate concentration. The unit is currently a few years into the commercial cycle and has reduced processing in a multiple pass fashion, therefore saving costs and enhancing safety for the refinery. Less time on stream for the same product quality results in more favourable economics for the refinery. Figure 4 shows the product quality for single and multiple pass
processing, relative to the observation in the pilot programme. It is noted that a lower pyrene equivalent and polars, higher saturates and lower aromatic content in the petrolatum product was achieved with TK-6001 HySwell/TK-921 EM in the pilot plant and surpassed the refiner’s requirements. Additionally, these properties have been largely met in the single pass operation in the commercial unit to date. These observations suggest that the polyaromatic saturation and ring opening activity of the TK-6001 HySwell/TK-921 EM in a single pass allows the refiner to meet the specialty lube specification. The colour is very nearly met with the first pass of operation. The enhanced base oil product quality allows the client the flexibility to evaluate the need for a second pass (additional treatment) operation based on blending ability, rather than a required second pass as a procedural rule. This flexibility provides cost saving opportunities to the refinery as multiple pass operation can be quite expensive. To summarise, the refiner has been able to largely meet product requirements in single pass operations relative to historic double pass, thereby increaseing production rates. Additionally, downstream processing has been minimised, further increasing profitability and safety.
Summary
Lube oil refiners have an opportunity to process more refractive feedstocks and meet current enhanced quality demands by ensuring maximum hydrogenation activity with a focus on polyaromatics saturation, selective cracking, rearrangement of paraffins and maximising ring opening. TK-6001 HySwell has emerged as a suitable option to ensure maximum hydrogenation activity, with ‘EM’ lube selective hydrocracking catalyst as an excellent accompaniment to ensure maximum lube yields with desirable properties for the full system. The key to producing a high-quality lube is to operate a lube hydrocracker pretreat at the lowest nitrogen slip possible under the given hydrogen environment to produce an effluent with the highest degree of saturation and utilise a hydrocracking catalyst with optimised selectivity and saturation activity to maintain high lube yields.
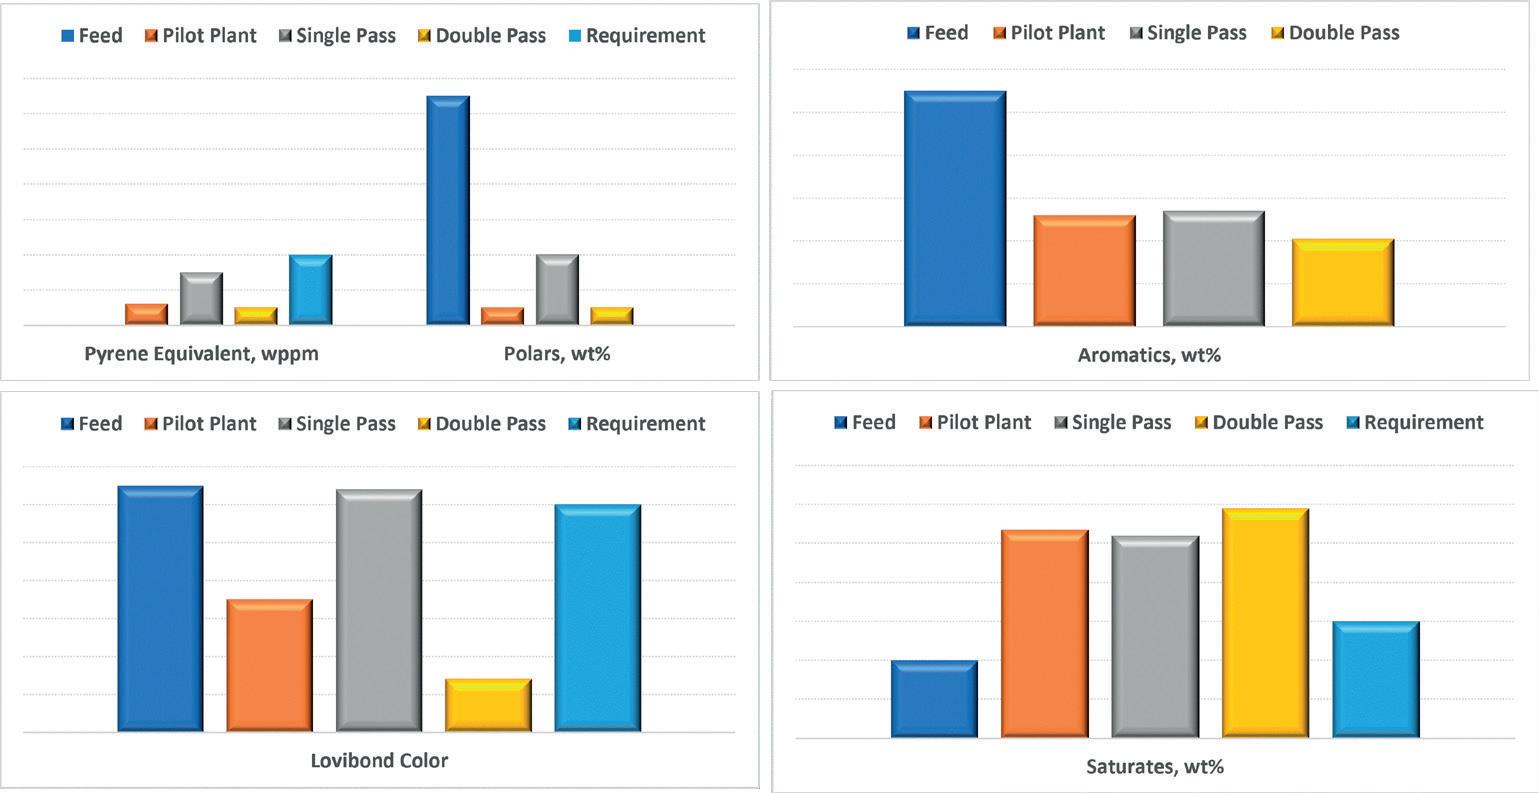
References
1. Lubricants Market Size, Share & Trends Analysis Report By Application (Automotive, Industrial, Marine, Aerospace), By Region (North America, Europe, Asia Pacific), And Segment Forecasts, 2023 – 2030, Grand View Research, California, US.
2. VERDIER, S., et al., ‘A critical approach to viscosity index, Fuel, 8, pp. 2199 - 2206, (2009)
March 2024 HYDROCARBON ENGINEERING 38
Figure 4. Speciality lube properties obtained on TK-6001/TK-921 EM catalyst system in a lube unit.

www.zwick-armaturen.de

Dongyue Zhao, Chunfang Chen, and Haitao Song, SINOPEC Research Institute of Petroleum Processing Co. Ltd, alongside Xianyao Liang and Xianglong Xu*, SINOPEC Beihai Refining & Chemical Co., explain how a novel additive can relieve the conflict between NO x and SO x removal efficiency.
40 March 2024 HYDROCARBON ENGINEERING

Approximately 10 - 20% of sulfur and 40% of nitrogen in fluid catalytic cracking (FCC) feed ends up in coke and yields large amounts of sulfur oxide (SOx) and nitrogen oxide (NOx) during coke combustion in regenerators. This accounts for around 70% of total SOx emissions and 50% of NO x emissions in refineries. Driven by environmental regulations, many FCC facilities are equipped with aftertreatment facilities for flue gas NOx and SO x removal, mainly ammonia selective catalytic reduction (NH3-SCR) and wet scrubber.1 However, the continuous deterioration of FCC feedstock burdens these facilities, resulting in severe boiler corrosion due to ammonium salt deposition and secondary pollution problems such as the coloured plume and increased total dissolved solids (TDS) in effluent wastewater.
A well-accepted solution is to use NOx and SO x additives. As distinct from aftertreatment technologies, the additives shift the DeNO x and DeSO x reaction spot to the regenerator. NO x additives can catalyse NOx reduction by carbon monoxide (CO) produced during coke combustion2, and SOx additives trap SOx as sulfate in the presence of O2 3 The incorporation of additives, in this way, eliminates the pollutants from the source and reduces them flowing downstream. The occupied SOx storage sites are regenerated as the SOx additives enter the riser and react with hydrocarbons (HC), hydrogen (H2) and H2O.4 The released H2S is converted into elemental sulfur (S) via the Claus technique in the downstream recovery facilities.5 Using additives is a smart innovation, tailor-made for the FCC units to control SO x and NO x emissions with relatively low cost and high flexibility. Nonetheless, the practice of current additives in industrial facilities suggests that owing to the intrinsic trade-off relationship between CO and O2 in the regenerator, the removal efficiency of NOx and SO x cannot be simultaneously optimised, and the unit operators have to carefully compromise between them. Along this line, Sinopec Research Institute of Petroleum Processing (RIPP) has conducted extensive research to relieve this conflict from the mechanistic aspect and developed a novel NOx additive less affected by oxygen levels. This article will present the functionality and features of the RDNOx-PC2 additive and a case study of the collaborative control of SOx and NO x in the BH refinery in the Guangxi Province, China, operated by SINOPEC. The approach applied herein can be potentially applied in other refineries.
Additive development
Figure 1 shows the impact of O2 on the performance of the commercial SO x and NO x additives conducted on a fixed-bed reactor. As the O2 concentration increases from 0.3% to 3%, a substantial increment of SO2 storage capacity can be observed over the SO x additive in Figure 1a, since the oxidation of SO2 to
March 2024 41 HYDROCARBON ENGINEERING
sulfur trioxide (SO3) is a bottleneck for SO2 trapping. However, as is mentioned above, the increase of O2 would significantly reduce the CO concentration in the dense phase of the regenerator, and thus inhibit the NOx reduction by CO. At high oxygen levels, the CO oxidation by O2 is the dominant reaction route at FCC regeneration temperatures (Figure 1b), rather than CO reducing NO. It should be noted that this intrinsic challenge in reaction selectivity can hardly be resolved through rational catalyst design. To the best of RIPP’s knowledge, only Ir catalysts exhibit effective performance for the selective NO reduction by CO in the presence of excessive O2, while its high cost inhibits wide industrial application. For this reason,
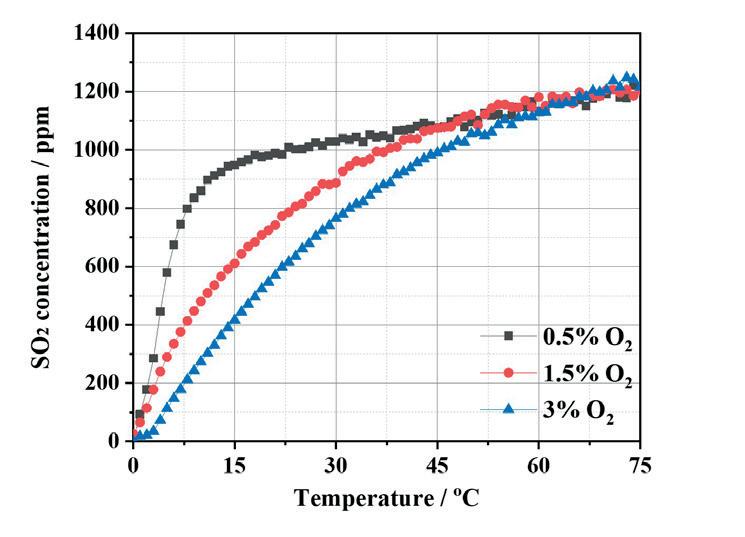
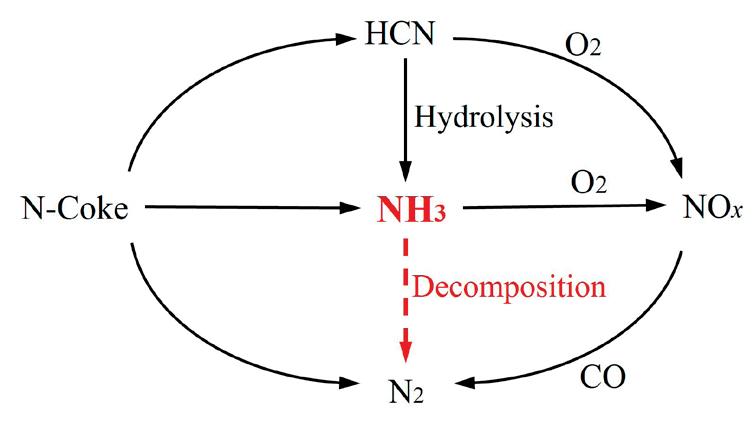
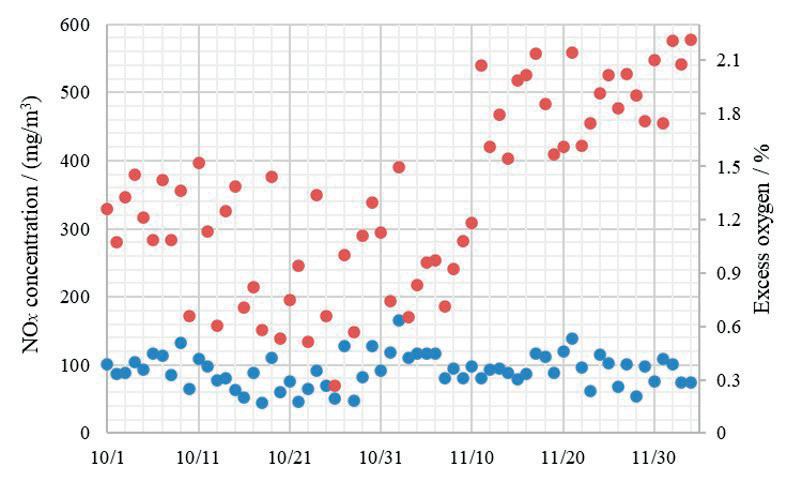
RIPP was seeking an alternative reaction route for efficient NO x removal in FCC regenerators.
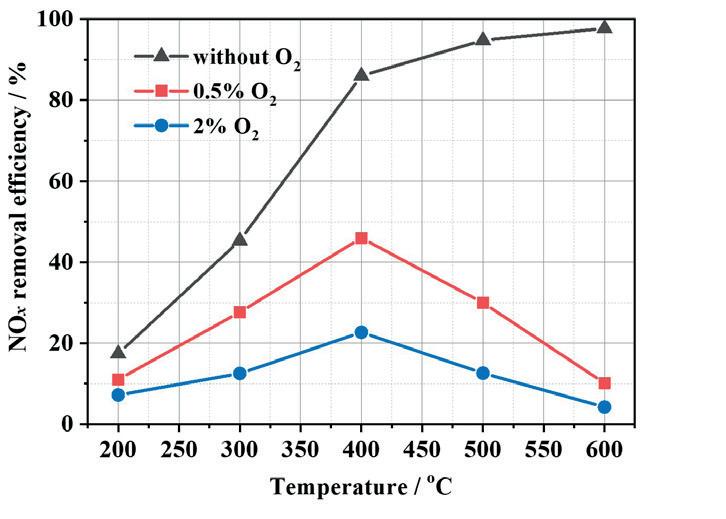
Figure 2a shows a simplified reaction pathway for nitrogen compounds. In FCC regenerators, N-coke is not straightly transformed to NO x but undergoes the reduced N intermediates, mainly NH3 and hydrogen cyanide (HCN).6 Among them, HCN is less stable and tends to hydrolyse into NH3 7 Based on this, RIPP adopted a novel technical route, NH3 decomposition. The challenge of this route is that the kinetics of NH3 decomposition are sluggish due to the high activation energy for N-H bond cleavage and N2 desorption.8,9 This motivates the design and construction of a new NOx additive with high efficiency and low cost. According to RIPP’s research, the metal-nitrogen binding energy is the descriptor of the NH3 decomposition activity. An optimal binding energy enables the balance between N-H bond cleavage and N2 desorption rate.10 Along this line, the RDNO x-PC2 additive was developed. As shown in Figure 2b, RDNOx-PC2 exhibits higher NH3 conversions and N2 selectivity in both the absence and presence of O2 as compared to previous additives and other commercial products. In the following section, a case study will be presented to illustrate the performance of this additive in the industrial facility.
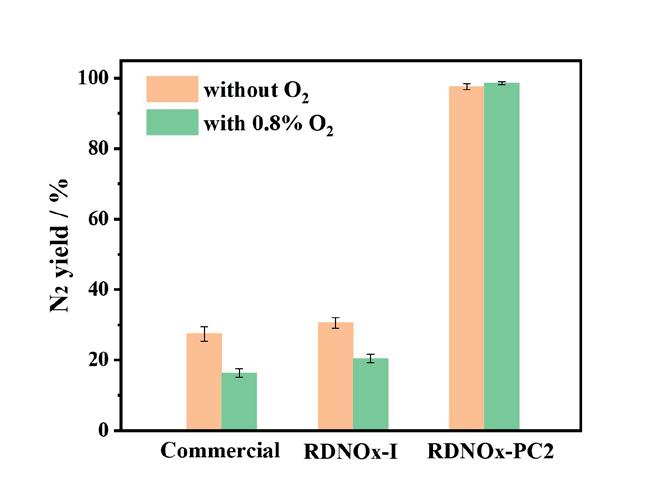
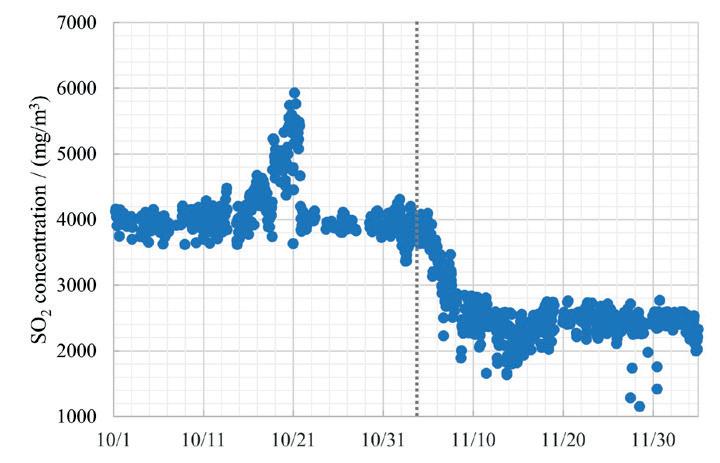
Industrial applications of additive
The 2.1 million tpy FCC unit in the BH Refinery employs the maximising iso-paraffins (MIP) technique and full burn operation to run combined feedstock of vacuum gas oil, hydrotreated gas oil and residual oil, with a high overall sulfur content of 1.2 - 1.5%. The unit is equipped with a wet scrubber with sodium hydroxide (NaOH) solution as the absorbent to meet the SO2 emission standards, but suffers from severe secondary pollution problems including the coloured plume and excess total dissolved solids (TDS) of 10 - 13% in wastewater. For this reason, operators at the BH Refinery decided to use the
March 2024 HYDROCARBON ENGINEERING 42
Figure 1. (a) SO2 storage curves over a commercial SOx additive at different O2 concentrations; (b) NOx removal efficiency in the presence of 0.3% CO over a commercial NO x additive at different O2 concentrations.
Figure 2. Reaction pathway of nitrogen compounds in regenerators, dash line is the target DeNOx reaction route; (b) N2 yield in NH3 decomposition reaction over the additives, RDNOx-I is previous generation NOx additive of RIPP.
Figure 3. (a) Online NOx and O2 at the regenerator outlet; (b) online SO2 at the regenerator outlet, dash line represents the time point of adding RDNOx-PC2 and RFS09.
(a) (b)
(a) (b)


SAFE. RELIABLE. TRUSTED.


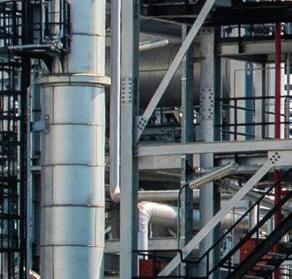


Pop-A-Plug ® Tube Plugs


• Simple hydraulic installation − no welding
• Helium leak tight seal to 1x10 -10 cc/sec
• 100% Lot tested to ensure unmatched quality
• Pressure ratings Up to 7000 PsiG (483 BarG)
• Wide range of sizes and ASME/ASTM certified materials available


ASME PCC-2 Compliant Heat Exchanger Tube Plugging System
877.383.1029
l est-sales@curtisswright.com


l cw-estgroup.com/he-24
Trusted by plants around the world as their go-to tube leak solution, Pop-A-Plug Tube Plugs from Curtiss-Wright are engineered for optimal performance throughout the life cycle of heat exchanger equipment. Controlled hydraulic installation eliminates welding and time-consuming pre-/post-weld heat treatments that can cause damage to tubes, tube sheet ligaments, and joints.


(a) (b)
reduced the burden of the downstream wet scrubber. The NaOH solution consumption decreased from 60 - 70 tpd to 30 - 40 tpd, along with TDS, mainly Na2SO3 and Na2SO4 in the wastewater, declining to 7 - 8%. Lower TDS reduces not only the wastewater treatment cost, but also the risk of scaling and corrosion in the slurry system. The trailing and deposition of the coloured plume were also alleviated after the incorporation of the RFS additive (Figure 4). The composition of the plume is mainly SO3 aerosols, Na2SO4 crystals mixed with vapour.11 RFS effectively traps SO3 in the regenerator and decreases TDS, and in this way reduces the sulfur content in the plume. Apparently, RFS exhibits satisfactory DeSO x performance at higher oxygen levels.
and RFS09
*Additional amount of RDNOx-PC2 is only 1/3 of previous NOx additive
**Unit price of NaOH solution (32 wt%) is 1100 RMB/t
***Reducing CO emission 850 m³/h equivalent to 380 m³/h CH in terms of heat
**** Unit price of sulfur is 800 RMB/t
RFS09 SO x additive developed by RIPP to lower the burden of the wet scrubber in 2019. However, the BH Refinery FCC employed a challenging operation in terms of SOx additive performance. Specifically, the oxygen level was controlled below 1% to ensure CO abundance in the dense phase and thereby good performance of NOx additive due to the absence of the denitrification facility, while effective SOx removal efficiency can hardly be achieved at such low oxygen levels. In this context, the refinery replaced the original NOx additive with RDNOx-PC2. As shown in Figure 3a, the FCC unit ceased the previous commercial NOx additive on 5 November and then initiated the simultaneous addition of RDNO x -PC2 and RFS09. During the changeover of the NOx additive, the excess O2 was gradually adjusted from 0.8% to 2%. The increase of O2 results in a significant decline of CO concentration from 0.2% to 0% at the outlet of the regenerator detected by a Testo flue gas analyser. The outlet NOx did not visibly increase with CO declining and remains relatively stable during the whole period, suggesting that when NH3 decomposition becomes the dominant DeNO x route, it is more efficient than CO reducing NOx at higher oxygen levels.
The usage of RDNOx-PC2 enables the unit to operate at higher oxygen levels beneficial for SOx additive to achieve higher SO2 trapping efficiency. When the SOx additive reached 1.8 wt% of the catalyst inventory, the online SO2 levels declined by around 1600 mg/m3 in Figure 3b, corresponding to a high pick up factor (PUF) of 64 kg (SO2)/kg (SOx additive), much higher than the typical PUF of 30 - 50 kg (sulfur transfer agent)/kg(SOx) for other similar types of unit. This significantly
The development of the RDNOx-PC2 additive relieves the conflict between NO x and SO x removal efficiency in FCC regenerators. Additionally, the rise in O2 levels reduces the risk of afterburning and recovers extra heat by decreasing CO emissions. From a cost perspective, the simultaneous addition of RFS and RDNO x saves 16.6 million RMB per year for the BH Refinery with a comprehensive consideration of the expenditure of the additives, NaOH solution, sulfur recovery and heat recovery as shown in Table 1.
Conclusions
The performance of the RDNOx-PC2 additive in the FCC unit of the BH Refinery demonstrates that the NH3 decomposition route is efficient in NO x removal at high O2 levels. Its application not only enables higher operation flexibility of the FCC unit, but creates better reaction conditions for SO2 trapping. Compared to the conventional NOx additive, RDNO x-PC2 is the better option to be used combined with SO x additives. The development of this novel additive provides refineries with an economical and efficient solution for the collaborative control of SO x and NO x emissions.
Acknowledgements
This work was supported by the National Key R&D Programme of China (2022YFB3504000).
*The authors acknowledge the inspiring discussion with Menglong Feng, Hao Sha, and QiuQiao Jiang at SINOPEC Research Institute of Petroleum Processing Co. Ltd, and the significant contribution of Xiaodong Wang and Liansheng Zhang in the application of the novel additive.
References
1. HUTSON, N. D., KRZYZYNSKA, R., and SRIVASTAVA, R. K., Ind. Eng. Chem Res. 47, 5825 - 5831 (2008).
2. WEN, B., and HE, M., Appl. Catal. B 2002, 37, 75 - 82.
3. KANG, H. T., LV, K., and YUAN, S. L., Appl. Clay. Sci. 72, 184 - 190, (2013).
4. PI, Z., SHEN, B., ZHAO, J., and LIU, J., Ind. Eng. Chem. Res, 54,10622 - 10628, (2015).
5. SU, J., CAO, L., LEE, G., TYLER, J., RINGSRED, A., and RENSING, M., et al. Fuel 294, 120526, (2021).
6. LI, S., JIANG, Q., QI, Y., ZHAO, D., TANG, Y., LIU, Q., CHEN, Z., ZHU, Y., DAI, B., SONG, H., and ZHANG, L. J., Hazard. Mater. 436, 129187, (2022).
7. JU, F., ZHAO, X., LUAN, H., LIN, J., XIU, G., and LING, H., Chem. Eng. J. 389, 124484, (2020).
8. SUN, S., JIANG, Q., ZHAO, D., CAO, T., SHA, H., and ZHANG, C., et al. Renew. Sust. Energ. Rev. 169, 112918, (2022).
9. GUO, J., and CHEN, P., ‘Catalyst: NH3 as an energy carrier’, Chem, 3, 709 - 712, (2017).
10. MUKHERJEE, S., DEVAGUPTAPU, S.V., SVIRIPA, A., LUND, C. R., and WU G., Appl. Catal. B, 226, 162 - 181, (2018).
11. OLORUNTOBA, A., ZHANG, Y., and HSU, C. S., Energies, 15, 2061, (2022).
March 2024 HYDROCARBON ENGINEERING 44
Figure 4. Pictures of the plume (a) before and (b) after adding RFS09.
Item Cost saving (million RMB) Additives* 3 NaOH solution** 10 Heat recovery*** 2.1 Sulfur recovery**** 1.5
Table 1. Cost saving in pollutants emission control by adding RDNOx-PC2
Tim Haugen, Quest Integrity, explores how advanced coil cleaning and inspection techniques can help plants optimise the performance of their fired heaters.
Vacuum heaters play a pivotal role in many petroleum refining operations allowing for the processing of heavy atmospheric residue, which is further processed into a wide range of final products for use as fuels for transportation, heating, road paving and petrochemical feedstocks. Internal tube fouling, ‘coke’, is a common refinery occurrence that affects heater operation and run length and can also diminish the piping coil integrity. The two primary drivers for coking are residence time and temperature, along with oil feedstock. Internal coke formation leads to elevated tube metal temperatures (TMT). As TMTs approach the tube metal limit, the heater must be brought down for cleaning, otherwise tube damage can occur from creep growth, as well as wall loss due to corrosion.
Case study
Maintaining fired heaters to achieve continuous and uninterrupted operations, especially those that are prone to coking, can be a challenge. One such owner-operator in Europe experienced an operational issue with its fired heater. The refinery noticed an elevated TMT reading in its four-pass vacuum heater at one of the tube skin thermocouple locations, confirmed by thermography. Additional thermography revealed eight other locations with elevated TMTs (see Figure 1). These locations were at tubes with steam injection nozzles near the end of the radiant section, as well as the last tube in the radiant

section in three of four passes (i.e., Tubes 25 and 27 in Figure 2). Unfortunately, due to limitations in the infrared (IR) scan angles, temperature coverage across the radiant tubes in the four passes was limited.
Based on these findings, the unit was brought down, and various non-destructive testing techniques were employed to determine if tube damage occurred from the elevated temperatures. Visual indications showed localised discolouration and external scale on the last radiant tube in two passes at the outlet (see Figure 3). Radiography at those locations revealed what may have been a thin layer of internal fouling, although those results proved inconclusive due to image quality. Some wall loss was also discovered during testing. Ultimately, nothing that required urgent attention was noted from the testing, so the heater was returned to service.
The following month, a video inspection of the inside of the heater revealed an unsteady flame pattern and possible impingement on adjacent tubes.
Following further investigation and burner adjustments, the plant established a maximum TMT operating limit at one of the discoloured tube locations that could be monitored at a nearby thermocouple. This approach allowed temporary heater operation, so long as the TMT did not exceed the limit.
The plant developed two potential solutions to correct the hotspots during the next scheduled shutdown: clean the internal and external pipe surfaces, or replace the affected pipes with a
March 2024 45 HYDROCARBON ENGINEERING
material that can withstand higher TMTs. Ultimately, the plant decided to bring the heater down earlier than expected for coil cleaning and inspection due to continued elevated temperatures
and some uncertainty with the condition of the tubes at those areas not covered by thermography.
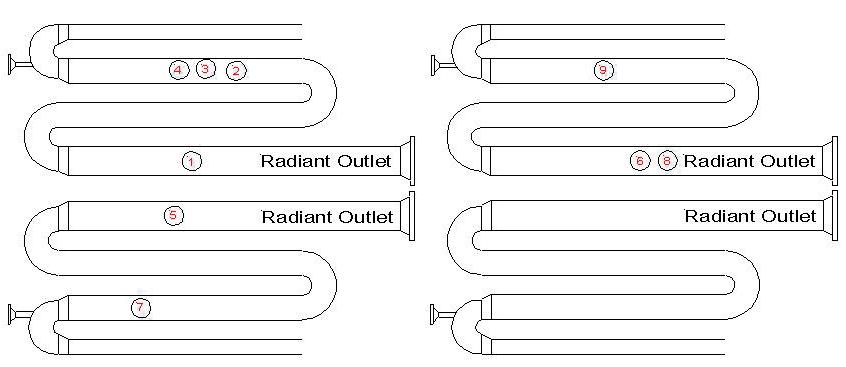
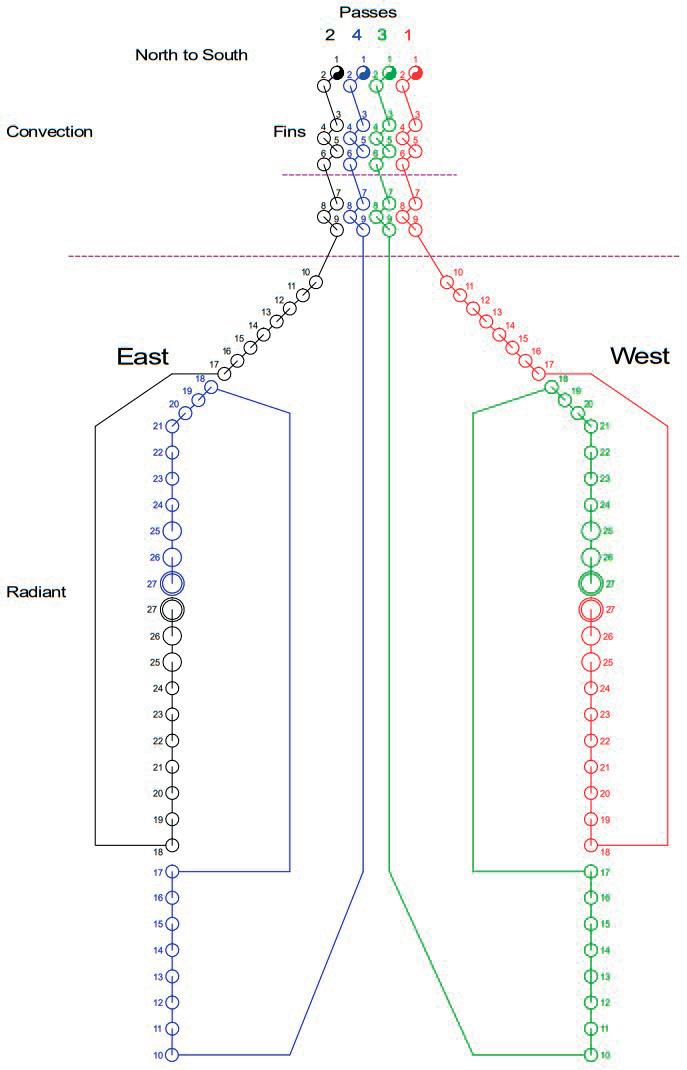
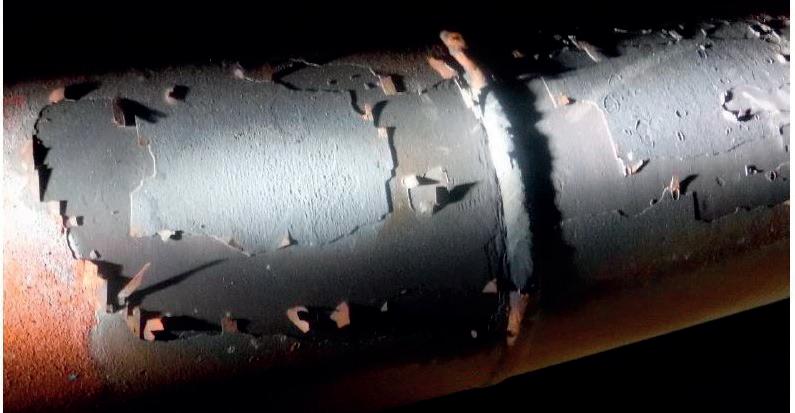
Project services and execution: the solution
Quest Integrity was contacted by the plant to apply its Advanced Decoking and Cleanliness Verification (ADCVTM) and Furnace Tube Inspection System (FTISTM) technologies for a comprehensive mechanical cleaning and inspection of all coils in the vacuum heater. ADCV was of particular interest to the plant due to the integrated solution’s advanced data capabilities. In addition to removing internal coke in coils, the service could also locate and quantitatively measure the amount of coke. With this information, the plant would be able to identify and confirm all areas containing hotspots, greatly aiding its troubleshooting and maintenance efforts.
As a result of wall loss being discovered during earlier testing, FTIS was selected for its high-resolution ultrasonic in-line inspection capability, comprehensive coverage, and data collection speed. The FTIS technology detects and measures damage such as localised and general internal and external corrosion, erosion, pitting, and fretting, as well as deformations such as bulging, swelling, denting, and ovality in numerous coil configurations (see Figure 4).
Quest Integrity’s fitness-for-service screening assessment for wall loss and creep growth was also provided following the guidelines of API 579-1/ASME FFS-1 Fitness-for-Service (API 579-1) standard and API 530 Calculation of Heater-tube Thickness in Petroleum Refineries Annex A methodology, to ensure that the heater could be safely returned to service and operated until the next scheduled shutdown.
Over the course of three days, the project was safely and successfully performed with 24-hour operations. Just over 100 tubes and return bends were cleaned and inspected during that period, including the fouling, FTIS data analysis, and reporting results.
Results
The ADCV cleaning technology revealed much more internal fouling than was expected. Of particular interest was the coke buildup toward the end of the radiant section in the 8 in. and 10 in. tubes. Excessive internal buildup (i.e., thickness and surface coverage) was found in the first 8 in. tube in all four passes where steam is injected into the oil. The excessive coke buildup most likely indicated an improper balance in the steam to oil ratio. The 10 in. pipe also contained heavier than expected coke, with the ADVC cleaning results revealing additional operating concerns.
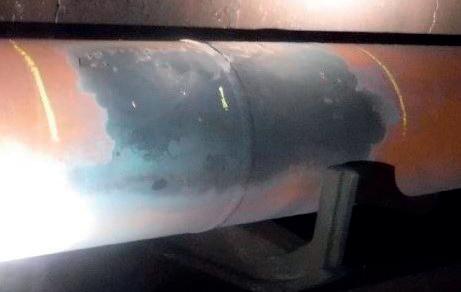
The FTIS inspection detected upwards of 35% wall loss in several tubes, with one tube showing very localised external wall loss at the same location in three of the four passes. Creep growth deformations from elevated TMTs were not detected anywhere in the heater, much to the relief of the operator.
The inspected coils passed the engineering screening assessment for a 3 year operating
March 2024 HYDROCARBON ENGINEERING 46
Figure 2. Vacuum heater.
Figure 1. Locations of elevated temperatures from thermography.
Figure 3. Tube discolouration due to high TMT.
A long history of looking
AHEAD

For nearly a century, Grace catalysts have kept fuel and petrochemical feedstocks flowing from the industry’s largest refineries to the trucks, trains, planes, and ships that keep our world running.
We are leveraging our long history of innovation in fluid catalytic cracking to develop products that enable lower carbon fuels and help meet the challenges of the energy transition. grace.com
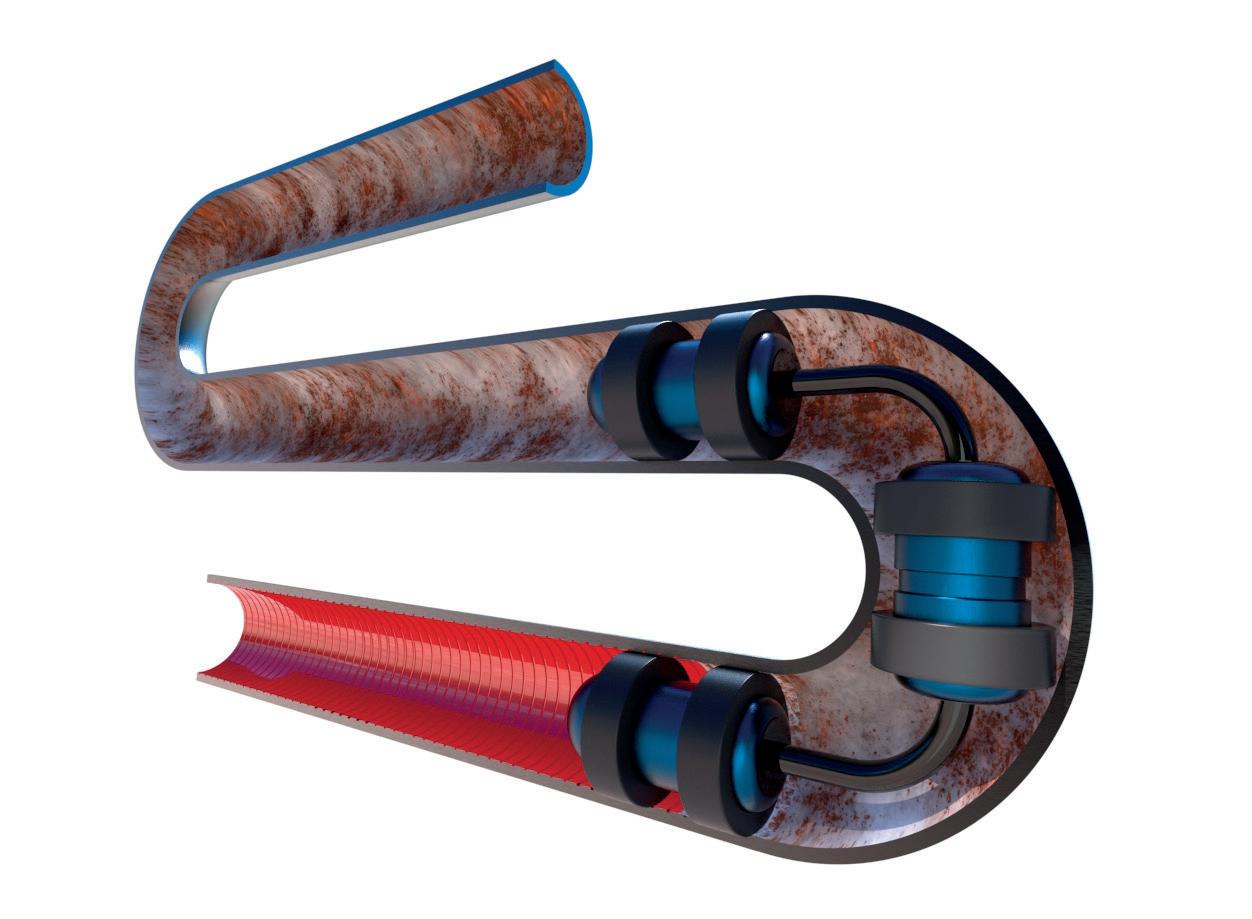
period with an estimated remaining life of >10 years and a recommendation to re-inspect within 4 years to monitor corrosion rates and detect any other localised damage.
The localised external metal loss detected during the FTIS inspection was identified as a concern in the screening assessment given that the mechanism, initiating event, and duration of the external metal loss were not fully understood. Based on this, Quest Integrity recommended investigating the root cause of the external wall loss and taking appropriate action(s) to manage the mechanism(s) and damage rate.
With the insights gained from the heater integrity optimisation solution, the refinery adjusted the velocity and
vaporisation of the fluid via steam injection to improve the flow pattern. This, in turn, should minimise coke buildup and improve overall heater operations. The refinery plans to perform a follow-up ADCV cleaning and inspection to gauge the effectiveness of the change. At that time, wall loss indication reporting from the first FTIS inspection will be compared with the latest inspection to determine corrosion growth rates and identify any new areas of concern.
Conclusion
FTIS in-line inspection technology, in conjunction with the ADCV technology, achieved previously unobtainable comprehensive insights into the overall condition of the heater. This provided the plant with the necessary information to operate the heater safely and confidently until the next scheduled shutdown.
By using an advanced cleaning solution, the plant was able to identify all hotspots within the passes based on the concentrated areas of coke buildup detected by the cleanliness verification tool. From this, corrective measures were taken to eliminate future hotspots and prevent rapid coke formations. The FTIS inspection provided complete assurance that no serious wall loss or deformations occurred at the hotspots. Additionally, it uncovered several areas of localised external wall loss for further investigation by the plant.
By offering a fully integrated solution, the plant was able to establish a plan to better optimise the performance and reliability of its vacuum heater, minimising costly downtime and maximising production and asset profitability.


REMBE® Your Specialist for Pressure Relief Solutions. © REMBE® | All rights reserved rembe.com hello@rembe.com 9567 Yarborough Rd. | Fort Mill, SC 29707, USA T +1 704 716 7022 hello@rembe.us
Figure 4. FTIS tool in coil.

 Jim Lines, Graham Corp., USA, explains how the life of steam surface condensers can be maximised.
Oil refining Ethylene Ammonia/urea Methanol Propane dehydrogenation
FCCU wet gas compressor Cracked gas compressor Syngas compressor Syngas compressor Product compressor
FCCU main air blower Ethylene refrigerant compressor
Hydrocracker recycle gas compressor Propylene refrigerant compressor
Process air compressor Propylene refrigerant compressor
Ammonia refrigerant compressor
Hydrotreater recycle gas compressor Boiler feedwater pump
Feed gas compressor CO2 compressor
CCR hydrogen recycle compressor
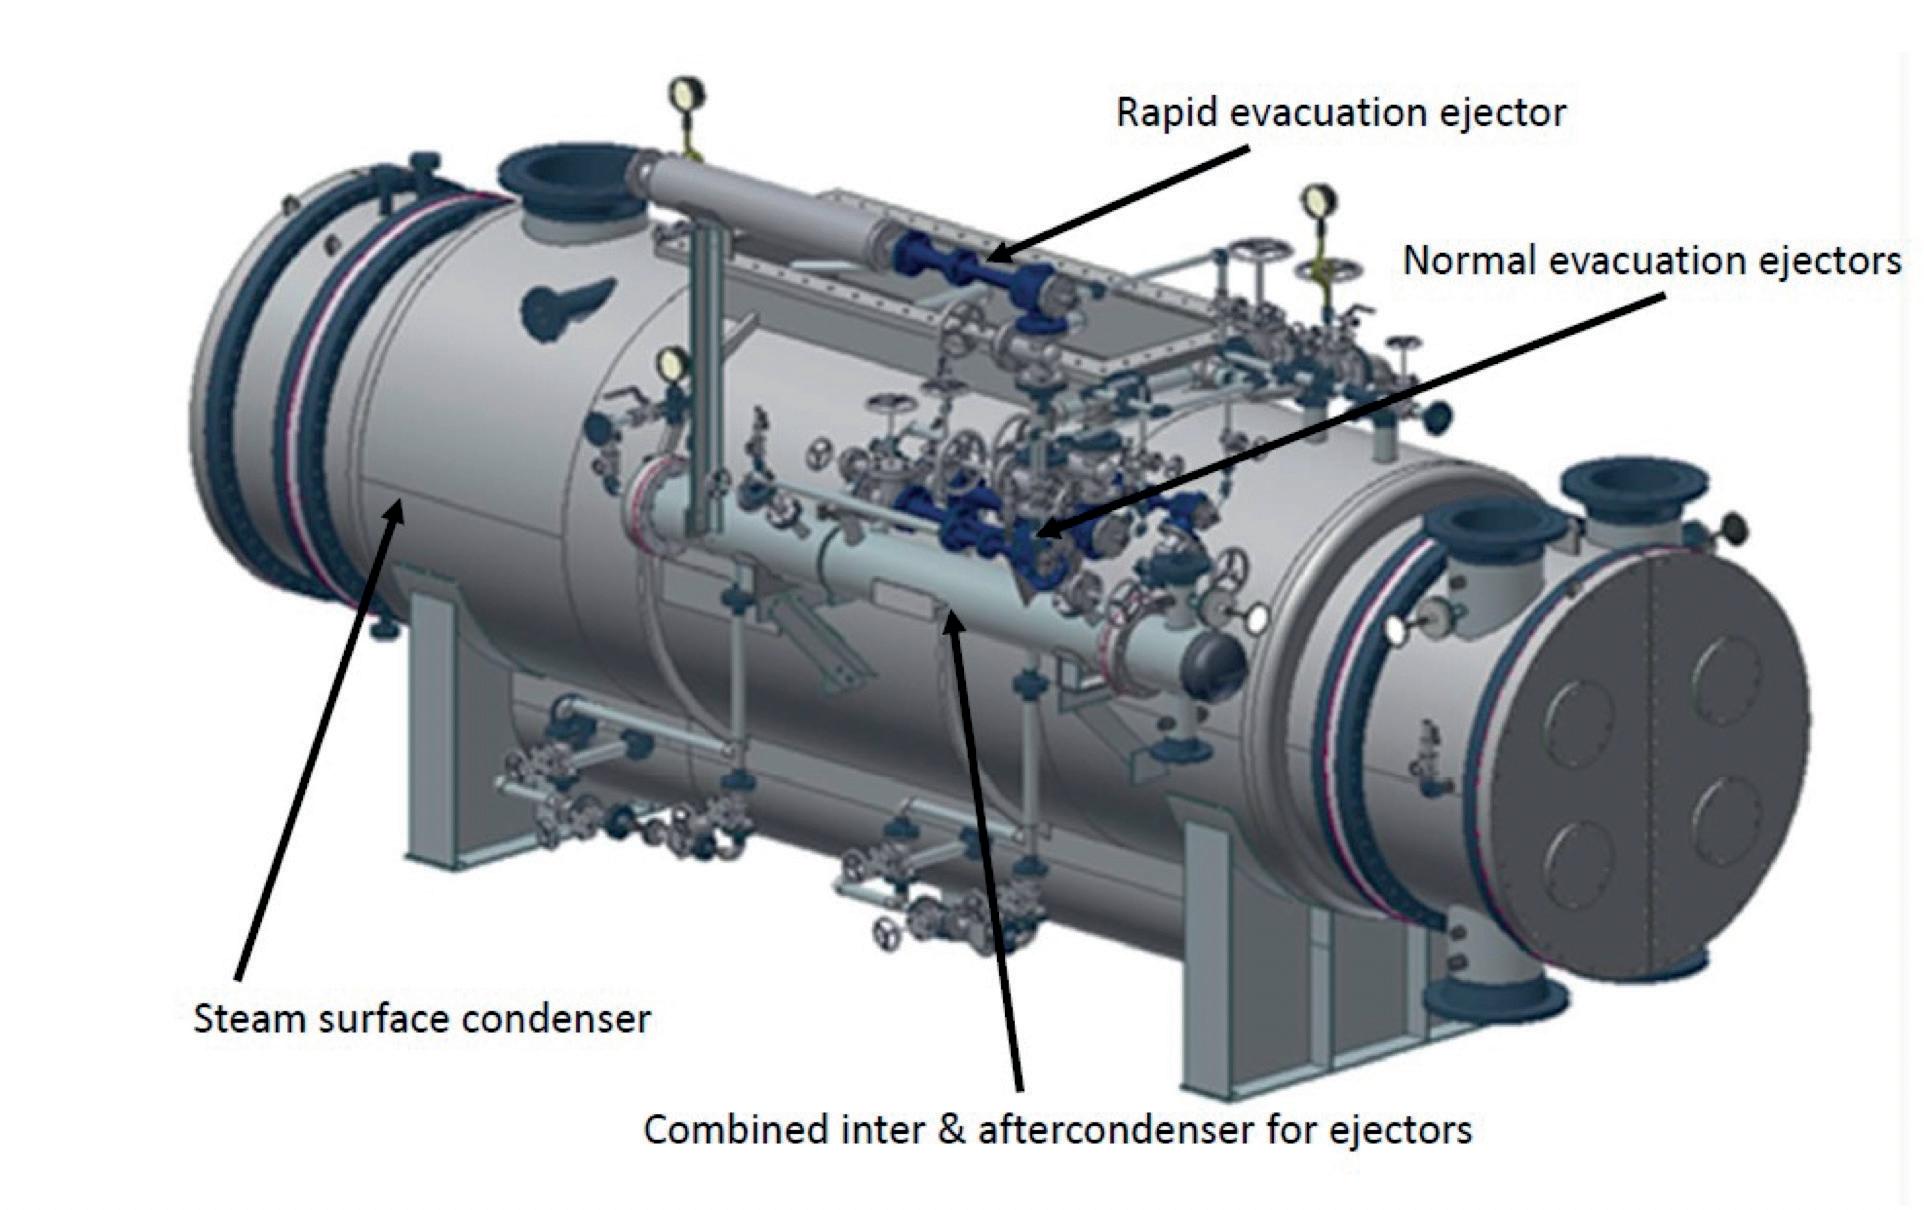
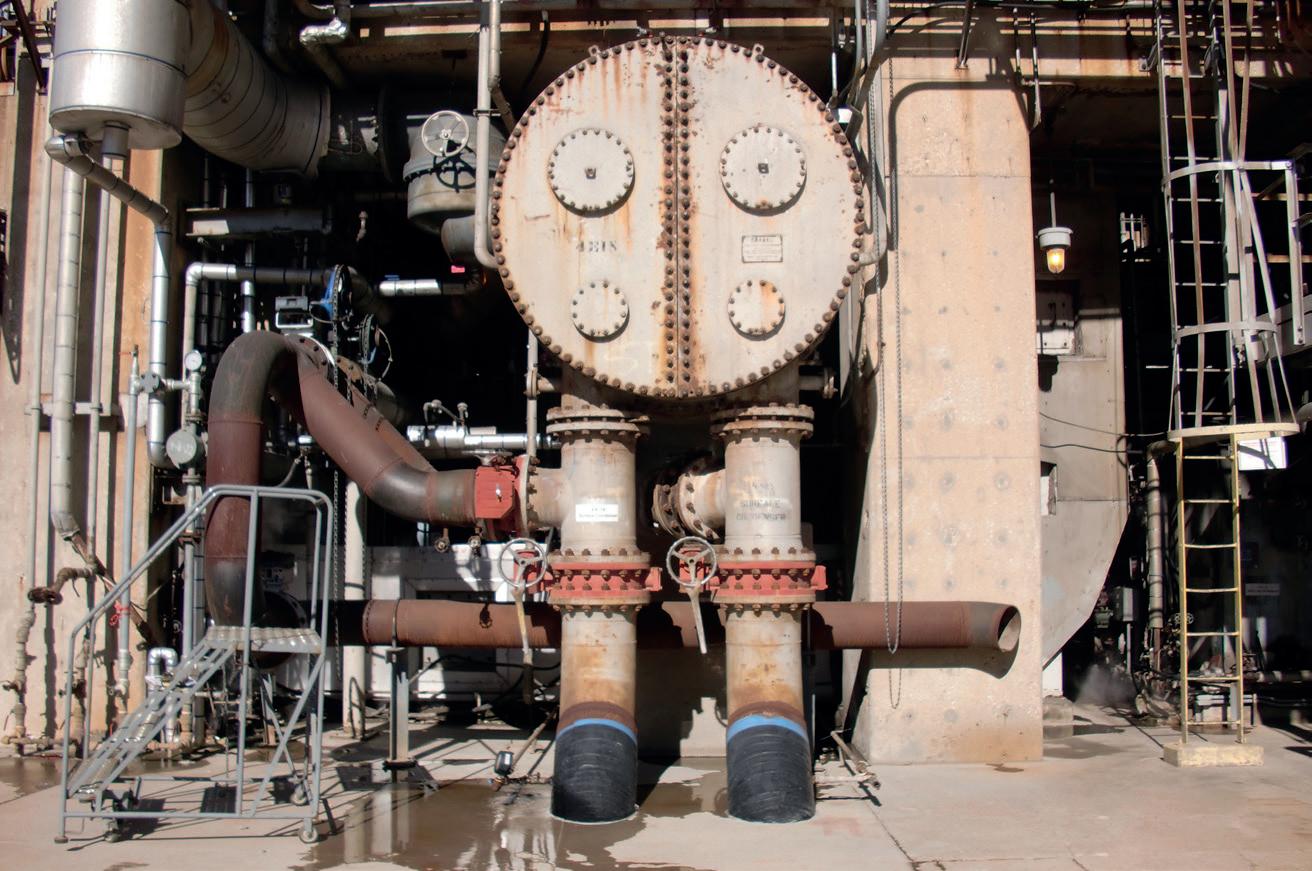
The sample evaluated was rather scattered – however, it is reasonable to predict a service life of 35 - 40 years for steam surface condensers, bearing in mind approximately 30% of the 80 units operated for longer than 40 years. The service life data was too scattered to infer that average or median figures would justly apply as expected service life (Table 2).
In this analysis, end of life is when the original condenser is replaced or the user procured a bundle kit. A bundle kit replaces tubes, tubesheets, support plates, air cooling shrouds and piping, tie rods and nuts.
It should not be misconstrued that service life implies no investment was made by the user to ensure reliable performance. Throughout the life of a steam surface condenser system there is periodic routine maintenance, repair and operational (MRO) type investment to replace worn parts or gaskets whenever a bolted joint is opened. Worn parts include ejector motive steam nozzle, ejector diffusers, condenser waterboxes and the inter and after condenser.
Best practices
Below is a list of best practices identified from the 80 units evaluated:
n Test ejector system performance at the factory. Obtain certified performance curves for each ejector including a no-load test.
§ A no-load test will confirm an ejector is stable at no-load and will also be useful when determining if an actual installation has excessive air in-leakage or there is a mechanical issue with an ejector.
n Maintain ejector motive steam nozzles as warehouse spares.
n Perform a benchmarking flowrate, pressure and temperature survey of the condensing system, ideally during summer months and near rated capacity. Document the following: turbine backpressure; condenser condensate flowrate and temperature; cooling water flowrate and temperature in and out; motive steam pressure and temperature as close to ejector inlet as practical; suction and discharge pressure for each ejector; cooling water flowrate and temperature in and out of inter and aftercondenser. (See Figure 3 for a comparison of benchmarking to field measurements that happened to
March 2024 HYDROCARBON ENGINEERING 50
Table 1. Common services within refining, petrochemical and chemical processes where steam surface condensers are used
Figure 1. Steam surface condenser and ejector system.
Figure 2. Steam surface condenser installation in crude oil recycle gas compressor service.
We understand how you need to reduce complexities at your plant.
CLEAN PROCESS + CLEAR PROGRESS
You strengthen your plant’s safety, productivity and availability with innovations and resources.

Endress+Hauser helps you to improve your processes:
• With the largest portfolio of safety instruments that comply with international regulations
• With applied technologies and people who have extensive industry application know-how
• With access to accurate and traceable information
Do you want to learn more?
www.endress.com/oil-gas
identify excess air in-leakage as evidenced by first and second stage ejector suction pressures.)
n At each shutdown, measure ejector internal critical diameters, specifically the motive steam nozzle throat diameter and ejector diffuser throat diameter. Replace these if wear is beyond what the OEM recommends.
§ Wear is common if motive steam supply conditions are poor, such as if supply conditions are wet. This then leads to erosion of motive steam nozzle and inlet diffuser of an ejector.
n Replace ejector steam nozzles and ejectors after 10 - 12 years of service.
n Replace the inter and aftercondenser after 12 - 15 years of service.
n As the steam surface condenser is approaching 20 years of service, include pressure boundary thickness checks as part of the routine maintenance evaluation at each shutdown.
n Have an OEM performance improvement engineer evaluate steam surface condenser performance typically 18 months ahead of a planned shutdown to give adequate time to assess performance, make
recommendations and have equipment fabricated on a non-urgent basis, should replacement be necessary.
Case study 1
An ethylene plant in the US Gulf Coast started up in 1990 and the original steam surface condenser had 17 500 ft2 of surface area for the cracked gas compressor turbine driver and was constructed with admiralty tubing and naval rolled brass tubesheets. Naval rolled brass is a material that cannot be welded, therefore, the joint between the tubesheet and shell flange was bolted with a permanent seal arrangement (Figure 4).
Case study 2
An ammonia/urea fertilizer plant commenced operation in the Middle East in 1992 and the original steam surface condenser had 9000 ft2 for the process air compressor turbine driver. The condenser was constructed with titanium tubing and titanium clad tubesheets. The tubesheet to shell joint was bolted with a permanent seal arrangement (Figure 5).
Case study 3
A crude oil refiner started up a reformer unit in 1970 and the original steam surface condenser had 29 000 ft2 for the recycle gas compressor turbine driver. The condenser was constructed with admiralty tubing and naval rolled brass tubesheets. The tubesheet to shell joint was bolted with a permanent seal arrangement, rather than a welded joint, as naval rolled brass cannot be welded (Figure 6).
Case study 4
An ammonia fertilizer producer had a steam surface condenser installed in the late 1960s to support a steam turbine driver for a feed gas compressor. The surface condenser performed well. However, after 45 years of service it had reached end of life and required replacement. The original design basis for the turbine exhaust flow to the surface condenser was 95 mm Hg abs
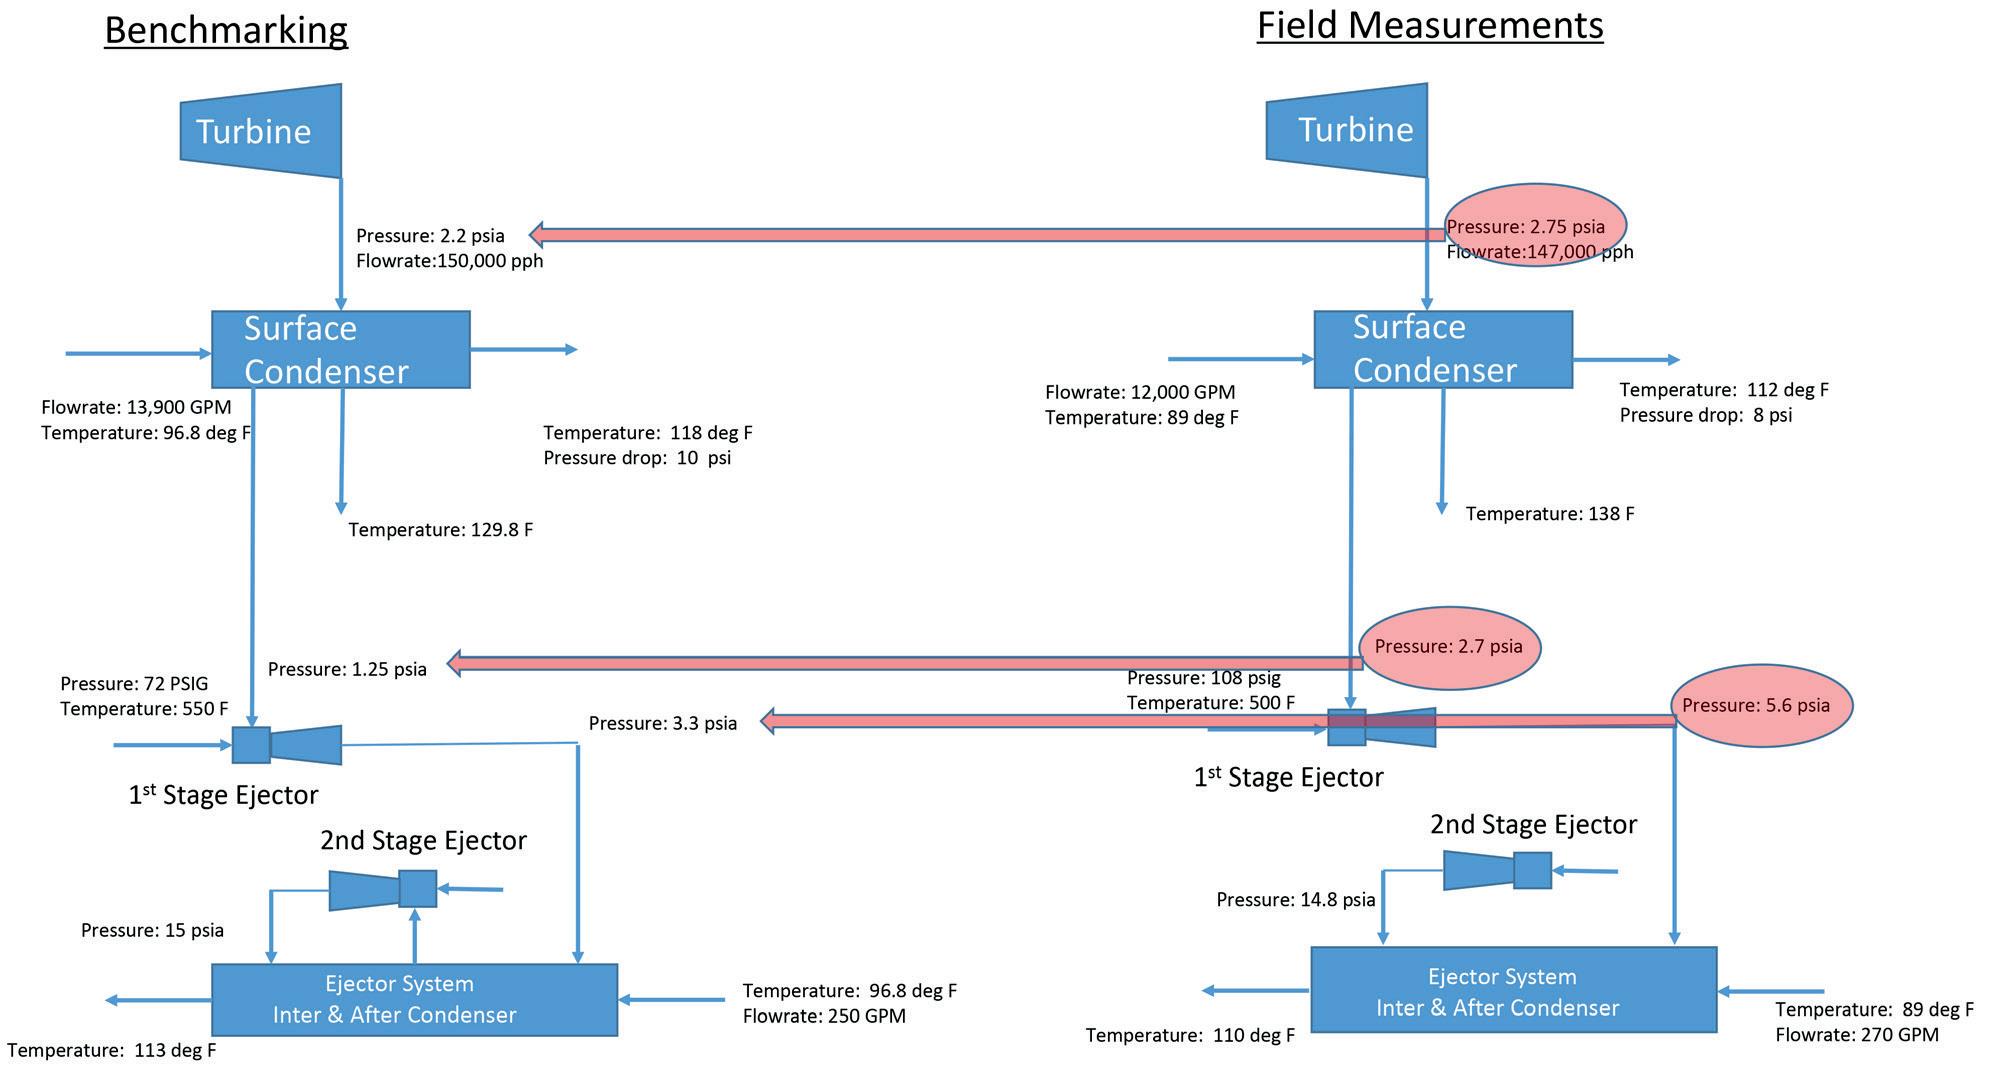
March 2024 HYDROCARBON ENGINEERING 52
Service life data Years of service % of units evaluated 20 years or less 9% 21 - 25 years 15% 26 - 30 years 23% 31 - 35 years 8% 36 - 40 years 18% 41 - 45 years 15% 46 - 50 years 8% More than 50 years 6%
Table 2.
Figure 3. Field measurements vs benchmarking survey, highlighting excess air in-leakage.


Our technical analysts aren’t just good listeners, they’re recognized experts. Skilled at diagnosing under-performing reactors and helping you get everything you need for healthier results. Call us. You’ll feel better. Optimize crystaphase.com
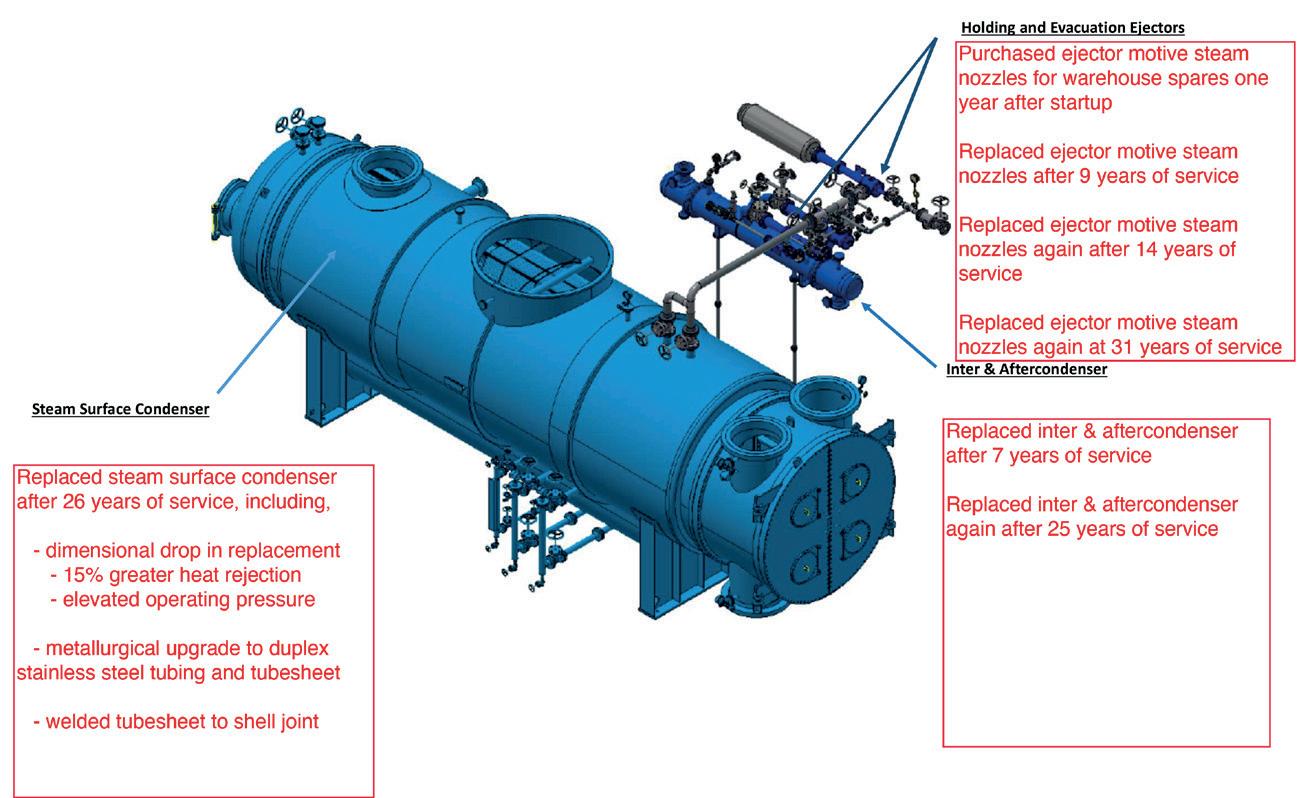
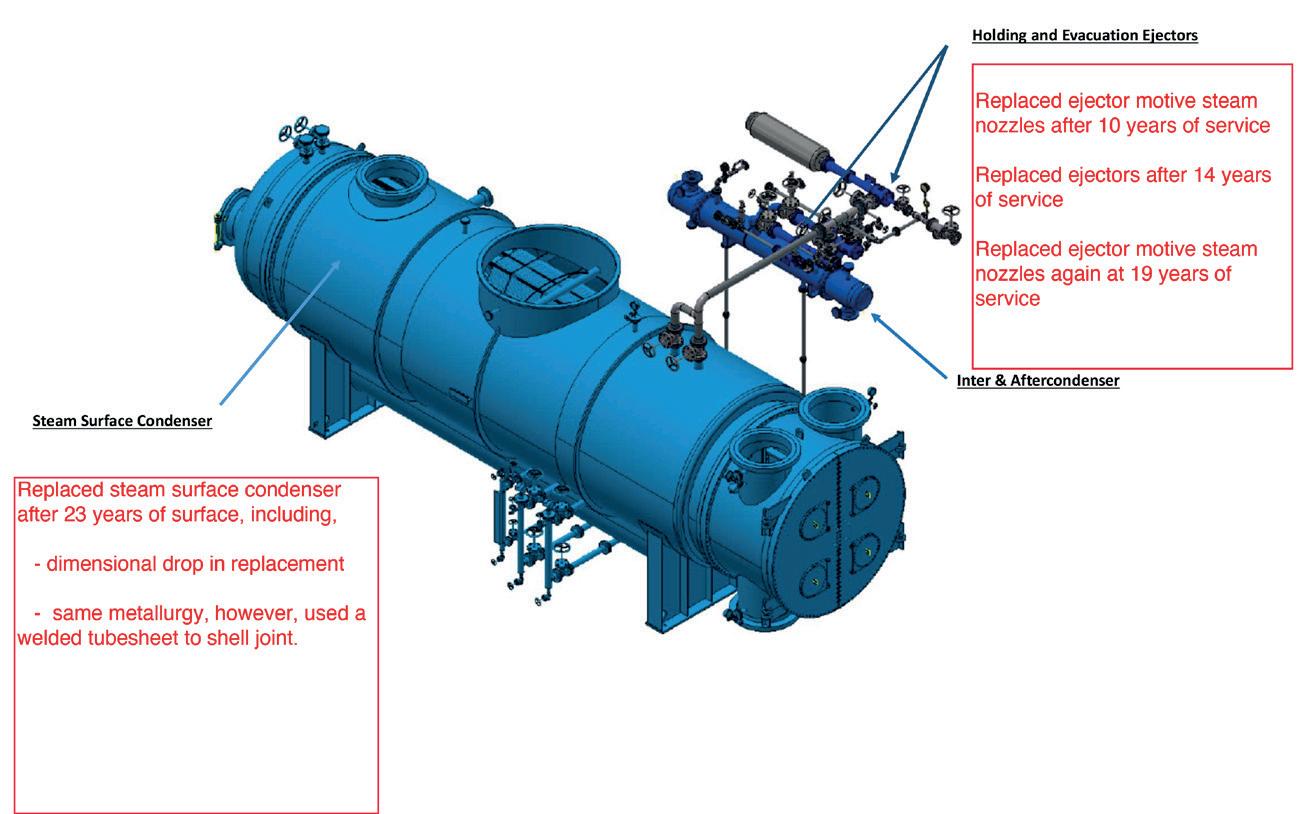
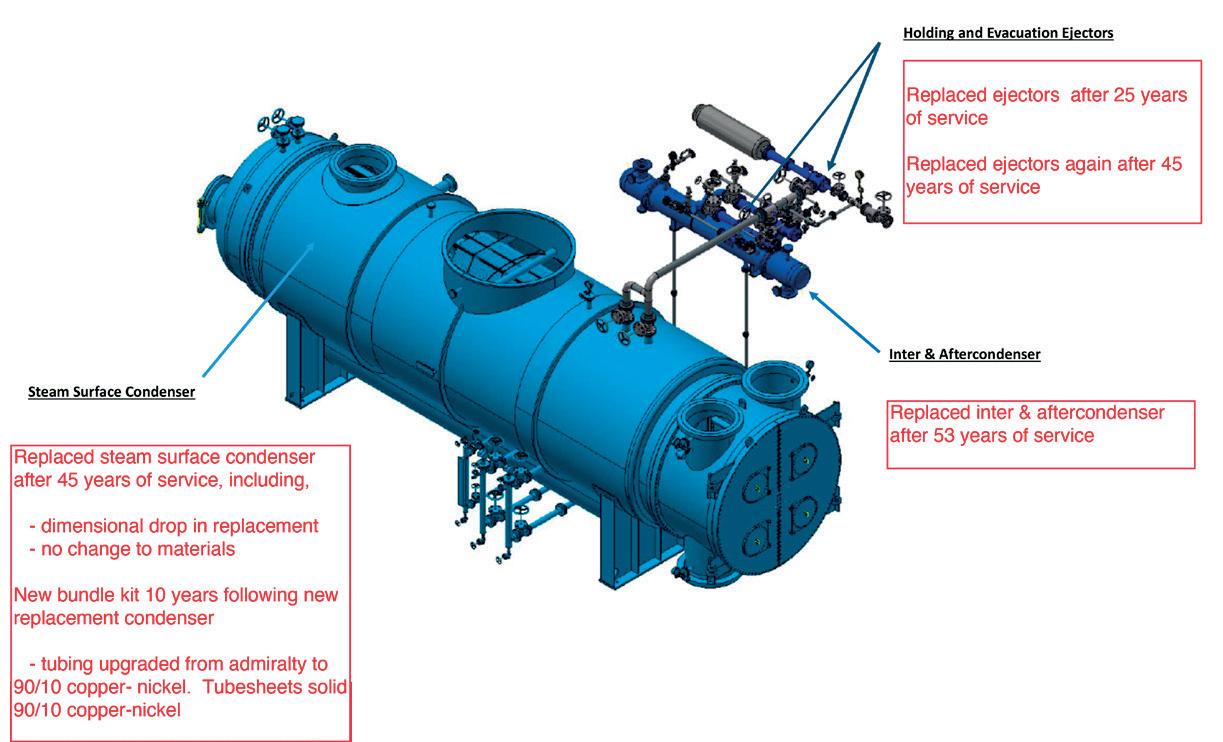
back pressure at 25 000 pph steam flow. Prior to replacement and near end of life, turbine back pressure was 125 mm Hg abs with 25 000 pph flowrate.
A decision to replace the condenser to fit into a planned shutdown left little time for a new replacement surface condenser to be built. A surface condenser OEM required 10 months, which was beyond the shutdown window. Consequently, the plant elected to use a shell and tube fabricator that could match external dimensions and provide a drop-in placement within 5 months.
Graham’s performance improvement engineers were contacted to assess why the new surface condenser, which is all that was replaced, would hold turbine backpressure at approximately 350 mm Hg abs while the plant had to operate at reduced rates for the turbine, which was running at about 60% of the designed 25 000 pph requirement. This resulted in a serious production capacity shortfall due to the reduced capability of the feed gas compressor.
The performance improvement engineer arrived on site. The first task was to inspect the installation to confirm that the arrangement and piping were correct – which it was, as all that had been replaced was the steam surface condenser. Secondly, the ejector venting package was inspected. Steam supply conditions were appropriate and within design tolerance. The ejector system was isolated and a no load test was completed. The pressures maintained by the first and second stage ejector were near to expected no load pressures, confirming the venting package was not the issue. Moreover, it did not appear that excessive air in-leakage was the issue. Cooling water flowrate, inlet temperature and pressure drop did not suggest water supply conditions were a cause for poor operating pressure. Consequently, it was the condenser that was the root cause of the elevated turbine discharge pressure.
The performance improvement engineer asked to review the drawings for the replacement condenser. The condenser internal geometry was quickly identified as the problem. While external dimensions matched the original supply, the internal geometry was not appropriate for a steam surface condenser. The internal geometry was closer to a typical shell and tube total vapour condenser geometry. The improvement engineer identified four internal design elements that were causing poor performance:
n There was a distributor plate running the entire tube length and across the
March 2024 HYDROCARBON ENGINEERING 54
Figure 5. Case study 2: drop-in replacement condenser after 23 years.
Figure 4. Case study 1: condenser replacement with superior metallurgy after 26 years.
Figure 6. Case study 3: change out of condenser after 45 years. Metal upgrade 10 years later.
top tube row. Steam could enter the tube field only through perforations in the distributor plate, which resulted in high pressure drop to pass through the small perforations. To overcome this pressure drop, operating pressure increased (backpressure on the steam turbine increased). The perforated plate had a net free area for flow to pass that was about 75% of the tube bundle entrance area. This resulted in parasitic pressure drop.
n The noncondensible vent was located on the shell in the open space above the tube bundle, permitting short circuiting of the steam directly to the noncondensible vent without entering the tube bundle. This would overload the ejector venting system with too much steam.
n Lack of noncondensible gas venting from the condenser tube bundle resulted in elevated operating pressure.
n Condenser internal geometry did not separate condensate from noncondensible gases to permit subcooling gases below the bulk condensate temperature, also resulting in poor performance.
Unfortunately there was not an easy fix for the fertilizer plant. The replacement condenser designed and built by the shell and tube fabricator was wrong for the service. A replacement condenser by a surface condenser OEM was required.
Conclusion
Steam surface condensers can provide reliable decades-long service. A service life of 35 - 40 years is typical and there have been numerous instances where condensers have provided approximately 50 years of service. There are best practices for maintaining a surface condenser and its ejector system in good working condition. The cost to keep this type of equipment in good working condition is minimal when compared to the cost associated with condenser underperformance and, therefore, reduced plant capacity or negative impact to product quality.
It is important to always perform a benchmarking performance survey (see Figure 3), ideally in the summer months when inlet cooling water is warmest. Condensate temperature and turbine exhaust pressure trends, along with motive steam supply conditions, should be monitored. Changes in trends can serve as lead measures for potential future performance shortfalls. It is also recommended to engage a performance improvement engineer from the condenser OEM to supplement plant data with an independent performance survey and health check-up. This should
be done approximately 15 - 18 months ahead of a planned shutdown. Therefore, adequate time is provided to analyse the data, identify opportunities for improvement, or to head off a performance shortfall, and to have replacement equipment built on a non-emergency basis, should replacement equipment be required. This will avoid the economic challenges described within case study 4.
References
1. Heat Exchange Institute Standards for Steam Surface Condensers, 12th edition.
2. JOHNSON, A., ‘Full steam ahead’, World Fertilizer, (Jan/Feb 2018), pp. 28 - 34.
3. KUBIK, W., ‘Ejectors eject energy hogs’, Hydrocarbon Engineering, (March 2021), pp. 57 - 60.
4. KUBIK, W., ‘Condensing Costs’, World Fertilizer, (Nov/Dec 2020), pp. 37 - 40.
5. LINES, J., ‘Picking up steam’, World Fertilizer, (Nov/Dec 2022), pp. 35 - 41.
6. LINES, J., ‘Steam-surface condensers: Lessons from the field’, Hydrocarbon Processing, (April 2023).


Inherently associated with significant emissions, due to the nature of its products and conventional processes, the hydrocarbon processing sector is undergoing substantial change to help create a more sustainable future. CCUS solutions can separate CO2 from flue gases, sequester and/or recycle it as a feedstock. As such, they provide a targeted, straightforward approach to mitigating the environmental impact of refineries and petrochemical complexes.
By implementing CCUS facilities, companies can do more than demonstrate an active commitment to sustainability. They can turn a potential liability into a profitable venture. Since CO2 can support a variety of organic and inorganic reactions and more conversion routes are reaching commercialisation, it is becoming easier for companies to embrace the processing technologies that best address their needs.
Starting from the basics
The starting point of a CCUS technology comprises carbon capture, which can occur at intermediate reactions, when burning fuels with oxygen, or just before releasing waste streams. These are known, respectively, as pre-, oxy-fuel and post-combustion methods, and have all been applied to real-world installations. Post-combustion carbon capture solutions are broadly recognised as the most mature and cost-effective. Therefore, they may be a better fit for refineries and petrochemical plants.
At this stage, companies should consider what type of separation strategy is best suited to extract CO2 from their flue gases. Current technologies include CO2-selective membranes, adsorption and absorption processes. The most widely spread technology is absorption, which uses liquid solvents. These are usually based on aqueous monoethanolamine, diethanolamine, piperazine, or potassium carbonate, to absorb gaseous CO2 through the formation of a chemical bond with the gas once dissolved. The CO2-rich liquid solvent is then heated to release the CO2 gas through a stripping process, thus becoming lean and ready for reuse in subsequent carbon capture cycles. This process owes its popularity to its high separation efficiency, flexibility of scale, and financial performance.
56 March 2024 HYDROCARBON ENGINEERING
Dr. Cecilia Mondelli and Stephen Shields, Sulzer Chemtech, look at the most promising CCUS technologies, which offer multiple benefits that go further than compliance with environmental regulations.

March 2024 57 HYDROCARBON ENGINEERING
Having identified their carbon capture solutions, refiners should then define what to do with the captured CO2 Generally, it is best to find ways to utilise it, rather than simply sequester it in geological formations, since it can be more profitable and/or support circular practices.
Considering the manifold options available when it comes to end products incorporating or originating from CO2, companies should take into account their existing offering, the industries they serve, and where the greatest market opportunities lie.
Deciding what to get out of CCUS systems
One particularly interesting option for hydrocarbon processors may be the incorporation of CCUS technologies that can deliver fuels, such as methanol and higher alcohols, which are already part of the refinery’s output. In addition to reducing emissions, this choice also displaces the extraction of virgin fossil fuels that would otherwise be used.
With an estimated annual CO2 consumption between 700 and 2100 million t for various fuels, 70 - 80 million t of which can be linked to methanol alone1, the total annual market can be valued as high as US$10 - 250 billion.2
Carbon utilisation solutions to obtain fuels mainly rely on a single direct hydrogenation stage, therefore benefitting from a compact footprint and limited investment requirement. Besides, they can leverage existing plants, retrofitting key pieces of equipment.
Other very appealing CCUS-based products for refineries and petrochemical complexes are organic carbonates, which can be produced by reacting CO2 with epoxide to obtain ethylene carbonate. This can then undergo a trans-carbonation to deliver dimethyl carbonate. As both carbonates can be used to support the production of widely used polymers, e.g. polycarbonates and polyurethanes, implementing this carbon utilisation route can help hydrocarbon processors expand their downstream base.
In addition, these two carbonates, as well as some of their derivates such as vinylene carbonate and fluoroethylene carbonate, are in very high demand for lithium (Li)-ion battery manufacturing as solvents for electrolytic solutions. With global electrification efforts driving the expansion of the Li-ion batteries market (compound annual growth rate, [CAGR] of 22%3), it is estimated that 1.74 million t of electrolytes will be required by 2030.
Getting creative
While organic routes are perhaps considered more straightforward for hydrocarbon processors to follow, companies can also look at producing inorganic materials. In this area, a great opportunity lies in the exothermic mineral carbonation, or mineralisation, of CO2 using metals extracted from waste metal oxides, hydroxides, silicates, or other inorganic materials to form carbonated products.
While the CO2 captured in organic compounds, whether as fuels, chemicals, or polymers, is typically expected to be re-emitted in less than 100 years, mineralisation can almost
permanently remove carbon from the atmosphere. Therefore, this choice enables companies to combine both carbon storage and utilisation, avoiding the need for continuous looping and CCUS activities.
Indeed, unlike other storage solutions, the materials obtained through mineralisation are fit for use in the construction and building materials sector. The production of carbonates for infrastructures not only enables the storage of large volumes of CO2, but can also be extremely profitable, with the total annual market estimated at US$165 - 550 billion.2
Smooth sailing
After selecting the appropriate CCUS approach for their needs, companies in the refining and petrochemical processing industry need to specify high-quality technologies to ensure their endeavours are successful. This means selecting solutions that maximise return on investment while optimising CAPEX and OPEX, considering the generally low price of the CO2-based products. Furthermore, companies should favour solutions that can address the specific challenges of the chosen CCUS processes.
For example, if methanol is the desired end-product of CCUS plants, it is important to implement separation systems that can handle the generation of water and other byproducts in the catalytic reaction and enable purification of the outlet stream in an energy-efficient manner.
Similarly, when looking at organic carbonates, processors should invest in setups that can deliver suitable separation efficiency while optimally balancing energy input and recovery rates. Even more important is selecting a partner that can meet the carbonate requirements for polymer production and Li-ion battery manufacturing, as these two pathways require feedstocks with very different purity grades.
To identify and best address these issues, it is vital to partner with a technology expert that can offer specialised equipment and process solutions and is positioned to support its customers as a full-service provider, such as Sulzer Chemtech. Having a single point of contact that handles engineering services as well as complete technology licenses can also help streamline CCUS projects, making it quicker for hydrocarbon processors to profitably slash their emissions.
Players in the refining and petrochemical sectors around the world can now turn CCUS facilities into profitable plants that generate new revenue streams. This supports the development of innovative carbon utilisation solutions that align with the needs of users, making decarbonisation an attractive pathway towards profitability.
References
1. ‘Global Roadmap for Implementing CO2 Utilization’, The Global CO2 Initiative, (2016). Available at: https://deepblue.lib.umich. edu/bitstream/handle/2027.42/150624/CO2U_Roadmap_ FINAL_2016_12_07%28GCI%29.pdf?sequence=1.
2. ‘Global Roadmap Study of CO2U Technologies,’ Lux Research, (2018), https://deepblue.lib.umich.edu/handle/2027.42/146529 ?show=full.
3. Research and Markets, ‘Grid-Scale Battery - Global Strategic Business Report’, Research and Markets, (2023), https://www. researchandmarkets.com/report/grid-scale-battery#tag-pos-1.
March 2024 HYDROCARBON ENGINEERING 58

CRS 31 & CRS 41 Promoted TiO₂
CSM 31 Aromatics Guard
AM & AMS Sulfation Guards
CR Series Standard & Optimized Macroporous Aluminas
TG 103 & TG 203 Conventional Temperature CoMo Catalysts
TG 107 & TG 136 Low-Temperature CoMo Catalysts
DR Series & ICB Bed Support Media
CR-3S Optimized Ultra-Macroporous Alumina
Hello! SULFUR RECOVERY CATALYSTS
New
here
Click


On Demand Webinars Explore our library of free-to-access On Demand Webinars, covering a range of topics in the downstream sector Visit: www.hydrocarbonengineering.com/webinars
Dr Chris Mills, TÜV SÜD National Engineering Laboratory, UK, discusses how flow measurement will play a fundamental role in carbon capture, utilisation and storage (CCUS).
Carbon capture, utilisation, and storage (CCUS) will play a crucial role in mitigating human-caused carbon dioxide (CO2) emissions and facilitating the transition towards sustainable and clean energy sources. Despite minimal progress over the years, there is now a noticeable increase in global interest and investment in CCUS initiatives.
In the UK, CCUS is a pivotal aspect of the UK government’s 2020 ‘Energy White Paper: powering our net zero future’. As an integral component of the UK’s strategy for decarbonising

industries, the government has committed to establishing two CCUS clusters by the mid-2020s (with an additional two by 2030). These clusters include the East Coast Cluster, which encompasses Teesside and Humberside, connected to the offshore storage site of the Northern Endurance Partnership. The other cluster is HyNet, covering the Merseyside region and North Wales, with storage sites located in the Irish Sea.
Studies indicate that the UK sector of the North Sea possesses substantial capacity to store approximately 78 gigatons (GT) of CO2 in saline aquifers. This storage potential
March 2024 61 HYDROCARBON ENGINEERING
translates to over 200 years worth of capacity based on the UK’s 2021 CO2 emissions. It is widely acknowledged that achieving net zero emissions without the implementation of CCUS is not deemed feasible.
Furthermore, nations around the world are presently committed to fostering a flourishing low-carbon hydrogen industry. CCUS will play a vital role in facilitating the rapid expansion of low-carbon hydrogen production through steam methane reforming. The integration of CCUS with methane reforming offers a viable pathway for cost-effective hydrogen generation, with net zero CO2 emissions, and is anticipated to be widely embraced.
An often overlooked aspect of CCUS is the requirement for appropriate flow measurement technology for CO2 streams. The ability to comprehend, monitor, and regulate the flow rate of CO2 will be crucial for ensuring the effective functioning of CCUS operations.
At each stage in the CCUS infrastructure, accurate measurement of the CO2 flow rate is required. These measurements can occur over a range of temperatures, pressures, flow rates and fluid phases, and must be validated through a credible traceability chain.
The traceability chain provides the underpinning confidence required to verify meter performance, financial and fiscal transactions, and environmental compliance. Unfortunately, there is currently a lack of traceable gas CO2 and liquid CO2 flow measurement facilities and associated flow measurement standards. This is a significant barrier to the successful implementation of CCUS projects worldwide.
Fluid properties of CO2
CO2 is a fairly unique fluid, and its properties present several measurement challenges. At ambient temperature and pressure, CO2 is in a gaseous state and its flow measurement is relatively straightforward. However, above the critical point of 31.1˚C, and 73.9 bar, CO2 becomes supercritical, exhibiting properties which are hybrid between gas and liquid.
Operating near the critical point can present significant technical challenges as slight changes in temperature and pressure may result in large changes in fluid properties. The phase diagram for CO2 and the anticipated operating range for the CCUS chain are shown in Figure 1. Each of the four phases may present different measurement challenges and maintaining the desired fluid phase may also be problematic.
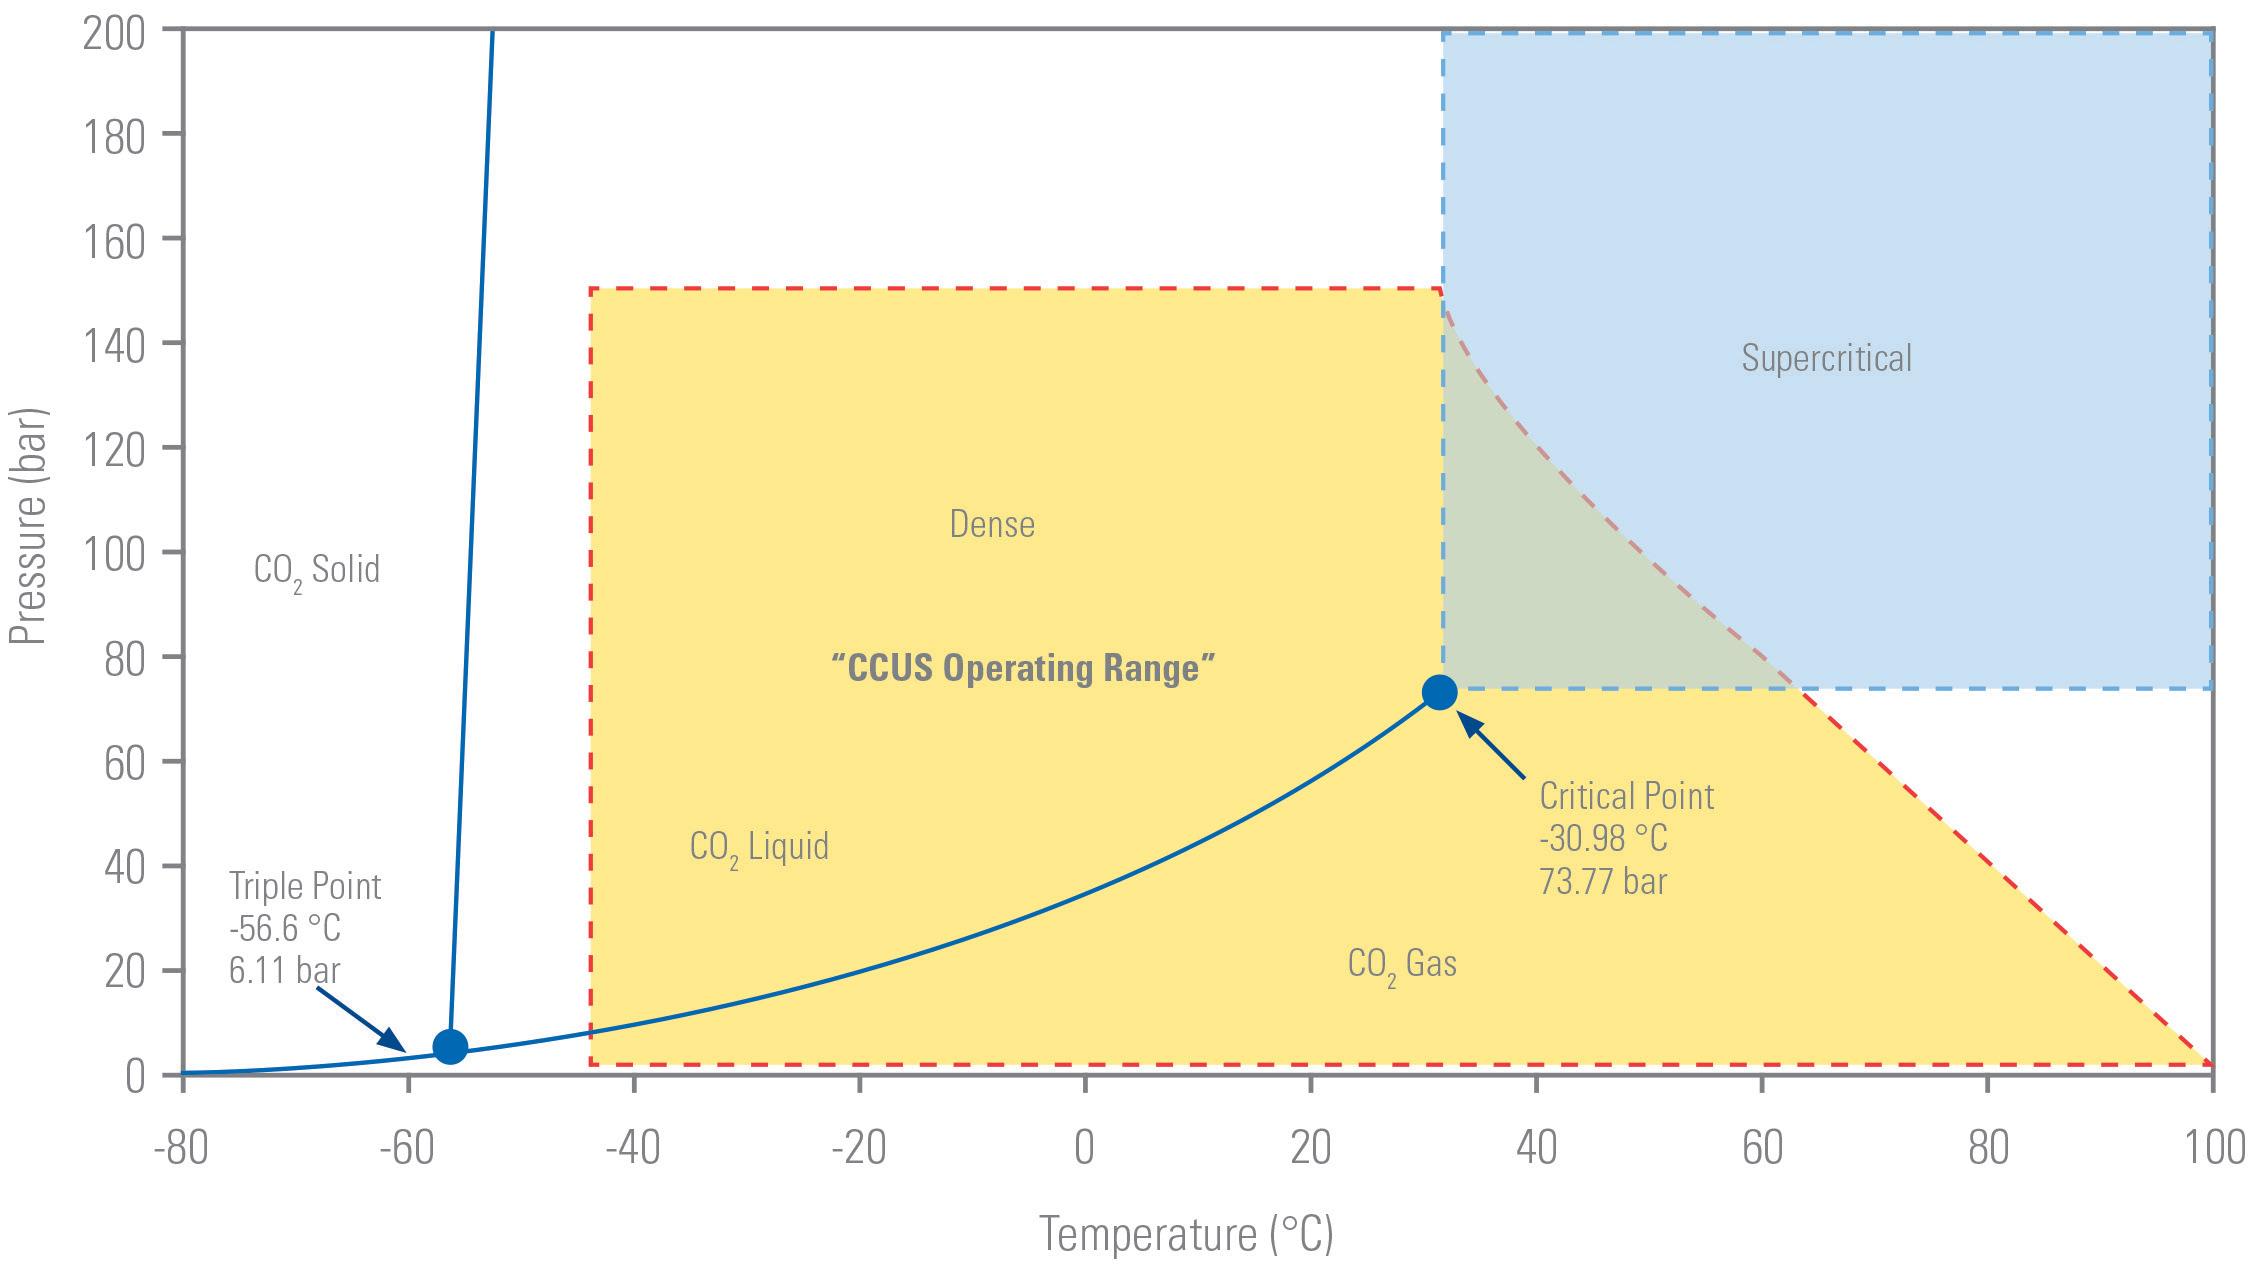
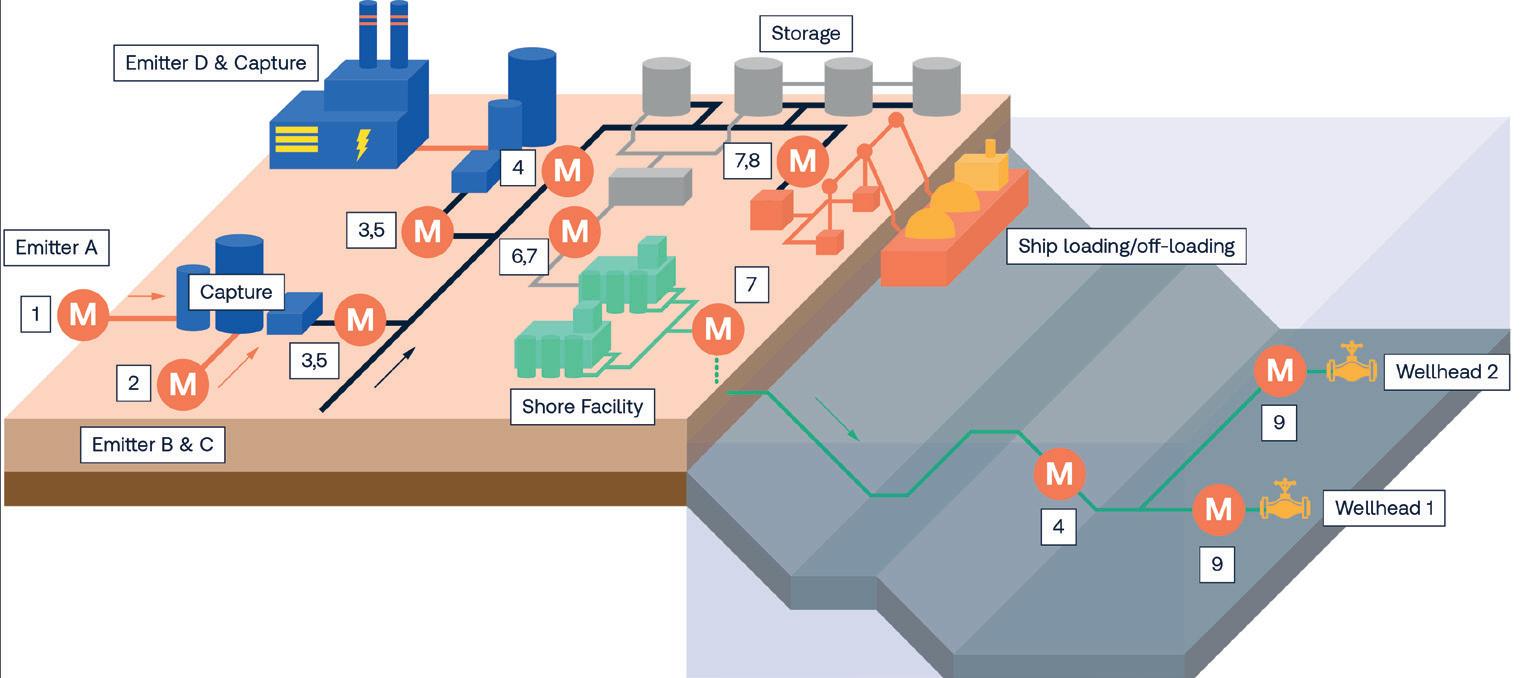
The possibility of phase change is further exacerbated by the likelihood of impurities being present in the CO2 stream, which may cause significant shifts in phase boundaries, the critical point, and specifically the two-phase region. Traces of impurities may also influence the density and compressibility of the process stream. Therefore, CO2 streams across the CCUS chain will require careful modelling and regular sampling to ensure the desired operating conditions and/or fluid phase are maintained.
Measurement stages for CCUS applications
The measurement locations for CCUS schemes are contingent upon various factors, including the defined limit of measurement uncertainty, the fluid phase involved, the method of transportation, and the regulatory mandates in place. These considerations help determine the appropriate locations where
March 2024 HYDROCARBON ENGINEERING 62
Figure 1. Pure CO2 phase diagram (CCUS operating range highlighted in yellow).
Figure 2. CCUS transportation measurement nodes.
ON THE ROAD TO DECARBONIZATION
SEPARATE EFFICIENTLY
Gulftronic® Electrostatic Separators are significantly more efficient at reducing ash in support of decarbonization when compared to mechanical filtration systems. Greater efficiency means maximum per barrel returns from FCC/ RFCC and hydrocracking, with lower operating costs. The result is a higher yield and a better return from the bottom of the barrel.
gulftronic.info@ga.com

©2024 GENERAL ATOMICS
1 Outlet of an emission source (e.g., flue gas from a coal fired plant)
2 Inlet to a CO2 capture facility
3 Outlet of a CO2 capture facility
4 Regular points along the transport network (e.g., at pumping/compression stations)
5 Entrance and exit to an onshore transport network
6 Temporary storage sites along the transport network
7 Entrance and exit to a shore facility
8 Loading and off-loading locations (e.g., ships)
9 Injection sites (e.g., North Sea wellhead)
measurements need to be taken within the CCUS infrastructure.
Figure 2 shows a typical CCUS transportation network with its corresponding measurement nodes. These measurement nodes are denoted in the diagram as red circles with a white ‘M’. Table 1 describes the activity taking place at each node in Figure 2. For measurement node types, refer to Table 1.
The main purpose of the transportation network in a CCUS system is facilitating CO2 capture. However, it also has the potential to contribute to CO2 emissions through losses and leaks within the system. To effectively monitor and evaluate fugitive losses throughout the CCUS process, a mass balance approach can be employed across the network, extending to the injection wellhead. This approach may involve tracking the CO2 composition at multiple locations within the CCUS transportation network to ensure a comprehensive assessment of the system’s overall performance.
Flow meters for CCUS applications
Orifice meters have been used for measuring CO2 injection in a variety of enhanced oil recovery (EOR) projects. Orifice meters are also widely used for single phase gas flow and liquid flow applications. If the fluid properties are accurately known, then orifice meters may provide low flow measurement uncertainty. As of yet, no published claims have been made for orifice plate flow measurement performance with supercritical CO2 However, if the composition, density, and viscosity are known, it is possible that orifice meters might be suitable across the CCUS chain, the only issue being the lack of traceable flow data.
Turbine flow meters are still one of the most commonly used flow meters for low uncertainty measurement of high value liquids and gases. They have been used extensively for measuring both liquid and supercritical CO2 flow in pipelines and have also been used for CCUS EOR applications.
There is insufficient data for ultrasonic meters (USM) in CO2 gas applications due to ultrasound signal attenuation. As the density can vary significantly in supercritical CO2, the ultrasonic transducer frequency required to maximise the signal might extend beyond the USM’s frequency. Furthermore, the flow profile is important for a USM and requires adequate corrections, which are dependent on the density and viscosity
of the fluid. Despite these difficulties, recent developments in transit-time USMs have shown potential for providing a low measurement uncertainty system for CCUS, but further research is required.
Coriolis mass flow meters can be utilised for nearly all types of flow applications and show significant potential for CO2 processes, as the devices should be able to operate across the full range of phase conditions in CCUS applications.
In all cases, the selection of the most appropriate flow meter technology must be complemented by appropriate calibration and operation, which in turn requires appropriate test and calibration facilities, best practice guidance, and regulations.
International CCUS regulations
The International Energy Agency (IEA) has repeatedly stated the need for clear legal and regulatory frameworks to underpin the successful implementation of CCUS. Its model regulatory framework document disseminates best practice for the development of CCUS legal and regulatory frameworks.
Some of the main drivers for improved traceability, R&D investment, reduced measurement uncertainty, and flow measurement innovation, are regulations and international standards. While CCUS has been a focus of policy development for several decades, legal requirements remain limited and vary around the world.
As of yet, there are approximately 30 commercial CCUS schemes operating in nine countries. In the Middle East, there are currently three CCUS schemes in operation and one in development. These schemes are EOR operations and sequester the captured CO2 into the reservoir to increase hydrocarbon production.
The majority of the CCUS schemes are located in the US. Recent CCUS legislation enables US taxpayers to elect to receive a payment in lieu of the tax credits for CO2 sequestration. However, at present there are no stipulations on the measurement uncertainty required.
There are two main European regulative frameworks. The CCS directive concerns CO2 geological storage and creates a legal framework for the safe and environmentally sound sequestration of CO2 to enable the reduction in anthropogenic CO2 emissions. The emissions trading system (ETS) specifies a maximum uncertainty value for CO2 flow measurement.
Meanwhile, the Global CCS Institute has commented that China’s lack of a regulatory framework for CCUS, alongside its ‘five-year plan’ for CCUS policy, is a key barrier for large-scale CCUS deployment. No measurement uncertainty stipulations have been published at present and, at current emission rates, China has storage potential for over 40 years of emissions.
According to the IEA, appropriate guidelines and regulations for CCUS implementation in Southeast Asia and the Middle East are still to be developed.
Flow measurement will play a fundamental role in CCUS schemes. Developing comprehensive regulations, standards, and a detailed traceability chain will be pivotal in ensuring the successful deployment of CCUS systems worldwide. Investment is required from governments, funding agencies and industry to ensure that the underpinning science for flow measurement of CO2 is provided on a global scale.
March 2024 HYDROCARBON ENGINEERING 64
Measurement node Location
Table 1. Typical CCUS network measurement locations
Dr. Sameera Naib and Dr. Daniel Sandana, ROSEN, evaluate the challenges and threats to
consider when deciding whether to repurpose existing pipelines or build new pipelines for the transportation of carbon dioxide.
Carbon capture, utilisation and storage (CCUS) has long been recognised as a potential enabler for the global decarbonisation agenda. CCUS involves the capture of carbon dioxide (CO2), generally from large industrial sources that use either fossil fuels or biomass as fuel.
Planned capacities for CO2 transport and storage surged dramatically in recent years, with more than 370 million tpy of new CO2 storage capacity announced since January 2022, with similar capacities for connecting infrastructure.1 This is a positive outlook for the CCUS industry, signalling strengthened market conditions driven primarily by policy

implementation and coordinated alignment of the CCUS value chain stakeholders.
Historically, the majority of commercial projects have been the transport of (almost) pure CO2. Recent developments around blue hydrogen involve looking at transporting anthropogenic CO2 from process plants, for example the steam methane reforming (SMR) process, where various impurities could be present. Safety and reliability is vital when transporting CO2 from the location where it is captured to a storage site.
It is well known that pipelines are being extensively utilised for transporting CO2 all over the world. With a
March 2024 65 HYDROCARBON ENGINEERING
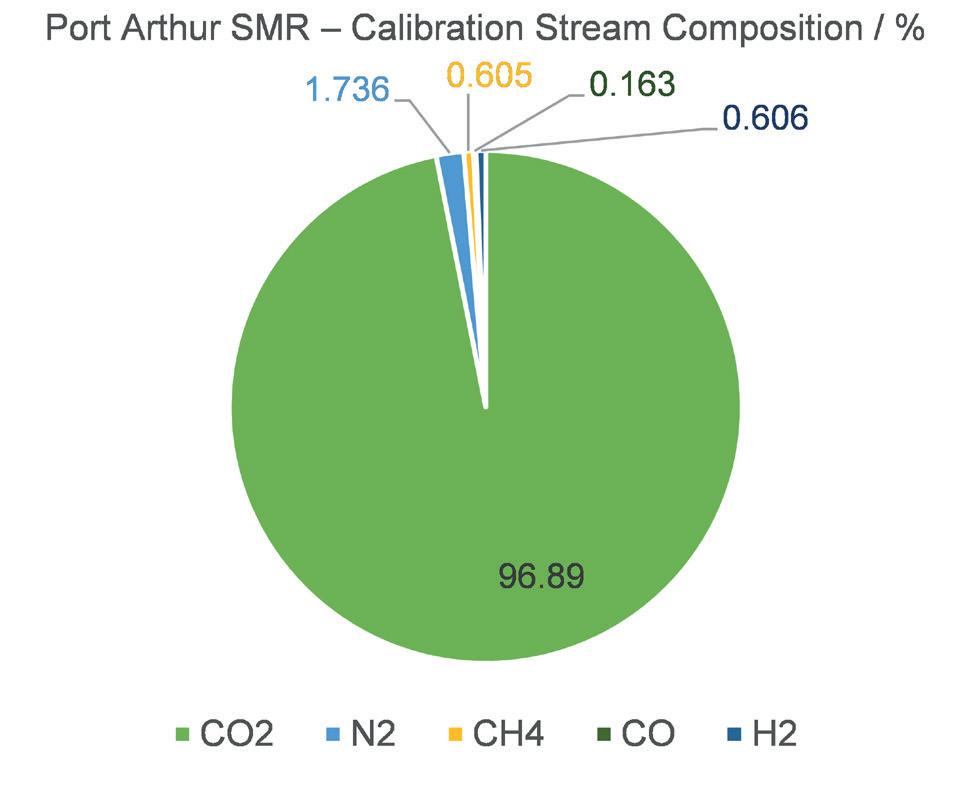
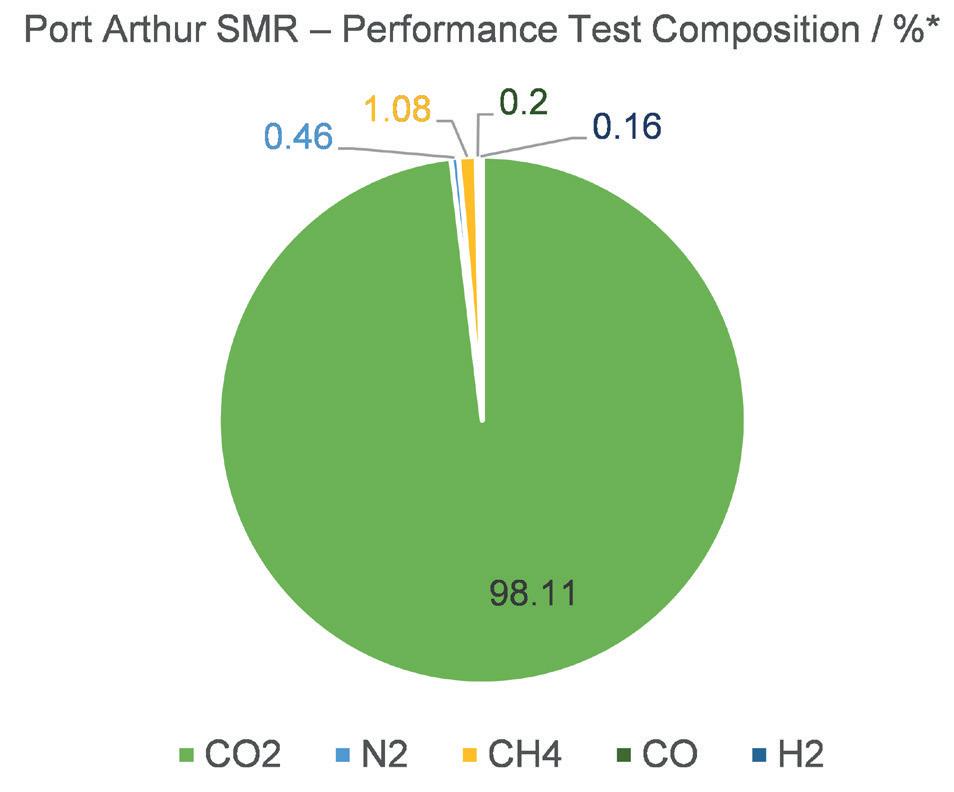
sudden increase in demand and production, the infrastructure owners need to choose between laying and constructing a new network, or reusing the existing network of pipelines and further understanding the integrity issues with CO2 pipelines.
Keeping all these aspects in mind, this article will provide guidance to asset owners regarding the key issues associated with anthropogenic CO2 pipeline transportation and conversion.
Eternal dilemma – the old or the new
Whether to construct new pipelines with the change in the flow medium, or reuse the existing network, is a constant dilemma for pipeline operators.
In many cases, utilising existing natural gas grids for hydrogen transport is four to six times more cost-effective than constructing new pipelines. In terms of OPEX between a CO2 transmission network based on repurposed natural gas pipelines, and a CO2 transmission network made up entirely of new pipelines, there are only limited differences.
It is likely that future CCUS projects will reuse existing hydrocarbon pipelines to a large extent. One can expect that the conversion to CO2 service will also take advantage of the existing offshore and onshore segments, to achieve storage at depleted reservoir fields, as is the case for projects such as Acorn in Scotland, Hynet in North West England, and L10 in the Dutch North Sea.
Factors to consider
In order to decide whether to reuse old pipelines, or to implement new pipelines along with their potential threats, it is important to consider certain factors. Transporting CO2 in pipelines comes with its own set of challenges. Though the transportation of CO2 in general is like other gaseous transport, specific aspects of CO2 and its production induces certain challenges. Therefore, it is important to consider the following aspects before undertaking the CO2 transportation:
n The CO2 composition and its impurities.
n Pipeline integrity challenges and threats.
n Managing conversion and integrity.
CO2 composition and its impurities
A multitude of impurities can arise from process plants, including SOX, NOX, hydrogen sulfide (H2S), carbon dioxide (CO), and hydrogen, and can enter the transported CO2 The type and levels of impurities present in the pipeline is dependent on fuel source, process generating flue gases and CO2 process treatment.
In the case of existing commercial CCUS facilities, there is limited data available on compositions or specifications of the CO2 streams derived from the SMR process. Nonetheless, the compositions of CO2 generated from the SMR process at Port Arthur were found (Air Products, Texas, US). This is depicted in Figure 1.2 The data confirms the presence of impurities in the stream, particularly CO. However, it has curiously omitted the presence of moisture (H2O) and H2S. Although desulfurisation usually takes place prior to the reforming process, a small amount in the orders of ppm vol. would be expected to leak through the CO2 stream and could be responsible for the presence of major integrity threats at the anticipated pressures in the transportation system. H2O, CO and H2S would also be considered and monitored within the CO2 stream post-SMR to manage the integrity of CO2 pipelines.3
Evaluating integrity threats
Pipeline material
For new pipelines, it is important to understand the threats associated with CO2 compositions and the consequent effect on the pipeline material used. Challenges include fracture control corrosion, flow assurance and operational issues.
Re-purposing existing infrastructure will involve the re-use of existing pipelines. Existing pipelines are generally manufactured from materials in accordance with API 5L/ISO 3183 (Figure 2). These existing pipelines are ageing. This means that they are either approaching, or have already exceeded, their original design life. They are likely to have been originally constructed in accordance with older steelmaking and manufacturing practices and will also tend
March 2024 HYDROCARBON ENGINEERING 66
Figure 1. Compositions of CO2 generated from the SMR process at Port Arthur (Air Products, Texas, US).

FTC filtration
FTC filters provide consistent effluent quality with the most predictable filtration of impurities as feedstocks change in renewable fuel production. Keep your cash cow flowing with reliable pre-treatment of your catalyst feed.
Beef up your filtration system. And eliminate unplanned shutdowns.
100% USDA PRIME
713.849.0849 ftc-houston.com
keeps your cash cow flowing
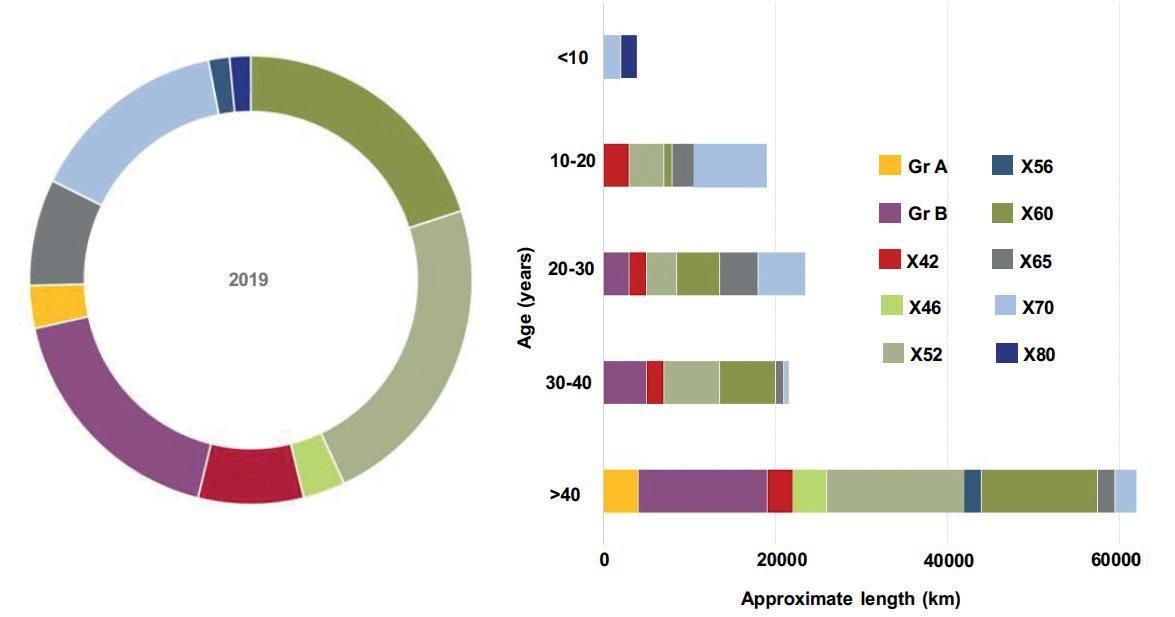
Cracking and fracture
Transgranular stress corrosion cracking (SCC) of steel is a common occurrence in the CO2-CO-H2O system. The presence of H2O is critical for the incidence of cracking. An increase of the CO activity in CO2-H2O systems increases the susceptibility to cracking, i.e., the crack growth rate is greater, and the minimum initial stress that is to be applied for SCC occurrence is lower.
to be made from lower grades of steel than their modern equivalents.
There are no recognised international standards dealing specifically with CO2 pipelines, except for some recommended practices. Re-purposing of existing infrastructure for CO2 assumes that existing pipelines are suitable, or can be made suitable, for CO2 service. However, there are various material-related factors that must be considered.
To ensure that pipelines can safely be converted, time-dependent threats such as ageing and degradations could lead to loss of containment in dense CO2, and therefore need to be identified and managed accordingly.
Ageing and degradation
To manage the long-term integrity of CO2 pipelines, pipeline engineers must understand the nature of the degradation mechanism(s) they are potentially faced with. In many respects, the management of time-dependent threats in CO2 pipelines is fundamentally an extension on the knowledge and experience gained through the traditional oil and gas industry. The main difference is that in ‘traditional’ gas production, CO2 is mainly an unwanted by-product or impurity, while for CCUS, CO2 is the primary fluid being transported. Therefore, CO2 will likely be at a higher partial pressure and may have its own inherent impurities, leading to a higher risk of internal corrosion.
For oil and gas infrastructure, a simplified rule is generally accepted: that the risk of internal corrosion in transporting facilities will remain low, as long as no free (separated) water phase is present. This means that an effective mitigation of internal time-dependent threats for CO2 pipelines is to keep the water content below saturation levels, or its solubility limits in the CO2 stream. Operators of existing CO2 pipelines in the US generally impose a strict water level specification, below 50 ppm, which is usually considered to be effective for full dehydration. Operators must understand their specific situation and the need to implement control over these threats.
The presence of H2S can lead to different types of sour cracking, mainly sulfide SCC and hydrogen-induced cracking (HIC). These threats and their respective mitigation requirements have been well documented in the oil and gas industry, particularly through the standard NACE MR0175/ISO 15156. If a CO2 pipeline is expected to see significant levels of H2S during service, sour resistant steels will need to be considered in order to prevent catastrophic failure of the pipeline.
CO2 pipelines are more susceptible to long running ductile fracture (than natural gas pipelines) because the CO2 will be transported in its dense phase, and more importantly because of the specific decompression behaviour of dense CO2 to a two-phase mixture.
The principal concern for the required mechanical properties of CO2 pipelines is generally considered to be related to the control of fracture propagation, and particularly how preventing (or arresting) a long running ductile fracture will be achieved. The means of averting propagating ductile fractures consists of specifying a line pipe with a sufficiently high toughness and/or fitting of mechanical crack arrestors at regular intervals along the pipeline length. Due to the presence of these ‘impurities’ in SMR-generated CO2 compositions, it will therefore be necessary to understand the expected composition envelope in deriving the suitable fracture toughness requirements.
Managing the conversion
One of the major challenges associated with re-purposing existing pipelines for CO2 service is ensuring the material properties, particularly toughness, are adequate to prevent long running ductile propagation. Other construction data will also be required as part of the evaluation of the suitability to conversion. This means that pipeline duty holders will need to have suitable documentation of pipeline and material ‘DNA’.
Another factor which needs to be considered is that most of the existing hydrocarbon pipelines have been in service for more than 30 years and are close to, or beyond, their original design life. Original design and construction documentation and mill test certificates are likely to have been lost, or to be incomplete.
March 2024 HYDROCARBON ENGINEERING 68
(a) (b) 8% 8% 18% 3% 20% 23% 3% 15%
Figure 2. Steel grades in natural gas transmission in Europe (a) 2019 distribution vs (b) age.
BELIEVING SEEING IS
Take a look at our ABC Certificate. It shows our circulation has been independently verified to industry agreed standards. So our advertisers know they’re getting what they paid for.
ABC. See it. Believe it. Trust it.

www.abc.org.uk
Additionally, there is no mandatory requirement for toughness testing. Consequently, there is no guarantee that the old lines will meet the CO2 required fracture control material-related criteria, due to the evolvement of steelmaking and manufacturing practices. Therefore, the operator has to decide on the criteria and requirements based on thorough research and understanding.
This means that intelligent targeted linepipe material sampling strategies will need to be deployed to access the materials key ‘DNA’ parameters, for example, toughness and strength. In-line inspection (ILI) technologies could play an important role when such approaches are taken.
For example, RoMatPGS can provide a direct, valuable picture of the pipe steel grade properties and material and construction differences, from which targeted cost-effective sampling strategies can be made.
There are major operational challenges in deploying an ILI tool in CO2 service. They are summarised below:
n Chemical degradation and explosive decompression due to interaction with dense CO2
n High wear in dry environments.
n Damage of electronic components due to the build-up of electrostatic charge on tools, as a result of movement of cups along the pipe wall in dry environment.
Although these challenges exist, they are not insurmountable and can be effectively managed through careful attention to material selection and tool design.
Conclusion
CCUS has not yet been implemented to the extent predicted 10 years ago, however, the underlying requirement for the technology remains. Indeed, the current interest and proposed investment in the hydrogen economy as an enabler for decarbonisation will necessitate the use for CCUS as part of the generation of ‘blue’ hydrogen. It is therefore an opportune time to revisit the integrity challenges associated with CO2 transport.
There is plenty of industry evidence that proves CO2 pipelines are an established ‘technology’ and can be safely managed by applying a due level of caution and mitigation, i.e., dehydration. This demands that water specification limits are well understood and defined in line with the pipeline operational framework.
Given the ongoing uncertainties referenced above, it would appear prudent for operators to consider each proposed conversion at a bespoke case-by-case level, with there being a potential need for project specific testing.
References
1. https://www.iea.org/energy-system/carbon-capture-utilisationand-storage/co2-transport-and-storage#tracking.
2. IEAGHG, ‘The Carbon Capture Project at Air Products Port Arthur Hydrogen Production Facility’, (2018).
3. GALLON, N., SANDANA., D., and ROBSON., P., ‘CO2 pipelines –back to the future?’, Technology for future and ageing pipeline conference (TFAP), Ghent, Belgium, (2022).

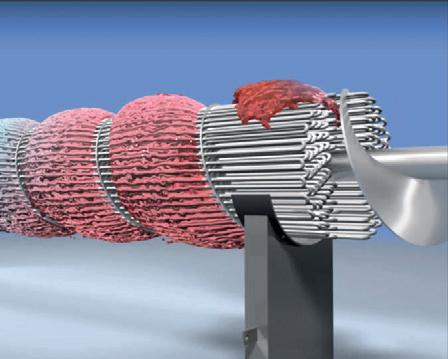


Klaus Reischl, SERO PumpSystems GmbH, Germany, highlights the important role played by side channel pumps in carbon capture and storage (CCS) processes.
Carbon capture and storage (CCS) is a technology designed to help reduce greenhouse gas (GHG) emissions. The process involves the capture of carbon dioxde (CO 2 ) from exhaust gases from industrial processes and power plants and its subsequent storage in geological formations. Due to their special
March 2024 71 HYDROCARBON ENGINEERING

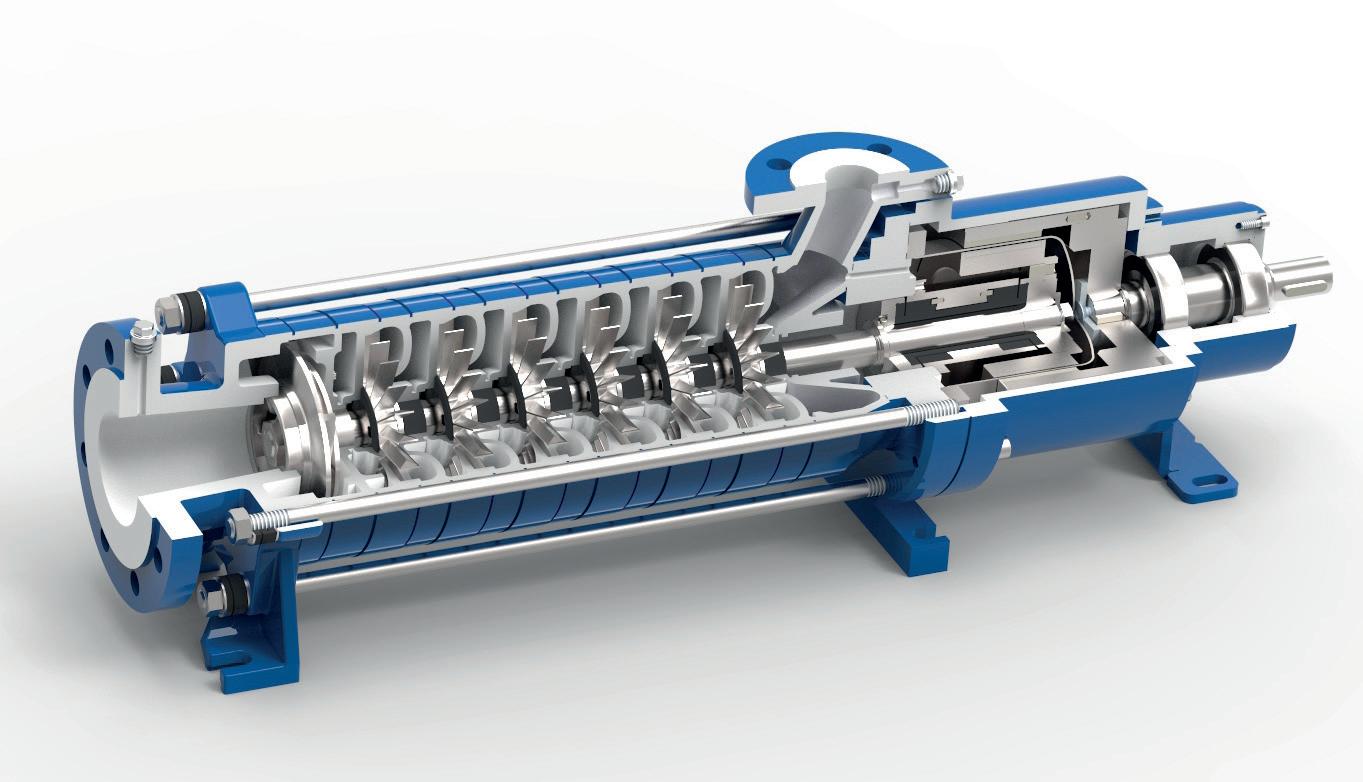
features, including very low NPSH values, large delivery heads, low-temperature resistance down to -60°C, and the tear-free delivery of two-phase flows with up to 50% gas content, CCS plant builders rely on side channel pumps when implementing CCS technology.
Technologies for the capture and storage of CO 2 make an important contribution to the decarbonisation of industrial processes. CCS plants are therefore currently being built primarily where GHGs are produced in large quantities in industrial processes, e.g. in power plants operated with fossil, substitute or residual fuels, in the chemical industry, in oil and gas refineries, in the cement industry, in iron and steel mills, and in the maritime industry. Another effect of capturing and storing CO 2 is the generation of environmentally neutral energy, e.g. in the production of blue hydrogen or the provision of liquefied CO 2 for heating purposes, for process engineering or in the
shipping industry. After the capture process, the CO 2 is fed into a compression stage where it is compressed under high pressure to around 100 bar so that it can be transported as a liquid phase to the point of use or storage. Pumps play an important role in the entire CCS process. Side channel pumps meet the necessary technical requirements to be used at several points along CCS infrastructure chains, from capture to transport, to permanent sequestration under the seabed in rock strata or in empty oil and gas fields.
Principle of the side channel pump
Side channel pumps have a number of features that provide benefits when used in CCS plants. Due to their self-priming operating principle and their holding pressure head – the lowest NPSH value is just 0.2 m – side channel pumps offer optimum integration possibilities. Extremely low inlet heads can be realised when taking off from a tank, which avoids special structural or design measures on the system. The wide speed range of the pumps makes it possible to adjust the delivery volume variably and, therefore, to pump liquid CO 2 or ammonia as a CO 2 carrier without pulsation. Another characteristic of side channel pumps is their large delivery head and very steep characteristic curve. Depending on the series and design, it can extend up to 1100 m.
Designed for high pressures and a wide temperature range
Side channel pumps operate under demanding process conditions in CCS plants. For example, they are designed and specified for high pressures of up to 100 bar – far more than the 15 bar that must be mastered in the transport and storage of compressed, liquefied CO 2
March 2024 HYDROCARBON ENGINEERING 72
Figure 2. The wide speed range of side channel pumps makes it possible to variably adjust the delivery volume and therefore to pump liquid CO2 or ammonia as a hydrogen carrier without pulsation.
Figure 1. CCS plants are currently being built primarily where GHGs are produced in large quantities in industrial processes.
They are also suitable for a wide range of media temperatures from -60°C to 220°C. Low-temperature fluids such as CO 2 and ammonia, which change from a gaseous to a liquid state at temperatures of approximately -57°C and -33°C respectively, can therefore be reliably transported because the side channel pumps are specially designed for this in several respects. Spring assemblies configured for this purpose compensate for thermal expansion, as well as contraction of the hydraulics, which occurs when the pump is filled by the pumped medium, or at standstill. Additional elongation inserts prevent temperature-related stresses in the pump body. The plain bearing is designed with a dimensionally optimised fit. Finally, special thrust washers minimise possible wear effects and ensure increased operational reliability.
Reliable performance in two-phase conveying
Another advantage offered by side channel pumps is their ability to maintain uninterrupted pumping performance even when gas components occur in the liquid CO 2 . If the pressurisation changes and media temperatures reach their boiling points, liquid CO 2 and ammonia tend to successively change to the gaseous state. In such a case, side channel pumps operate very reliably for a long period of time because they keep the flow rate largely constant even in the event of pressure fluctuations. They can even pump two-phase flows with up to 50% gas content without cracking. Problems due to possible vapour bubble formation and consequent effects on the delivery or metering rate are therefore reliably excluded.
CCS plant projects with side channel pumps
The advantages offered by side channel pumps in the capture and storage of CO 2 are already being used in various CCS projects and pilot plants. Among them is Wärtsilä Marine Systems, which is developing the industry’s first on-board CCS technology. As such, CCS presents an immediate opportunity for sustainable shipping. Through its collaboration with AxFlow AS, SERO PumpSystems has supplied pumps for the Wärtsilä test facilities.
Contributing to CO 2 -neutral processes
CCS helps to reduce CO 2 emissions and therefore actively contributes to sustainability. To this end, side channel pumps can play a significant role in the capture, transport and storage of CO 2 – and therefore in climate-neutral processes – as an important component in CCS plants. The advantages offered by side channel pumps in the capture and storage of CO 2 are hence already being used in various CCS projects and pilot plants.
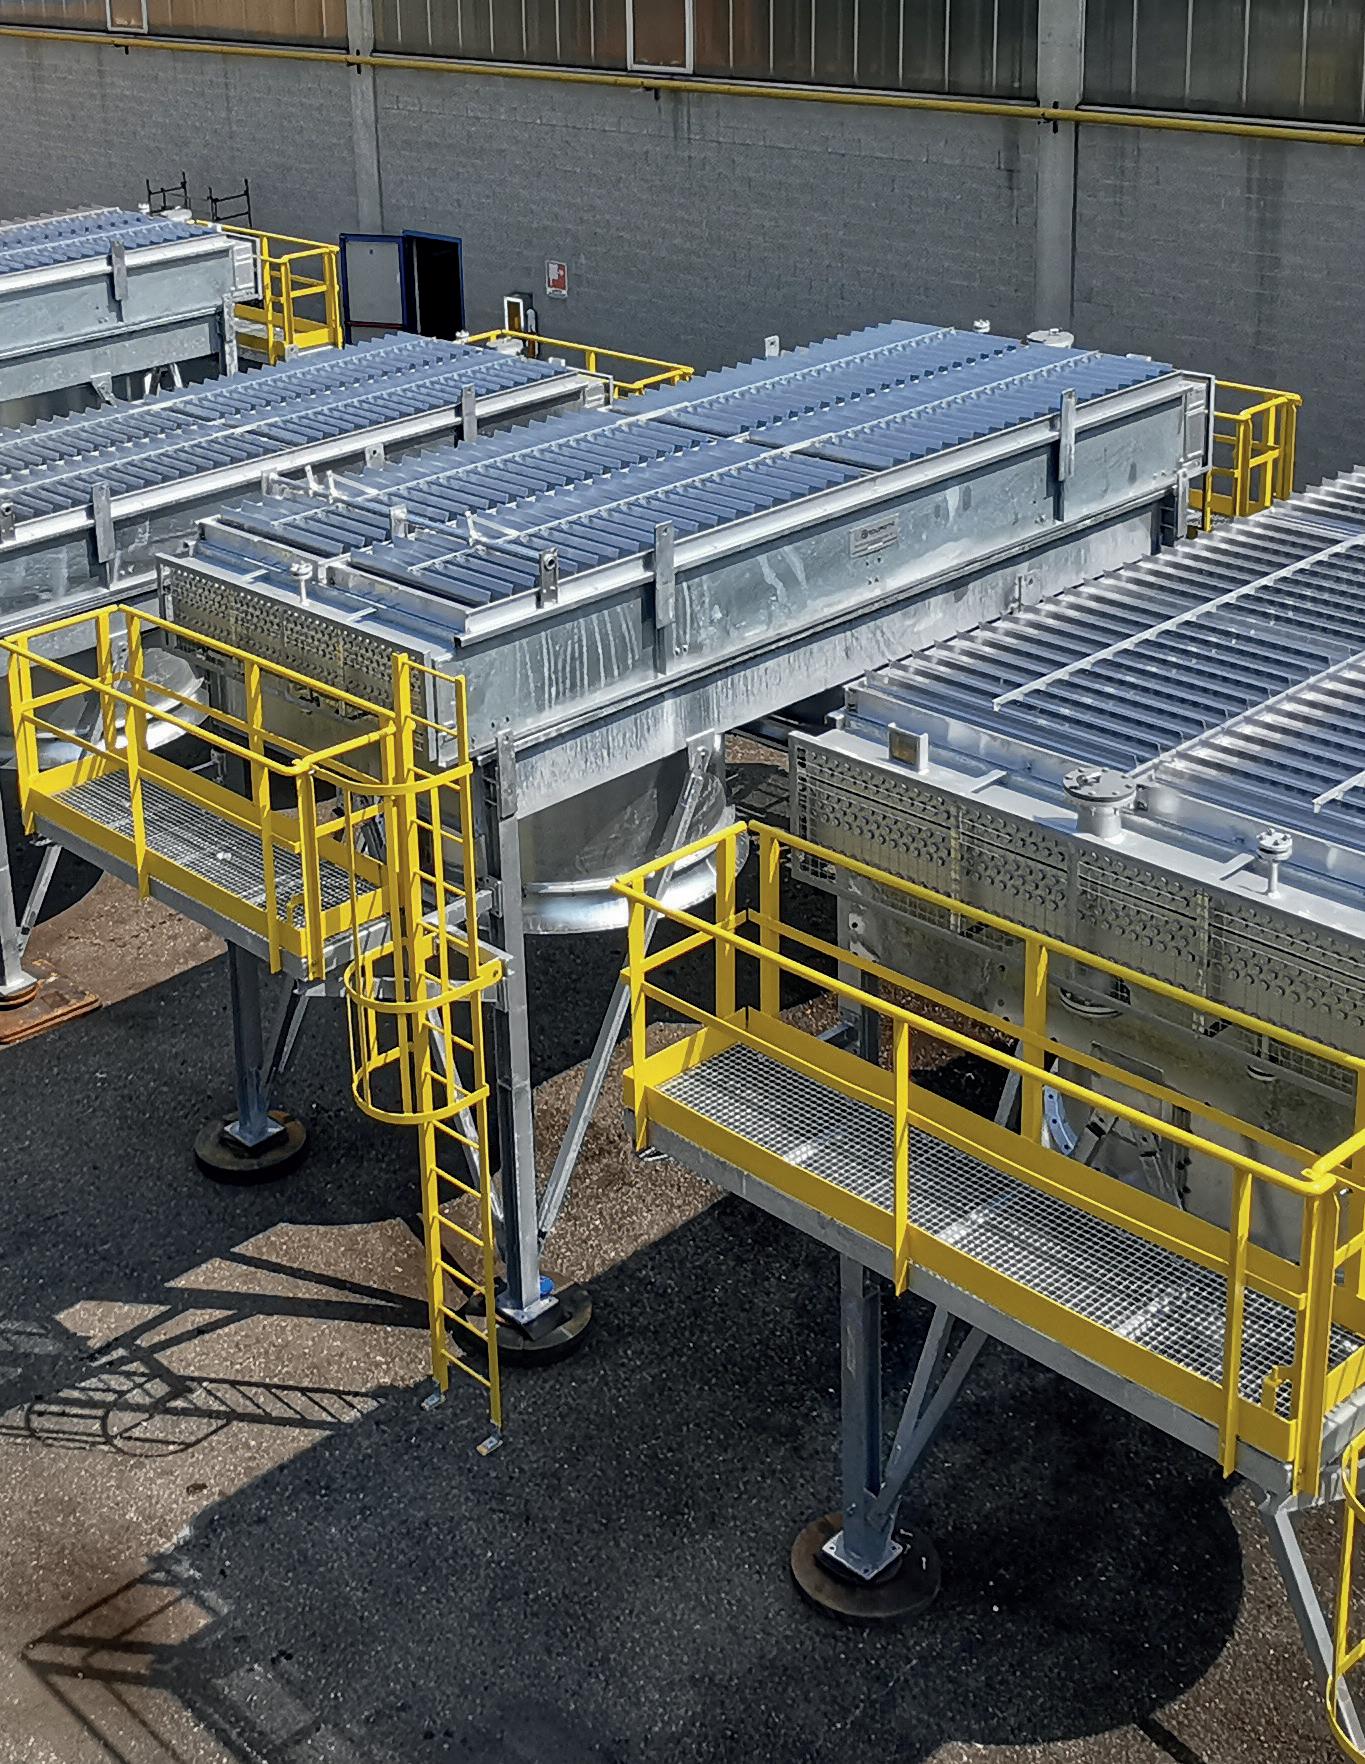

74 March 2024 HYDROCARBON ENGINEERING

Tim Gale, 1898 & Co., reveals why a change in the culture of engineering is required to achieve security of industrial control systems.
The evolution of industrial control systems (ICS) is marked by significant technological transformation, starting with the first relay-based systems and evolving into programmable devices like programmable logic controllers (PLC). Distributed control systems (DCS) have evolved from application-specific single loop controllers to multi-controller distributed systems. Now, the original proprietary networks of these systems have been replaced with open and interconnected architectures, and computers have evolved from proprietary interfaces to open Windows-based systems.
Advanced control and data integration have resulted in unprecedented gains in efficiency because of the convergence of industries and these digital technologies. This increased connectivity, while enhancing operational capabilities, has exposed ICS environments to new cybersecurity risks.
In the past, these risks were thought to be addressed through isolation of the ICS and obscurity of the technology. Without any possible remote access, tampering with these systems was difficult. As these systems were proprietary, knowledge of how they worked was limited to industry insiders. Currently, the typical ICS is highly connected with remote access, technology in the cloud, and widely dispersed users. Commercial off-the-shelf (COTS) technology, open networking and easily accessible information and training has made it easy to understand how an ICS operates.
March 2024 75 HYDROCARBON ENGINEERING


Events with colourful names such as Stuxnet, Industroyer, and Trisis have illustrated the possibilities for tampering with an ICS. New technologies and ICS architectures are required to secure these systems from malicious actors and software. These changes have not been quickly or easily adopted as industry is limited by resources, funding, and available technology support for existing ICSs that are, in some cases, up to 20 years old.
Challenges
The oil, gas and chemicals industries have unique challenges that add to the complexity of industrial cybersecurity (Figure 1). These processes are controlled by complex and interconnected basic process control systems (BPCS) and critical safety instrumented systems (SIS). A compromise of these systems may result in significant health, safety and environmental (HSE) events. Upgrading an ICS while in production is risky and downtime in these industries is costly with limited turn-around windows.
Adoption of significant ICS architectural changes and system-wide improvements in existing systems is difficult for these reasons. In many cases, the best opportunity for substantial and meaningful reduction of cybersecurity risk is during an ICS upgrade or migration (Figure 2).
What is often seen in new construction and ICS migration projects is the old way of purchasing an ICS. The functional requirements are specified: type of configuration languages, number and type of I/O, specifics of HMI requirements and so on. These types of functional requirements are important when designing an
ICS and getting it configured the way it needs to be for the end user.
Often though, there are no requirements given around security, meaning there is no base security specification issued at the time of purchase. If security is considered, it is near the end of the project when changes are difficult, depriving the end user of the optimal opportunity to achieve a secure and resilient ICS.
In addition, because security has not been considered during the preliminary stages of the project, there is limited or no opportunity to test any controls that are deployed. This can result in numerous vulnerabilities in an ICS after it has been commissioned and started up. That leaves the end user in the same predicament as outlined above where there is insufficient time and resources to implement improvements.
Cultural change
To overcome these issues, a new approach is required. This is one that begins to address the security and resilience of an ICS from the conceptual stage of engineering, all the way through testing and startup. Over the course of several projects, 1898 & Co. observed that these good practices can take companies a long way toward achieving security goals:
n Set base controls in a cybersecurity requirements specification (CRS). There are many standards to provide guidance including ISA/IEC 62443 and NIST 800-82. These should be used to define the minimum controls to be included in future projects. Treat them like any other requirements.
n Get the security manual from the vendor. This step can help ensure that any systems provided are secured in accordance with the manual.
n Use the CRS and the vendors security manual to develop cyber factory acceptance tests (CFAT) and cyber site acceptance tests (CSAT). As part of the procurement process, ensure that the vendor knows this testing is a requirement the same as functional acceptance testing.
n Carry out a risk assessment of the proposed design to identify any outstanding risk scenarios that require additional controls or changes to the design. Include any additional controls to the CFAT and CSAT documents to help ensure they are verified.
n Schedule adequate time for the CFAT and CSAT testing. These are dedicated events that can take significant effort. Document deficiencies and verify that the vendor has the resources available to fix them.
n In all cases, favour designing risk out of the system over adding on technology.
Security is not going to be designed into the ICS without end users demanding it. A change in the culture of engineering is required to achieve security and resilience in ICS from the start, not as an add-on. Health, safety and the environment are too important to keep security as an afterthought.
March 2024 HYDROCARBON ENGINEERING 76
Figure 1. Control systems are complex and interconnected between units and sometimes facilities.
Figure 2. New control system migrations or upgrades represent an opportunity to include security in the design.


STAYING AHEAD OF CYBERTHREATS WITH CRITICAL INFRASTRUCTURE THREAT
PROTECTION AND RESPONSE FOR THE OIL AND GAS INDUSTRY.


LEARN MORE


ISoni Malik, Alessandro Speranza and Rolando Gabarron, KBC (A Yokogawa Company), discuss how IIoT technologies optimise operations to improve efficiency and reliability.
nvestments in the oil and gas industry have been cyclical for decades, with waves of booms and busts. Each downturn has severely affected investments in new developments or retrofitting operating assets. Historically, the industry has adapted and recovered quickly. As new technologies have emerged, the industry has progressively adopted them to improve efficiency and stabilise production while reducing emissions.
Currently, energy costs are high while availability is low. Industry sources predict the global demand for energy consumption will steadily increase. This scenario emphasises the need for innovative solutions to meet the rising demands for energy.
A paradigm shift
Even while investments drop, technologies continue to evolve. The adoption of these disruptive solutions that boost automation and offer remote control capabilities are becoming more common. Simultaneously, there is a renewed focus on hybrid solutions that combine hardware and software. This includes blending the strengths from

traditional physics-based models with new data-driven techniques. The overarching goal is to improve automation and control, while enhancing overall safety and production. This is like the trend seen in other industries referred to as Industry 4.0, or digitalisation, or digital transformation.
In the oil and gas industry, digitalisation involves:
n Acceptance of cloud solutions.
n Cybersecurity improvements.
n Capability to support Industrial Internet of Things (IIoT) from the ground up.
n Interest in integrated solutions.
n The need to simplify work processes and improve productivity.
Forces behind digitalisation
What is the key to deciphering vast troves of data? A fresh data-centric approach is needed to bridge the gap between identifying problems and creating solutions. Past experiences highlighted challenges in extracting value from large datasets in the field that technology could not overcome a few years ago.
Now, operators recognise that large datasets collected in the field can reveal
March 2024 79 HYDROCARBON ENGINEERING
new paths to greater efficiency and safety while reducing greenhouse gas emissions. Furthermore, companies are moving toward digitalisation because they need to streamline work processes and increase productivity. The motivation behind this shift is fuelled by the capability to facilitate IIoT, since it enables real-time monitoring and optimisation. For example, obtaining insights on production behaviour enhances efficiency, as shown in Figure 1.
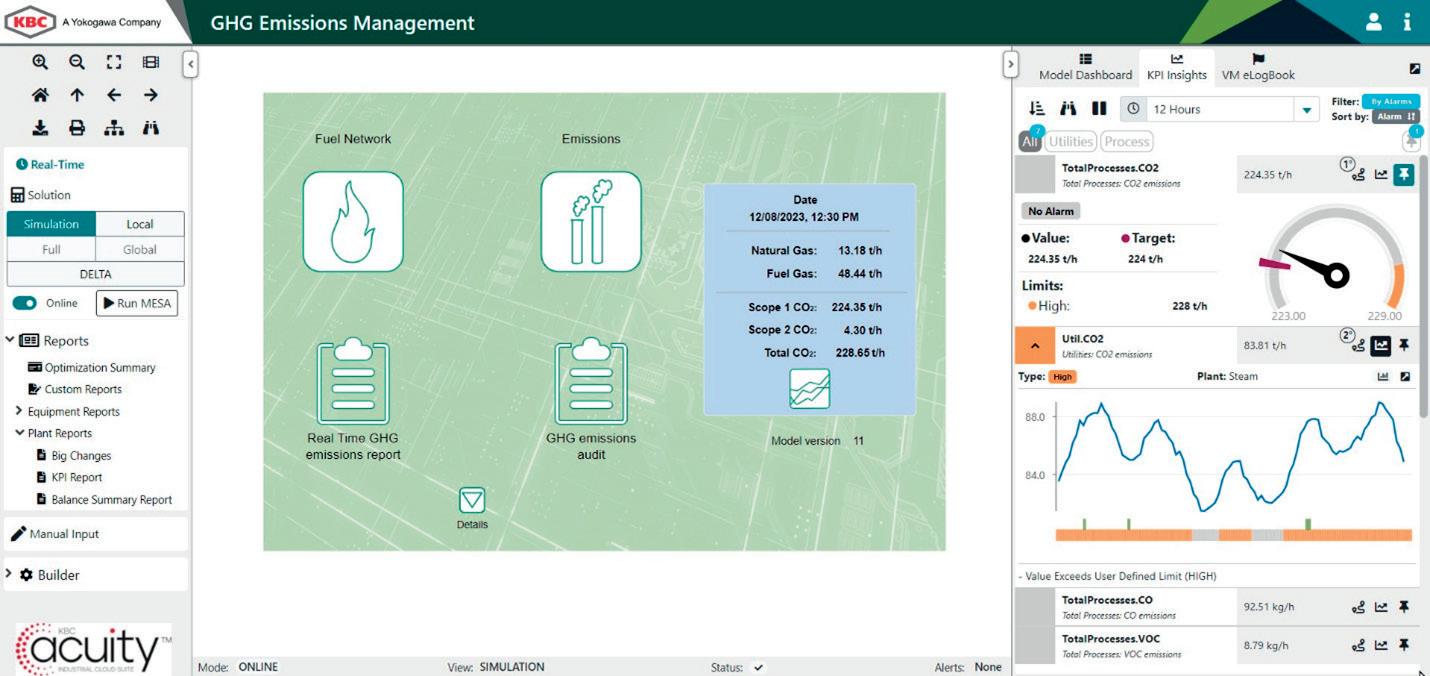


Digital twins
A ‘digital twin’ is a dynamic, virtual representation of a physical asset or system created using real-time data. This technology has already proven to have the potential to revolutionise the oil and gas industry, providing unparalleled insights into operations. In the complexity of process engineering, digital twins serve as virtual replicas of physical assets such as fluidised catalytic cracking units (FCC), reformers (REF), hydrocrackers (HCR), and delayed coker (DC) units. Digital twins enable engineers to run intricate ‘what-if’ scenarios, conduct profitability analyses, and perform optimisation studies with accuracy and efficiency. By using simulation tools, engineers can mirror real-time operations, thereby enhancing their understanding of the system’s behaviour under different conditions.
Digital twins are leveraged to establish an automated system that collects data and executes daily sets to run predictions. The automated system helps engineers continuously monitor the assets’ performance in real-time and make timely adjustments to optimise operations.
Digital twins help track model performance by comparing measured results from the plant against predicted outcomes. This comparison provides valuable insights into the accuracy of these models and helps identify potential areas for improvement.
Managing on-premise complexities
One of the use cases derived from customer feedback and surveys is the continuous struggle of maintaining the digital twins for zero value leakage.
Continuously tracking a model’s health requires a more rigorous system, given the need to manually analyse multiple datasets and KPIs. The goal is to ascertain whether the issue pertains to the model or data.
Maintaining the models’ digital twins and ensuring their accuracy for a large number of assets is a time and labour-intensive task. This task becomes even more daunting when factoring in the need for domain expertise to handle growing complexities within a unit. On the other hand, a lack of a single version of truth across business units or using dated models can negatively influence economic decisions, as different models of the same asset may not accurately reflect the current situation or potential future scenarios. This can lead to a disparity between planned outcomes and actual results. Such disparities can not only create internal confusion and miscommunication, but can also undermine strategic decision-making processes, ultimately impacting the overall performance and profitability of the organisation.
Overcoming this situation requires not only rigorous systems and processes but also the right mix of domain expertise and technological capabilities.
Integrated solutions
The acceptance of cloud solutions across various industries is fuelled by their greater flexibility, scalability, ease of deployment and maintenance, and increasing emphasis on cybersecurity. Like digitalisation, a significant driver for adopting cloud solutions is the ability to support the IIoT from the ground up. This growing interest extends to integrated solutions, including Data as a Service (DaaS),
March 2024 HYDROCARBON ENGINEERING 80
Figure 1. Advanced technology analyses datasets to uncover untapped opportunities.
Figure 2. AMM unlocks true value of digital twins.
Real Time Optimisation Planning & Scheduling Enhanced Unit Monitoring What-Ifs Real-time Health Scores Recalibrated & Retuned Digital Twin Performance Indicators & Data Quality Parameters Automated workflow orchestration tools Real Time Health Index Tracking Auto-calibration & Auto-tuning Evidence Package, Automatic Alerts & more Unites Data, Technology, Processes & People Rich data analytics Data intelligence & Insightful UI Elastic cloudfast & scalable Asset & Digital Twin HeadquartersGlobal Assets
Figure 3. AMM for data-driven decision-making and operational effectiveness at enterprise level.
Software as a Service (SaaS) and Solutions as a Service (SolaaS), as well as the incorporation of artificial intelligence (AI) and machine learning (ML).
So, what role do cloud solutions play in simplifying work processes, as well as boosting productivity for businesses working toward reducing emissions while maximising production and minimising operating costs? Ultimately, the adoption of new tools and technologies plays a crucial role in predicting failures and anomalies.
Cloud platforms facilitate ways to bridge the gap between data collection, transformation, and derive meaningful insights. An important element to achieve the company’s mission involves creating synergies among different personas and consolidating them via a single pane of glass. Now, data or interfaces from several different sources can be unified and presented in a single view.
This paves the way for democratisation of modelling and analytics, previously confined to specialists. New terms such as ‘enterprise platform’ take on a new and deeper meaning in this context.
Automated model maintenance (AMM)
An automated model maintenance (AMM) application is a SaaS designed to enhance the user experience via automating the workflows, as shown in Figure 2. Built on top of digital twin, the AMM web application consistently measures the health of a digital twin and recalibrates and/or retunes the digital twin of the process unit with a few clicks. Subscribers can monitor either one asset or multiple assets across various refinery sites and integrate the data and model performance analysis for each asset from one centralised location. This application delivers rich data modelling capabilities, offering users a platform to leverage advanced analytics to unlock powerful and meaningful insights about the data and the model. An updated digital twin when utilised in real-time optimisation, planning and scheduling, enhanced unit monitoring and ‘what-if’ scenarios aid decision-making and strategic thinking in process units.
The value achieved from using the AMM application helps reduce the time spent on monitoring the digital twin, as well as calibrating and tuning it when it deviates from actual operating responses. Moreover, with the models consistently maintained and updated, it is expected that the digital twin will produce more accurate results that can be leveraged to find missed opportunities. This can potentially lead to a significant potential for increased profitability.
Digital transformation at enterprise level
The emergence of advanced technologies is revolutionising how asset managers operate and track the health of their assets, resulting in a surge of rich data ready for analysis. Cloud infrastructure not only provides a scalable solution for data storage, but also facilitates big data analytics and intelligence that unites data, technology, processes, and people. The flexibility offered via cloud infrastructure is instrumental in fostering industrial autonomy via auto-calibration and auto-tuning, thereby supporting business growth, enhancing decision making agility and bolstering operational effectiveness to drive more value. Moreover, AI/ML techniques expedite data analysis and data-driven recommendations. When applied
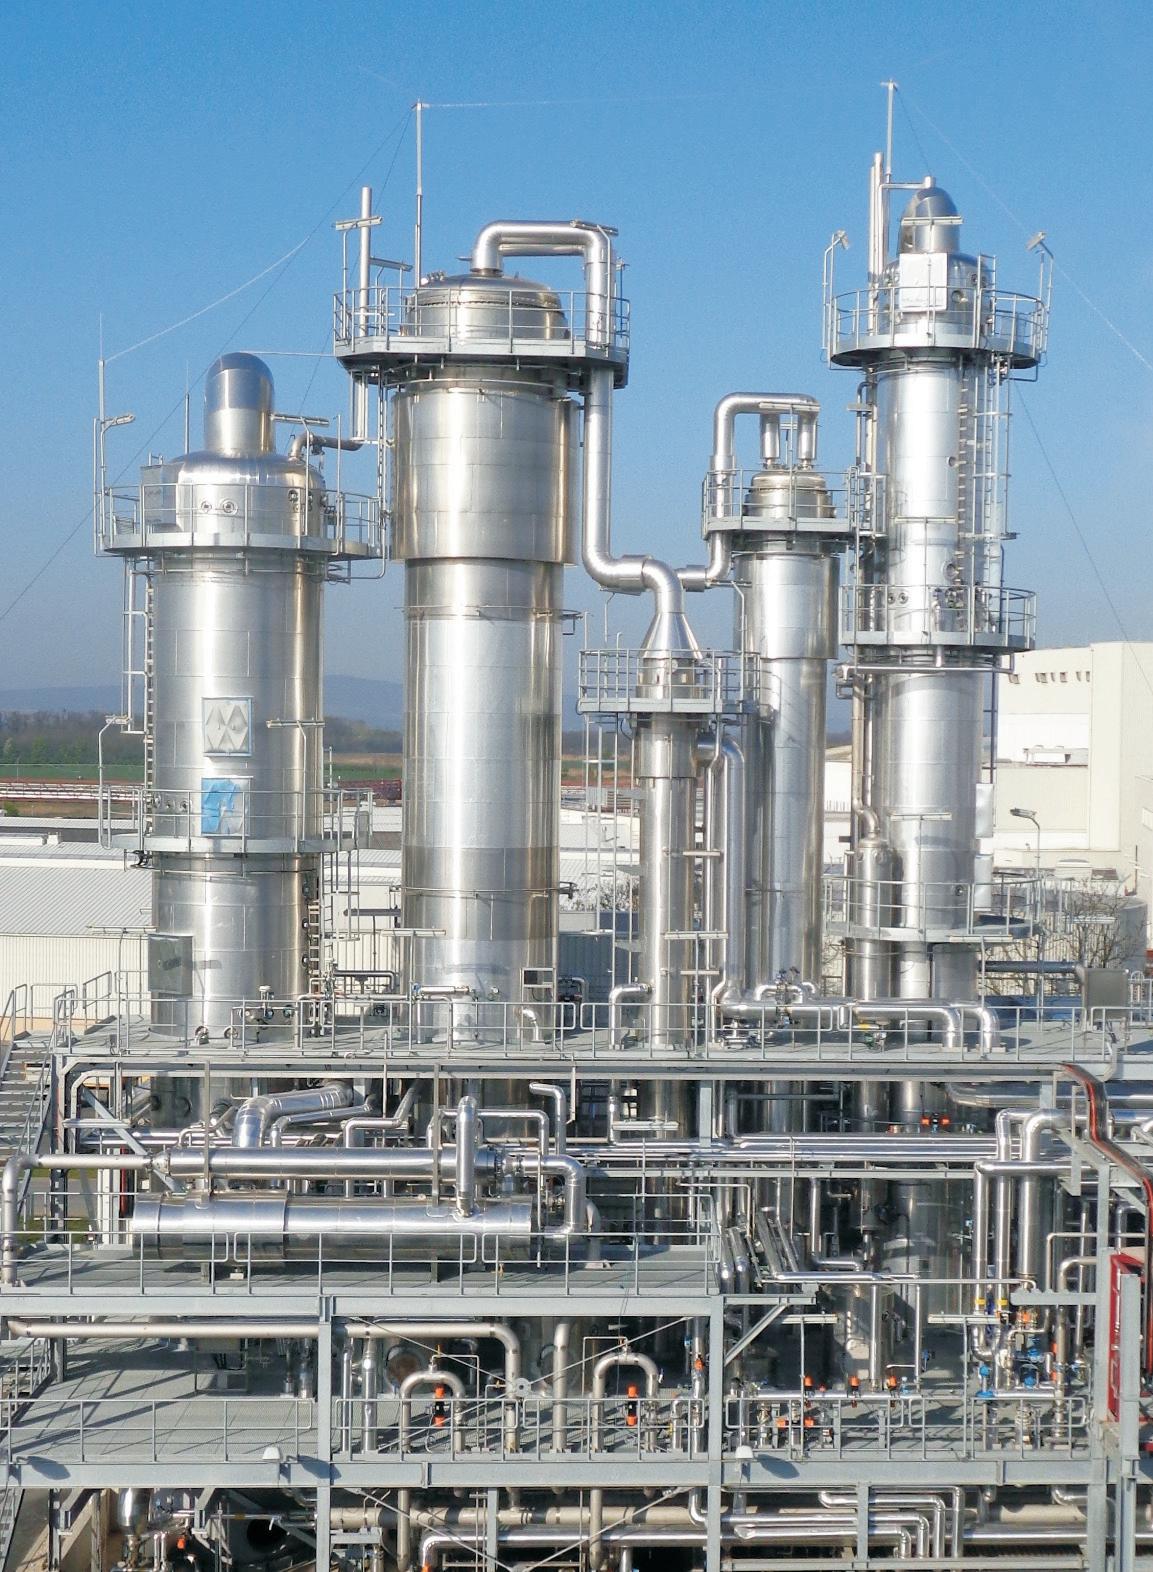
The leader in Energy Optimization.
GEA means worldwide recognized evaporation, crystallization and distillation plants, in-house R&D facilities, vast know-how and expertise. We develop and design multi-stage, TVR & MVR heated plant concepts tailored to your specific needs.
Get in touch today at gea.com/contact
with first-principles models and engineering expertise, these techniques help ensure that the system supports efficient decision-making and operational effectiveness, as summarised in Figure 3.
Companies are keenly aware of the need to invest in digital infrastructure and skills but are often restricted by budget or resources. Transitioning to a fully digital environment is complex; it requires robust security measures, data recovery strategies, strict compliance protocols, and effective environment management techniques.
Companies understand the value of data but express reservations about data management and utilisation practices. Transforming raw data into actionable insights requires significant time and effort. Along with digitalisation, change management strategies are required at the enterprise level to simplify software and technology via improved integration for adoption and scalability. The cloud-based services need to ensure that the user experiences a seamless transition from on-premise tools to cloud applications, particularly when transitioning from legacy tools. Moreover, first principles models are laying a solid foundation for automation. These models aid in analysis that can foster trust and facilitate effective decision making.
Overall, the effectiveness of the system ensures that current opportunities are fully exploited, and no promising opportunities are missed. It helps maintain the engineers’ focus on designated targets, while scanning for attractive opportunities that may demand their attention.

Conclusion
Identification, integration, and implementation of technologies can provide the scalable and agile approach needed to improve the operators’ ability to monitor and optimise assets. Transitioning simulation software to a fully cloud-enabled state makes it accessible via APIs. These solutions can then be easily deployed through an integrated SaaS platform. This scenario opens opportunities for seamless integration with data management, contextualisation, and visualisation technologies.
Leveraging a light and pervasive infrastructure, refiners are equipped to define and execute their digitalisation roadmap. By incorporating purpose-oriented and integrable modules, operators have access to a suite of practical tools that seamlessly integrate with existing systems. This malleable solution emphasises flexibility and cost-effectiveness that avoids the need for an all-encompassing commercial platform.
Looking ahead, the roadmap for digital solutions continues to evolve. Development plans include deploying additional analytics and capabilities tailored to detect production anomalies, leak detection, trend analysis, and optimising operation. As the scope expands, production, processes, energy availability, and greenhouse gas emissions will be managed and optimised across the facilities. The overarching philosophy remains grounded in full openness, with standard architectural solutions and APIs, to ensure integrability and ease of deployment. This commitment is designed to help operators achieve their goals of improved efficiency, reduced carbon footprint and enhanced control and automation.


Discover more at: www.refcomm.com Reasons to attend: Learn from 50+ technical presentation in the multi-track agenda Agenda covers coking, cat cracking, sulfur and SDA Network with a large audience of refiners and technical experts Develop practical solutions for optimising your coking unit with our fundamentals and advanced training courses Delayed Coking | Fluid Catalytic Cracking | Sulfur Production & Processing April 29 - May 3, 2024 • Galveston, Texas, USA ®REFCOMM Training, Conference & Exhibition 2024 24th Platinum Sponsors Silver Sponsors Bronze Sponsors ® 642 ATTENDEES 245 COMPANIES 233 REFINERS 80+ EXHIBITORS *Stats from Galveston 2023
Ivan Kovtun, Endress+Hauser, Switzerland, explains how leveraging advanced digital technologies can transform the efficiency of inventory monitoring in the oil and gas industry.
Efficient inventory monitoring in the oil and gas industry faces several challenges which can impact operational effectiveness and financial performance.
These include:
n Global supply chain complexity: the industry often operates on a global scale with extensive supply chains involving multiple suppliers, vendors, and logistics partners. Coordinating and monitoring inventory across these diverse and interconnected networks can be challenging.
n Complexity and variety: the oil and gas industry deals with a wide range of equipment, spare parts, chemicals, and materials. Managing diverse inventory items with varying characteristics, shelf lives, and storage

requirements can be complex. Accurate asset tracking and identification are particularly important for critical spare parts and equipment to avoid downtime.
n Sustainability and environmental considerations: with an increasing focus on sustainability, monitoring and managing environmentally sensitive materials and waste products in the inventory is becoming more important. Compliance with environmental regulations adds an additional layer of complexity. Ensuring that inventory management practices align with these regulations requires continuous monitoring and adaptation to changing compliance requirements.
n Fluctuations in demand and market volatility: the oil and gas industry is susceptible to rapid changes in market
March 2024 83 HYDROCARBON ENGINEERING
conditions that can lead to unexpected shifts in inventory requirements, making it challenging to maintain optimal stock levels.
n Remote and harsh environments: many oil and gas facilities are located in remote and harsh environments. Monitoring inventory in such locations can be difficult due to limited accessibility and environmental conditions.
n Security concerns: the industry is vulnerable to security threats, including theft and cyber-attacks. Ensuring the security of inventory data and the physical security of assets is crucial for preventing losses and disruptions. Addressing these challenges often requires a combination of advanced technologies, streamlined processes, and a proactive approach to adapt to changing market conditions and regulatory landscapes.
The perks of going digital
Key benefits of digitalisation in inventory monitoring for the oil and gas sector include real-time visibility and optimised operations: digital tools offer real-time insights into inventory levels, location, and condition. This enhances decision-making by allowing companies to respond promptly to changes in demand, supply chain disruptions, or any other operational challenges. Preventing overstocking the stockout helps to save

costs and to improve efficiency. Digitalisation also facilitates better collaboration, as well as improved coordination with suppliers and partners, therefore streamlining the supply chain and reducing lead times, which results in better overall supply chain efficiency.
Predictive maintenance also plays an important role when it comes to reducing downtime and improving the lifespan of critical assets. This proactive approach minimises the risk of unexpected failures and ensures smooth operations. Furthermore, continuous, and reliable process insights enhance data-driven decision-making: digitalisation provides a wealth of data that can be analysed to gain insights into inventory trends, supplier performance, and overall operational efficiency. This helps in making informed strategic decisions and enhancing plant efficiency.
Additionally, digital tools can monitor environmental conditions and ensure compliance with safety regulations. Automated systems can alert personnel to any deviations from safety standards, helping to prevent accidents and ensuring compliance with industry regulations.
Integrating advanced technologies, such as Internet of Things (IoT) devices and sensors, for real-time monitoring offer numerous benefits for plant operators. However, handling and analysing the vast amount of data generated from these technologies requires robust data management systems and an experienced partner to team up with – especially when it comes to integrating inventory monitoring systems with Enterprise Resource Planning (ERP) systems, where seamless communication between different software platforms is crucial.
Case study – optimising fuel storage
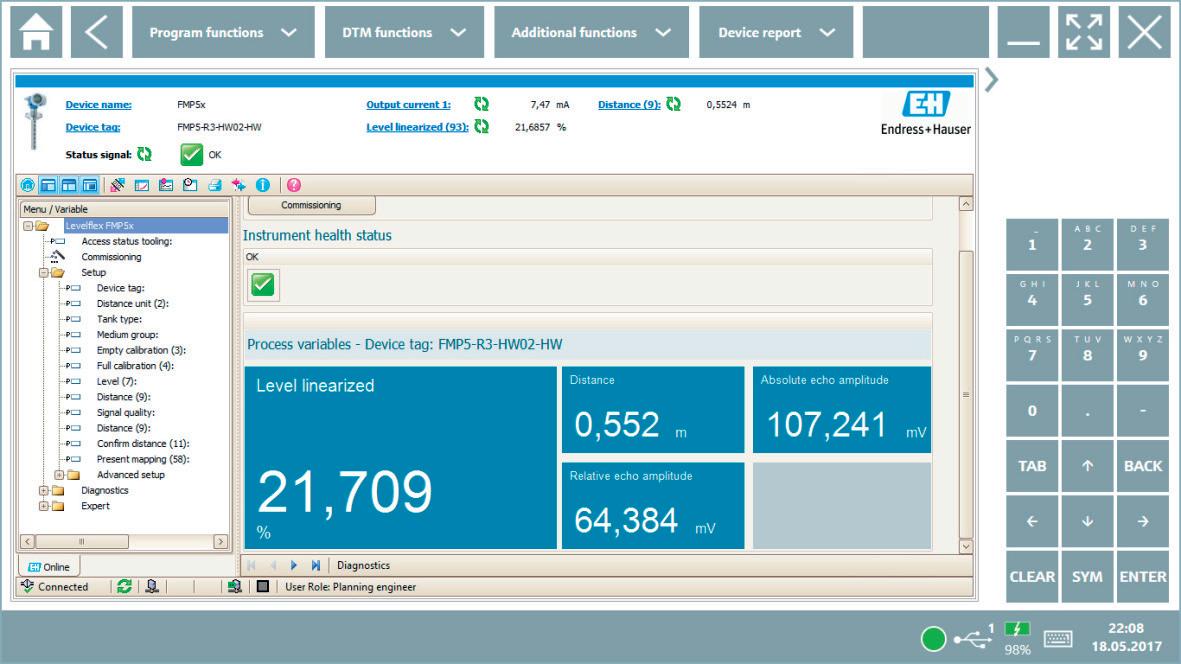
Grappling with the need to enhance efficiency and optimise processes, a fuel storage company started to look for the most efficient way to organise and enhance its inventory monitoring reliably. The customer operates running brownfield plants with fuel storage. Custody transfer and accurate inventory measurement of the fuel are organised with a tank gauging system that contains high-precision servo measurements and high-precision average temperature measurements. During the tank operation, instruments cannot be easily accessed for maintenance and calibration. Instrument reliability is therefore crucial, and redundant level measurements are often vital. This usually forces tank farms to be equipped with a second type of level measurement in addition to existing tank gauging systems. It is tedious to lay more cable on the running plant, while avoiding plant downtime and meeting requirements quickly – all in a hazardous location. Together with the measurement device manufacturer Endress+Hauser, a solution with free-space radar and WirelessHART connection was developed.
The implemented Micropilot is an 80 GHz free-space radar fulfilling the requirements according to the
March 2024 HYDROCARBON ENGINEERING 84
Figure 1. Reliable monitoring of tank level: FieldPort adapter on free-space radar.
Figure 2. Overview of level device configuration and health status.

NATIONAL INSTITUTE FOR STORAGE TANK MANAGEMENT NISTM 26th Orlando, Florida APRIL 3-5 2024 FREE TRADE SHOW www.NISTM.org | 800.827.3515 International 011.813.851.1700 • AST Conference Sessions • Free Trade Show • Golf Tournament • Co-Located Events • Free EPA SPCC & FRP Course • Welcome Reception • Network Mixers on the Trade Show Floor
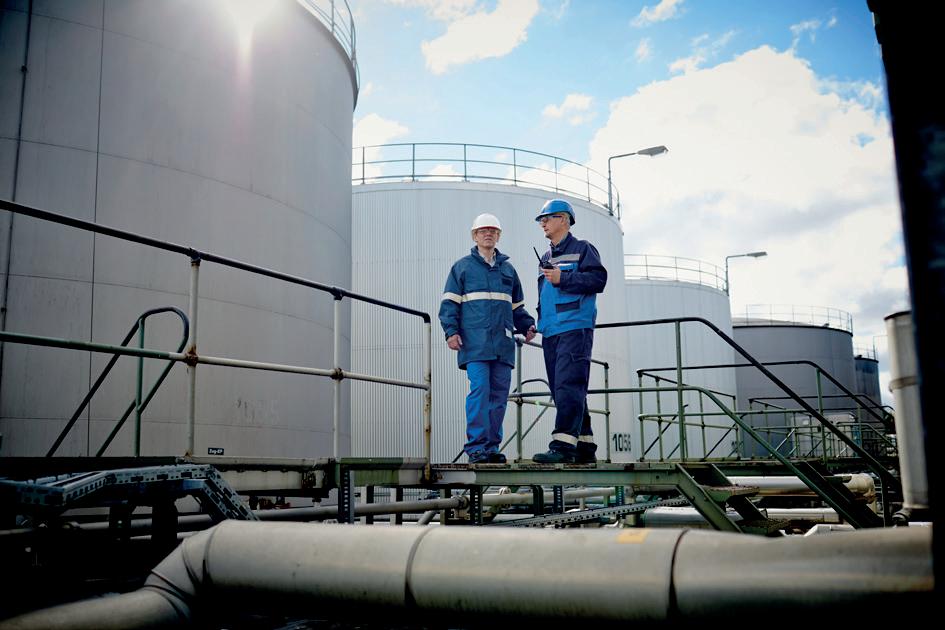
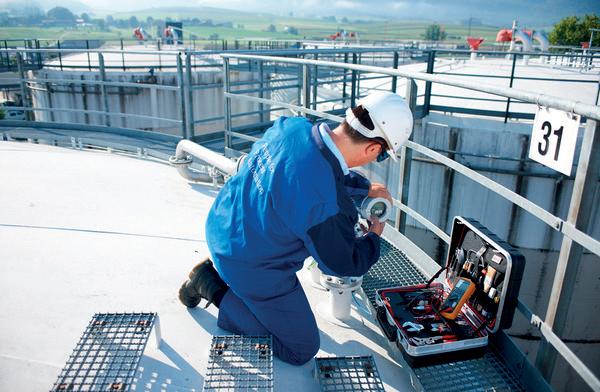
international functional safety directive IEC 61508, offering maximum reliability and a small beam angle. When it comes to measuring the level of aggressive liquids, this radar device is an excellent option due to its PTFE-filled and flush-mounted antenna. It can accurately measure levels within ±1 mm, making it ideally suitable for fuel level measurements. Additionally, it offers high beam focusing, making it ideal for use in vessels with many internal fittings.
The WirelessHART network was enabled by implementing various FieldPort adapters and a FieldGate gateway, which is suitable for remote monitoring or as a digital second channel by using extended information about measurements and/or diagnostic information. The FieldPort adapters have been connected to all installed Micropilot radars. They convert the HART output signal of the connected level devices into a reliable and encrypted WirelessHART signal. The radar’s and adapter’s power supply were organised from the existing tank gauge, saving the customer time and costs. The measurement data and diagnostic information from the free-space radar devices are sent to the WirelessHART gateway every 1 minute, and thanks to Modbus TCP communication protocol, the customer gains complete data insights for their inventory monitoring system. All mentioned devices fulfil requirements for installations in hazardous locations.
Before installation and commissioning of the devices, Endress+Hauser provided an extensive site survey service. Thanks to the information gathered during the site survey, the
project teams optimised the design of the WirelessHart network and chose the appropriate location for WirelessHART components. By prioritising a preliminary site survey, the WirelessHART project was executed more accurately, efficiently, and cost-effectively.
There are some recommendations that help to create a reliable network:
n Use of a battery-powered version of the FieldPort adapter as a repeater creating a mesh WirelessHART network and connecting all the adapters together for extended distances.
n There should be at least two neighbours for each FieldPort adapter. In case of a connection loss, the adapter can communicate via the alternative path.
n Avoid pinch points by ensuring that at least 25% of the adapters have direct contact with the gateway for proper bandwidth. Make sure that you have a buffer for the radio power in case of potential environmental influence on the WirelessHART network.
n Note that under certain conditions, it may be beneficial to locate adapters separately from their associated field device. This ensures better protection, minimising the impact of harsh environmental conditions on the adapters and improving radio signal quality.
In addition to WirelessHART connectivity, the FieldPort adapter supports a Bluetooth communication protocol. This function enables wireless access to the Micropilot radar for device configuration. It solves a common challenge for customers who cannot open the housing of the field device in hazardous areas. To overcome this challenge, customers can use an Ex-proof Field Xpert tablet to connect to the FieldPort adapters and the radars via Bluetooth. This makes it easier to access the device configuration and is also safer for the maintenance staff, as they can stay at a safe distance of 12 - 16 m from the device during configuration.
To collect data from the different locations, the WirelessHART gateway was connected to the edge device via HART-IP communication protocol and enabled access to the data via the IIoT solution, Netilion. Besides supply chain reasons, digital access to this information allows customers to control operational quality accurately and precisely – even remotely. By creating digital twins of level instruments in Netilion, the customer gained access to a digital file management service that optimises team operations, saves administrative work, and stores data for audits. Less time spent managing calibration protocols and similar documents means more time to focus on core tasks.
WirelessHART-based solutions have been used for a long time and have proven to be reliable, stable, and cost-effective for the digitalisation of industrial plants. In this case, the customer required flexibility and scalability – and gained it. Nowadays, WirelessHART-based solutions offer a large ecosystem and are utilised not only for monitoring purposes, but also for configuration and access to cloud solutions. Digitalisation in inventory monitoring for the oil and gas sector improves operational efficiency, reduces costs, enhances safety, and provides valuable insights for strategic decision-making. It is a key enabler for companies looking to stay competitive in a rapidly evolving industry.
March 2024 HYDROCARBON ENGINEERING 86
Figure 3. Smart devices enhance operational safety and enable remote access.
Figure 4. A service engineer performing maintenance on a tank level measurement device.
Aleix Monteso, Inprocess Technology, Spain, details the advantages of using digital twin technologies for plant optimisation.
Today’s society is growing and learning in a new era, the age of computing. At the same time, year after year, new generations of central processing units (CPUs) and graphics processing units (GPUs) are coming onto the market, all linked to different machine learning (ML) algorithms that are gradually being integrated into society.
Most of the algorithms in use today were created decades ago. They are becoming increasingly standardised and available to everyone. This is due to their open-source characterisation and their ease of use thanks to the low-code philosophy. Even so, the current difficulty is not in the complexity of the mathematical formulation, but rather in how to integrate the mathematics into the solution.

At the same time, the hydrocarbon industry is not lagging behind and more projects are emerging which utilise this type of technology. The industry is seeing that the technology can be profitable and applied quickly. This article discusses the digital twin (DT) applied in hydrocarbon processes. It will explain what these types of applications are and where they come from, and will explore different types of this technology.
What is a DT and where do they come from?
During production, the aim has always been to make inferences on process variables. This allows access to more information with which to make decisions. A simple economic balance of outputs
March 2024 87 HYDROCARBON ENGINEERING
minus inputs is already an inference of profit. However, this article will discuss the process and control part. Let us start with a very simple example: water boils at 100°C at atmospheric pressure. What happens if water is boiling at 110°C using a pressure cooker? With a single thermometer, we can know the pressure – in this case it would be 1.4 atm. A very common inferential in the hydrocarbon industry is the composition in distillation columns. In this case it gets more complicated. Let us assume a binary mixture, e.g. propane and propylene. What we know is, each tray of the column is boiling, so if we measure pressure and temperature on that tray, we can find out the composition of this mixture. This is because there is only one mixture boiling at that pressure and temperature.
While this sounds ideal, real plants are not that simple. There are always more components, the instrumentation does not work as it should, and there can be moments when operators are not in balance. In these situations, one must look for more
complex solutions. There are many options, and they all have their pros and cons. There are three main solutions:
n The first solution is to correlate directly with plant data. This has its merits, as it directly uses historical data from the actual plant. However, only using data is not always a good thing. This is because one can only correlate something that there is already historical data of. Therefore, the predictions will get increasingly inaccurate as they move away from the correlated data zone. To complete these regressions, conventional multivariate calculations can be used, such as the typical polynomial fit. Alternatively, ML model training can be taken.
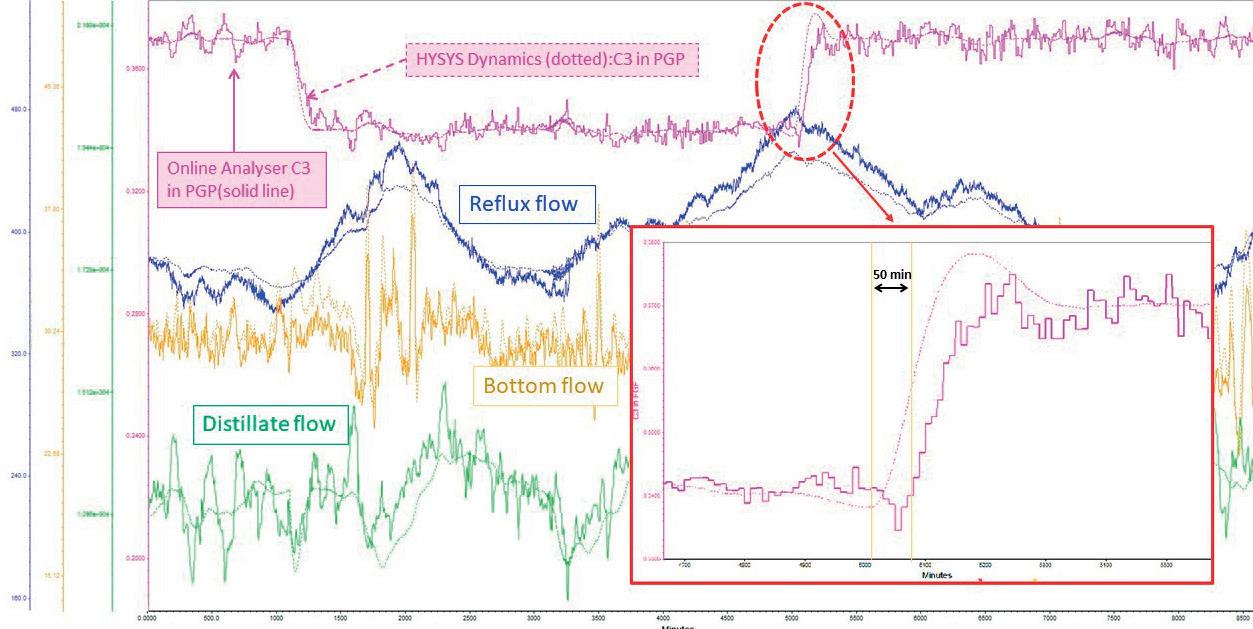
n As a second solution, commercial simulators can be used. These already include thermodynamic packages and most of the objects to be simulated. However, they will require a model to be built for the simulation. This model can be used to generate all the states in the plant (e.g. high, medium, low feed, high pressure, low pressure). This includes all the states that the process can have depending on the independent variables. With these results, correlations can be applied and the inference that the operator is looking for can be calculated. This will give better solutions than correlations which use only the historical data of the plant, since there will be more samples outside of the normal operation parameters.
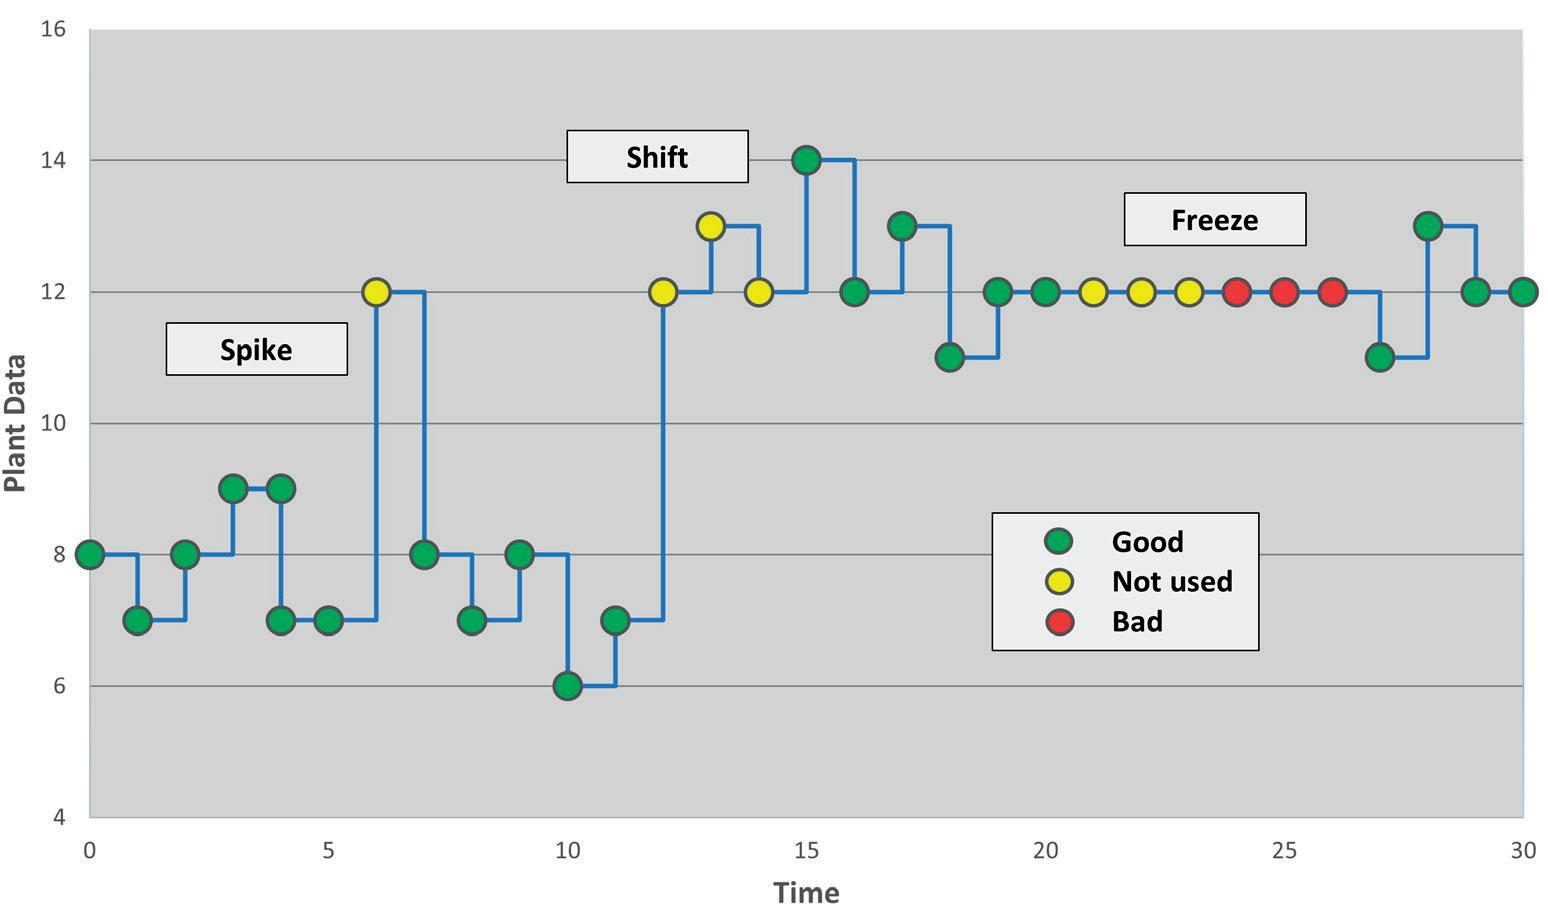
n The third (and most accurate) solution is to connect the model to the historical pipeline. This model can be a dynamic or steady state, depending on whether the operator is interested in transitions or not. This consists of feeding the model with all the inputs. These inputs are mainly process variables (PV), set points (SP), outputs from controllers (OP), laboratory data and online analysers. This DT of the plant is the most accurate and
March 2024 HYDROCARBON ENGINEERING 88
Figure 1. Comparison of data: digital twin data (dashed) and plant data (solid).
Figure 2. Graphical description of some data processing in the digital twin inputs.
2024

Conference & Trade Show

May 6-8
HOU TX
ILTA 2024, the leading conference and trade show for the bulk liquid terminal industry, is set to be our biggest yet!
Join thousands of terminal industry professionals from around the world for:
Inspiring keynotes plus in-depth educational sessions featuring expert speakers
The ILTA exhibit floor packed with hundreds of industry solution providers
World class networking including a special celebration of ILTA’s 50th anniversary
All in Houston, TX—the Energy Capital of the World!
ilta.org
Register Now!
will give the operator more scope for optimisation and control. The only problem with this is that unlike the other solutions, it is necessary to build a more complex model and integrate it into the plant system.
For example, in a distillation column, it is interesting to know the composition of the distillate and the composition of the bottoms for its correct operation. But beyond that, the price of an online analyser project can be around €500 000. Moreover, an online chromatograph takes samples every 10 - 15 minutes and is also affected by the dead times of the tubbing. This means that a lot of control and optimisation margin is lost, especially in continuous processes that run non-stop for years.
At the same time, inferences are not only used for operators, but more usually for advance control applications. They tend to be widely used in predictive variable controllers (MPC). These are very well integrated in the industry as their implementation is relatively feasible and usually gives good results. Finding key hidden variables and replacing controlled variables with more optimal ones can improve control and production.
How is a DT developed from a dynamic model?
DT projects have a similar development structure to MPC projects. As a first phase, it is very important to have a clear understanding of all the instrumentation and control in the plant and to make an analysis of the historical data to detect that everything is working correctly. For this step, simplified steady state models are usually developed as they allow the operator to close energy and material balances.
Once everything is clear, the independent variables of the process have to be defined. These variables are the manipulated variables (MVs) and the disturbance variables (DVs) – mainly those that will affect the process and depend on time (SPs, boundaries, OPs).
Thereafter, a dynamic model is built and validated with historical data (10 to 30 days and 5 - 60 seconds sampling).
With this model, it is possible to know how well the model fits and where to focus the efforts to match the simulation with the plant data. Figure 1 shows a model that has run with the plant data. The advancement of values in time compared to online chromatographic samples can be seen. Nowadays, as a result of computational power and with the help of automation algorithms, it is becoming easier to match these commercial models to historical plant data.
As the DT model is fed with plant data – which is affected by all the physical phenomena that can affect the instrumentation – it is necessary to make a treatment to ensure that the plant data is consistent. Usually, different transformations are applied to deal with instrumentation failures, spikes and noise (Figure 2). Plants and their behaviour are dynamic, so it is necessary to differentiate between the changes they undergo. On the one hand, the system has to be able to deal with unknown DVs, and on the other hand, it has to deal with physical changes in the equipment (e.g. fouling, clogging of equipment, failures). Therefore, it is important that the model reconciles and monitors these changes in real time. If the impact of an unknown DV is significant, the DT will not track the plant and in this case it is recommended to measure that paticular DV and potentially incorporate it into the MPC controller.
Some logic has to be applied to deal with certain plant scenarios, for example, switching from pump A to pump B, starting parallel trains or the shutdown of the plant. Finally, with the model already developed and tested, the variables to be exported are defined and connected to the realtime database of the plant. A subsequent validation is carried out with the system connected, first in open loop to monitor, and then in closed loop with the MPC to optimise, as shown in Figure 3.
Benefits
DT technology offers a number of benefits, including the following:
n Inferential: the DT can calculate pressures, temperatures, flow rates and compositions for each stream in the plant, or for each tray in a column. This data can be used by MPC controllers or operators, or backed up by online analysers.
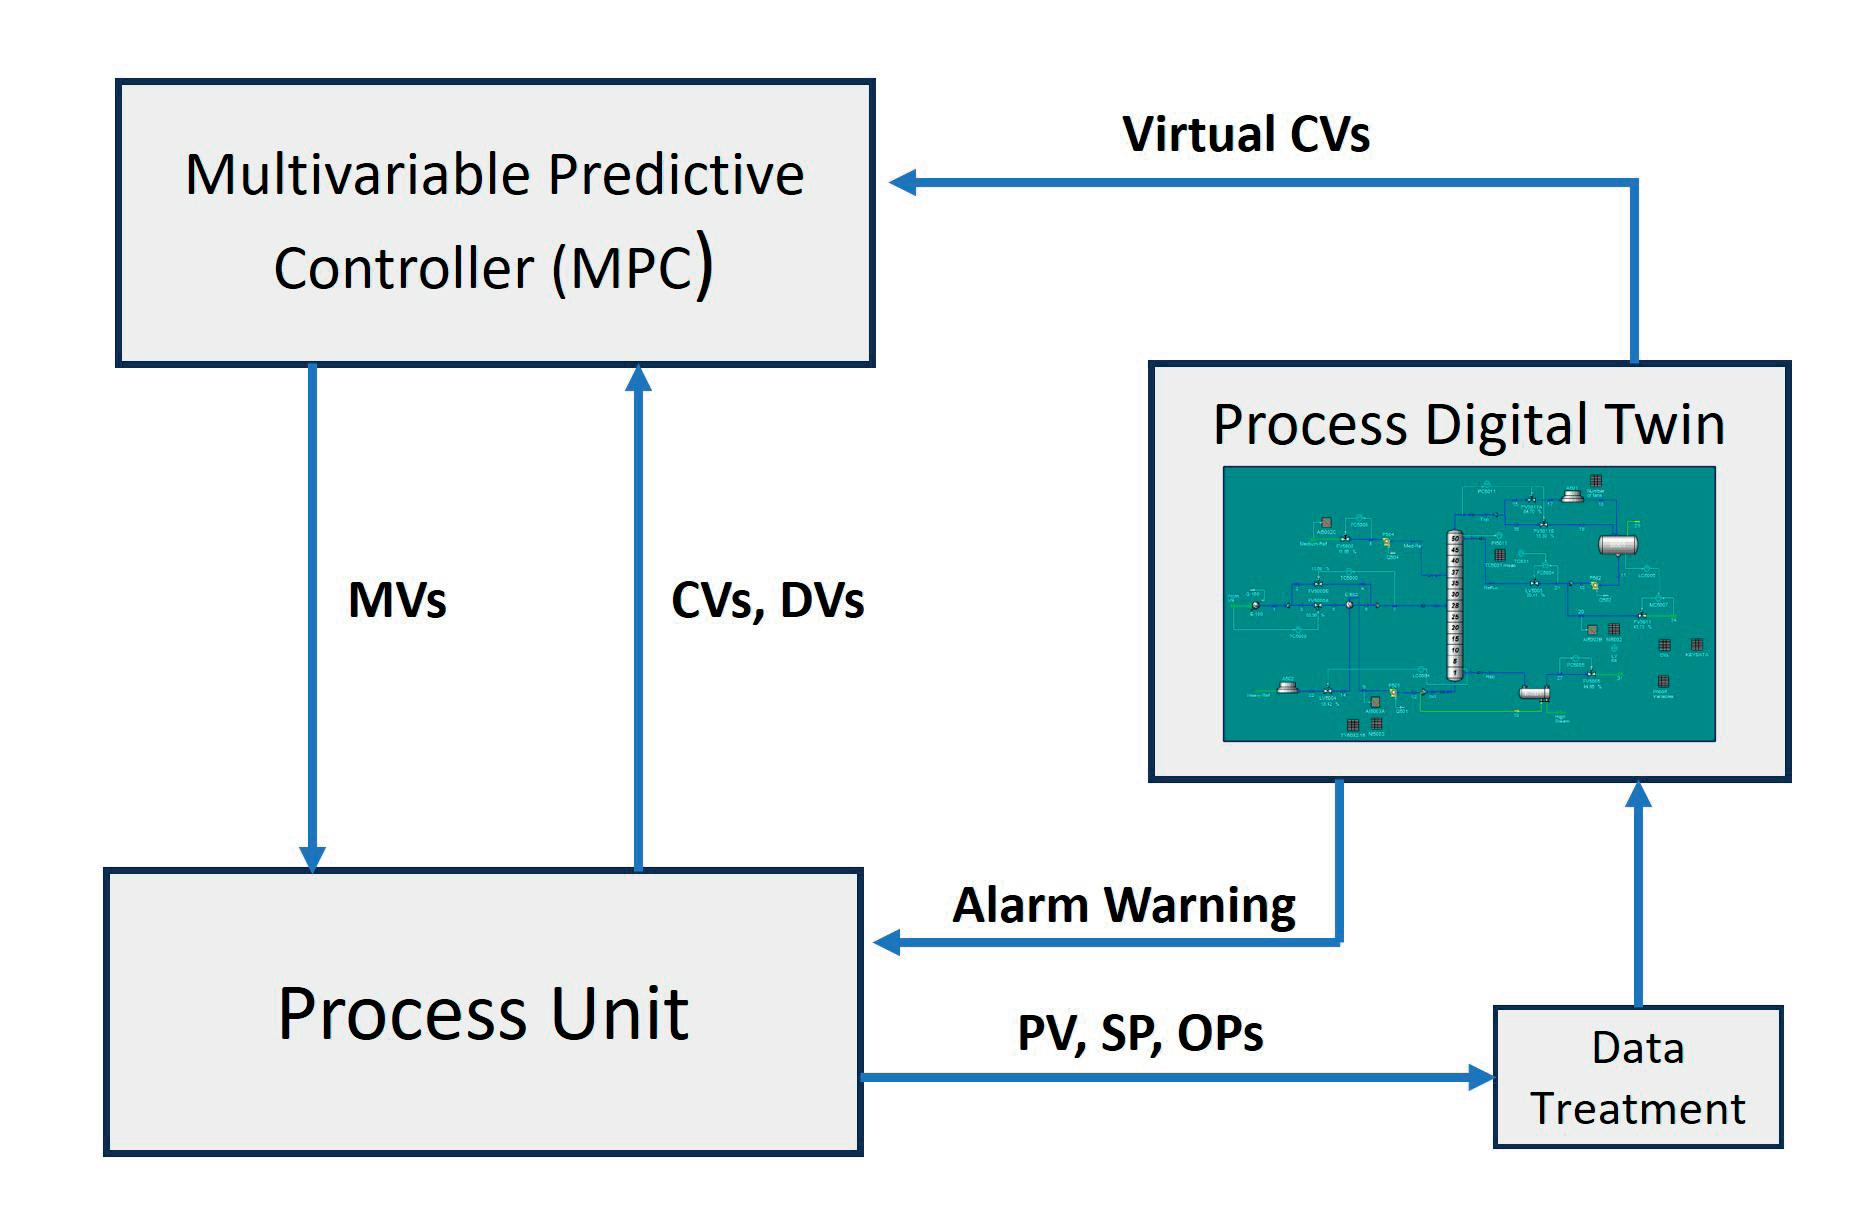
n Alarm warning: having a first principles model as the basis of the DT calculation allows operators to have a comparison between what should happen and what actually happens in the plant. With this insight, operators can predict if the process and instrumentation is operating efficiently.
n ‘What if’ scenarios: DT always operates in the current state of the plant and can therefore be used by engineers to evaluate a change (e.g. set point, control parameters,
March 2024 HYDROCARBON ENGINEERING 90
Figure 3. Simplified flow diagram between an MPC, DT and the process unit.


ASIATURBOMACHINERY & PUMP SYMPOSIUM 2024
EXCHANGING IDEAS. IMPACTING THE INDUSTRY.
Taking place in the fastest-growing market for energy, oil and gas, and manufacturing, the Asia Turbomachinery and Pump Symposium (ATPS) is the ideal training and networking opportunity for professionals in the pump and turbomachinery industries.
Connect with more than 1,100 delegates, engage with leading suppliers, witness product demos, and receive expert answers to your technical inquiries. We look forward to seeing you in Kuala Lumpur!
ATTENDEE INDUSTRY TYPES (2022)
1,100+
ATTENDEE JOB DESCRIPTIONS (2022)
Senior Management — 26%
Professional Engineer — 24%
Student — 22%
Sales — 17%
Technical/Engineering Support — 5%
Marketing/Conventions/Admin — 3%
Product Development — 3%
TOP
HOSTED BY
•
• USA • JAPAN • INDONESIA • INDIA
COUNTRIES: MALAYSIA
SINGAPORE
14 – 16 MAY | SHORT COURSES: 13 MAY | KUALA LUMPUR CONVENTION CENTRE, MALAYSIA
#ATPS2024 REGISTER TODAY! ATPS.TAMU.EDU Chemical/Petrochemical — 4% Education — 8% Manufacturing/Repair — 8% Oil/Gas — 38% Other — 9% Power — 3% Water — <1% No Response — 30% 5% 3% 3% 26% 24% 22% 17% 30+ EXHIBITING COMPANIES 30+ COUNTRIES REPRESENTED
EXPECTED ATTENDEES 80+ TECHNICAL SESSIONS 38% 30% 9% 3% <1% 4% 8% 8%
equipment parameters, boundary conditions) before it is actually taken in the plant.
These types of projects are currently new in the industry and are being applied in different areas of the hydrocarbon sector. One of these applications is at the start of greenfield plants. Once the plant has started up, there are many unforeseen events and it is likely that equipment may not be working as designed. This can be due to multiple reasons including control settings, diferent boundaries, process anomalies, etc. Through DT, operators may be able to detect these errors, correct them, or leave them planned for future implementation of improvements. This is an application that allows the detection of these problems in a fairly simple and fast way, meaning operators can avoid living with these problems for years (as plant myths) until they are eventually realised and resolved at a much later date.
MPCs work by controlling a series of controlled variables (CVs) in a zone defined by an upper limit and lower limit. Most of the CVs in MPC controllers typically correspond directly to the plant instrumentation and online analysers.
Some of the CVs are labelled as ‘critical CVs’, meaning that the MPC switches off if any of these fail. The DT can provide backup values for these critical CVs. At the same time, there are situations where it is interesting to have CVs that are not measured in the plant in order to optimise. As previously mentioned, it is difficult to quantify the optimal instrumentation needed in the plant. For example, a deethaniser distillation column can have different control philosophies. The objective is always the same: to separate between C2s and C3s. But depending on the process, the reboiler duty will be increased to
avoid C2s in the bottom or, on the contrary, the condensation will be increased to avoid C3s in the head. This creates a situation where operators will have to decide what to increase and what to sacrifice. Normally, operators only have online composition analysers where they need to meet the product specification. With a DT, operators can infer composition that is not measured and, therefore, control the column in the most optimal way.
The dynamic model of the DT is also used to perform other offline tasks. One of these tasks is to improve the performance of MPC applications. The dynamic models are used to calculate the true process gains (CVs vs MVs/DVs) for the whole operation range of the plant. With this data, the APC engineer can define the best MPC solutions (models validity, models multipliers, multiple models, etc).
Another task is to use the dynamic model to generate virtual data to train deep reinforcement learning (DRL) controllers. This virtual data is provided for the whole operational envelope of the plant, and the data is not contaminated by unmeasured plant perturbances or noise.
Conclusion
New technologies are allowing well known dynamic process simulators to have even more potential than they currently have. They allow more robust systems to be built, which are more powerful and can have new useful functionalities. The prediction of plant behaviour, the improvement of safety, and the maintenance of equipment are critical points to which more resources are being dedicated continuously. DTs are an extremely valuable tool which can be used to improve the operation of plants and provide assistance to plant issues.
March 2024 HYDROCARBON ENGINEERING 92
Page Number | Advertiser 77 | 1898 & Co., part of Burns & McDonnell 69 | ABC 25 | American Petroleum Institute (API) 91 | Asia Turbomachinery & Pump Symposium 59 | Axens 15 | BASF 73 | Boldrocchi 55 | Catalyst Trading Company 53 | Crystaphase 43 | Curtiss-Wright EST Group 51 | Endress+Hauser 02 | Eurotecnica 67 | FTC 81 | GEA 63 | General Atomics Electromagnetics 10 - 11 | Halliburton Multi-Chem 04 | Honeywell UOP 89 | ILTA 35 | KBC, A Yokogawa Company IBC | Merichem Technologies 09 | Moxba Metrex 85 | NISTM 19 | Optimized Gas Treating, Inc. 32, 60, 78 | Palladian Publications 82 | RefComm 48 | REMBE® GmbH Safety+Control 29 | Rotoflow, an Air Products business 37 | Sabin Metal Corp. IFC | Selective Adsorption Associates, Inc. OBC | Solenis 17 | Sulzer Chemtech 06 | Topsoe OFC, 31 | UNICAT Catalyst Technologies, LLC 23 | Vega 70 | Watlow 47 | W. R. Grace & Co. 39 | Zwick Armaturen GmbH AD INDEX

Yellow, meet Green.
For 75-plus years, Merichem has been a leader in sulfur treatment technologies, providing safe and eco-friendly solutions to remove H₂S and mercaptans from both liquid and gas streams. Whether it’s customized or standardized, we handle it all—from consultation and engineering to fabrication and support.
merichem technologies

The experts in sulfur reduction and removal.
www.merichemtech.com