Introducing MagAFS, our latest break -through in Advanced Filtration System (AFS) technology. Designed for unmatched nano-particle removal, MagAFS utilizes a patented magnetic design to efficiently extract ferromagnetic, para-magnetic, and diamagnetic solids from gas and liquid streams — protecting catalyst beds and optimizing performance.
NanoParticle Removal
www.unicatcatalyst.com/afs
21 Waste into wins
Maggie Pycherek, Alfa Laval, Canada, considers how operators can maximise efficiency in ethanol plants through waste oil recovery.
Shaking up global oil markets
Ng Weng Hoong, Contributing Editor, explores the turbulence in the Asian oil and gas markets, while considering the future of the industry in the region.
13 Boosting gas processing capacity
Anh Do, Shell Catalysts & Technologies, the Netherlands, investigates ways to assist gas processing plants to boost capacity and improve efficiency.
17 Transforming inlet separator performance
Tom Mazzacavallo, Nalco Water, an Ecolab Company, USA, shares insight on how gas processing facilities can build a proactive maintenance strategy with a comprehensive programme to ensure the performance of inlet separators.
25 A new approach to ammonia sampling
Matt Dixon, Swagelok Co., USA, examines how modern ammonia sampling enhances safety, accuracy, and efficiency.
31 Minimising flaring emissions
Jason Knudson, Baker Hughes Valves, USA, explores how pilot-operated safety relief valves serve as an emission abatement solution.
37 Electrifying the future
Atul Arunkumar Shenoy and Carles Miller, Burns & McDonnell, and Manish Verma, TMEIC, USA, review how early engagement in replacing steam turbines with electric motors and variable frequency drives (VFDs) can drive project success.
42 The rising star of electrification
Rasmus Rubycz, Atlas Copco Gas and Process, Germany, assesses the benefits that mechanical vapour recompression (MVR) technology could provide for heat generation.
45 Link by link: the hydrogen value chain
Jens Wulff and Dr David Franzen, NEUMAN & ESSER, Germany, analyse how having knowledge of the entire hydrogen value chain is crucial for providing the best solution.
49 High hydrogen combustion
Tim Tallon, AMETEK Process Instruments, USA, examines how optimising high hydrogen-fired combustion processes with catalytic flue gas analysis can aid efforts towards decarbonisation.
53 Scaling SAF
Scott Sayles, Pattabhi Raman Narayanan, and Jessica Hofmann, Becht, consider technological pathways for sustainable aviation fuel (SAF) and its role in the road to net zero emissions by 2050.
57 Staying aware of the situation
Christi Mezzic, Emerson, details strategies to improve operator situational awareness with high-performance graphics.
With stricter emissions regulations, refineries are seeking ways to minimise flaring while maintaining safety. On p. 31, Baker Hughes explores how pilot-operated safety relief valves (SRVs) can reduce emissions, prevent leakage, and improve operational efficiency. Discover how adopting these valves can help refineries meet regulatory standards while optimising costs and sustainability.
ET Black™ Technology
Cut your CO2 emissions by 50% with the future of carbon black production
Compliant and innovative
Meets stringent environmental regulations, keeping your business future-ready
Unparalleled flexibility
Produce all ASTM grades and specialty grades seamlessly in a single plant
Sustainable Uses thermal decomposition of aromatic oils for cleaner production
CONTACT INFO COM MENT
MANAGING EDITOR James Little james.little@palladianpublications.com
ADMIN MANAGER Laura White laura.white@palladianpublications.com
CONTRIBUTING EDITORS Nancy Yamaguchi Gordon Cope
SUBSCRIPTION RATES
Annual subscription £110 UK including postage/£125 overseas (postage airmail). Two year discounted rate £176 UK including postage/£200 overseas (postage airmail).
SUBSCRIPTION CLAIMS
Claims for non receipt of issues must be made within 3 months of publication of the issue or they will not be honoured without charge.
APPLICABLE ONLY TO USA & CANADA
Hydrocarbon Engineering (ISSN No: 1468-9340, USPS No: 020-998) is published monthly by Palladian Publications Ltd GBR and distributed in the USA by Asendia USA, 701C Ashland Avenue, Folcroft, PA 19032. Periodicals postage paid at Philadelphia, PA & additional mailing offices. POSTMASTER: send address changes to HYDROCARBON ENGINEERING, 701C Ashland Ave, Folcroft PA 19032.
15 South Street, Farnham, Surrey
GU9 7QU, UK
Tel: +44 (0) 1252 718 999
CALLUM O'REILLY
SENIOR EDITOR
Five years on from the start of the COVID-19 pandemic, it’s clear that the crisis has reshaped the way that we interact with the world. Remote work is no longer a perk but a norm for millions. E-commerce has tightened its grip on retail. Education has shifted into hybrid formats. Even our social habits have been reshaped by a new awareness of proximity and hygiene.
The pandemic pushed us into a digital acceleration that few would have predicted beforehand. Among the many technologies that surged in relevance – video conferencing platforms, mobile payment systems, and digital health apps, to name just a few – one quietly made its way from novelty into the mainstream: the humble QR code. Once a niche utility, overlooked and forgotten, the little black and white square became a symbol of contactless convenience.
I wrote about the surprising revival of the QR code back in 2020, in an editorial comment for our Tanks & Terminals supplement. At the time, the QR code had emerged from the digital wilderness to take centre stage in our social interactions, offering a gateway to restaurant menus, vaccine records, contact tracing, and touchless transactions.
There had been a time – years before – when the QR code had burst onto the scene. Flick through an issue of Hydrocarbon Engineering from the early 2010s and you will find it littered with QR codes. But their early mainstream use stumbled due to a number of reasons: smartphones needed third-party apps to scan the codes, data connections weren’t as reliable as they are now, and the user experience was often clunky. The big gamechanger for the technology was the ability to scan the codes using smartphone cameras (and a global pandemic, of course).
However, the QR code has a new nemesis that is threatening to damage user confidence: quishing. In a rising trend, scammers are using QR codes to direct users to malicious websites and carry out phishing attacks. Here in the UK, the national fraud reporting centre received 1386 reports of people being targeted in 2024 (up from just 100 cases in 2019). Contactless payment hotspots, such as parking meters and restaurant menus, are common targets for the criminals, who stick their own QR codes on signage in the hope of directing users to their websites and tricking them to hand over their bank details. Fraudulent codes have also been spotted on television and in email campaigns. In fact, back in May 2023, a major quishing attack targeted a US energy company. Attackers sent fake Microsoft emails that encouraged users to update security or enable multi-factor authentication. Scanning the embedded QR code led victims to a fake Microsoft login page, compromising over 1000 accounts.1
Quishing is just another cyberthreat facing the energy sector, and the case study above should serve as a wake-up call for the industry. The cyberattack bypassed many traditional email filters and capitalised on employee trust in visual prompts. In a sector as critical as energy, the incident highlights how urgently companies must adapt their cybersecurity strategies to match the pace of evolving threats.
Rest assured, all QR codes featuring in this issue of Hydrocarbon Engineering have been scanned and vigorously checked. You can use them to access a wealth of information from our advertisers, as well as register for one of our upcoming webinars (p. 20), download a copy of our EnviroTech supplement (p. 55), access the latest issue of Global Hydrogen Review magazine (p. 63), and listen to the Hydrocarbon Engineering Podcast (inside back cover).
Egypt | Contracts signed for phase 1 of Red Sea petrochemicals complex
Critical contracts for phase one of the Red Sea Petrochemicals Complex have been signed, marking a major step forward in Egypt’s industrial transformation.
The agreements were awarded to the Egyptian-Chinese joint venture responsible for executing the basic design work of the massive project located in Ain Sokhna.
The deal brings together major stakeholders, including the Red Sea National Petrochemicals Co., China
National Chemical Engineering Co., Ltd (CNCEC), ENPPI, and Petrojet. These entities will collaborate on developing the initial design blueprint for the complex, laying the groundwork for the project’s next phases.
Completing the design phase will allow for a more precise estimation of the project’s actual cost, an essential step toward securing the required financing and achieving financial closure, paving the way for construction to begin in 2026.
USA | Lummus announces acquisition of NAPCON and partnership with Neste
Neste has signed an agreement to sell its proprietary technology NAPCON to Lummus Technology.
NAPCON covers solutions in the field of interactive operator training simulators and game-aided learning systems, real-time process optimisation, artificial intelligence (AI) based process predictors, and real-time process information gathering, monitoring, and analytics.
“The acquisition of NAPCON’s digital solutions and continuing our partnership with Neste are transformative steps for Lummus,” said Leon de Bruyn, President and CEO of Lummus Technology. “This aligns with our strategic vision of combining cutting-edge AI-driven solutions with process technology to enhance the performance of our customers’ operations.”
Türkiye | Rönesans Holding set to invest in Turkish polypropylene
Rönesans Holding, one of Türkiye’s largest contracting and investment conglomerates, has closed the financing to progress the development of a major new polypropylene (PP) production plant and terminal facility, which will be one of the largest private sector investments in Türkiye.
This undertaking, valued at US$2 billion, is expected to boost Türkiye’s industrial self-sufficiency and strengthen its global trade position – reducing the country’s import dependence.
The development is comprised of distinct components financed separately by international financiers. The first is the PP production plant, being developed by Rönesans and SONATRACH (as a shareholder and feedstock supplier), with an annual production capacity of 472 500 t, meeting approximately 17% of Türkiye’s PP demand.
UAE | SAMSUNG E&A selected as contractor for PLA plant
SAMSUNG E&A has announced that it has been named as the contractor for Emirates Biotech’s upcoming polylactic acid (PLA) production plant in the UAE.
The strategic project, officially named Falcon PLA Project, will deliver a facility producing a biodegradable and environmentally friendly plastic alternative and solidify Emirates Biotech’s commitment to environmental responsibility and innovation.
SAMSUNG E&A was selected as the sole partner for this project, due to a track record of bringing these innovative but complex industrial
projects to fruition. In its role,
SAMSUNG E&A will oversee all engineering, procurement, and construction (EPC) work for the Falcon PLA project, ensuring that it progresses smoothly and aligns with the planned schedule and budget.
The pre-EPC contract, covering the initial phase of the collaboration, was signed on 14 April 2025 at Emirates Biotech’s head office in the UAE.
Emirates Biotech recently selected Sulzer as the technology provider for its PLA plant and SAMSUNG E&A will ensure the Sulzer technology and proprietary equipment will be
integrated flawlessly into the PLA production facility.
The plant, expected to be operational in early 2028, will be located in the KEZAD free zone in Abu Dhabi, a new industrial area with access to state-of-the-art transportation infrastructure including the deep sea port of Khalifa.
Emirates Biotech aims to accelerate the transition from fossil-based plastics to renewable, biodegradable alternatives, ensuring industries worldwide have access to high-performance, environmentally responsible solutions.
WORLD NEWS
DIARY DATES
19 - 23 May 2025
World Gas Conference
Beijing, China
www.wgc2025.com
20 - 22 May 2025
ESF North America
Houston, Texas, USA www.europetro.com/esfnorthamerica
4 - 5 June 2025
Valve World Americas Expo & Conference Houston, Texas, USA www.valveworldexpoamericas.com
09 - 11 June 2025
ILTA Conference & Trade Show
Houston, Texas, USA ilta2025.ilta.org
10 - 12 June 2025
Global Energy Show Canada Calgary, Alberta, Canada www.globalenergyshow.com
25 - 26 June 2025
Downstream USA Houston, Texas, USA events.reutersevents.com/petchem/downstream-usa
25 - 28 August 2025
AFPM Summit Grapevine, Texas, USA summit.afpm.org
09 - 12 September 2025
Gastech Milan, Italy www.gastechevent.com
16 - 18 September 2025
Turbomachinery & Pump Symposia
Houston, Texas, USA tps.tamu.edu
21 - 24 September 2025
GPA Midstream Convention
San Antonio, Texas, USA www.gpamidstreamconvention.org
USA | Ergon Refining expands
processing capabilities for production
Ergon Refining Inc. (ERI) has announced plans to expand processing capabilities at its Vicksburg, Mississippi, US, refinery to include gasoline production, which is expected to come online during 1Q27.
This expansion will enable the production of nearly 6000 bpd of gasoline to support the wholesale fuels market in western Mississippi and eastern Louisiana.
“This significant investment is another step toward living out our commitment to consistently
expand our portfolio of solutions to meet needs within the markets we serve,” said Lance Puckett, ERI President.
In August 2023, ERI announced the purchase of a fuels terminal in Vicksburg, adjacent to the refinery, where Ergon currently markets a full slate of gasoline and diesel fuel products. The expansion project at ERI will include pipeline infrastructure that connects directly to the terminal, significantly enhancing supply and fuels marketing capabilities.
The Netherlands | Neste begins SAF production at Rotterdam refinery
Neste has started producing sustainable aviation fuel (SAF) at its renewable products refinery in Rotterdam, the Netherlands.
The refinery has been modified to enable Neste to produce up to 500 000 tpy of SAF. As a result, Neste’s global SAF production capability has increased to 1.5 million tpy.
In addition to the recent modifications to the refinery, Neste
continues its strategic growth investment project in Rotterdam, which will more than double the company’s production capacity at the Rotterdam refinery to 2.7 million tpy of renewable products, making the refinery the world’s largest facility producing renewable diesel and SAF. This expansion will increase Neste’s total global annual renewable fuels production capacity to 6.8 million t.
Germany | Mabanaft and HIF Global accelerate e-methanol adoption
Energy companies Mabanaft and HIF Global have signed a heads of agreement (HoA) for the planned offtake of e-methanol, reinforcing their commitment to advancing carbon-reducing fuels for the shipping industry.
The initial offtake would be of up to 100 000 t of e-methanol produced from renewable electricity and captured CO2 per year.
The agreement outlines the starting point for negotiations to define the terms of a potential offtake contract. As HIF Global moves forward with the development of its e-fuels facilities, Mabanaft will further explore demand for different methanol applications jointly with its customers. In 2021, both companies signed a memorandum of understanding (MoU). This new document seeks to deepen collaboration.
INTRODUCING
Grace Essential Articles, Vol. 1
Grace is proud to present a meticulously curated collection of our most requested and referenced articles from the past four decades. For over 80 years, Grace has been at the forefront of FCC catalyst development, driven by innovation and a long history of looking ahead.
What’s Inside?
Timeless Knowledge:
Articles are presented as originally published, preserving authenticity and demonstrating enduring relevance.
Expert Insights: Grace experts provide introductions, reflecting on each article’s historical impact and modern significance.
Diverse Topics:
Explore key drivers of catalyst value, including traditional fuel production, on-purpose propylene, and the decarbonization value chain.
Get Your Copy Today!
Read or download Grace Essential Articles, Vol. 1 now and tap into the collective knowledge of the catalysis experts at Grace.
Ng Weng Hoong, Contributing Editor, explores the turbulence in the Asian oil and gas markets, while considering the future of the industry in the region.
Donald Trump would have been a formidable oil trader. Instead, he chose politics, became the President of the US (twice), and is now shaking up the energy markets on his way to creating a new world order.
At his second inauguration on 20 January 2025, Trump launched a national energy emergency programme to boost domestic oil and gas production, raise the country’s strategic oil stockpile, and end the US’s participation in the 2015 Paris climate agreement.
Asian allies will buy more US oil
To appease Trump’s anger over their ‘unfair’ trade practices, three of Asia’s four largest energy consumers immediately committed to import more oil and gas from the US. This will impact global trade flows as India, South Korea, and Japan, which collectively account for 30% of Asia’s oil consumption, will likely reduce purchases from their traditional suppliers in the Middle East and Russia.
The trio, together with Taiwan, imported a combined record 946 000 bpd of crude from the US in 2024. They share the same motivations to further increase the purchase of US fossil fuels over the course of Trump’s second term.
Firstly, as energy-deficient countries, they are heavily reliant on imports that the US is well positioned to supply. Secondly, the increased imports will help reduce their respective trade surpluses against the US. Lastly, they want a role in building up the US’s energy sector in the hope of winning Trump’s commitment to counter China’s expansionist activities in the region.
The Trump-Modi oil bond
India has become a key geopolitical and economic partner of the US over the past decade. The personal bond developed between Prime Minister Narendra Modi and Trump has carried over from the president’s first term in 2017 to 2021.
Oil has emerged as a surprising foundation stone in the building of the two countries’ bilateral ties, with the US sending crude to India, and refined products going in the other direction and to western Europe. India’s growing energy demand has coincided with the US’s rise as a major oil producer, thanks to its shale-based revolution.
By the time Joe Biden became the 46th president in January 2021, oil and gas was already “the cornerstone of bilateral trade” between the two countries, accounting for 15% of their merchandise trade, according to analyst Hari Seshasayee writing for the Wilson Centre.2
US crude exports to India hit a record of more than 420 000 bpd in 2021, up nearly 49% from the previous year, according to the US Energy Information Administration (EIA). That growth was all the more impressive against the backdrop of the world economy plunging into recession during the COVID-19 pandemic.
But 2021’s volume turned out to be the peak as India’s appetite for US crude fell sharply the following two years when Russia, overnight, became a competing supplier.
By offering huge discounts for its oil and other commodities, Russia’s export of crude to India surged to a record of 800 000 bpd in 2022, up from just 84 000 bpd the previous year.3
Table 1. US crude exports to South Korea, India, Taiwan,
and Japan (000 bpd)
threats to ‘reclaim’ the island. Taiwan has committed to increase energy imports and defence spending to pare down its trade surplus against the US which rose more than 3.5 times from US$18 billion in 2020 to nearly US$65 billion in 2024.
Source: Energy Information Administration.1
Russia was forced into a fire sale when it was hit by global trade sanctions organised by the US in retaliation against President Vladimir Putin’s military invasion of Ukraine on 24 February 2022.
India ignored the sanctions to gorge on cheap Russian oil just as the Brent crude price rocketed past US$100/bbl in the early months of the Ukraine war.
“A study by the Indian rating agency ICRA estimated that India saved around US$5.1 billion on oil imports in 2023 and US$7.9 billion in the first eleven months of 2024, for a total of US$13 billion,” according to the National Bureau of Asian Research.3
Partly to placate the anger of American politicians, India then raised its import of US crude. For the first 11 months of 2024, India’s intake of US crude rose by 29.4% to more than 217 000 bpd. It is set to rise further as India is now the fastest growing oil consumer among the world’s major economies.
The EIA expects India to account for 25% of the world’s oil consumption growth in 2024 and 2025.
“Driven by rising demand for transportation fuels and fuels for home cooking, consumption of liquid fuels in India is forecast to increase by 220 000 bpd in 2024 and by 330 000 bpd in 2025. That growth is the most of any country in our forecast in each of the years,” said the EIA.1
In their first meeting since Trump’s re-election, Modi indicated that his government would endeavour to reduce India’s US$45.7 billion trade surplus with the world’s largest economy by boosting its import of oil and gas, and defence equipment from the US.
South Korea, Japan, and Taiwan fall in line
Like India, East Asia’s three democracies are also looking to win Trump’s favour by strengthening ties with the US oil and gas industry.
South Korea, already among the world’s most important markets for US crude, imported a record 484 400 bpd in the first 11 months of 2024, up nearly 80% from 2020.
In an interview with the Yonhap news agency, South Korean Industry Minister Ahn Duk-geun pledged to further raise his country’s import of US fossil fuels to directly address Trump’s complaint about their bilateral trade imbalance.4 South Korea reported a record US$55.7 billion surplus in its merchandise trade with the US in 2024.
Among Asian countries, Taiwan is under the greatest pressure to win over the Trump administration due to its overwhelming reliance on US protection against China’s
The US now accounts for nearly a quarter of Taiwanese oil imports. Due to its limited refining capacity, Taiwan is unlikely to substantially improve on its recent intake of 217 300 bpd of US crude. Instead, it will look to boost its purchase of LNG from Alaska.
Japan will follow in the footsteps of South Korea and Taiwan in raising LNG imports from the US. However, Japanese imports of US crude will remain insignificant owing to its declining appetite for oil.
Singapore is spared, for now
The US has become one of Singapore’s largest crude suppliers this decade, with sales rising to a record of nearly 311 000 bpd in 2022. Those volumes have declined over the past two years, likely the result of competition from cheaper crude displaced by discounted Russian supplies.
Singapore is under far less pressure than other Asian countries to increase US crude imports for three reasons. Rare among Asian countries, the city state has a consistent trade deficit with the US. It was up by more than 80% from US$1.3 billion in 2023 to US$2.4 billion in 2024. Uniquely too, Singapore is friendly with China while enjoying strong political, economic, intelligence, and military ties with the US at the same time. Lastly, the US already has a major role in Singapore’s oil trading, financing, distribution, and price-making functions through companies such as ExxonMobil, Citibank, JP Morgan, and S&P Global.
As a result, Singapore has not been called out by Trump to undertake any ‘corrective’ actions. But that does not mean it is off his radar as Singapore is an increasingly vital base for Chinese trade, investment, and financing activities.
In 2009, state-owned PetroChina acquired Singapore Petroleum Co., giving Beijing a frontline role in Asia’s leading oil refining, storage, distribution, and trading centre. Given the extensive involvement of both Chinese and US stakeholders, Singapore is an inevitable pawn and future battleground in any war scenario that pits the US against China. Furthermore, the island’s world-class 1.4 million bpd of refining capacity, oil storage tanks, and refuelling infrastructure for ships and fighter planes will be prized military assets in the event of a shooting war in the Asia Pacific region.
Oil in US-China politics
China is a fairly significant buyer of US oil and gas, but the trade has entered a turbulent and uncertain phase, reflecting the growing tensions in their bilateral ties.
Unlike other Asian countries, China is strong enough to rebuff the Trump administration’s attempts to dictate its
Learn more about our range of service capabilities at elliott-turbo.com. Trust Ebara Elliott Energy for your
When process changes, environmental regulations, or increased capacity requirements demand enhanced performance, Ebara Elliott Energy helps plant operators extend the operating life of rotating equipment from any manufacturer. Our engineered solutions improve efficiency, reduce operating costs, and support increased capacity.
Trusted Solutions for a Sustainable Future
Table 2. US crude exports to Singapore (000 bpd)
Source: Energy Information Administration.1
Table 3. US crude and oil product exports to China (000 bpd)
Source: Energy Information Administration.1
energy policy and trade. Despite chalking up a massive US$295 billion trade surplus against the US in 2024, up 5.8% from 2023, China feels no obligation to buy more fossil fuels from the US to ‘correct’ the imbalance.
Indeed, China’s import of US crude and refined products fell 14% in 2024 after peaking at nearly 993 000 bpd in 2023. While economics played a part in the decline, geopolitical considerations may also have influenced China’s decision to reduce dependence on US energy supplies. Beijing underlined that point by imposing tariffs on imported US oil and gas in February 2025.
For now, China can still look to Russia, which remains under Western economic sanctions, for much of its energy supplies. According to the EIA, China’s crude imports from Russia have risen for three consecutive years to reach a record 2.2 million bpd in 2024, up about 1% from 2023.
But Trump’s recent decision to engage with Putin over the Ukraine war may have been partly intended to disrupt Russia’s close ties with China. It may set the stage for sanctions to be loosened that could reduce Moscow’s heavy reliance on selling its oil and gas to China and India. Already struggling with slow growth and a huge debt overload, the Chinese economy would suffer if it loses access to discounted Russian oil and gas supplies.
In February 2025, the US Treasury Department imposed tough sanctions on several companies, individuals, and tankers that deliver Iranian oil to China.
“The oil was shipped on behalf of Iran’s Armed Forces General Staff (AFGS) and its sanctioned front company, Sepehr Energy Jahan Nama Pars,” said a Treasury Department statement.
“Iran generates the equivalent of billions of dollars each year via oil sales to fund its destabilising regional activities and support of multiple regional terrorist groups, including Hamas, the Houthis, and Hizballah. The AFGS utilises networks of foreign-based front companies and brokers to enable these oil sales and shipments.”
Iran exported between 1 - 1.5 million bpd of crude to China over the course of this decade, according to the Congressional Research Service (CRS) which supplies analysis to the US House of Congress.5 In 2024, Iran sold a record US$70 billion worth of crude oil and petrochemical products
to China, said the CRS, citing The Economist magazine.
Apart from fulfilling Trump’s avowed goal to stop Iran’s oil exports, the sanctions will have the added impact of undermining Beijing’s growing ties with Tehran.
China targets Indian Ocean with Sri Lanka refinery and port investments
The Indian Ocean is emerging as another area of contest pitting China against the US and India.
China has set the foundation for its growing presence in the Indian Ocean after agreeing with the Sri Lankan government to fast-track the construction of a US$3.7 billion oil refinery. The 200 000 bpd refinery will be Sri Lanka’s largest stand-alone investment when completed by 2027.
The proposed project near the island’s southeastern port of Hambantota had been delayed by domestic political turmoil and financial problems following the collapse of the Rajapaksa regime in 2022.
Shortly after his party was elected to power in November 2024, Sri Lanka’s new President, Anura Kumara Dissanayake, flew to Beijing to meet China’s President Xi Jinping to strengthen political and economic ties. Dissanayake returned home with a slew of agreements, including the coveted refinery deal that will play a key role in the country’s economic recovery.
Chinese state firm Sinopec will build and likely operate the refinery to add to its growing portfolio in the South Asian nation. The company is already the owner of an oil storage terminal and the operator of a bunker fuel business in Hambantota’s strategic port, serving the shipping traffic in the Indian Ocean.
Sinopec’s operations in Sri Lanka will give Beijing an important foothold in the South Asia region amid China’s growing rivalry with India and the US.
For Sri Lanka, the refinery will enhance the nation’s energy security as well as generate much-needed export earnings for its cash-strapped economy.
References
1. US Energy Information Administration. 2024. ‘India to surpass China as the top source of global oil consumption growth in 2024 and 2025.’ https://www.eia.gov/todayinenergy/detail.php?id=64084
2. SESHASAYEE, H., ‘Oil: A New Chapter in U.S.-India relations’, Wilson Center, (10 February 2022). https://www.wilsoncenter.org/blogpost/oil-new-chapter-us-india-relations
3. VICKERY, R.E., and CUTLER, T., ‘Oil for India’, The National Bureau of Asian Research, (3 September 2024). https://www.nbr.org/ publication/oil-for-india/
4. YOON-SEUNG, K., ‘S. Korea aims to expand imports from U.S. ‘constructively’ to address Trump uncertainties: minister’, Yonhap News Agency, (7 December 2024). https://en.yna.co.kr/view/ AEN20241129010100320
5. Congressional Research Service. 2024. ‘Iran’s Petroleum Exports to China and U.S. Sanctions.’ https://www.congress.gov/crs-product/ IN12267
Anh Do, Shell Catalysts & Technologies, the Netherlands, investigates ways to assist gas processing plants to boost capacity and improve efficiency.
Maximising production capacity while minimising capital expenditure (CAPEX) is an ongoing challenge for gas processing plant operators. As demand for efficiency grows and regulatory standards become more stringent, operators must further develop existing facilities and equipment without resorting to costly and disruptive infrastructure expansions. In this context, technological innovation plays a crucial role in enhancing performance.
In greenfield projects, the high CAPEX associated with high-pressure absorption columns can account for a substantial part of total project costs. Maximising mass
transfer rates and throughput without increasing equipment size is critical for cost control, while still meeting regulatory requirements.
Many existing plants still encounter bottlenecks in their absorbers, even after upgrading to structured packing or high-capacity trays. These limitations prevent them from managing higher contaminant loads without compromising product quality. Additionally, expanding capacity through additional processing trains can be both costly and complex, often deterring investment.
Shell Turbo Technologies (STT) offers a patented column tray internal design that enhances mass transfer
efficiency and column hydraulics. This allows operators to debottleneck absorbers, increase throughput, and handle higher contaminant levels without needing major infrastructure expansions.
The innovation of STT trays lies in the integration of contacting and separation zones within a single package. In each tray, co-current flow of gas and liquid enhances mixing and mass transfer. This is followed by effective separation via swirl tubes that use centrifugal
force (Figure 1). The co-current flow design is key to boosting throughput while maintaining separation efficiency in both greenfield and brownfield applications.
In greenfield projects, STT can reduce absorber column cost by up to 50%, facilitating the use of smaller, more cost-effective absorbers that maximise gas-to-liquid contact and separation efficiency.
STT trays offer a solution for increasing capacity in brownfield units. Older absorber columns often face structural imperfections, such as uneven surfaces or a lack of roundness, complicating retrofitting. The technology addresses this with adjustable expansion rings, which eliminate the need for direct welding to high-pressure column walls and minimise downtime. Installed at various levels and supported by existing rings, these expansion rings conform to the column’s shape using tension and a flexible gasket to ensure a secure seal, accommodating imperfections like bulges or dents.
Case studies
Two case studies illustrate the effectiveness of STT. In one instance, an operator increased production by 21% through debottlenecking its acid gas removal unit (AGRU). In another case, an operator boosted gas treatment throughput by 59% due to enhancing the capacity of its triethylene glycol (TEG) dehydration train.
Debottlenecking an AGRU
The operator of a natural gas treatment facility using Sulfinol-X1 gas processing technology wanted to debottleneck the sour gas absorber, but was concerned that upgrading the unit could be expensive, and disrupt operations. Previous attempts to increase natural gas throughput had led to H2S levels exceeding regulatory limits (Figure 2), confirming the limitations of the existing absorber. The retrofit aimed to boost gas processing capacity in the AGRU with minimal CAPEX by using STT technology. By enhancing column hydraulic limits, the technology maximised solvent loop margins, enabling full utilisation of existing equipment without modifications. The retrofitting design parameters are summarised in Table 1.
Figure 2. The technology enabled the operator to increase natural gas production capacity by more than 20%, while keeping H2S levels within specified limits.
Figure 1. The innovation of STT trays lies in the integration of contacting and separation zones within a single package.
As part of the upgrade, 21 conventional trays were removed and replaced with just nine STT trays, substantially improving efficiency. The new trays were installed using the existing tray support rings, eliminating the need for hot work on the pressure vessel. Additionally, a new solvent inlet distributor was introduced to enhance flow distribution, and a new mesh demister was installed to improve gas-to-liquid separation.
Figure 3 illustrates the hydraulic operating point of the column that has been retrofitted with nine STT trays. This new operating point exceeds the capacity of traditional tray designs. The hydraulic assessment indicated that, even at the peak test flow rate of 158 million ft 3 /d (5% above design flow rate as seen in Table 1), the new trays functioned well within hydraulic limits. This configuration not only ensured operational stability but also minimised the risks of liquid carryover.
Combining the use of Shell’s Sulfinol-X solvent with STT enhanced natural gas production capacity, while maintaining H 2 S levels within specified limits. The retrofitted AGRU was able to manage flow rates of up to 121% of baseline levels. Additionally, the rich solvent loading increased from 0.46 to 0.51 moles of acid per mole of amine, remaining within industry standard limits. The regeneration system effectively kept the solvent lean, utilising the available reboiler capacity of the existing equipment. The new technology is expected to achieve even higher capacity, but limited feed gas availability prevented further testing.
Furthermore, the total pressure drop across the new trays (including the mixing boxes, gas inlet ports, and swirl devices) was reduced by approximately 0.2 bar compared to conventional trays. This pressure reduction increased the plant’s gas capacity, which could be particularly advantageous for source fields that are anticipated to experience declining pressures.
Improving TEG dehydration capacity
TEG dehydration columns have historically used structured packing, with earlier designs incorporating bubble cap trays. In the 1990s, the introduction of swirl tube trays helped reduce the footprint of contactors while either maintaining or improving dehydration efficiency. However, excessive glycol losses, ranging from 0.2 to 1 US gal./million ft 3 (30 to 200 l/MSm³), exposed the challenges of liquid carryover in compact dehydration systems.
The introduction of the STT equipped the operator with an effective solution to minimise glycol losses and enhance separation efficiency. The system, combined with a mesh-swirl deck-mesh (MSM) demisting system, achieved up to 99% separation efficiency, substantially reducing glycol losses caused by mechanical entrainment. This enabled the operator to meet industry standards of 0.1 US gal./million ft 3 (15 l/MSm³) while improving overall dehydration performance.
One of the key advantages of STT is its ability to increase gas throughput within a given contactor diameter, making it a viable retrofit solution. By enhancing capacity without major modifications to equipment, operators can achieve lower CAPEX, reduce their carbon footprint, and decrease operational expenditure, all while accelerating project timelines.
In 2021, STT trays were used to upgrade an existing 96.5 in. (2.45 m) dia. glycol contactor originally fitted with
Figure 3. Hydraulic limits of the conventional and Shell Turbo Technologies (STT) trays and the operating point of the retrofitted column.
structured packing trays. The retrofit incorporated seven STT trays and an MSM separation system, with no other major changes to the glycol unit. The result was a 45% increase in production capacity, raising output from 346 to 500 million ft 3 /d. During testing, the operator requested a further flow rate increase, successfully reaching 550 million ft 3 /d (a 59% increase), which was sustained for eight hours before reverting to the designed rate (Figure 4).
Figure 5 shows the relationship between feed gas throughput and pressure drop across the TEG contactor, with values adjusted for calibration errors to reflect zero drop at zero throughput.
When using STT trays to replace structured packing, pressure drop is an important consideration. Nonetheless, the overall economic impact should be evaluated individually, as permissible pressure drops can vary widely, and their effects may be less harmful than expected, especially when factoring in the benefits of the technology in revamp projects.
Throughout testing and operation, no noticeable glycol losses were observed, and since its deployment, no abnormal TEG losses have been reported. Operators have noted that glycol losses are lower compared to structured packing, reinforcing the long-term reliability of this technology.
Figure 4. Demonstrated throughput increase after an STT revamp of a triethylene glycol (TEG) dehydration column.
Figure 5. Demonstrated throughput after an STT revamp of a TEG dehydration column.
With its proven efficiency, cost savings, and increased capacity, STT is a viable option for gas operators seeking to maximise production without investing in entirely new TEG dehydration units.
Conclusions
The trays discussed in this article can improve column hydraulics and mass transfer in AGRUs and TEG dehydration columns, delivering a substantial boost to capacity and efficiency. Their design facilitates co-current gas and liquid contact on each tray, enabling smaller, cost-effective absorbers in new projects and higher throughput in brownfield applications.
Extensive testing and real-world deployments have shown that STT can reduce absorber costs by up to 50% and debottleneck existing units, allowing operators to manage higher contaminant loads without compromising performance. These applications demonstrate how the technology meets the industry’s toughest challenges, helping operators maximise efficiency while minimising costs.
Note 1. Sulfinol is a Shell trademark.
In the energy sector, gas processing facilities play a critical role in refining natural gas to meet stringent quality standards for domestic and industrial use. As raw gas travels from wellheads to processing plants, it carries a complex mix of methane, ethane, propane, and other components, such as acid gases (H2S and CO2), water, condensate, and various foulants like solids and salt. The primary objective of these facilities is to purify the gas, stripping away these contaminants to help meet industry standards required for both home and commercial use.
Central to this purification process is the acid gas removal unit (AGRU), which utilises technologies like amine absorption to remove acidic gases from the incoming gas stream. The inlet separator plays a vital role in processing, helping to separate out
Tom Mazzacavallo, Nalco Water, an Ecolab Company, USA, shares insight on how gas processing facilities can build a proactive maintenance strategy with a comprehensive programme to ensure the performance of inlet separators.
natural gas liquids, water, and solids before the gas enters the AGRU. This process helps prevent physical contaminants from damaging the equipment or hindering the absorption process. Additionally, compressors are used to pressurise gas to the necessary levels for effective processing, helping the gas to maintain the correct pressure throughout the treatment stages. Fouling poses a significant challenge to the efficiency of gas processing operations. When the inlet separator is not working properly or is exceeding its designed flow rate, solids and other particulates can pass through the separator to downstream equipment, potentially leading to operational inefficiencies or equipment damage, if not promptly addressed. Without a proactive programme, operators are often forced to schedule
frequent and costly maintenance to manage fouling in the equipment of the plant, such as compressors, absorbers, or lean/rich heat exchangers. These maintenance activities are expensive and time-consuming, leading to potential downtimes that can disrupt the overall productivity of the facility.
When inlet integrity is neglected, not only is equipment at risk, but the entire process. Contaminants like solids and salts can travel through the system, causing corrosion, fouling, and unplanned downtime. By prioritising inlet integrity, plants can help to safeguard downstream processes.
Nalco Water, an Ecolab company, recently launched a programme to help gas processors manage fouling and support efficient performance. The Inlet Integrity Programme combines products with localised service and digitally enabled reporting to help companies identify and address challenges, before they can cause significant impact.
The programme features patented chemistries, such as an iron sulfide inhibitor and corrosion protection product, which minimises the formation of harmful deposits. The programme also includes an inlet separator solid removal enhancement product that effectively removes suspended solids from the incoming gas stream. The products can be utilised together or separately depending on the needs of a specific operation. Supported by the company’s tailored offerings, the programme
helps drive operational efficiency and reliability at an optimised operating cost.
Inlet integrity in action
The programme was implemented at a gas processing facility near Midland, Texas, US, where high compressor fouling rates were leading to frequent downtime for cleaning and maintenance. An average of one compressor per day was shut down due to overheating valves, commonly called ‘hot valves.’ This not only incurred high costs but also consumed significant personnel time and occasionally led to the flaring of the backed-up gas.
The facility’s challenges required a detailed understanding of specific operational issues. As a first step, Nalco Water focused on identifying the root cause. Samples from the compressors were sent to the company’s analytical lab, where analysis revealed that the deposit primarily consisted of salt. Based on these findings, the company recommended introducing a compressor antifoulant product designed to help remove solids and dissolved salts from the gas stream in the inlet separator, enabling them to be efficiently removed through blowdown water.
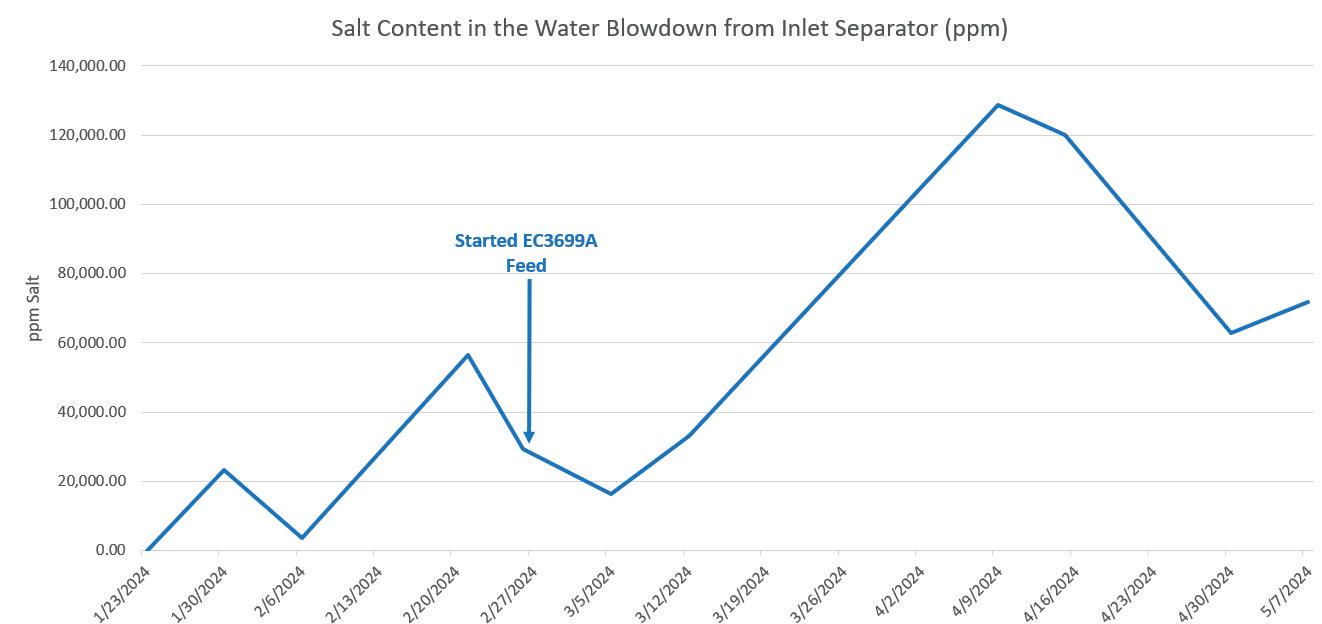
The product was injected into the pipeline a few feet upstream of the inlet separator, using an atomiser to ensure even distribution throughout the gas stream. Samples of the blowdown water were taken regularly to monitor salt content, while the plant closely observed compressor performance to determine whether maintenance frequency decreased. This data, along with additional analytical reports, was uploaded to the ECOLAB3DTM digital intelligence platform through a mobile app to help the plant review and understand trends.
When analysed, the results were promising. Blowdown water samples showed a significant increase in salt content, with salt levels rising approximately 250% compared to pre-trial samples (Figure 1). The data indicated that the treatment programme was effectively removing salt deposits from the inlet separator, preventing them from travelling downstream to the compressors or amine unit.
The trial ran for 10 weeks on the plant’s most problematic compressor, which they selected to pilot the programme. Prior to the trial, the compressor required cleaning every three days.
Two weeks after the introduction of the treatment product, the compressor showed no signs of fouling and no evidence of build-up (Figure 2, left). The trial continued for 10 weeks without any fouling-related issues. At the 10-week mark, the compressor was opened for inspection. As shown in Figure 2 (right), the valve remained clean.
With the solution in place, no compressors went down due to fouling or hot valves for the duration of the 10-week trial. The plant went from daily compressor maintenance to over a year without issues related to hot valves,
Figure 2. Compressor valve two weeks into the trial (left) and after the 10-week trial (right).
Figure 1. Blowdown samples.
Our answer: Yes! What was the question?
When your measurement is crucial, VEGA is the right choice. Our level and pressure measurement technology is not just state of the art – it sets the industry standard. With clear vision, technical expertise and strong innovation, we always have the right answer. No matter what the question is. Everything is possible. With VEGA.
enabling operators to focus their time on other plant operations. The absence of compressor maintenance also saved significant costs related to labour and replacement parts, and led to other benefits such as reduced gas flaring. In total, the programme delivered a value of over US$300 000 and helped save 1255 t of CO2 emissions for this specific plant.
Expanding the impact
The programme’s ability to adapt to evolving challenges was demonstrated at another gas processing facility in western Texas, US. Initially, it was trialled on intermediate-pressure compressors to assess its effectiveness in reducing fouling and optimising efficiency. While these compressors had no significant history of fouling, the trial revealed critical insights that led to a more impactful application.
In the first phase of the trial, Nalco Water introduced the programme to the plant’s intermediate pressure compressors. These compressors had not historically experienced significant fouling, making it difficult to quantify and benchmark the programme’s value. Despite this, water analysis during the trial showed promising indicators – fewer solids reached the compressors, and six out of seven compressors operated more efficiently. When the company saw the improvements even in the absence of severe fouling, the team wanted to target a different part of the process to deliver even stronger operational benefits.
The team then turned to the low-pressure compressors. After switching its programme to an alternative solution, the plant was experiencing challenging fouling issues that needed
a shift. The plant collaborated with the company to conduct a new trial for the programme – this time focusing on the low-pressure compressors where fouling was most prevalent.
The revised strategy applied a two-step treatment programme to address fouling at its origin. One product was injected upstream of the inlet separator. A second treatment was applied after the inlet separator, ensuring contaminants were neutralised before reaching the compressors. By intercepting the issues at the source, and treating the gas at two stages, the team helped to prevent fouling from reaching critical machinery.
As a result of the low-pressure compressor trial, the plant was able to extend cleaning intervals and reduce operational disruptions. Within a few weeks of implementing the second trial, the facility began seeing significant improvements. The frequency of hot valves in the low-pressure compressors decreased, and the overall efficiency of the system improved.
A proactive approach
The programme continues to add value across industry operations as it can help reduce midstream maintenance complexities, with success demonstrated at both gas processing plants and compressor stations across gas lines. The programme’s holistic treatment strategy helps gas processors move away from reactive maintenance as they transition towards proactive performance management. By adapting the way that gas plants manage fouling, the programme aims to turn routine operations into cost saving efficiency opportunities.
The Hidden Costs of Fugitive Emissions and the Role Valves Play in Cost Reduction
Fugitive emissions are a growing challenge for industrial facilities due to tightening regulations, budget constraints, and the need to maintain strong emissions credentials. Poorly functioning valves are a major contributor, and companies must address the cumulative impact of emissions from potentially thousands of valves within a facility. Outdated valve designs not only reduce profitability but also pose risks to personnel, communities, and the environment.
In this webinar, Emerson experts will provide valuable insights into mitigating fugitive emissions and ensuring compliance while optimising plant efficiency.
Aravinth Rajagopalan Director Global Hydrocarbon Emerson
Omar Cruz Marketing Manager for Tank Products Emerson
Nicolas Corsico Application Engineer Emerson
Maggie Pycherek, Alfa Laval, Canada, considers how operators can maximise efficiency in ethanol plants through waste oil recovery.
In ethanol production, lost oil means lost revenue. But what if it offered a bigger opportunity? For years, manufacturers have worked to optimise oil recovery, and production systems have evolved from rudimentary separation techniques to more sophisticated equipment. But while the process has improved, the challenge remains in recovering oil more efficiently and sustainably, without leaving potential value on the plant floor.
Enter the decanter centrifuge: a technology that is advancing what is possible in sustainable industrial oil and fat extraction. By maximising yields, minimising losses, and integrating into existing systems, this system helps ethanol plants more effectively transform by-product streams into high-value resources while reducing waste, improving efficiency, and capturing more market value.
For ethanol producers, where even a single percentage point of improvement can mean significant financial gains, implementing a decanter centrifuge system is a strategic move that enhances manufacturing process within an increasingly competitive market.
A new era in oil extraction
The latest generation of decanter centrifuges are designed for efficient oil and fat extraction in industrial ethanol production. Engineered for integration, they work within existing systems with minimal disruption, maximising recovery and efficiency. Their key features include:
n Recovery rates: certain decanters can recover virtually all free oil in the feed, delivering over 95% purity.
n Ease of use: the intuitive design of decanter centrifuges allows for straightforward installation, operation, and maintenance, reducing complexity for operators.
n Versatile applications: whether processing whole stillage, by-products, food waste, or other oil-rich feedstocks, this type of advanced decanter centrifuge adapts to diverse needs.
n Reduced energy consumption: advanced designs utilise lower power requirements compared to traditional decanters, contributing to cost savings and reductions in allowable CO2 emissions.
By recovering high-value oil from existing processes without the need for significant energy consumption or additional manpower, installing a decanter centrifuge like Alfa Laval’s Prodec Oil Plus can help maximise profits and navigate market fluctuations.
The technology behind the latest decanter centrifuges represents a leap forward in oil recovery. Decanter technology for oil extraction first emerged in the 1970s,
offering ethanol producers a more efficient way to manage by-products. In the late 1980s, the focus for decanter development was improving solids handling capacity. Since then, oil extraction methods have evolved from rudimentary separation techniques to high-efficiency oil recovery systems, designed specifically for thin stillage oil recovery. Not only do modern decanter designs extract oil with greater precision and consistency, but their plug-and-play designs allow for integration within existing plants.
Additionally, older machinery often requires more frequent shutdowns for maintenance, whereas modern systems can operate continuously, delivering oil recovery improvements of 20 - 30% in some cases. This surpasses the industry standard of 2 - 3% gains.
By integrating a decanter centrifuge into operations, plants can achieve higher yields, reduce waste, and enhance sustainability – all while maintaining a low total cost of ownership. It is an upgrade that can boost productivity while simultaneously shrinking the plant’s environmental footprint.
Case study 1: Dakota Spirit
Ethanol production faces growing pressure to improve sustainability by reducing waste and maximising resource use. Dakota Spirit tackled this challenge head-on, boosting oil recovery by 25% in just two months with the Prodec Oil Plus decanter.1 By extracting more valuable corn oil from thin stillage, the plant not only improved efficiency but also minimised waste – demonstrating how advanced separation technology plays a crucial role in making ethanol production more sustainable and resource-efficient.
Ethanol producers implementing high-performance centrifuges can thus see significant gains in their operations, including:
n Optimised oil recovery that extracts additional oil of more than 95% purity, often with minimal additional processing.
n Low total cost due to its energy efficiency and low maintenance costs, resulting in a short pay-off time of under two years.
n Plug-and-play installation that is easy to integrate into the current plant setup.
n Hands-off performance that handles varying flow conditions, high solids, and oil content fluctuations without manual adjustments needed.
Decanter centrifuge systems are robust enough to handle high fluctuations in oil content and varying flow conditions, all while maintaining consistent performance. Cleaning is simple, with standard flushing or clean-in-place (CIP) programmes that ensure minimal downtime. The financial impact of such improvements cannot be overstated. In an industry where margins are often tight, the ability to recover additional oil from the same inputs can make a substantial difference to a plant’s efficiency.
Case study 2: DENCO II
By optimising its oil recovery process with high-efficiency centrifuge technology, DENCO II increased its yield by 52%,
Figure 2. Decanter centrifuges are helping to advance industrial oil and fat extraction.
Figure 1. One of the key features of decanters is how they can be integrated into existing systems with minimal downtime or modifications.
End-to-End Ammonia Solutions
At Zeeco, we’re making ammonia a practical energy solution through our tailored approach from burners to thermal oxidizers and low Btu flares. From design to modeling, manufacturing to operation, we help ensure your ammonia plant is fulfilling its mission while remaining a cleaner source for the world’s energy needs. Trust the end-to-end ammonia experts to redefine efficient, effective combustion of ammonia and other low Btu waste streams.
Zeeco: Innovation At Work
Figure 3. Decanter centrifuges can help maximise profits and navigate market fluctuations in ethanol production.
to 1.15 lbs per bushel in just six months.2 Leveraging advanced separation solutions like the Prodec Oil Plus decanter, the plant was able to achieve superior oil purity, reduced energy use, and maximised efficiency – proving that decanter centrifuges are important to unlocking higher profitability in ethanol production.
Sustainability, simplified
Sustainability has gone from being a buzzword to a smart business move that directly impacts profit margins. The technological development in newer decanter systems offers the opportunity to turn oil content into a valuable resource. Being able to recover up to 99% of free oil without disrupting biogas production significantly reduces waste and helps drive sustainability in the corn ethanol industry.3
Prodec Oil Plus optimises the availability of feed material for the production of renewable fuels like biodiesel and sustainable aviation fuel (SAF), supporting global efforts to reduce greenhouse gas emissions (GHG) and combat climate change.
Adapting the latest decanter technology into production processes will not only improve efficiency, it will also offer a competitive edge in the shift toward cleaner, more sustainable energy.
Solving the oil recovery puzzle
The progress in decanter centrifuges is tackling some of the biggest challenges in oil extraction. From fluctuating feed conditions to the need for sustainable solutions, modern decanters are designed to tackle several critical challenges faced by industries involved in oil extraction, including the following.
Resource optimisation
As industries move toward more sustainable practices, turning waste into value is critical. In industries like ethanol production, corn oil is a valuable by-product that often goes underutilised. High-efficiency decanter centrifuges ensure this resource is fully utilised to its maximum, turning what would otherwise be sent out with another by-product into a valuable commodity. This not only supports
sustainability goals but also aligns with the growing demand for renewable fuels like biodiesel and SAF.
The ability to recover oil from food waste is particularly significant in today’s market, where consumers and regulators alike are demanding more circularity. Installing a decanter centrifuge will allow operators to ensure environmental stewardship while also capitalising on new revenue opportunities.
Ease of installation, operation, and maintenance
One of the features of such decanters is how easily they can be integrated into existing systems with minimal downtime or modifications. Once operational, it requires little intervention, due to its robust performance under variable conditions. Routine maintenance is straightforward, with cleaning achievable through standard flushing or CIP programmes.
This ease of use is a major advantage for facilities looking to maximise output of oil in the dry house or to recover oil prior to an anaerobic digestion process without impacting methane production. The user-friendly design features intuitive controls and a streamlined interface that simplifies operation and maintenance.
Improved feed quality and process efficiency
In ethanol production, removing excess oil from dry distillers grains with solubles (DDGS) improves the quality of livestock feed, making it easier to digest for some animals.4 Additionally, recovering oil reduces the energy required for drying DDGS and improved heat transfer in evaporative emissions control systems (EVAPS), further enhancing process efficiency and lowering operational costs.
A decanter centrifuge also supports the production of high-quality biodiesel and other industrial products, providing companies with additional revenue streams. By optimising oil recovery, it ensures that no part of the raw material goes to waste, maximising resource utilisation and supporting a circular economy.
Conclusion
As the demand for sustainable biodiesel and jet fuel continues to grow, decanter centrifuges offer an opportunity to turn even more oil content lost to by-product or waste streams into a valuable resource.
References
1. ‘Dakota Spirit Increases Oil Recovery by 25% With New Technology’, Ethanol Producer Magazine, (2024), https:// ethanolproducer.com/articles/dakota-spirit-increases-oil-recoveryby-25-with-new-technology
2. ‘DENCO II Increases Oil Recovery by 52% with New Technology’, PRNewswire, (2024), https://www.prnewswire.com/newsreleases/denco-ii-increases-oil-recovery-by-52-with-newtechnology-302316809.html
3. ‘Alfa Laval to unveil game-changing separation technology to boost distilled corn oil (DCO) recovery by more than 20% at FEW 2024’, Alfa Laval, (2024), https://www.alfalaval.us/media/ news/2024/few-2024-distilled-corn-oil-separation-technology/
4. RODRIGUEZ, D.A., LEE, S.A., and STEIN, H.H., ‘Digestibility of amino acids, but not fiber, fat, or energy, is greater in cold-fermented, low-oil distillers dried grains with solubles (DDGS) compared with conventional DDGS fed to growing pigs’, Journal of Animal Science, Vol. 98, No. 10 (2020), pp. 1 - 8.
Matt Dixon, Swagelok Co., USA, examines how modern ammonia sampling enhances safety, accuracy, and efficiency.
Chemical plants and refineries around the world use anhydrous ammonia every day in their operations in the production of plastics, textiles, petroleum, and more. For optimal performance, that ammonia must contain the proper water content; typically, that means between 0.2% and 0.5%, which will prevent severe corrosion and ensure end-product quality
remains high. To maintain consistency in these water levels, the ammonia requires regular testing (Figure 1).
However, the traditional methods used for ammonia sampling and testing are challenging for many reasons, primarily due to the chemical’s volatile nature.
The sampling itself is time-intensive and presents a minefield of potential challenges. The slightest misstep
can cause inaccuracy of the entire sample, which puts extensive pressure on the technician to get it right the first time. Additionally, the process requires the use of extensive personal protective equipment (PPE), including (but not limited to) goggles, gloves, respirators, and chemical suits. Because ammonia vapours are highly toxic, preventing exposure is paramount.
But a better way to sample ammonia is possible. Deploying the latest ammonia sampling technology and pre-engineered grab sampling systems in place of traditional means can increase the accuracy of results, improve operational efficiency, and enhance worker safety. This article will explore the challenges inherent to traditional, manual sampling for ammonia, as well as some advancements in ammonia sampling equipment that can help operators maintain safer, more efficient, and more accurate sample procedures.
Traditional ammonia sampling
Traditional ammonia sampling is commonly performed using the CGA G-2.2 method, where a 100 ml sample of liquid ammonia is dispensed and then allowed
to evaporate. The residual water from the evaporated sample provides a reliable way to measure the ammonia’s water content, which should be between 0.2% and 0.5%.
Water content above 0.5% is excessive. If the water content falls below 0.2%, it can lead to stress corrosion cracking in storage tanks or other fluid system components through which the ammonia flows – a dangerous phenomenon that can destroy components at stress levels below the yield strength of the alloy. Stress corrosion cracking can lead to catastrophic system failure if left unaddressed, as the metals used in such tanks and components can weaken under the strain and fail unexpectedly. While in progress, the phenomenon of stress corrosion cracking can be difficult to detect.
The traditional method of testing ammonia for water content should enable fast identification and remediation of problems before the system fails, but it is notoriously unreliable unless handled perfectly. A few variables that can cause inaccuracies include:
n When cold ammonia is introduced into warm glass containers, it rapidly starts to boil and evaporate, making it challenging to fill residue tubes precisely to the marked graduation line.
n Variations in heating rates can result in inconsistent sampling outcomes.
n Failure to thoroughly flush residual water and previous samples from the transport line may result in unrepresentative samples that do not accurately reflect systemic conditions.
Traditional, manual ammonia sampling can take up to 8 hrs to complete, with much of that time required for the sample to adequately evaporate. This lengthy wait time means operators must wait longer to detect a problem in the process, or whether the test was compromised in some way. Additionally, precision is critical – if these conditions are not met, the sample will not reflect actual process fluid conditions. If that occurs, the end product may not meet internal or customer-based specifications, resulting in lost profit for the business. This is true of any product in industrial fluid and hydrocarbon processing, but the specificity required for ammonia sampling can introduce added opportunity for error.
Additionally, safety is a major concern when handling and sampling ammonia. Due to the highly toxic nature of anhydrous ammonia, direct contact can cause severe skin burns and irritation to one’s eyes, nasal passages, throat, and respiratory system, as well as pollute the air. Prolonged exposure can potentially cause blindness, lung impairment, or fatality. Breathing in lesser amounts may induce coughing, as well as nose and throat irritation. While the requisite PPE can mitigate much of ammonia’s toxicity, the gear can be laborious to take on and off multiple times. Further, technicians must be careful to avoid spilling any ammonia. In addition, a momentary loss of focus could derail the entire sampling process, forcing the technician to restart the test from the beginning.
Taken collectively, these challenges and considerations make the manual ammonia sampling process a cumbersome and error-prone one, and it can be costly for
Figure 1. Hydrocarbon processing facilities regularly test ammonia systems for the proper water content.
Figure 2. Ammonia testing systems with glass-enclosed fixtures protect technicians from toxic fumes while allowing them to monitor the process and correct errors before they impact the sampling results.
FUTURE
today’s ammonia processors. But alternatives are available, and they are worth seeking out.
An improved alternative to ammonia sampling
Pre-engineered grab sampling panels have been used for numerous process gases and liquids throughout the hydrocarbon processing industry for years, helping to eliminate some of the handling, accuracy, and safety concerns associated with manual handling. Today, technological advancements have led to grab sampling solutions for ammonia.
First, these systems increase safety by minimising potential exposure to liquid and vaporised ammonia, better protecting technicians as they work with the fluid. They also offer improved consistency in how samples are drawn from the system, minimising the potential for sampling errors and helping the sample maintain its representativeness of true process conditions. They also significantly reduce the amount of time necessary for analysis. Particularly in processing facilities, where production speeds must remain constant, pre-engineered grab sampling systems ensure that the ammonia meets the necessary requirements while shielding technicians drawing the samples from dangerous liquid and vaporised ammonia. In addition to improved safety, this enables efficient sampling while maintaining product quality throughout the process.
As processing facility managers consider ways to enhance their ammonia sampling procedures and systems, they should consider specific features when purchasing sampling equipment. For example:
Closed-sample fixtures
Closed-sample fixtures (Figure 2) will adequately protect workers from unnecessary exposure to ammonia and simultaneously prevent the ammonia from being released into the atmosphere. In addition, technicians do not have to gear up as thoroughly when using closed-sample fixtures. Because these fixtures are made of glass, technicians can observe the process throughout the collection process, allowing them to correct potential errors quickly before they affect the outcome of the sampling session.
Effective chilling mechanisms
Ammonia is unusually prone to boiling off as the sample is being dispensed, which can lead to inconsistencies in sample size and fill accuracy. Modern ammonia sampling systems should incorporate effective chilling mechanisms to cool the sample container and minimise this boiling (Figure 3).
Representative sample dispensing
The sampler should reduce reliance on manual operation by semi-automating the process, thereby minimising the opportunities to compromise the sample (Figure 4). A well-designed ammonia sampling system may also allow the user to flush ammonia through the system, which enables fresh samples each time. Not only can this flushed ammonia be used to cool the sample container, but the process removes older ammonia from the transport line that may otherwise mix with new samples, helping to prevent inaccuracies during the collection process.
User-friendly operation
Sampling systems should offer clear and simplified operations wherever possible, minimising the potential for human error that often occurs with manual sampling. Minimising the number of valves that the operator must manipulate during sampling helps ensure that the process
Figure 3. Effective cooling mechanisms in modern ammonia sampling systems prevent premature boiling and provide more accurate samples.
Figure 4. Residue tube caps allow for greater precision in sample tube filling.
Ammonia Sampling - No Transport Needed Safer • Faster • Consistent
For industries needing precise ammonia water measurement, the Swagelok® ammonia sampler transforms this critical process.
Ease of Use
One handle controls all valves, reducing error and simplifying training.
Consistent Sampling
Automatic ll-level control enables precise sampling.
Smart Interface
Touch screen offers intuitive controls and guidance to minimize potential for error.
Enhanced Safety & Visibility
Closed design minimizes ammonia exposure; glass front allows safer monitoring with less PPE.
Precision Engineering
Prechilled residue tube system prevents boiling; fast loop design ensures fresh, accurate samples.
Transform your ammonia sampling with a solution that prioritizes safety, improves consistency, and eliminates hazardous sample transport throughout your facility. www.swagelok.com/ammonia-sampler
goes smoothly. Finally, convenient touchscreen interfaces can enable technicians to handle heater operations quickly and efficiently, especially when step-by-step operating instructions walk them through the sampling process (Figure 5).
Documentation
To best promote proper use, sampling panels should also include a robust service manual. Ideally, such documentation will include a theory of operation, installation instructions, operating instructions,
maintenance instructions, construction diagrams, and other technical information that will be useful if operators encounter any issues. Such information enables operators to appropriately install, operate, and maintain the sampler. The manual should also include a bill of materials, making it easier to notify a supplier of exact replacement parts with no guesswork required.
Modern ammonia samplers with these features ensure quicker testing overall. It also allows for adjustments to the system to prevent corrosion and other issues before they start, which saves time and money in the long run. Finally, newer technology in ammonia sampling systems offers easy installation and semi-automation for improved maintenance.
Conclusion
Well-designed, modern ammonia sampling systems can enhance safety by minimising or preventing exposure to toxic ammonia fumes or liquid. Additionally, semi-automated systems produce accurate results and can improve overall convenience by reducing sampling time and optimising the user interface to make sample collection easier.
While traditional ammonia sampling remains relevant and effective, new technology offers several benefits for processing facility managers to contemplate. Considering these big-picture gains is an important factor when deciding which equipment will best fit application needs.
Figure 5. Touchscreen controls simplify the user interface to reduce operator errors that could interfere with the sampling procedure.
Jason Knudson, Baker Hughes Valves, USA, explores how pilot-operated safety relief valves serve as an emission abatement solution.
The term ‘net zero’ has gained recognition in the past decade, referring to when the produced greenhouse gas (GHG) emissions are offset by those removed from the atmosphere. Many countries aim to reduce GHG emissions by 2050, but face challenges in addressing industrial processes and emissions. According to the Environmental Protection Agency (EPA), industrial facilities account for 30% of the total GHG emissions in many countries, leading to increasingly stringent emission regulations. 1 Governments worldwide are thus implementing tighter emissions regulations in various industries. For instance, the EU has set ambitious targets for reducing GHG emissions and introduced regulations such as the Industrial Emissions Directive. In the US, the EPA has introduced stricter emissions regulations for industrial plants, vehicles, and other sources.
Flaring regulations and the role of pressure relief devices (PRDs)
Flaring in refineries is frequently observed as emissions to the public eye, making it a target for regulations. Flaring is a common practice in the oil and gas industry, but not necessarily the worst offender of GHG emissions in industrial plants, considering that not all fluids that are burned convert to air pollutants. Routine flaring is one of the easiest processes to reduce emissions output when compared to other industrial sources, according to the American Institute of Chemical Engineers. Most refineries are taking steps to reduce emissions voluntarily, partly in response to public perception and regulations, but also internally to meet sustainability and production goals.
The latest EPA ruling on emissions limits and flares is aimed at reducing harmful air pollutants released by industrial flares. The new rule requires refineries to limit the amount of flaring they conduct and decrease the amount of emissions released during flaring events.
Flares and other control devices must achieve at least 95% reduction in methane and volatile organic compound emissions. The rule also requires facilities to monitor and report their emissions to the EPA, which will help the agency enforce the regulations and ensure compliance. This ruling is a significant step forward in reducing emissions, asserting industrial companies to adopt more sustainable practices.
To meet these new regulations and improve perceptions of flaring, refineries are integrating additional safeguards and technologies to minimise flaring. Routine flaring events can be captured by a flare recovery system; however, these systems are not typically designed to manage unpredictable emergency conditions that usually result from PRDs, such as safety relief valves (SRVs), rupture discs, and control valves. When unplanned scenarios arise, pressure-relief system designers and plant operators rely on the flare to mitigate unsafe conditions such as over-pressurisation beyond the design limits of piping, flanges, and vessels. PRDs are critical components in refineries that help prevent equipment from over-pressurising and causing potentially catastrophic accidents such as explosions, fires, and other safety hazards.
While PRDs are essential for maintaining safe operating conditions in refineries, they also contribute to the flare header system, which conflicts with emission and flare reduction directives. Emergency flaring because of a relief event is difficult to predict and typically, when PRDs open, they release large amounts of media, depending on their size and flow characteristics.
Despite these challenges, PRDs are a necessary evil to prevent accidents and ensure the safety of workers and the surrounding area. When evaluating the impact of PRDs on flaring, pressure-relief system designers and plant operators will consider various types of PRDs to fit their specific applications as PRDs come in more than one design, with each one having unique features. Preventing leakage and limiting the duration and flow of these devices is a top priority for plant operators in refineries as it relates to emission reductions for relief events to flares.
Comparing PRDs
Rupture discs, spring-loaded SRVs, and pilot-operated SRVs are all essential PRDs used in various industrial applications to protect equipment and personnel from overpressure events. Each type of PRD has unique characteristics and functionalities, making them suitable for different operating and process conditions.
Rupture discs serve as non-reclosing PRDs designed to burst at a predetermined pressure, providing instantaneous overpressure protection. They are tailored to operate optimally during normal operating pressure, with no leakage into a flaring system before reaching the burst/set pressure. Rupture discs offer a high coefficient of discharge and reach full-rated flow immediately after opening due to their flowing characteristics. Unlike other PRDs, reseating pressure or blowdown does not apply to rupture discs as the disc is destroyed and there is no
Figure 2. Typical gas flaring at a refinery.
Figure 1. Pressure relief device (PRD) performance (before, during, and after a relief event) by type.
Your unit is expected to deliver, night after night, run after run. Crystaphase helps you crank up the output and keep it loud, from the first note to the last barrel. Performance that doesn’t miss a beat. That’s the Crystaphase Experience.
mechanism to reseat. Flow/leakage will continue until the process is shut down and the disc is replaced.
On the other hand, spring-loaded SRVs are reclosing PRDs that utilise a spring to counteract the force of inlet pressure at the valve’s seat. These valves typically remain leak-tight for up to 90% of the set pressure for metal seated valves and up to 95% of the set pressure for soft seat valves. At set pressure, spring-loaded SRVs typically
reach 50 - 70% lift, thereby relieving most of their rated capacity without additional overpressure. The blowdown of spring-loaded SRVs depends on the relieving medium and trim selected, ranging from 5 - 25% of the set pressure.
In some cases, incorporating a rupture disc at the inlet of the spring-loaded SRV can present a viable solution for ensuring process stability and mitigating potential leakage issues associated with spring-loaded SRVs. However, it is not always ideal to shut down the process for replacing rupture discs in most applications.
Pilot-operated SRVs are another type of reclosing PRD that employs a pilot valve to load operating pressure into the main valve dome, allowing the main valve seat to remain tight until the set pressure is reached. These valves are typically leak-tight from 95 - 99% of the set pressure. Pilot-operated SRVs offer two pilot types, pop-action or modulating which influence the flowing characteristic of the valve. Pop-action pilots enable the main valve to achieve full lift/flow at the set pressure, while modulating pilots open proportionally to the relief demand, only flowing what is necessary. Typical blowdown for pilot-operated SRVs can range from 2 - 10% of the set pressure.
Pilot-operated SRVs present a superior solution for mitigating leaks and managing flow before, during, and after a relief event, when contrasted with the other PRD types. While their applicability may not extend to all processes and applications, consideration of pilot-operated SRVs as an alternative to conventional, reclosing spring-loaded SRVs is warranted due to the several advantages they offer in reducing process loss to the flare.
Maximising operational efficiency
Pilot-operated SRVs have traditionally been favoured as an optimal valve solution for enhancing operational efficiency within refineries. Presently, pilot-operated SRVs are strategically employed by refinery operators for high operating pressure, inlet line loss, and back pressure applications. The following list outlines the advantages of utilising these SRVs to mitigate both process loss and emissions.
No main valve leakage
It is imperative to prevent seat leakage during normal conditions to minimise unnecessary process loss to the flare. Unlike conventional spring-loaded SRVs, the seating force of a pilot-operated SRV is distinct in that it directly corresponds to the increase in system pressure. Consequently, as the system pressure rises, the seating force of the main valve also increases. Pilot-operated SRVs can provide a maximum seating force of up to 100% of the set pressure, thereby eliminating seat leakage and process loss to the flare header system. Additionally, pilot-operated SRVs generally come standard with soft seats and are tested to API 527 standards for seat leakage of zero bubbles per minute at 90% of the set pressure. Most PRD manufacturers conduct more rigorous testing for these PRDs by surpassing 90%, with testing extending
Figure 4. Consolidated 3900 Series Pilot-Operated SRVs can enhance operational effiency where high pressures and back pressure need to be controlled.
Figure 3. Pilot-operated safety relief valve (SRV) seating force curve.
to 96% of the set pressure, affirming the seat leakage performance of pilot-operated SRVs.
Limit pilot venting
The pilot valve is responsible for regulating the pressure in the dome above the main valve’s seat. When the pilot senses the set pressure, it vents the dome pressure to facilitate the main valve lift. Pop-action pilots do not initiate venting until the set pressure is at 100%, ensuring optimal leakage performance before reaching the set pressure. However, these pilot types enable the main valve to achieve full lift and rated capacity which is not ideal for minimising process loss during a relief event. Modulating pilots offer an improved solution for mitigating excessive process loss during a relief event, although it is important to understand the operational principles of these valves.
Modulating pilot designs maintain a specific amount of dome volume to aid in main valve modulation. A traditional modulating pilot design initiates operation before the set pressure by securing dome pressure at approximately 95% of the set pressure, known as the ‘null’ zone. Operating pressure beyond this threshold triggers the pilot to start venting prior to set pressure, to prepare the main valve for opening. Alternative modulating pilot solutions, such as bolt-on modulators that exhibit no leakage up to the set pressure or pilots that enter the null zone above 95%, should be considered especially when high operating pressures are close to the set point of the pilot. These modulating pilot types prevent unnecessary leakage before set pressure to the flare header system.
Modulating flow
Regulating the flow rate during a relief event is crucial to comply with the latest EPA regulations and flare monitoring is increasingly utilised. Pilot-operated SRVs, outfitted with a modulating pilot, function to open and close in response to fluctuations in the upstream pressure. When the upstream pressure nears the valve’s set pressure, the modulating pilot valve incrementally opens, discharging dome pressure and prompting the main valve to modulate. This design characteristic enables the modulating pilot-operated SRVs to deliver the necessary capacity for upset conditions, rather than
the full rated flow, thereby avoiding substantial process loss to the flare header system. Additional benefits of these pilot types include noise reduction and stable relief cycles for challenging applications.
Short blowdown
After a pressure relief event, it is important to have a valve with an optimal blowdown to minimise product loss when system pressure decreases. Pilot-operated SRVs reseat the main valve at pressures close to the pilot valve’s set pressure, but also offer adjustable blowdowns to meet specific normal operating parameters. With adjustable blowdowns as low as 2%, pilots offer excellent reseat performance to prevent excessive flow to the flare and help normalise system pressure.
Optimising efficiency and cost savings
Pilot-operated SRVs offer a practical solution for pressure-relief system designers and plant operators looking to comply with new emission directives for flare systems. By using pilot-operated SRVs, operators can save costs by preventing leakage, regulating flow, and reducing the amount of emissions released. This can help avoid hefty regulatory fines, estimated to be in the hundreds of thousands of dollars per release. Additionally, the use of pilot-operated SRVs is expected to decrease product loss expenses by tens of thousands of dollars per relief event and improve overall system efficiency, thereby increasing profitability for refineries.
The transition from an existing spring-loaded SRV installation to a pilot-operated SRV will require consideration of the product cost and associated piping modifications. Commissioning a full-nozzle pilot-operated SRV that aligns with the API 526 spring-loaded SRVs centre-to-face dimensions presents a cost-effective alternative by avoiding the need for piping changes. Furthermore, pilot-operated SRVs offer additional advantages that can contribute to overall cost savings, offering a short payback period on upfront costs. Implementing any modifications to the existing process system requires a thorough consideration of management of change (MOC). PRD manufacturers offer various tools and resources, including product catalogues, whitepapers, sizing programmes, and service partners, to facilitate the transition and alleviate the MOC process.
In conclusion, the global movement towards achieving net zero GHG emissions has led to stricter regulations for refineries and other industrial facilities, with a focus on minimising flaring and emissions. PRDs such as pilot-operated SRVs should emerge as a favoured solution for minimising process loss and emissions. They offer several advantages and cost savings for end users, making them a promising option for refineries striving for process loss reduction.
Reference
1. ‘Industry Sector Emissions’, United States Environmental Protection Agency , (March 2025). https://www.epa.gov/ ghgemissions/industry-sector-emissions
Figure 5. Pilot-operated SRV lift curve.
Atul Arunkumar Shenoy and Carles Miller, Burns & McDonnell, and Manish Verma, TMEIC, USA, review how early engagement in replacing steam turbines with electric motors and variable frequency drives (VFDs) can drive project success.
In global commodity markets such as oil and gas, assets that get to operate and turn a profit, compared to those that do not, is largely determined by the production efficiency and reliability of the equipment that makes up the production capacity. Refineries have little control over the price of their feedstock and the selling prices are also set by global market forces. Hence the road to profitability is operational efficiency. The average age of a refinery in the US is over 40 years1 and the last major refinery built in the US with significant downstream unit capacity was Marathon’s facility in Garyville, Louisiana, US, which came online in 1977.2 Turbomachinery equipment such as large compressors that range from a few thousand horsepower to tens of thousands is critical to move hydrocarbons from one stage of the process to another.
This has been typically powered by steam turbines in large petrochemical facilities and by gas turbines in smaller facilities, like pipeline compressor stations, where a source of steam is not available. However, as these machines age and electricity is widely available, the downstream industry is at a pivotal juncture where transitioning from steam turbine drivers to electric motors and variable frequency drives (VFDs) has become hard to ignore. The improvement in the reliability of VFDs, efficiency of motors, and reduced emissions has made this transition not only feasible but also economically advantageous. This article explores how early engagement with the electrical discipline and its vendors can drive project success, capturing the attention of operations, capital projects, and engineering teams.
Why replace mechanical prime movers and project development cycles
Replacing mechanical prime movers such as steam turbines with electric motors and drives can reduce maintenance costs by up to 90%, improve thermal efficiency by 7 - 10%, and eliminate emissions compliance issues. Electric systems offer higher reliability, instant dispatch capability, and consistent performance, making them a more cost-effective and sustainable choice for operations. Additionally, electric motors have lower operational costs and can adapt more easily to varying load demands, enhancing overall plant flexibility and responding to variable production targets.
Switching from turbines to electric motors and drives is typically defined as a major capital project. This means that the investment must meet certain financial metrics –profitability, investment rate of return (IRR), and strategic objectives. The stage gate process, as shown in Figure 1, formalises the concept of progressive elaboration, where a formal go or no-go decision is made at each front-end planning (FEP) gate. The fundamental decision question varies by gate (GX), and the deliverables develop through each subsequent stage gate.
In a typical project, work starts from process engineering, then piping, followed by civil and mechanical engineering. The electrical discipline is considered last. This is understandable because mechanical equipment (such as a compressor or a steam turbine) typically has long lead times and are a critical path for commercial operation date (COD). However, in the current scenario, what is being observed in the industry is that electrical equipment is now the critical path to realising the first processed molecule. However, due to increased lead times, it is now imperative to revise traditional project workflow and specify and select electrical equipment in FEP-2 (± 30% of total installed cost) stage rather than FEP-3 (± 10% of total installed cost). Figure 2 illustrates this concept.
Utility coordination and constraints
In refineries, steam turbines typically produce between 10 000 - 80 000 hp for various compression services but refineries might not have this amount of power available on-site. Hence, utility upgrades might be necessary, and the plant must engage with its local utility provider early in the project. This is because the utility parameters will dictate what kind of electric motor and starting strategy will be necessary for the compressor service. In the past, the process or mechanical teams would determine the required horsepower, and the electrical team would provide the necessary support. However, with load requirements growing exponentially, the existing infrastructure is reaching its limits.
The cost of upgrading utilities to support these additional requirements could be so high that it might render the entire project financially unfeasible. Therefore, to assist the client project manager and see that they have a viable project, it is crucial to engage with the utility team early on to determine the appropriate compressor sizing.
The key parameters for utility co-ordination that governs compressor size are:
n Short circuit and impedance information: obtain data on short circuit capacity and reactance-to-resistance ratio at the point of interconnect to the facility.
n Distance from substation: measure the distance from the facility to the substation to account for voltage drop and determine the cost of duct banks or poles.
n Flicker and voltage dip requirements: ensure the facility meets utility requirements to avoid operational issues with neighbouring facilities.
n Electrical utility tariff structure: understand how the utility calculates peak demand and any additional costs associated with motor starts.
n Power factor requirement: maintain a minimum power factor (typically 0.95 or higher) as mandated by the utility.
n Number of feeders: ensure an adequate number of feeders are available for reliable and isolated power supply to the facility.
n Transmission line and substation capacity: verify the availability of transmission line capacity and substation capacity for reliable operation.
n Type of grounding: design considerations for solidly grounded systems to ensure personnel safety and limit arc flash incident energy.
n Contract timeline: establish contracts with the utility early to avoid delays, ensuring power is available at the end of construction.
n Substation upgrade timeline: understand the utility’s timeline for engineering, installing, and commissioning substation upgrades to support the project.
Figure 1. Typical stage gate steps in major capital projects.
Figure 2. Typical discipline sequence for developing large capital projects.
Execution Excellence for Predictable Results
From equipment upgrades for regulatory compliance to executing large capital projects, our team is ready for any challenge.
How electrical aspects govern compressor sizing
Voltage dip and flicker requirements are essential in determining the maximum horsepower capacity for the motor and, by extension, the largest compressor size that can be selected without necessitating an upgrade to the utility infrastructure. This information allows the process and mechanical teams to define the compressor’s required capacity, often measured in ft3/min or litres/sec based on the expected flow rate.
Understanding the short circuit current rating is critical in selecting the appropriate compressor type (e.g. reciprocating, rotary screw, centrifugal, scroll) and motor starting mechanism. This is particularly important for integrally geared compressors where a VFD may not be implemented if the utility is weak. This data allows for the optimisation of the load profile, ensuring the compressor meets the specific project requirements.
Compressors typically start in either under loaded or unloaded conditions. This aspect helps determine the required starting torque and the most suitable starting mechanism for the motor. With this information, the process and mechanical teams can reverse-engineer the discharge pressure requirements to ensure they remain within the maximum horsepower limits, thereby preventing costly upgrades to the utility infrastructure.
The efficiency of the compressor can be assessed based on the motor’s horsepower and power factor capabilities. Higher compressor efficiency and motor power factor result in reduced strain on the utility supply, contributing to a more energy-efficient and cost-effective system.
Based on the maximum motor horsepower determined through utility coordination, the compressor vendor can specify the required displacement, which refers to the
volume of air or fluid the compressor can move per cycle. This helps match the motor size to the operational needs of the system.
The stroke length of the compressor is directly proportional to the horsepower required. This is a key design consideration for compressor vendors, as it affects both the mechanical design and the overall power requirements of the system.
Early coordination with utilities during the feasibility phase will prevent delays, optimise costs, and ensure a reliable power supply for seamless project execution. At the same time, it will also provide proactive guidance to process and mechanical vendors with design limits and constraints for compressors, and other turbomachinery that requires electrical support.
Key parameters for motor selection and starting methods
Selecting the correct type of electric motor is critical to meet the project cost and performance target. Induction motors are generally preferred due to their simplicity, reliability, and ease of maintenance. Applications up to 15 000 hp are suitable for induction machines. Between 15 000 - 25 000 hp, one can select either induction or synchronous machines. Anything beyond 25 000 hp is better suited for the synchronous machines. However, it must be noted that the cut-off range for one over the other will change based on the motor speed. For slow speed machines, the cut-off range is at a lower horsepower range. The motor vendor is the best source of information for selection criteria. The next important decision point is around how to start the electric motor and the compressor. While there are numerous ways to start the machine, the two most evaluated methods are using soft starters or VFDs.
Pony start motors
The cheapest option to start the compressor motor is to use the pony start motors to provide the initial high torque support to rotate the motor from stand still position. Once momentum is picked up, the electromagnetic force within the stator winding will ensure that the rotation is sustainable and the pony motor is disconnected from the circuit. The only limitation is if the compressor is started under loaded conditions, then the starting torque requirements would be outside the capabilities of pony motors, and the project might have to explore electrical solutions like soft starters or VFD.
Soft starters
Soft starters are an economical option to limit inrush current and manage acceleration time. Operators must ensure the
Figure 4. Recommended project execution strategy.
Figure 3. Starting mechanism of a compressor motor using variable frequency drive (VFD).
inrush current limit meets utility requirements (300 - 450%) and perform motor starting analysis to confirm that acceleration time is within acceptable limits.
VFDs
VFDs are an option if soft starters are not viable. VFDs come in diode-based and active-based converters. VFDs limit inrush current to 100% and can start large machines on very weak utility systems. Figure 3 shows a typical system for starting and running a 20 000 hp synchronous motor.
Strategies for integration
To integrate electric motors and drives into refining and downstream operations, it is essential to engage electrical manufacturers early. This involves several steps:
n Initial consultation: engage manufacturers during the feasibility study (FEL-1/2) phase to understand the technical requirements and constraints. This early consultation can help to identify potential challenges and develop strategies to address them.
n Design collaboration: work closely with manufacturers during the design phase to ensure compatibility and an optimised system performance. This collaboration can lead to more efficient and reliable systems that are better suited to the operational requirements of the refinery.
n Project management: establish clear communication channels and project management practices to coordinate efforts between all stakeholders. This includes regular meetings and updates to ensure that everyone is aligned and working towards the same goals.
n Training and support: ensure that personnel are adequately trained and that support is available for maintenance and troubleshooting. This includes providing training programmes and resources to help the workforce adapt to the new systems.
n Case studies and examples: ask for successful examples of early engagement in similar projects. This can provide valuable insights and lessons learned that can be applied to future projects.
Conclusion
The transition to electric motors and drives in the refining and downstream
industry offers numerous benefits. However, the success of such projects hinges on identifying the electrical constraints and resolving those through the early engagement with electrical manufacturers, as shown in Figure 4. By adopting best practices, industry stakeholders can ensure the successful integration of electric systems and achieve their project goals.
References
1. EBERHART, D., ‘Are the Stresses of Middle Age too much for Today’s Refineries?’, Canary USA , (20 February 2014). https:// canaryusa.com/stresses-of-middle-age-for-todays-refineries/ 2. ‘Frequently Asked Questions (FAQs) When was the last refinery built in the United States?’, US Energy Information Administration , (2024), https://www.eia.gov/tools/faqs/faq. php?id=29&t=6
As the world transitions away from fossil fuels to fulfil global energy needs, it is becoming increasingly clear that industries with a high demand for thermal heat to run their processes have overlooked the challenge of heat generation. This is certainly the situation within the oil and gas downstream industry and the hydrocarbon processing industry, which have invariably had an overreliance on fossil fuels.
In the case of energy flows in large scale plants, smaller scale solutions (such as direct heat generation by electricity via classic resistance heaters) are insufficient. Simply put, a small plant that produces heat via direct electric heaters is not a viable solution for plants in the multi-MW class. For processes requiring temperatures above 250°C/482°F (for special chemical processes, cement, metal, and glass production, for example) it makes sense to use direct electrification by arc, plasma, induction, resistance, or other heater types. Hydrogen, derived from electrolysis, also works for most of the aforementioned applications. However, it is produced from electricity with high energy losses, and it requires greater efficiencies, or an abundance of renewable electricity, before it can be widely deployed.
While the solution for the decarbonisation of the process and downstream industry may be electrification, the industry
has to use renewable energy in the electricity mix in a wise way: because there are many other areas of daily life that also require precious renewable electricity to decarbonise.
Nevertheless, modern daily life does provide a useful insight for electric alternatives to fossil fuels. Research shows that the best methods to heat domestic homes in colder climate areas are through renewable heat from heat pumps, district heating, or a combination of both and other sources (biomass and solar, for example). Similarly, another compressor-based technology sits in sharp contrast to the above-mentioned direct routes of converting electricity into process heat: mechanical vapour recompression (MVR) technology and its close sister, the industrial heat pump.
While industrial, large scale heat pumps rely on a closed loop, filled with a carefully selected working fluid (the refrigerant) to fulfil the duty of heat recycling, MVR technology utilises the very same fluid that is used in the process to recycle process heat. Importantly, depending on the temperature levels, in most situations these two technologies – heat pumps and MVRs – offer a much higher electricity-to-heat efficiency than other technologies.
This article will specifically explore the role direct MVRs can play in the energy transition within the petrochemical, chemical,
Rasmus Rubycz, Atlas Copco Gas and Process, Germany, assesses the benefits that mechanical vapour recompression (MVR) technology could provide for heat generation.
and downstream industry. It outlines how the compressor plays a central role in the success of MVR systems, and it provides an overview of a case study in the Netherlands, which highlights MVR’s potential.
The central role of the compressor
As with heat pumps, though MVR technology is proven and not new, innovations have improved its performance over many decades. Central to the success of MVRs is the compressor. Together, with the electricity invested, the system delivers a blend of recovered and electric heat that is locally carbon free, ideally with the electricity invested from a carbon free source. Even if driven by electric power from a fossil fuel power plant, the heat from an MVR always has a lower carbon intensity than the same amount of direct fossil fuel derived heat.
Integrally geared radial turbocompressors come with a special feature that makes them a good match for high-temperature MVRs. In this type of compressor, it is possible to access the gas flow between the stages, allowing the insertion of cooling gas. This, in turn, improves the efficiency of the cycle with a very high temperature lift (80 K and higher) compared to a single-stage compressor or blower. To compensate for fluctuations in heat demand, the compressor
stages can be precisely controlled via inlet guide vanes (IGVs). In most cases, the entire mechanical control system makes expensive power electronics for speed control redundant. In fact, in critical applications in large production plants, a simple mechanical power and capacity control is often the preferred option.
For the downstream industry, one of the most omnipresent auxiliaries is low-pressure steam of between 2 - 5 barg (30 - 80 psig), which is commonly used as a heating medium for distillation and other process duties. Instead of swapping out miles of steam lines or distillation tower reboilers for electric alternatives, installing a local MVR compressor at the distillation tower manages the shift to an electricity-based process without much change to the infrastructure. Furthermore, as it takes in otherwise lost low-grade waste heating in the form of the top vapour, it reduces the thermal load on the cooling water system.
Vapour and steam-booster compressors
Modern MVR systems can provide water steam at discharge pressures up to 40 barg (580 psig), which opens the range to medium and high-pressure steam applications. Other fluids may
be compressed to higher pressures, depending on their correlating temperature. Following the golden rule in heat recovery, it is important to ‘collect the heat at the highest temperatures possible.’ In a distillation process, for example, the heat of an overhead condenser is usually transferred to a cooling-water loop and dissipated. Recovering the heat of the overhead vapour is directly possible by utilising MVR, which is subsequently sent to the bottom reboiler of the column. There, the vapour condenses to a liquid and rejects its latent heat to the fluid inside the column, which in turn boils. The energetic cycle is closed and only fractions of the heat are dissipated.
MVR technology allows for the direct recompression of most widely used fluids, such as hydrocarbons, water, organic compounds, and alcohols, which then raises the vapour pressure and the condensation temperature. As the heat transfer coefficient and temperature of the recompressed, condensing
vapour is lower than the used water steam, the introduction of MVR technology often requires a new bottom reboiler. However, and in contrast to a heat pump, this is the only heat exchanger in the process, which keeps the efficiency high. Energy efficiency of machines is measured in coefficient of performance (COP), which shows the ratio between the recovered thermal power and the supplied electrical compressor power. The COP value indicates the energy efficiency of a range of machines, such as chillers, heat pumps, and MVRs. Typical MVR applications can reach COP values up to 10, an exceptional level if compared to heat pumps and up to 10 times more efficient than direct electrification (and much more than hydrogen).
Case study: MVR at Terneuzen
In a pilot project in Terneuzen, in the south west of the Netherlands, a plant uses MVR to upgrade low-pressure steam and reuse it to supply energy. Central to the plant’s MVR solution is an Atlas Copco Gas and Process two-stage integral gear centrifugal compressor, which compresses superheated steam from 3 barg (43.5 psig) to 12.5 barg (181.3 psig) in two steps.
For the Terneuzen plant, the company designed the two-stage compressor with one pinion, with two impellers on each end. The number of stages is defined by the pressure ratio limit for each stage, though, if required, it would have been possible to design a three-stage compressor for this purpose (with the advantage of a slightly lower power consumption of the e-motor).
The nominal mass flow of the installation is 12 tph and the steam is cooled by water injection with a desuperheater at the inlet and between stages. The larger droplets are caught downstream by a knockout drum and the steam enters the compressor on the suction side at 3 barg (43.5 psi) and a temperature of 150 - 220°C (302 - 428°F). The steam is sent through the desuperheater and the knockout drum in case temperatures reach higher than 170°C (338°F), to avoid higher temperatures in the compressor discharge stage.
Between late 2020 and late 2021, the measurements resulted in an overall COP of 7.5. A COP of 7.5 means that for 1 MW of electricity, 7.5 MW of thermal energy was produced. In simple terms, COP shows the ratio between the recovered thermal power and the supplied electrical compressor power.
After reaching a COP high of 7.5, as in the Terneuzen case study, the expectations on the potential of steam compression are certainly high. In addition to a good COP achievement, steam recompression underpins natural gas savings and CO2 emission reductions. The result at the plant was a reduction in natural gas usage of around 10 million m3/y and a net reduction in CO2 emissions of 17 800 t.
Outlook
This article has shown that MVR systems are capable of providing an efficient form of heat generation. As the world transitions away from fossil fuels to fulfil growing energy needs, industries with a high demand for thermal heat to run their processes can no longer overlook the challenge of heat generation. MVR technology is not new, and it has proven its reliability over decades. Underpinned by modern compressor technology, MVR is recognised as a key element in industrial decarbonisation plans.
Figure 3. Pilot project in Terneuzen, the Netherlands.
Jens Wulff and Dr David Franzen, NEUMAN & ESSER, Germany, analyse how having knowledge of the entire hydrogen value chain is crucial for providing the best solution.
As hydrogen can take on numerous important functions to decarbonise or de-fossilise the economy, industry, and energy supply, it has a key role to play in mastering the climate crisis. To achieve the associated technological transformations around the world, an integrated view of the components of the hydrogen value chain, which are related to each other, is of great importance.
One of the major challenges of the coming decades will be the decarbonisation of the economy to achieve climate neutrality by switching to renewable energies and by linking the energy, industry, building, and mobility sectors. As electricity generation from renewable energies such as wind and solar power is volatile, reliable and cost-effective storage and transportation options for large amounts of energy are needed.
An integrated and aligned view beyond the single components of the value chain is necessary to ensure the respective solution offers optimal results in terms of overall costs. Therefore, it is important to know the various options and requirements for the stages of the value chain.
Energy sources for hydrogen production
In principle, all fossil fuels and any form of biomass or electricity are suitable as energy sources for hydrogen production. However, the hydrogen produced is classified differently later in the hydrogen colour spectrum depending on the energy source. When fossil energy sources are used, this is referred to as grey hydrogen. If the resulting CO2 is captured and stored, it is referred to as blue hydrogen with a reduced CO2 footprint. If the hydrogen is produced by electrolysis,
the source of electrical energy used is relevant for the classification; emissions from electricity production are considered to classify the hydrogen by colour. If only grid electricity is simply used, grey hydrogen is also produced here. The use of renewable energies such as wind, solar, or hydropower produces green hydrogen.
Methods for hydrogen production
The method and technology used to produce hydrogen are a direct result of the chosen energy source. The most common source currently is methane, which is converted into hydrogen in steam methane reforming (SMR). This produces around 10 t of CO2 per t of hydrogen, i.e. around 300 g/kWh. An alternative process is pyrolysis, in which the methane is passed
through molten tin in a bubble column reactor. Elemental carbon is produced as a by-product. By using biomethane with appropriate certification, the carbon footprint of these methods can be significantly improved and even green hydrogen can be produced. However, direct CO2 emissions cannot be completely avoided.
In electrolysis, hydrogen is produced without direct CO2 emissions. There are various technologies with different degrees of maturity and individual advantages and disadvantages. However, what all processes have in common is that water is split into the molecules hydrogen and oxygen through an electrochemical reaction. Alkaline electrolysis (AEL) and proton exchange membrane electrolysis (PEM) are currently well established processes on the market.
In PEM electrolysis, high-purity water is split on precious metal catalysts. The membrane used prevents the resulting gases from mixing. As a result, a high level of gas purity is achieved at outlet pressures for the hydrogen of around 30 bar. In addition, the PEM can follow a volatile current profile very well. However, the precious metal catalysts also lead to higher costs.
In AEL electrolysis, an alkaline electrolyte is used, which reduces the required activity from the catalyst itself. A porous separator is used instead of a membrane, which leads to higher cross-contamination. Due to the process, the contamination increases further in partial load operation, making it more difficult for the AEL electrolysis to follow a volatile current profile. Further, entrained alkaline electrolyte can pass the electrolyser and needs to be removed for the further processes. However, the lack of precious metals results in lower investment costs.
Storage of hydrogen
Due to its low volumetric energy density, it does not make sense to store hydrogen under environmental conditions. These basic methods are suitable for achieving a sufficient energy density:
n Physical binding to a carrier substance such as in solid metal hydride storage or in organic carrier liquids (LOHC).
n Liquefaction (LH2) by cooling to below the boiling point (-252°C) with a density of around 70 g/l.
n Pressurised storage at various pressure levels. Depending on the pressure level, mass, and load cycle requirements, various types of tanks are used, from simple steel tanks to composite tanks.
n Chemical binding in ammonia or hydrocarbons. Depending on the chemical compound, various further storage options are possible.
All methods have limitations in their application, just as almost all storage methods have one thing in common: the hydrogen must be compressed for storage using compressor systems.
Transportation and distribution
There are several options for transporting hydrogen as a pure substance to the end user or interim storage. Mobile pressure storage units such as trailers or containers can transport quantities ranging from a few kilograms to around 1.5 t of hydrogen, depending on size and pressure level. If, for example, a freight train is used as a ‘rolling pipeline’, around 60 t of
ASME PCC-2 Compliant Heat Exchanger Tube Plugging System
Trusted by power and process plants around the world as their go-to tube leak solution, Pop-A-Plug Tube Plugs from Curtiss-Wright are engineered for optimal performance throughout the life cycle of heat exchanger equipment. Controlled hydraulic installation eliminates welding and time-consuming pre-/post-weld heat treatments that can cause damage to tubes, tube sheet ligaments and joints.
• Simple hydraulic installation − no welding!
• Helium leak tight seal to 1x10 -10 cc/sec
• 100% Lot tested to ensure unmatched quality
• Pressure ratings to 7000 PsiG (483 BarG)
• Wide range of sizes and ASME/ASTM certified materials available
Ask about our Smart Ram 640T for fast & reliable cordless installations!
877.383.1029 l est-sales@curtisswright.com l cw-estgroup.com/HydroEng25
hydrogen (equivalent to around 2 GWh of energy) can be transported. An LH2 trailer can hold around 3 - 4 t of hydrogen, and a large LH2 tanker with a volume of around 150 000 m3 of LH2 could deliver around 10 000 t of hydrogen. Pipelines offer the possibility of transporting very large capacities of over 30 GW per pipeline and represent a significant storage volume.
End user
Hydrogen can be used in many ways. In principle, it can be converted back into electrical energy, heat, or material conversion. The reconversion into electricity can take place in fuel cells, e.g. in the mobility sector, or in gas turbines as a back-up in an energy system. In processes with high heat and energy requirements, such as in the glass or paper industry, hydrogen can be converted directly in appropriate burners. In the chemical industry, hydrogen is an important building block for higher-value products. In some areas, the functions can also be combined. In the steel industry, for example, hydrogen can be used to provide the temperature and at the same time act as a reducing agent to produce raw iron from iron ore.
There are various advantages and disadvantages associated with the use of hydrogen in all areas. In addition, different requirements are placed on hydrogen depending on the area of application. During reconversion into fuel cells, around 50 - 60% of the lower calorific value of hydrogen is converted into electrical energy and the rest into heat. Fuel cells require hydrogen of the highest purity, which is not necessary when using hydrogen as a fuel in turbines or combustion engines; however, their efficiency is only around 30 - 40%.
Choosing the right compressor technology
This brief overview of the components of the hydrogen value chain shows that precise knowledge of the individual stages is necessary to find optimal solutions. Moreover, it is obvious that compressors are particularly important for storage and transportation. Therefore, the selection of the appropriate compressor technology in coordination with the specifications and requirements of the adjacent components of the value chain is of utmost importance. Due to the low molecular weight of hydrogen, compressors based on the displacement principle are the method of choice. Isothermal efficiencies of over 80% can be achieved there. If high-purity hydrogen is required, water-injected screw compressors or dry-running piston and diaphragm compressors are suitable.
Water-injected screw compressors achieve final pressures of 15 bar, dry-running crosshead piston compressors over 300 bar, and diaphragm compressors and hydraulically driven piston compressors well over 1000 bar. For appropriate delivery quantities, the diaphragm compressor and the hydraulically driven piston compressor are dependent on higher suction pressures. The diaphragm compressor can compress around 1000 Nm3/h from 30 to 1000 bar in three stages. In contrast, a large-volume piston compressor with a drive power of 22 MW can compress more than 800 000 nm3/h from 40 to 80 bar. This means that the output of 4 GW electrolysis can be transported by a single large scale compressor. If purity is not an important criterion, oil-flooded screw compressors for pressures of up to 50 bar or piston compressors with cylinder lubrication for final pressures of up to 1000 bar can also be used.
Different pressures require different systems
The typical trailers for filling station supply have pressures between 300 - 500 bar. Trailers with 300 bar steel containers can transport around 500 kg of hydrogen and are often limited in the number of load cycles. A 40 ft MEGC gas container with 380 bar pressure can transport around 1000 kg of usable hydrogen and usually has a significantly longer service life. However, it is more expensive.
Depending on the electrolyser, the typical discharge pressures range from a few millibars to around 30 bar. A system with atmospheric discharge pressure and a system with 30 bar discharge pressure are compared here. The filling pressure of the trailer should be 500 bar. At atmospheric suction pressure, pre-compression is unavoidable due to the small stroke volume of the diaphragm compressor. Four compressor stages are required to reach over 30 bar. At 30 bar suction pressure, the diaphragm compressor can be compressed to more than 500 bar in two stages. This means that the supposed cost and efficiency advantage of an electrolyser with atmospheric discharge pressure is relativised by four additional compressor stages and the necessary use of two compressor types. The efficiency of mechanical compression in the reciprocating compressor corresponds almost exactly to the efficiency of electrochemical compression in the pressurised electrolyser.
In addition, the choice of discharge pressure and the type of electrolysis also has a significant impact on the choice of gas drying and oxygen removal. Thus, the selected electrolyser pressure and also the energy supply has a major impact on the choice, dimensioning, and complexity of the compressor and gas treatment system.
This explains how important it is to know the characteristics and limits of the different components in the hydrogen value chain. The cost benefits of investing in a low-pressure electrolyser can be completely offset by the higher operating costs of a complex compressor system. This is where providers of integrated solutions that also offer aftermarket service can gain a significant competitive advantage.
Development requirements for compressors and outlook
Proven compressor technology is already available for feeding into pipelines and caverns. The main challenge is to ensure purity depending on the end user. A consistently high level of purity in the cavern-connected hydrogen pipeline system of the future appears difficult to achieve.
The demand for high-purity hydrogen will increase sharply with the increasing conversion of mobility, especially in the truck, bus, and train sectors. This means that both compressors for filling trailers and hydrogen refuelling station compressors will have to cope with larger high-purity flow rates at pressures in the region of 500 bar in the future. For this reason, the development of dry-running piston compressors that can achieve flow rates of over 1000 kg/h at this pressure level must be driven forward. Those who master compression and understand the process environment can deliver significant added value.
Tim Tallon, AMETEK
Process
Instruments,
USA,
examines how optimising high hydrogen-fired combustion processes with catalytic flue gas analysis can aid efforts towards decarbonisation.
As many industries embark on the journey towards decarbonisation, most operators must confront the pressing need to meet near-term emission reduction targets, especially for those in industries that utilise combustion for heating and/or powering their processes. While major facility changes (such as carbon capture or electrification) could substantially reduce emissions, these options do not guarantee an emission reduction in the near future, regardless of the financing picture or the overall return on invested capital. As a result, many operators are evaluating alternative fuels (such as hydrogen) and better optimisation methods to improve efficiency and achieve their near-term decarbonisation targets. This article will elaborate on the role of optimisation in combustion and the flexibility of using catalytic detectors in flue gas analysis to safely monitor the combustion process when firing high hydrogen fuels at the burner.
Uncovering efficiency in combustion processes
For combustion, efficiency and optimisation opportunities begin at the stack – by evaluating excess oxygen and combustibles levels in the flue gas. These two measurements provide clues for balancing safety and efficiency. By itself, an excess oxygen measurement provides an operational setpoint to ensure that there is always
sufficient air at the burner for an excess of oxygen to exist in the flue gas. Excess oxygen levels in the flue gas correlate directly with the air to fuel ratio, and the incoming excess of combustion air at the burner. For natural gas, approximately 20% excess of combustion air produces roughly 3% excess oxygen in the flue gas, as depicted in Figure 1. The excess of oxygen represents the safety margin derived from operating the combustion air slightly higher than stoichiometric conditions (i.e. 0% excess oxygen). However, as more combustion air passes through the burner, more fuel is also needed to heat up the increasing amounts of inerts and the ‘passing through’ excess oxygen. As a result, higher levels of excess oxygen also correlate with higher levels of fuel consumption and higher levels of carbon dioxide (CO2) and nitrogen oxides (NOX) emissions. For any operator, there is a trade-off between the higher safety margin of combustion air at the burner, and the allowable levels of fuel usage and CO2 and NOX emissions. Fortunately, additional measurements can be leveraged to gain greater visibility on optimal combustion operation.
In particular, a combustibles measurement provides additional insight into the quality of the combustion reaction. Capable of measuring both carbon monoxide (CO) and hydrogen, a combustibles detector provides a means to monitor the onset of incomplete combustion. At high levels of excess oxygen, a combustibles measurement may see sub-100 ppm levels of
combustibles (CO + H2) or less as more oxygen is present to fully combust the fuel. However, as excess oxygen levels decrease, operators see the combustibles levels increase – gradually at first and then exponentially higher as oxygen levels approach stoichiometric conditions. This point where combustibles levels shift from gradual to exponential is often referred to as the ‘combustibles breakthrough’ point. For safety, it is imperative that any combustion process remains below the combustibles breakthrough point during normal operation. It is also important to have multiple alarms to alert and respond to high levels of combustibles.
From an optimisation standpoint, the combination of an excess oxygen measurement and a combustibles measurement provides visibility to see a window for safe and efficient operation. The excess oxygen measurement provides a setpoint to ensure sufficient combustion air is going to the burner. In contrast, the combustibles measurement provides a secondary reference point for monitoring incomplete combustion and alerting for combustibles breakthrough. By leveraging both of these measurements together operators can systematically reduce the excess oxygen setpoint to a lower level that is still within the safe range, and ensure it is still below the combustibles breakthrough point. As depicted in Figure 2, an operator who may set their excess oxygen levels at 2% may be able to reduce this to slightly above 1%, when also monitoring
for combustibles. The benefit of these two measurements working together is what is typically called ‘combustion optimisation’. As excess oxygen levels safely decrease to a more optimum control point, operators are able to reduce both their fuel usage at the burner and their emissions to atmosphere.
Recognising the nuances of high hydrogen fuels
While most hydrocarbon fuels typically generate combustibles in the form of CO rather than hydrogen, the use of high hydrogen fuels presents a number of nuances to consider in the combustion process. In particular, hydrogen varies widely from methane on a number of physical and combustion properties, and these differences require careful consideration when transitioning from a typical hydrocarbon fuel to a high hydrogen fuel.
From the standpoint of physical properties, a hydrogen molecule is nearly eight times smaller than methane, resulting in hydrogen being eight times less dense compared to methane, which also causes a greater chance of hydrogen leaking out of piping. At the same temperature, hydrogen molecules are also nearly three times faster compared to methane molecules, resulting in faster diffusion in any given space. Finally, hydrogen has a much higher range of flammability in the air compared to methane. With all these points, operators using high hydrogen fuels must recognise the faster diffusivity, lighter density, and increased flammability of hydrogen as an additional constituent in the fuel – as summarised in Table 1.
From the standpoint of combustion properties, more hydrogen is needed to achieve the same heat release as methane (on a volumetric basis). That is, hydrogen has a volumetric net heating value that is three times less than that of methane, requiring three times more hydrogen to provide an equivalent heat release at the burner. Applying this to high hydrogen fuels, operators should be aware of the need for higher volumetric flow rates to achieve the same heat releases when compared to hydrocarbon-based fuels. In the extreme case, re-sizing a burner to switch from natural gas to pure hydrogen would require three times the volumetric flow, and piping lines and nozzles would need to be considered and potentially re-sized accordingly.
With additional considerations summarised in Table 2, hydrogen burns at a higher flame temperature, ignites with much less energy, and moves with a significantly faster fundamental burning velocity. There are several important implications of these differences. Notably, the faster molecules contribute to a faster burning velocity (flame speed) which creates a greater risk of flashback in existing premix burners. Also, the hotter flame temperature creates a risk of greater thermal NOX production, especially for hydrocarbon fuels blended with hydrogen, and this increase can be exaggerated and penalised further for those permits written on a dry basis – as combustion of hydrogen generates approximately 50% more water vapour compared to the combustion of methane. The hotter flame temperature also poses the risk of overheating nearby metal, such as the burner flame rod or nearby radiant heater tubes. Finally, the combustion air requirement for hydrogen is roughly 20% less air than that of methane at the same heat release. What is important to note here is that a higher
Figure 2. Example of combustion optimisation using both the excess oxygen and combustibles measurements.
Figure 1. Correlation between excess oxygen in the flue gas with excess combustion air at the burner (when using natural gas as the fuel).
WWW.ZWICK-ARMATUREN.DE
volumetric flow of fuel will be needed to achieve the same heat release with a high hydrogen fuel (up to three times that of natural gas), but with approximately 20% less combustion air at
Flammability limits (vol%) 4 - 75 5 - 15
* Calculated at STP, 0°C and 101.3 kPa, in which the molar volume is 22.4 m3/kmol
** Calculated using kinetic theory at 1200 K (926°C, 1700°F)
Figure 3.
of an RTD-type combustibles detector, capable of measuring both carbon monoxide (CO) and hydrogen at ppm levels.
the burner. Operators cannot simply switch from hydrogen to natural gas without allowing for the proper ramp up of combustion air at the burner, otherwise there is a fuel-rich condition or loss of flame.
Overall, any switching from hydrocarbon-based fuels to high hydrocarbon fuels requires that operators recognise the need to monitor combustion air flow to the burner – as well as the faster, more diffusive, and more flammable nature of hydrogen, and its hotter, faster flame.
Leveraging catalytic flue gas analysis in high hydrogen combustion
With much greater variability at play at the burner, flue gas analysis using catalytic detectors provides one proven path to monitor and alert for potentially unsafe conditions, even with the challenges of high hydrogen fuels, while also working to achieve combustion optimisation. In the case of high hydrogen fuels, catalytic detectors can be tuned to measure a range of compounds, including hydrogen, to monitor for safety and efficiency.
To measure ppm levels of hydrogen, a catalytic combustibles detector can be used and calibrated to measure both CO and hydrogen in a single measurement, in order to monitor and detect the onset incomplete combustion when using high hydrogen fuels. Two types of technologies are often used for the elements of these catalytic detectors: resistance-temperature detectors (RTD) and ‘hot-wire’ detectors using catalytic bead pellistors. As depicted in Figure 3, these detector types use active and reference elements to measure the relative change in resistance as combustibles oxidise on the surface of the active elements. With proper calibration, a catalytic combustibles measurement can provide a means to reduce excess oxygen levels and provide greater visibility on the health of the combustion reaction, even when using high levels of hydrogen in the fuel.
To measure percent levels of unburnt hydrogen in the flue gas, a catalytic detector can also be tuned to measure hydrogen and lighter hydrocarbons (often methane) in a single measurement, to provide additional safety monitoring for the loss of flame or burner leaks. Using hot-wire catalytic bead pellistor elements exclusively, these detectors operate hot enough to crack methane and monitor for percent levels of hydrogen, when properly calibrated for hydrogen. Percent level measurements become increasingly more important when evaluating the frequency of switching from high hydrogen fuels to natural gas, as more combustion air is required to handle methane at the same heat release and to ensure that no unburnt fuel escapes into the firebox.
Conclusion
As operators confront near-term emission targets, many are considering high hydrogen fuels as a means to decarbonise existing fired equipment and reduce their CO2 emissions. However, hydrogen acts as a much more diffusive, faster, and reactive molecule compared to methane, and careful attention should be given to safely monitor for its presence in the firebox. Nevertheless, with the use of catalytic flue gas analysis, operators can achieve combustion optimisation to drive greater efficiency gains, and to further reduce emissions and fuel usage – even when using high hydrogen fuels.
Table 1. Comparison between selected physical properties of hydrogen and methane
Table 2. Comparison between selected combustion properties of hydrogen and methane
Example
Scott Sayles, Pattabhi Raman Narayanan, and Jessica Hofmann, Becht, consider technological pathways for sustainable aviation fuel (SAF) and its role in the road to net zero emissions by 2050.
The aviation sector faces significant challenges in achieving its goal of net zero carbon emissions by 2050. Sustainable aviation fuel (SAF) represents a critical component in this decarbonisation strategy, and offers a drop-in fuel alternative that can reduce lifecycle greenhouse gas emissions by up to 80% compared to conventional jet fuel. Despite its potential, the current global supply of SAF is insufficient, accounting for only 0.01% of total jet fuel demand. To meet the industry’s sustainability targets, SAF production must scale dramatically, including setting a specification for the minimum concentration of renewable jet in fossil jet to qualify as SAF. However, the challenge of scaling SAF production is immense. To bridge the current gap between supply and demand, refineries will need to adopt new technological pathways, utilise a broader range of feedstocks, and navigate emerging certification and regulatory frameworks to ensure that SAF meets stringent sustainability criteria.
This article examines the key technological routes for producing SAF, including hydrogenated esters and fatty acids (HEFA), alcohol-to-jet (AtJ), gasification/Fischer-Tropsch (GFT), and power-to-liquid (PtL) processes, and the role refineries can
play in scaling up these solutions. By exploring these opportunities and challenges, refineries can position themselves at the forefront of the aviation sector’s sustainable future.
Key technological pathways for SAF production
According to Annex 16, Volume IV of the International Civil Aviation Organization (ICAO), a SAF conversion process is defined as the technology used to convert a feedstock into aviation fuel. These processes are evaluated and approved by organisations like ASTM International to ensure their safety, sustainability, and compatibility with existing aviation systems.
As of July 2023, ASTM International has approved 11 SAF conversion processes, with another 11 currently under evaluation. To be used under ICAO’s Carbon Offsetting and Reduction Scheme for International Aviation (CORSIA), SAF must also meet strict sustainability criteria. Approved processes, including Fischer-Tropsch (FT), HEFA, synthesised iso-paraffins (SIP), and AtJ, have CORSIA default life cycle emission values, ensuring they provide substantial emissions reductions.
D7566 Annex A7 Synthesised paraffinic kerosene from hydrocarbonhydroprocessed esters and fatty acids
Approved SAF conversion processes
ASTM D7566 defines the key conversion pathways and their blend limits with conventional jet fuel (Table 1).
The HEFA pathway was formally approved by ASTM in 2011. It involves the refining of vegetable oils, tallow, or waste greases into SAF through the deoxygenation and hydroprocessing of the feedstocks. It is the most mature of the SAF technologies and currently used today on a commercial scale.
AtJ using isobutanol as a feedstock, was approved in 2016, followed by the approval of ethanol as a feedstock in 2018. This pathway converts alcohol feedstocks like sugars, starches, hydrolysed cellulose, and industrial waste gases into SAF and other clean fuels, through several chemical processes.
GFT was the first SAF pathway to be approved by ASTM, in 2009. The process involves the conversion of a synthesis gas (syngas) into liquid fuel via a FT reaction. FT is a common commercial process for producing liquid fuels from both coal and natural gas. Syngas is produced from the gasification of cellulosic feedstocks or municipal solid waste. The syngas is then converted to a mixture of hydrocarbons, the main chemical component of jet-fuel in a FT reactor, before being further refined into SAF and other clean fuels.
PtL is another type of drop-in fuel produced using green hydrogen and sustainable carbon dioxide (CO2). Like the advanced biofuel pathways, the PtL process can also be used to produce a series of clean fuels. PtL involves the conversion of syngas into SAF via a FT reaction. However, the syngas is produced from either green hydrogen and captured CO2 via a reverse water-gas-shift reaction or directly via co-electrolysis using solid oxide electrolysis cells and clean electricity.
Process flow schemes for hydrotreating and hydrocracking are similar. Both use high-pressure hydrogen to catalytically remove contaminants from petroleum fractions. Both achieve at
Ethanol, isobutanol, isobutene from biomass
least some conversion, and they use the same kinds of hardware, whereas hydrotreating and hydrocracking differ in other ways. For a given amount of feed, hydrocrackers use more catalysts and operate at higher pressures. They also use different catalysts. Because they make large amounts of light products, hydrocracker fractionation sections must be more complex. In some hydrocrackers, unconverted oil from the fractionation section is recycled, either back to the front of the unit or to a separate cracking reactor.
The impact of feedstocks on SAF scalability and sustainability
Types of feedstocks used for SAF include agricultural residues, municipal solid waste, dedicated energy crops, wet wastes, and renewable methanol.
Biofuels are divided into three categories: first generation, second generation, and third generation, from the least to most environmentally advantageous. SAF derived from biomass stands out as a leading contender for the aviation sector.
The primary sources of biomass-waste feedstocks are agricultural and forestry residues. Also, feedstocks such as lignocellulosic biomass, sugar beet, corn grain, sawdust, forest residue, wood residue, sugarcane bagasse, straw, agricultural wastes, and others have the characteristics for producing SAF from biowaste. In addition, the second generation feedstock sourced from animal fats, used cooking oil, and nonedible oil seeds have also been used for SAF. The pathway involves the conversion of lignocellulosic biomass and municipal solid waste into syngas by gasification followed by FT synthesis. Microalgae is also emerging as a prominent choice for a third generation feedstock due to their rapid growth rate. However, microalgae-based SAF faces challenges such as elevated production costs, intricacies in harvesting and processing, and difficulty to meet SAF standard specifications like fossil fuels.
Municipal waste is a cost-effective source but requires expensive pre-treatment. Used cooking oil is a low-cost, easily accessible feedstock, whereas straw is inedible but has higher alkali-metal content and transport costs. Energy crops such as Jatropha and algae offer rapid growth without competing with food crops, whereas wood waste is currently low-cost due to low local demand.
A lifecycle analysis is meant to capture the entire impact in terms of carbon emitted from the first point of origination to the last point of delivery. Comparing the life cycle analysis of SAF to fossil derived jet fuel demonstrates the major net carbon benefit of SAF. A typical blended SAF with fossil derived fuel
A SUPPLEMENT TO HYDROCARBON ENGINEERING
Exploring decarbonisation technology and solutions for the downstream sector
This special supplement focuses on decarbonisation pathways for the downstream sector, highlighting innovative technology and solutions that will help you thrive within the energy transition.
Scan the QR code to download your free copy of EnviroTech 2024.
achieves a 20 - 25% reduction in emissions, with variations depending on the feedstock and blend. A lifecycle analysis is conducted to draw these comparisons, determining the final environmental footprint of a given batch. It is important to note that not all SAF is the same.
The emergence of e-fuels
E-fuel is a liquid fuel made from water and carbon dioxide in a PtL process powered by renewable energy. Hydrogen, produced via water electrolysis using renewable energy, reacts with captured CO2 using innovative technologies to make e-fuel. The use of renewable power and capturing CO2 from the atmosphere makes it a carbon-neutral fuel when it is burned, producing no net greenhouse gas (GHG) emissions.
Unlike other SAF pathways that rely on biological feedstocks, e-SAF is a groundbreaking synthetic fuel that requires green hydrogen and CO2 (biogenic or non-biogenic) to offer a clean, low-carbon alternative to fossil-based jet fuels.
Role of e-fuels in reducing carbon intensity
E-fuel is gaining momentum as a way of reducing carbon footprints in the transportation sector, which accounts for around a fifth of global energy-related CO2 emissions. At present, e-fuel is more expensive than conventional fossil fuels. Japanese automakers are eyeing e-fuel as an alternative to EVs. They believe e-fuel has an edge over biofuel as biofuel production runs the risk of destroying forests and ecosystems, especially in developing countries. E-fuel will also lead to the sustained use of advanced technology within internal combustion engines and existing infrastructure such as pipelines and gas stations.
Potential for e-fuels to complement SAF in the aviation sector
In 2023, Norwegian and Norsk e-fuel signed a strategic partnership agreement to build the world’s first large scale production facility for electrofuel in Mosjøen, northern Norway. Electrofuel, often called e-fuel, is a fossil-free aviation fuel that can be used in today’s aircraft. Norsk e-Fuel is starting the industrialisation of e-fuel production in Mosjøen, Norway, and will start to provide e-fuels to the aviation industry after 2026. Backed by a strong shareholder and partner network, the company looks to increasing production with two additional plants by 2030.
The passenger airline Norwegian and the cargo airline Cargolux have committed to the offtake of e-SAF of more than 140 000 t of fuel supply. In addition, the two companies will provide strategic support for the development of two additional production facilities by 2030.
Certification and regulatory challenges
Navigating international standards is crucial for the global adoption of SAF. The path to widespread SAF adoption faces regulatory challenges that can slow down progress due to multi-stage certification and approval processes that can be lengthy and resource-intensive. The differences in regulatory requirements between countries can also complicate approvals.
The International Air Transport Association (IATA) states that SAF must demonstrate a net carbon reduction through a
lifecycle analysis (LCA), which is an essential element of sustainability certification. Drop-in SAFs are also typically blended with conventional fossil derived jet. However, the international specifications for jet fuel developed by the ASTM aim to ensure that this is achieved safely and effectively, with current specifications allowing for a maximum of 50% SAF, depending on the SAF type used for commercial flights (compared in Table 1).
There are significant regulatory challenges to increasing the supply of SAF. These include evolving the certification and approvals process for new production pathways whilst maintaining safety and monitoring feedstock standards to ensure sustainable practices.
Scaling-up SAF production
The success of SAF scaling hinges on strategic partnerships, targeted technology deployment, supportive regulations, and financing mechanisms. Global collaboration, investment, and supportive policies are needed to bridge the projected demand-supply gap in 2030 and beyond.
The most significant economic barrier is that SAF is currently approximately two to five times more expensive than traditional fuel costs and requires favourable tax and subsidy policies to become feasible for airlines to use in the short-term. Innovation by start-ups and incumbents are helping to bridge the gap between SAF technologies and commercially viable pathways.
There is currently a lot of attention on newer technologies like PtL, which removes the feedstock-related barriers by only using water, renewable energy, and CO2 as inputs. However, HEFA is still the most mature SAF production technology today. Across North America there is a significant amount of announced HEFA production, with a proportion of AtJ which mostly comes from corn starch.
As an industry, it is possible to draw on experience in other renewables, where costs have decreased as these industries deploy. As the SAF industry develops, so too will additional feedstocks and pathways.
SAF supply chains will involve engagement with and contributions from a diverse group of stakeholders as coalitions provide a functional platform for collaboration and engagement among a diverse set of supply chain participants. Strong public-private SAF collaborations help mitigate risks for all parties; aid in establishing a secure, stable, and competitive SAF supply chain; and help establish long-term competitiveness of SAF.
SAF needs rapid technology adoption, and net zero corridors that connect global production hubs to demand centres. Also crucial are collaboration, regulation, incentives, and accounting standards.
Christi Mezzic, Emerson, details strategies to improve operator situational awareness with high-performance graphics.
Technology has advanced over the last few decades, yet there are still numerous industrial incidents that can, at least in part, be attributed to human error. In many cases, an operator did not recognise an abnormal operating condition that ultimately led to an emergency situation.
Although technology has advanced, the style of graphics the industry has been using over the last several decades has not. A useful analogy is the comparison of piping and instrumentalisation diagram (P&ID)-based graphics to flip phones from the late 1990s/early 2000s. They provided basic information and functions but were cumbersome to search for a contact and type text messages. People who made the transition from a flip phone to a smart phone can remember the feeling of their new phone being easy to use, intuitive, and making their lives easier. This is the same feeling experienced when moving to high-performance graphics.
This article discusses how current graphic designs contribute to human error and introduces how high-performance graphics can improve process safety when incorporated into human machine interface (HMI) designs.
It applies ANSI/ISA101.01 (also being developed as international standard, IEC 63303) in leveraging physical and psychological human traits to produce a more intuitive and less ambiguous environment, drawing in the user’s attention to abnormal situations long before alarm setpoints are reached, allowing more time for them to detect, diagnose, and respond in a controlled fashion, long before the situation becomes serious and time critical.
Graphic designs
Current situation
Traditional HMI designs primarily based on P&IDs often hinder the operator’s ability to detect operating abnormalities. It is common for an HMI to be comprised of a greater number of graphics than of monitors on which to display each graphic individually, so the operators must choose which graphics to display and which ones to leave hidden. To proactively identify process abnormalities, the operators methodically review each graphic a few times per shift. However, it is a tedious task requiring significant concentration, and when faced with
jump straight to pictures and charts in long reports or instruction manuals, as we’ve all heard, “a picture is worth a thousand words”. This applies to graphics, too. A trend is an excellent high
distraction or competing responsibilities, is skipped or postponed.
“60%” compared to an expected value of 50% the first digits of each, “5” and “6”, are very similar in shape.
In an attempt to resolve this, some companies have increased the number of console monitors to broaden the operator’s view of the operation, unfortunately with no real
improvement – rarely will there be enough monitors to dedicate to each graphic and anything beyond four main monitors and approximately four supplemental monitors tend to fall outside ergonomically acceptable viewing angles defined by the Engineering Equipment and Materials Users Association (EEMUA). Ultimately, this falls back on the operator to either physically move their body directly in front of each monitor or strain their body, against good ergonomics, for the same graphic review task previously described.
Another solution companies have tried is to create overview graphics so that broader sections of the operation can be viewed from fewer graphics. Many designs have provided some form of relief but are often congested to the point of being confusing or cumbersome to use.
1. Trends tell a story.
’ attention and should be states should be avoided, as it desensitizes the operator’s ability to detect abnormalitie s, like the saying, “crying wolf”
The end result is that the operator must work against human nature and ergonomics to proactively maintain a healthy operation, when quite often it is the alarm that winds up serving as the abnormality detection. This results in less time at a higher stress level for abnormality diagnosis and response time, with potentially compromised decision quality and higher risk of an incident.
The operator ultimately must work against human nature and ergonomics to be proactive, yet high numbers of alarm setpoints reached would indicate a low success rate. Furthermore, the alarm starts the race to diagnose and respond before the issue escalates, so the operator must perform these tasks under added stress and potentially compromised decision-making.
The solution
2. An equilateral triangle representing a mental model of ‘GOOD’.
Figure 3. Earliest hint of abnormal condition – PV still resides within optimum range.
The application of ISA101.01 Human Factor Design in graphics involves a hierarchical set of graphics, called high-performance graphics, designed to leverage the human mind’s strengths and support its limitations to enhances the operator’s situational awareness. Situational awareness can be broken into three elements:
n Detection.
n Diagnosis.
n Response.
To enable the operator to perform each of these tasks efficiently and successfully, graphics must provide easy problem-detection, make data collection and processing easier, and support good decision-making.
Detection
It is human nature to jump straight to pictures and charts in long reports or instruction manuals, as most people have all heard, “a picture is worth a thousand words”. This applies to graphics, too. A trend is an excellent high-performance object, as it tells a story much better than a single data point, where a relatively straight horizontal line may indicate steady state operation, yet a sudden steep curve indicates some sort of change. If an operator expects to see a straight horizontal line representing normal operation, shown on the trend on the left of Figure 1, their eye will stumble over the trend climb seen in the right of Figure 1, which represents an unexpected change. Without the trend, detecting a difference in the instantaneous value of 60% compared to an expected value of 50% is more
Figure
Figure
difficult, especially because the shape of the first digits of each, five and six, are very similar in shape.
The human mind is good at detecting what is wrong with a picture, so using oddities are a good means of drawing in an operators’ attention and should be strictly reserved for abnormalities. Attention-grabbing representations of normal states should be avoided, as it desensitises the operator’s ability to detect abnormalities.
Diagnose
Once the operator detects there is a problem, the next step is to diagnose the problem. On traditional graphics, built directly from P&IDs, the operator may need to review data from multiple graphics before making an accurate assessment. This may sound like an easy task, but as discussed earlier, the operator is usually performing tasks such as this amidst distraction and conflicting responsibilities, which can impede and confuse the data collection process. To address this, commonly compared data should be clustered together on a
single graphic, eliminating the need to sort through multiple graphics and reducing the time it takes to collect and analyse the data. In turn, this increases the chances for accurate and efficient assessments more quickly.
In some cases, multiple pieces of data can be combined into a single illustration to represent a common abnormal situation, eliminating the need for diagnosis, enabling the operator to jump straight into response mode.
The 3-point radar plot in Figure 2 illustrates a strategic data relationship, for example between acid flow valve position, temperature, and feed ratio.
Taking one leg of the triangle, acid flow valve position for example:
n Triangle centre = 0% of scale.
n Outer triangle point = 100% of scale.
n Grey rectangle = optimum process variable (PV) range.
n Dark blue triangle points = current PV.
An equilateral triangle shape creates a mental model representing a good data-relationship between the three variables, acid flow valve position, feed ratio, and temperature.
When the relationship first shifts towards the abnormal, the dark blue triangle shape begins to deform (Figure 3).
The PV still resides in the optimum PV range of each variable.
Selecting the variables that provide the first hint of abnormality is key in maximising the amount of time available to address the issue before an alarm point is reached.
If the situation worsens, dark blue information boxes appear at the perimeter of the triangle wherever a PV resides outside of its optimal range, providing extra colour to draw in attention (Figure 4).
Each of the variables now reside outside of the optimum PV range, which triggers the appearance of the dark blue boxes. The blue boxes do not represent alarm setpoints and appear before reaching an alarm setpoint, which will be illustrated in Figure 5.
It is important to minimise use of colours on a display, so as not to camouflage colour changes that represent abnormalities.
If the process continues to drift and the alarm points are met, the blue squares are replaced with flashing alarm icons, red triangles containing black exclamation points in this case.
The alarm icons will remain on the display until the alarm conditions no longer exist, but the flashing should stop once the alarm is acknowledged.
The triangular shape forms a mental model, similar to an analogue clock for telling time. When mental models are applied to common abnormal situations, the operator is able to make cognitive leaps, meaning when the shape begins to deform in a recognised fashion, the operator instantly knows the appropriate action to take without requiring time to troubleshoot the abnormal condition.
From this type of mental model, the operator’s attention is drawn in to the first hint of an abnormal condition, even when each variable still resides within their optimum PV ranges. Furthermore, the instant interpretation of the data relationship enables the operator to jump into action, without requiring time for diagnosis.
We can tailor to your requirements, produce 1 - 12 page formats, print colour or mono and more
+44 (0)1252 718999 reprints@hydrocarbonengineering.com Need
Response
Once the operator completes diagnosis and/or knows what response to take, it should be easy to make. The system should
indicate whether their action was completed without having to navigate away from the graphic from which they have been working on.
Display hierarchy
An overview illustrating the overall health of the operator’s domain is a Level 1 Overview Display. It illustrates the most critical information, in context, so that the operator is never confused about which system it represents and does not require any effort to interpret. It would include the most critical alarms, the first clues of a process deviation, key performance indicators (KPIs), and process safety metrics, all illustrated in context. It is designed to be on-display 24/7, typically on a large screen monitor. It promotes situational awareness and is particularly helpful when juggling multiple abnormal issues. At a glance, the operator immediately knows the general health of their entire domain.
A Level 2 overview display incorporates 80% of the operator’s daily tasks into unit-overviews, eliminating the need to open multiple displays to gather information to make decisions and changes. Level 2 displays can also be task-oriented, where reference data and controls for common tasks are incorporated onto single displays, such as a start-up graphic or absorber swap.
As mentioned previously, displays are traditionally built directly from P&IDs, which are designed for the construction of a facility and not based on how the human mind processes information to operate it. However, they do have a place within ISA-101’s proposed 4-level hierarchy as Level 3 detailed control displays are used for detailed troubleshooting.
Level 4 displays are diagnostic displays used for, but not limited to, interlock logic, safety shower maps, faceplates, equipment vibration data, and reference guides.
The following illustrates examples of each level of display.
n Level 1 – situation awareness
overview graphic presenting the most important information for the operator’s entire span of control. This level is not intended for control and can facilitate information sharing with other consoles and secondary users (Figure 6).
n Level 2 – unit overview or primary control display providing the operator with graphics to perform
Figure 6. Example of Level 1 graphic.
Figure 7. Example of Level 2 graphic.
Figure 8. Example of Level 3 graphic.
routine changes and monitoring under normal operating conditions (Figure 7).
n Level 3 – a detailed process display providing the operator with a detailed view of the information for a particular process system (Figure 8).
n Level 4 – a diagnostic display such as interlock displays, machine level diagnostics, and controller faceplates.
Adopting a display hierarchy facilitates a structured approach to graphic navigation. Using a tab-based
navigation bar that also provides alarm information can significantly speed up the time it takes for an operator to diagnose an abnormal situation. An example of this is shown in Figure 9.
Navigation should be simple, and key displays should be accessible within less than two mouse clicks.
Conclusion
In in the early 2000s, the Abnormal Situation Management Consortium performed a study at NovaChem evaluating the improvement gains from incorporating human factors in graphic design, the results of which are summarised in Table 1.
The results show significant improvement across the board and that supplementing traditional P&ID-based graphics with human-factor based graphics creates a high-performance HMI that promotes good operator situational awareness through easier and faster abnormality detection, diagnosis, and response, effectively setting the operator up for success all around.
Reference
1. The High-Performance HMI Advantages, NovaChem/ASM Consortium Study
Figure 9. Example of tabbed navigation bar.
Table 1. Improvements from incorporating human factors in HMI design¹
A podcast series for professionals in the downstream refining, petrochemical and gas processing industries
LISTEN NOW
EPISODE 1
Alan Gelder, Senior Vice President of Refining, Chemicals and Oil Markets at Wood Mackenzie, provides a review of downstream markets in 2024 and looks ahead to what 2025 may hold for the sector.
EPISODE 2
Dr Klaus Brun, Global Director of Research & Development, Ebara Elliott Energy, discusses the progress that is being made towards adapting centrifugal compressors for high-speed hydrogen compression.
EPISODE 3
Peter Davidson, CEO of the Tank Storage Association (TSA), outlines the essential role that the tank storage sector has to play in ensuring supply security and resilience, as well as in facilitating the energy transition.
Sponsored by
EPISODE 4
Rasmus Rubycz, Market Manager for New Energy at Atlas Copco Gas and Process, considers how heat pumps as an industrial technology are gaining greater attention as a result of the increased drive for sustainability and the challenges and opportunities of electrification of process heat.
COMING SOON
Mike Logue, Owens Corning Business Director – Specialty Insulation, delves into factors that can support the performance, safety and longevity of insulating systems installed in hydrocarbon processing environments, including cryogenic facilities.
API 617 Centrifugal Designs to 100MW, 40MPa
API 617 Centrifugal Designs to 100MW, 40MPa
API 618 Reciprocating Designs to 20MW, 60MPa
API 618 Reciprocating Designs to 20MW, 60MPa
ASME PTC10 type 2 testing capacity to 100MW (steam turbine), 30MW (motor)
ASME PTC10 type 2 testing capacity to 100MW (steam turbine), 30MW (motor)
For more information, visit our website: www.sbw-intl.com
For more information, visit our website: www.sbw-intl.com
Scan QR for brochure, or Contact:
Scan QR for brochure, or Contact:
Head office & Manufacturing: Shenyang, China info@sbw-intl.com
Head office & Manufacturing: Shenyang, China info@sbw-intl.com
Global Sales Director: chenqiming@sbw-intl.com
Global Sales Director: chenqiming@sbw-intl.com Middle East & North Africa: yangyang@sbw-intl.com
Americas: xianganding@sbw-intl.com
Americas: xianganding@sbw-intl.com
Middle East & North Africa: yangyang@sbw-intl.com
ASEAN, South Asia, Europe and West Africa: liusong@sbw-intl.com
ASEAN, South Asia, Europe and West Africa: liusong@sbw-intl.com