Nancy Yamaguchi, Contributing Editor, examines the dynamics of Australasia’s oil and gas demands and refining industry, in the everchanging regional and global landscape.
15 Sulfur processing during turndown
G. Simon A. Weiland, Optimized Gas Treating Inc. (OGT), USA, explores the challenges and considerations of turndown operations at a refinery gas treating and sulfur processing train.
Dr David Kirkwood and Jamie Williams, Indicatura, UK, alongside Mike Smeltink, Worley Comprimo, the Netherlands, suggest how industrial organisations can incorporate advanced probabilistic forecasting techniques to account for future uncertainties and better assess the risks and benefits of technology options.
28 Line of defence
Jeff Gomach, Merichem Technologies, discusses how refinery operators can defend against the threat of hydrogen sulfide (H2S) by using effective removal treatments.
33 Monitored and mastered
Harry Burton, AMETEK, outlines the methodology behind monitoring amine acid gas treatment and discusses the importance of acid gas removal units and analytical solutions in optimising amine stripping.
37 The cost of corrosion
Mike Aughenbaugh, Swagelok Company, USA, discusses the cost of system issues stemming from corrosion, and considers how refineries can best defend against corrosion before it causes serious downtime.
41 Boosting future operations
Kevin Nietupski, AUMA, Germany, analyses how digital solutions can boost the efficiency and reliability of valves and actuators and increase responsiveness in the hydrocarbon processing industry.
45 Demystifying control valve selection
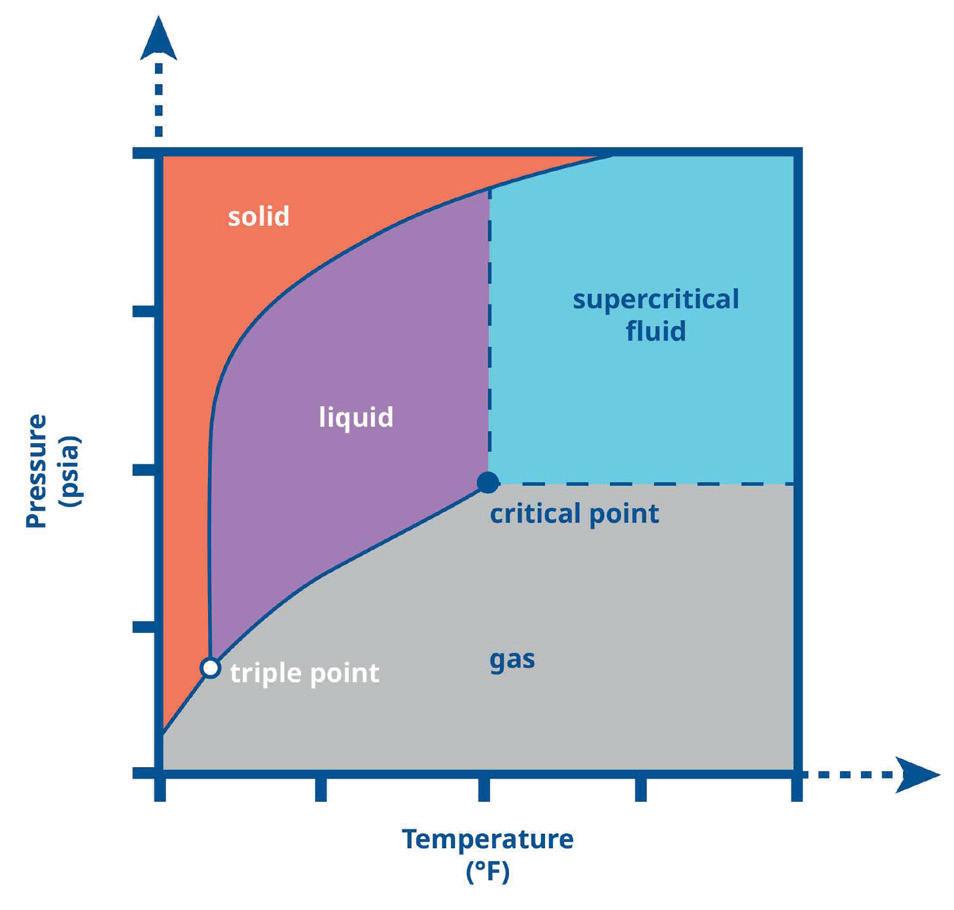
Melissa Niesen and Emily Stone, Emerson, USA, explain how supercritical fluids present significant challenges for control valves. However, proper design is possible by understanding the application, and consulting experts if required.
51 High-speed hydrogen compression
Klaus Brun and Marybeth McBain, Ebara Elliott Energy, USA, discuss the current state and progress toward adapting centrifugal compressors for high-speed hydrogen compression.
Optimized Gas Treating, Inc. (OGT) delivers high-quality software and consulting services for gas treating and sulfur recovery. What began 30 years ago as the first ever true, fundamental, mass transfer rate-based amine absorber programme has expanded into the OGT|SuiteTM of rate-based process simulation tools. OGT’s customisable software minimises costs and enhances efficiency by allowing you to license only the features you need.
ET Black™ Technology
Cut your CO2 emissions by 50% with the future of carbon black production
Compliant and innovative
Meets stringent environmental regulations, keeping your business future-ready
Unparalleled flexibility
Produce all ASTM grades and specialty grades seamlessly in a single plant
Sustainable Uses thermal decomposition of aromatic oils for cleaner production
CONTACT INFO COM MENT
MANAGING EDITOR James Little james.little@palladianpublications.com
ADMIN MANAGER Laura White laura.white@palladianpublications.com
CONTRIBUTING EDITORS Nancy Yamaguchi Gordon Cope
SUBSCRIPTION RATES
Annual subscription £110 UK including postage /£125 overseas (postage airmail). Two year discounted rate £176 UK including postage/£200 overseas (postage airmail).
SUBSCRIPTION CLAIMS
Claims for non receipt of issues must be made within 3 months of publication of the issue or they will not be honoured without charge. APPLICABLE ONLY TO USA & CANADA
Hydrocarbon Engineering (ISSN No: 1468-9340, USPS No: 020-998) is published monthly by Palladian Publications Ltd GBR and distributed in the USA by Asendia USA, 701C Ashland Avenue, Folcroft, PA 19032. Periodicals postage paid at Philadelphia, PA & additional mailing offices. POSTMASTER: send address changes to HYDROCARBON ENGINEERING, 701C Ashland Ave, Folcroft PA 19032.
15 South Street, Farnham, Surrey
GU9 7QU, UK
Tel: +44 (0) 1252 718 999
CALLUM O'REILLY
SENIOR EDITOR
President Trump promised to make heads spin following his inauguration, and he has certainly been true to his word. Since returning to the White House, Trump has been working at full speed, signing a flurry of executive orders (and ruffling a few feathers both at home and abroad).
Across the pond, the UK government has also been attempting to stamp its authority, most recently by taking aim at NIMBYs, who it accuses of standing in the way of economic growth. The Labour government has put the economy at the heart of its plan to ‘rebuild Britain’, and is now vowing to go “further and faster” to put its plans into action. As part of this, it has promised to end a “challenge culture” by blocking campaigners from making repeated legal challenges to planning decisions for major infrastructure projects.
Arguably the biggest infrastructure project of all – the building of a third runway at London’s Heathrow Airport – has just received government backing. Having grown up just a few miles from Heathrow, I can say with confidence that opposition to the third runway from the local community in west London will be strong. London’s Mayor, Sir Sadiq Khan, has also voiced his opposition to the plans, questioning whether a new runway could be built that abides with carbon targets and addresses concerns around noise and air pollution.
However, the UK government contends that the new runway could have environmental benefits, such as fewer planes circling London before landing. Key to its argument is that there is also huge investment in sustainable aviation, which it says goes hand-in-hand with economic growth. The world’s first transatlantic flight using 100% sustainable aviation fuel (SAF) took off from Heathrow airport in November 2023, and Heathrow recently announced an increase in its SAF incentive scheme, with £86 million available to encourage airlines to switch to SAF. In 2025, the scheme aims to reduce lifecycle carbon emissions from flights by over 500 000 t.
It’s certainly true that SAF has a key role to play in meeting the aviation industry’s decarbonisation ambitions, alongside other promising technologies including hydrogen and electrification. We regularly publish interesting technical articles exploring the potential of SAF, and examining its various production pathways, in Hydrocarbon Engineering. And you can also find several articles exploring the economics of SAF in our EnviroTech supplement, which is dedicated to decarbonisation initiatives within the downstream sector (scan the QR code on page 43 to download your free copy).
I’d also like to draw your attention to a special Insight Seminar that Hydrocarbon Engineering will be hosting on 19 March, exploring the economics of e-fuels. As the marine, automotive and aviation industries aim to reduce their carbon footprint, understanding e-fuel cost structure is essential for all stakeholders. Please join us for a roundtable discussion with Johnson Matthey and a panel of industry experts from A.P. Moller - Maersk, Honeywell, HIF Global and the Methanol Institute as we look to provide a clear analysis of the factors influencing e-fuel pricing, the economic challenges, and strategies for cost reduction. Scan the QR code to book your free space.
THE SMARTER WAY TO TREAT SULPHUROUS OFF-GASES
Strike the balance between regulatory, economic and environmental requirements when dealing with sulfurous off-gasses. Whether you’re managing sulfurous emissions from a new facility or an existing plant, our solution allows you to keep your operation compliant and running smoothly.
Visit topsoe.com to learn more.
WORLD NEWS
Worldwide | Global gas balance to remain fragile in 2025
Global natural gas markets are set to remain tight in 2025 as demand continues to rise and supply expands more slowly than before the pandemic and energy crisis, according to the International Energy Agency (IEA)’s latest quarterly ‘Gas Market Report.’
The report, which provides a thorough review of market developments in 2024 and an outlook for 2025, finds that markets moved towards a gradual rebalancing last year
after the supply shock that followed Russia’s full-scale invasion of Ukraine in February 2022. Still, the global gas balance has remained fragile, highlighting the need for greater international cooperation to enhance gas supply security.
Global gas demand rose by 2.8% in 2024 – well above the 2% average growth rate between 2010 and 2020. At the same time, below-average growth in LNG output kept supply tight.
China | CSPC invests in petrochemical complex expansion
CNOOC and Shell Petrochemicals Co. Ltd (CSPC), a joint venture between Shell Nanhai B.V. and CNOOC Petrochemicals Investment Ltd, has taken a final investment decision (FID) to expand its petrochemical complex in Daya Bay, Huizhou, in South China.
The expansion will include a third ethylene cracker with a planned capacity of 1.6 million tpy of ethylene.
This investment also includes a new facility which will produce 320 000 tpy of high-performance specialty
chemicals, such as polycarbonates and carbonate solvents.
The new facilities will produce a range of chemicals that are widely used in the agriculture, industrial, construction, healthcare, and consumer goods sectors.
This investment will contribute to CSPC’s competitiveness by extending its value chains, drive further integration with the existing site, and enable greater innovation capability to meet customer demand in the fast-growing Chinese market.
USA | Baker Hughes secures liquefaction equipment order
Baker Hughes has announced an order from Bechtel Energy Inc. to supply gas technology equipment for two liquefaction plants with a total capacity of approximately 11 million tpy for Phase 1 of Woodside Energy Group Ltd’s Louisiana LNG development opportunity. The order marks a significant milestone as Woodside targets final investment decision (FID) readiness from 1Q25.
The award, which includes eight main refrigeration compressors driven by LM6000PF+ gas turbines and eight expander-compressors, leverages Baker Hughes’ LNG technologies to support Bechtel and Woodside. The company’s history of working with Bechtel and Woodside will support the delivery of Phase 1 of the project.
In addition to this award, Baker Hughes was previously selected to supply Woodside electric-powered Integrated Compressor Line (ICL) packages and other turbomachinery equipment for the associated pipeline serving the LNG export terminal.
Spain | Johnson Matthey technology selected for e-methanol plant
Johnson Matthey’s (JM) e-methanol technology has been selected by Reolum for the next phase of its La Robla Nueva Energia (NE) project.
Located in the Spanish region of Castilla y León, it will be one of the largest e-methanol production plants in Europe, planned to be online by the end of 2027.
The facility will be one half of an integrated green energy generation project called La Robla Green. This project is made up of two cutting-edge facilities: Roblum, a green energy generation plant that will power more than 50 000 households, and La Robla NE, an
e-methanol plant. La Robla NE blends the CO2 extracted from the biomass plant with green hydrogen to produce e-methanol, with the expectation of up to 140 000 tpy.
For JM’s Catalyst Technologies business, the Reolum project represents the fifth win since 1 April 2024, contributing to JM’s strategic milestone of 20 sustainable technologies project wins by the end of 2025/26. Together with previously announced wins, including ETFuels’ planned methanol plant in Texas, US, announced in December 2024, JM has won 15 major energy transition projects since 1 April 2022.
E-methanol is an increasingly important product in decarbonising two hard to abate sectors – the chemicals industry and heavy transport, like shipping.
The project is supported by the European Investment Bank and a final investment decision (FID) is expected in 2025.
Reolum has selected JM’s eMERALD TM technology – a process that converts captured CO 2 to methanol – for the project, which contributes to the regeneration of an area in northern Spain, previously home to a thermal power plant and a once-thriving coal mining industry.
WORLD NEWS
DIARY DATES
24 - 27 February 2025
Laurance Reid Gas Conditioning Conference Norman, Oklahoma, USA pacs.ou.edu/lrgcc
2 - 4 March 2025
AFPM Annual Meeting
San Antonio, Texas, USA www.afpm.org/events/AnnualMeeting2025
11 - 12 March 2025
StocExpo Rotterdam, the Netherlands www.stocexpo.com
23 - 25 March 2025
AFPM International Petrochemical Conference San Antonio, Texas, USA www.afpm.org/events/IPC25
6 - 10 April 2025
AMPP Annual Conference + Expo Nashville, Tennessee, USA ace.ampp.org
8 - 10 April 2025
Sulphur World Symposium Florence, Italy www.sulphurinstitute.org/symposium-2025
19 - 23 May 2025
World Gas Conference Beijing, China www.wgc2025.com
20 - 22 May 2025
ESF North America Houston, Texas, USA www.europetro.com/esfnorthamerica
4 - 5 June 2025
Valve World Americas Expo & Conference Houston, Texas, USA www.valveworldexpoamericas.com
10 - 12 June 2025
Global Energy Show Canada Calgary, Alberta, Canada www.globalenergyshow.com
25 - 26 June 2025
Downstream USA Houston, Texas, USA events.reutersevents.com/petchem/downstream-usa
China | Topsoe chosen as technology provider for SAF project
Topsoe has signed an agreement with Chuangui New Energy company to provide technology and services to produce sustainable aviation fuel (SAF) and renewable diesel.
Located in Qinzhou City of the Guangxi region, Southwest China, Chuangui New Energy company will use Topsoe’s licensing and engineering design services and technologies, including its HydroFlex® technology, proprietary equipment, and catalysts, enabling production of SAF and renewable diesel starting from used cooking oil.
Reaching final investment decision (FID) in December 2024, construction of the Chuangui New Energy company plant has begun. Operations are expected to commence in December 2026.
Once at full capacity, the plant expects to process 300 000 tpy of feedstock into SAF and renewable diesel. Topsoe’s technology is expected to enable an annual emission avoidance of approximately 800 000 t of CO2e. The agreement represents Topsoe’s second SAF project in China, following its first agreement in April 2024.
Italy | Lummus and Versalis ink partnership
Lummus Technology and Versalis, Eni’s chemical company, have announced a strategic partnership to license all of Versalis’ technologies in the phenolics value chain.
Under the agreement, Lummus will serve as the exclusive licensor for phenolics technologies, which ranges from cumene to cyclohexanone oxime. Both companies will also collaborate on engineering, marketing and licensing, as well as providing proprietary
catalysts and equipment for both processes.
Through this new partnership, both companies aim to develop sustainable technology solutions and maximise efficiency to support their customers’ needs for reliable operations and sustainability.
Lummus and Versalis began collaborating in the late 2000s with similar technology partnerships for dimethyl carbonate and diphenyl carbonate technologies.
Norway | Boeing advances SAF production
Boeing has become a key project development partner of Norsk e-Fuel, supporting one of Europe’s first industrial scale Power-to-Liquids (PtL) facilities.
Boeing’s investment will accelerate the production and availability of sustainable aviation fuel (SAF) in the Nordics and globally. It is also intended to support the commercial aviation industry’s and ICAO member states’ common goal to achieve net-zero carbon emissions by 2050.
Norsk e-Fuel will produce jet fuel known as electro-SAF,
or e-SAF. This involves the PtL process: using fossil-free power to generate green hydrogen and combining it with recycled CO 2 from biogenic sources. This fuel can reduce the lifecycle greenhouse gas emissions of air travel by over 90% compared to conventional jet fuel.
The strategic partnership combines Boeing’s SAF industry leadership and fuels expertise with Norsk e-Fuel’s technology know-how and strong network of partners, including Norway’s largest air carrier, Norwegian.
Australasia includes Australia, New Zealand, Papua New Guinea (PNG), and a host of island nations. What ties them together, and how do they weather differences born of vast distances, disparity of income, and cultural differences? Australia and New Zealand are wealthy, Organisation for Economic Cooperation and Development (OECD) countries, while some island nations have ‘subsistence affluence’ lifestyles. Nonetheless, Australasia has important diplomatic, cultural, and economic ties. There are 11 countries in the Commonwealth: Australia, Fiji, Kiribati, Nauru, New Zealand, PNG, Samoa, the Solomon Islands, Tonga, Tuvalu, and Vanuatu. Tokelau is a New Zealand Dependency, and Niue and the Cook Islands are sovereign states in free association with New Zealand. The Australian external territories include Christmas Island, Norfolk Island, and the Cocos (Keeling) Islands. Nauru and PNG, now independent, were once part of the Australian external territories.1
These countries and dozens more cooperate in regional trade agreements and pacts. Migration patterns create strong ties. For example, the census of 2021 counted the Cook Islands population at 14 987. However, approximately 80 000 people in
New Zealand identified themselves as Cook Islanders or of Cook Islands descent, and approximately 28 000 in Australia did the same. The topic of migration is complicated. On one hand, it increases regional solidarity, provides cultural diversity, and gives people the freedom to move. On the other hand, it may signal a lack of economic opportunity in the areas losing population.
Australia, New Zealand, and to a lesser extent PNG, have been the focal points of Australasia’s downstream petroleum industry. These countries were the only ones with a refining presence, and their ties to other island countries motivated them to develop and maintain trade links. This article discusses Australasia’s oil demand, the decline and stabilisation of cuts to refinery output, the dramatic impacts on oil product trade, and concern about global climate change.
Australasian oil demand
The COVID-19 pandemic caused Australasian oil product demand to drop by approximately 214 000 bpd (around 15%) between 2018 and 2020. Figure 1 presents the long-term trend in Australasian oil demand between 1980 – 2023.2 Between 2000 – 2019, before the pandemic hit, demand had been expanding at an average
annual rate of 1.5%, a robust level of growth. By fuel type, demand had been declining for gasoline and LPG. It had been stable for fuel oil and other products. Jet fuel and diesel demand had been growing. Demand peaked in 2018 at 1 401 000 bpd. It collapsed to 1 187 000 bpd in 2020, then began to recover between 2021 – 2023. By 2023, Australasian demand had climbed back to approximately 1 322 000 bpd, 94% of its pre-COVID level. Demand is likely to recover to historic levels, though it is not expected to grow as rapidly in the mid- and long-term, in part because of the strong push toward alternative energy development.
There is a huge gap in market size among the Australasian countries. Table 1 provides a look at demand in 2022. Australia’s demand was 1 064 400 bpd, followed by New Zealand with 150 700 bpd and PNG with 26 900 bpd. Among the smaller island nations, Fiji’s market was the largest, with demand of 8500 bpd. The other countries had oil market sizes of 100 – 2200 bpd. These islands are wholly dependent on imported fuel.
Reducing dependence on petroleum fuels is not simple in Australasia. Liquid transport fuels are vital in most
Nancy Yamaguchi, Contributing Editor, examines the dynamics of Australasia’s oil and gas demands and refining industry, in the everchanging regional and global landscape.
remote islands. Gasoline is a key fuel for ground transport, and aviation and marine fuels are essential to maintain trade links with the rest of the world. As the table notes, diesel accounts for a significant percentage, typically between 40% – 70%, of product demand in Australasia. In remote areas, diesel is also used as generator fuel. There are multiple initiatives underway to develop renewable energy resources to reduce diesel imports for power generation. Table 1 also includes renewable electricity generation, 2022, as published by the International Renewable Energy Agency (IRENA).3
Renewable electricity already plays a huge role in New Zealand, where 87% of 2022’s power was generated by a mix of hydropower, geothermal, wind, and solar. Coal use was cut to just 1% in 2023. In Australia, coal still accounted for 46% of the power sector mix. Natural gas provided 17% of the mix, and oil accounted for 2%. Fossil energy’s share was 65%, and renewables’ share was 35%, led by solar, wind, and hydropower. However, Australia committed to reducing coal use, and the country has pledged to shut all coal-fired plants by the year 2038.4 Fiji and PNG have significant hydropower generation
capacity, while Samoa has a small amount also. All the Australasian countries listed here have installed solar energy capacity.
Refining stabilises after drastic cuts
Australia has a long history as a refining centre, and it has been the centre of refining in Australasia. The boom in Asian demand and refining, however, eroded refinery profitability, resulting in closures. Australia’s refineries mainly were older, mid-sized gasoline-oriented facilities, unable to keep up with booming demand for diesel. Australian crude refining capacity peaked at 829 000 bpd in 2002. It slid below 700 000 bpd in 2006, then collapsed to 443 000 bpd in 2015. Shell converted its 85 000 bpd Clyde refinery to a product terminal in 2013. Shell sold its
Figure 1. Australasia oil product demand 1980 – 2023, ‘000 bpd. (Source: US Energy Information Administration, and Author’s estimates for 2023).
Table 1. Australasian oil
Sources:
and
118 000 bpd Geelong refinery to Vitol in 2014. Caltex closed its 135 000 bpd Kurnell refinery at the end of 2014. BP closed its 102 000 bpd Bulwer Island refinery in 2015. Table 2 lists the changes in Australasian refinery capacity, and Table 3 lists the remaining refineries.
Crude production near the older refineries also began to decline, forcing Australian refineries to rely more on imported crude oil. According to the ‘Australian Petroleum Statistics’ data series published by Australia’s Department of Climate Change, Energy, the Environment, and Water,5 Australian crude plus condensate production has been declining at a rate of -3.1% per year between 2010 – 2024 (January – September.) The focus of Australia’s oil production shifted west, far from established refineries and population centres. During the January – September 2024 period, only 21.8% of Australian refinery input was indigenous.
Australasian refinery capacity levelled off between 2015 – 2019, but the pandemic felled two of Australia’s four remaining refineries plus New Zealand’s sole refinery at Marsden Point. BP announced that it would close its Kwinana refinery in 2021 and convert it to a product import terminal. The Ampol Lytton (formerly known as Caltex Australia) refinery went early into extended maintenance in May 2020. In 2022, ExxonMobil closed its Altona refinery, which was the country’s oldest and smallest. Viva Energy reduced throughput at its Geelong refinery by closing one crude tower and the residual catalytic cracker, and the company announced that it was considering a full shutdown. The company shifted its refinery into maintenance ahead of schedule. The Lytton and Geelong refineries also might have been shuttered had the government not stepped in. The last two refineries received government support to remain in business via the fuel security package in 2021. The government stated that this would increase Australia’s fuel security, stimulate employment, secure its sovereign refining capacity, and keep prices low for fuel users.6
New Zealand’s refinery had been Australasia’s only hydrocracking facility. It was expanded and upgraded as part of the government’s ‘Think Big’ energy projects after the oil price shocks of the 1970s. When the petroleum industry was deregulated in 1984, the refinery was transferred to the New Zealand Refining Co., a consortium of the five major retailers, later led by BP, Mobil, and Z Energy. Government and industry worked for years to keep the refinery afloat. However, in 2021, the shareholders voted to stop refining. The Marsden Point location became a product import terminal, and the company was renamed Channel Infrastructure.
PNG became the third Australasian country with a refining presence when InterOil Corp. completed its Napa Napa refinery project at Port Moresby, which incorporated refinery units shipped in from two closed refineries in the US. The refinery had a crude refining capacity of 32 500 bpd, a 5000 bpd hydrodesulfurisation (HDS) unit, and a 3500 bpd catalytic reforming unit. Utilisation rates were low. In 2014, Singapore-based Puma Energy Holdings Pte purchased InterOil’s refinery, fuel terminals and service stations. In 2023, the company added a solar project to power the refinery and reduce carbon emissions.
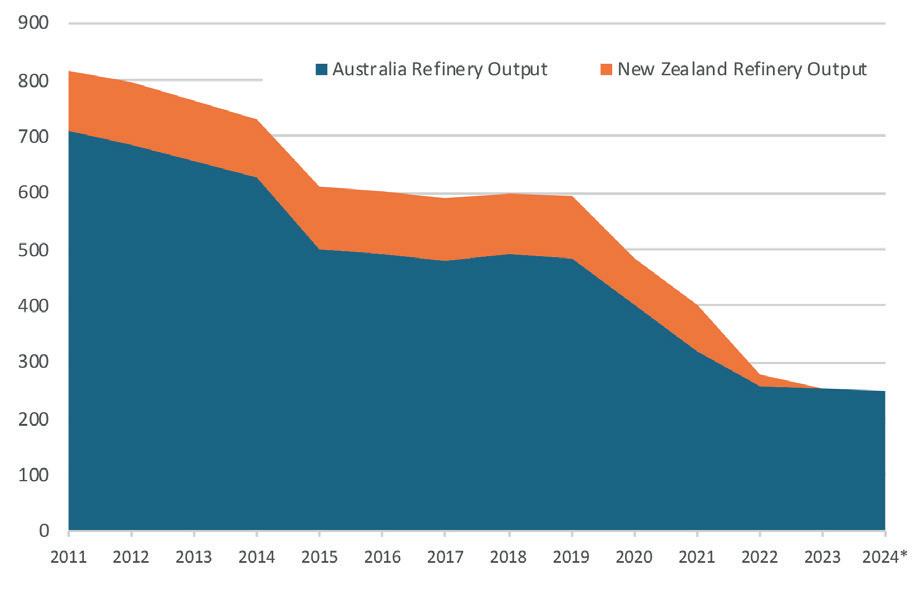
Figure 2 shows these closures cut into Australia’s and New Zealand’s refinery production between 2011 and the first nine months of 2024. In 2011, Australia’s refinery output averaged
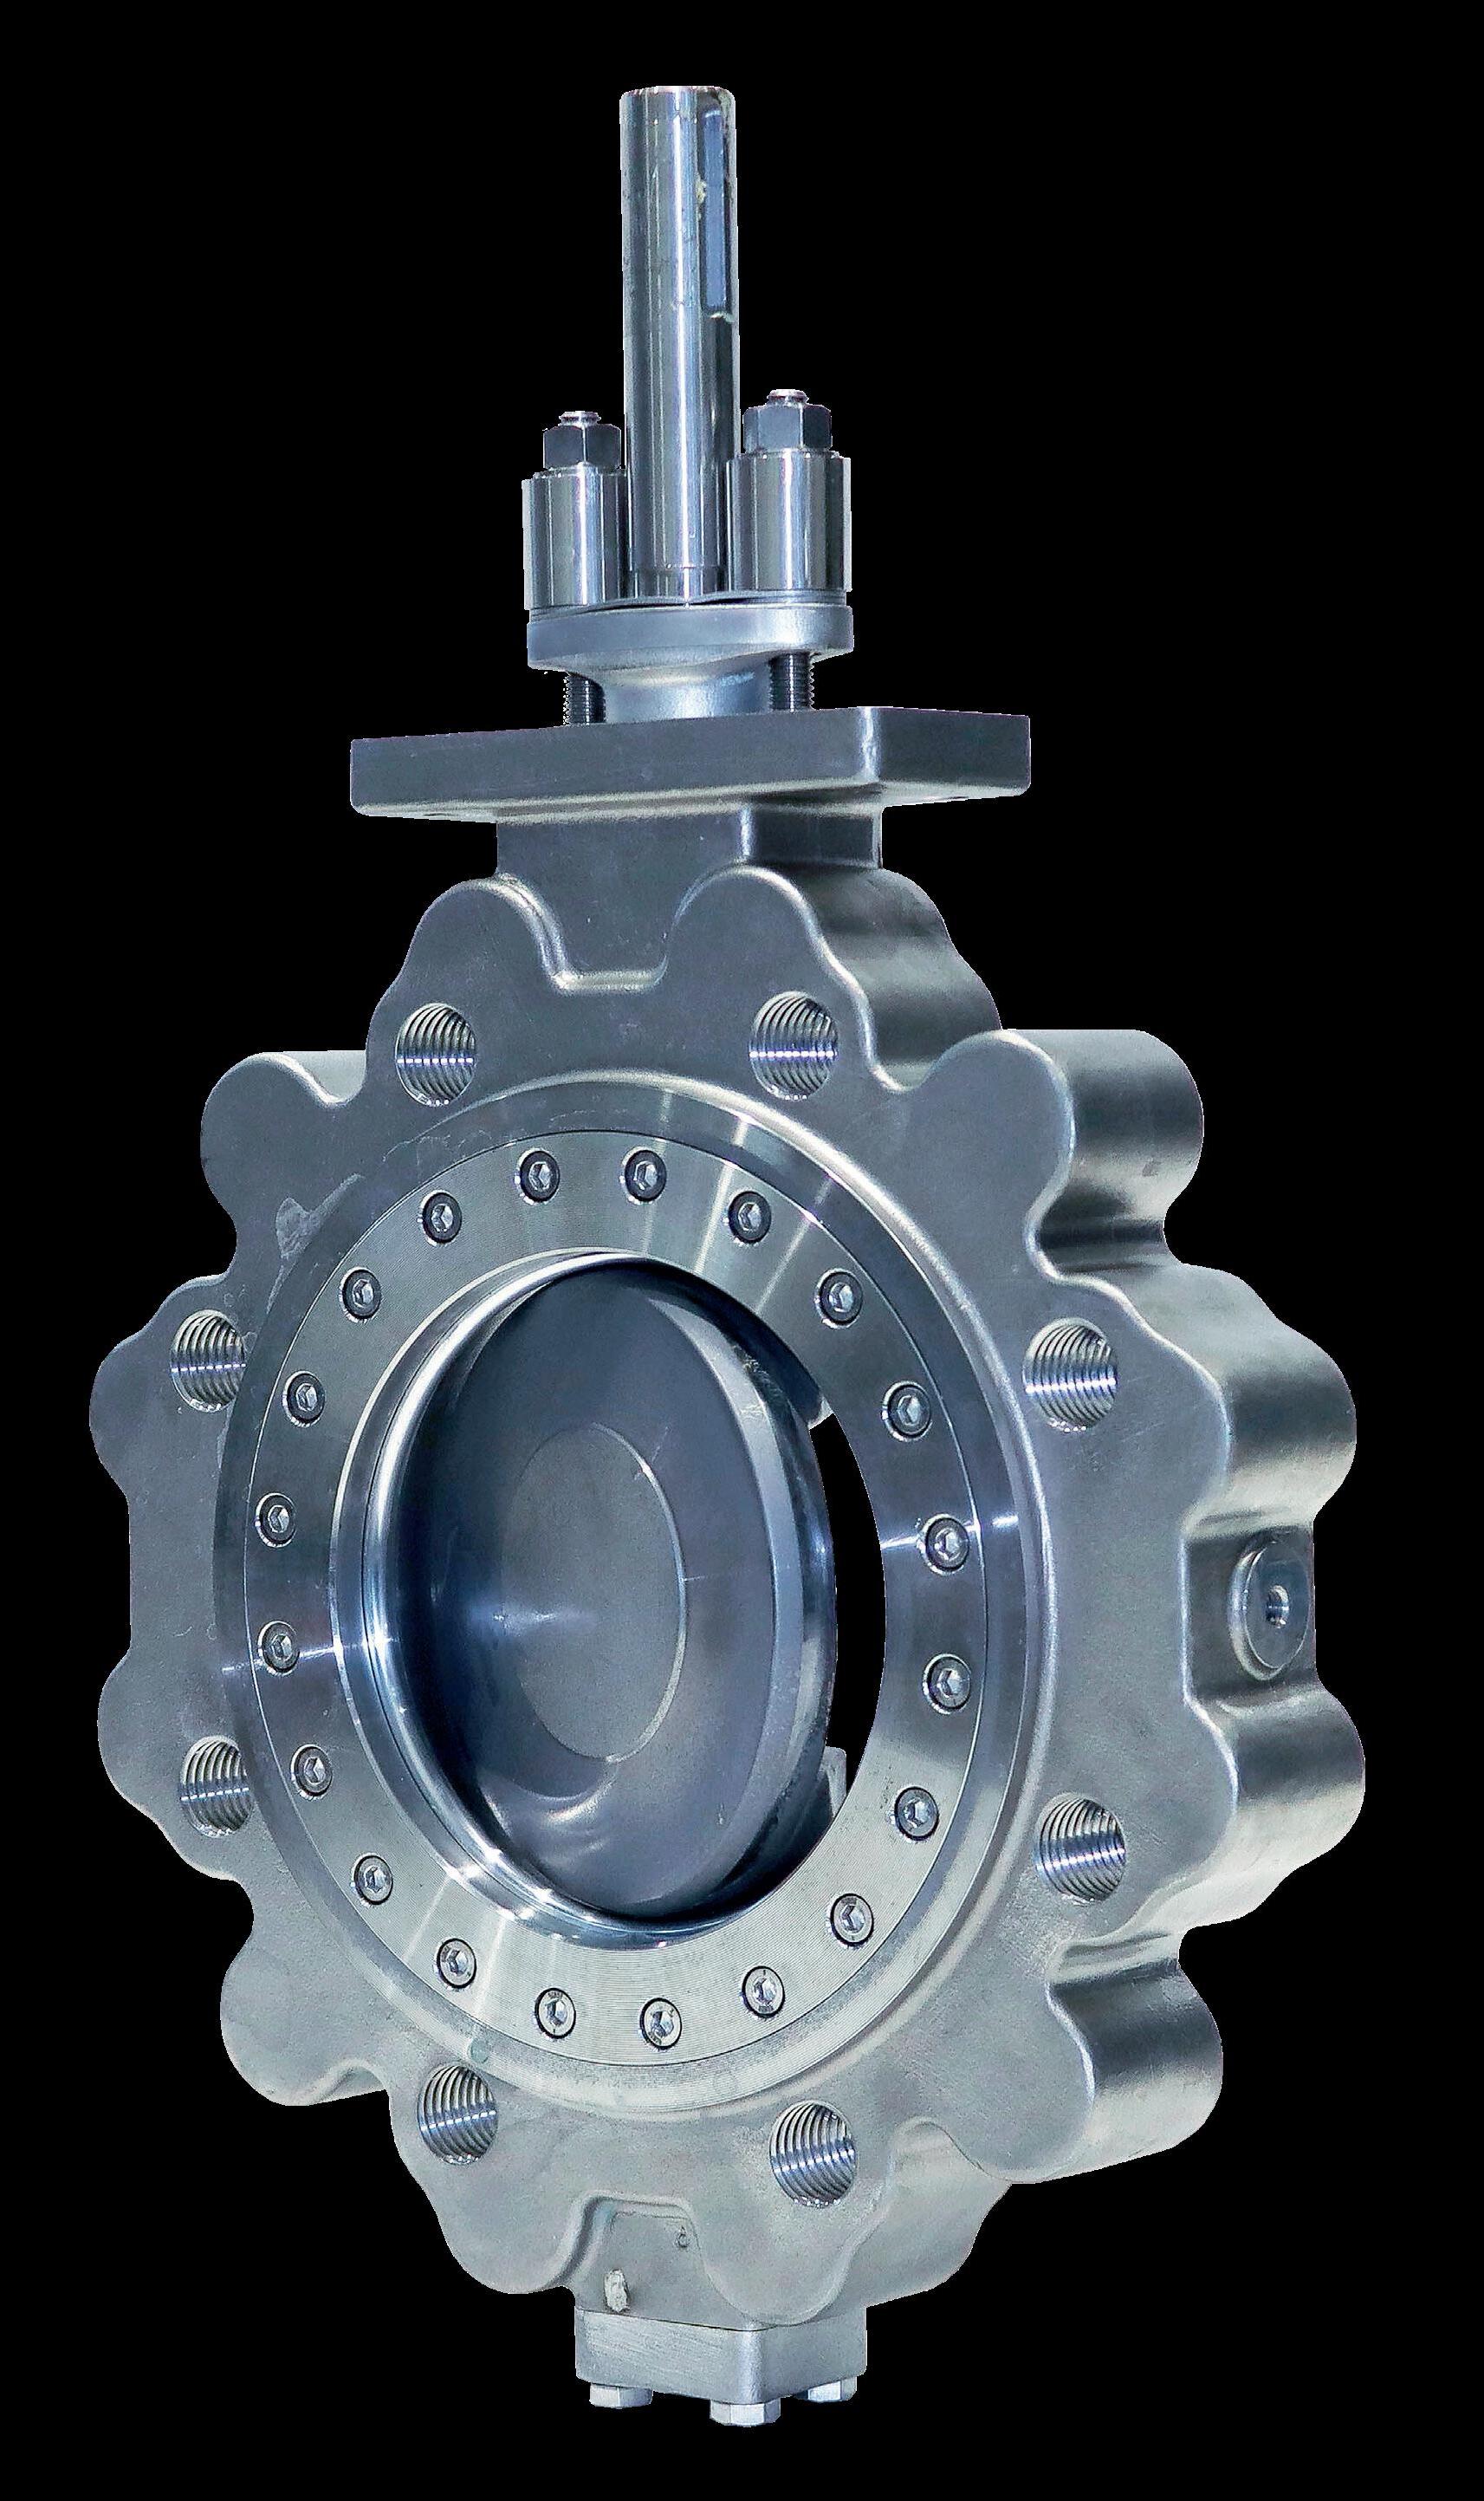
Over a Century of Proven Control Valve Performance
Optimized with advanced digital instrumentation for industry leading safety and efficiency.
Innovative technical solutions to meet the world’s most challenging process control applications.
Trusted reliability protecting critical components in the harshest environments.
approximately 710 000 bpd. Australian output fell below 500 000 bpd in 2015, and it stabilised in this vicinity until the COVID-19 pandemic. Output fell to 420 000 bpd in 2020, then dropped again to 320 000 bpd in 2021. Refinery output declined modestly, and it appears to have levelled off in the vicinity of 250 000 bpd during the 2022 – 2024 period.
New Zealand’s refinery output, according to the New Zealand Ministry of Business, Innovation, and Employment, had been stable in the range of 100 000 – 110 000 bpd in the decade leading up to the pandemic, upon which refinery output was cut to 81 000 bpd in 2020 – 2021. The refinery remained unprofitable, and shareholders decided to close the refinery after the first quarter of 2022. Refinery output averaged 20 000 bpd that year. In 2023, output was zero. Since 2011, Australasian refinery output has plunged 70%.
Shifts in Australasian product trade
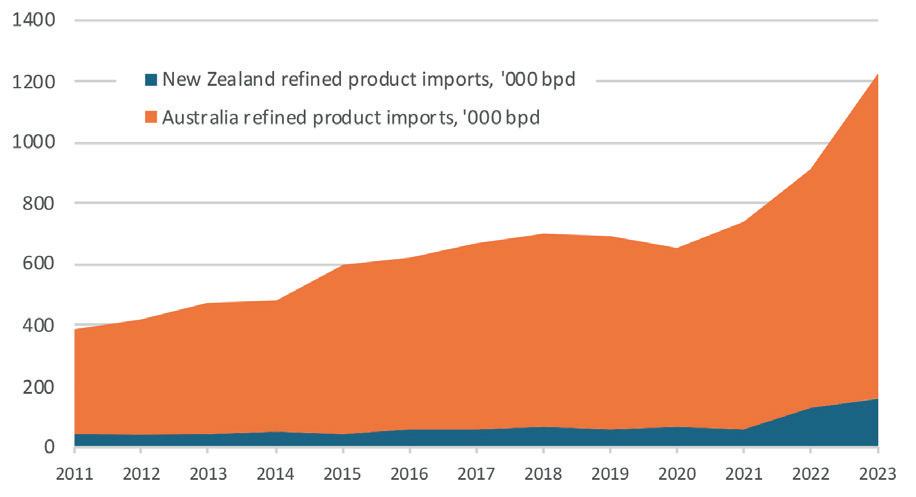
The combination of reduced refinery capacity and the gradual recovery of demand is causing a major surge in fuel imports and a loss of fuel export capability. Figure 3 shows the growth in Australian and New Zealand refined product imports. In 2011, product imports totalled 385 000 bpd. Imports expanded to 695 000 bpd in 2019, until the pandemic caused a dip to 651 000 bpd in 2020. In 2020 – 2023, however, refinery output collapsed, and demand began to recover. Imports surged to 1 227 000 bpd in 2023. New Zealand’s imports averaged 42 000 bpd in 2011, and the refinery closure caused imports to jump to 159 000 bpd in 2023.
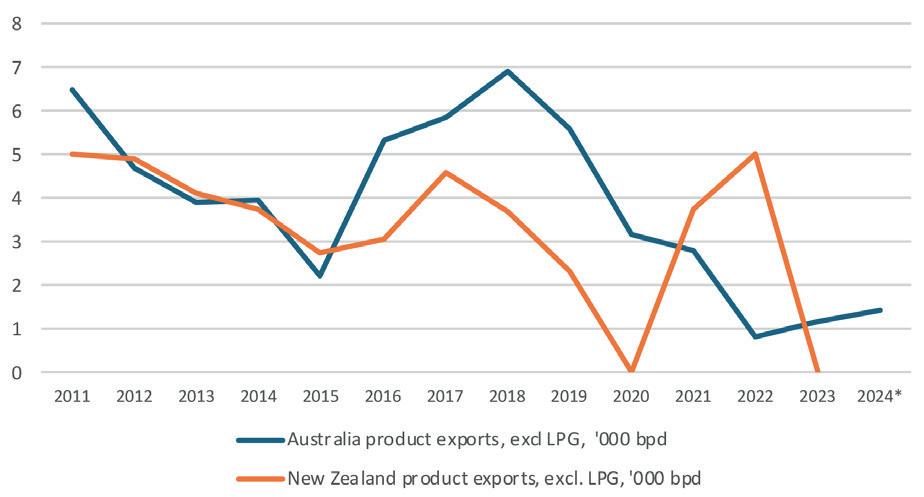
Australia is a significant product trader, but its product exports are dominated by LPG. In 2011, product exports were 51 900 bpd, 37 200 bpd (72%) of which were LPG. Exports of non-LPG products ranged from approximately 10 000 bpd to 25 000 bpd. Because Australia is so large and has so many ties to neighbouring Australasian countries, many small trades remain to balance supply and demand, to export specialty products, and to provide fuel to countries including the Solomon Islands,
Table 2. Changes to Australasia’s refinery capacity, ‘000 bpd
Vanuatu, Christmas Island, Fiji, and other neighbours. One trade pattern has essentially vanished, however: Australian exports of crude oil and refinery feedstocks to New Zealand and PNG. In 2012, for example, PNG imported 828.2 million l of crude and refinery feed from Australia. This fell to 1.8 million l in 2022. New Zealand’s crude imports have ceased entirely.
Before its refinery closed, New Zealand had been a modest exporter of refined product, typically 2000 – 6000 bpd to neighbouring Australasian countries. These exports vanished in 2023.
Future of Australasia’s downstream sector
What is the future of the downstream petroleum industry in Australasia? Not refining, certainly. The industry has already experienced drastic downsizing and is unlikely to ever build new refineries. Australia has only two refineries remaining, PNG has one small refinery, and New Zealand has none. Currently, refinery throughput appears to have stabilised at a new, low level, in part because of government support. Without this support, refinery activity could be even lower. Australasia has morphed into a major fuel importer. So far, import requirements have been met easily from other refineries, though some of the island nations have had to adjust to receiving fuel shipments from sources such as Singapore rather than Australia and New Zealand. The downstream industry remains active in terminaling, storage, and shipping activities. The outlook for oil demand appears reasonable, though not rosy, with PNG forecast to be one of the fastest-growing countries.
Concern has grown over global climate change. Most of Australasia’s population lives in coastal areas. Some are experiencing shoreline recession and already have visibly lost properties along coastlines. Australasia’s SOS might stand for ‘save our sand.’ The Pacific Ocean includes islands that are called ‘the front line’ in the battle against global climate change. Most island nations rely on agriculture and fisheries, both of which are threatened by global climate change. Fresh water supplies also may be endangered, since aquifers include Ghyben-Herzberg lenses, where lighter freshwater floats atop denser saltwater in saturated sediments, and can be collected. Climate change can increase saltwater intrusion and contamination by storm runoff. Severe storms can destroy infrastructure. Severely endangered Australasian countries include Fiji, the Solomon Islands, the Torres Strait Islands, the Carteret Islands of PNG, Kiribati, and Tuvalu. Some low-lying islands are expected to simply vanish by the year 2050.
Australasia’s downstream petroleum industry, like most of the global oil industry, has been accused of not doing enough to address climate change. However, the industry is becoming more progressive in outlook, recognising that environmental protection is vital to health and prosperity. Industry’s preference has been to advocate measures that help reduce emissions without wholesale disruption of business models. For example, the industry group Australian Institute of Petroleum (AIP) issued a statement supporting government initiatives for low-carbon fuels such as renewable diesel and sustainable aviation fuel. Public and private entities alike often favour solutions that advance the meeting of environmental goals without having to scrap vehicles and infrastructure. The industry is working to
remain flexible in facing stricter environmental regulations, maintaining good relations with governments and the public by self-regulating. In Australia, there are few accusations of price-gouging, for example, because the AIP is fastidious about price transparency. Australia’s fuel prices are based on Singapore prices, and they are logically linked to the outside world. Australasia’s downstream industry is likely to face a future where regulatory compliance is job number one. Refineries, tanks, pipelines, terminals, tankers, and market outlets will all need maintenance and vigilance, and trade links with neighbours
Figure 2. Downturn then recent stabilisation in refinery output, ‘000 bpd. (Source: Australian Petroleum Statistics and New Zealand Ministry of Business, Innovation, and Employment).
Figure 3. Australia and New Zealand product imports jump after refinery closure, ‘000 bpd. (Source: Australian Petroleum Statistics and New Zealand Ministry of Business, Innovation, and Employment).
Figure 4. Dwindling refined product exports from Australia and New Zealand, ‘000 bpd (Source: Australian Petroleum Statistics and New Zealand Ministry of Business, Innovation, and Employment).
will remain a priority. Regulatory barriers, however, will protect the local market, providing some stability for the industry.
Conclusion: Australasia’s shared sea
How many proverbs and sayings are there that concern the sea and the gulf between people, ideas, and cultures? ‘Oceans apart’ means immense separation. ‘Bridging the gulf’ means trying to bring people closer together. ‘The tides are rising’ means that change is upon us, perhaps dangerous and unstoppable change. Pacific Islanders now say, ‘The sea is coming for us,’ and ‘We are the front line in the fight against global warming.’ Australasia is the world’s largest region when the sea is considered, and the sea level is rising. Thus, the distance between Australasian countries and their neighbours is indeed growing. Is this literal widening of the gulf also symbolic of isolation? Or can Australia, New Zealand and PNG continue to be good neighbours to smaller island nations, providing regional unity in their shared sea?
Historically, Australasia had a reasonable balance of oil production, refining, consumption, and trade. The smaller island nations relied on Australia and New Zealand for much of their fuel supply. Now, Australia and New Zealand have pulled away from refining as a heavy industry. Both are working to reduce carbon emissions. New Zealand is considered one of the most progressive countries in this area, with 87% of its electricity coming from renewable energy sources. According to the Energy Institute (EI) Statistical Review, New Zealand cut its carbon dioxide equivalent (CO2e) emissions at a respectable rate of -1.2%/year during the decade 2013 – 2023. Australia, in contrast, cut its CO2e emissions at an average rate of only -0.2%/year during the decade, evoking criticism from its Pacific Island neighbours.
Australia did not respond with denialism and isolationism. Instead, it ramped up its efforts to reduce coal use. Its current plan calls for full closure of all remaining coal-fired power plants in 2038, five years ahead of the original schedule. This does not necessarily translate into a reduction in global coal use, however. Australia remains one of the world’s largest producers and exporters of coal. Some exports go to China, the world’s largest coal consumer, where CO2e emissions expanded at 1.9%/year from 2013 – 2023. Even with a shared purpose and commitments within Australasia, the region’s energy and environmental goals are influenced by the world around it. Australasia’s efforts may be undermined by the actions of its neighbours, not just China and other coal users, but even OECD neighbours such as the US. Australasian countries are sharing the sea and have strong ties as neighbours. But the world as a whole, experiences the tide.
References
1. For the purposes of this article, island nations that are territories of other large powers such as France and the US are not included in the Australasian region.
2. www.eia.doe.gov. The US Energy Information Administration provided country-specific data through the year 2022 for the Island Nations, whereas 2023 data was published only for Australia and New Zealand. The author extrapolated year 2023 demand for the island nations by using the growth rates exhibited between 2020 and 2022.
G. Simon A. Weiland, Optimized Gas Treating Inc. (OGT), USA, explores the challenges and considerations of turndown operations at a refinery gas treating and sulfur processing train.
Turndown operations are hard to consider fully at the outset of a project. The primary focus is usually on providing a design that accommodates the worst possible steady-state operating conditions. Turndown conditions are often ones that can cause the most damage to plant equipment but are usually of low priority and often given last-minute attention, if any attention is given at all. The extent to which the hardware can be turned down is often not known until equipment bids have been received and have cycled around in the workflow to the process engineering department to confirm that the hardware will perform under all expected operating conditions. In fast-tracked projects, sometimes only superficial attention is given to these critical steps, and the level of detail required in a complete evaluation with new process designs is completely inadequate.
Mass and heat transfer devices, as well as material transfer equipment and instrumentation, behave differently under turndown conditions, and not always in ways that are desired. The present work is a case study of the turned down operations of a refinery gas treating and sulfur processing train. It focuses on the changing demands placed on the process equipment.
Sulfur recovery units (SRUs) are designed to meet a specific set of targets given an initial set of parameters such as feed flowrates, feed composition, feed temperatures, and pressure. During the design phase, considerations are generally given to different scenarios such as varying feed quality, feed rate (turndown), equipment ageing (exchanger fouling), and catalyst ageing to help assess the robustness of the design. However, startups and shutdowns arguably cause the most damage to an SRU through thermal cycling of the process equipment, and it is these conditions that are often overlooked. Thermal cycling affects the reliability of the waste heat boiler (WHB) most notably by degrading the tubesheet system, which includes the refractory, ferrules, the tubesheet itself, the tube-to-tubesheet joints, and the tubes. Through proper design, operating practices, and maintenance procedures, the reaction furnace and WHB system can have a life expectancy exceeding 20 years. However, with an inadequate design, poor operating practices, and poor maintenance, it could be as short as 2 – 3 years.1,2 Being able to model accurately varying feed quality, feed rate, exchanger fouling, and catalyst ageing can provide better understanding of the effects of these parameters.
Turndown operations with notes on startup and shutdown
It is normal for an SRU to operate at below design flowrates. Frequently, the initial operating conditions
(including flowrates) change after construction and commissioning, as well as during the operation of the unit. Ensuring that the unit will perform adequately under these non-design conditions is crucial to a successful operation.
Heat loss from plant equipment also becomes more significant at turndown, and separations equipment may not perform as advertised either. In a sulfur condenser, for example, fogging has been reported at low mass velocities (<1 lb/sec·ft2).3,4 Fogging is a phenomenon in which submicron mist is formed in the bulk vapour (vs normal film condensation on the condenser tubes). This mist is so fine it evades conventional mist elimination devices.
An important part of turndown operations is knowing whether the plant equipment is operating safely and reliably. Below is an example of how process simulation can complement plant operations.
Case study
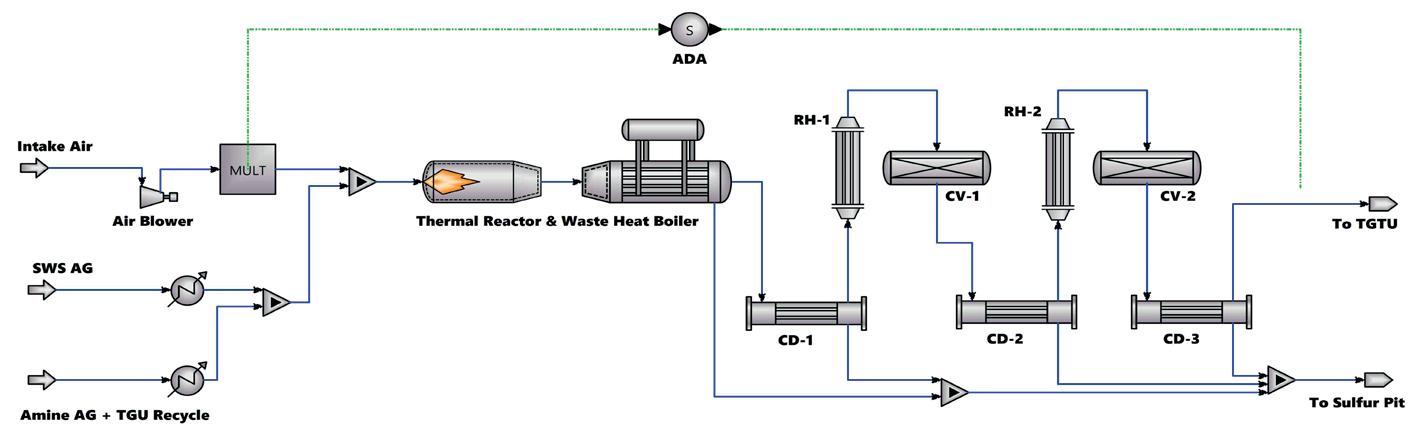
A series of case studies was performed to analyse the effects of turndown on the SRU. The Claus unit analysed was a typical 2-stage unit in a refinery setting processing both sour water acid gas and amine acid gas at a combined design flowrate of 125 tpd as shown in Figure 1 and Table 1. The heat exchange units, such as WHB and condensers, were simulated in rating mode to accurately assess the effects of operating at off-design rates. All cases were simulated using SulphurPro®, a reaction kinetics and heat transfer rate-based Claus sulfur recovery simulator.
First, simulations were run in two turndown scenarios: one at 75 tpd (60% of design) and the other at 40 tpd (30% of design). The performance of the unit, and specifically the exchangers, was assessed at each turndown step.
For the second case study, the unit was assessed at a point corresponding to halfway between the startup/shutdown procedures. Supplemental natural gas plus acid gas (from combined amine acid gas and sour water acid gas sources) were both sent to the Claus unit in equal amounts (50% each) at a combined hydraulic load equal to the hydraulic load at 30% of the design rate on acid gas alone. This gave a point midway between hot standby (natural gas only) and turndown on acid gas (40 tpd or 30% of design).
Results
Table 2 shows that as the unit is turned down from 100% (base case) to 60%, and then 30%, the most notable change is in the WHB operating conditions. At 30% turndown, the peak heat flux is reduced to nearly half the base case of 100% throughput. This is caused by the severely reduced mass flux through the unit. The overall sulfur conversion, sulfur recovery, and CS2 in the tail gas do not seem to be greatly affected. Although not directly
Table 1. Feed conditions for amine acid gas and sour water acid gas (mole %)
Figure 1. SulphurPro® PFD for 2-stage Claus unit processing amine acid gas and sour water stripper acid gas.
calculated in this case study, pressure drop reduces significantly with turndown.
Hydrogen in the Claus tail gas drops quite significantly from the base case design as turndown progresses. This can significantly affect the performance and reliability of a downstream reduction-quench-amine type tail gas treating unit (TGTU). The reducing gas demand is increased per unit volume of feed gas as the unit is turned down, meaning either more external hydrogen or more natural gas must be combusted substoichiometrically in the TGTU reducing gas generator (RGG) at turn down. Insufficient hydrogen increases the risk of potentially catastrophic SO2 breakthrough during turndown operations. Additionally, if the TGU hydrogenation reactor catalyst is not fully active, then COS and CO conversion tend to fall off first.5
At turndown, there is significantly higher COS concentration in the Claus tail gas. Even though rates are reduced (meaning more residence time is available in the Hydrogenation Reactor catalyst), if the TGU catalyst is sick then unconverted COS will slip through the TGU amine system to the incinerator.
If there is not a TGTU downstream of the Claus unit, then stack emissions concentrations directly increase in proportion to the unconverted sulfur. Incineration systems, permitted on a concentration basis of SO2 in the stack, will see an increase in SO2 at turndown which should be considered at the design stage.
In addition to these points, there are two further complications with turndown operations. The first is the
formation of sulfur fog in the sulfur condensers, while the second concerns heat loss. In the case of sulfur fog, conversion to elemental sulfur is not affected directly. It is the recovery of sulfur within the condensers that suffers. At low mass velocities (< 1 lb/s·ft2), fine droplets of elemental sulfur mist evade capture by conventional mist elimination equipment and this leads to lower sulfur recovery efficiency. The risk of reaching the sulfur dew point in a downstream sulfur converter increases, and this is compounded by increased heat loss.
Besides the concerns about the sulfur dew point in the catalyst beds, heat loss reduces the temperature in the Reaction Furnace and is exacerbated at turndown. Wissbaum6 provided a methodology to estimate heat losses in the Reaction Furnace. This has been incorporated into OGT|SulphurPro.
Because both the heat loss and sulfur fogging concerns are highly specific to plant configuration, these facets in the work were not explored. However, these relative influences are blunted somewhat also by the choice to limit the turndown in a sulfur plant to 30% of design. In the case of a well-designed sulfur condenser, the risk of fogging losses is minimal at 30% hydraulic load.
Table 3 compares the unit operating at 30% turndown on acid gas only vs operating at 30% hydraulic turndown on a mixture of acid gas and natural gas. This latter case is illustrative of an operating point halfway through pulling the acid gas out during a shutdown. The reaction furnace temperature is a significant concern (+400°F) in both cases.
Table 2. Parametric results from turndown case study
Here, the temperature was limited by adding tempering steam in the simulation.
Note also from Table 3 that significant changes occur in the WHB and downstream tail gas. The peak heat flux for acid gas alone shows a considerable reduction compared to the full-rate operations. However, when operating on acid gas plus natural gas mixtures, the peak heat flux shows less decrease. This can be explained through the much higher reaction furnace temperatures for the mixture cases. Because a considerable portion of the combustibles is now hydrocarbon rather than acid gas, the temperature within the furnace is much higher. Tempering steam is needed while combusting a significant amount of hydrocarbons, not only to keep the temperature moderated, but also to mitigate soot formation.
The overall conversion and recovery are quite considerably reduced under the startup/shutdown operations compared to both the full rate, and even vs 30% turndown on acid gas only. If the operating company is mandated to meet a certain percent recovery or SO2 concentration in the stack, this could very plausibly prevent the plant from meeting the permitting requirement.
Conclusions
Table 3. Parametric results from 50% startup/shutdown case study
*These simulations ignore heat loss
Although startup and shutdown procedures are short-term actions in any sulfur processing facility, there are long-term implications if not properly considered integrally, both within the design phase, as well as during operations. Careful measures need to be taken to avoid damaging the integrity of the unit, which will cause untimely repairs to be required. Utilising the kinetic and heat transfer ratebased sulfur simulator, SulphurPro, can help give better understanding of the operations during these procedures, allowing steps to be taken to plan for and mitigate potentially costly events revealed by the simulations but invisible to the human eye.
Turndown also needs to be carefully monitored and given ample consideration right from the start. Knowing the limitations of the unit and what may occur during these turndown operations will help prevent unnecessary repairs and downtime. Design targets can additionally be set more intelligently, using the simulation tool’s rate-based kinetics.
References
1. NASATO, E., HATCHER, N., WEILAND, S. and FULK, S., ‘Factors Affecting Claus Waste Heat Boiler Design and Operations’, Sulphur 2018.
2. NASATO, E., MISALE-MYTTLE, D., BAROW, D., and HUFFMASTER, M., ‘Examining the Impact of Waste Heat Boiler Design and Operation on WHB Reliability’, Sulphur 2015.
4. GENE GOAR, B., ‘Design Considerations for Modified Claus Sulphur Recovery Plants’, Proceedings of the Comprimo/Western Research Seminar on Gas Sweetening and Sulphur Recovery, Amsterdam, the Netherlands, (November 1985).
5. KRUEGER, K., MALDONADO, F., and HUFFMASTER, M., ‘Low Temperature Tail Gas Kinetic Functions – What They Are –Really’, Brimstone Conference Proceedings, (2016).
6. BLAIS, D., MARSHALL, C., and WISSBAUM, D., ‘How Hot is Your Reaction Furnace – Really?’, Proceedings of the 2012 Laurance Reid Gas Conditioning Conference, Norman, Oklahoma, US, (February 2012).
Dr David Kirkwood and Jamie Williams, Indicatura, UK, alongside Mike Smeltink, Worley Comprimo, the Netherlands, suggest how industrial organisations can incorporate advanced probabilistic forecasting techniques to account for future uncertainties and better assess the risks and benefits of technology options.
We live in an increasingly fast changing world, where predicting the future is becoming ever more difficult. Why does this matter in terms of investing in industrial assets and process technology selection? It matters because investors are seeking to better understand future uncertainties and their potential impact on their investments, which in turn requires a greater understanding of the associated risks.
As such, it is more important than ever for industrial organisations, including those in the hydrocarbon sector, to adopt more sophisticated approaches when evaluating these investments, and move beyond traditional total cost of ownership (TCO) to whole-life value (WLV) analysis.
TCO and WLV
Capital investments in industrial assets and process technology traditionally rely on financial analysis of
Table 1. Summary of approaches to WLV analysis
Type of analysis
Point Single snapshot calculation based upon ‘point source’ data – unit rates, CAPEX, OPEX, carbon, etc.
Time-based
Simple future uncertainties
Application of unit rates and principles across a defined time period, e.g. 25 years. May include inflation and discount rate for NPV. Used for three-point estimates
Applying levels of uncertainty, e.g. +/- 3% on input unit rates to quantify the impact of potential uncertainty across a defined time period
Probabilistic forecasting Applying complex hierarchical probabilistic theory and analysis to analyse impact of likelihood upon the results
Advantages
n Quick to complete
n Provides indication of benefits for various options
n Promotes further discussion and supports additional analysis
n Includes impact of timing and allows for periodic events
n Provides a more financial analysis to support business cases
n Allows some sensitivity analysis
n Provides more nuance and complexity than a simple time-based solution. Provides a simple version of expected outcomes with some limits to maximum and minimum
n Three-dimensional analysis – finance/carbon, time, and probability
n Enables profiles of inputs against profiles of probability. Provides probabilistic outcomes with confidence levels
the projected benefits against the costs of the investment, TCO, usually expressed in terms of capital (CAPEX) and operating (OPEX) costs over the life of the asset.
More recently, sustainability has also become a driving factor when considering the various investment options This has led to a more advanced form of investment analysis, WLV, which enables all levers of value to be forecast, resulting in a more balanced appraisal of the options available.
Coupled with this is the move to incorporate more sophisticated analytical techniques, such as Bayesian hierarchical analysis, which not only quantifies the potential benefit of one option over another, but also evaluates the likelihood of this outcome being achieved given uncertain futures.
Approaches to WLV analysis
Table 1 illustrates four types of analysis that can be applied to identify the potential WLV from investment in industrial assets and process technologies. They can be summarised as follows:
n Point: a simple estimate based upon a single point in time, with a focus on CAPEX.
n Time-based: considers possible variance of factors such as revenues and OPEX over the life of the asset.
n Simple future uncertainties: allows for variance of key inputs in the future (often completed as a three-point estimate – best, worst, and most likely cases).
n Probabilistic forecasting: enables incorporation of unknown futures in terms of probability profiles and the fact that inputs do not vary in isolation, as is often assumed when completing a traditional sensitivity analysis.
Disadvantages
n Single dimension
n Misses time-based complexities, e.g. periodic asset replacement
n Snapshot in time and does not reflect impact of future cash-flows
n Cannot support a full business case
n Limited ability to analyse the complexities of various scenarios beyond simple sensitivity analysis
n Two-dimensional analysis –finance/carbon against time
n Leads to maximum-maximum and minimum-minimum limits that are not realistic outcomes in reality
n Two-dimensional analysis –finance/carbon against time
n Requires specialist tools/applications and ability to process complex computations
n Requires knowledge to apply
Each of these approaches has its merits, as well as drawbacks, with the major disadvantage of the first three being the reliance on a ‘simple’ version of the future, which can lead to poor decisions.
Uncertain futures and comparative analysis
Financial forecasts that underpin capital investments generally rely on some form of prediction of how key metrics will vary in the future, for example, inflation, commodity prices, and the various input costs. However, it is nearly impossible to predict the future and, as such, these financial forecasts stand a very good chance of being wrong.
It follows, therefore, that if the future cannot be accurately predicted, it is not possible to accurately predict the ‘absolute’ future performance of a particular investment, especially when considering a financial analysis that is based upon so many unknown future input values.
As a result, when comparing differing options, it becomes more useful and meaningful to complete a comparative analysis with one option selected as the ‘baseline’. The impact of the future unknowns can then be explored in terms of how they impact the potential benefits of one option over another, as well as the likely ranking of the various options.
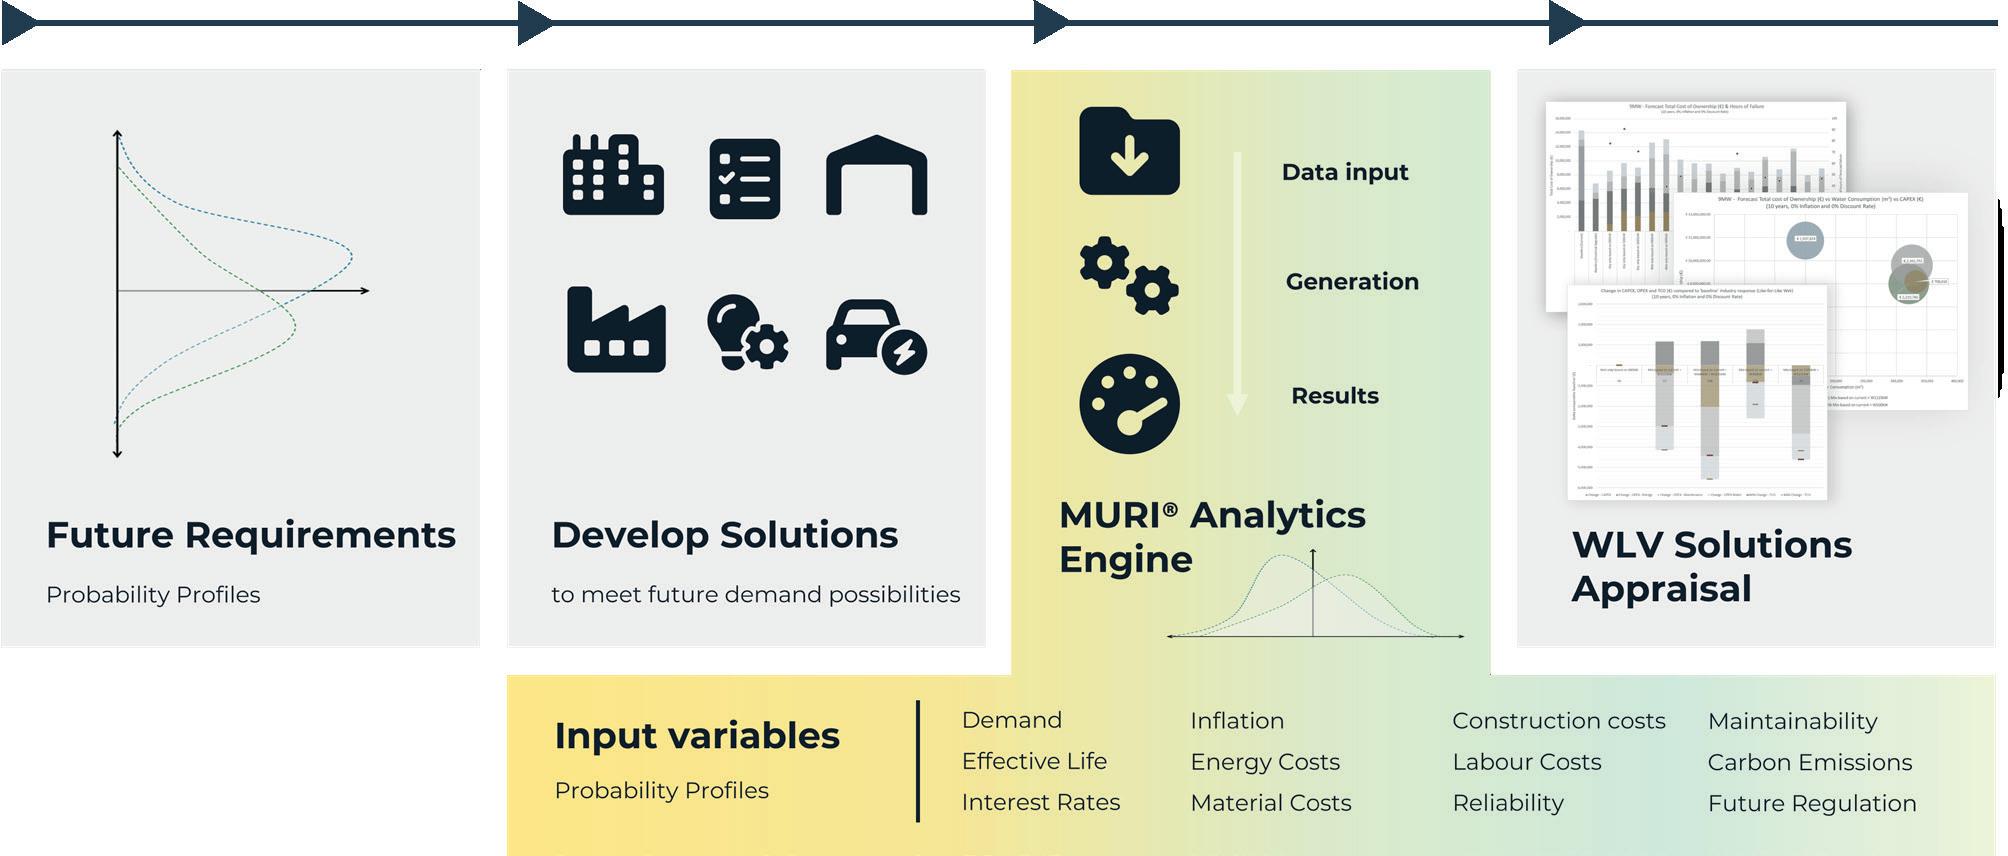
Considering these factors, a more sophisticated approach to understanding the potential impact of unknown futures on investment decisions is needed, which is why Indicatura developed the KBEE® approach with the MURI® software application, illustrated in Figure 1.
Using probability-based profiles for key analytical inputs, including externalities such as future product
demand and environmental conditions, it is possible to analyse various technology options from a WLV perspective, while taking into account the potential variances in the analytical inputs.
In this way, it is not only possible to cater for future unknowns but arrive at more robust and resilient decisions when evaluating asset and technology options.
Case study: sulfur recovery unit (SRU) technology selection
In partnership with Worley Comprimo, Indicatura applied the traditional time-based approach and a more advanced probabilistic approach to complete a WLV analysis of various SRU technology options, with the objectives of:
n Identifying the practicalities and benefits, or otherwise, of adopting a WLV approach within a complex hydrocarbon process industry environment.
n Providing insight with respect to the various merits of the different SRU technology options with regard to WLV, TCO, and carbon impact.
To understand the impact of increasing regulatory requirements for sulfur removal, and the resultant sustainability impact, five different technologies were
chosen and each applied to a potential European refinery application:
n Tech1: EUROCLAUS, sulfur recovery efficiency (SRE) 99.5%.
n Tech2: SUPERCLAUS + caustic scrubber unit (CSU), SRE 99.95%.
n Tech3: Claus unit + TGTU + MDEA, SRE 99.80%.
n Tech4: Claus unit + TGTU + alt solvent, SRE 99.95%.
n Tech5: TOPCLAUS, SRE 99.95%
For this analysis, the Claus unit, tail gas treatment unit (TGTU) and MDEA (Tech3) was chosen as the ‘baseline’ technology against which the other options were compared using WLV analysis techniques.
In this analysis WLV was the focus as it considers a combination of TCO and sustainability, expressed as CO 2 equivalent (CO 2 e). Functional, embedded and contextual asset risks, normally included to provide a holistic view of WLV, were considered too detailed for this analysis but may be considered in future work.
WLV analysis results
The analysis was completed in a logical series of steps, each building on the previous: TCO, traditional sensitivity analysis for TCO, carbon impact, impact of carbon credits
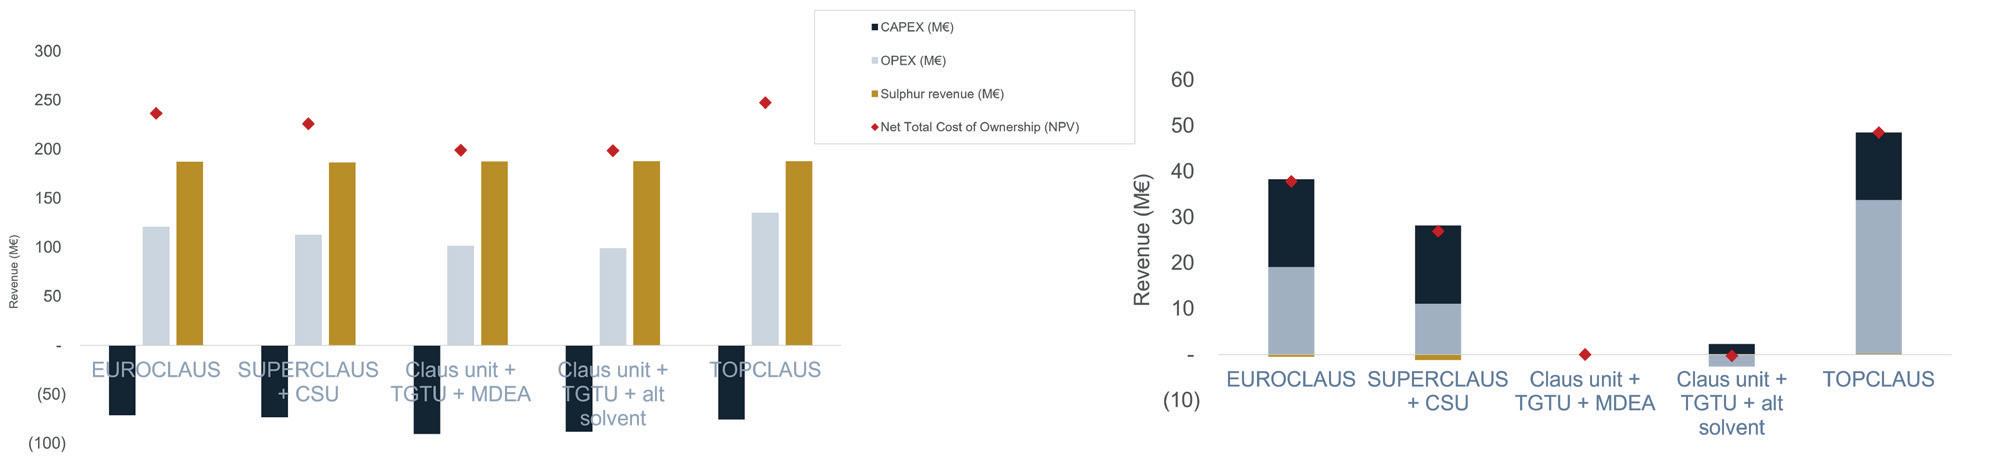
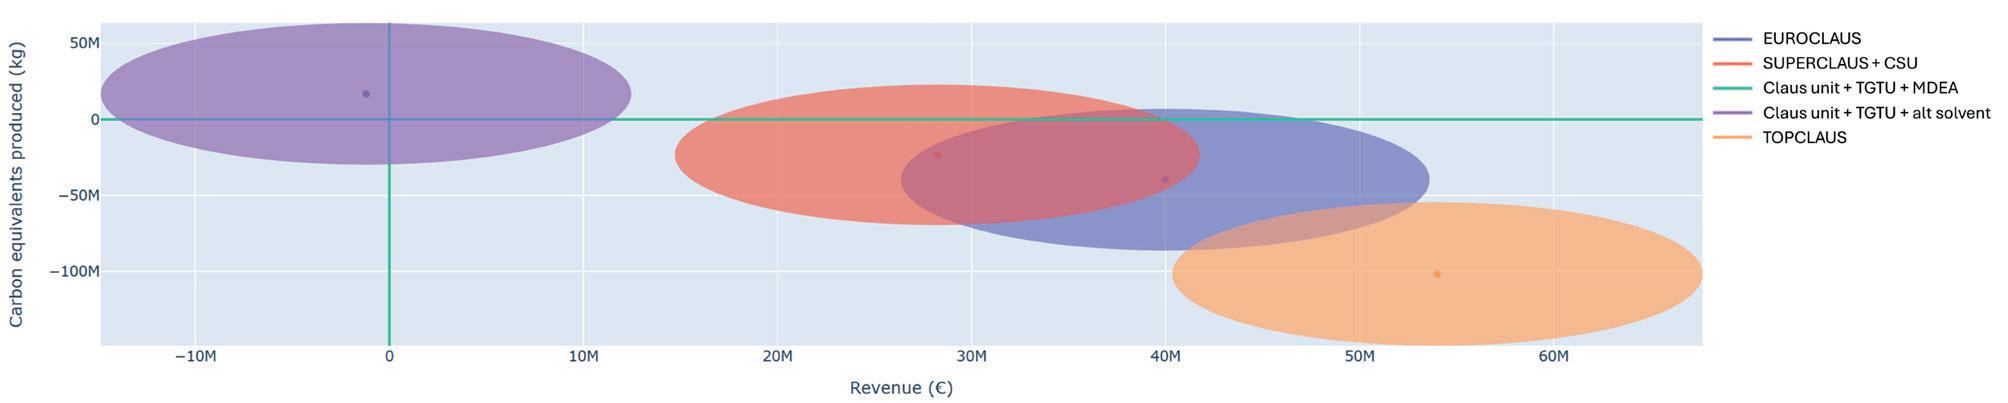
Figure 2. Total NPV for Tech1 - 5 (left), and total NPV over 25 years, normalised against Tech3; Claus+TGTU+MDEA (right).
POWERING
Fuel Transition
Thanks to its deep know-how and proven experience, Vanzetti Engineering supplies on-skid cryogenic pumping equipment downstream the liquefaction plants, complete of all the accessories, sensors and instruments for the main applications in Small-Scale LNG terminals (SSLNG).
VANZETTI
for options Tech1 - 5 – baseline Tech3 - 10% uncertainty – combined discounted revenue + total CO2e including potential savings.
WLV with an uncertain future. For brevity, the results from the TCO, sensitivity analysis for TCO and probabilistic WLV in an uncertain future are summarised in the following sections.
Total cost of ownership (TCO)
Figure 2 (left) illustrates the results of the TCO analysis in terms of NPV for the five options, highlighting the major contributors of CAPEX, OPEX, and sulfur revenues. While it is apparent that Tech3, the baseline, has the lowest NPV, this is clarified further by comparing the results to the baseline (Figure 2, right). As can be seen, all the technology options are forecast to perform significantly better than the baseline option (Tech3), with Tech5, TOPCLAUS, forecast to offer NPV improvements over the 25 years of 20%.
Sensitivity analysis for TCO
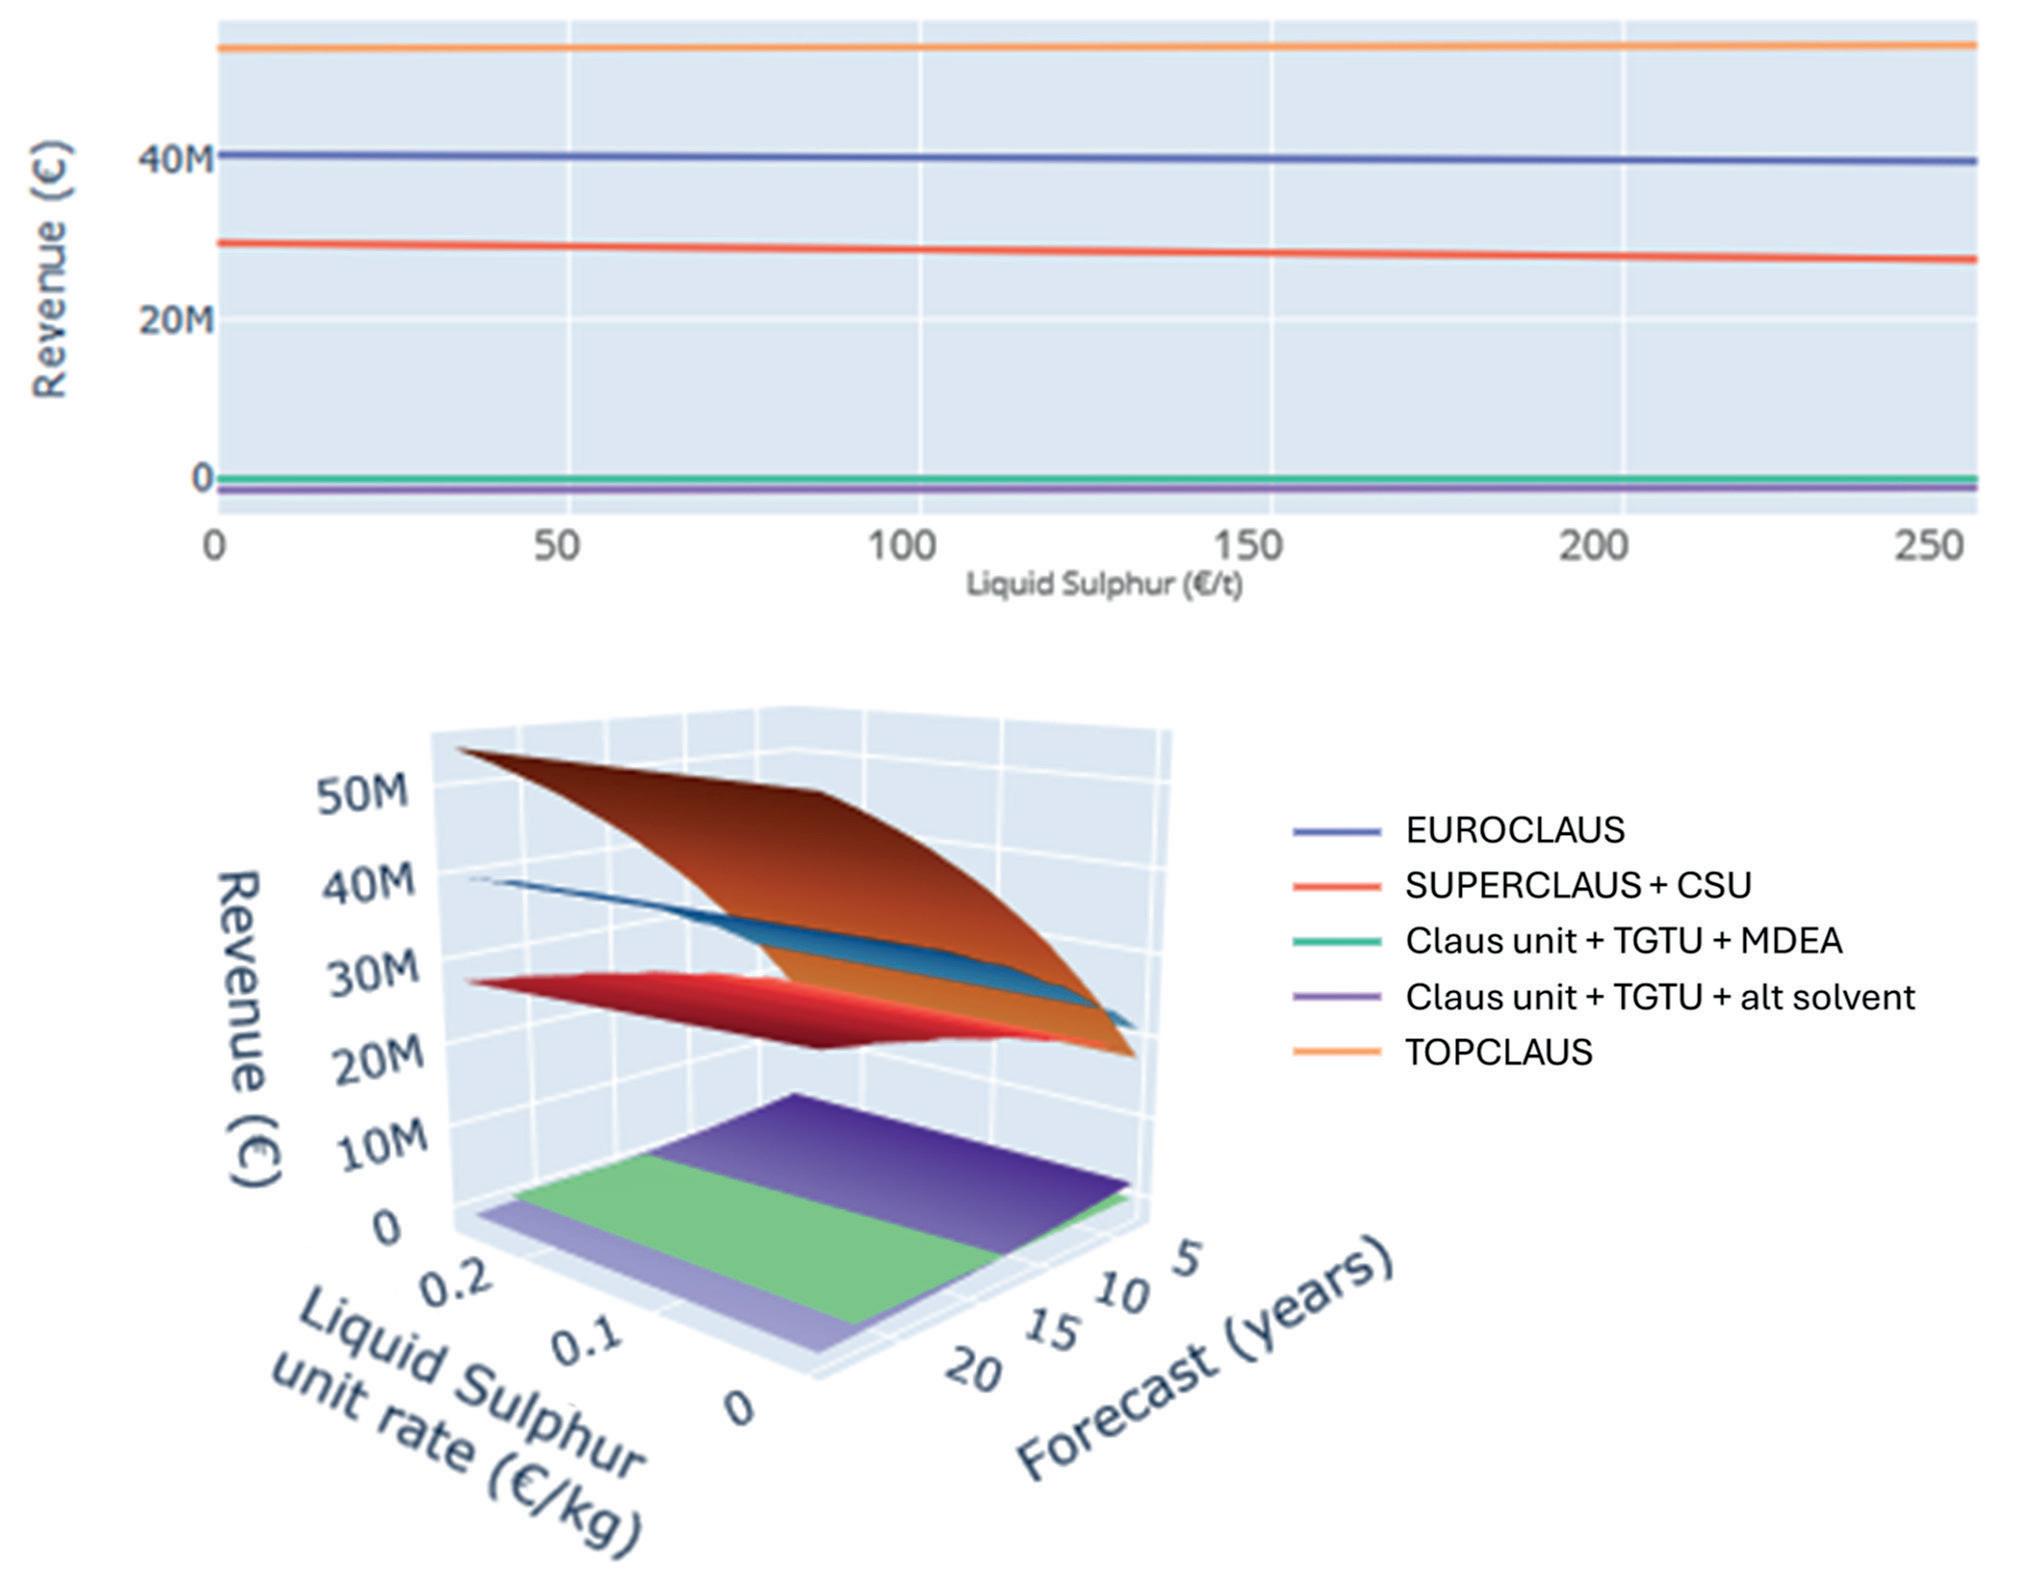
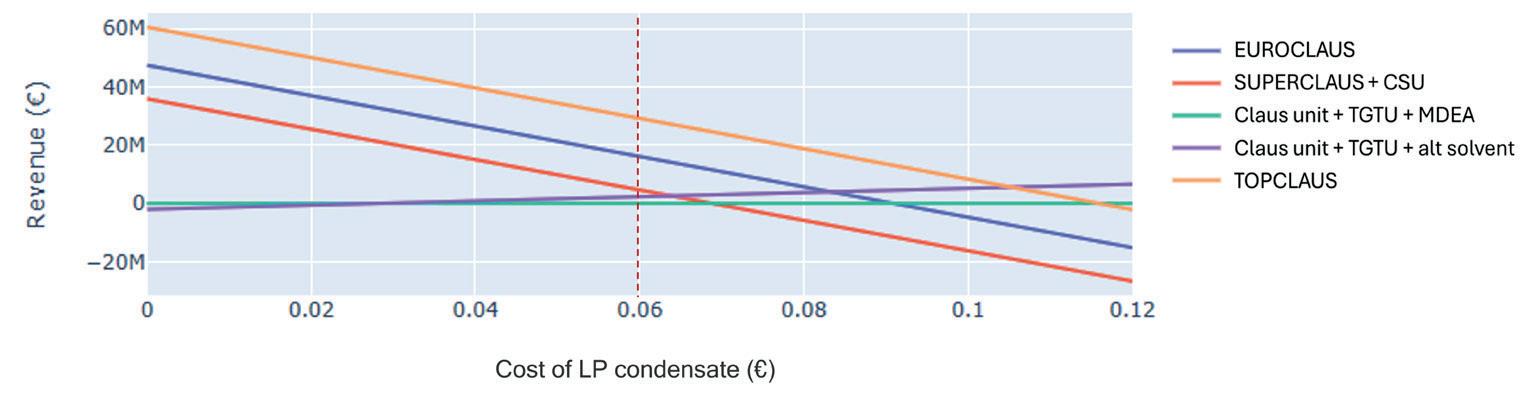
A traditional sensitivity analysis has been completed to understand the various factors that are likely to influence the results of the TCO analysis. These key variables were selected for sensitivity analysis, based upon their scale of contribution to the TCO. For example, Figure 3 illustrates the resulting TCO for the different technology options, baselined to Tech3, across a range of values for liquid sulfur. This highlights the limited effect that individual variables, e.g., liquid sulfur or fuel gas price,
Figure 5. WLV
Figure 4. Impact of variance in LP condensate on TCO compared to Tech3 (baseline).
Figure 3. Impact of variance in liquid sulfur unit rates on TCO compared to Tech3 (baseline).
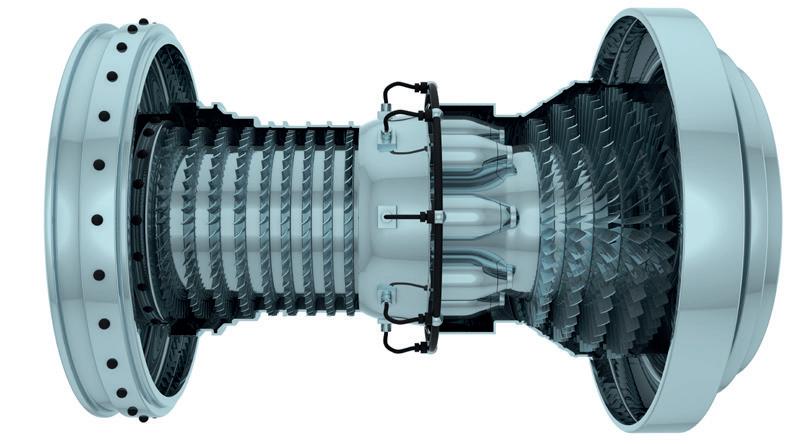
TGSim PlusTM
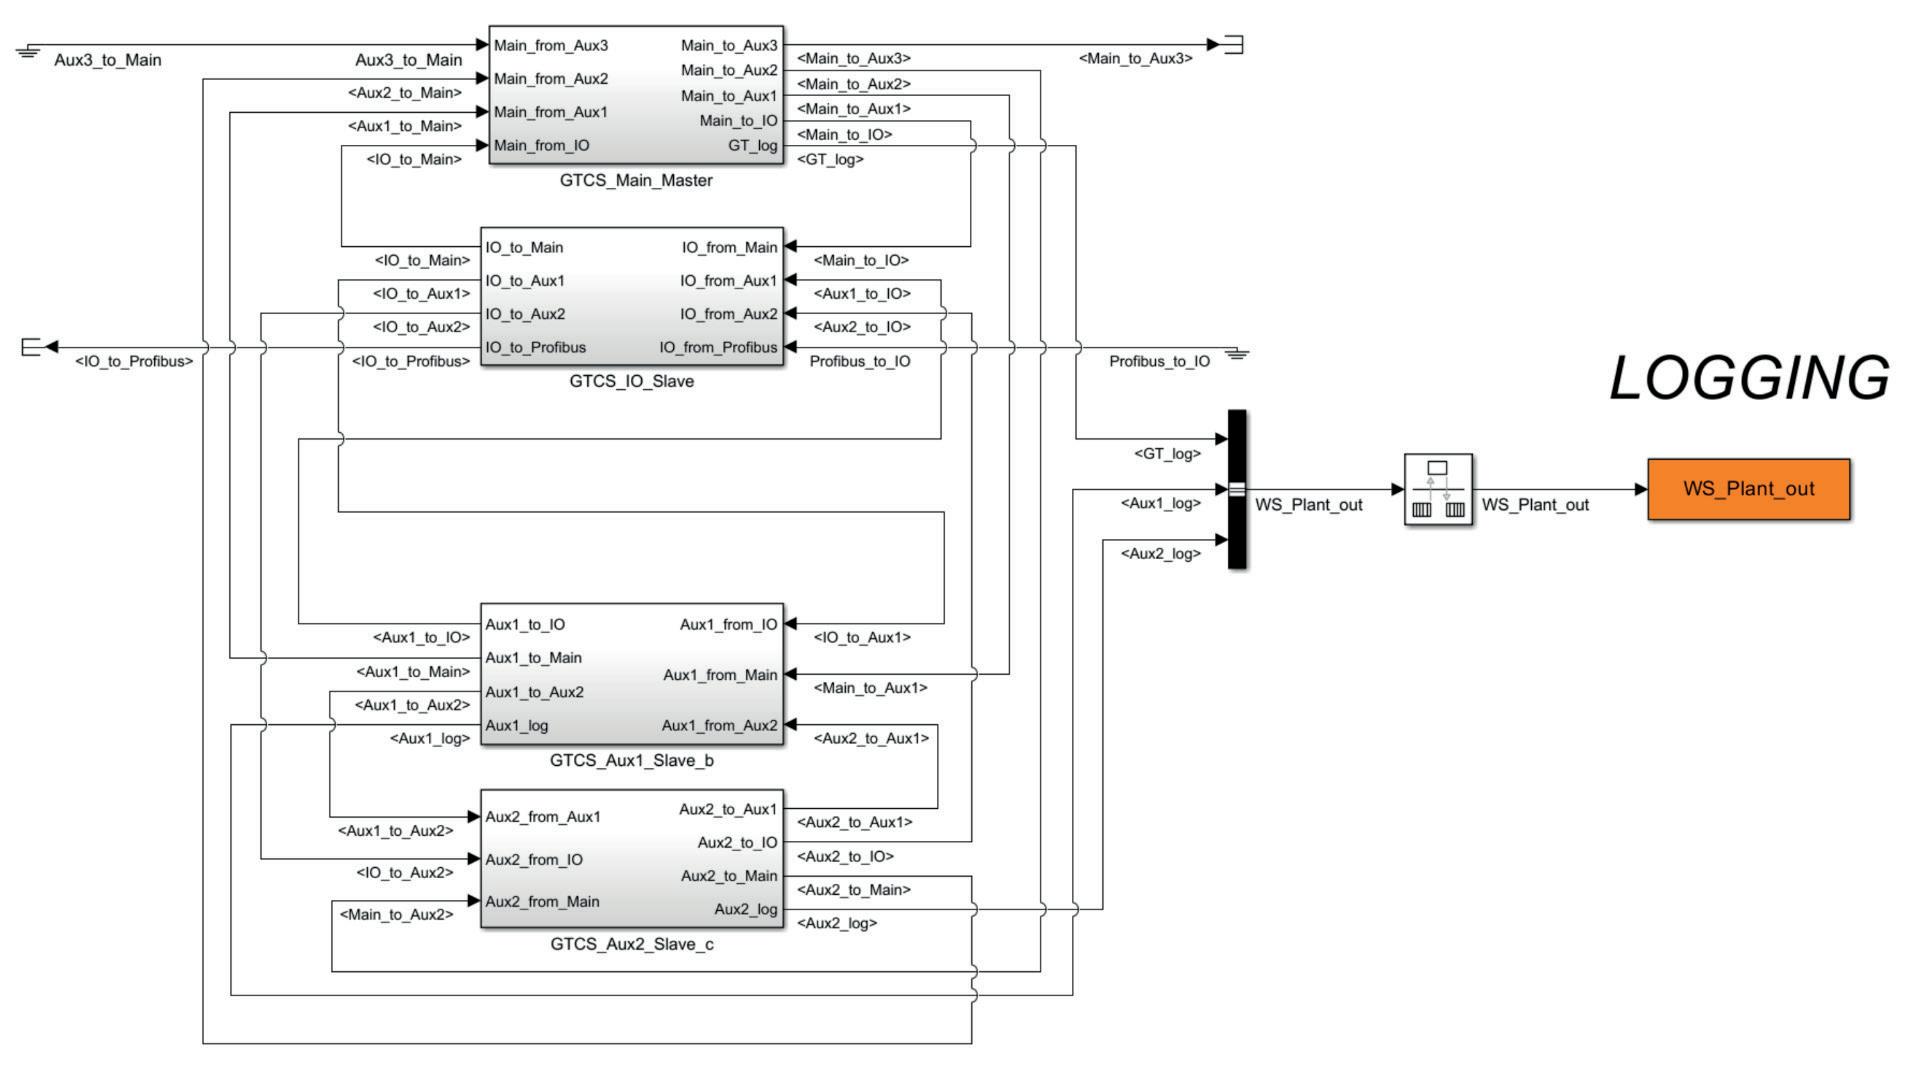
DESIGN AND ANALYSIS OF GT MAIN SYSTEM AND AUXILIARIES
GT CONTROL SYSTEM VERIFICATION & VALIDATION BY HIL TESTING
SCENARIOS
» Verify and validate the real GT Control System (GTCS)
» Hardware-in-the-Loop (HIL) full system testing
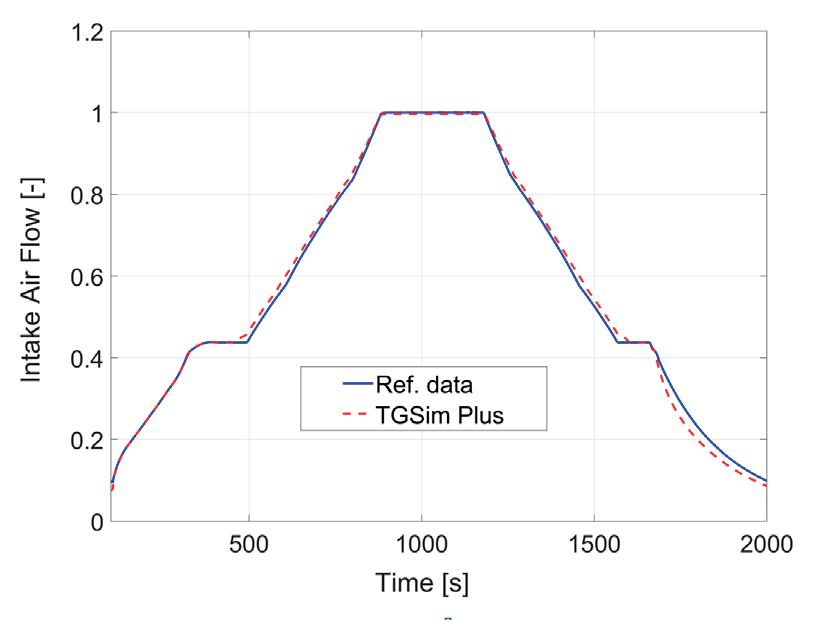
» Whole system performance analysis:
y Accurate performance envelope
y Start-up sequences
y Normal and emergency shutdowns
y Load rejection
y Investigation of fault events
TECHNICAL DETAILS
» 0-D modelling
» GT component modules libraries
» Real-time compatibility at millisecond scale
» User friendly GUI & pre-/post-processing tools
» Split stages or whole compressor maps management
» Single or bi-fuel combustion chambers, including Hydrogen
START-UP & SHUTDOWN
GVA
GVA
Figure 6. WLV options Tech1 - 5 combined with CO2e emissions – baseline Tech3 - 10% uncertainty applied –combined discounted revenue + total CO2e including potential savings.
terms, as shown in Table 2, whereby the likelihood of the possible benefit from the option, over the baseline (Tech3) is expressed in terms of probability and the size of the benefit in terms of 50% of the likely outcome.
have on ranking of technology options. Adding the axis of time further demonstrates that the variance in the liquid sulfur unit rate does not affect the order of ranking of the various options.
This was found to be the case for the other input variables, apart from Saturated HP steam and LP condensate. A minor variance in the input LP condensate rate, e.g. from €0.06/kg to €0.08/kg, changes the ranking of the technology options when considered from a TCO perspective (Figure 4).
This highlights the potential issue with simple time-based TCO, namely, fixed input variables. Additionally, using simple uncertainty analysis will not address this fundamental problem, highlighting the need for a more sophisticated approach.
Probabilistic WLV analysis
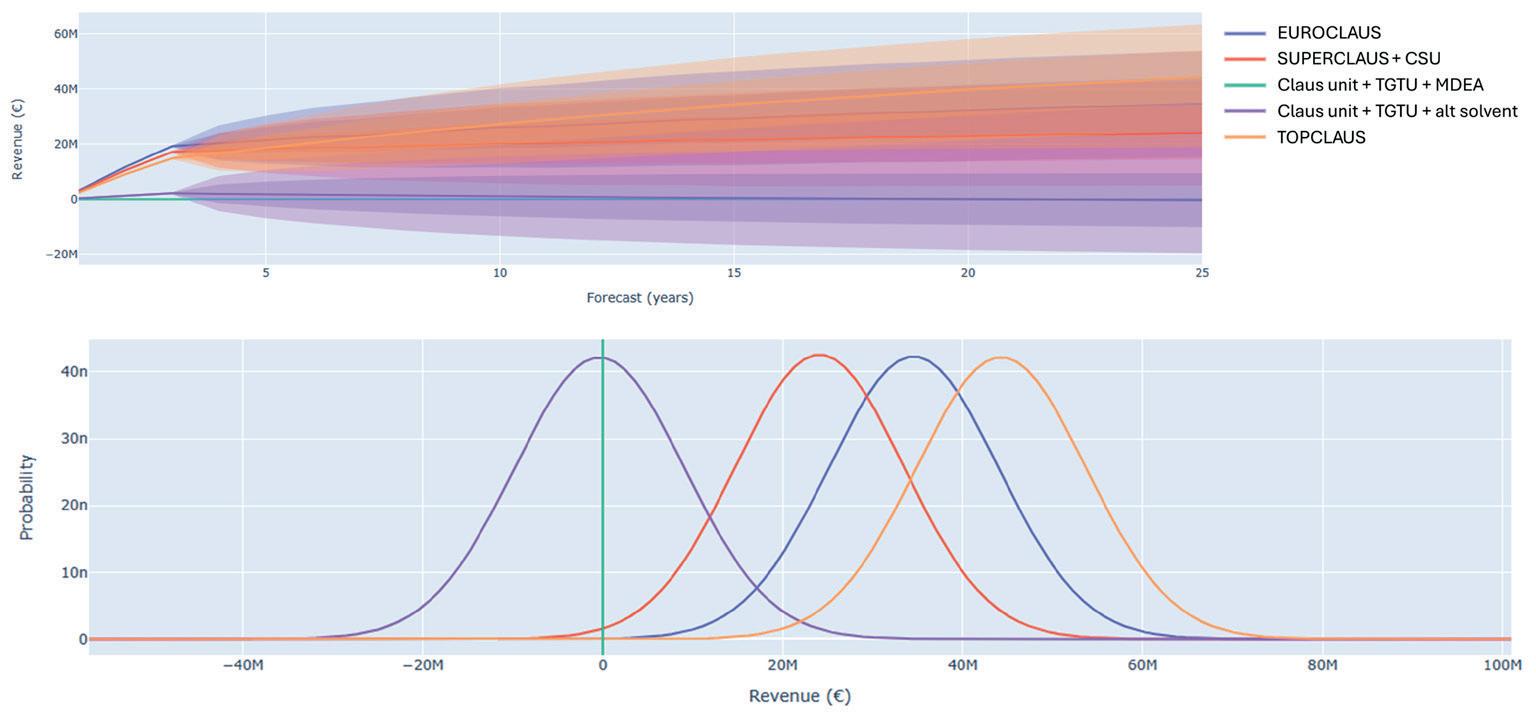
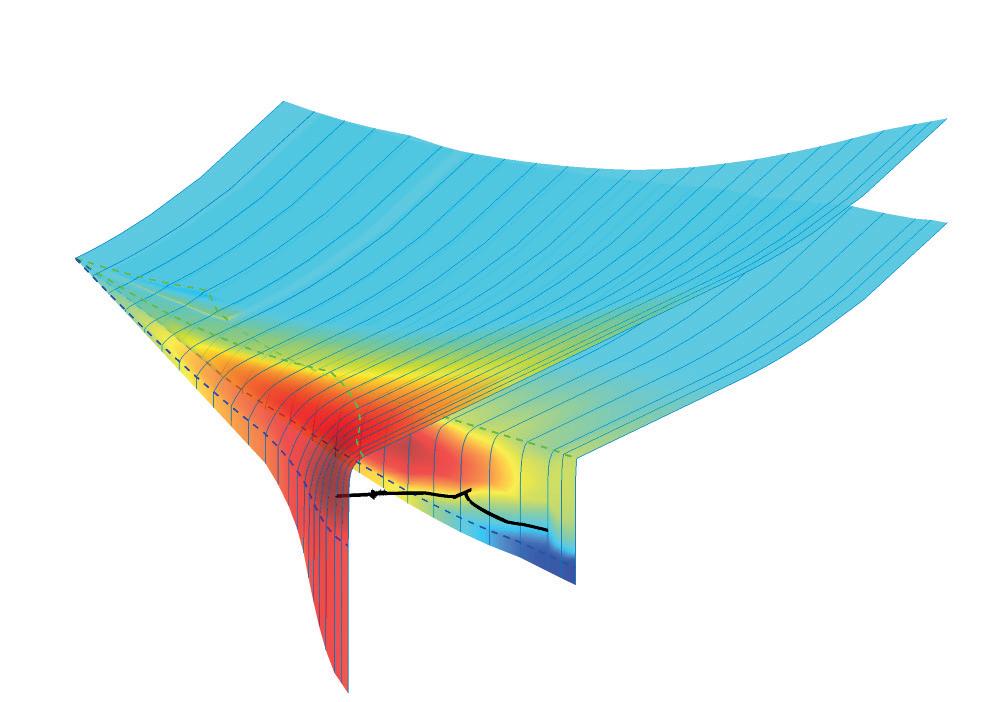
Figure 5 illustrates the results of a more nuanced and sophisticated approach to the WLV analysis, using Bayesian hierarchical probabilities. For this analysis, each of the inputs has been subject to a probabilistic profile with a fixed degree of uncertainty.
The WLV results (including carbon impact) are baselined to Tech3 for the forecast WLV over time and, as can be seen, this results in a ‘blurred’ view of the future WLV outcomes, with the various shades representing 1 and 2 standard deviations around the mean.
To aid interpretation and better inform the likelihood of the outcomes, a slice can be taken through these distributions in year 25, as illustrated in Figure 5. This more clearly highlights the differences between the technology options, along with the likelihood of an outcome occurring.
It is also possible with the probability analysis to express the above in more understandable quantitative
In effect, this analysis is not only informing which are the better options, but the quality of the choice and the likelihood of the outcome being achieved.
The same approach can be taken, whereby sustainability, in terms of quantities of CO 2 e, is included so that a more balanced view of the options can be taken, as shown in Figure 6.
It can be seen that Tech1, Tech2, and Tech5 offer both improved NPV and reduced carbon impact when compared to the baseline. Tech3 and the use of uncertainty also illustrates, via the 1 standard deviation ‘bubbles’, that there is a high likelihood of these outcomes being achieved given 10% uncertainties associated with the multiple metrics for the SRUs.
Conclusion
It is possible to apply advanced WLV analytics to hydrocarbon investments in assets and technologies, and the use of future probability analysis not only enables the identification of which options are the most beneficial, in terms of TCO and carbon impact, but also the size of the comparative benefits over the life-cycle of the SRU, and the likelihood of that benefit being realised.
While traditional approaches to assessing investment decisions and technology options, such as TCO analysis, offer some benefits, they are not capable of dealing with future uncertainties and, as such, may provide false comfort around those decisions.
Looking to the future, organisations will need to become more sophisticated in their approaches to optimising capital investments and technology selection. In doing so, they will improve the likelihood of making the right decisions, despite an uncertain future, and increase their chances of achieving their desired investment outcomes.
Table 2. Summary of probabilistic analysis
Jeff Gomach, Merichem Technologies, discusses how refinery operators can defend against the threat of hydrogen sulfide (H2S) by using effective removal treatments.
The risk of hydrogen sulfide exposure is one of the most significant hazards associated with upstream, midstream, and downstream oil and gas operations, as well as some renewables operations. Hydrogen sulfide (H2S) is highly toxic to humans and poses significant safety risks to workers and the environment. It acidifies water, which causes pitting corrosion to carbon steel pipelines, a reaction that increases exponentially when combined with oxygen and carbon dioxide (CO2), thereby significantly reducing the service life of oil and gas transportation pipelines and processing facilities. Left unchecked, H2S becomes a contributor to acid rain, and end products fail to meet required process and fuel specifications.
Without consideration or treatment, accidents could emit H2S during the extraction, storage, transport, or
processing stages. This would cause both safety and environmental issues worldwide.
While no single international standard exists for H2S regulations, most countries regulate emissions based on occupational exposure limits. The World Health Organization (WHO) does not impose a strict health-based limit; rather, it provides an air quality guideline for hydrogen sulfide based on odour perception averaged over a 24-hour period. In the US, regulatory agencies like the Environmental Protection Agency (EPA) and Occupational Safety and Health Administration (OSHA) set determined exposure limits and enforce compliance with safety standards regarding H2S exposure in the workplace.
The removal of H2S from feedstocks is one of the most essential undertakings in industry operations. It is primarily overseen by facility operators who are responsible for
implementing safety procedures and selecting appropriate treatment methods for managing H2S levels.
Chemical scavengers, scrubbers, and biological processes
Chemical sulfide scavenger refers to any chemical (typically a commercial additive) that reacts with one or more sulfide species and converts them to an inert form. Effective chemical scavenging is based on attaining an irreversible and complete chemical reaction between the scavenger and one or more sulfides. There are various regenerative and non-regenerative scavengers for removing H2S in downstream operations, all of which differ in mechanisms, efficiencies, and efficacies in capturing and removing H2S.
A legacy solution, chemical scavengers became widely used to remove lower quantities of H2S in the mid-20th Century. The optimal strategy for choosing a solution should take into consideration demand, plot space, efficacy, and CAPEX/OPEX – as well as the composition of the hydrocarbon stream, operating conditions, and regulatory requirements.
Despite their ability to remove or reduce concentrations of H2S gas, chemical scavengers are not without their shortcomings. Some can form solid deposits in pipelines and equipment which can develop into a host of follow-on issues. There may be compatibility issues with downstream processes such as glycol dehydrators, limited efficacy in situations with high H2S concentrations, and disposal can be complex if waste materials require additional treatment before landfilling.
H2S chemical scavenging technologies continue to be tweaked and improved upon for super-efficiency. Smart chemical scavengers are being developed to selectively target and neutralise H2S in complex mixtures. They employ advanced materials and molecular design to improve reaction rates and selectivity, reducing the amounts required for effective scavenging. Research is also being conducted on developing recyclable chemical scavengers that can be regenerated and reused multiple times, which will minimise waste and lower costs.
As innovation continues, advanced chemical scavengers promise to transform H2S mitigation, making it more efficient and environmentally friendly.
Another option for removing H2S is a chemical scrubber. Scrubbers utilise sodium hydroxide (NaOH) to neutralise H2S after absorption in the scrubbing liquid, forming aqueous sodium sulfide and sodium bisulfite. The aqueous sodium sulfide can then be further oxidised by a chemical agent, such as hydrogen peroxide, or sodium hypochlorite, to form soluble sodium sulfate, which is removed from the system using a blowdown stream. The blowdown stream is usually sent to disposal.
The most typically used equipment for a caustic scrubber is a packed-bed scrubber, preferably a vertical countercurrent packed-bed tower. This type of scrubber has high efficiency mass transfer, smaller equipment size, but some pumping costs. The process design is a countercurrent operation where gas flows upward, and the liquid caustic flows downward through spray nozzles or a liquid distributor. Fibre-reinforced plastic (FRP) is used as the material of choice, especially if sodium hypochlorite is used as an oxidising agent. There are drawbacks that keep chemical oxidation scrubbers from being widely used. The caustic is selective to H2S in the presence of other contaminants but not exclusive. In the case of high CO2 concentration, the interference must be minimised. Carbon dioxide results in the formation of sodium carbonate and increased caustic usage. Managing the blowdown stream also increases operating costs.
Biological processes, such as bio-trickling filters (BTF) are also used for removing H2S, more commonly in atmospheric pressure gasses and biogas applications. BTFs are irrigated reactors with a packed bed colonised
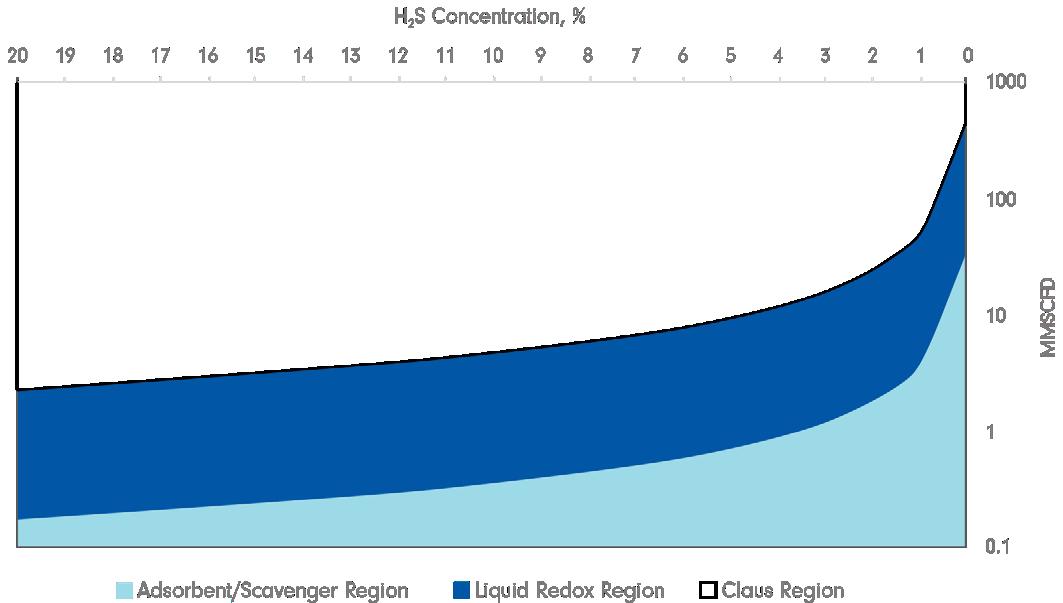
Figure 2. Recommended treatment option by H2S concentration and gas flow rate.
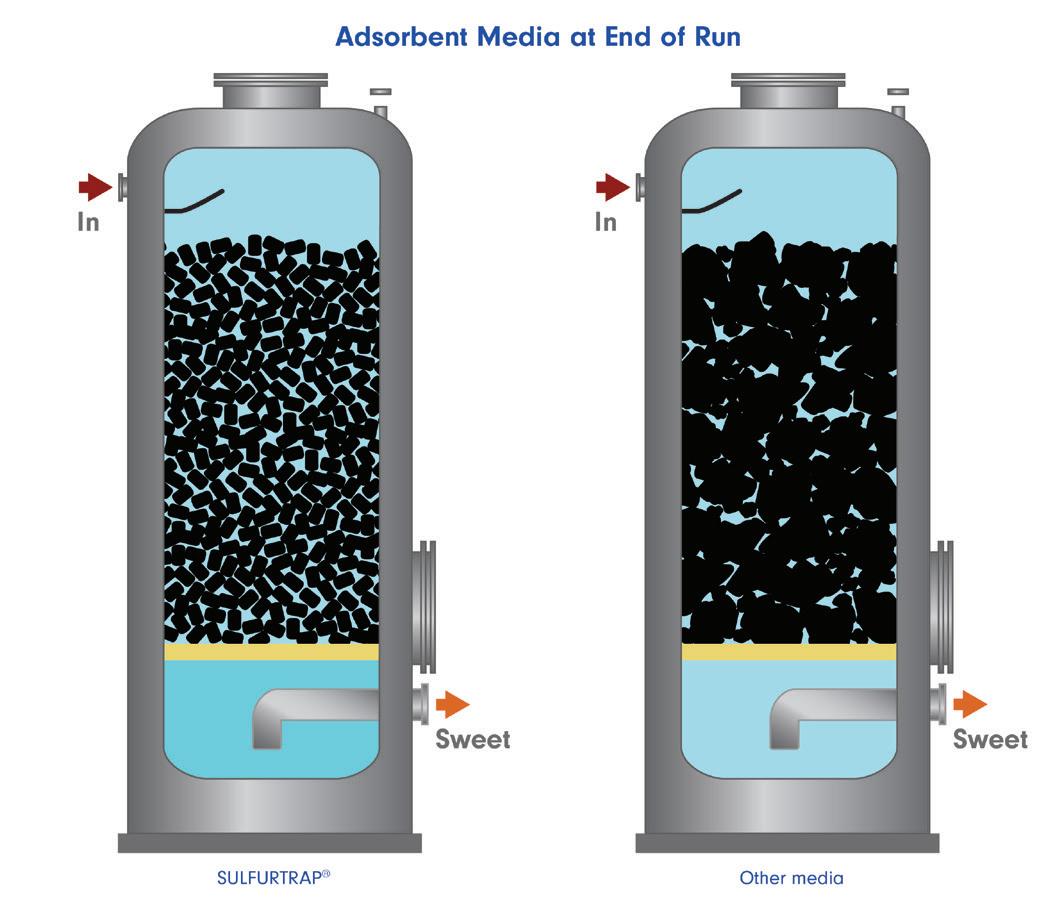
Figure 1. End of run challenges determine media recommendations.
by sulfur oxidising bacteria (SOB). As raw biogas is blown through the media, the H2S is removed from the biogas and metabolised by the SOB. This method also has drawbacks preventing its use. BTFs are sensitive to humidity, temperature, and fluctuating H2S inlet loading, long residence times, and require large vessels. Additionally, if the media dries, the microbes are rendered inactive. Biological processes are best left to other industries.
Technologically advanced H2S removal
Adsorbents, sometimes also referred to as an H2S scavenger, are among the most efficient and widely used methods for H2S removal in the downstream, midstream, upstream, and renewables sectors world-wide. Adsorbents can handle low and high concentrations of H2S, making them integral to these operations for their ability to facilitate purification, separation, and environmental compliance by selectively adsorbing specific compounds from process streams.
The choice of adsorbents versus other technologies is a function of many factors, including economics, but can initially be narrowed to applications with <1.5 tpd sulfur. This is equivalent to approximately 350 million ft3/d of gas containing 100 ppm of H2S. Anything less than this is an excellent use case for solid scavenger beds. Additionally, the selection process should emphasise efficient operation, quick changeout, and operator safety.
Selecting a suitable adsorbent requires review of the material and the environment in which it will be used. An adsorbent that compacts or cakes throughout the bed
life cycle creates high pressure drop and gas channelling, leading to shortened bed life, and may become extremely challenging to remove. Adsorbents with low crush strength or that are powdery may cake while in service leading to large chunks or layers of concrete-like hardened material that may require jackhammering or hydro-blasting to chisel it away. Changeouts of spent media of this type can potentially be dangerous, posing a safety risk to anyone performing the maintenance, especially if the worker must enter the vessel where they may be exposed to residual pockets of H2S and the potential of falling chunks damaging equipment and harming personnel.
One solid scavenger, the SULFURTRAP® EX solid adsorbent, is able to efficiently decrease the H2S content to <1 ppm with a continuous low-pressure drop (SOR to EOR), at times loading 2 – 3 times more sulfur than conventional products while keeping the cost of the media low and being more accessible and safer to changeout. With fewer and easier annual changeouts due to its free-flowing nature, low OPEX costs are achievable with this technology. SULFURTRAP EX provides a safer turnaround experience for operations and maintenance personnel as the spent material remains loose and can be quickly removed from the vessel. The technology can be used to remove H2S from gaseous and light liquid hydrocarbons and can also remove oxygen and light mercaptans, if present, which further eliminates the corrosive nature of the hydrocarbon. Operators of all types can choose from modular systems with standard sizing to fully customised SULFURTRAP systems for a wide range of operating conditions.
Liquid redox system technology
LO-CAT® liquid redox system can remove over 99.9% of the hydrogen sulfide from gas streams at ambient to moderate temperatures, and low to high pressure gas streams. Its optimum operation is for streams ranging from 1.5 to 20 tpd of sulfur removal. At these operating rates, this liquid redox system is an economically viable solution for H2S treatment. The technology uses a chelated iron solution to convert H2S to innocuous, elemental sulfur. It does not use any toxic chemicals and does not produce any hazardous waste byproducts. Its environmentally safe catalyst is continuously regenerated, so operating costs are low, and its aqueous-based ambient temperature process applies to any gas stream. The technology’s design has a small carbon footprint yet achieves more than 99.9% removal efficiency. There are no liquid waste streams, so it does not require treatment and disposal – and it is less expensive than the alternative. Its unique design allows for 100% turndown in gas flow and H2S concentrations.
Refinery emissions, sustainability, and ESG
The refinery sector of the oil and gas industry is not without controversies and challenges, particularly concerning environmental impact. Concerns for the environment shape consumer behaviour and investor decisions, requiring refiners to analyse the best solutions for meeting environmental, social, and governance (ESG) goals.
Like many hard-to-abate sectors, traditional oil refineries are facing up to the challenges of reducing their greenhouse gas (GHG) emissions, which account for approximately 25 - 30% of emissions globally. Tackling refining sector emissions is a pressing issue that will not go away – and refineries cannot afford to cherry-pick easy-to-complete ESG projects. Monitoring and controlling SO X emissions has been a prevalent environmental concern since the 1970s. The removal of H 2S from oil and gas streams can never be an afterthought.
In the US, federal regulations dominate refinery investment budgets. Compliance mandates rule over everything else, and adherence is necessary. The refiners’ trade group American Fuel and Petrochemical Manufacturers (AFPM) reported in 2024 that its member companies have spent billions of dollars on measures to improve efficiency and cut emissions. These requirements have broadened into all areas of oil and gas treatment and are becoming the norm.
Plants that continue to manage available resources, investments, and technologies can maintain and optimise operations with an emphasis on safety, reliability, efficiency, and environmental and social awareness. Selecting the right system for each installation is paramount to meeting required ESG goals and protecting the planet from SO 2 emissions while maintaining internal OPEX and CAPEX requirements.
Harry Burton, AMETEK, outlines the methodology behind monitoring amine acid gas treatment and discusses the importance of acid gas removal units and analytical solutions in optimising amine stripping.
Demand for natural gas is at an all-time high, with annual consumption in the US alone totalling approximately 32.6 trillion ft3 1 Meeting this demand necessitates a continual and efficient means of supplying high quality natural gas to market. Gas-sweetening serves as one of the last remaining treatment procedures before the final sales gas product is sold for additional processing, or to be introduced into the energy grid. Critical to sweetening is the removal of hydrogen sulfide (H2S) and carbon dioxide (CO2), along with other impurities such as mercaptans, benzene, toluene, ethylbenzene, xylene (BTEX), moisture, and additional sulfur species, which can taint the final product.
H2S being present in natural gas supply, at sufficiently high concentrations, can lead to hazardous air quality environments. CO2, when in the presence of water and H2S, can produce reactions that form corrosive elements that degrade pipeline surfaces, such as carbonic acid. Multiple industry standards exist to keep total sulfur content to below 17 ppm, which is in accordance with EPA guideline 40CFR72.2. For H2S, this means a concentration level of no more than 4 ppm. CO2 is expected to be no more than 3% for pipeline distribution into natural gas energy grids.2 This can be lower (<50 ppmv) if the natural gas is expected to undergo cryogenic cooling, as CO2 provides a sufficient environment for dry ice to form at such low temperatures. The transportation of natural gas as LNG is a noteworthy example of a situation that requires as little CO2 as possible. Not meeting these H2S and CO2 standards can entail significant losses for producers, as they either cannot sell their gas product, or must do so at a discount.
Amine treatment has proven itself to be a reliable method for removing H2S and CO2 from process gas. However, given industry standards on the allowable concentrations for these two species, amine plant operators will often find themselves ‘over-stripping’ the amine to ensure the final sales product meets specifications. Ultimately, this produces sales gas with H2S and CO2 concentrations well below the necessary limits. Given that heat is critical for this process, this means amine treatment users find themselves with higher operating costs due to generating more heat than needed to successfully remove H2S
and CO2. As a result, industry leaders have stressed the need for an analytical solution capable of monitoring these key species so that the circulation rate, regeneration frequency, process temperature, and contact time for amine stripping can be optimised.
To that end, it is important to underline the methodology behind amine acid gas treatment, what techniques are currently employed to monitor the concentration of the impurities to be removed in amine solution (specifically H2S), and what challenges exist in monitoring lean amine with acid gas constituents.
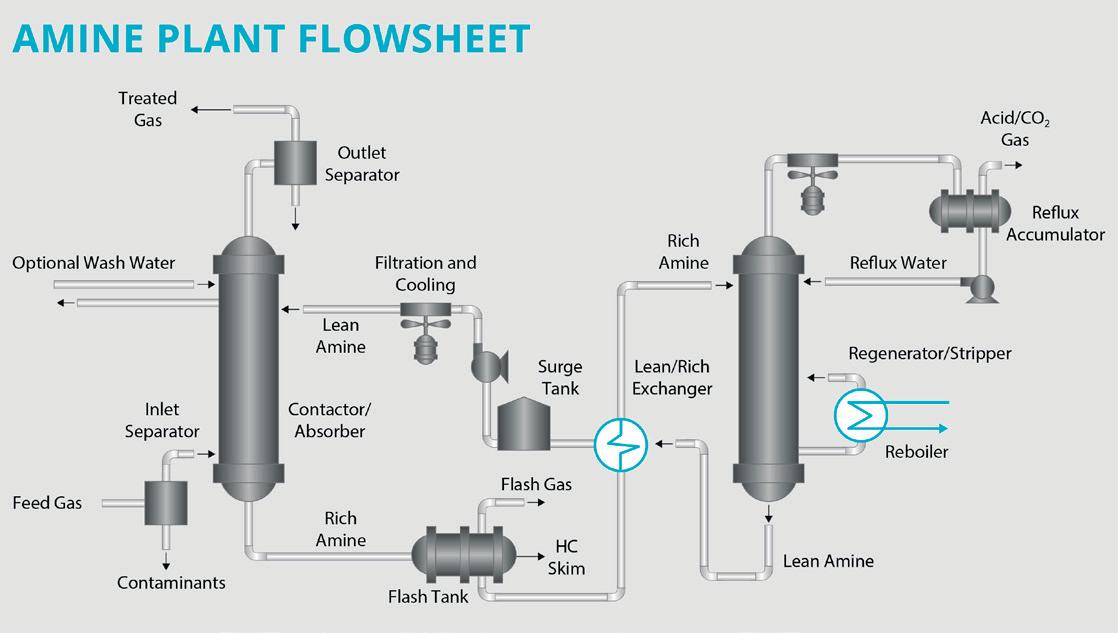
Acid gas removal unit (AGRU) process
AGRU makes use of aqueous amine solution for the removal of H2S and CO2 acid gas impurities from natural gas. This method relies on the chemical absorption of CO2 and the amine to form weakly-bonded intermediate compounds, which also allows for the uptake of H2S. When exposed to heat, CO2 and H2S are released, and this amine is now considered ‘regenerated’.
Several amine options exist in ready supply, which are characterised by the number of organic constituents bonded with nitrogen (N2), which includes primary, secondary, and tertiary amines.
n Primary amines: monoethanolamine (MEA) and diglycolamine (DGA).
n Secondary amines: diethanolamine (DEA) and diisopropanolamine (DIPA).
n Tertiary amines: methyldiethanolamine (MDEA).
DEA, MEA, and MDEA are traditionally the most employed amines in AGRUs. Each amine provides its own benefits based on the composition of the process gas being introduced. For example, MDEA reacts near instantaneously with H2S, but at a significantly slower rate with CO2, making it especially suited for H2S removal while minimising CO2 co-absorption.
When H2S contacts aqueous amine, it dissociates into sulfide and bisulfide ion (see Equation 1).3
(1) H2S + amine → HS- + (H: amine) +
CO2 reaction in amine is a bit more distinct, depending on the amine solution chosen. Examples of DEA and MDEA reaction can be seen in Equation 2.
2a) CO2-DEA 2R2NH + H2O + CO2 ↔ (R2NH2 )2 CO(R2NH2)2 CO - + H2O + CO2 ↔ 2R2NH2 + 2HCO3
2b) CO2-MDEA R2NCH3 + H2O + CO2 ↔ HCO- + R2NHCH3
Where R stands for – C2H4OH-
AGRU plants follow the traditional Girbotol process, which prominently features both an absorber and regeneration unit. While complete versions of this process may be different, they often tend to complement these conditioning systems with reboilers, flash drums, heat exchangers, reflex drums, pumping system, and condensers. Figure 1 illustrates a common AGRU design used by most natural gas producers. ‘Sour gas’ is the common phrase used in describing acid gas contaminated natural gas entering the AGRU. Sour gas injection will begin by first reaching the inlet filter-separator, which minimises liquids and particulate content. This sour gas will then enter the bottom of the absorber, travelling upwards, with a countercurrent of amine flowing down the absorber. This initial starting amine solution is considered ‘lean’ due to its low acid gas load. Once the acid gas is absorbed, this ‘rich’ amine solvent leaves out of the bottom of the absorber. A flash drum will assist in removing any hydrocarbons, such as methane or ethane, from the rich amine to prevent further complications with oxygen demand when the acid gas is sent to the sulfur recovery unit (SRU). Next, the rich amine passes through a lean/rich amine heat exchanger before entering the top of the regenerator column. The regenerator is where the rich amine is stripped of its acid gas constituents using steam under low pressure (through the reboiler) and high temperatures. CO2 and H2S are liberated during this heating, and the resulting H2S-rich acid gas now exits the top of the regenerator where it is sent through the overhead condensers and reflux accumulator. The condenser works to trap CO2 for carbon capture, while the accumulator provides separation of the vapour and liquids. A portion of this gas will be sent to a sulfur recovery unit (SRU), which will turn H2S into elemental sulfur. This stripped amine solvent now returns to its ‘lean’ condition, where it is cooled via heat exchanger. This process is followed up by water cooling before being recycled back towards the top of the absorber to restart the amine absorption process once more.
Measurement opportunities and challenges
It was previously discussed that a common impediment for AGRU users is cost. These users, to meet industry standards, find themselves recirculating amine at higher than required rates to ensure there is sufficient washing of the acid gas. Coupling this is the need for excessive heat application to drive out H2S and CO2 from the amine. When taken together, these factors can ramp up the operational costs to a significant degree. For this reason, users have needed an analytical means of determining when it is best to slow the degree of heat delivered to the regenerator. By extension, this could also serve as a means of reducing the amount of recirculation needed for optimal stripping.
Figure 1. Illustration of a typical amine plant.
San Antonio, Texas · March 2 – 4, 2025
Figure 2. UV absorbance spectra of 3 g/L H2S in 20% MDEA aqueous solution (in blue), as well as 100% vol. H2S gas (in red). Operating temperature and pressure during H2S in amine capture was 60°C and 34.4 psia, with a pathlength of 0.5 mm. Operating temperature and pressure during H2S vapour capture was 100°C and 12.7 psia, with a pathlength of 1 mm.
A variety of analytical approaches have been used to determine the H2S concentrations within lean amine solutions, many with specific pros and cons. Iodometric titration is a common method for determining sulfide content, which can indicate the level of H2S presence in the amine. Amine solution, after being regenerated, is collected and sampled. From here, sulfide reacts with iodine solution within an acid solution such as hydrochloric acid (HCl). Remaining iodine is then determined by titration with sodium thiosulfate, which is accompanied by a starch indicator for determining the end point. Titration, however, is both a time consuming and tedious affair. Other methods have included the use of gas chromatography (GC) and measuring both H2S and CO2 gas constituents, where the amine is heated to boiling before injection into the elution column. This approach provides a great deal of accuracy but has much slower response times.
Another method that has proven successful is the employment of ultraviolet (UV) based analysers for the purpose of absorbance capture. Analytical instruments, such as the AMETEK 4650 and IPS-4 analysers, have been used for monitoring H2S loading in amine solutions. When H2S is complexed with amine solution its absorbance response, which is normally at wavelengths of less than 250 nm, is shifted to wavelengths of 260 nm or greater. Amine will produce its own absorbance at wavelengths of 255 nm or less, which means it is possible to monitor changes in total H2S content within the amine, because the wavelengths do not overlap. Figure 2 illustrates this absorbance behaviour by contrasting 3 g/l (or approximately 3000 ppmw) H2S in 20% MDEA solution against 100% vol H2S gas. Both absorbance data captures were with AMETEK’s IPS-4 instrument. However, there are several drawbacks to this approach. Amines are particularly temperature sensitive, which translates into notable variance in the absorbance readings. This can be especially problematic for H2S measurements, as this variance translates into both a sizable degree of noise contribution even with small changes in temperature, and significant shifts in the H2S absorbance reading. This is why it is especially important that the temperature of the lean amine is relatively constant when flowing through the sample cell in the analyser.
In effect, calibrating an analyser for this type of environment can be especially difficult.
Complicating measurement is the risk of possible contaminants collecting in the amine solution and entering the sample cell. Most commonly, this includes small particulates of corrosion inhibitors, which are meant to improve the longevity of the carbon steel process piping, as well as scaling from already corroded material. As mentioned earlier in this article, the mixture of CO2 with water can produce carbonic acid, which eats away at the piping and vessel surface material. Often, this is at the bottom of the amine absorber or regenerator. Amine itself also acts as a corrosive element, which is why a growing number of modern AGRUs typically use stainless steel piping in their construction for corrosion prevention. Doing so means that the AGRU can operate at higher temperatures, while also mitigating the abundance of inhibitors being needed for corrosion prevention.
Conclusion
AGRUs play a central role in the stripping of acid gas from natural gas, which ensures a high-quality product while maintaining regulatory compliance. The demand for natural gas will continue to grow over the coming decades. Minimising overhead costs can help a vast number of amine plant users in maximising their returns. This article has covered the mechanisms by which an AGRU operates, but also where the issue lies in reducing operational costs. In addition, it was showcased that methods do exist for the monitoring of H2S in amine. These methods can be especially useful for users, as they can ensure proper management of the amount of heat needed to liberate the acid gas.
Monitoring the acid gas loading in amine is a challenging endeavour. A multitude of variables must be controlled, such as temperature, particulates, and additives, to make a successful measurement for acid gas loading. In many respects, this is what makes this branch of the SRU process the most critical or difficult to get right. Process instrument manufacturers who seek to address the needs of this industry will likely need to find more novel approaches to help mitigate these measurement influencers. Improving the ease of measurement not only makes such techniques more worthwhile for plant operators, but the lifetime savings in operating costs for amine treatment end-users alone would more than justify the existence of even a single analyser.
References
1. KOPALE, M., VILLAR, J., LITTLE, J., and EBOWEM, E., ‘Natural Gas Annual 2023’, US Energy Information Administration, (2023).
2. HUBBARD, B., ‘New and Emerging Technologies’ (Petroskills workshop), 2010 Gas Processors Association Convention, John M. Campbell & Co, Austin, Texas, US, (2010).
3. REZA, J., and TREJO, A., ‘Degradation of aqueous solutions of alkanolamine blends at high temperature, under the presence of CO2 and H2S’, Chemical Engineering Communications, 193(1), 129 – 138, (2006).
Mike Aughenbaugh, Swagelok Company, USA, discusses the cost of system issues stemming from corrosion, and considers how refineries can best defend against corrosion before it causes serious downtime.
In refineries everywhere, a hidden threat may be lurking in some of the smallest corners of the facility, and it can have a significant impact on a refinery’s bottom line.
That threat is corrosion – deterioration of certain materials by chemical interaction with their environment. According to research from the National Association of Corrosion Engineers (NACE), it is one of the leading causes of profit loss throughout the broader oil and gas industry, costing upwards of US$1 billion annually.
While offshore environments are at the greatest risk for widespread corrosion due to salt spray on the exterior surfaces, the problem extends throughout the entire value stream. Onshore, downstream applications frequently struggle with more localised issues typically associated with elevated heat and the presence of chlorides in such environments. For example, in refineries, corrosion presents issues with instrumentation systems, which are
responsible for consistent control of refinery production. If critical instruments fail due to corrosion, this can lead to faulty readings and reductions in overall yield and may even necessitate temporary facility shutdown. Corrosion can also occur with strong acids, such as sulfuric and hydrofluoric acids, which can be extremely hazardous to workers and the surrounding communities.
The good news is that common types of corrosion can be mitigated or prevented with some relatively straightforward steps, before they cause significant and costly damage to critical fluid systems. However, taking these kinds of proactive measures depends on the ability to identify and differentiate between a range of corrosion types and implement appropriate solutions.
This article will explore two of the most common (and most costly) forms of corrosion: pitting corrosion and crevice corrosion. While crevice corrosion tends to be the more common of the two in downstream applications, both have the potential to occur under the right conditions, and it is important to know what to look for. Furthermore, this article details why corrosion occurs, what differentiates pitting corrosion from crevice corrosion, and what can be done to protect operations from this potentially costly problem.
Examining the root causes of corrosion
Under certain circumstances, nearly every metal used in industrial applications – not just refinery-specific ones – can be susceptible to corrosion. But taking the steps necessary to minimise the potential for corrosion requires a basic understanding of the different types of corrosion and their causes.
So, what is corrosion? At its most fundamental level, the phenomenon is a series of electrochemical reactions with oxidation (a loss of electrons) at an anode and a reduction (gaining of electrons) at a cathode. For example, iron in tubing may oxidise, yielding two electrons and dissolving into water as a Fe2+ positive ion. Simultaneously, the electrons from oxidising iron may participate in a reduction reaction which uses O2 dissolved in H2O to form OH-negative ions.
In refineries, metal tubing systems are most often used for analytical and process instrumentation, as well as control and utility applications like steam and instrument air. Many engineered metals used within these applications are made from stainless steel, which typically contains more than 10% chromium. Chromium helps form an oxide layer that helps to protect the metal from corrosion. But that does not mean stainless steel cannot corrode – when environmental conditions or mechanical damage causes that layer to break down, there is corrosion risk. Indeed, if the protective oxide cannot reform in a given solution, corrosion reactions may progress rapidly. Another example is rust, a commonly occurring byproduct of carbon steel corrosion that results from iron corroding and forming iron oxide.
However, many other types of corrosion exist. Each type poses a unique threat that must be evaluated when selecting the optimal material for an application.
Figure 1. Corrosion can be a major problem that, in a worst case scenario, can bring refinery operations to a halt.
Figure 2. In refineries, corrosion can wreak havoc on critical instrumentation systems that are essential for efficient and reliable production.
Figure 3. Pitting corrosion (left) and crevice corrosion (right) can each pose major riskS to refineries, and knowing the difference is important for operators.
Discerning the differences between pitting corrosion and crevice corrosion
There are two forms of localised stainless steel corrosion that occur more frequently than others: pitting corrosion and crevice corrosion. Both types have the potential to wreak havoc on refinery process instrumentation, and it is worth knowing how and why each type forms and how it can be prevented.
Pitting corrosion
Pitting corrosion forms when stainless steel’s protective chromium-rich oxide layer breaks down, rendering the bare metal underneath susceptible to continued attack in a corrosive solution. This localised electrochemical attack initiates the formation of small cavities – or ‘pits’ –therefore giving this type of corrosion its name. And while pitting corrosion is more typical of offshore applications than onshore ones, it can still occur and cause significant problems in refineries.
Pitting corrosion is sometimes detectable via visual inspection, but such an inspection may not fully reveal the extent of the damage. Oftentimes, there may be a deep network of lost material lurking below the surface that is not visually apparent. Left unchecked, pitting corrosion can grow deep enough to fully perforate a tube wall, potentially resulting in leaks that can compromise environmental safety while leading to lost material, and therefore, lost profit. What is more, such leaks inevitably require expensive unplanned maintenance.
When examining stainless steel tubing for pitting corrosion, technicians can look for reddish-brown iron oxide deposits as well as potential pits that may have formed on the metal surface. Regular inspection can help to prevent major issues in the longer term.
Crevice corrosion
Like pitting corrosion, crevice corrosion is initiated by the breakdown of stainless steel’s protective oxide film. But crevice corrosion can be even more damaging, because rather than occurring in plain sight, it occurs within crevices – as its name implies.
For example, in a typical refinery fluid or instrumentation system, crevices exist between tubing and tube supports or clamps, between adjacent tubing runs, and underneath dirt and deposits that may have accumulated on surfaces.
Such crevices are virtually impossible to avoid in tubing installations, and tight crevices pose one of the greatest dangers to stainless steel integrity. In refineries, elevated temperatures are one of the greatest risk factors for crevice corrosion. Some of the most common applications experiencing these factors are saturated steam transmitters, where the chlorides within the insulated tubing or the steam itself can attack the material’s surface.
Crevice corrosion is also a common issue in systems carrying hydrofluoric acid, sulfuric acid, hydrogen sulfide, and anything with elevated salinity, like desalter operations.
Crevice corrosion can only be observed visually when a tubing clamp is removed from the installed tubing.
HIGHER QUALITY LESS DISRUPTION
Industrial Efficiency Fueled by Custom Modular Buildings
When evolving project demands call for new or upgraded workspaces in existing facilities, interruptions aren’t an option. Manufactured off-site with careful QA/QC considerations, Hunter’s custom modular buildings deliver specialized structures on your schedule, with minimal impact to operations. It’s support on every front .
• Blast-Resistant Buildings
• Modular Buildings
• RIEs & E-Houses
• FE/BR Buildings
• Offshore Buildings
• Storm Shelters
It is important to remember that crevice corrosion can occur at lower temperatures than pitting corrosion because less effort is needed to create a ‘pit’ beneath the geometric crevice (e.g., the tube clamp).
Preventing corrosion in a facility
For refineries, the best protection against both types of corrosion is an educated workforce. Basic materials knowledge and applying corrosion-prevention best practices can go a long way toward keeping facilities safe and profitable.
First, consider the choice of materials for tubing applications. These include the tubing itself as well as tube
supports and clamps. According to the ASTM G48 standard, laboratory testing for critical pitting temperature (CPT) and critical crevice temperature (CCT) is an invaluable tool for comparing materials to be used in corrosive environments. CPT testing helps to evaluate at what temperature pitting begins on a material in a specific corrosive solution. Likewise, CCT testing evaluates at what temperature crevice corrosion begins when a predefined crevice is placed on a metal sample in a corrosive solution.
Alloys that maintain high CPT and CCT values are generally more suitable for use in potentially corrosive environments throughout the oil and gas value chain. For example, 304L has among the lowest CPT value of common materials while 6Mo and 2507 are the two highest for CPT and CCT temperatures. This suggests that 6Mo and 2507 are likely to be more resistant to pitting and crevice corrosion than 304L and 316L in chloride-bearing solutions, i.e., offshore applications. It is important to keep in mind that these tests are useful for comparison and material selection but are not necessarily predictive of potential material failures in real-world applications during service life.
Selecting the right corrosion-resistant materials
For refineries, 316L grade stainless steel (UNS S31603) tubing works well in many installations. It is important, however, to keep such material clean and maintain non-extreme temperatures. In warmer climates, especially in installations where rust from carbon steel structural beams and floors may accumulate on stainless steel surfaces, corrosion of 316L stainless tubing is more readily observed. However, due to the beneficial addition of molybdenum, 316L typically outperforms 304L (UNS S30403) stainless steel in these corrosive environments.
There are certain applications where 316L may not be sufficient to meet the lifetime requirements of the application. Here, tubing made from super austenitic (e.g., 6Mo or 6HN, UNS N08367) or super duplex (e.g., 2507, UNS S32750) stainless steels offers significantly improved corrosion resistance. Additionally, the higher yield and tensile strength of super austenitic and super duplex stainless steels make it easier to build systems that must be rated to a higher maximum allowed working pressure (MAWP).
In addition to materials selection, fluid system design best practices can help prevent corrosion by minimising the number of locations where crevice corrosion may occur. For example, avoid placing tubing directly against walls or against each other, thus eliminating a potential crevice. Elsewhere, when crevice corrosion of 316L stainless steel tubing is observed, one can replace 316L tubing with more corrosion-resistant tubing such as 6Mo, which can be installed with cost-effective 316L tube fittings in suggested mixed-material engineered combinations.
Building an understanding of corrosion among those who regularly work with tubing systems can help prevent material failure and costly repairs as well as improve system longevity. Armed with the basics, refineries everywhere can better protect their systems, operations, and bottom line.
Figure 4. One of the best defences against corrosion in facilities is a well trained workforce that knows how to identify corrosion issues before they become major problems.
Figure 5. High-quality 316 stainless steel can help better prevent corrosion in many refinery environments.
Kevin Nietupski, AUMA, Germany, analyses how digital solutions can boost the efficiency and reliability of valves and actuators and increase responsiveness in the hydrocarbon processing industry.
Elections, wars, pandemics, booms and busts – the world is not becoming any simpler or more predictable, and nor are the demands on hydrocarbon producers and processors. Management experts refer to VUCA: volatility, uncertainty, complexity, and ambiguity. More simply: it is crazy out there.
Digitalisation can help the downstream industry to manage some aspects of the rapidly changing business environment. Specifically, it can make plants more agile, flexible, reliable, sustainable, and secure.
Valves and actuators are a good example: these unassuming devices are vital to smooth plant operation, yet they can fail, and they typically do not have backups. New digital ecosystems for actuators can keep a whole site
running reliably while avoiding unnecessary maintenance shutdowns.
Digital ecosystems support human expertise
To avoid unplanned downtime in plant operation and ensure that vital components such as actuators and valves continue to work correctly, effective ways to prolong component lifetimes, schedule maintenance and predict failures need to be found. This is especially important for critical applications.
Actuator manufacturers can help to support plant operators and maintenance engineers to ensure availability. On the one hand, intelligent devices with advanced sensor technology are required – thanks to the data they generate
and store, these offer a new spectrum of added value. On the other hand, efficient digital tools are essential to support this smart hardware.
Digital tools work best when they connect their users to deep human understanding. It is crucial to seamlessly link traditional after-sales services with digitally accessible data evaluation based on expert knowledge. For instance, an experienced maintenance specialist in a tank farm may pinpoint the source of a problem by asking the right questions – or even just listening to a faulty device. Yet many skilled field personnel will soon be retiring, so where can the industry turn in the future? Automated evaluation based on a combination of digital data and expert knowledge could be the answer.
Intelligent electric actuators, in combination with digital tools – such as AUMA Assistant App, AUMA CDT, and AUMA Cloud – can meet the fast-changing requirements of today’s VUCA world. Together, actuators
1. AUMA’s Ex-rated RSTX 100 remote control makes it easy to download a complete data snapshot from an AUMA actuator in the field and subsequently analyse it in the AUMA Cloud.
and digital tools can form a digital ecosystem, which AUMA calls CORALINK. The first part of the name, CORAL, represents the ecosystem of perfectly harmonised processes that is a coral reef, while LINK evokes connections and networks. This ecosystem combines access to expert knowledge with digital tools and data analysis.
Benefits of lifecycle management
Lifecycle management supports users in managing their different requirements through every phase of the plant lifecycle. Modules in the digital ecosystem can interact seamlessly, helping plant operators cut costs and increase the availability of their plants by taking full advantage of the digital potential of intelligent actuators.
Commissioning
During commissioning, the requirement is to adjust each actuator efficiently and optimally to its matching valve. The AUMA Assistant App is an easy-to-use app running on Android or iOS smartphones. AUMA CDT is a configuration and analysis tool running on laptops. Both tools offer easy actuator configuration, saving time and cost during commissioning on site. Device information can be easily read out and uploaded to the AUMA Cloud to create a digital image of the plant. Actuator-related documents such as operating instructions and wiring diagrams can be easily retrieved digitally on site.
Plant operation
Once the plant is in operation, the aim is to avoid unplanned downtime or failure of critical plant components. Uncertainty about the health status of individual devices is one of many challenges here.
Intelligent actuators can automatically record a multitude of important operational and device data, such as number of starts, motor running time, temperatures, and a time-stamped event report. This data can be easily read out and uploaded to the cloud for analysis, using for example an Ex-rated remote control device (Figure 1).
The cloud gives users immediate feedback on the status of their actuators, in the form of automatically calculated key figures and an action plan with recommendations for action (Figure 2).
The AUMA Cloud is a browser-based web application, with no need for a complex IT infrastructure. Using proven Microsoft Azure infrastructure, data storage within the EU and comprehensive security mechanisms, it ensures data security. Data transfer is strictly one-way: from the actuator to the cloud and not vice versa.
In this way, plant operators are able to maintain an overview of the status of their devices, even in stressful day-to-day plant operations, and plan necessary interventions at an early stage. The digital ecosystem also offers the option of getting directly in touch with service experts via actuator-related service tickets.
If an actuator needs maintenance or repair, a new function in the cloud makes it easy to order the correct spare parts (Figure 3).
Figure
Figure 2. The action plan provides simple concrete recommendations for each AUMA actuator.
A SUPPLEMENT TO HYDROCARBON ENGINEERING
Exploring decarbonisation technology and solutions for the downstream sector
This special supplement focuses on decarbonisation pathways for the downstream sector, highlighting innovative technology and solutions that will help you thrive within the energy transition.
Scan the QR code to download your free copy of EnviroTech 2024.
Modernisation
The cloud also makes it easy to identify old devices and call up recommendations for successor products. If human advice is required, the system offers direct contact to the service department.
In practice
Data recording and evaluation via a digital ecosystem is especially valuable for actuators and valves used at critical points in the process or exposed to particularly high loads. Evaluating the diagnostic data allows precise analysis of the loads to which actuator and valve have already been exposed. This can help users detect problems at an early stage and take appropriate countermeasures before unplanned failures occur. The following examples show how plant operators are already doing this in practice.
Case studies
Heavy vibration
The analysis and action plan function in the AUMA Cloud can help to uncover a wide variety of error sources. At one German site, for example, the diagnostic data indicated heavy vibration. The cause turned out to be a pump installed nearby. As excessive vibration can cause electronics to fail in the
long-term, the actuator controls were separated from the actuator and mounted separately on a wall bracket.
Wrong control settings
In a plant in France, an actuator was experiencing an accumulation of thermal faults when the motor would overheat and switch off. The AUMA Cloud determined that the duty cycle averaged 50%, but that this variant of the actuator was only designed for 25% duty (Figure 4). The problem was solved by adjusting the control parameters to reduce the frequency of position changes without negatively affecting the process.
Incorrect valve end position and an ageing valve
Frequent torque errors can be caused by mistakes during commissioning. In a plant in Sweden, for example, it was found that on one valve the end position was incorrectly set. In another case, however, it turned out that the many torque errors were signs that the valve was ageing (Figure 5). In this case, the valve underwent preventive maintenance in good time to prevent a breakdown.
Forestalling problems
In a biogas plant in Spain, regular maintenance is carried out on the actuators. The analysis and action plan function in the AUMA Cloud was used for the first time during the last maintenance cycle. In addition to this automated analysis, experts put further data, such as vibration, temperature and motor statistics, into the context of the associated process. This allows maintenance measures to be specifically tailored to the condition of each actuator.
Digitalisation is happening now
Efficient asset management is becoming increasingly important to ensure plant availability in the face of increasing challenges to plant operation. Networking of traditional services with digitally accessible expert knowledge and seamlessly interlinked processes plays a key role here.
Figure 4. Frequent thermal errors in an actuator could be traced back to the fact that the control behaviour had not been set optimally.
Figure 5. Frequent torque errors showed that this valve needed maintenance.
A digital ecosystem for electric actuators takes the strain off plant personnel, helping to minimise premature wear and tear and preventing breakdowns. The ability of digital systems to automate diagnostic processes and recommend preventative actions helps to keep costs low. In the future, the seamless integration of individual digital tools will continue to expand – always with the aim of further streamlining processes and making life as easy as possible for everyone involved with actuators.
Figure 3. The right spares can be ordered quickly and conveniently via the AUMA Cloud.
Melissa Niesen and Emily Stone, Emerson, USA, explain how supercritical fluids present significant challenges for control valves. However, proper design is possible by understanding the application, and consulting experts if required.
Carbon capture, ethylene, and hydrogen refining processes require the use of fluids in their supercritical state. This presents substantial challenges in terms of equipment selection, particularly for control valves because their internals are directly exposed to these fluids.
Supercritical state fluids exist when a pure substance is exposed to a process that raises its fluid condition above both its critical temperature and pressure (Figure 1). In this state, the substance no longer acts as a liquid or as a gas, but as something in between. As such, these fluids are often described as dense phase gases or compressible liquids, depending on the fluid’s behaviour in the process.
This article will define a supercritical fluid, show how it is often used, present key applications, identify red flags for sizing, and suggest tips and tricks for selecting control valves and trim. It will also show end users how to accurately size control valves for this fluid state, and how to select the correct trim and other internal soft goods to mitigate the potentially dangerous phase changes that are inherent to handling supercritical fluids.
What applications use supercritical state fluid?
There are many reasons to pressurise and heat a fluid to its supercritical state, rather than using it in a more typical liquid
or gas state. For example, carbon dioxide (CO2) in its supercritical fluid state is denser than its gaseous state, allowing for more throughput and/or lower velocities. Supercritical CO2 also has a lower viscosity than CO2 in a liquid state, resulting in lower line losses. In other cases, the altered solubility of a supercritical fluid is beneficial to the process.
The four main fluids used in their supercritical state are ethylene, CO2, hydrogen, and water.
Ethylene is a process fluid commonly seen in the chemical and refining industries, with a critical pressure of
approximately 730 psia and a critical temperature of approximately 49°F,1 which indicates that any valve rated ASME Class 600 or above in ethylene service is likely seeing a supercritical state fluid at some point of operation.
CO2 has a critical point at 1070 psia and 88°F, so most valves installed downstream of a compressor in a carbon capture, utilisation, and sequestration process will be in a supercritical state (Figure 2). This may include some or all transportation, monitoring, injection, and vent valves.
Hydrogen has a critical point at around 188 psia and -400°F,1 thus non-cryogenic valves in hydrogen service are likely used to regulate the flow of a supercritical state fluid.
Water is in a supercritical state when it is above its critical point of 3200 psia and 705°F, which is sometimes seen in applications such as power plants and chemical processes.
What concerns exist for incorrectly sized valves?
It is worth noting that there are hundreds, if not thousands, of control valves currently installed across the globe and regulating the flows of supercritical fluid that may not have been identified for this service before installation. Does this mean that these valves should be removed and replaced?
To understand the risk, one must evaluate how the installed valve is operating. Is it operating closer to the seat, or is it staying closed more than originally anticipated? Conversely, is the valve running out of capacity and having to operate fully open? Are maintenance cycles becoming shorter, often to replace damaged trim components? If one or more of these conditions is being experienced, it might be worth re-evaluating the sizing to get a more accurate understanding of the process, and to find a valve that will operate in the controllable range with a more reasonable maintenance cycle.
Emerson has had an internal methodology for evaluating, sizing, and selecting control valves for supercritical fluid service since 1991, and it has often been used for ethylene and CO2 applications. Most of these traditional applications experience lower pressure and lower pressure drops, which minimises the potential risk factors of damage and incorrect sizing. But now that there is an industry push towards carbon capture, utilisation, and sequestration – along with an increase in hydrogen production – there is a surge in higher pressure supercritical fluid applications, with an increased chance for incorrectly sized valves, and potential failures.
How do end users evaluate conditions for sizing?
Once a fluid is determined to be in a supercritical state, additional information is needed to understand the intended
Figure 1. A fluid is in a supercritical state when it exceeds its critical pressure and temperature.
Figure 2. Carbon capture, utilisation, and sequestration processes include several applications involving supercritical fluids.
Figure 3. This diagram shows common severe service phenomena often associated with supercritical fluids.
San Antonio, Texas · March 23 – 25, 2025 One of the largest petrochemical events in the world. Join thousands of participants from companies from all over the globe. Register today! afpm.org/events/IPC25
use of the control valve, as well as the nature of the process fluid. In its supercritical state, small changes in temperature can have a large impact on the energy transport efficiency of the fluid, and the likelihood of a phase change occurring during a pressure drop. Understanding the intent of a control valve application can help to clarify the potential issues that could occur within the valve (Figure 3).
For example, anti-surge valves and vent valves installed downstream of a CO2 compressor may operate under similar conditions as at the inlet, but they may need different valves and trims. An anti-surge valve is used to recirculate flow from the outlet of a compressor back to its inlet in order to protect the compressor from the risk of backflow, which can cause damage to the compressor blades and potentially force a plant shutdown. For an application such as this, the intent would be to take a large pressure drop and provide a stable gas phase process fluid to the inlet of the compressor to reduce the risk of damage. This could require a highly engineered valve solution with an accessory package to allow tight control of this complex process.2
However, the same conditions going to atmosphere through a vent during an emergency would not have the same risks of damaging equipment and would only need a more standard noise attenuating valve-diffuser combination, even with the process fluid in a supercritical state. However, in the case of a vent, the possible formation of dry ice may need to be considered.
To understand the risks, one needs to understand the limitations of the current international standard for sizing control valves IEC 60534-2-1.3 This standard provides an industry-approved framework for calculating the necessary flow capacity required for a control valve based on the process conditions using one of two models. The first model covers incompressible fluids, such as liquids, which will see limited expansion across the pressure drop, unless cavitation or flashing occurs. The other model considers compressible fluids with a ratio of specific heats between 1.08<y< 1.65 that follows the ideal gas law to calculate the expected expansion at the control valve throat. According to their definitions, neither model was designed to predict the flow capacity required for handling fluids in a supercritical state.
In some cases, when valves see a low pressure drop or have inlet states that exist near the supercritical state boundary, an approximation using the fluid state to which they are closest may be sufficient. For example, an ethylene valve with inlet conditions of 750 psi and 50°F is just above the critical point but lies very close to the liquid state for that fluid. Therefore, if the valve was sized using the liquid model, with the trim selected to allow additional capacity over the calculated required capacity, the end user may not notice an operational issue with the selected valve. This is why many valves have been installed into and operate well in supercritical service without concern, but as conditions move further into the supercritical zone, deviations from the applicability of the standard sizing models increase, along with design control valve design and selection complexities.
From a practical perspective, one needs to understand the compressibility of the fluid from the inlet state to the control valve throat to evaluate if a standard sizing model may provide a reasonable estimate of the fluid’s behaviour, or if a more complex methodology is required.
Figure 4 shows how the density of a fluid will change with its state. For instance, if a liquid-sizing model is selected for a compressible liquid type supercritical fluid, then the expansion of the fluid may not have been considered, and the valve could be undersized, forcing the valve to operate fully open or run out of capacity. However, the gas sizing model may overestimate the expansion, resulting in oversizing the valve, causing it to operate close to the seating surface, and increasing the rate at which the trim is worn. These types of situations are where the Emerson methodology can be used to evaluate the process fluid, and to more accurately calculate the actual required capacity of the valve to avoid over or under sizing. Additional complexity is introduced if the process fluid is not pure but has a number of different components.
Once the inlet and outlet conditions have been established and initial sizing has been completed, the process conditions at the vena contracta must be evaluated, which is the point at which the process fluid is at its lowest pressure within the valve (Figure 5). Depending on the valve style and trim selected, the vena contracta pressure could see a potentially damaging phase change, and/or the most extreme temperature of the process fluid due to the Joule Thomson effect. Although temperature changes due to pressure drops should be considered, usually a standard construction with adequately selected materials can be used.
Figure 4. These beakers show molecular interaction in standard fluid states.
Figure 5. This diagram shows the pressure drop into a control valve throat with phase changes.
Selecting the correct valve and trim
Once the fluid states are known at the inlet, outlet, and vena contracta, one can start to evaluate if any damaging phase change has the potential to occur, and what trim may be required to mitigate this potential. If the fluid is supercritical for all three conditions, then there is likely a low enough pressure drop across the valve that the process will act similarly to a simple phase fluid, and a more standard trim will suffice.
If the fluid is supercritical at the inlet and outlet, but changes phase at the vena contracta, a more specialised trim may be required to stage the pressure drop to avoid phase change, or to direct and isolate the potential damage from a phase change.
If the fluid sees a full phase change between the inlet and outlet, the conditions should be reviewed further to understand what is occurring in order to select the correct trim.
This is where understanding the intent and application of the control valve can become essential to proper valve selection. Depending on the application and outlet state, the valve choice may vary from a flow down angle valve with low flow trim and body liner, to a flow up valve with specialised noise attenuation or pressure staging trim, or even a rotary valve solution.
Lastly, as previously mentioned, supercritical fluids fall outside of the scope for many IEC sizing practices. This includes the hydrodynamic noise and aerodynamic noise prediction methods.4,5 Any estimation provided by these methods for supercritical fluids has a decreased accuracy
compared to standard fluids, and it is currently unknown how much the prediction might be affected. Therefore, this is an area where consultation with a control valve expert is highly recommended.
Conclusion
Supercritical process fluids do not behave as either a liquid or a gas, so control valves should not be sized using standard methods without understanding how the fluid will change with the pressure drop across the valve. As such, these applications should be identified early and reviewed for conditions at the inlet, outlet, and vena contracta. With this information, along with advice from a control valve expert, it is possible to correctly size and select a control valve that will operate well for years to come.
2. Fisher Controls International LLC. 2017. Increased Plant Availability Through Proper Anti-Surge Valve Selection. Accessed 2024. https:// www.emerson.com/documents/automation/white-paper-increasedplant-availability-through-proper-anti-surge-valve-selectionfisher-en-1653588.pdf.
3. IEC 60534-2-1. 2011. INDUSTRIAL-PROCESS CONTROL VALVES - Part 2-1 Flow Capacity - Sizing Equations for fluid flow under installed conditions. IEC.
4. IEC 60534-8-4. 2015. INDUSTRIAL-PROCESS CONTROL VALVESPart 8-4: Noise considerations - Prediction of noise generated by hydrodynamic flow. IEC.
5. IEC 60534-8-3. 2010. INDUSTRIAL-PROCESS CONTROL VALVESPart 8-3: Noise considerations - Control valve aerodynamic noise prediction method. IEC.
SPEAKER SESSIONS
Global Sulphur and Sulphuric Acid Supply and Demand Outlook
- Fiona Boyd & Freda Gordon from Acuity Commodities
Metals Market Update
Visit The Sulphur Institute website to learn more: www.sulphurinstitute.org/symposium-2025/ APRIL 8 – 10, 2025
Dry Bulk Shipping Market
- Serena Piazzo from IFCHOR Galbraiths
Phosphate Outlook
- Anna Fleming from Benchmark Mineral Intelligence European Chemical Industry Present and Future - Moncef Hadhri from CEFIC (European Chemical Industry Council)
- Allan Pickett from S&P Global Commodity Insights
- 20% OFF for industry representatives under the age of 40 - Discounts also available for companies registering more than three delegates.
Klaus Brun and Marybeth McBain, Ebara Elliott Energy, USA, discuss the current state and progress toward adapting centrifugal compressors for high-speed hydrogen compression.
usually transported between production sites and power plants by barges, railways, and trucks. Pipeline transmission is the most cost-efficient way to transport large quantities of energy over long distances in the form of gaseous or liquid fluids. Natural gas, the world’s most prolific energy source, is transported via complex pipeline networks over thousands of miles from production wells to end users. It is also liquefied (LNG), transported, and distributed globally via maritime shipping.
Hydrogen does not occur in its pure state in nature, but instead is bound with other elements to form common molecules such as water, ammonia, methane, and other hydrocarbons. Therefore, hydrogen cannot be considered an energy source, but rather is an energy carrier and an energy storage medium. Since the most basic highly exothermic reaction of hydrogen with oxygen yields clean water, it has significant potential as an intermediary transport gas in a decarbonised energy value stream.
A functioning hydrogen energy economy requires major infrastructure changes to meet production, transportation, storage, and usage needs. This includes the need to develop centrifugal compressors that are very different from those currently in use.
Hydrogen sources
Hydrogen ‘colours’ colloquially refer to the way the hydrogen is generated, resulting in a rainbow of colours. However, the only four colours that are currently commercially relevant are black, grey, blue, and green hydrogen. For the most part, turbomachinery that either uses or transports hydrogen is agnostic to its source. There are two areas where the production source can make a difference:
n The pressure at which the hydrogen is available.
n The composition of the hydrogen gas.
Both relate to the fact that hydrogen compression is energy intensive. For a given mass flow, the amount of work to get a certain pressure ratio with pure hydrogen is almost 10 times higher than that of natural gas. However, even a small amount of composition impurity can substantially lower the compression work by a factor of two. Therefore,
it makes a big difference at what pressure and composition the hydrogen is made available in various compression processes. Additionally, both the combustion characteristics and the compression work change if other components (such as carbon dioxide or methane) are part of the hydrogen produced. Lastly, the capability of hydrogen to cause material issues, such as hydrogen embrittlement, can be influenced by the presence of other substances in the gas composition.
Hydrogen compression
Hydrogen compression applications do not depend on the type of hydrogen, but they strongly depend on the pressures and flow rates at which the hydrogen is being produced. Specifically, green hydrogen from renewable energy sources is generally produced at low pressures using electrolysis, and must be compressed, whereas grey/blue/black hydrogen often exits the production process at elevated pressures and requires less compression to enter the pipeline transport stream. Hydrogen purity can also affect compressor selection since even small quantities of other gases blended with hydrogen can significantly impact the physical properties of the gas.
For economic reasons, the initial hydrogen transport, storage, and distribution infrastructure will likely rely on blue or grey hydrogen from fossil fuel source conversion. This assumption defines and limits the operating conditions for hydrogen transport to pressure levels/ratios required by pipeline and storage operations, which tend to be between 1000 – 2000 psig and a compression ratio of 1.5 – 3.0, respectively.
Longer term, as electrolysis-based production of green hydrogen evolves, hydrogen will need to be stored to sync up to the renewables intermittent power cycles for use in the troughs when renewable power is less available. This likely involves different versions of hydrogen compression, pipeline transport, and storage compared to hydrogen compression for blue/grey hydrogen. For booster compression to initial flow into a pipeline, and for storage, hydrogen compression ratios are likely greater than 5.0 and possibly as high as 10.0 for long-term hydrogen battery storage.
The compounded effect of low energy density by volume and high head due to its high specific heat makes hydrogen compression both challenging and power intensive. Centrifugal compressors for pipeline and storage applications are capable of higher volumetric flow rates, but will need to meet the higher head requirements by increasing rotational speed or by adding additional stages. Adaptable multi-body arrangements, such as the compressor shown in Figure 1, provide additional stages with a reduced footprint.
While a multi-body integral compressor arrangement is a method to increase head by increasing the number of compression stages, increasing the compressor’s rotational speed can achieve the same result with fewer stages and less CAPEX. The degree to which the rotational speed can be increased is limited by impeller stress, current bearing and seal designs, and rotordynamic constraint.
Figure 1. Ebara Elliott Energy Flex-Op™ hydrogen compressor.
Theoretically, impellers with high tip speeds are possible by using alternative materials, magnetic or gas bearings, and special seals. Alternatives to steel impeller materials include aluminium alloys, ceramics such as silicon nitride, and continuously wound carbon fibre. For example, a high-speed compressor impeller made from light, high-strength, directionally wound carbon fibres has the potential to operate at tip speeds exceeding 2000 fps. Critical research gaps include high head requirements, material limitations, and static and dynamic sealing. A brief discussion of these gaps reveals the challenges that must be solved to provide a path forward.
Thermodynamics of a light gas requiring high head
A fundamental issue with hydrogen is its ultra-low density and its very high specific heat. Hydrogen centrifugal compressors require significantly more head per stage to achieve a specified compression ratio. This effect is thermodynamically manifested in hydrogen’s high specific heat – requiring significantly higher head to achieve the same pressure ratio. The following equations can be used to relate pressure ratio to head to understand this effect.
First, the isentropic process is defined for a simplified ideal gas behaviour as Equation 1, true for any process in which the polytropic exponent does not equal 1 (i.e., non-isothermal processes). Next, Euler’s equation (Equation 2), rewritten as head per stage, relates enthalpy difference to the power absorbed as mass flow multiplied by the angular momentum through the compressor (angular speed and the change in radius and angular velocity).
A constant specific heat is assumed in re-writing enthalpy as the product of specific heat and temperature, which is valid for lower ratio applications but also allows the equations to be derived easily for illustration purposes.
By substituting T2 from Equation 3 into Equation 1 for discharge temperature (T2) and accounting for isentropic efficiency (Hact*n=Hisen), Equation 4 is obtained (below), which directly relates pressure ratio to actual head, specific heat, and suction temperature of the compressor. In addition, the relationship between pressure rise across the compressor, specific heat and the centrifugal compressor angular momentum can be seen.
P and T for an isentropic process:
Modified Euler’s equation for specific heat related to angular momentum (simplified for constant specific heat):
Solving Equation 2 for actual discharge temperature:
Substitution of Euler’s relation for an isentropic process:
Therefore, compressing hydrogen at equivalent pressure ratios as natural gas requires a higher head (numerator of Equation 4) to compensate for the higher specific heat (denominator of Equation 4).
For compressor design, this typically means:
n Additional stages of compression to achieve the same pressure ratio, which requires more impellers or casings and a much larger footprint.
n Very high tip speed impellers to achieve the same head, which can be achieved via either larger diameters or higher rotational speeds. As speed is increased, the maximum impeller stress will quickly exceed API’s 120 ksi yield strength limit which is applied to steel impellers to safely design against hydrogen embrittlement.
Material limits
The interaction of hydrogen gas with ferrous metals at certain pressures and temperatures can rapidly deteriorate the yield strength of the base metals in the compressor, causing hydrogen embrittlement. Hydrogen embrittlement does not impact the mechanical design strength of iron-based metals, but it reduces material ductility. It can also cause internal cracking within ferrous metals independent of any external stress. Defects that are acceptable in non-hydrogen applications may become unstable in the presence of hydrogen.
Atomic hydrogen can permeate steel even more readily than diatomic hydrogen. Generated either by the disassociation of diatomic hydrogen (H2) at elevated temperatures and pressures, or by a cathodic reaction with the steel surface, atomic hydrogen causes internal pressure to build up high enough to create a fracture within the material itself. This is referred to as hydrogen induced cracking (HIC), and is most critical on components which are processed in a single direction, such as rolled plate and pipe. At temperatures below 200°C (392°F), special considerations are not normally necessary for other components.
Relatively standard materials that are currently used in hydrogen compression and transportation can be used at temperatures below 200°C (392°F) and pressures up to 10 000 psi (69 MPa). Carbon steel is used for the pressure-containing components such as the process piping and the centrifugal compressor casing. Higher strength steels can be used for the rotating components as long as they are kept under a maximum yield strength of 120 ksi (827 MPa) as per API 617 specifications. However, the material yield strength limits the maximum allowable speed of a given impeller, further limiting the operating speed of the compressor and the pressure rise per stage.
High-head impellers manufactured with alternative materials such as aluminium alloys, nickel-based alloys, ceramics, or carbon fibre, have higher strength-to-density ratios and would allow a speed increase. These alternative materials show promise but require additional research. Given the overall risk of hydrogen embrittlement and potential corrosion concerns with wet hydrogen gas mixtures, materials used to manufacture compressor casings and rotating components must be further examined.
Celebrating 20 years of industry excellence
80% of exhibitors would recommend StocExpo
100+ countries
64% of visitors were at a managerial level or above
3,574 attendees
92% of visitors will return in 2025
150+ exhibitors
It’s my first time coming to StocExpo, and I’m happy with what I’ve experienced so far! The conference has been engaging, covering a wide range of topics that have kept me interested throughout!
Jan Gelens, Safety Advisor, Vopak stocexpo.com
Leakage and sealing
Hydrogen molecules are the smallest of all hydrocarbon molecules, which makes it difficult to minimise leakage flows and reduce the risk of hydrogen exposure to the atmosphere and the associated explosive hazards.
Fleuroelastomer (FKM) (Fleuro rubber) O-rings are commonly used as seals between stationary components at many locations within a centrifugal compressor and its shaft end seals. The FKM material is chemically compatible with hydrogen gas.
The most critical O-ring location is the sealing between the removable casing head(s) and the atmosphere. Higher pressures can lead to extrusion failures. A higher rated durometer compound would reduce this risk, but the diametral clearance between parts must still be considered Explosive, or rapid gas decompression, is another risk. All elastomers are permeable, and hydrogen can easily penetrate into the seal under high pressure. If the surrounding pressure is suddenly reduced, the gas trapped within the O-ring will expand and blister the surface or form cracks. Higher durometer compounds and a high percentage of gland fill would lessen the risk of explosive decompression.
Tandem dry gas seals have proven to be reliable for the main shaft seals of compressors used in refinery hydrogen recycle service. However, for high tip speed impellers, fluid
film journal bearings and dry gas seals are a limiting factor. A 350 ft/sec surface velocity for fluid film bearings is achievable, but well above current norms. Published dry gas seal rubbing velocity limits are compatible with a higher velocity fluid film journal bearing. However, additional research, development and testing of sealing technologies is needed to minimise the risk of hydrogen leakage and explosivity.
Summary
Regardless of the colour or origin of industrially produced hydrogen, it must be compressed at the specified pressure ratio tor energy transport, storage, and feed. This requires compressors that are different than those currently operating in industrial hydrogen applications. In designing compressors for these applications, several complex challenges remain. These include static head rise, static and dynamic sealing, explosive safety, and material compatibility. Factors such as hydrogen purity, dry or wet gas, and design adaptability to hydrogen content must also be accommodated. Technology development is underway to design high-speed centrifugal compressors optimised for hydrogen compression. In the interim, currently available and proven compressor technologies adapted to provide the required compression duties are supporting the transition.