September 2023


www.mercuryadsorbents.com Optimized Mercury Removal With MERSORB® mercury adsorbent pellets MERSORB® mercury adsorbent pellets – a Trademark of Nucon International, Inc. (NUCON®) • PROVEN RELIABLE – EVEN IN CRACKED GAS • HIGH MERCURY CAPACITY – HOT, COLD, WET or DRY • MORE PELLET SIZES – MORE PROCESS DESIGN FLEXIBILITY • LOW MOISTURE – FAST START-UP • 40 YEARS EXPERIENCE – ADSORPTION PROCESS DESIGN Your Experts for Mercury Removal – in Ethylene Plants PROVEN PROCESS – PROVEN PRODUCTS AntiMercure® is a Registered Trademark of Selective Adsorption Associates, Inc. for its Process Engineering Services MERSORB® is a Registered Trademark of NUCON International, Inc. for its mercury adsorbent pallets • Cracked Gas • Ethane Feed Gas • LPG, Naphtha, & Light Condensate Feed Liquid • Regen. Gas from Cracked Gas Driers • Light Olefin Gas from FCC Units • AntiMercure® Process Engineering • MERSORB® mercury adsorbent pellets
Lopez, Hernando Salgado, Aaron Liew, Emmanouil Smaragdis and Corbett Senter, BASF, outline the


feeds, and the

the better
Neil Richards, PS Filter, Canada, considers the importance of effective filtration and separation techniques within the downstream oil and gas industry, in order to produce cleaner fuels.
31 Two-phase feed distributors for distillation and absorption columns
Aadam F. Aryan, Distillation Equipment Company Ltd, UK, discusses the selection of appropriate feed arrangements for two-phase feeds, and lists several industrial examples.
40 Opening pathways to decarbonisation
Lukas Biyikli, Siemens Energy, Germany, considers how it is possible to decarbonise industrial process heat through steam compression.
45 Selecting the right corrosion resistance
alloys
Luiza Esteves, Alleima, USA, compares the corrosion and mechanical resistance of advanced stainless steels and special alloys used in shell and tube heat exchangers in various chemical process industry applications.
49 Taking back control
Nina Golder and Erik Lindhjem, Emerson, USA, explain how new life cycle maintenance tools can help companies manage the health of their automation assets.
53 An unbroken flow of information
Thomas Fahland, Implico, Germany, discusses how new data technology could lead to increased transparency across energy companies’ operations.
57 Bringing decarbonisation
to life
Pablo Jimenez-Asenjo, Federico Neira and Nicolas Visuara, KBC, alongside Rafael Rebouças de Araujo, Joana Variani and Juan Carlos Moreno, Acelen, explore how real-time emissions monitoring drives decarbonisation.
63 Frontline safety culture and digitisation
Graham Freeman, Intelex Technologies, ULC, examines how a resilient frontline safety culture can be upheld in the oil and gas industry.
67 Cybersecurity: a life cycle, not a destination
Tim Gale, 1898 & Co., USA, explores how a broader cybersecurity programme is required to protect critical process control and safety systems in the oil and gas industry.

73 Unveiling the shadows
Dr. Gareth Owenson, Searchlight Cyber, UK, discusses how dark web intelligence can protect the oil and gas sectors.
THIS MONTH'S FRONT COVER
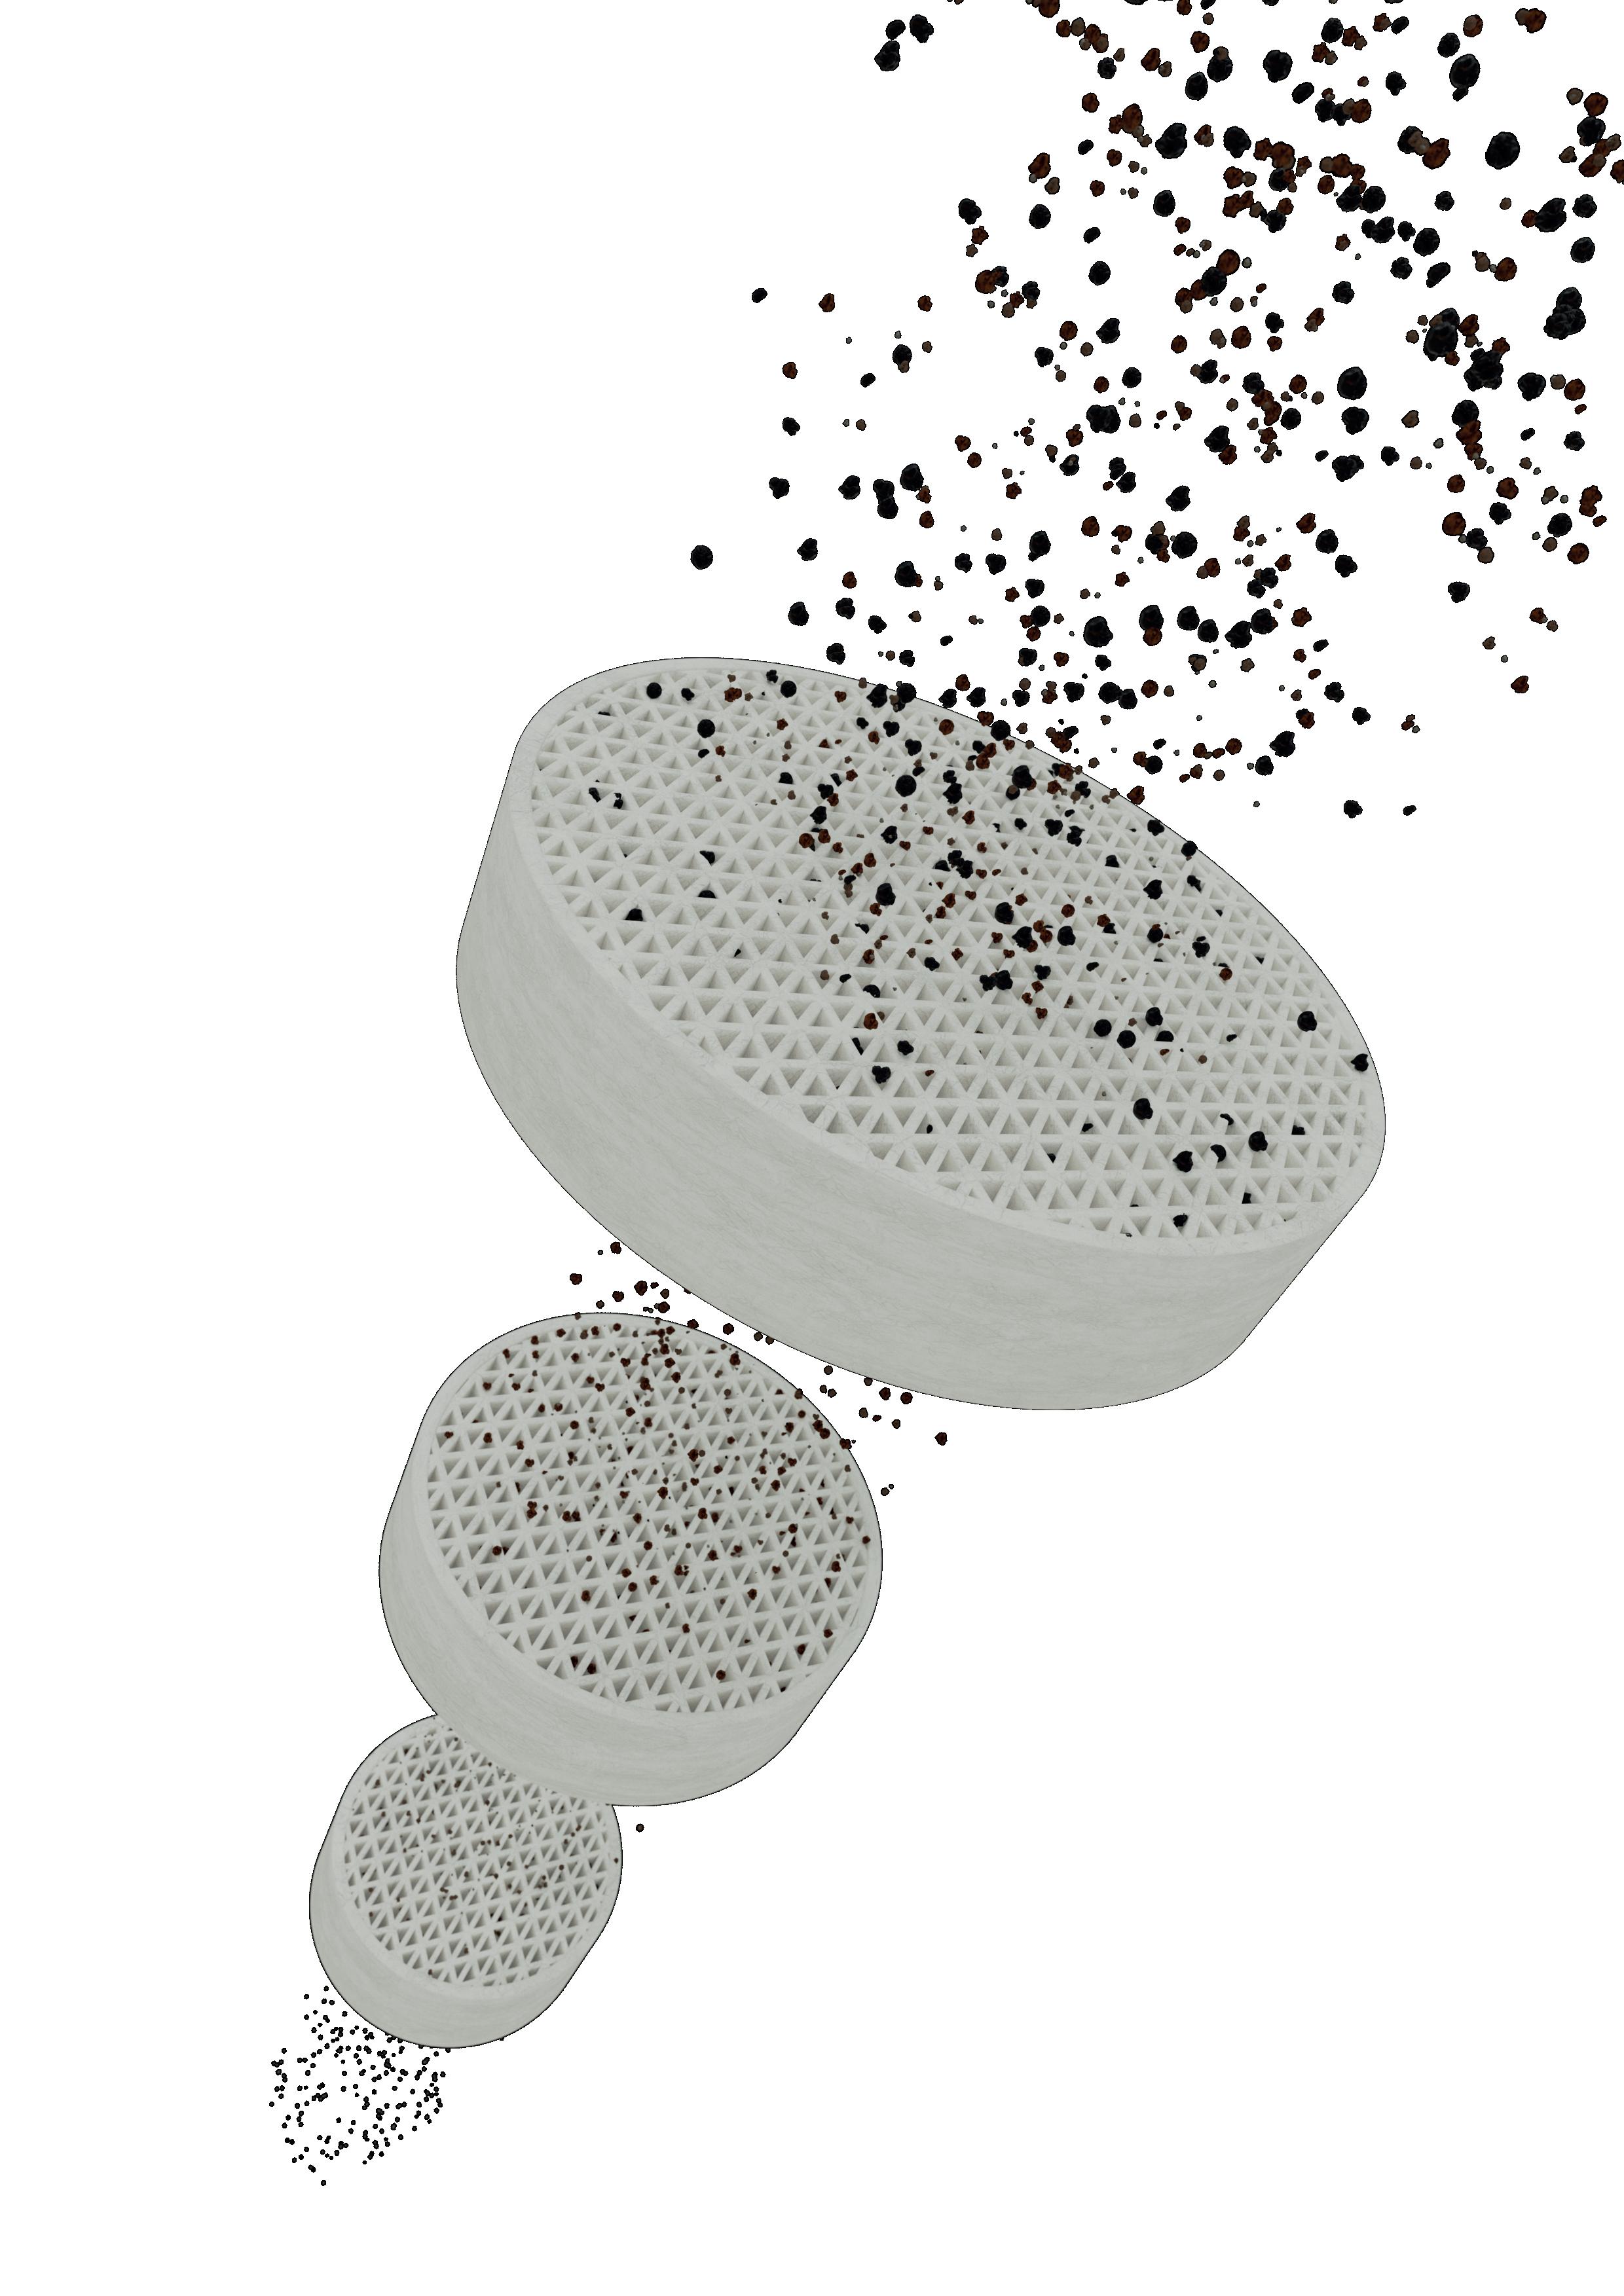
UNICAT’s Next Generation Filtration System ‘AFS’ has improvements in geometry, influencing capacity and pressure drop. AFS increases catalyst bed life by 50% +, offers high void space, and allows foulants to get deeper into the grading, resulting in significantly longer cycles.
CONTENTS CBP019982 Hydrocarbon Engineering Like Join Hydrocarbon Engineering @HydrocarbonEng Follow CONVERSATION JOIN THE 2023 Member of ABC Audit Bureau of Circulations Copyright© Palladian Publications Ltd 2023. All rights reserved. No part of this publication may be reproduced, stored in a retrieval system, or transmitted in any form or by any means, electronic, mechanical, photocopying, recording or otherwise, without the prior permission of the copyright owner. All views expressed in this journal are those of the respective contributors and are not necessarily the opinions of the publisher, neither do the publishers endorse any of the claims made in the articles or the advertisements. Printed in the UK. September 2023 Volume 28 Number 09 ISSN 1468-9340 03 Comment 05 World news 08 Evaluating new opportunities in North America Gordon Cope, Contributing Editor, discusses how investors in North American refineries and petrochemicals are tacking in the face of adversarial winds, and evaluating new opportunities. 14 Next generation filtration
Michalec, James Esteban,
Catalyst Technologies, LLC, explore how
next generation technology can help to
and efficiency, while reducing costs and improving
21 Maximising potential
Miranda
challenges of maximising
importance of novel catalyst technology. 27 The cleaner
Tim
Will Bridges and Tom Ventham, UNICAT
innovative
increase bed cycle time
profitability.
Modesto
butylenes from residual
THE PATH TO SUSTAINABILITY ...
BEGINS WITH THE RIGHT CATALYST
Refineries face unprecedented challenges as the world demands cleaner production. Now more than ever, your operation needs to safeguard more than just the bottom line.
With our eye on your conventional and renewable needs, Topsoe is committed to delivering catalysts with unprecedented activity, selectivity, and lifetime for every application. All with the goal of ensuring that your business does even more good, and even less harm.
Because the most important catalyst for a sustainable future isn’t actually a catalyst, at all. It’s you.

Visit topsoe.com to learn more.
COM MENT
CONTACT INFO
MANAGING EDITOR James Little james.little@palladianpublications.com
SENIOR EDITOR Callum O'Reilly callum.oreilly@palladianpublications.com
EDITORIAL ASSISTANT Poppy Clements poppy.clements@palladianpublications.com
SALES DIRECTOR Rod Hardy rod.hardy@palladianpublications.com
SALES MANAGER Chris Atkin chris.atkin@palladianpublications.com

SALES EXECUTIVE Sophie Birss sophie.birss@palladianpublications.com
PRODUCTION MANAGER Kyla Waller kyla.waller@palladianpublications.com
EVENTS MANAGER Louise Cameron louise.cameron@palladianpublications.com
DIGITAL EVENTS COORDINATOR Merili Jurivete merili.jurivete@palladianpublications.com
DIGITAL ADMINISTRATOR Leah Jones leah.jones@palladianpublications.com
ADMIN MANAGER Laura White laura.white@palladianpublications.com
CONTRIBUTING EDITOR
Nancy Yamaguchi Gordon Cope
SUBSCRIPTION RATES
Annual subscription £110 UK including postage /£125 overseas (postage airmail).
Two year discounted rate £176 UK including postage/£200 overseas (postage airmail).
SUBSCRIPTION CLAIMS
Claims for non receipt of issues must be made within 3 months of publication of the issue or they will not be honoured without charge.
APPLICABLE ONLY TO USA & CANADA
Hydrocarbon Engineering (ISSN No: 1468-9340, USPS No: 020-998) is published monthly by Palladian Publications Ltd GBR and distributed in the USA by Asendia USA, 17B S Middlesex Ave, Monroe NJ 08831. Periodicals postage paid New Brunswick, NJ and additional mailing offices. POSTMASTER: send address changes to HYDROCARBON ENGINEERING, 701C Ashland Ave, Folcroft PA 19032.
15 South Street, Farnham, Surrey
GU9 7QU, UK
Tel: +44 (0) 1252 718 999
CALLUM O'REILLY SENIOR EDITOR
White noise has played a big part in my life over the past year or so. My wife and I have tried various different apps, and lots of different sonic hues, in an attempt to get a good night’s sleep.
It’s not that we are discerning customers of aperiodic sound, but rather, our 15-month-old son is. And although he now sleeps peacefully through the night (karma will probably get me for writing that), we dare not change any aspect of his bed-time routine for fear of returning to the realm of insomnia. So white noise (or more specifically, brown noise) will continue to play softly from a speaker in his room until we’re brave enough to wean him off it!
We recently had to find a new source for our son’s brown noise addiction, as our subscription to a ‘paid-for’ app expired during the summer. After careful consideration, we decided that we couldn’t justify spending £30 for continued access to a “library of 60 premium sounds” (which seemed wholly essential a year or so ago). After all, we have found the genre of noise that works for us, and there are plenty of free white noise apps to choose from, as well as – we discovered – podcasts dedicated to playing nothing but white noise on loop.
These white noise podcasts recently hit the headlines after Bloomberg reported that Spotify has a “US$38 million white noise problem.”1 It seems that the music streaming service has been inadvertently pushing white noise and ambient podcasts to its listeners as part of its own “algorithmic push for ‘talk’ content (vs music)”. These podcasts are said to account for 3 million daily consumption hours on the platform (and I’m guessing that newborn babies are substantial consumers). Bloomberg reported last year that the creators of these podcasts could make at least US$18 000/month through advertisements that Spotify placed in their programmes.2 Once Spotify realised how much attention these white noise podcasts were attracting, it considered removing the shows and banning future uploads in order to redirect its audience to “comparable programming that was more economical for Spotify,” according to Bloomberg. However, this proposal did not come to fruition, despite some content creators reporting suspicious activity, such as their shows going missing from the platform.
Of course, there are hundreds of podcasts available that are substantially more rewarding than these white noise podcasts (unless, of course, you are a new parent). If you’re on the lookout for a new show to help you keep up-to-date with the latest developments in the oil and gas industry, then I’d like to point you in the direction of the Palladian Energy Podcast. The second season of the podcast is out now, and focuses on ‘sustainability in the oil and gas sector’. We talk to a number of experts on a range of topics including transitioning towards a greener future; learning to drive strategic sustainability goals; developing and implementing sustainable chemical solutions; and why climate change-related legal disputes are on the rise. By subscribing to the podcast, you will also have access to a whole host of interesting conversations that took place during season one, which explored ‘digitalisation in the energy industry’. Topics here include the role of digitalisation in the downstream sector, the benefits of embracing automation, the importance of cybersecurity, and how downstream companies can begin their digitalisation journeys. You can access the Palladian Energy Podcast from wherever you usually get your podcasts.
 1. CARMAN, A., ‘Spotify Looked to Ban White Noise Podcasts to Become More Profitable’, Bloomberg, (17 August 2023).
2. ‘CARMAN, A., ‘Spotify Podcasters Are Making $18,000 a Month With Nothing But White Noise’, Bloomberg, (1 June 2022).
1. CARMAN, A., ‘Spotify Looked to Ban White Noise Podcasts to Become More Profitable’, Bloomberg, (17 August 2023).
2. ‘CARMAN, A., ‘Spotify Podcasters Are Making $18,000 a Month With Nothing But White Noise’, Bloomberg, (1 June 2022).
THE RENEWFINE CATALYST PORTFOLIO FOR RENEWABLE DIESEL & SAF

Sustainable Solutions, Limitless Potential
Ketjen’s ReNewFine Catalyst Portfolio for renewable diesel and sustainable aviation fuel is now commercially available.

Scan and learn more
WORLD NEWS
USA | Cheniere and BASF sign long-term LNG SPA
Cheniere Energy Inc. has announced that it has entered into a long-term LNG sales and purchase agreement (SPA) with BASF. Under the SPA, BASF has agreed to purchase up to approximately 0.8 million tpy of LNG from Cheniere on a free on board (FOB) basis for a purchase price indexed to the Henry Hub price, plus a fixed liquefaction fee. Deliveries will commence in mid-2026 and, subject
to a positive final investment decision (FID) with respect to the first train (Train Seven) of the Sabine Pass Liquefaction Expansion Project in Louisiana, US, will increase to approximately 0.8 million tpy upon the start of commercial operations of Train Seven. The term of the SPA extends through to 2043. The expansion project is being developed for up to approximately 20 million tpy of total LNG capacity.
USA | Cummins and Chevron advance strategic collaboration
Cummins and Chevron have announced a Memorandum of Understanding (MoU) to leverage complementary positioning in hydrogen, natural gas, and other lower carbon fuel value chains. This will expand the two companies’ previous strategic collaboration on hydrogen and renewable natural gas.
The collaboration is expected to encompass other liquid renewable
fuels, such as renewable gasoline blends, biodiesel and renewable diesel, and is intended to encourage commercial and industrial adoption in North America.
Cummins and Chevron will work together on enabling the commercial development at scale of alternative fuels production, transportation and delivery systems for industrial and commercial markets.
UK | Lummus and Biohydrogen Technologies partner on blue hydrogen technology
Lummus Technology and Biohydrogen Technologies have announced an agreement to develop and deploy advanced synthesis gas reactor technology primarily for the production of blue hydrogen.
Lummus’ Green Circle business unit will provide to Biohydrogen Technologies its expertise in hydrogen and synthesis gas plant design, reactor scale-up and design, and proprietary equipment supply.
“As the world looks for solutions to generate significant quantities of hydrogen for energy use while lowering CO2 emissions, Lummus is proud to partner with Biohydrogen Technologies to address this critical challenge for our industry and society,” said Leon de Bruyn, President and CEO of Lummus Technology. “By joining together, we will help further develop and deploy decarbonised solutions to the market.”
China | CPC Corp., Taiwan awards major contract to Sulzer and Axens
Sulzer Chemtech’s GT-BTX PluS and GT-AromatizationSM technologies, combined with Axens’ Prime-G+ technology, have been selected by CPC Corp., Taiwan (CPC Corp.) to streamline its oil to petrochemical value chain at its Talin Refinery in Kaohsiung, Taiwan.

CPC Corp. is undertaking an ambitious modernisation project of its Talin Refinery, an integrated refining and petrochemical production complex, to address growing petrochemical market needs. The company is implementing key technologies to
recover high volumes of valuable aromatic hydrocarbons from RFCC gasoline and other fuels.
Sulzer Chemtech’s licensed extractive distillation technologies will enable the recovery of high-quality key aromatics, namely benzene, toluene, and xylenes (BTX) from RFCC gasoline, as well as convert C4-C8 olefin-rich non-aromatics into additional aromatics. The solutions will offer a processing capacity of 32 000 bpd of RFCC gasoline and other aromatics-rich streams. Sulzer Chemtech will provide the
technologies, licenses, basic engineering, critical equipment, solvent, and catalyst, as well as technical services.
CPC Corp. will also leverage the alliance between Sulzer Chemtech and Axens to integrate additional hydrotreating solutions within the processing train, further reducing sulfur-based impurities in end products, relying on Axens’ Prime-G+ technology to ensure the selective desulfurisation of the gasoline. This will drive the production of high-grade petrochemicals and, ultimately, profitability.
September 2023 HYDROCARBON ENGINEERING 5
WORLD NEWS
DIARY DATES
17 - 21 September 2023
World Petroleum Congress
Calgary, Alberta, Canada www.24wpc.com
26 - 28 September 2023
Turbomachinery & Pump Symposia Houston, Texas, USA tps.tamu.edu
02 - 05 October 2023
ADIPEC
Abu Dhabi, UAE www.adipec.com
03 - 05 October 2023
AFPM Summit
Grapevine, Texas, USA summit.afpm.org
09 - 12 October 2023
2023 API Storage Tank Conference & Expo Denver, Colorado, USA events.api.org/2023-api-storage-tank-conference-expo
06 - 08 November 2023
Sulphur + Sulphuric Acid 2023 New Orleans, Louisiana, USA www.sulphurconference.com
13 - 16 November 2023
ERTC
Lake Maggiore, Italy worldrefiningassociation.com/event-events/ertc
05 - 07 December 2023
16th Annual National Aboveground Storage Tank Conference & Trade Show
The Woodlands, Texas, USA www.nistm.org
30 - 31 January 2024
NARTC
Houston, Texas, USA www.worldrefiningassociation.com/event-events/ nartc
03 - 07 March 2024
AMPP Annual Conference + Expo
New Orleans, Louisiana, USA ace.ampp.org
29 April - 03 May 2024
RefComm
Galveston, Texas, USA www.events.crugroup.com/refcomm
USA | Refinery outages amid lower capacity increase US gasoline crack spreads
Unplanned refinery outages and lower gasoline production capacity are increasing the costs of producing summer-grade gasoline in the US this summer, resulting in both higher US crack spreads and retail gasoline prices, according to the US Energy Information Administration (EIA).
The crack spread the difference between petroleum product prices and crude oil prices is an indicator of underlying trends in refining, and it usually makes up about 25% of the retail gasoline price. During the
summer of 2023, US gasoline crack spreads had remained less than those of summer 2022, up until the final weeks of July and into August. Although US gasoline consumption has increased from last summer and inventories remain near five-year lows, recent developments in US refining activity are primarily driving crack spreads this summer.
Several unplanned refinery outages have prevented refiners from producing enough high-octane blendstock to meet summer demand.

China | INEOS and SINOPEC complete major petrochemicals deal
INEOS has completed the formation of a 50/50 joint venture with SINOPEC for the Tianjin Nangang Ethylene Project in China, which was announced in December 2022.
SINOPEC is currently constructing the plant, which is expected to be on-stream by April 2024.
The petrochemical complex includes a 1.2 million tpy cracker, a new 500 000 tpy high-density
polyethylene plant to produce INEOS pipe grade under license, and 11 other derivative units.
The completion of the agreement marks the continued progression of the significant petrochemical deals announced by the parties in July and December 2022, and highlights the close relationship and growing collaboration between SINOPEC and INEOS.
India | McDermott selected for petrochemical expansion project
McDermott has been awarded a project management consultancy (PMC) and engineering, procurement, and construction management (EPCM) contract for the Naphtha Cracker Expansion (Phase II) polypropylene expansion and new ethylene derivative unit project, by Indian Oil Corp. Ltd (IOCL).
The project is located at the Panipat Refinery and Petrochemical Complex, located 62 miles (100 km) from New Delhi, India.
The project will increase the ethylene production capacity of the naphtha cracker unit (NCU) by approximately 20%.
The additional ethylene and propylene production will act as feed for downstream polymer units. The polymer products will be used for the manufacture of household and industrial items, including containers, automobile parts, furniture, and heavy-duty films.
September 2023 HYDROCARBON ENGINEERING 6
Select The Best Catalyst With Confidence
Your Feed , Your Conditions
Commercial extrudates are tested with real feedstocks at industrial process conditions. Relevant refinery knowledge with industry experience.

Highest Data Q uality
Outstanding reactor-to-reactor repeatability. Tests performed by highly experienced staff with extensive catalysis knowledge.
Reliable Results
Test duplicates for improved accuracy.We can discriminate <1°C activity difference and <0.5 wt% in MD yield. Test catalysts side-by-side under the exact same conditions.
Validated by Catalyst Suppliers
Flowrence® technology validated by all catalyst suppliers. Pilot plant systems with unmatched accuracy. Results you can trust.
REFINERY CATALYST TESTING
rds@avantium.com Avantium R&D Solutions | +31 20 586 80 80
rds.avantium.com

8 September 2023 HYDROCARBON ENGINEERING
Gordon Cope, Contributing Editor, discusses how investors in North American refineries and petrochemicals are tacking in the face of adversarial winds, and evaluating new opportunities.
The international energy sector is entering a new world order. Nations are scrambling to find alternatives to Russian supplies of oil and gas, jurisdictions are reducing their carbon footprints, new fuels such as hydrogen are entering the market at warp speed, and the overriding priority of energy security is super-charging geopolitics. North America is blessed with abundant fossil fuels and a comprehensive downstream sector, but, like everyone else, must pivot to the new realities or be left in the dust by more nimble competitors.
Canada
Since the election of the Trudeau government in 2015, Canada’s oil and gas sector has been inundated by federal regulations geared to transitioning the country to a non-carbon economy. This has resulted in cancelled pipelines, regulatory delays and missed opportunities. When German Chancellor, Olaf Scholz, visited Canada in late 2022 seeking LNG exports to alleviate the loss of Russian imports, Justin Trudeau replied that there was “no business case” for building East Coast gasification facilities (Germany subsequently signed a 15-year contract with Qatar). Despite this, oil and gas remains the country’s number one export, accounting for CAN$104 billion in 2022, primarily in the form of crude shipments to the US.
Canada’s total refining capacity is approximately 2 million bpd. New clean fuel regulations established by the Canadian federal government require refiners to reach net-zero emissions by 2050. The Canadian Association of Petroleum Producers (CAPP) estimates that it will cost up to CAN$75 billion to reach that goal and
significant capital is already being deployed to reconfiguring existing facilities:

n In January 2023, Imperial Oil announced that it was investing CAN$720 million to create the largest renewable diesel facility in Canada. Initial production has already begun at Imperial’s Strathcona refinery near Edmonton, Alberta. When the module is commissioned in 2025, it will be able to produce 20 000 bpd from a feedstock of locally-sourced canola and soy, as well as blue hydrogen.
n Tidewater Renewables invested CAN$430 million to build Canada’s first stand-alone renewable diesel refinery. The plant, located in Prince George, British Columbia (B.C.), is expected to enter production in mid-2023. When it reaches full operational capacity, it will produce 170 million l/yr of fuel using canola oil, tallow and used cooking oil. Unlike biodiesel, which can be mixed with conventional diesel up to 10%, renewable diesel can be substituted 100%, reducing emissions by up to 90%.
n Since its purchase in late 2021, Newfoundland & Labrador’s Come By Chance refinery has been undergoing conversion to a biofuels refinery. Cresta Fund Management has revamped the facility’s hydrocracker and diesel hydro-treater to produce renewable diesel and sustainable aviation fuel (SAF). The bio-refinery will have the capacity to produce up to 18 000 bpd of renewable diesel and SAF, with production currently expected to begin during 2023. Cresta has also indicated that the capacity could later be expanded to 35 000 bpd, with the addition of a further
September 2023 9 HYDROCARBON ENGINEERING
stream of green ammonia fuel. Products are destined for both domestic and international markets.
In addition, Federated Co-operative is proposing a diesel project for its Regina facility, and Parkland Corp. is seeking a final investment decision (FID) for a CAN$600 million addition to its refinery in Burnaby, B.C.
LNG
For over a decade, various developers have been proposing LNG projects in B.C.; the province is finally seeing development.
LNG Canada, led by Shell, is completing its plant in Kitimat, B.C. The first phase of 14 million tpy is scheduled for completion in 2025. Construction of a 2.1 million tpy Woodfibre LNG plant near Squamish, B.C., is set to begin in late 2023, with a completion date in 2027. In March 2023, the B.C. government approved the construction of the Cedar LNG project, also near Kitimat. The CAN$2.4 billion floating LNG facility, which is majority owned by the Haisla First Nations, is expected to produce up to 4 million tpy.
The US
Refiners in the US are seeking to rebalance production in response to COVID-19 regulations and international fuel demand. According to the US Energy Information Administration (EIA), six US crude oil refineries have closed since the COVID-19 pandemic began, dropping US capacity from 18.98 million bpd to slightly under 18 million bpd. Now, refiners are reversing the trend.
In early January 2023, ExxonMobil completed a US$2 billion expansion at its 369 000 bpd refinery in Beaumont, Texas, US. The project, almost a decade in the making, will see the startup of a 250 000 bpd crude distillation unit (CDU), making it the second largest refinery in the US. The new capacity comes at a time when diesel and gasoline reserves are at five-year lows; refiners are receiving a very healthy US$35/bbl crack spread (the difference between the price of crude and refined fuels).
“Right now, margins are sensational,” said Garfield Miller, President of refining investment bank, Aegis Energy Advisers Corp. “These margins tell you that as far as the US Gulf Coast is concerned, there is plenty of demand relative to supply.”1
Kevin O’Leary, a panelist on the popular TV show, Shark Tank, has announced plans to build a US$14 billion refinery in the US. “At the end of the day, we can make our own energy here very clean,” he noted, in a television interview. “We haven’t built a refinery in America for decades because we can’t permit it. I’m going to find a state that wants to work with me. I’m going to get a permit and we’re going to do the right thing for America. We have to have more refineries.”2 The financier later commented that North Dakota would be a primary candidate due to its pro-fossil fuel stance.
LNG
Currently, US LNG plants are exporting approximately 13.4 billion ft3/d of gas; that number is expected to climb significantly over the next five years as new trains come online at the Golden Pass, Plaquemines and Corpus Christi sites, pushing exports above 20 billion ft3/d by 2028. When Sempra’s Port Arthur project and LNG projects in Mexico (using gas from the US) come on-stream, that figure could rise to 30 billion ft3/d within the decade.
In March 2023, Dubai-based energy company Qilak announced a plan to build a US$5 billion LNG plant in Alaska’s North Slope. The region has over 35 trillion ft3 of stranded gas, and is several thousand kilometres closer to key Asian markets than the massive Yamal Peninsula LNG complex in Russia. The initial phase would see up to four vessels per month delivering 4 million tpy to South Korea, Japan and Taiwan.
In April 2023, the US Department of Energy (DOE) approved exports from the proposed US$40 billion Alaska LNG project. The Alaska Gasline Development Corp. plans to start delivering up to 3.5 billion ft3/d of gas via an 800 mile pipeline running from the North Slope to an LNG plant on the Pacific coast. The latter announcement, coming on the heels of the Biden administration’s approval for the Willow conventional oilfield project in the Alaska Strategic Petroleum Reserve, left environmentalists aghast. Alaska state officials applauded the move.
In late 2022, Chevron Phillips Chemical and QatarEnergy announced they had reached FID on a new petrochemical complex in Orange, Texas. The Golden Triangle Polymers Co. will build a complex that includes a 2 million tpy ethane cracker, and two 1 million tpy high-density polyethylene units. The facility is expected to be completed by 2026.
Green potential
Net-zero regulations in Canada and the US are incentivising companies to invest in environmentally-friendly projects that create renewable fuels in North America. In February 2023, German-based RWE formed an alliance with LOTTE Chemical of Korea and Japan’s Mitsubishi, to build a clean ammonia production and export facility in the port of Corpus Christi, Texas. The plan is to build a series of units with a final capacity approaching 10 million tpy by 2030. Output will be in the form of both blue and green ammonia, and will be exported to Asia and Europe for use as both fuel and a source of renewable hydrogen.
In February 2023, EverWind, based in Nova Scotia, Canada, received approval from the provincial government to build a 300 MW hydrogen electrolysis and green ammonia plant in Port Hawkesbury, Nova Scotia. The CAN$6 billion project is intended to supply the German market by 2025.
Nutrien, a Canadian fertilizer company, is working in collaboration with Belgian shipping company, EXMAR, to develop an ammonia-powered shipping vessel. In late 2022, the company announced that it has plans to build the world’s largest clean ammonia facility at its existing complex in Geismar, Louisiana, US, near tidewater ports in New Orleans. Currently undergoing front-end engineering and design (FEED), the 1.2 million tpy plant would permanently remove up to 90% of CO2 emissions using carbon capture and sequestration (CCS) technology. An FID is expected by 2023; full production could commence by 2027.
Yara, a fertilizer company based in Norway, is teaming up with Enbridge to build a blue ammonia plant in Corpus Christi, Texas. The US$2.9 billion facility will produce up to 1.4 million tpy using carbon capture. The output will be used for low-carbon fertilizers, shipping fuel and utility power.
Hydrogen
ExxonMobil is advancing plans for a huge, low-carbon hydrogen and ammonia production facility, located in its
September 2023 HYDROCARBON ENGINEERING 10
Baytown, Texas, complex. In January 2023, it contracted with Technip Energies to conduct FEED in order to make an FID by 2024. When construction is finished in 2028, the new facility will produce up to 1 billion ft3/d of blue hydrogen by capturing and sequestering up to 98% of CO2 emissions. The output allows ExxonMobil and third party customers to produce low-carbon fuels and products.
Geopolitics
The war in Ukraine has exacerbated a great geopolitical divide between nations; on one side, the US, NATO and western allies, and on the other, Russia, China and many non-aligned nations in Africa and Asia. The former is mainly concerned about energy security, and the latter with buying cheap, embargo-busting Russian oil.
In the Middle East, loyalties are also being divided. Russia has found an ally in Iran, which supplies it with military kit, such as attack drones. Saudi Arabia relies on its traditional alliance with the US as a source of arms. Others try their best to sit on the fence, looking to maintain and grow market share in Asia and to wrangle concessions from both sides. Qatar, for instance, positions itself as a neutral supplier of LNG to all nations. In the last several months, it has signed major long-term contracts with both China (4 million tpy for 27 years, starting in 2026) and Germany (2 million tpy for 15 years, starting in 2026.)
However, it is telling that, when it comes to major internal investments, Qatar favours the west. In early 2022, Houston-based McDermott signed a contract for the engineering, procurement, construction and installation (EPCI) for the offshore components of the North Field Expansion Project in Qatar. McDermott categorised the size of the contract as one of the largest in its history. In addition, Qatar has partnered with US-based Chevron Phillips Chemical to build a US$6 billion ethylene plant located in the former’s Ras Laffan expansion. The complex will feature a 2.1 million tpy ethane cracker, and include two polyethylene trains with a total output of 1.7 million tpy of high-density polyethylene, bringing Qatar’s overall petrochemical production capacity to approximately 14 million tpy.
Conclusions
The regulatory pressure for net zero emissions over the next several decades will require hundreds of billions of dollars in downstream investments to capture and sequester CO2, and to switch to low-carbon biofuels and hydrogen. As the consumption of diesel and gasoline in North America gradually stagnates due to higher fuel efficiency and more electric vehicles, production will be geared toward greener fuels for both domestic consumption and export. National oil companies, including those in the Middle East, will increasingly look to North America as a means of diversifying assets into less geopolitically-fraught jurisdictions. In all, it will create significant opportunities for the downstream segment of oil and gas in Canada and the US to both evolve and seek new markets.
References
1. SEBA, E., ‘Exclusive-Exxon prepares to start $2 billion Texas oil refinery expansion’, Yahoo Finance, (13 January 2023), https://ca.finance.yahoo. com/news/exclusive-exxon-prepares-start-1-163315791.html
Let ProTreat® Be Your Guide
The Leading Simulator for CO2 Capture
Solvents:
• Primary, secondary, promoted amines
• CESAR1 (updated with data from DOE partnership & tested within EU-funded consortium “SCOPE”)
• Amino acid salts
• Enzyme catalysed & amine-promoted carbonates
• Ionic solvents
• High strength piperazine
• Chilled ammonia
Applications:
• Stationary power generation
• CO2 capture from LNG-fueled ships
• Renewable methane from landfill gas and organic waste

• Hydrogen production via reforming
Ferrybridge Pilot Plant, Ferrybridge, UK, 100 TPD

Reliable:
• New CESAR1 model updated with cutting edge lab and plant data from DOE partnership
• Thoroughly tested as part of EU-funded research consortium “SCOPE”
2. PARASKOVA, T., ‘O’Leary Looks For A US state to host his $14 billion refinery’, Oilprice.com, (15 April 2023), https://oilprice.com/Energy/ Crude-Oil/OLeary-Looks-For-A-US-State-To-Host-His-14-BillionRefinery.html Contact us

a
Optimized Gas Treating, Inc. www.ogtrt.com +1
for
free trial
512 312 9424

©2023 Halliburton. All Rights Reserved. halliburton.com Superior Process and Water Treatment Solutions Driven by Service Excellence PROTECT ASSETS & MAXIMIZE VALUE
COMPLETE SOLUTIONS
Halliburton Multi-Chem offers a broad selection of chemistries, equipment, services and automation to ensure timely and successful results.
COLLABORATIVE APPROACH
Through onsite technical service and engineering support, Halliburton Multi-Chem collaborates with you to deliver solutions to your challenges. Improving reliability, increasing throughput and enhancing the efficiency and flexibility of operating units is important to you.
We are here to help.


14 September 2023 HYDROCARBON ENGINEERING
Tim Michalec, James Esteban, Will Bridges and Tom Ventham, UNICAT Catalyst Technologies, LLC, explore how innovative next generation technology can help to increase bed cycle time and efficiency, while reducing costs and improving profitability.
Catalyst use in fixed bed reactors pre-dates the refining and petrochemical industries and is considered an essential component over a broad scope of applications. While fixed bed reactors are found in a wide variety of applications, there are many similarities between these operations despite a rich diversity of reactants and products.
Fixed bed reactor systems have two key failure modes which act to reduce the overall activity and life of catalyst bed materials:
n Feed poisons.
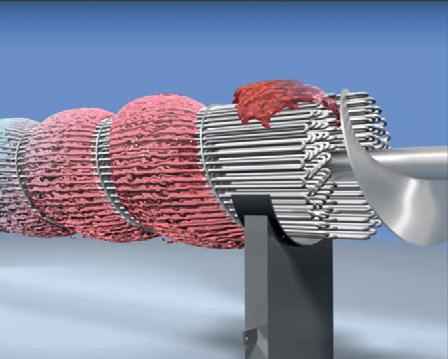
n Pressure drop (dP) due to particulate fouling (Figure 1).
Poisons that enter with feed impair the conversion abilities of primary catalysts and therefore impact product quality. Control of poisons, and resistance to impurities, are essential components of fixed bed reactor catalyst system design. Inherently, fixed bed reactors are also exceptional physical filtration devices. Unfortunately, this results in susceptibility to premature shutdown when overall system dP exceeds design parameters due to excessive fouling. Graded bed materials have been used at the inlet of hydroprocessing and hydrocracking reactors for decades to trap foulants and poisons
First generation: deep bed filter using spherical ceramics
Catalyst companies initially developed top bed grading systems targeting foulant filtering with varying degrees of success. Initially a series of smaller spherical supports were used that became known as ‘deep bed filtration’. A properly designed deep bed filter, based on particle size and distribution, will remove large proportions of particulate matter, provided it has sufficient depth. The problem is that it requires a significant portion of a catalyst bed to work properly, reducing the amount of active catalyst that can be used. A second problem is that only external void fraction can be used to filter particulates. Thirdly, accumulation of particulates in external void spaces redirects flow to paths of least resistance. Over time, decreased flow accessibility to the catalyst below was due to plugged sections of top bed grading.


Second
generation filter
systems: ‘wagon wheels’ and rings
Replacing inert support balls with ‘wagon wheels’ and rings improves internal flow channels around plugged external void spaces and improves flow. Filtering remains limited to external void spaces between wagon wheels. Run length is not dramatically improved when using wagon wheels and rings because internal void spaces of the smallest rings remain too large to filter the smallest particulates (‘fines’). Fines are trapped at interfaces between the smallest ring layer and main catalyst bed, which is the only external void fraction small enough to capture small particulates. Accumulation rapidly builds at this interface, void space decreases, dP increases, and end of run (EOR) due to high dP is quickly realised. Since the internal void space of wagon wheels and rings do not effectively filter or collect particulates, grading depths remain large to generate sufficient void space to be effective. Many industrial users must cut feed rate or skim the reactor when encountering high dP limitations. Both options reduce uptime and output, and analysis is required to determine the most cost-effective selection. At times, refiners find that a full discharge and reload with fresh catalyst and grading is more cost effective in comparison to the time and cost of multiple skims.
September 2023 15 HYDROCARBON ENGINEERING
Third generation: advanced shapes for effective particulate filtration
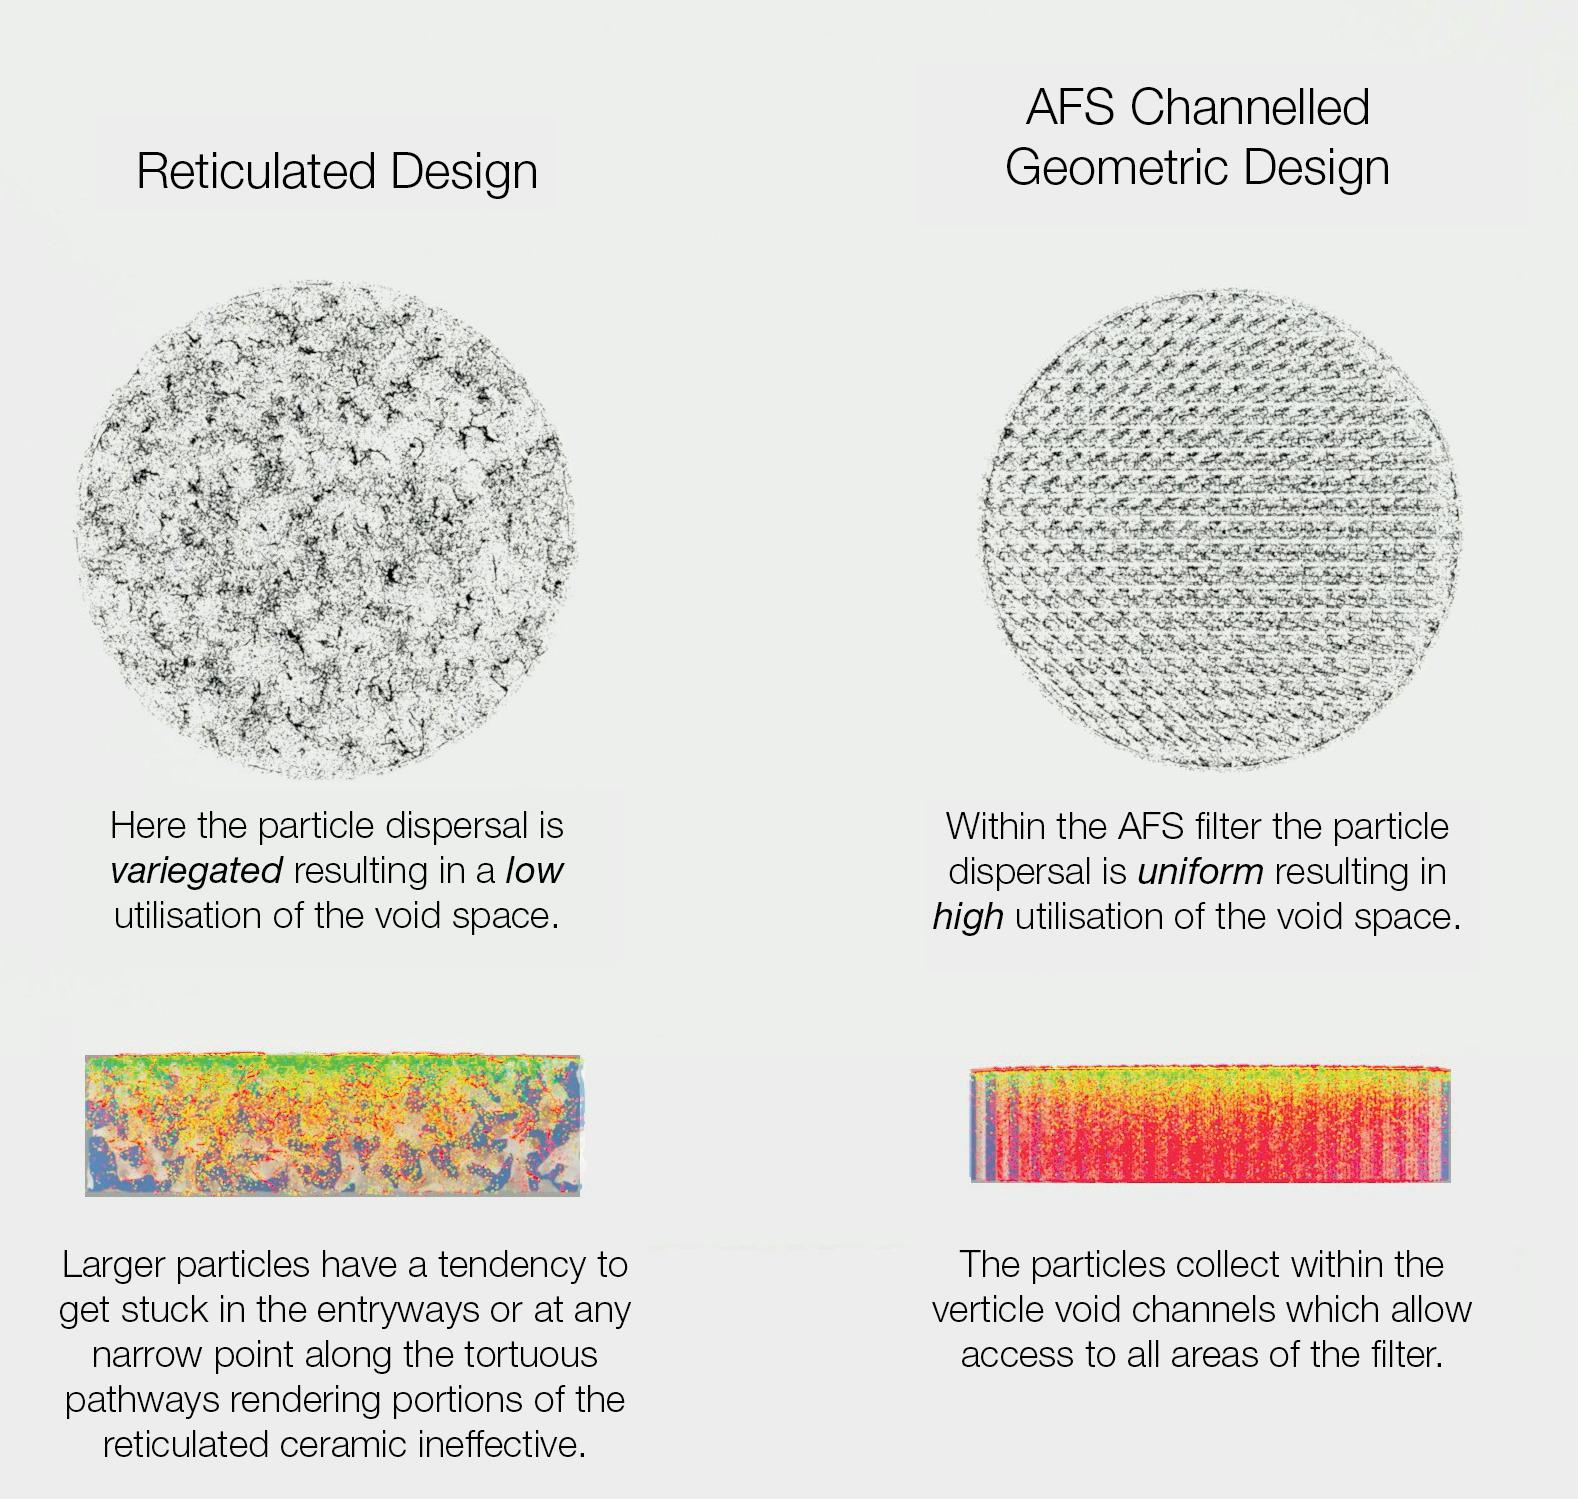
Rings and medallions layered above the main bed catalyst was an innovation that produced a small step change in reactor system life cycles. This was further improved with the invention of reticulated ceramics, which enhanced particulate removal and reduced dP build during runs. Finally, a new product entered the market with regular fixed triangular openings that proved additional benefits beyond reticulated ceramics. These advanced filtration system (AFS) disks had higher strength, more disks per ft3, higher particulate pick-up capacity, and an overall deep bed filtration which led to even longer runs with lower dP build.
Adaptation to deep bed filtration systems has been a staple in catalyst system design for over a generation. It is this critical component of reactor system design where
UNICAT Catalyst Technologies continues to study, innovate and develop new solutions to advance overall reactor system performance. The company’s AFS technology couples next generation computational fluid dynamics (CFD) and process modelling to design products that can maximise performance. By fundamentally restructuring the way that grading material functions in a deep bed filtering process, AFS significantly reduces dP build, which delays onset of EOR dP limits and can increase flow through a vessel without an increase in bed depth.
This paradigm shift is achieved with AFS by facilitating full access to all internal void space for particulate capture (Figure 2). As a result, less grading bed depth is required as internal void space collects particulates, without compromising external void space availability for fluid flow. Lower initial start of run (SOR) dP is also typically observed with AFS due to the higher overall void space.

Other improvements that can be observed include uniformity of reactor radial temperature distribution, due to a reduction of dead spots in catalyst layers beneath areas of plugged top grading. The internal void space of AFS is dimensionally controlled using various triangular-shaped mesh grades that are sized for different particulate diameters within an overall range of 10 - 2500+ µ m. Required layer depth of different mesh sizes is calculated to optimise removal of the full range of particulates present in the process to maximise time before EOR dP is reached. UNICAT designs AFS loading schemes through careful analysis of particulate size distribution in reactor feed samples, observations from previous cycles (when using AFS or other advanced or basic grading technologies), and engineering experience.
While the functional objectives of AFS have remained much the same, the shape and design has evolved based on CFD modelling of filter capacity and system dP. A primary beenfit of AFS is durability, which is directly related to composition and shape. It is important to refiners that catalyst and grading materials exhibit exceptionally high robustness and crush strength. This is essential to withstand operating conditions and is also vital during transportation and loading activities. Breakage or damage to fresh materials loaded into fixed bed reactors leads to an elevated dP beginning from SOR.
Furthermore, when replacing only a portion of the catalyst load during a skim, it is of paramount importance that no additional small particles are introduced to the existing catalyst bed below. A geometric design and a uniform structure provide AFS with high durability and crush strength. The mesh structure provides exceptionally high useable void space relative to alternative technologies. These dual benefits provide refiners with advantages in both reduced dP for longer days on stream pressure, as well as enhanced protection of main bed catalyst materials.
September 2023 HYDROCARBON ENGINEERING 16
Figure 1. Common contaminates/foulants found in feed.
Polymers
Figure 2. Reticulated vs AFS channelled geometric design.
Iron Scales Carbon Coke Iron Sulfide Silica
Common contaminates/foulants are:
These contaminates can cause a variety of issues during hydrating: 1. Loss of activity within the catalyst bed
2. Differential pressure fluctuations
3. Shorter cycle lengths
Cut your CO2 emissions in half with ET Black™ Carbon Black Technology
ET Black™ is a state-ofthe-art technology that complies with the most stringent environmental regulations now and in the future.


Plus, the flexibility to produce all ASTM grades, and specialty grades, in a single plant. ET Black™, the technology of reference for producing carbon black obtained by thermal decomposition of highly aromatic oils.


Find out more at: www.igoforETBlack.com
Shape and size
Many examples exist in literature which highlight the importance of catalyst shape and size in terms of how these parameters influence activity, especially relating to fluid dynamics, diffusivity, and mass transfer. Therefore, it is equally important that shape and size be considered for
graded bed filtration media to provide enhanced fluid dynamics, without disrupting flow distribution. This is to achieve maximum catalyst utilisation, while providing high surface area and void space for particulate accumulation. AFS functions analogously to distillation column structured packing, where reactor feed passes through engineered channels designed to optimise surface contact without excessive resistance to fluid flow.
Loading
Typically, AFS grading is random packed (sock loaded) to give up to 80% total void fraction. Sock loaded AFS naturally configures in a manner where a significant proportion of the matrix face is exposed to feed flow. In vessels where it is important to load the highest number of pieces possible in order to maximise total contaminant capacity, AFS can be raked during loading in order to load approximately 10% more disks. AFS is also a valuable hold-down material due to its high density (~44+/- 10% lb per cuft). UNICAT has experienced cases replacing lower density grading with AFS to avoid damage previously found in reactors where top bed grading formed into vortex-shapes due to turbidity of feed at the top of the bed, leading to premature dP.
Active metal promoted options
With catalyst reactors being fixed in size, refiners are looking for ways to utilise every ft3 of space for as much benefit as possible. In addition to the removal of contaminants from feed streams, grades of AFS are available with a variety of enhanced chemical properties, including active versions that provide a staged activity profile as feed is introduced to the reactor bed. This allows many common main catalyst bed poisons to be actively captured on AFS media, in addition to providing mild hydrogenation in hydroprocessing units to protect from deposition of polymeric structures that result from rapid hydrogenation of light hydrocarbon components.
Future feedstocks
Advancement of co-processing bio-based feedstocks presents new and unforeseen challenges for refiners. The popular solution appears to be to process such feeds in fixed bed reactors, such as hydrotreaters and hydrocrackers. With high costs and short
September 2023 HYDROCARBON ENGINEERING 18
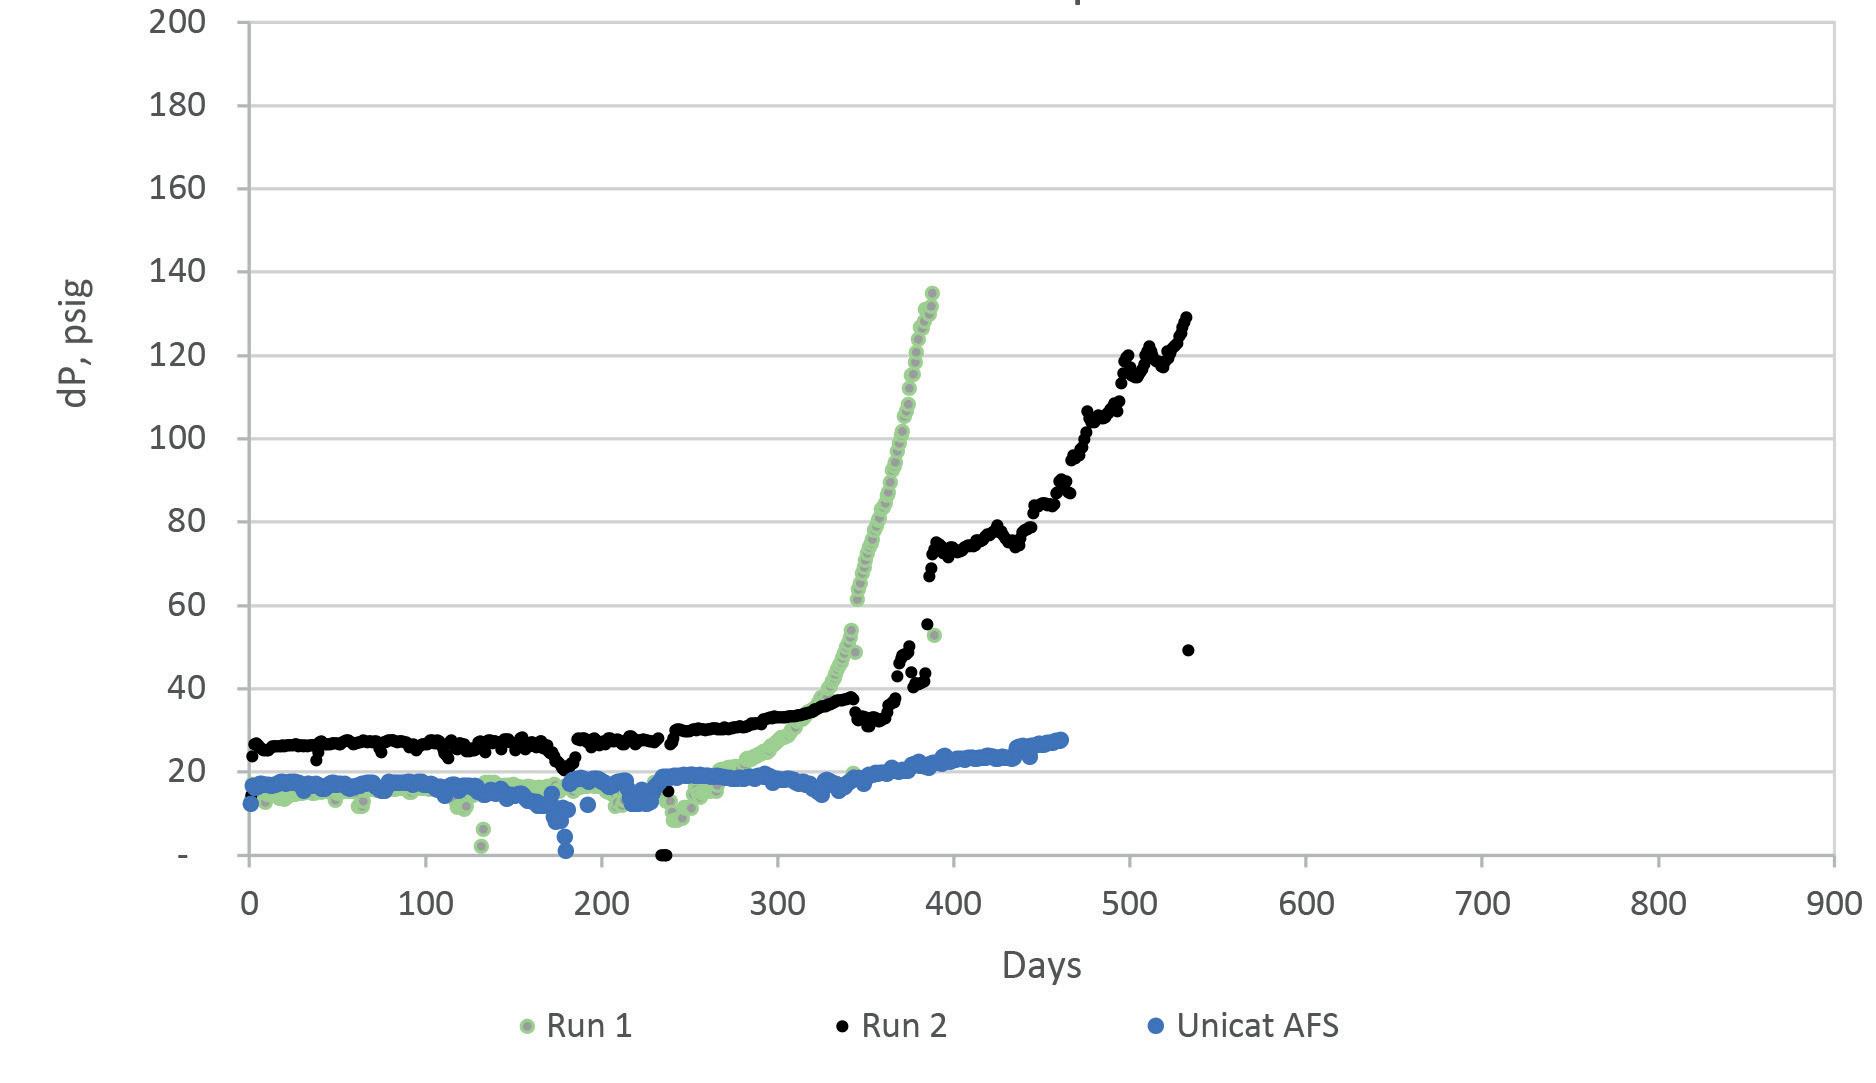
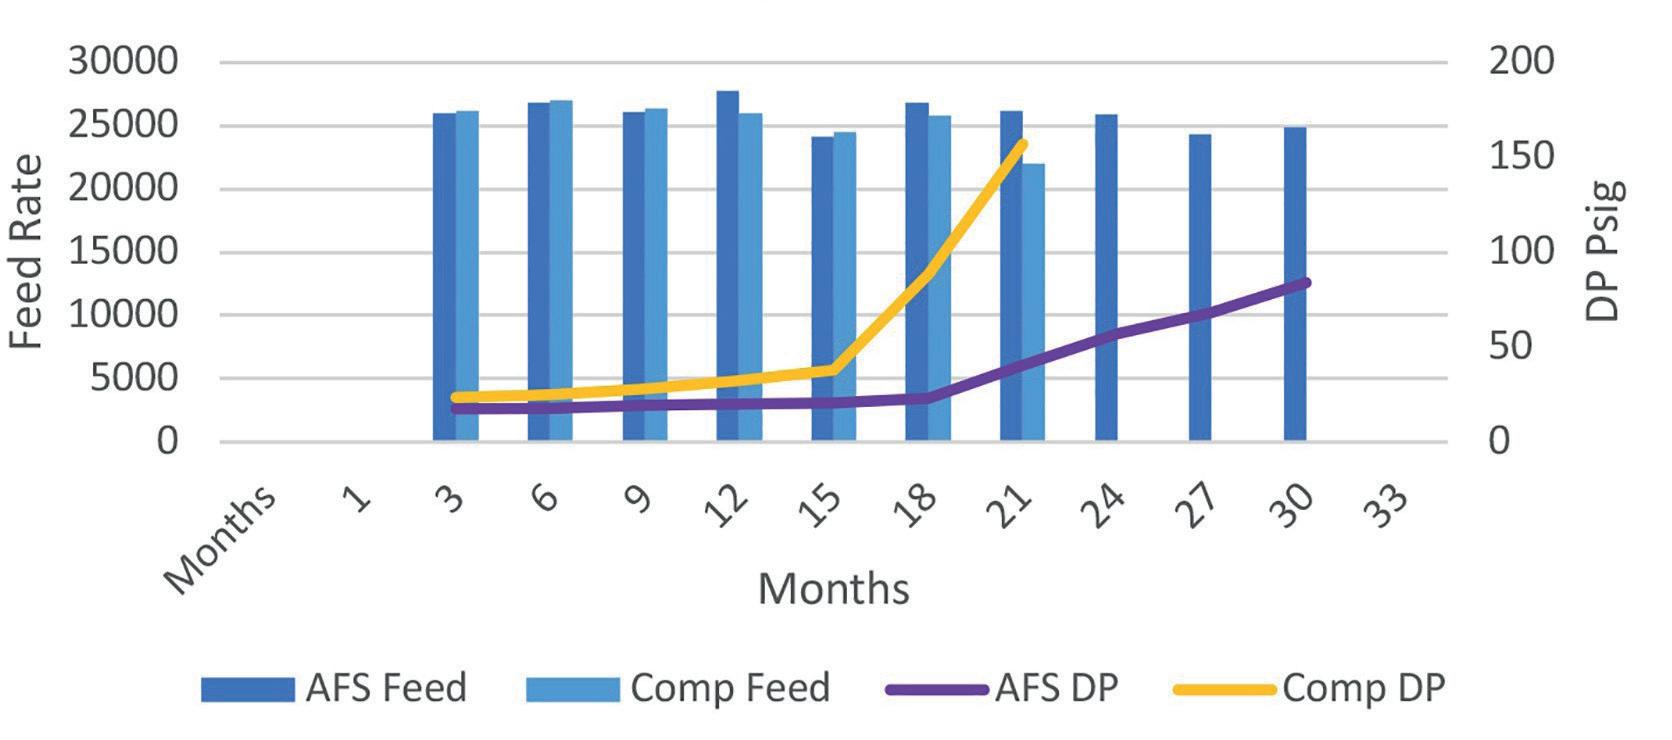
Figure 3a. AFS vs competitor grading. Pressure drop and feed rate comparison; with AFS a 150% longer cycle can be realised compared to competitor grading, leading to reduced costs, improved profitability and minimised down time.
Figure 3b. AFS vs competitor traditional reticulated grading.
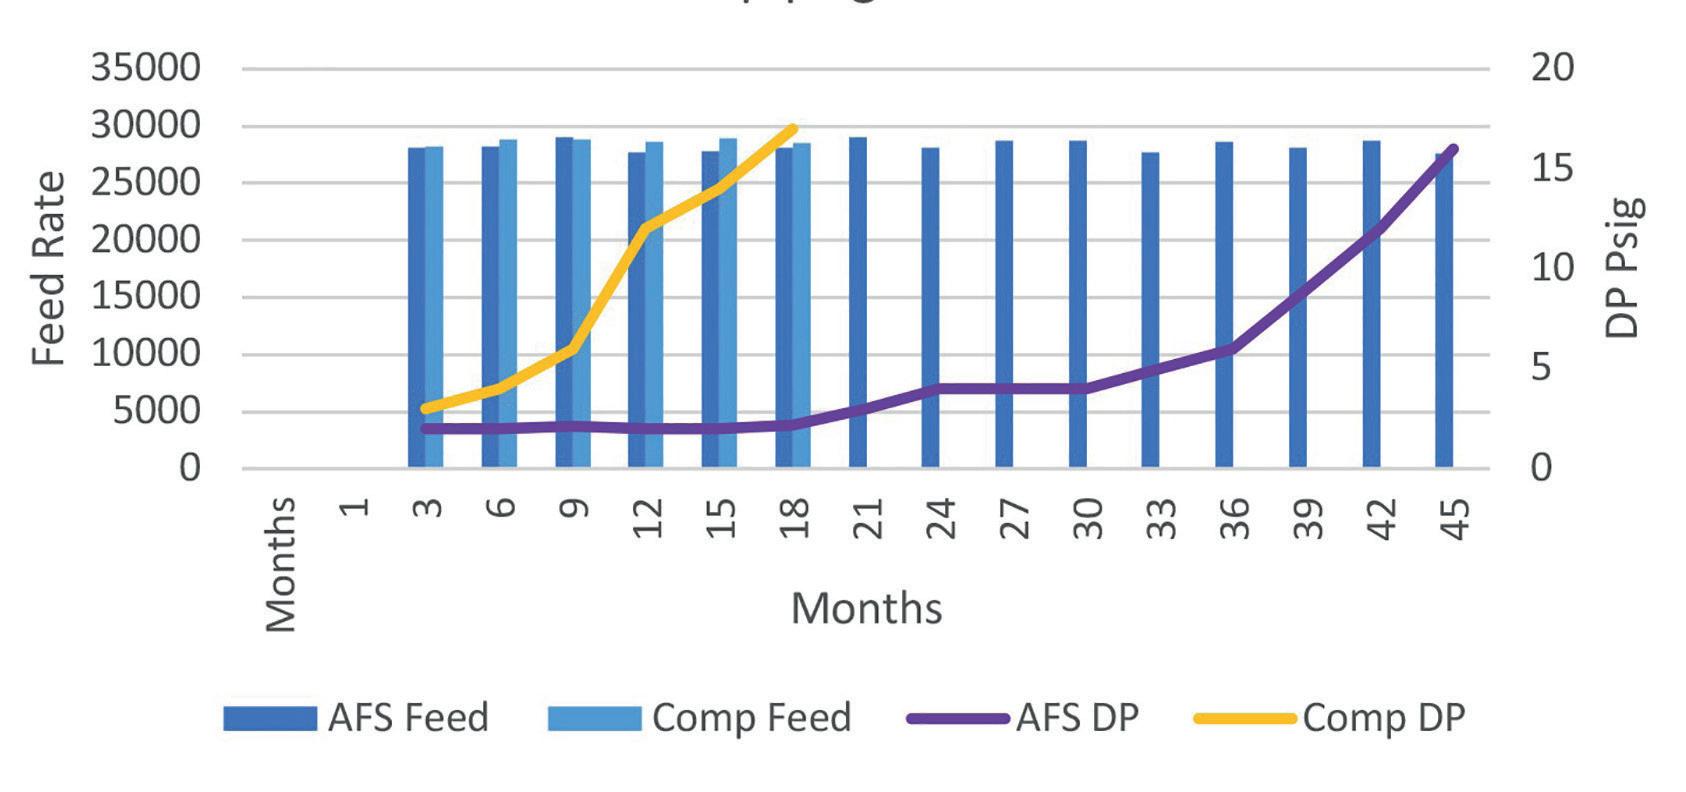
Figure 4. Case study: reactor pressure drop with similar feed rates and properties. SOR pressure drop significantly lower compared to the competition, leading to longer cycles and improved profitability.

lifetimes of advanced catalysts required for such hydroprocessing reactors, maximising the protection of the catalyst bed becomes even more essential. Additionally, the possibility of introducing new contaminants associated with bio-feeds requires careful consideration of the incumbent grading system before commencing such feed processing, such as oxygenates, gums, coke particles from pyrolysis, and other particulate material.

Conclusion
AFS is an advanced filter technology that can help refiners achieve significantly longer run lengths (Figure 3), lower dP (see Figures 3 and 4), better catalyst conversion retention, improved radial heat profiles (Figure 5), and increased reactor throughputs. This can apply to refiners processing both conventional crude based feeds and bio-based feeds, where challenges may be different, but the solution can be straightforward and cost-effective.
The technology can be applied in any fixed bed reactor or can be provided in flexible, skid-based units to treat flows ahead of a main reactor bed. This second option provides an opportunity to physically separate grading layers from the catalyst bed, allowing greater volumes of catalyst to be loaded to the main reactor, and contaminant management to be conducted more effectively and online, without interruption to the process. While achieving significantly longer run lengths, shorter turnarounds, and less catalyst wastage (i.e., costs), UNICAT supports refiners optimising their reactor loading designs through consecutive cycles to ensure the grading system remains functioning in the best way possible for the operator.


REMBE® Your Specialist for Pressure Relief Solutions. © REMBE® | All rights reserved rembe.com hello@rembe.com 9567 Yarborough Rd. | Fort Mill, SC 29707, USA T +1 704 716 7022 hello@rembe.us
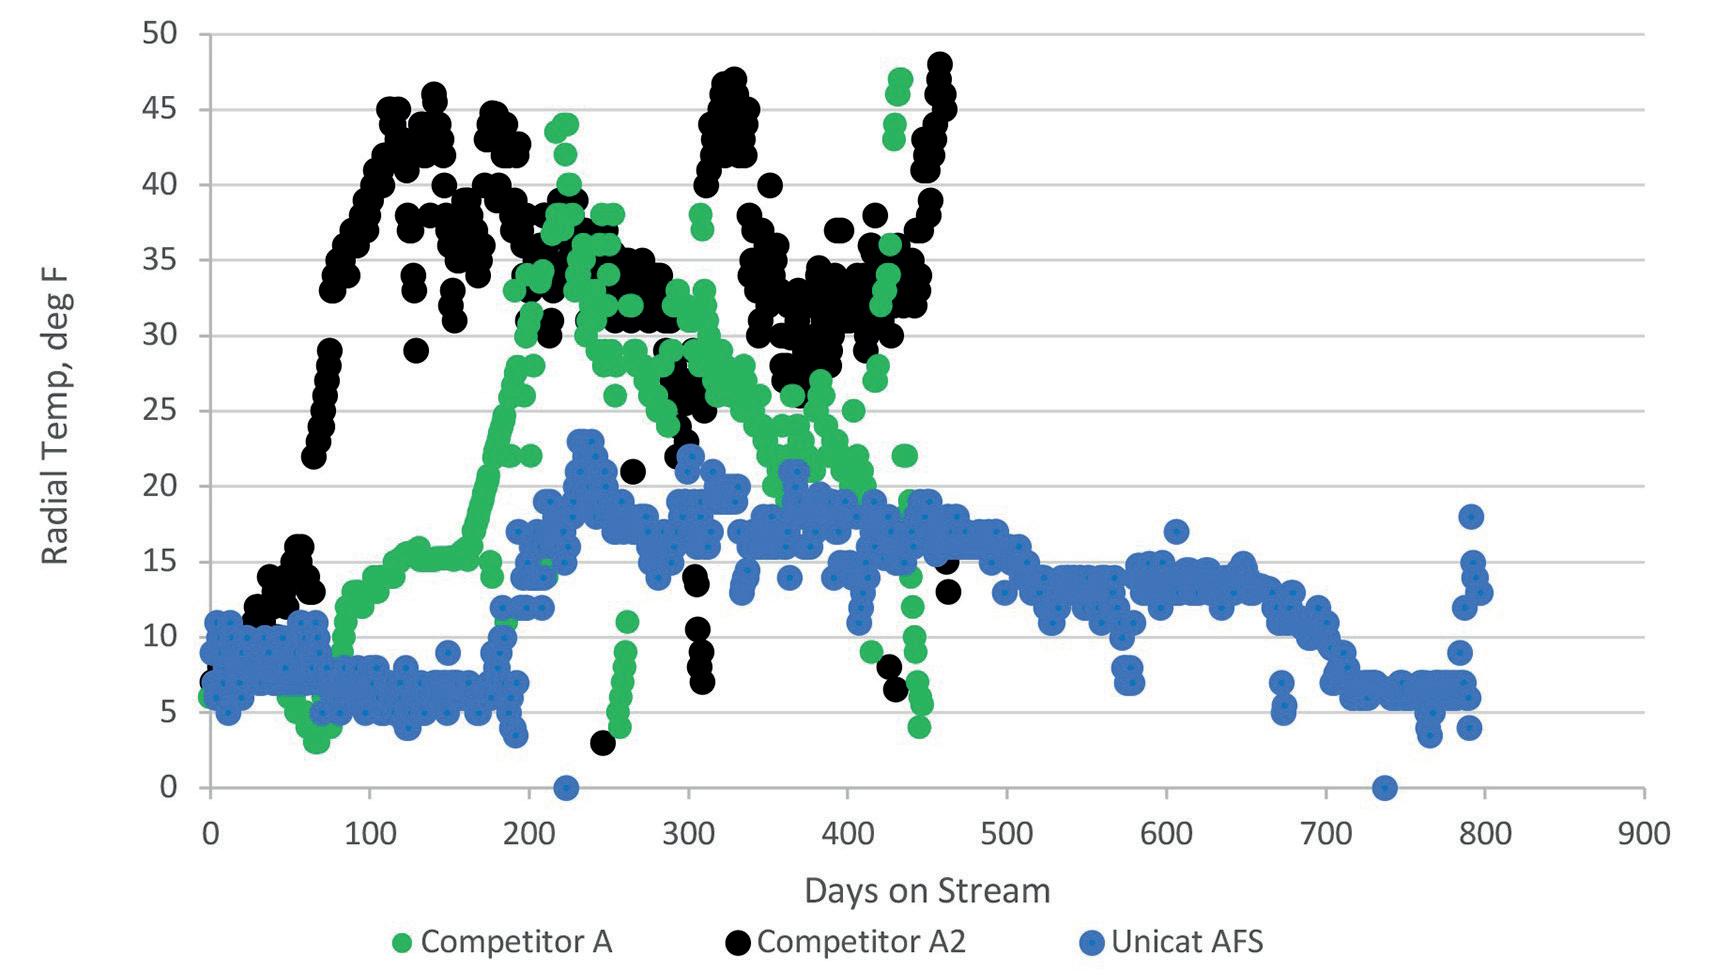
Figure 5. Radial temperature profile: AFS vs reticulated grading. Radial temperatures are mitigated with AFS compared to other advanced grading technologies. In this application, AFS also gave significantly longer cycle length at 800 days vs other runs with alternative technology at under 500 days.
Fluidised catalytic cracking units (FCCUs) are a major source of global butylenes production, and global butylene consumption is expected to continue growing over the course of the coming years. Alkylate produced from butylenes offers a high value gasoline blending stock, as well as a raw material to produce petrochemicals. BASF reviewed the objectives of hundreds of global FCCU operations between 2018 and 2021, and observed that 40% of FCCUs identified increased LPG olefin yields in their objectives.1 FCCUs in North America clearly displayed the highest preference for butylenes over other LPG components. As the demand for butylenes has grown, new FCCU catalyst technologies have been developed to address this challenge and increase butylenes yields from FCCUs. This article will describe the challenges associated with the maximisation of butylenes yields in FCCUs which process resid feeds. These challenges include: elevated levels of nickel and vanadium in the feed; the need to balance high yields of olefins with the maintenance of catalyst activity; and the difficulty of upgrading heavy FCCU feed molecules. Various types of FCCU catalyst functionalities designed to help overcome these challenges, developed through collaboration with key refinery partners, will be discussed. Finally, a case study of a commercial refinery trial of the BASF Fourtitude catalyst will be presented. This is the

September 2023 21 HYDROCARBON ENGINEERING
Modesto Miranda Lopez, Hernando Salgado, Aaron Liew, Emmanouil Smaragdis and Corbett Senter, BASF, outline the challenges of maximising butylenes from residual feeds, and the importance of novel catalyst technology.
third catalyst that has been introduced to the market using BASF’s Multiple Framework Topology (MFT) technology. The catalyst trial demonstrates how various catalyst functionalities can be combined to maximise yields and selectivity of butylenes from residual feedstocks.
Challenges of maximising butylenes from residual feeds
Designing a catalyst for butylenes maximisation in an FCCU that processes high levels of metals in its feed has a number of challenges associated with it. First, there should be a balancing act between the catalyst stability and the olefin selectivity. For example, rare earth oxides play a key role in catalyst stability. Increasing the rare earth content on zeolite in the catalyst will increase catalyst stability. However, increasing rare earth content on zeolite also increases the rate of hydride transfer reactions in the FCCU riser. This leads to a decrease in the yields of olefins from the FCCU, including butylenes.
Multipleframeworks

The second challenge is effectively dealing with elevated levels of metals present in the FCCU. The two most common contaminants are nickel, which increases hydrogen and coke yields, and vanadium, which primarily reduces catalyst activity through zeolite destruction. Using effective metals passivation technologies is crucial to effectively dealing with these contaminants. However, this is not always a straight-forward task, as nickel exists in different states, is immobile, and can be reactivated by Cl contaminant.2,3 On the other hand, vanadium is highly mobile in the FCCU environment and never truly deactivates as a contaminant.4 Therefore, careful consideration should be made regarding the strength and type of metal passivation technology. Finally, the appropriate amount of zeolite and matrix phases should be chosen so that bottoms upgrading and butylenes production can be maximised.
Catalyst development and solution
Fourtitude is a recent innovation that combines MFT with metal passivation technologies to offer advanced products for butylenes maximisation in FCCUs which process metals-containing, resid feed. The balance of all of these factors can be seen in Figure 1. The appropriate combination of MFT technology with metals passivation technologies comes from knowledge gained through laboratory experimental studies, in-unit catalyst trials, and collaboration with refiners.
As mentioned previously, vanadium and nickel are two of the most ubiquitous contaminant metals in FCCU feeds. Significant research has been carried out to understand the behaviour of nickel in an FCCU. Key findings include the fact that nickel exists in a variety of different oxidation states within an FCCU, is not mobile, and is less active when fully oxidised. The presence of chlorides in an FCCU can also reactivate oxidised nickel.2,3 A combination of boron-based technology (BBT) and specialty alumina is the most effective in passivating nickel. Boron and alumina are highly reactive towards nickel, and boron adds the functionality of being mobile. Consequently, their combination provides a versatile and robust method for dealing with the complexity of nickel contamination. In addition, the in-situ manufacturing method limits the amount of chlorides entering the FCCU with the catalyst and is another key design consideration which plays a role in reducing the impact of nickel.
Vanadium, unlike nickel, is highly mobile and works in combination with sodium to destroy zeolite framework and lower catalyst activity.4 Traditionally, alkali-based technologies, including MgO and CaO were used to passivate vanadium in FCC. However, the presence of sulfur presents challenges in using these alkali-based technologies. MgO and CaO are both highly reactive with sulfur in an FCCU environment, which limits their ability to passivate vanadium.
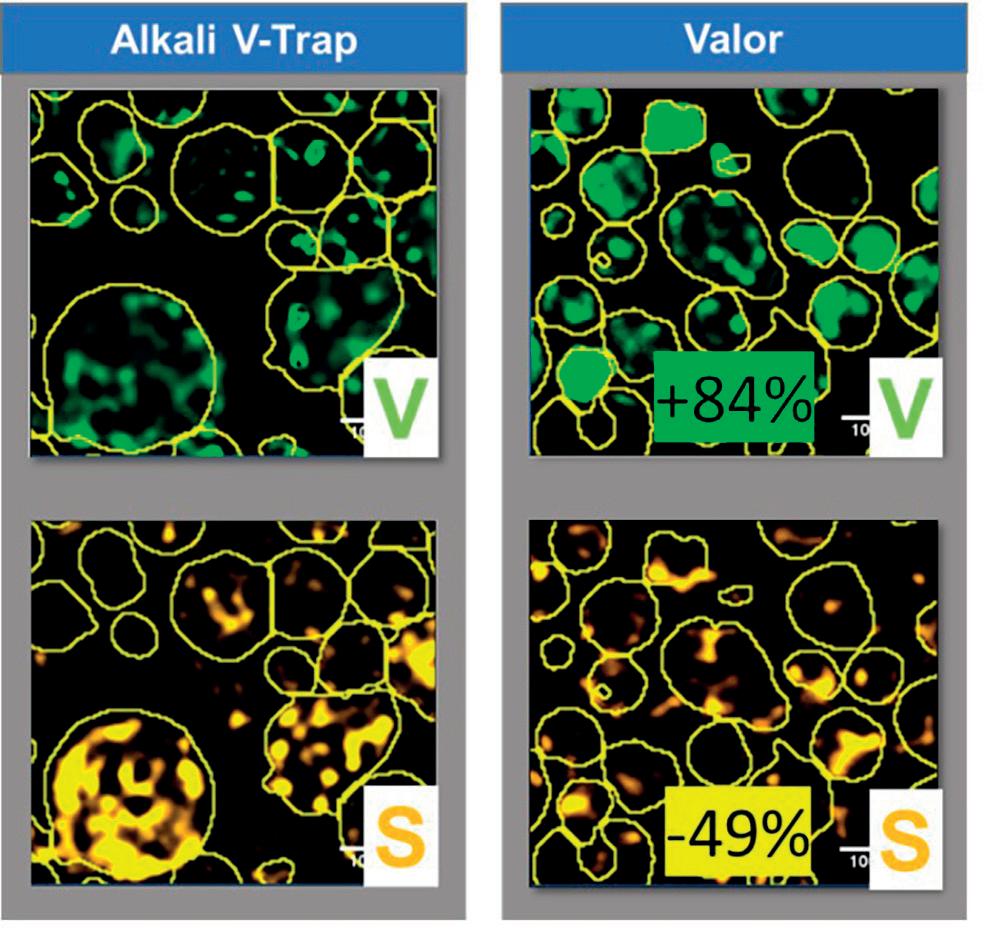
In response, BASF developed Valor, a rare earth-based vanadium passivation technology which shows much stronger tolerance to sulfur and is more effective in mitigating the impacts of vanadium. This improvement can be seen in Figure 2, as Valor shows significantly less sulfur uptake and, consequently, higher vanadium uptake, in a study where two vanadium passivation technologies, Valor and an alkali-based technology, were deactivated in the presence of
September 2023 HYDROCARBON ENGINEERING 22
Figure 1. Technology functions contributing to MFT technology.
High activity Low Acid site density Metal Passivation Ni-Passivation V-Trapping Active matrix
Figure 2. Scanning electron microscope images of vanadium and sulfur concentration of two different vanadium traps, following metalated deactivation. Amount quantified using ImageJ.
Pop-A-Plug ® Tube Plugs


ASME PCC-2 Compliant Heat Exchanger Tube Plugging System


Trusted by plants around the world as their go-to tube leak solution, Pop-A-Plug Tube Plugs from Curtiss-Wright are engineered for optimal performance throughout the life cycle of heat exchanger equipment. Controlled hydraulic installation eliminates welding and time-consuming pre-/post-weld heat treatments that can cause damage to tubes, tube sheet ligaments, and joints.


• No Welding Required
• Pressure Ratings Up to 7,000 PsiG (483 BarG)


• Simple Hydraulic Installation
• Helium Leak Tight Seal to 1x10 -10 cc/sec


• 100% Lot Tested to Ensure Unmatched Quality


• Wide Range of Sizes& ASME/ASTM Certified Materials Available


877.383.1029 l est-sales@curtisswright.com l cw-estgroup.com/he-23
sulfur and vanadium. The use of a secondary zeolitic framework is a strategy that can be used to maximise butylenes selectivity. In the Fourtitude catalyst development process, several potential zeolitic frameworks were screened using rapid laboratory testing to identify candidates that demonstrate improved butylenes selectivity. The best candidates were then further optimised by modifying the chemical and physical properties to further enhance butylenes yield. As a result, prototype testing developed specialty zeolites which could be used to increase butylenes selectivity over propylene while lowering saturates. Additionally, the zeolitic frameworks improved isomerisation of products, increasing gasoline octane values. These frameworks achieved the desired selectivity improvements, without sacrificing catalyst activity, nor generating more hydrogen and coke.
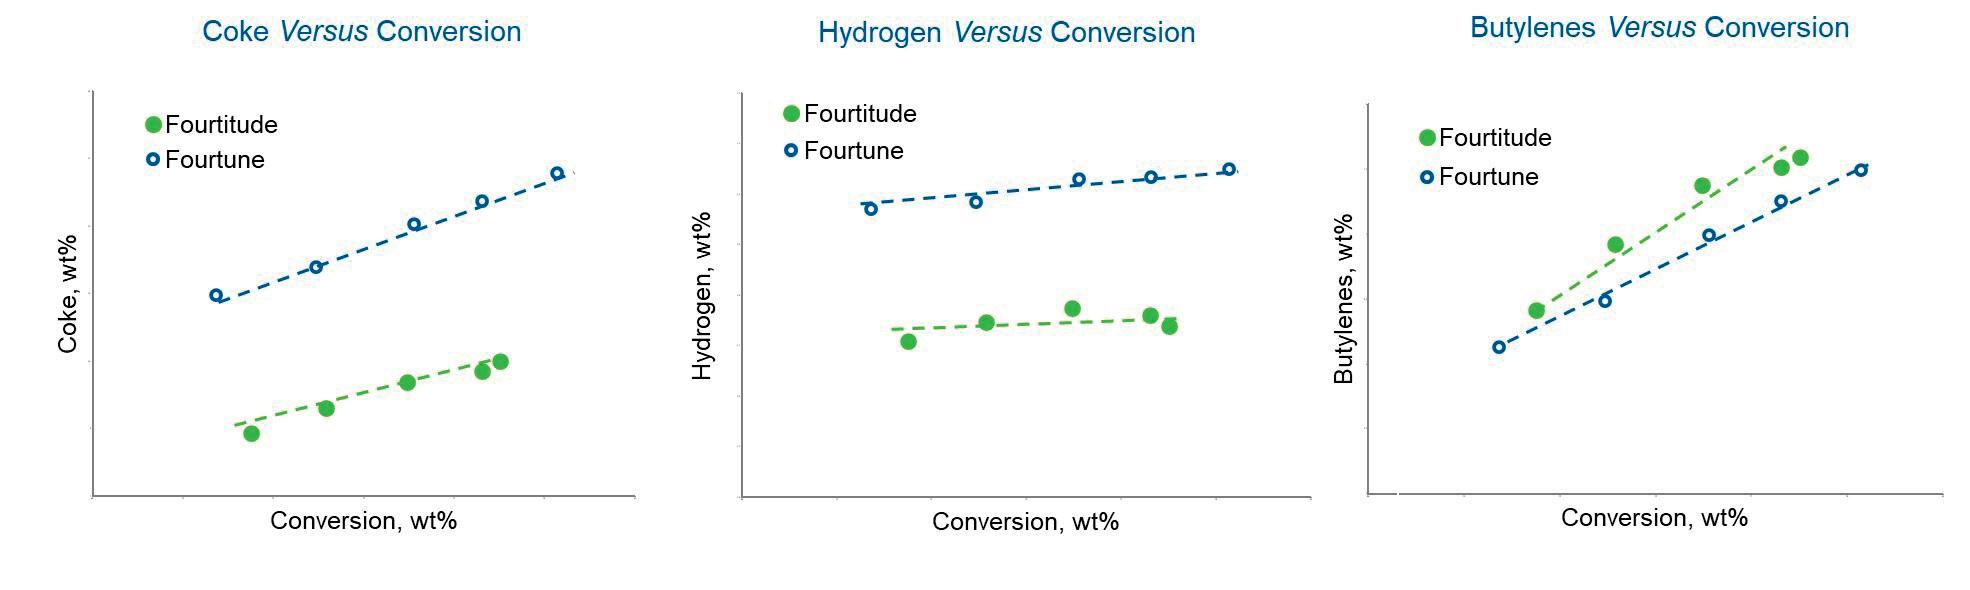
Finally, with identification of the appropriate metal passivation technologies and zeolitic frameworks, significant effort went into combining all of these features into a single catalyst to maximise butylenes yield and selectivity, limit yield of coke and hydrogen, maximise cracking of heavier feed molecules, and maintain catalyst activity. Fourtitude’s improved performance can be seen in pilot-scale testing against a previously developed MFT catalyst, Fourtune, which was designed to maximise butylenes in a non-resid environment (Figure 3). Test results clearly show that Fourtitude is able to maintain, and even slightly improve, butylenes selectivity compared to Fourtune and significantly lower coke and hydrogen yields.
Commercial trial
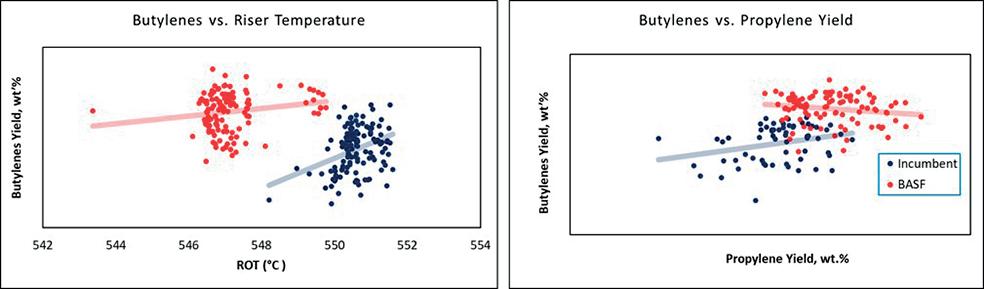
While robust performance in testing is a key step in the development of catalyst technology, catalytic performance must ultimately be demonstrated in commercial operation. An early trial of this catalyst occurred in a Europe, the Middle East, and Africa (EMEA) unit highly integrated with petrochemicals production. They had the objective of maximising butylenes yield, and improving bottoms upgrading, without sacrificing propylene production, and the unit processes a feed with high levels of metals (>3000 ppm NI and > 4000 ppm V on ECAT). The results of the trial can be seen in Figures 4 and 5.
Figure 4 shows FCCU butylenes yields as a function of riser outlet temperature (ROT) and in comparison to propylene yields. The results of the trial indicate that, even at lower ROT, the FCCU was able to achieve approximately 1 wt.% higher yields of butylenes. This data also highlights the improved selectivity to butylenes, as the amount of butylenes produced compared to propylene also increased.
A post-audit of the Fourtitude catalyst trial was performed and the rest of the yield shifts at constant operating conditions can be seen in Figure 5. Once again, a clear increase in butylenes yield and selectivity was seen during the catalyst trial. Both LPG olefins increased as desired by the refinery, but the total LPG did not increase significantly, meaning that invaluable LPG saturate molecules (propane and butanes) decreased during this trial. This is a significant aspect of improving refinery profitability. Naphtha yields also increased as a result of increased conversion due
September 2023 HYDROCARBON ENGINEERING 24
Figure 4. Commercial trial results of Fourtitude vs incumbent catalyst.
Figure 3. Pilot-scale testing of Fourtitude vs. Fourtune catalysts.

2009 Renaissance Blvd., King of Prussia, PA 19046 USA Int’l: +1 610-941-4900 Fax: +1 610-941-9191 PARATHERM RELIABLE CONSISTENT RESULTS Proven, advanced formulations ideal for your processes, industry, and applications. More choices and better choices in heat transfer fluids based on our 35 years experience. www.paratherm.com
to improved activity and activity maintenance provided by the enhanced vanadium tolerance of the catalyst. Furthermore, there was a significant decrease in slurry yields as a result of improved bottoms upgrading. This was proof of both improved matrix functionality and preservation of zeolite from the improved vanadium tolerance, which is important for pre-cracking of heavy feed molecules. All of these changes occurred with a minimal increase in hydrogen yield, a testament to the ability of the catalyst to effectively passivate nickel. Hydrogen yields are also a function of product olefinicity and, in this case, an increase in hydrogen was expected, despite the improved metals passivation. This was due to the significant increase in olefins and decrease in
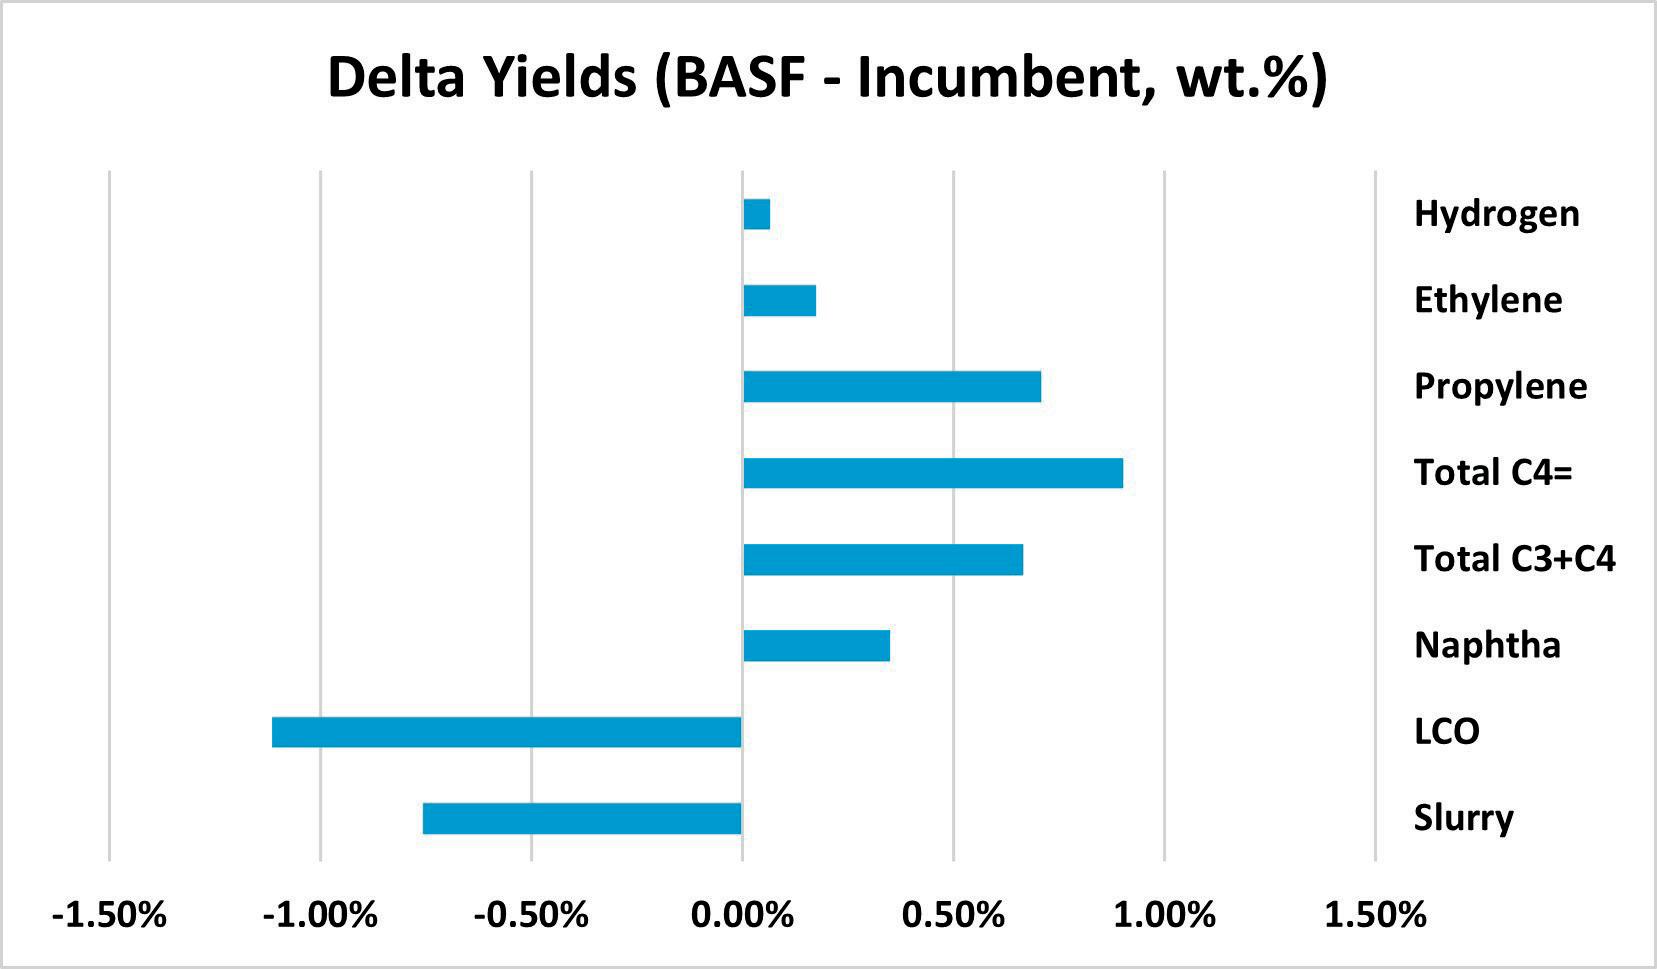
saturates. It was determined that the new Fourtitude catalyst provided an improvement of more than US$0.75/bbl when compared to the incumbent catalyst.
Conclusions
Many FCCUs have a strong incentive to maximise their production and selectivity of butylenes. This incentive is only expected to increase in the future as tighter vehicle standards increase demand for high-octane fuels, and the global demand for petrochemicals increases. As a result, there is a continued need to improve the ways in which butylenes yield and selectivity can be maximised from FCCUs which process residual feed. To achieve this improvement, several challenges must be faced, including overcoming contaminant metals, identifying appropriate zeolite frameworks, and balancing catalyst activity with selectivity. Many years of research and development, alongside collaboration with refiners, has enabled BASF to develop an FCCU catalyst solution which meets these challenges.

References

1. BASF survey based on request for proposal data received during 2018 - 2021 period.
2. CHARISTEIDIS, I.D., et. al.,‘Characterisation of Ni-hases and their transformations in fluid catalytic cracking (FCC) catalysts: Comparison of conventional vs boron-based ni-passivation’, Catalysts, (2023).
3. SENTER, C., et. al. ‘Role of chlorides in reactivation of contaminant nickel on fluid catalytic cracking (FCC) catalysts’, Applied Catalysis A: General, 611, (2021).
4. XU, X., et. al. ,‘Pathways for Y zeolite destruction: The role of sodium and vanadium’, J Catal, 207, (2002).
Figure 5. Summary of yield deltas of Fourtitude compared to incumbent catalyst.
Separation technology is a critical part of the downstream oil and gas industry, as it is used to separate the various components of crude oil and natural gas into different products. Some of the key areas where separation technology is utilised within the industry include:
n Refining: separation technology is used in the refining process to separate crude oil into its various components such as gasoline, diesel, jet fuel, and other fuels. This is achieved by way of distillation, whereby the crude oil is heated and the different components are separated based on their boiling points.
27 September 2023 HYDROCARBON ENGINEERING
Neil Richards, PS Filter, Canada, considers the importance of effective filtration and separation techniques within the downstream oil and gas industry, in order to produce cleaner fuels.
n Petrochemicals: used to separate the various chemicals and compounds that are derived from crude oil and natural gas. This is accomplished through processes such as fractionation and distillation, which allow for the separation of chemicals based on their physical and chemical properties.
n Gas processing: used to separate the natural gas from other gases and impurities, such as sulfur and carbon dioxide (CO 2). This is achieved with absorption and adsorption, which allow for the removal of impurities and the separation of different gases.
n Environmental protection: lastly, separation technology is also used to protect the environment by removing pollutants and contaminants from industrial wastewater and other waste streams. This is carried out through processes such as sedimentation, filtration and adsorption, which allow for the removal of solids, oils, and other contaminants from water and other waste streams.
Both filtration and separation are important processes, but they differ in their approach and in the level of efficiency that they provide.
Filtration is the process of removing solid particles and contaminants from liquids or gases using a porous medium such as a filter. In the downstream oil and gas industry, filtration is used to remove impurities such as dirt, sand and rust particles from crude oil and refined products such as gasoline, diesel and jet fuel. Filtration is typically used for removing larger particulates in the range of 1 – 100 µ m, and it is a cost-effective way of achieving a certain level of cleanliness for the products.
While both filtration and separation are important processes, separation technology is generally more expensive and requires more specialised equipment and expertise than filtration. However, separation technology can provide a much higher level of purity and separation efficiency than filtration, making it essential for many applications in the industry.
Sometimes, filtration and separation terminology are used interchangeably as they can be closely related but, in many cases, they are used in different processes to achieve varying results.
One of the key areas in which PS Filter has utilised effective contamination control (filtration) has been in the amine purification process, to separate solid particulates. When it comes to separation techniques, the company has used carbon adsorption to remove dissolved organics (hydrocarbons) in order to reduce operational and other possible downstream issues.
Amines are designed to remove hydrogen sulfide (H 2S) and carbon dioxide (CO 2) from natural gas. It is a common process that is used in refineries, petrochemical plants, gas processing plants, and other industries.
Effective equipment and media design are two key factors that need to be addressed to ensure that the amine is kept as clean as possible, for optimum performance. PS Filter’s scope of design and supply utilises physical filtration and separation (adsorption) in the amine system in conjunction with one another, to ensure optimum and safe performance. Ultimately, a clean amine system is the goal in order to achieve operational excellence.
Some of the immediate benefits that can be realised are as follows:
n Reduced foaming tendencies (reduced solid and liquid contamination).
n Increased gas throughput (clean amine performs effectively to remove H 2S/CO 2).
n Reduced operational labour and the associated costs related to increased contamination, which are avoided with an effective filtration-separation programme.
n Avoidance of excessive mechanical maintenance from corrosion-erosion contamination.
September 2023 HYDROCARBON ENGINEERING 28
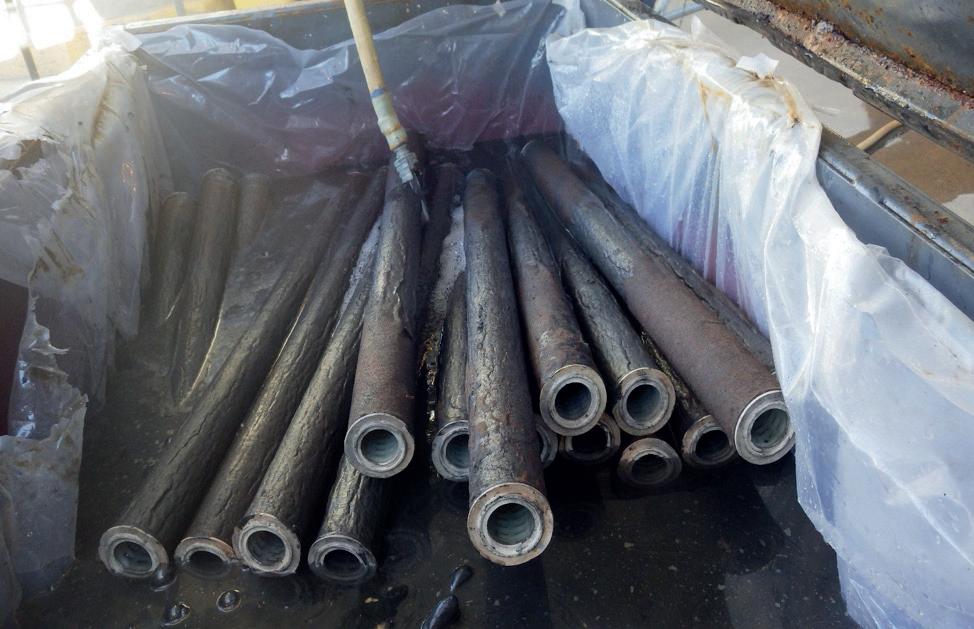
Figure 1. Spent amine cartridges, completely filled with solid contaminants.
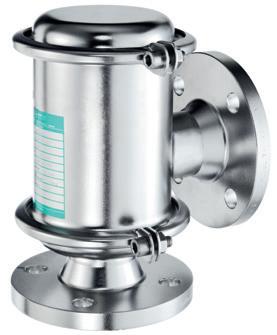
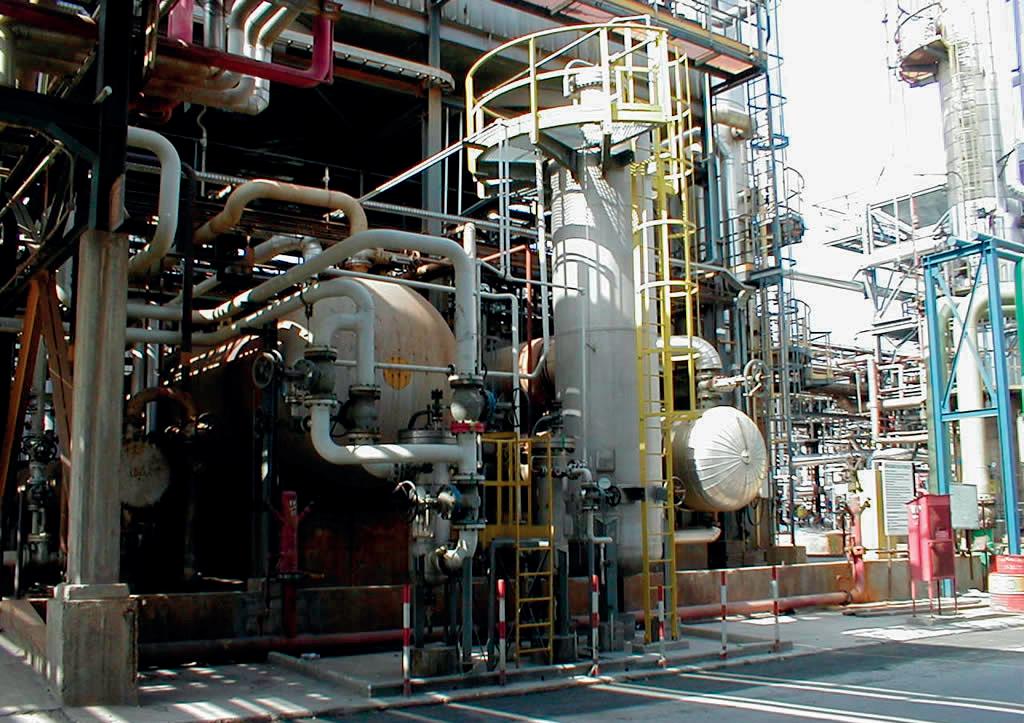
Figure 2. A PS-Filter activated carbon adsorber (separation) amine system.
Meet the BASF Refining experts at AFPM Summit in Grapevine (Texas) from October 3–5 and learn all about Valor ® –our latest vanadium trapping technology.
We look forward to discussing coprocessing renewable and recyclable feedstocks in FCC at the ERTC Annual Meeting in Italy, from November 13–16.
Learn more about BASF Refinery Catalysts


n Reduced disposal costs of spent products (less severe environmental impact).
n Safer operational conditions (reduced operator exposure to hazardous materials).
n Removal of dissolved organics through activated carbon adsorption is of paramount importance in order to reduce the associated costs of chemical addition products such as anti-foam and corrosion inhibitors.
Operating a dirty amine system is never a good idea, and will result in increased costs to the operator. Clean amines should be bright and clear, indicating that the system is in excellent shape. When particulates build up, the amine becomes darker and can get to the point of a translucent black, indicating that processing issues could be on the horizon.
One common problem in gas processing operations is amine foaming. As fine solids build up, the surface tension of the amine changes and foam becomes
stabilised, contributing to reduced throughput for the plant, and the possibility of amine losses with carryover and off-specification gas downstream of the contactor.
Common contaminants in an amine system are iron sulfide particulates, and these can build up from a combination of factors, namely inadequate filtering. A minimum 10% of the amine should be filtered, and this is usually carried out with two filters piped in parallel, so that one filter can be serviced while the other is running, in order to maintain a constant filtering operation.
In addition to effective particulate filtration in the amine system, it is important to have an adequately sized charcoal adsorber system in the loop in order to adsorb dissolved organics such as hydrocarbons that can also contaminate the amine and contribute to the foaming tendency. It is also critical to note that only filtered amine should flow through the charcoal adsorber, and the effluent from this system should be filtered to ensure the capture of any carbon fines that could possibly migrate downstream and also contribute to foaming and other mechanical issues.
Some guidelines to help reduce amine foaming are to ensure that the filter-separation system is designed to meet the process flow rates and is effective to remove the particulates that can contaminate and build up in an amine system, leading to a plethora of problems that multiply over time.
If a filter system is undersized or uses filters that are not sufficient to remove the particle size of contaminants in the 10 µ m range, an operator may be unknowingly contributing to amine foaming.
To provide an effective filtration-separation system for the amine process, PS Filter utilises proprietary mechanical and adsorption medias to optimise performance based on the specific process conditions. It is important to work together with clients to understand their goals and expectations.
The energy industry is unique, as the products are ubiquitous and can enhance and enrich the lives for all the inhabitants on the planet.
Former Harvard Professor, Theodore Levitt, summarises the benefit of working together in unison for a common goal: “Sustained growth depends on how broadly you define your business and how carefully you gauge your customer needs”. Responsible and operationally-effective downstream energy production with effective filtration-separation is just one example in a complicated industry.
In collaboration with global partners, PS Filter is continuously evolving to utilise innovative and effective filtration and separation medias that are efficient and cost-effective. The goal is to improve operational and safe processes by providing the lowest cost per pound (lb) of contaminant separation. Working with clients, the company utilises various weighted criteria that they deem important for their specific production processes.
September 2023 HYDROCARBON ENGINEERING 30
Innovation feasibility criteria Applicability to this innovation Weighting of criteria’s importance (%) Improve operations Save costs by reducing operational labour costs 5 Reduce filtration costs Reduce physical number of filters used and total costs reduced based on comparable number of units 5 Reduce mechanical costs Reduce costs on rotating equipment and other process equipment in the system 5 Improve plant throughput Increase sales revenue and hence improve the bottom line 20 Extraneous variables Reduce chemical costs (solvent replacement, etc.) 5 Fewer disposal costs Reduce the amount of used product to be disposed and hence reduce overall disposal costs 10 Improve safety Reduce worker exposure time and frequency to hazardous material 50 Total weighting of all criteria 100
Table 1. Innovation feasibility: a summary
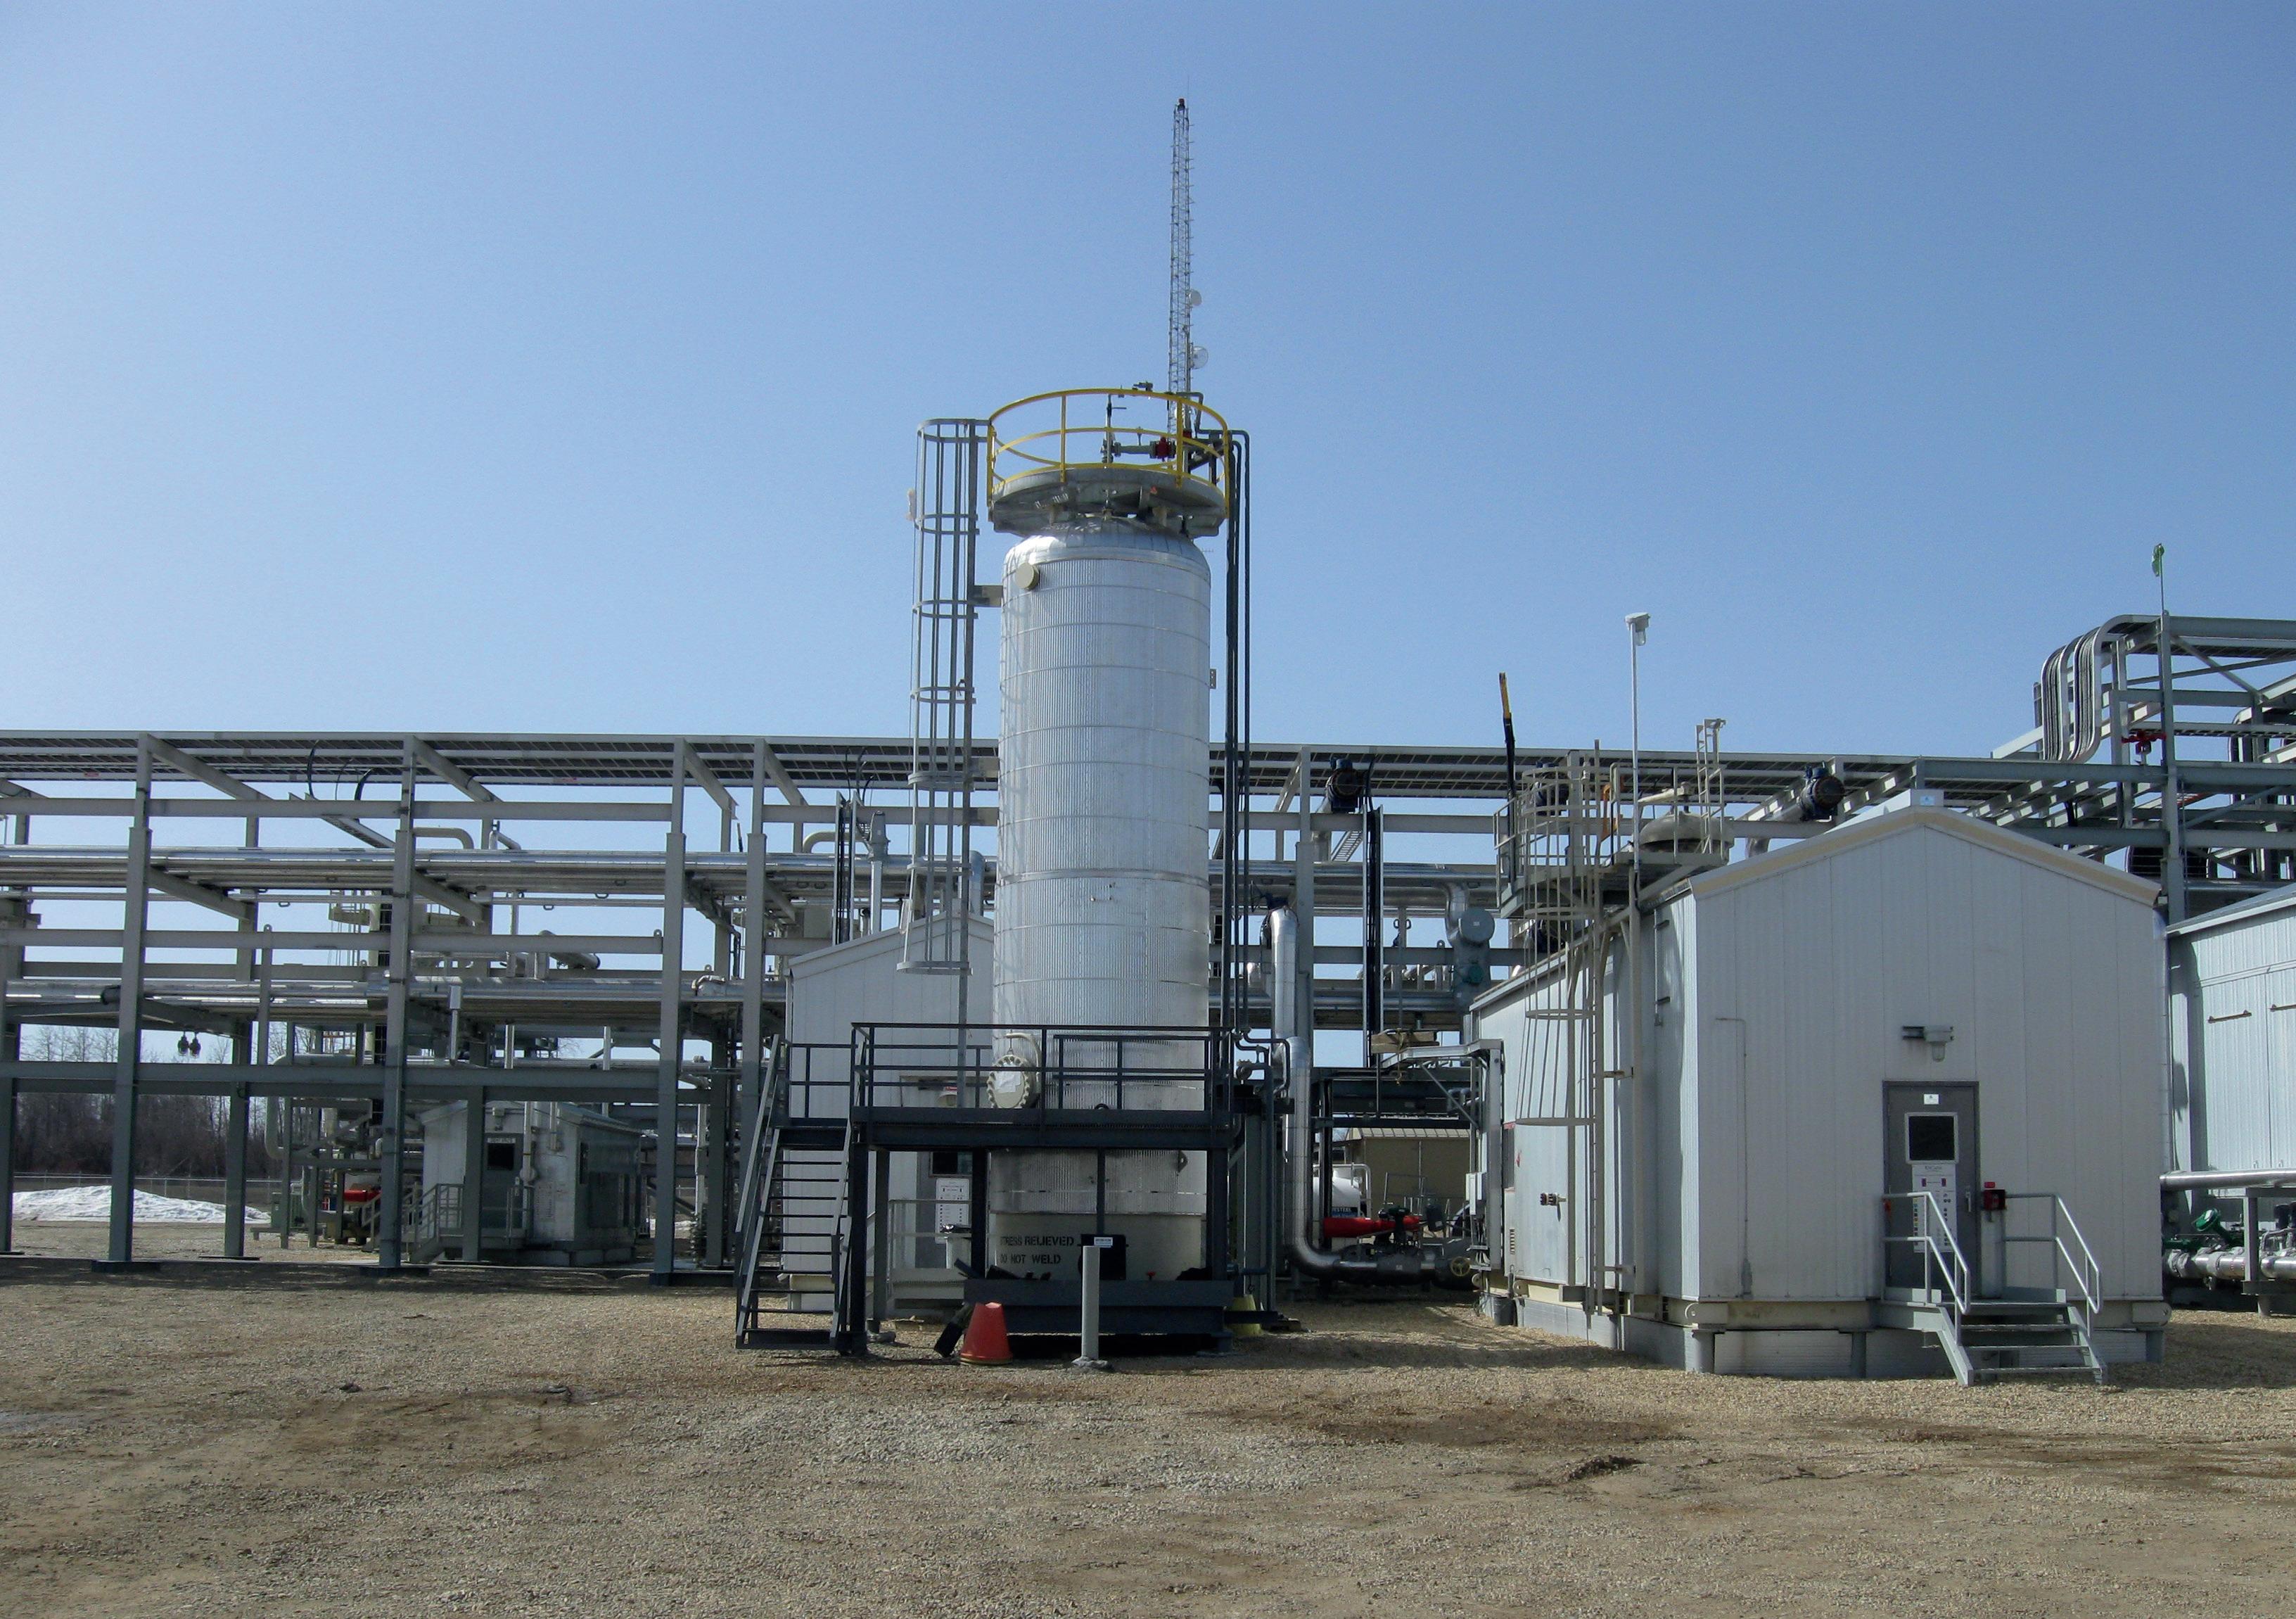
Figure 3. Amine gas treatment within a refinery.
Aadam F. Aryan, Distillation Equipment Company Ltd, UK, discusses the selection of appropriate feed arrangements for two-phase feeds, and lists several industrial examples.
Many a column has been bottlenecked by a poor or completely incorrect feed arrangement, particularly where two-phase feeds are concerned. Selecting an appropriate arrangement not only increases the capacity of a column, but also enhances its efficiency. This article will outline some industrial examples, with relevant design guidelines.
There is no one solution that fits every scenario. What is feasible for a new column may not be possible for an existing one. Additionally, whether the column is packed or trayed will influence the decision making. Last but not least, the feed location – top, intermediate or at the bottom of the column – should also be considered.
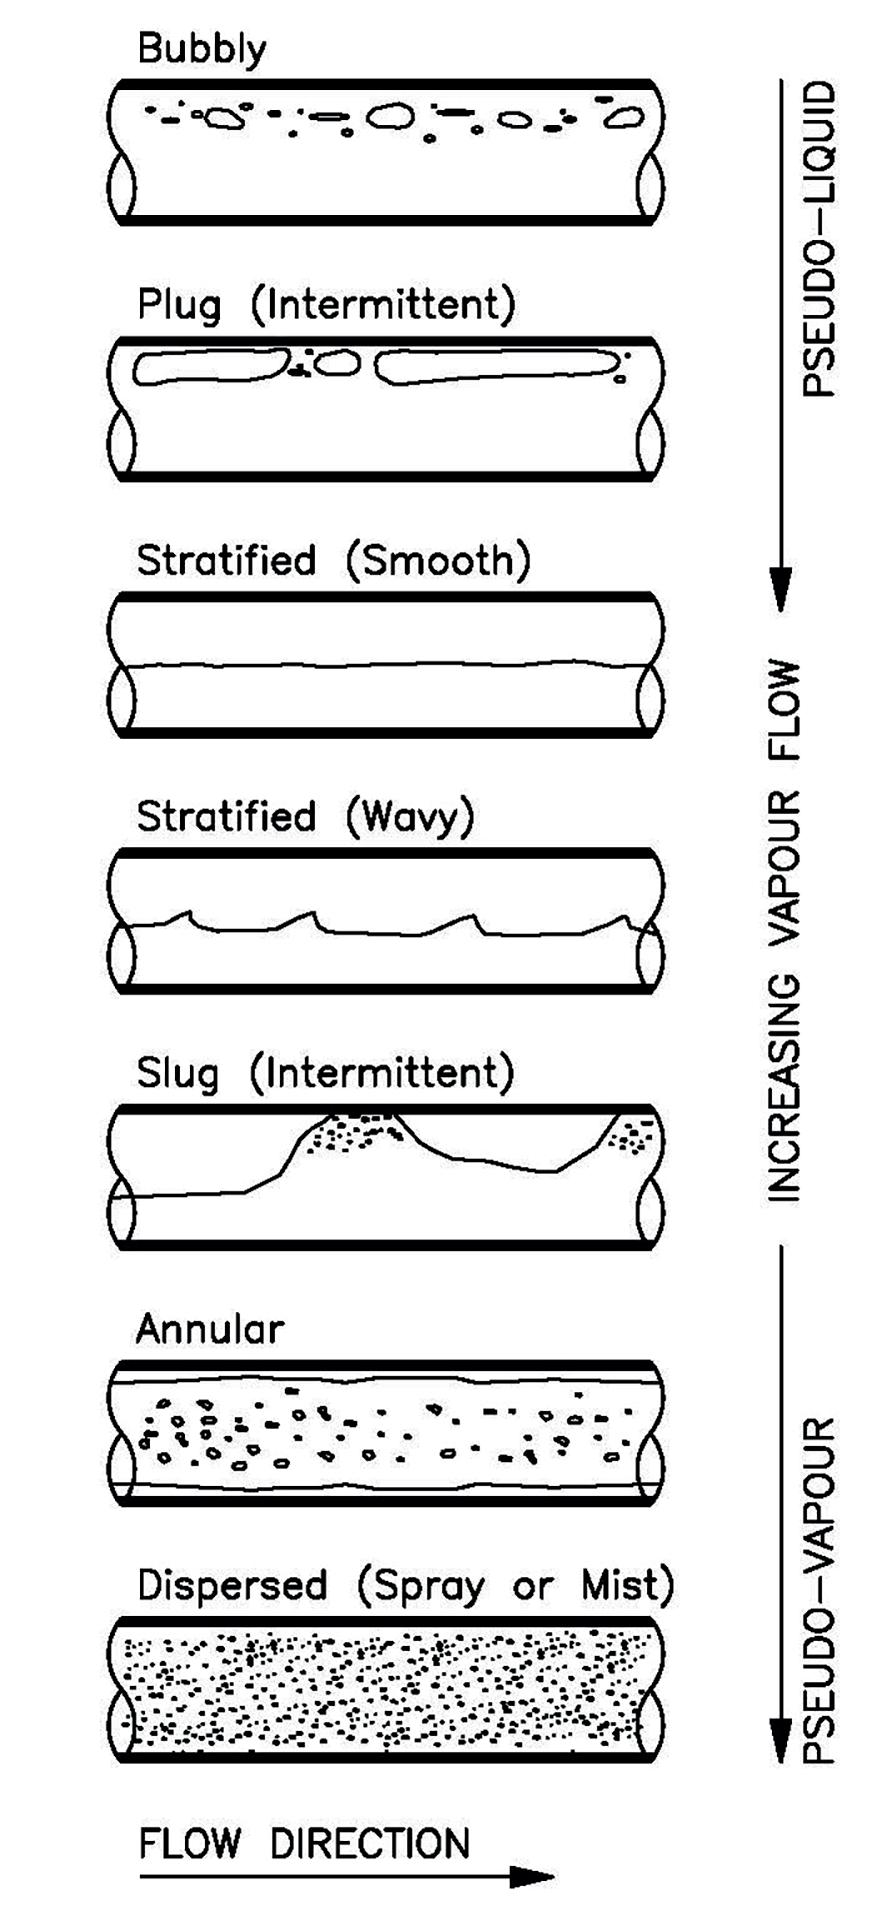
Flow regimes

In horizontal pipes, the flow regimes that can exist for two-phase flow are shown in Figure 1 (in order of increasing vapour flow). The flow regime depends on the flow rates and the properties of the two fluids.
Bubbly flow
At low vapour flow rates, the liquid will occupy the bulk of the cross-section of the pipe. Due to buoyancy, the vapour will flow in the form of bubbles, towards the top of the pipe.
Plug flow (intermittent flow)
As the vapour rate increases, the bubbles will coalesce, forming alternating plugs of liquid and vapour along the top of the pipe. Liquid will remain as the continuous phase along the bottom of the pipe.
September 2023 31 HYDROCARBON ENGINEERING
Stratified smooth flow
As the vapour rate increases further, the vapour also becomes a continuous phase. Vapour will flow at the top of the pipe, whilst liquid occupies the bottom.
Stratified wavy flow
As the vapour rate increases even more, since vapour moves appreciably faster than the liquid, the resulting friction at the interface between the two forms liquid waves. The wave amplitude increases proportionally to the vapour flow.
Slug flow (intermittent flow)
At a certain critical value of vapour flow, the crests of the liquid waves reach the top of the pipe, forming alternating frothy liquid slugs and vapour slugs. The velocity of both slugs will be greater than the average liquid velocity. Where a vapour slug occurs, the liquid level will be depressed such that vapour occupies a large part of the cross-section of the pipe.
Annular flow
At high vapour rates, the liquid flows as an annular film of varying thickness along the wall, while the vapour flows as a high speed core down the middle. Under these conditions, there is substantial slip between the phases. Part of the liquid is sheared off from the film by the
vapour, creating entrained liquid droplets along the core of the pipe. Simultaneously, turbulent eddies in the vapour will deposit droplets onto the liquid film. Due to gravity, the liquid film will be thicker at the bottom of the pipe than at the top.
Dispersed flow
Dispersed flow is also known as spray flow or mist flow. At very high vapour rates, the vapour velocity in annular flow becomes so high so that all the liquid film is torn away from the wall and is carried by the vapour as entrained droplets.
Flow regime maps
Understanding which flow regime is present assists the engineer in the design of an appropriate two-phase feed distributor. A number of flow regime maps have been published, however the maps do not necessarily agree with each other. One of the earliest and most widely used maps was created by Baker, as shown in Figure 2.1 Baker based his map on the air-water data of four earlier researchers, and used correction parameters λ and ψ to generalise the map for other fluids:
Where:
ρG = density of gas (vapour).
ρL = density of liquid.
ρair = density of air at ambient conditions.
ρW = density of water at ambient conditions.
μL = viscosity of liquid.
μW = viscosity of water at ambient conditions.
σ = surface tension – system.
σW = surface tension – water.
L = liquid mass velocity.
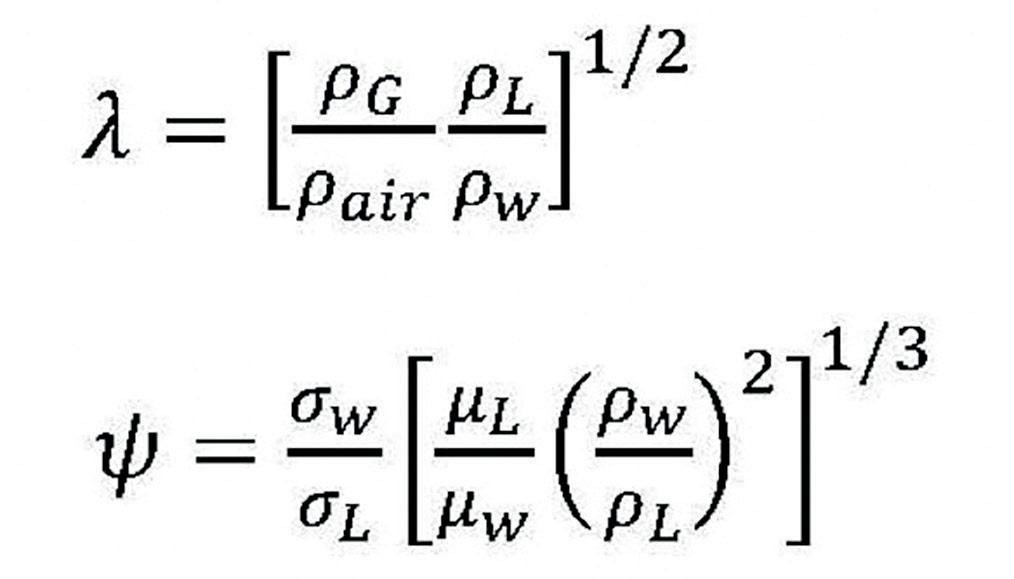
G = vapour mass velocity.
In Figure 2, the demarcation between each zone is distinct, whereas in reality, the change from one zone to another will be diffuse. A more recent map by Mandhane et al (see Figure 3) is based on nearly 6000 data points, generated by other researchers between 1962 - 1973.2 Here, the demarcations between the zones are shown as wider bands. There are also other proprietary maps based on the Froude number.
Stratified flow is desired in the inlet feed pipe. Intermittent flow, either plug or slug – and particularly the latter – should be avoided wherever possible. In the slug flow zone there is severe vibration and erosion. However, since the operating pressure dictates the system properties, the feed pipe diameter is the only parameter that can be changed to alter the flow regime. Where intermittent flow is unavoidable, appropriate mechanical features should be used to mitigate the effects of vibration and erosion.
September 2023 HYDROCARBON ENGINEERING 32
(1) (2)
Figure 1. Flow regimes for two-phase flow in horizontal pipes.
Electrical Tubular Heaters
A Unique Solution to Reduce Emissions
Click here to learn more
Types of two-phase feed distributors
Excluding vapour-horns for crude vacuum columns, there are three main types:
n Vane inlet device (VID): model 760.
n Perforated sparge pipe plus shroud: model 750.
n Flashing gallery: model 740.
VIDs – model 760
For the bottom of a distillation or absorption column, VIDs are an excellent choice of feed distributor. They have been used in many hundreds (if not thousands) of columns. The momentum of the inlet feed is substantially decreased in an incremental manner, by splitting the feed mixture into a series of flat jets. The device also separates solids and liquid from the vapour. A conventional VID will typically remove up to 95% of the incoming liquid.
Design criteria dictating whether or not to use a VID is based on the momentum of the mixed feed coming
through the inlet feed nozzle using the mixed feed properties (see Table 1).
The guidelines in Table 1 assume the mixed flow is uniform coming into the column/vessel. Straight pipe length outside the column should be at least 10x the diameter of the feed nozzle. Even this does not necessarily guarantee a uniform flow. In critical applications, CFD analysis of the feed arrangement should be considered.
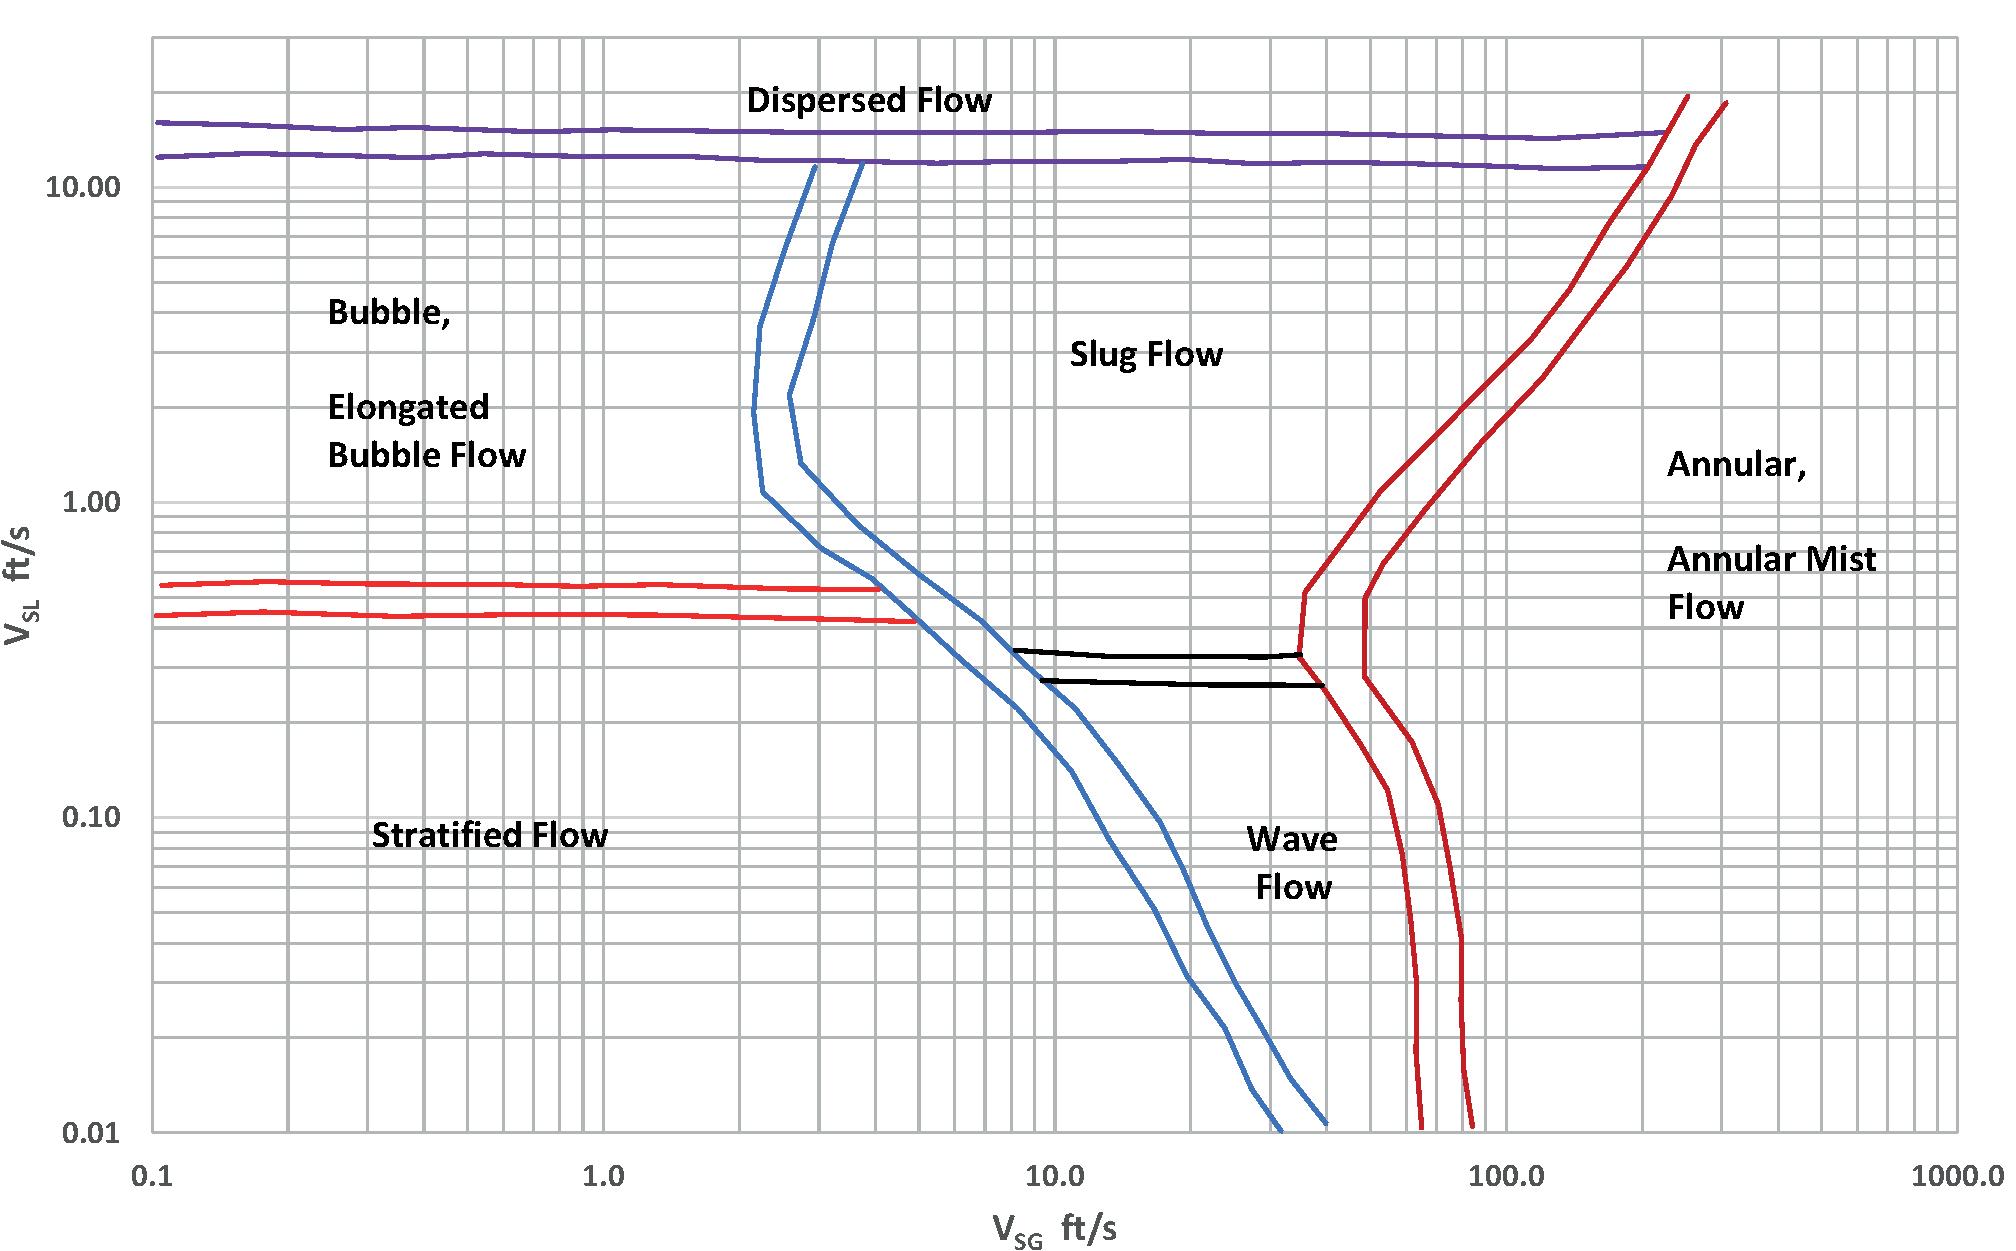
The pressure drop in two-phase flow will be greater than that of either single-phase flow, due to the irreversible work resulting from the vapour on the liquid (e.g. creation of slugs, waves, droplets, etc.) and the fact that the presence of the second fluid reduces the cross-sectional area for flow of the first fluid.
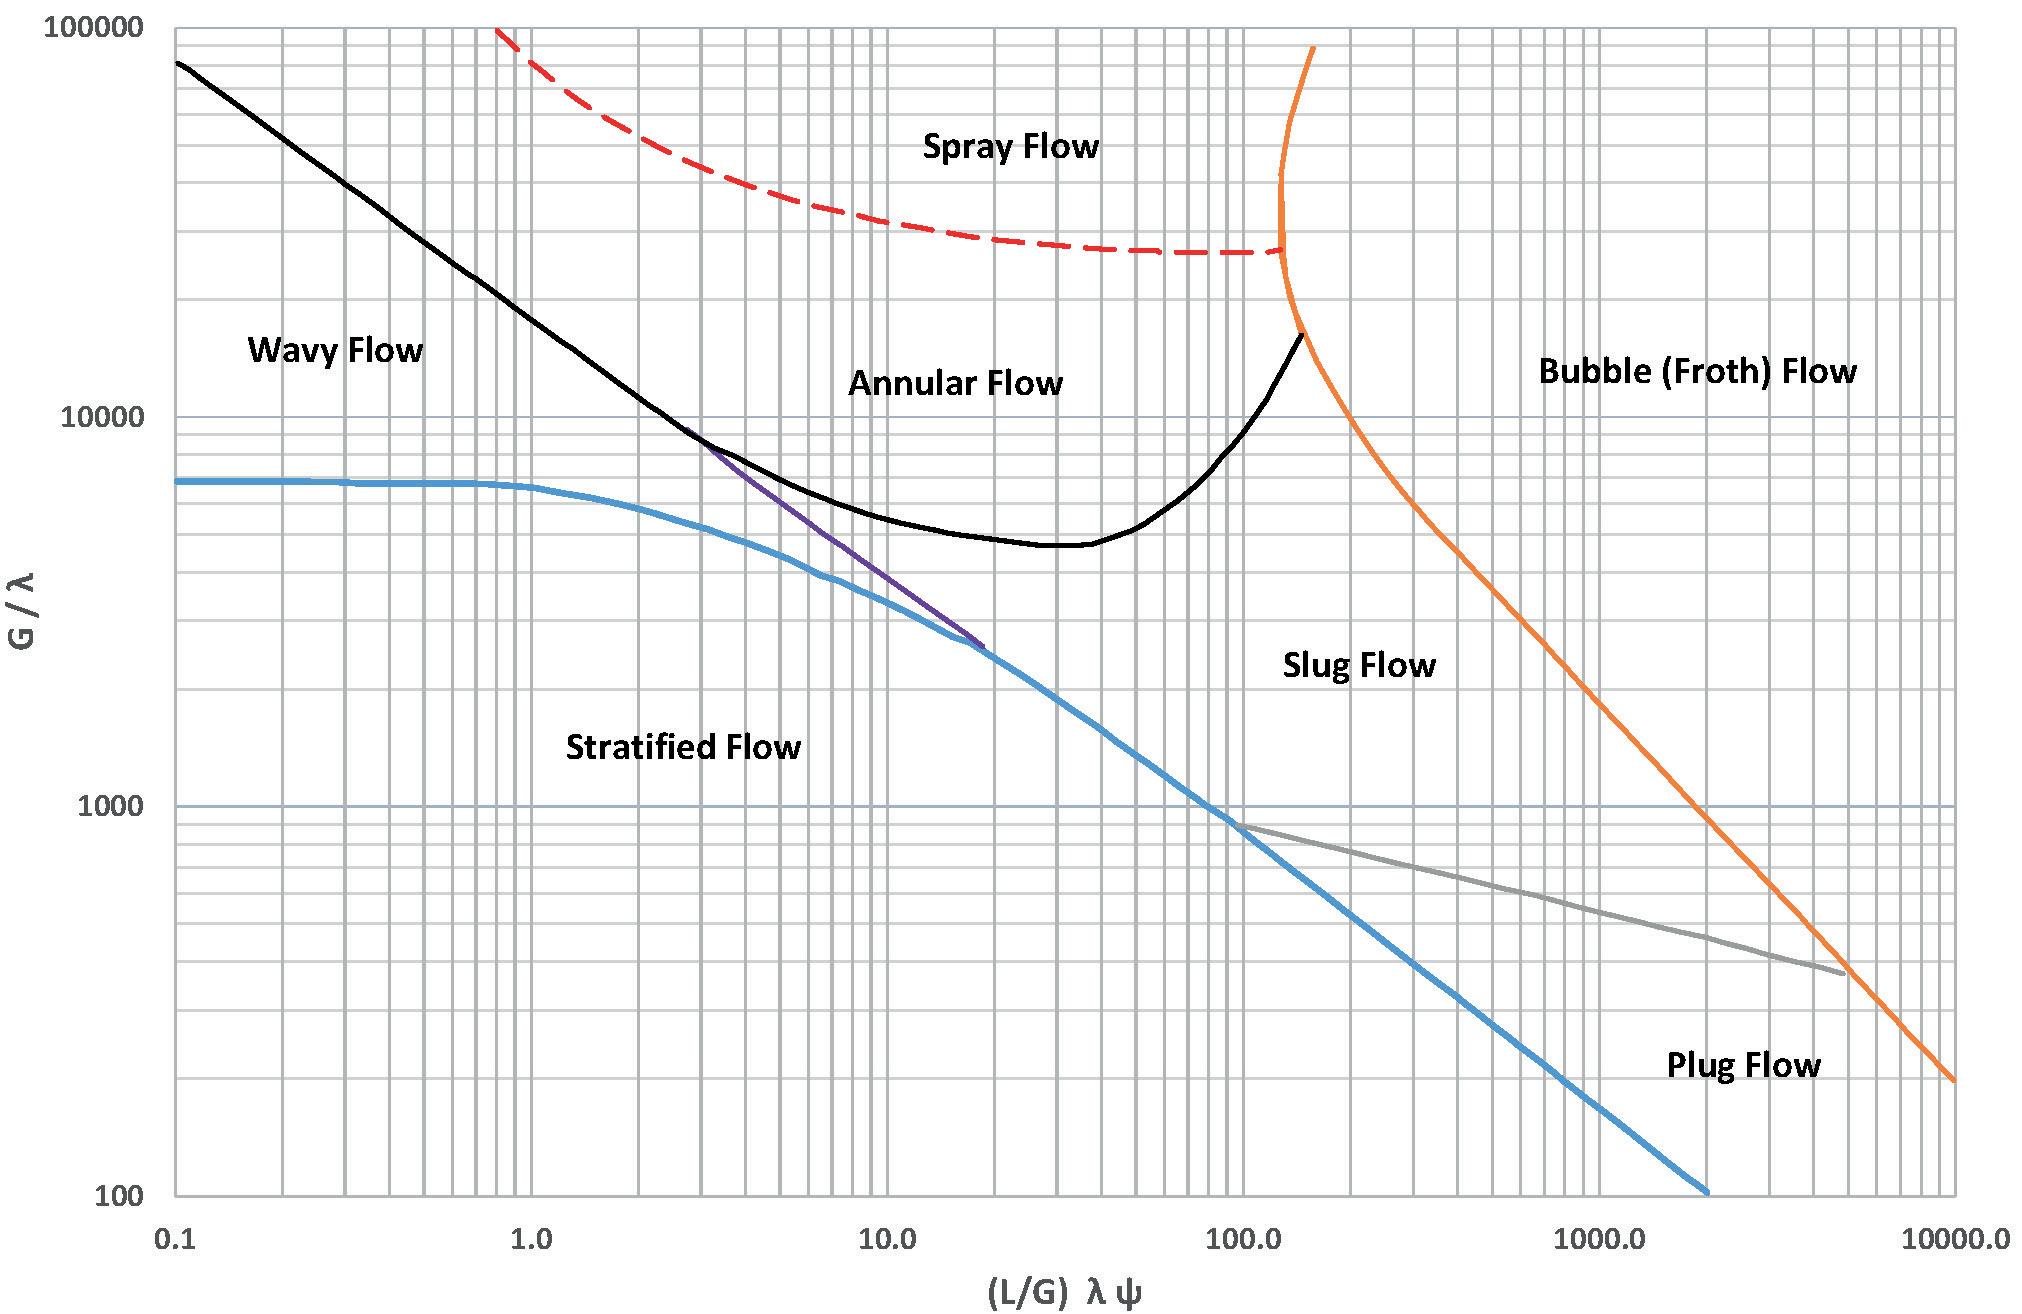
Pressure drop for a half-pipe feed distributor can be calculated by equation 3; and that for a VID by equation 4:
ΔPHP = 0.5 ρmix Vmix (3)
ΔPVID = 0.08 ρmix Vmix (4)
Where:
ΔPHP Pa = pressure drop across a half pipe.
ΔPVID Pa = pressure drop across a VID.
ρmix kg/m3 = mean density of the fluid mixture.
Vmix m/sec. = velocity of the mixture in the inlet pipe.
The pressure drop across a VID is very modest. The low value indicates that it cannot be assumed that a VID will condition the flow. For very critical applications, e.g., packed columns using a shallow packed bed, a chimney tray distributor above the VID and below the packed bed may need to be used. A shallow packed bed is defined as one where the packed bed height is less than the column diameter.3
When designing VIDs, mechanical aspects should be assessed vis-à-vis access through the column manhole. When access to all parts through the column manhole is feasible, a single-tier construction can be used. Where the nozzle size is large or very large compared to the column manhole, a two-tier or three-tier construction may be necessary.
Figure 4 shows a single-tier construction VID for an 18 in. nb nozzle in a 2260 mm dia. column. Design vapour flow 230 990 kg/hr at 35.66 kg/m3; liquid flow 9605 kg/hr at 1111.4 kg/m3
September 2023 HYDROCARBON ENGINEERING 34
Figure 2. Flow regime map for two-phase flow in horizontal pipes –Baker 1954.
Figure 3. Flow pattern map for two-phase flow in horizontal pipes –Mandhane et al 1974.
A long history of looking
AHEAD
For nearly a century, Grace catalysts have kept fuel and petrochemical feedstocks flowing from the industry’s largest refineries to the trucks, trains, planes, and ships that keep our world running.
We are leveraging our long history of innovation in fluid catalytic cracking to develop products that enable lower carbon fuels and help meet the challenges of the energy transition.

grace.com
Perforated sparge pipe plus shroud –model 750
For an intermediate two-phase feed for columns with trays, the perforated sparge pipe plus shroud type, or variation thereof, is an excellent choice.
For the design of perforated pipe distributors, when vapour volume flow is less than 5% it may be treated as pseudo-liquid. Likewise, where the liquid volume flow is less than 5%, it may be considered a pseudo-vapour. For pseudo-vapour flow, the mixture properties are used in pressure drop calculations. For pseudo-liquid flow, the liquid viscosity is used for calculation of the friction factor and mixture properties for all other pressure drop calculations. When the flow is in the two-phase region, a complication
that needs to be addressed is that liquid may preferentially flow through some holes, and vapour through others. As such, it is recommended that manifolds, when used, be uniform in design. A key benefit of this type of distributor is that the separated liquid may be introduced at a specific (controlled) point.
Flashing feed gallery – model 740
Top two-phase feeds in packed columns are commonly handled by a flashing feed gallery. The mixed fluid is made to flow tangentially around a gallery. The separation of liquid from the vapour is enhanced by the centrifugal forces generated. The entry into the column can be through tangential nozzles or radial nozzles. Where the entry is through a radial nozzle, a vane (baffle) deflector will be required on the inside of the column.
The gallery provides some residence time (hold-up) to allow the vapour to disengage from the liquid akin to the downcomers on a crossflow tray. The separated liquid is then fed below the gallery to a distributor or a pre-distributor (parting box). To minimise pressure drop, the central open area is 40 – 50% of the column cross-sectional area. Flashing galleries are usually constructed in a polygonal shape, the number of sides ranging from 6 to 12, depending on the column diameter vis-à-vis the column manhole size.

Case study 1
This case study for a crude stabilisation column is an example of a difficult intermediate feed arrangement that a process engineer is likely to encounter. It is an identical column to that described in Kister by Lakha.4 The emphasis here is on the arrangement rather than the troubleshooting aspects. Figure 5 is a 3D drawing of the arrangement. Design vapour flow 11 495 kg/m3 at 15.37 kg/m3; liquid flow 450 650 kg/hr at 723.2 kg/m3
The column has one-pass trays in the top section (2590 mm dia.) with four-pass trays in the bottom section (4270 mm dia.). The trays are numbered bottom to top. A cone section (2450 mm height) contains the transition from one-pass to four-pass trays, plus an external two-phase feed. Feed tray #25 immediately below the cone section is a four-pass tray with side plus centre downcomers and is rotated 90˚ to the one-pass trays. Hence, the off-centre inlet areas of feed tray #25 are also perpendicular (90˚) to the side seal pan below tray #26 in the top section.

To ensure the efficiency of feed tray #25, the liquid from the seal pan below tray #26 is introduced into the inlet areas of feed tray #25. This is achieved by using pipe downcomers welded to the seal pan. The arrangement is symmetrical, hence the liquid flow from the seal pan is split equally to feed tray #25 inlet areas. To ensure self-venting flow in pipe downcomers, the Froude number should be kept to less than 0.3.
In the transition section there is also an external two-phase feed. Since two 12 in. nb feed nozzles are available outside the column at the correct orientation, straight sparge pipes can be used. If there had been only one feed nozzle, an H-pipe sparge would have been required. To achieve the optimum elevation, a vertical ‘dog leg’ is used to lower the sparge pipes closer to the
September 2023 HYDROCARBON ENGINEERING 36
Type of feed distributor Momentum (kg/m sec2) None < 1400 Half pipe 1400 – < 2100 VID 2100 – 8000
Table
1. Design criteria for mixed (two-phase) feeds
Figure 4. Example VID, 1-tier construction.
Figure 5. An example of a model 750 feed arrangement – 3D image.
PETROLEUM & PETROCHEMICAL CATALYST RECYCLING EXPERTISE
With best-in-class techniques and over seven decades of experience, we deliver the highest possible metal returns for our customers.
We recover and refine precious metals from petroleum catalysts and materials used in processing from various supports, including Carbon, Zeolite, Silica-alumina, and Soluble and insoluble alumina. Also, our proprietary Pyro-Re® process o ers the only pyro-metallurgical recovery of rhenium in the industry. With it, we recover total rhenium content from spent semi-regenerative and cyclic fixed-bed hydrocarbon processing catalysts—and get you a full return.
Find out more about Sabin Metal Corp’s services, operations, and why a partnership with us is the right choice at sabinmetal.com

tray deck. As the feed coming into the column is mixed, a shroud is used to separate the liquid from the vapour, which is then fed correctly to feed tray #25 off-centre inlet areas.
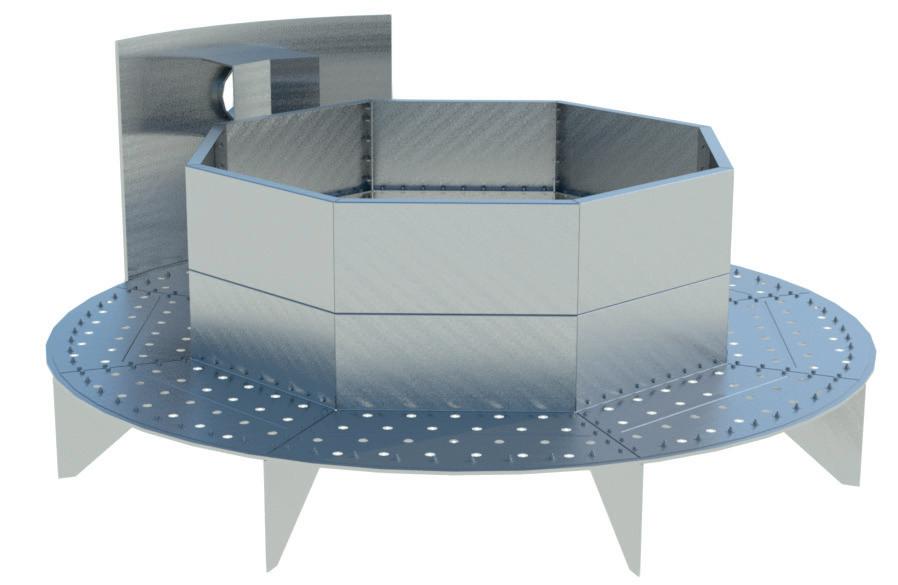
The flow regime in the feed pipes is most likely slug type. Therefore, it is important to prevent damage due to vibration by securely fixing the ends of the pipes. The arrangement shown has been in successful operation for over 20 years.
A variation of the shroud arrangement is to splash the mixed feed against vertical plates. In an earlier article, the author described a case study where the mixed feed was introduced at the side inlet area of a one-pass tray, not only to separate the vapour-liquid mixture, but also to improve the efficiency of the feed tray by utilising all the flow path length of the tray.5 Kister et al described a similar
troubleshooting case study for debottlenecking an FCC debutaniser column by improving the two-phase feed arrangement.6
Case study 2
In many services, mixed feeds are created due to a reduction in pressure across a control valve. In addition, the feed flashes as it enters the tower due to the sudden expansion. An example of this is an amine regenerator (2084 mm dia. with two-pass trays), shown in Figure 6. Design vapour flow 6219 kg/hr at 2.16 kg/m3; liquid flow 186 522 kg/hr at 1031.6 kg/m3. The feed is introduced at penultimate top tray #2, directly above the centre downcomers. Usually, it is not good practice to introduce a feed, single or mixed, directly into a downcomer as the purpose of a downcomer is to disengage vapour from liquid. However, top tray #1 (with side pipe downcomers) is a wash tray. Hence, the liquid rate coming from tray #1 is very low (less than 3%), compared to the liquid being introduced through nozzle A1. In effect, tray #2 centre downcomer can be considered a ‘false downcomer’. Tray #2 being operated in this manner is also a wash tray.
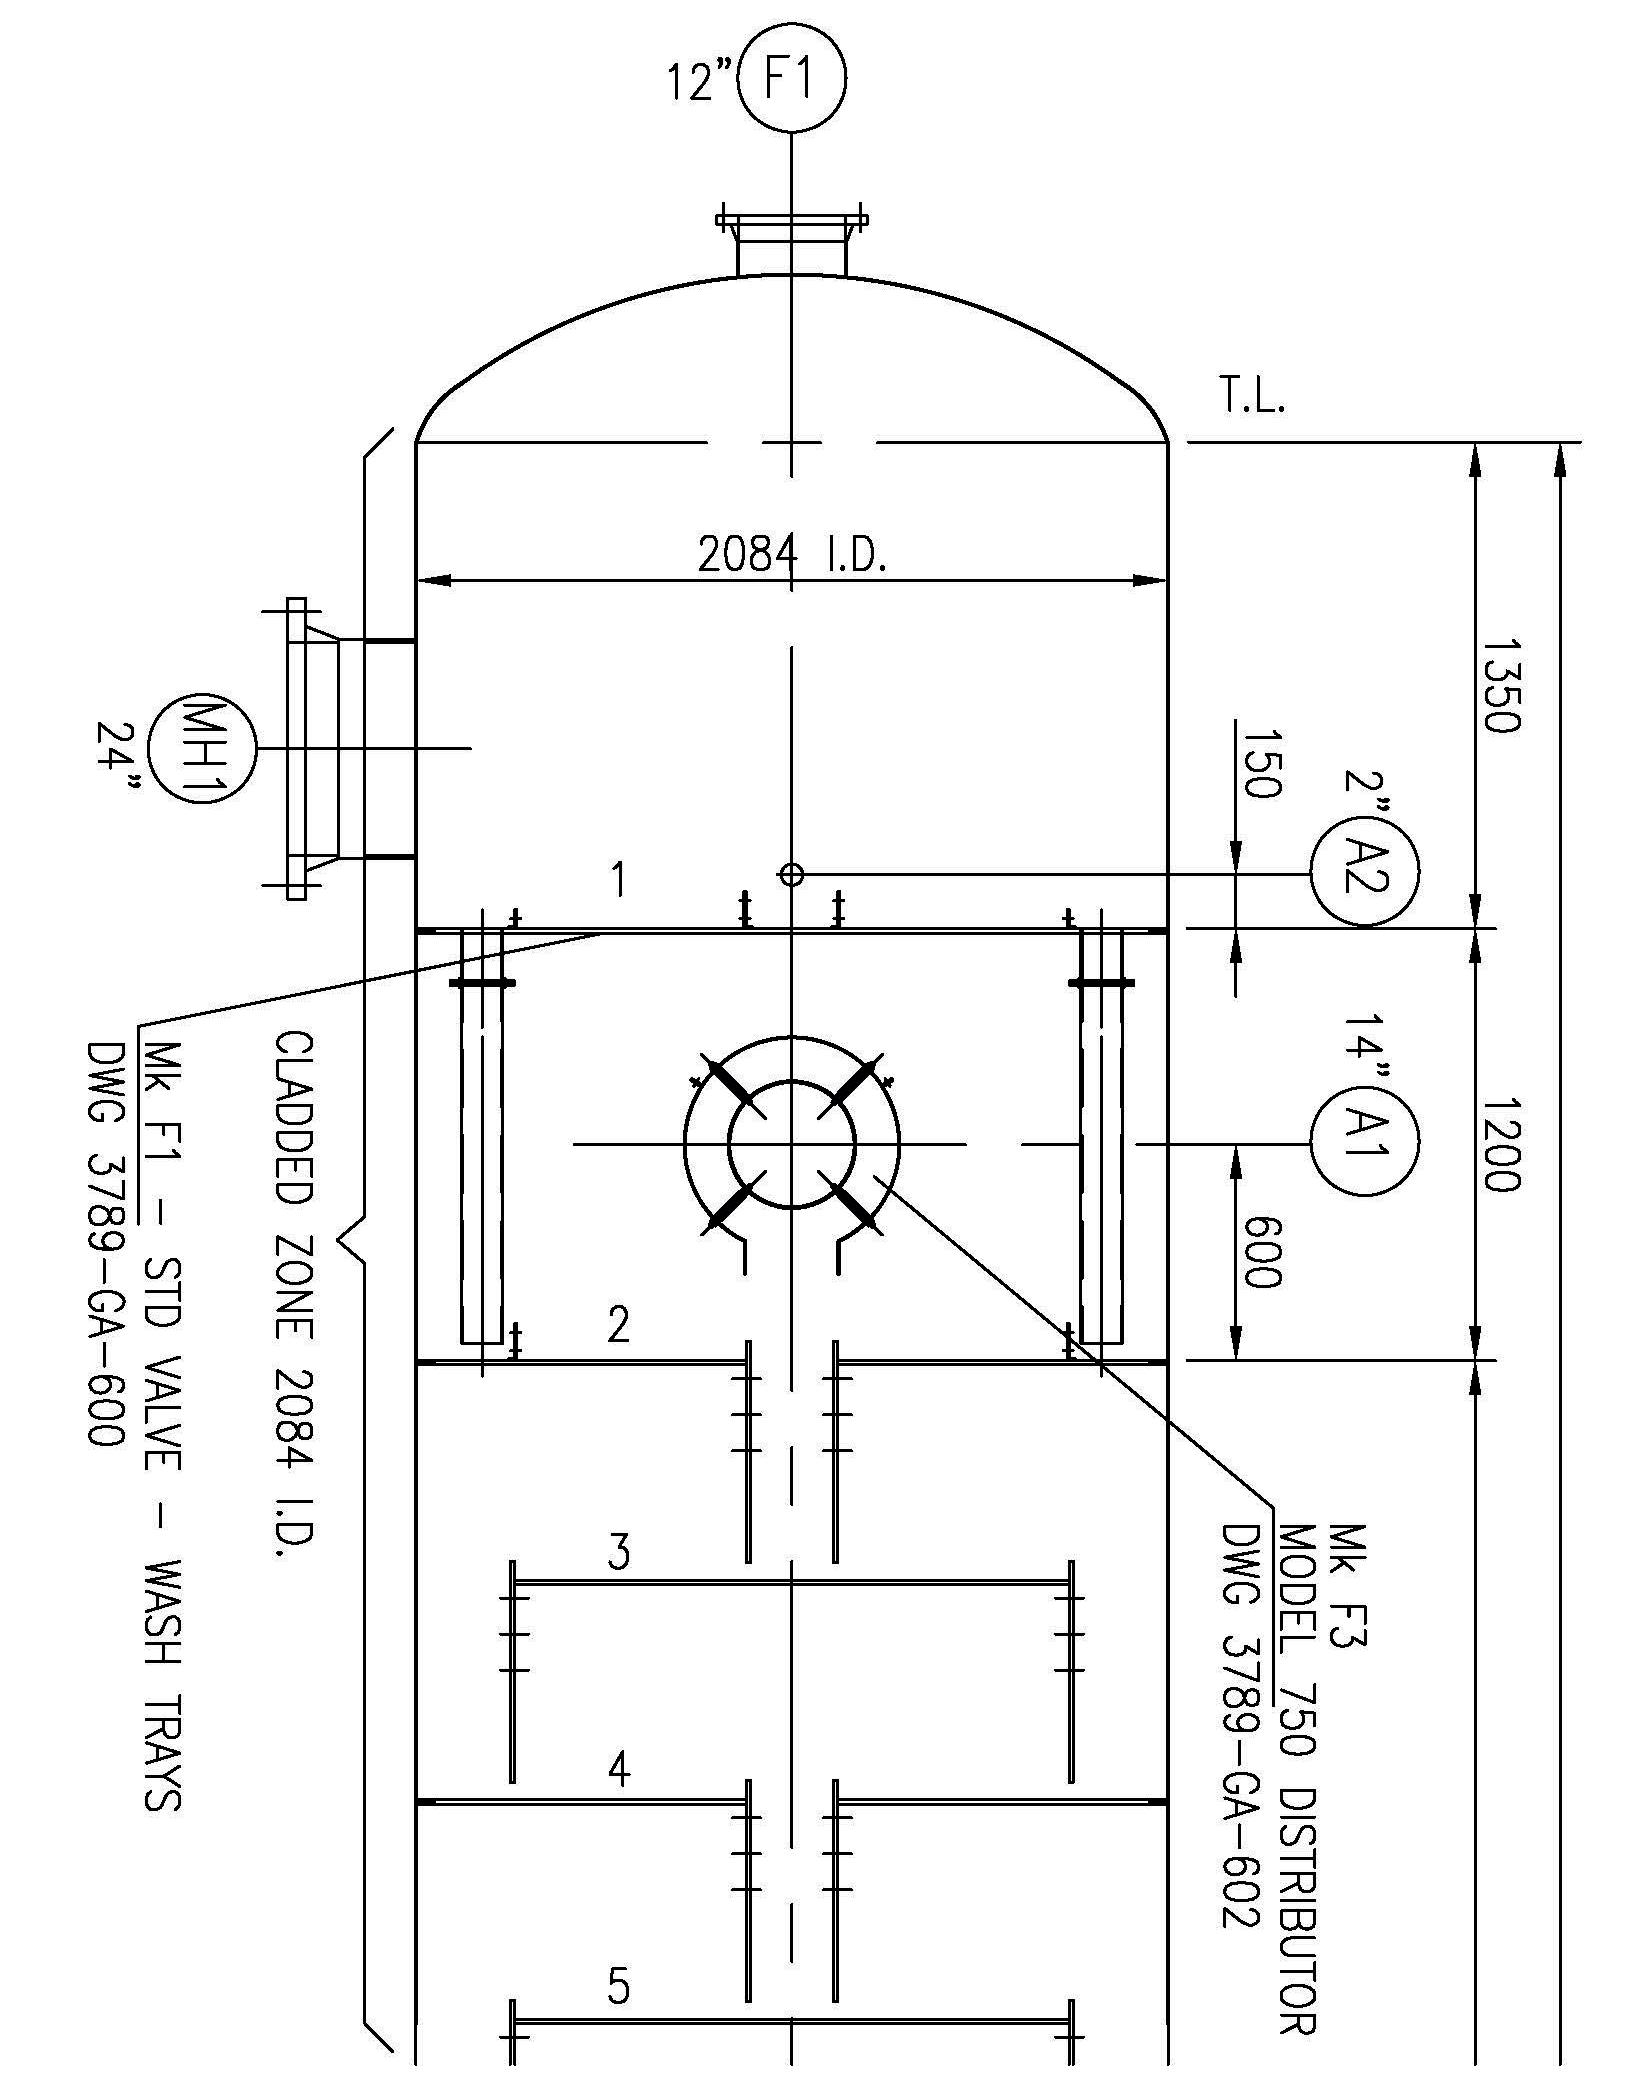
Case study 3
An example of a flashing gallery in a 3680 mm dia. CO2 stripper is shown in Figure 7. Feed nozzle 12 in. nb. Design vapour flow 42 604 kg/hr at 2.2 kg/m3; liquid flow 1 356 000 kg/hr at 1096 kg/m3
The flow regime is dispersed. Consequently, liquid (droplet) entrainment will be high. In such cases it is important to have a mist eliminator above the flashing galley.
Conclusion
To obtain the best performance from a distillation or absorption column, be it with trays or packing, it is necessary to correctly select appropriate feed arrangements. Many columns have been bottlenecked by poor or completely incorrect feed arrangements; particularly where two-phase feeds are concerned. As there is no one solution that is appropriate for every scenario, it is necessary to have a range of different types of distributors available. Three types have been discussed in this article, which have been used successfully in hundreds of columns. Where trays are concerned, liquid from any source should ideally be introduced at the inlet areas of the tray to maximise the tray efficiency.
References
1. BAKER, O., ‘Simultaneous Flow of Oil and Gas’, Oil & Gas Journal Vol. 53, (1954), pp. 185 - 195.
2. MANDHANE, J.M., GREGORY, G.A., and AZIZ, K., ‘A Flow Pattern Map for Gas-Liquid Flow in Horizontal Pipes’, Int. J. of Multiphase Flow (1974), pp. 537 - 553.
3. PORTER, K.E., ALI, Q. H., HASSAN, A.O., and ARYAN, A.F., ‘Gas Distribution in Shallow Packed Beds’, I&EC Research, Vol. 32, (1993), pp. 2406 - 2417.
4. KISTER, H.Z., ‘Distillation Troubleshooting’, J. Wiley & Sons, Inc., (2006), Case Study 5.2 by LAKHA, A., pp. 101 - 105.
5. ARYAN, A.F., ‘Improving tray efficiency in the spray regime’, Hydrocarbon Engineering, (January 2022), pp. 26 - 30.
6. KISTER, H.Z., GRICH, D.E., and YELEY, R., ‘Better Feed Entry Ups Debutaniser Capacity’, PTQ Revamps & Operations, (2003), pp. 31 - 35.
September 2023 HYDROCARBON ENGINEERING 38
Figure 6. An example of an intermediate two-phase feed arrangement in an amine regenerator.
Figure 7. An example of a flashing feed gallery in a CO2 stripper.
Our business is the “insides” of distillation and absorption columns …
Whether you are designing a new column or revamping an existing design, let our decades of experience and expertise assist you in making and implementing the most appropriate solution, at minimum cost, not only to achieve the desired throughput but also to accommodate feed rate variations and minimise downtime.
DtEC design standards are based on many years of proven experience in the mass transfer field and are used to design the internals to suit the specific process requirements, resulting in consistent and reliable performance. Our range of internals comprise, but not limited to, are:

• Packing Support Plates Gas Injection Multi-Beam Type for random packing beds
• Packing Support Grids Lattice Bar Type for structured packing beds
• Liquid Distributors Over 50 types including plate-orifice type, trough type and pipe ladder type
• Chimney (Draw-Off) Trays
• Feed Pipe Distributors Single-Phase and Two-Phase
The importance of correctly feeding a tray or packed column cannot be over-stressed, particularly in the case of two-phase feeds. Poor design arrangements can lead to premature flooding of the trays or packed bed. At DtEC we have a wide range of two-phase feed distributors thus ensuring the correct type will be selected:
• Model 740 Flashing Gallery
• Model 750 Perforated Sparge Pipe plus Shroud
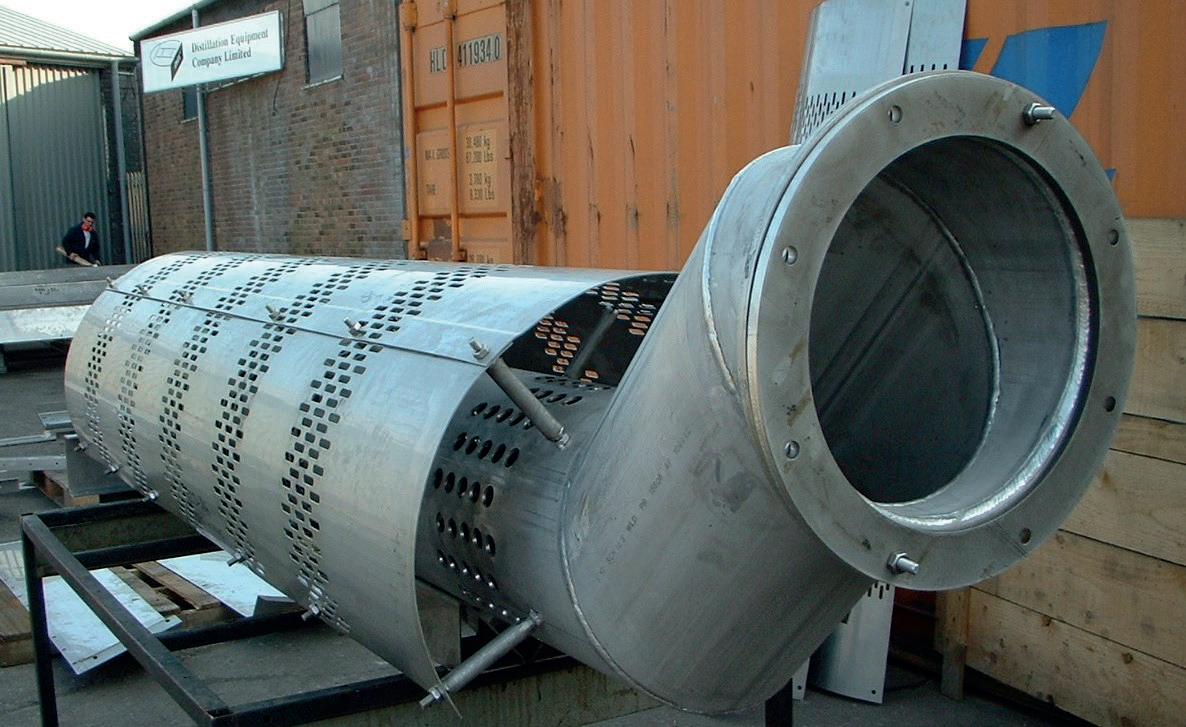
• Model 760 Vane Inlet Device (VID)
From receipt of your enquiry, our team of dedicated professionals are ready to give you a fast, efficient, knowledgeable and friendly response. At DtEC, we all believe the customer comes first.
Model 750 Distributor –Nozzle Dia. 12”nb Crude Stabilisation Column 4270 mm Dia.
Some day all internals will be made like this …
… quality and service with
… Distillation Equipment Company Ltd, The Boat Yard, Newcastle Road, Stone, Staffordshire ST15 8JZ, United Kingdom Tel: 0044 1785 602810 Email: sales@traysrus.com Fax: 0044 1785 602811 Web: www.traysrus.com
a passion
Heat generation makes up approximately two-thirds of industrial energy consumption and is a major contributor to direct CO2 emissions from process industry.1 Today, most of the heat produced in process facilities occurs through the combustion of fossil fuels (i.e. in gas or oil-fired boilers). Often, this heat is then converted into low, medium or high-pressure steam.
Decarbonising industrial heat and steam production will play a key role in achieving established climate targets and driving a successful energy transition. Significant opportunities exist to reduce industry reliance on fossil-fuel-based heat through waste heat recovery. By some estimates, as much as 50% of the energy consumed in industrial processes ends up as waste heat.2
High-temperature heat pumps (HTHPs), in combination with steam compression and mechanical vapour recompression (MVR) cycles, both represent sustainable methods of generating useable steam from waste heat. This is because they solely require electricity for input energy. These technologies can achieve the steam temperatures and
pressures required by many processes across the downstream oil and gas, chemicals, and pulp and paper industries, opening new pathways for decarbonisation.
Combining HTHPs with steam compression
Heat pumps are a highly efficient technology for recovering waste heat and have been in use since the mid-19th century. They have gained significant traction in recent years as pressure to reduce emissions has increased.

The primary advantage of heat pumps is that the only required energy input is electricity, meaning that heat generation can be emissions-free if the power comes from a green source. Whilst electric boilers and heaters offer this same advantage, heat pumps can be up to 5 times more efficient because most of their energy requirement is provided by the waste heat.
Heat pumps are typically classified as either low-temperature or high-temperature. Most of the installed base of heat pumps today are the former, and are designed for
September 2023 HYDROCARBON ENGINEERING 40
temperatures up to 100°C. They are commonly found in district heating applications. On the other hand, HTHPs are becoming more prevalent for steam generation in industrial facilities. Depending on the refrigerant used, simple HTHP cycles, without steam compression, are usually limited to ~150°C in their maximum outlet temperature, and therefore a maximum steam pressure of 5 bara. The higher the temperature that the refrigerant reaches, the more the width of the two-phase region is reduced. This is due to the temperature approaching the critical point. As a result, there is less latent heat recoverable and useable in the condenser, reducing the coefficient of performance (COP) and benefit of the heat pump system. This is why the system should be designed with sufficient distance to the critical temperature of the refrigerant. Furthermore, synthetic refrigerants lose stability when operated continuously at temperatures between 150 - 200°C. As requirements for process steam often lie above 150°C and 5 bara, in many cases a steam compressor will be required downstream of the heat pump system.
Steam compression technology
In the past, steam compression applications required relatively small pressure ratios, which could be handled by single-stage compressors/blowers. However, many of today’s industrial heat applications require multi-stage compression.

The technology that Siemens Energy applies for steam compression is integrally geared compressors (IGCs) (Figure 1). Although some operators view IGCs as a novel technology, these machines have accumulated millions of hours of uninterrupted service in a broad range of industrial applications. Siemens Energy developed the first IGC in 1948 (formally named the VK).
IGCs are centrifugal compressors with a bull gear that can drive as many as four pinion shafts (with one or two impellers each). This allows each impeller to turn with its optimal velocity and frequency for maximum efficiency. Furthermore, each impeller sits in its own volute casing, which allows the process gas to exit the machine between the compression stages. Doing so enables intercooling after each stage, which is important for
September 2023 HYDROCARBON ENGINEERING 41
Lukas Biyikli, Siemens Energy, Germany, considers how it is possible to decarbonise industrial process heat through steam compression.
minimising power consumption. It is also critical for preventing temperatures from exceeding the maximum allowable limits of the compressor, which may necessitate the use of more expensive materials.
Siemens Energy manufactures IGCs that can handle up to 1.2 million m3/h in one compression stage, with impeller diameters up to 2 m. Flow rates as high as 2.4 million m3/h are
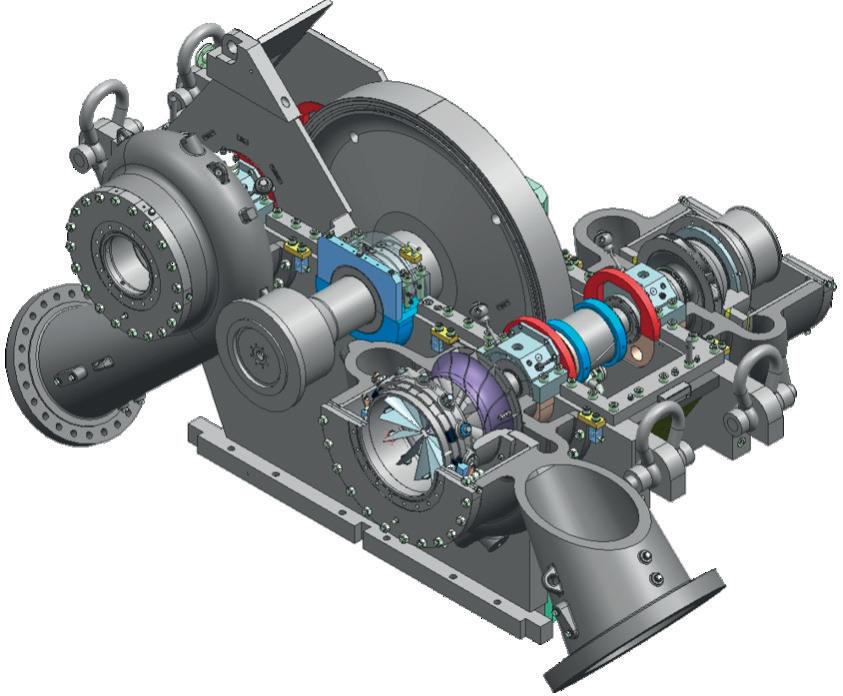
achievable in a double-floating design, where the volume flow at the inlet of the compressor is distributed to two parallel stages/impellers.
Because each impeller sits in its own casing, each compression stage is independent, enabling the application of combined refrigerant/steam compressors (when the steam compressor is applied downstream of a heat pump).
In a combined configuration, two different process gases – in this case the refrigerant for the heat pump and the steam – are compressed within the same machine, as shown in Figure 2. Any number of refrigerant and steam stage counts are possible. For example, four stages/impellers can be used for the refrigerant and four stages for the steam, as long as a total of eight stages is not exceeded. This reduces the number of compressor trains required for such an application from two to one, which saves approximately 20 - 30% on CAPEX for the compression equipment.
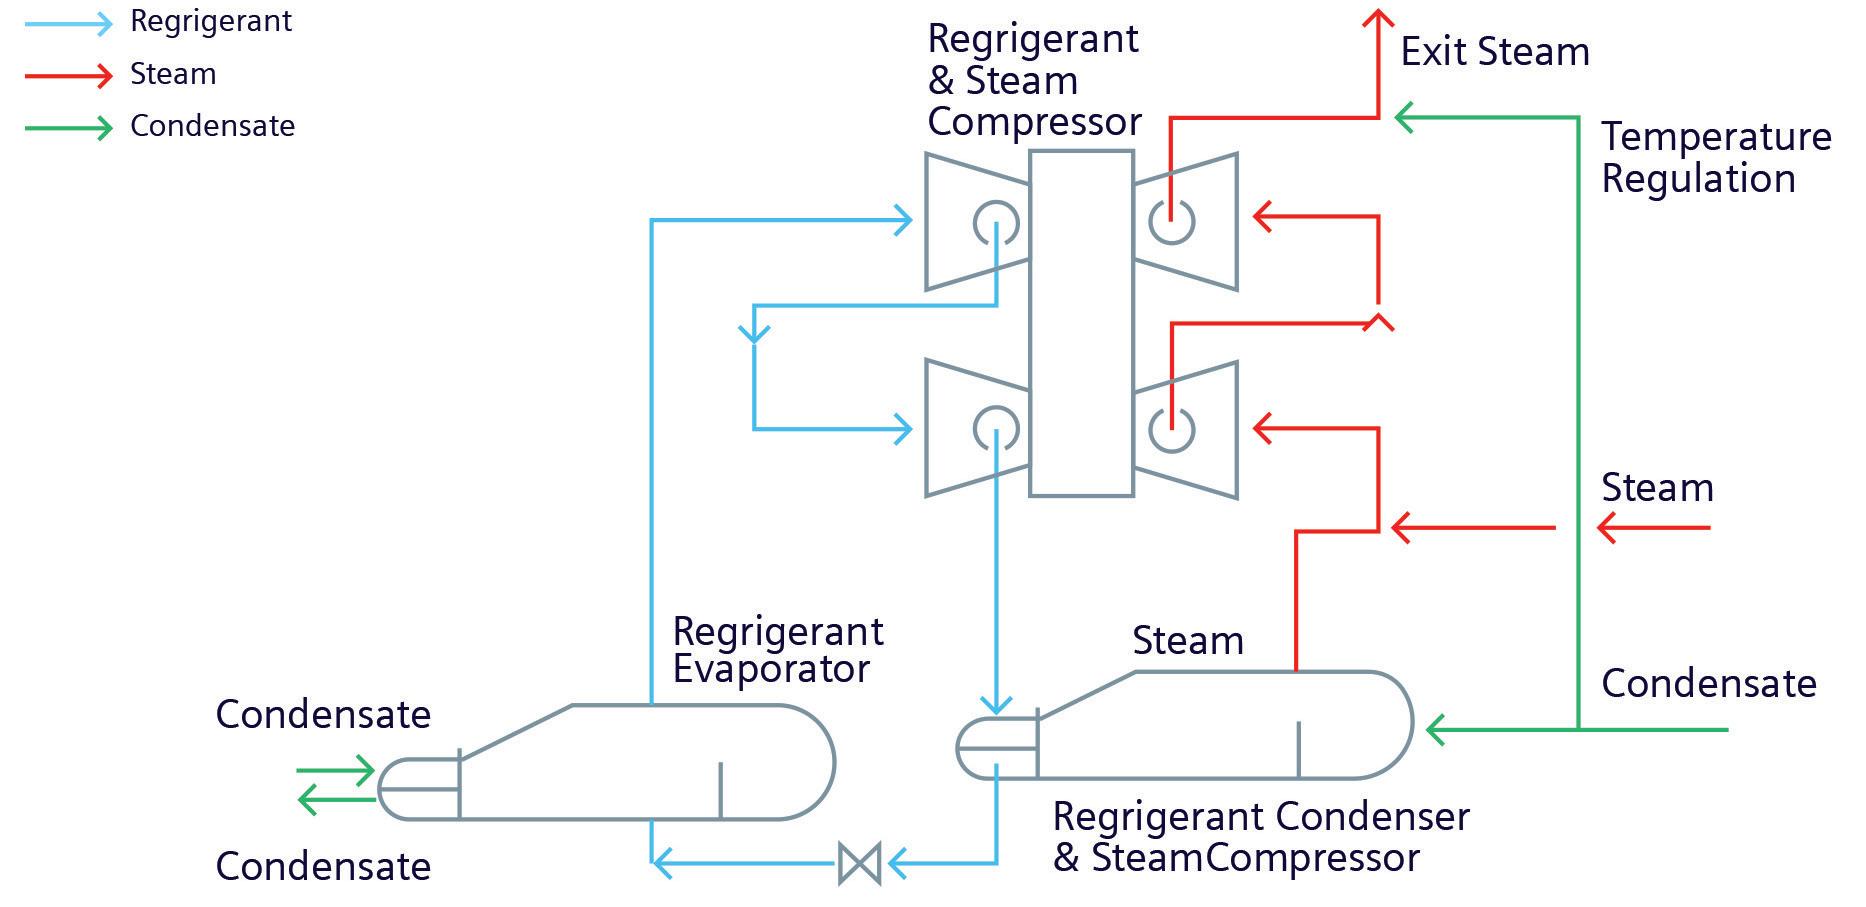
The cooling in a steam compressor is not done by typical water or fin/fan coolers but instead by water injection into the process gas piping between the stages. The injected water is then evaporated by taking heat from the steam, as shown in Figure 3.
Due to the high latent heat requirement for water evaporation, the steam is cooled significantly and 100% of the compression heat, which is typically a byproduct, is utilised for additional steam production. The desired cooling temperature can be controlled by the amount of water injected (i.e. the more water that is injected, the more cooling is achieved).
By using HTHPs with subsequent steam compression, temperatures up to 300°C and pressures up to 60 bara are achievable. Even higher temperatures are possible through the installation of a small electric superheater downstream of the steam compressor. As previously stated, these levels are well within the range of what is required by many processes across the oil and gas, chemical, and pulp and paper industries, which have traditionally relied on fossil fuel burning for heat/steam production.
Mechanical vapour recompression (MVR) cycle
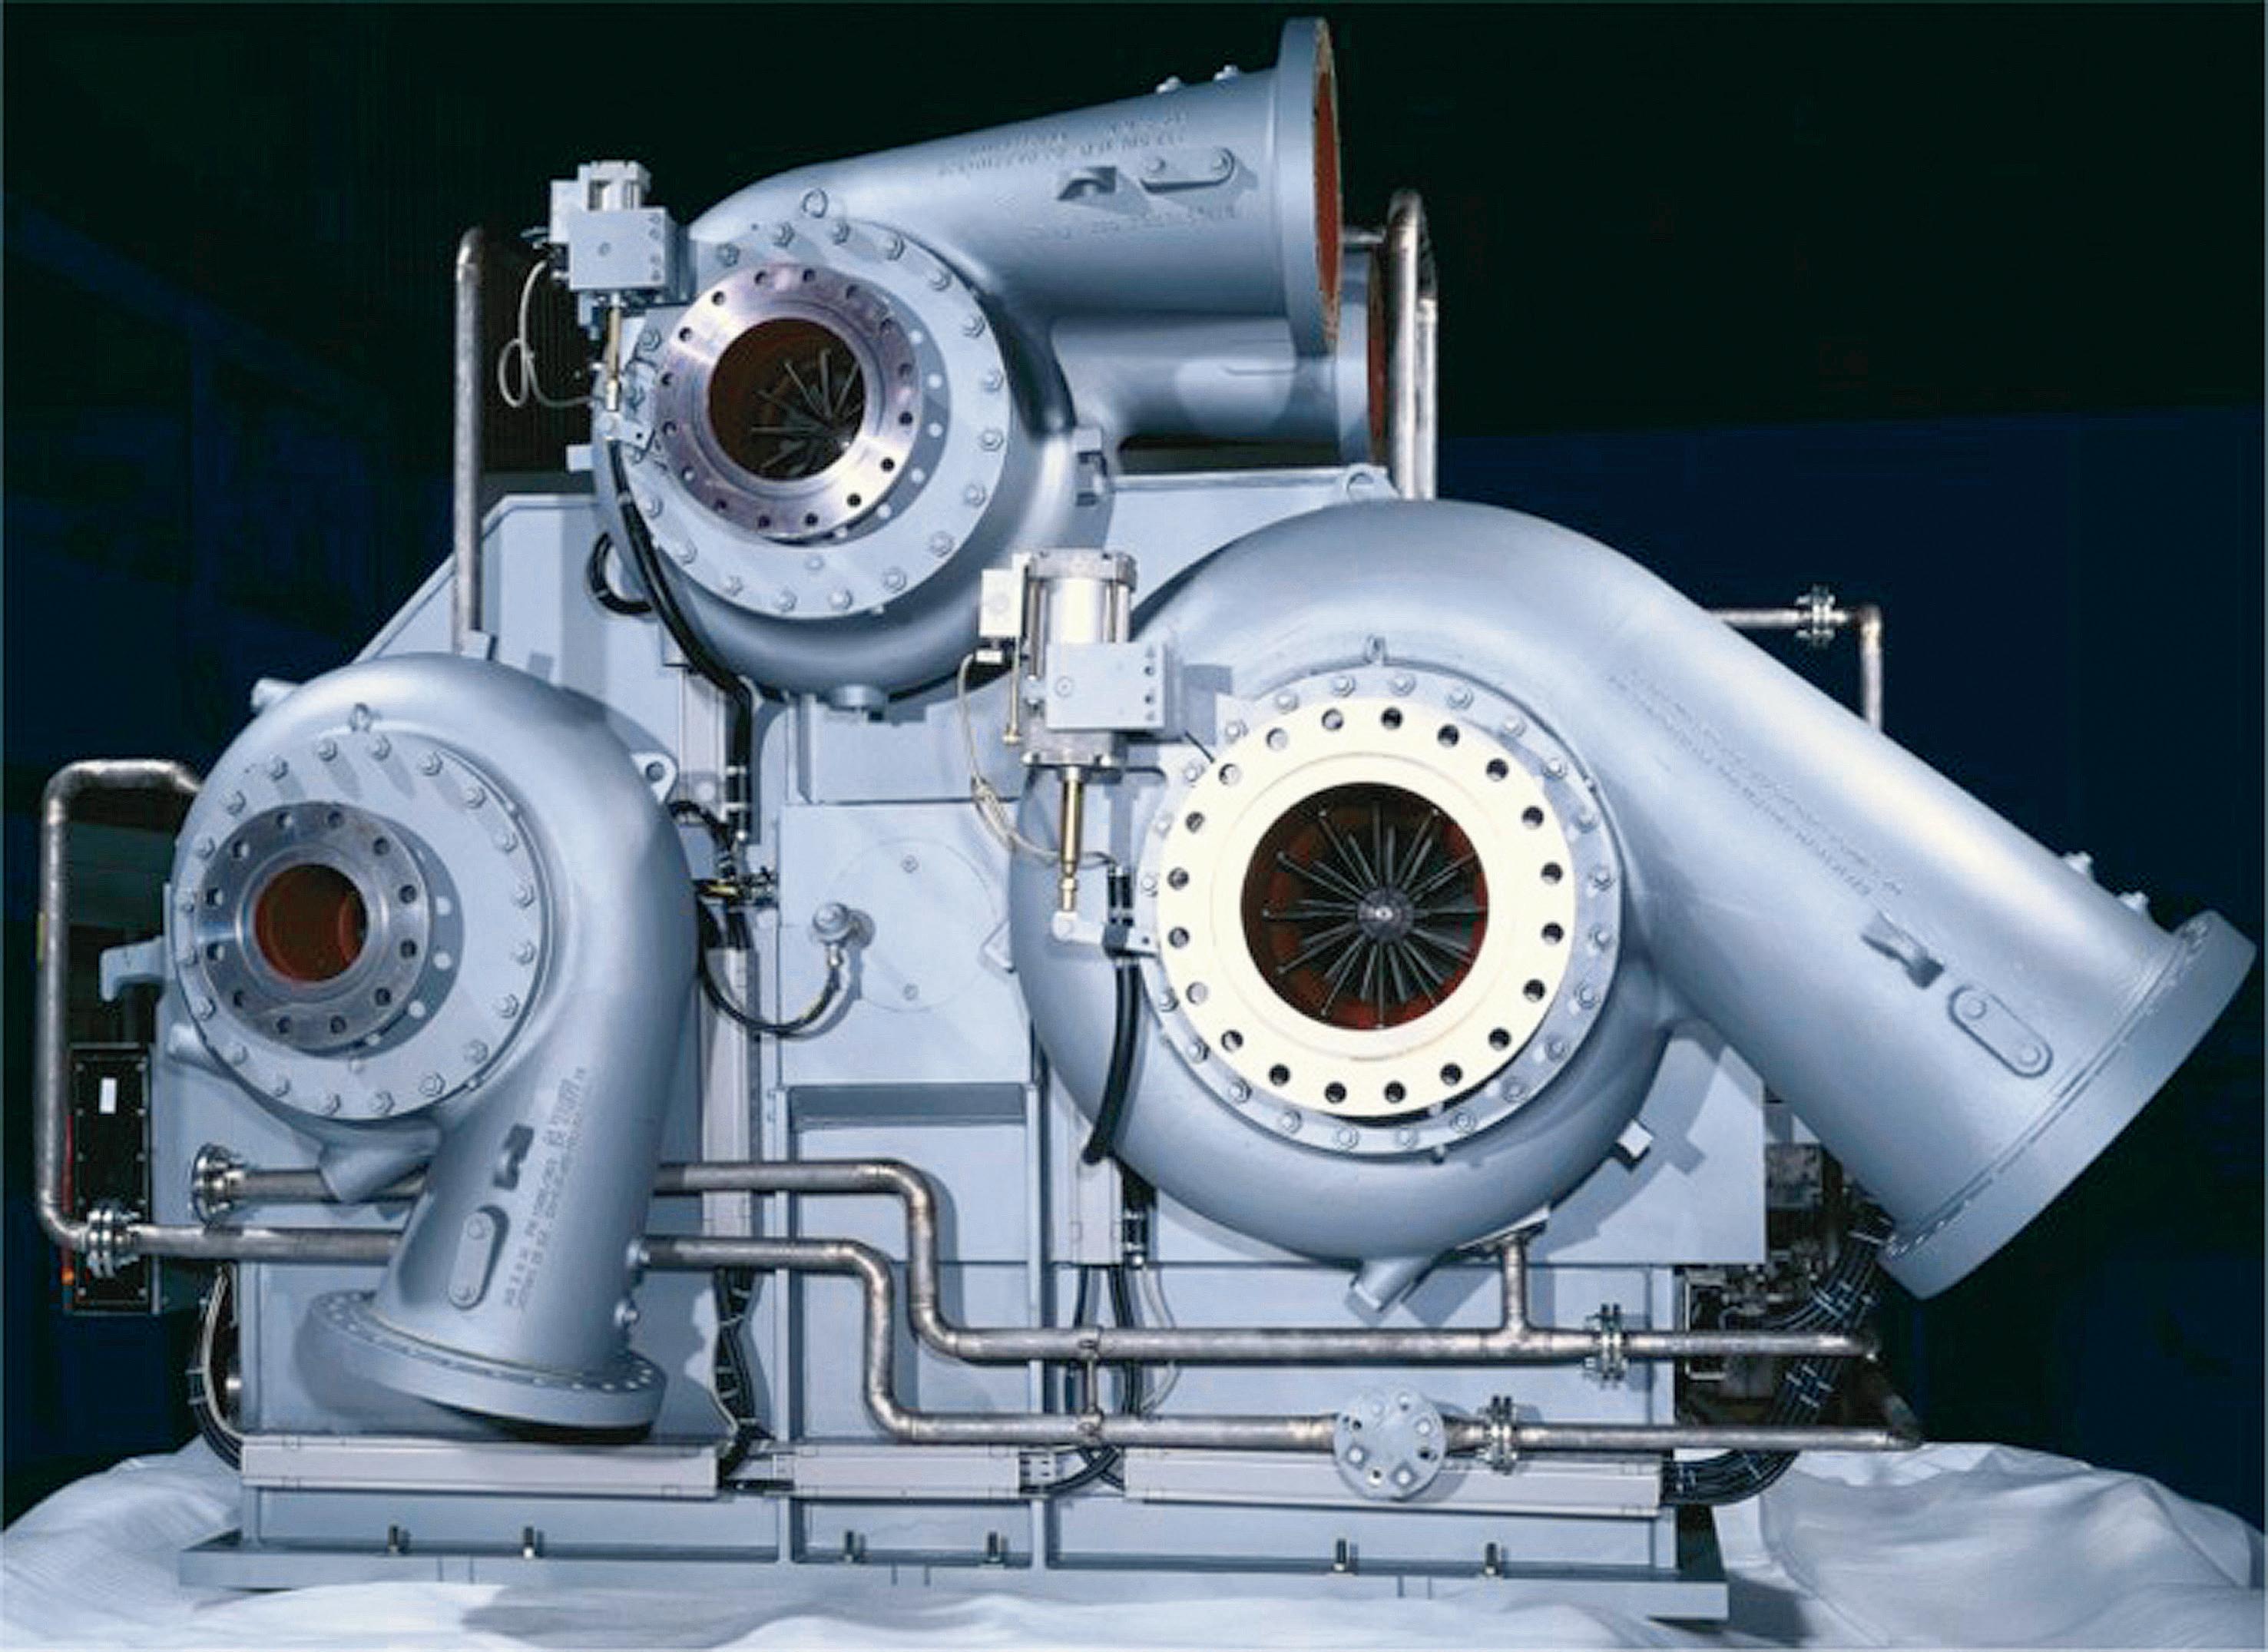
MVR cycles provide an alternative to classical heat pumps for recovering waste heat in order to produce low, medium or high-pressure steam.
With MVR cycles, thermal energy from a mid or low-temperature waste stream is used to directly evaporate feedwater. The steam is then compressed to the required temperature and pressure level of the process. The entire latent heat for evaporation is provided by the free-of-charge waste heat, and only the sensible heat, which is
September 2023 HYDROCARBON ENGINEERING 42
Figure 1. An integrally geared compressor (IGC) with independent volute casings.
Figure 2. Combined refrigerant/steam compressor.
SPECIALIZED CATALYSTS

JOINTLY DEVELOPED SOLUTIONS FOR CLEANER FUELS AND MAXIMUM PERFORMANCE
Together with Advanced Refining Technologies LLC, CLG offers the most complete portfolio of hydroprocessing catalysts in the industry. We offer more experience than any other licensor providing leading technologies, expertise, and innovative solutions for refiners worldwide. To get the performance and flexibility needed to keep pace with changing market dynamics, start by visiting www.chevronlummus.com.

significantly lower than the latent/evaporation heat, is provided in the form of compression.
In nearly all cases, the waste heat source has a temperature below 100°C, which means that the water needs to be evaporated at sub-atmospheric pressure. While this requires additional considerations when it comes to equipment design (e.g. around the sealing system so that no ambient air is sucked in), these challenges can be solved with Siemens Energy’s existing technology.
Compared to heat pumps, the MVR cycle does not require refrigerant. This is beneficial, as per- and polyfluoroalkyl substances (PFAS) restrictions are being considered in the EU for synthetic refrigerants. Natural refrigerants, on the other hand, are often toxic (e.g. NH3) or hydrocarbons (e.g. pentane), which require additional considerations, including explosion protection. In many cases, CAPEX and footprint can also be reduced relative to heat pumps by eliminating the need for an expansion valve, the flash tank, the refrigerant condenser, and some ancillary piping.
Figure 4 shows an MVR cycle example where 68 thermal megawatt (MWth) of waste heat at 75°C can be utilised to produce 100 MWth of steam at 6 bar and 180°C. The resulting system has a COP > 3.
In this application, the water is evaporated at 0.15 bara and then compressed in a steam compressor. Although the density of the sub-atmospheric steam is very low (at only 0.1 kg/m3), the entire volumetric flow can still be handled within one Siemens Energy IGC machine. The COP of the system is similar to that of a comparable heat pump system, with the added benefit of reduced CAPEX due to the elimination of the aforementioned components.
COP can be increased and CAPEX lowered further if the heat source temperature is increased. In another example, where the waste heat source is ~105°C and the steam is required at 3 bara, a COP > 7 can be achieved. In this case, the steam for the MVR cycle was able to be produced at 0.65 bara, leading to a higher density and, therefore, a lower volumetric flow compared to the previous example with 0.15 bara.
Conclusion
Both heat pump and MVR cycles represent sustainable and efficient technologies for waste heat recovery. The choice of which to employ is largely dependent on the unique requirements of the process or facility.
The MVR cycle is typically more advantageous for heat sources with higher temperatures, as this results in an increase in steam evaporation temperature and pressure, which leads to a higher COP and a smaller system footprint through a reduction in volume flow. As the heat source temperature decreases, heat pumps become more economical due to a rising steam volumetric flow within a respective MVR cycle, which will increase the size and cost of the system. Furthermore, at a certain point, the steam pressure becomes excessively low, so that, for example, sealing can become too challenging, making the heat pump a better option.
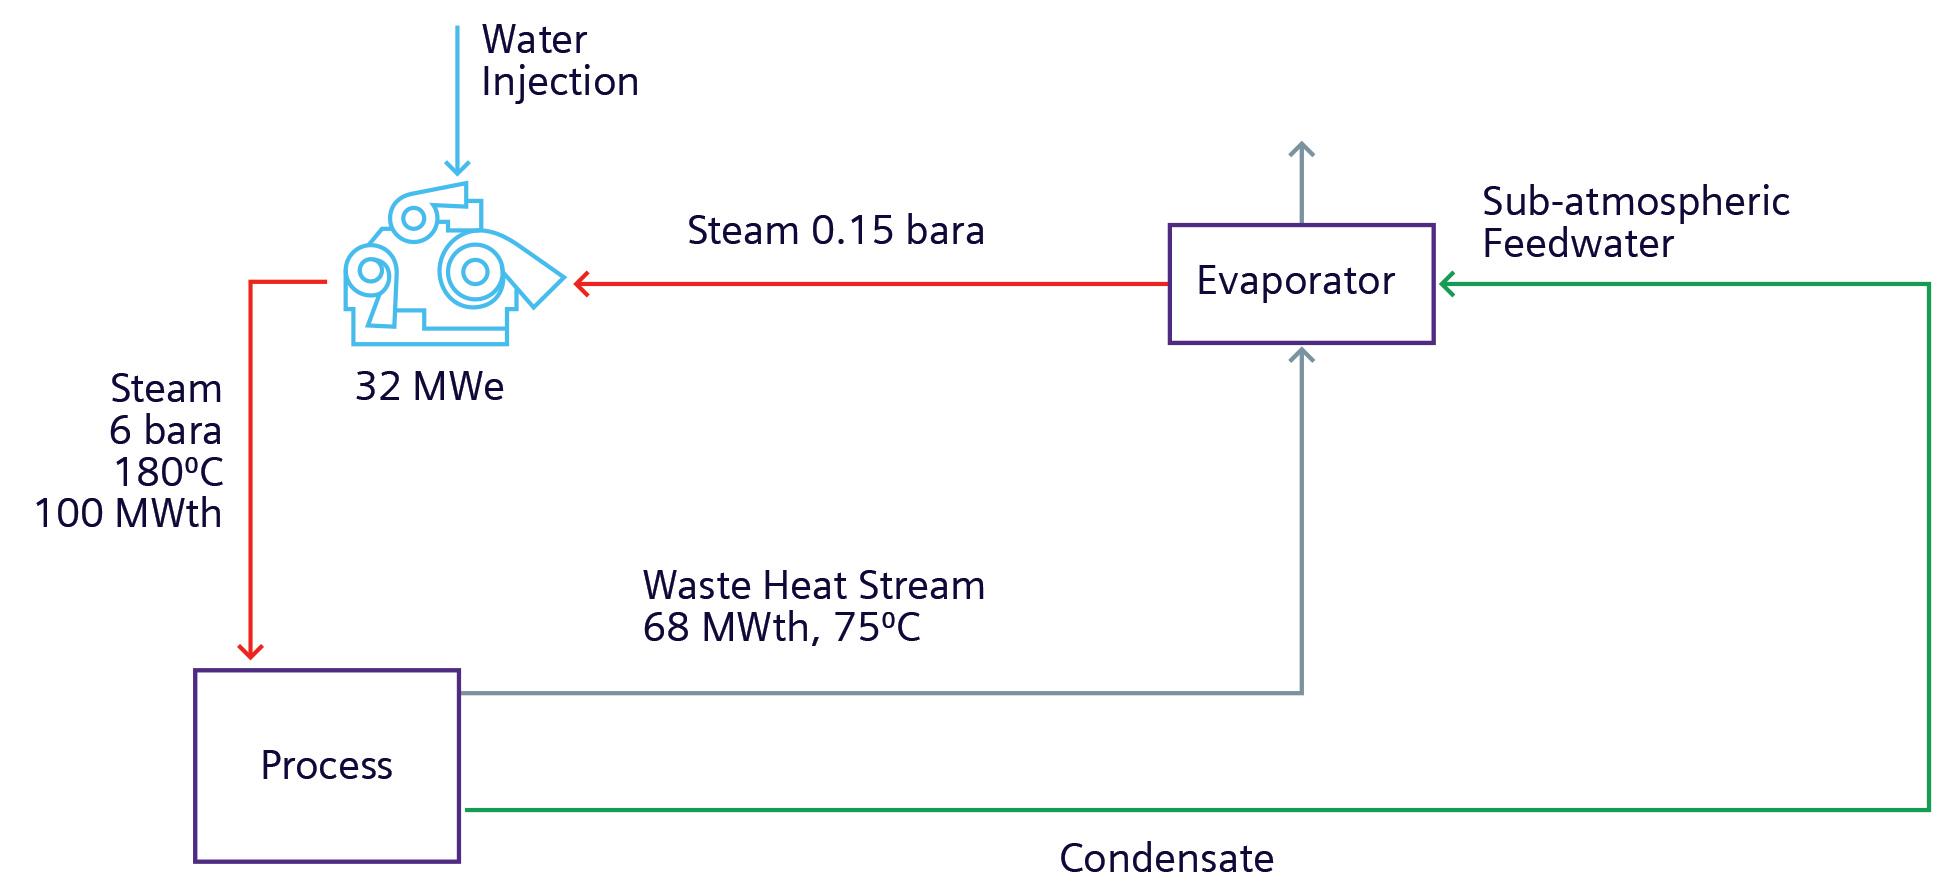
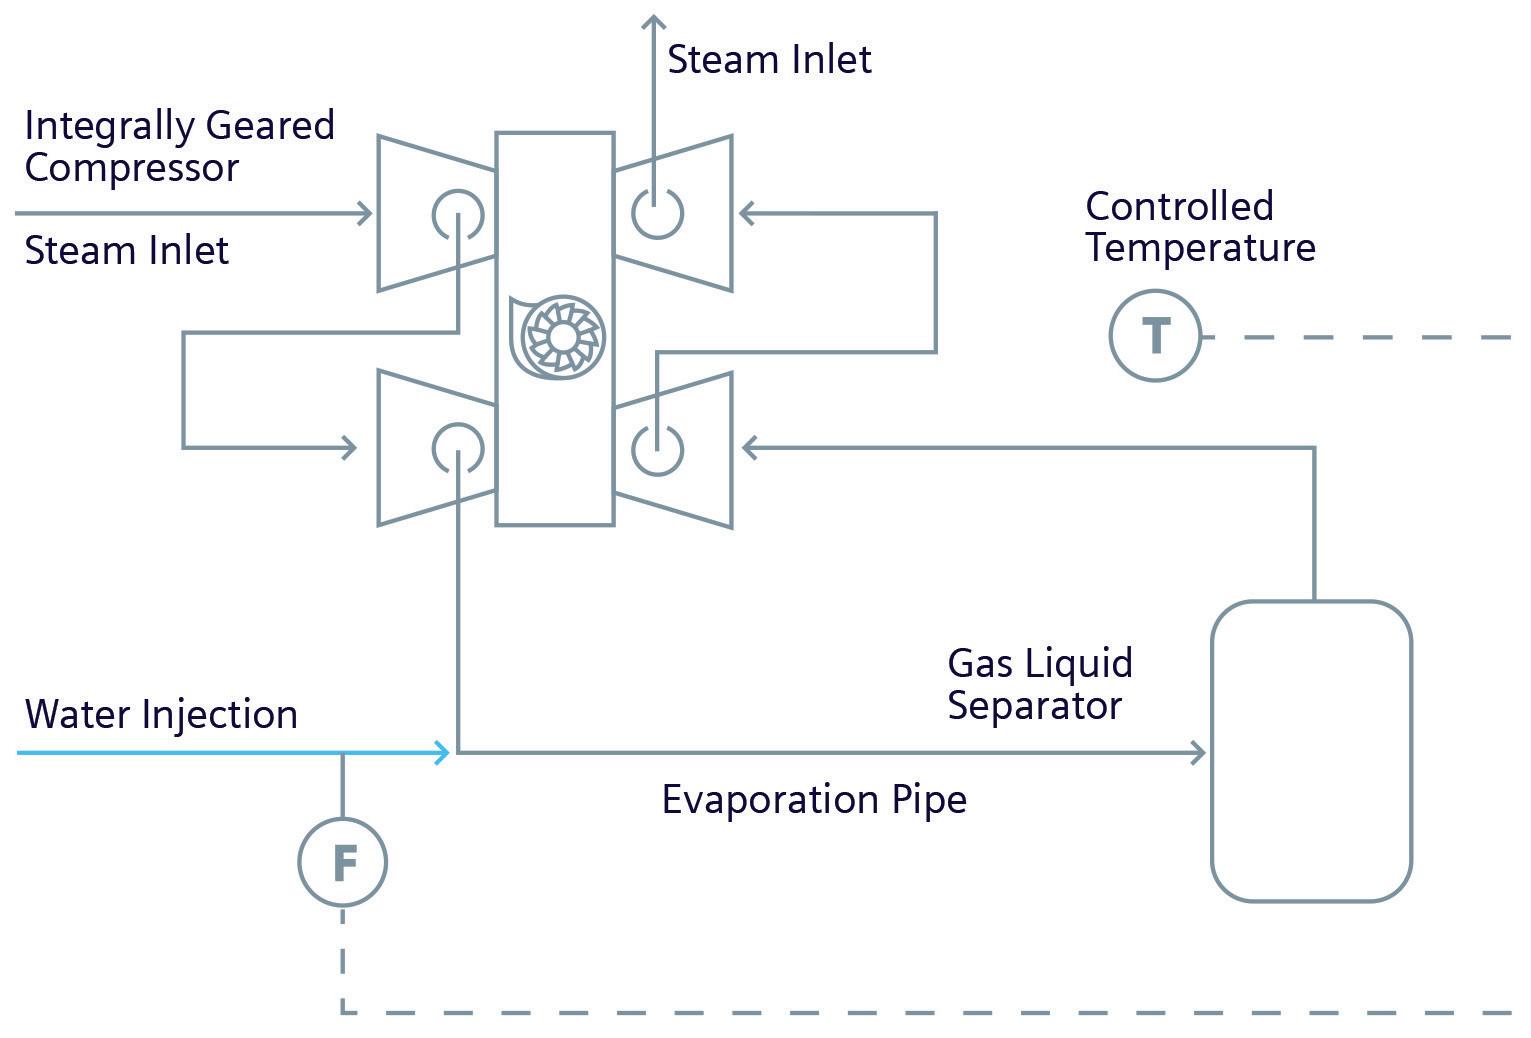
Ultimately, there is no defined temperature threshold where one technology is always more advantageous than the other. Selection requires consideration of many different variables. Siemens Energy provides an in-depth evaluation of both options to determine the optimal cycle configuration, depending on the customer’s requirements with respect to CAPEX, OPEX, footprint, lead time, complexity and environmental and safety aspects.
References
1. WEST, K., and BELLEVRAT, E., ‘Clean and efficient heat for industry’, International Energy Agency (IEA), (23 January 2018), https://www. iea.org/commentaries/clean-andefficient-heat-for-industry.
2. ‘Waste Heat Recovery Resource’, US Department of Energy (DOE), (24 January 2017), https:// www.energy.gov/eere/amo/ articles/waste-heat-recoveryresource-page#:~:text=It%20 is%20estimated%20that%20 between,equipment%20surfaces%20 and%20heated%20products.
September 2023 HYDROCARBON ENGINEERING 44
Figure 3. Steam cooling by water injection.
Figure 4. Mechanical vapour recompression (MVR) cycle.
Heat exchangers play a key role in the operation of the petrochemical and chemical process industry (CPI), transferring heat from one fluid to another. These fluids can be corrosive, and proper material selection is critical to reduce failures, maintenance, and repair costs. One of the most common types of heat exchangers is the shell-and-tube exchanger. Figure 1 shows a schematic representation, where the cold fluid flows through the tubes and a hot fluid flows through the shell.1
The corrosion resistant alloys (CRA) used in the CPI includes austenitic stainless steels, duplex stainless steels, super austenitic stainless steels, and nickel-based alloys. These alloys have high corrosion resistance, high-temperature strength, low-temperature ductility, ease of fabrication, availability, abrasion resistance, and ease of cleaning.2 The requirements and aspects of material selection in a chemical plant include a balance of safety, economics, process, and product requirements. Further considerations in the corrosion resistance of heat exchangers must be taken to avoid contamination into the manufactured products, extend their service life, and reduce costly downtime.3
Regardless of the heat exchanger design or size, the initial CAPEX is likely to be low compared to the cost of the entire plant. And yet, the ability to achieve sustained energy efficiency and uptime can have a significant impact on total OPEX over the long-term. Making the right choice of fabrication material will largely depend on the specific operation.4 It is important to mention that tubes, tubesheets, heads, and shells may have different materials. The material selection needs to consider various combinations of alloys and fabrication for the tube-to-tubesheet joints.
Corrosion mechanisms
There are various reports regarding heat exchanger failure due to common corrosion mechanisms such as uniform, pitting, crevice, stress corrosion cracking, erosion, intergranular, galvanic, and microbiologically induced.
Uniform corrosion
This is a relatively uniform attack over the tube, tube sheet, or shell. Many chemicals such as acids (i.e. sulfuric acid),

September 2023 45 HYDROCARBON ENGINEERING
Luiza Esteves, Alleima, USA, compares the corrosion and mechanical resistance of advanced stainless steels and special alloys used in shell and tube heat exchangers in various chemical process industry applications.
strong bases (i.e. caustic soda), and organic acids (i.e. acetic acid and formic acid) can lead to uniform metal loss. The thinning of the tube or plate leads to failure. For this reason, it is important to select stainless steel to ensure that this alloy can passivate in the working media, where uniform corrosion occurs at a very low rate. Another way to evaluate the corrosion performance is by carrying out test installations and determining the corrosion resistance, enabling the heat exchanger to be designed with the right alloy and wall thickness.1
Pitting corrosion
Pitting is a form of localised corrosion in which the attack is confined to a small area of the metal surface. Pitting is caused by the presence of an ‘aggressive’ anion in the electrolyte, usually chloride, but can also occur in the presence of other anions, including bromides, iodides, sulfates, and nitrates. These anions attack the passive film forming an anode. The unbroken passive surface will form a cathode (Figure 2). As the corrosion proceeds at the anode, a pit will form. Because of the chemistry within the pit, it will become more acidic, and an autocatalytic reaction will propagate rapidly. This acceleration makes pitting especially difficult to predict in terms of time to leak or failure. Pits can also serve as sites to initiate stress corrosion cracking.5 The tendency of stainless steel to be susceptible to pitting corrosion can be predicted with the pitting resistance equivalent number (PREN). This number can be calculated according to the following equation:
PREN = %Cr + 3.3% Mo + 16% N
In a weld joint, pitting corrosion can occur in the heat-affected zone (HAZ). If this happens, an upgrade of the material could avoid pit formation. Figure 3 shows a ranking of different alloys and their PREN values.
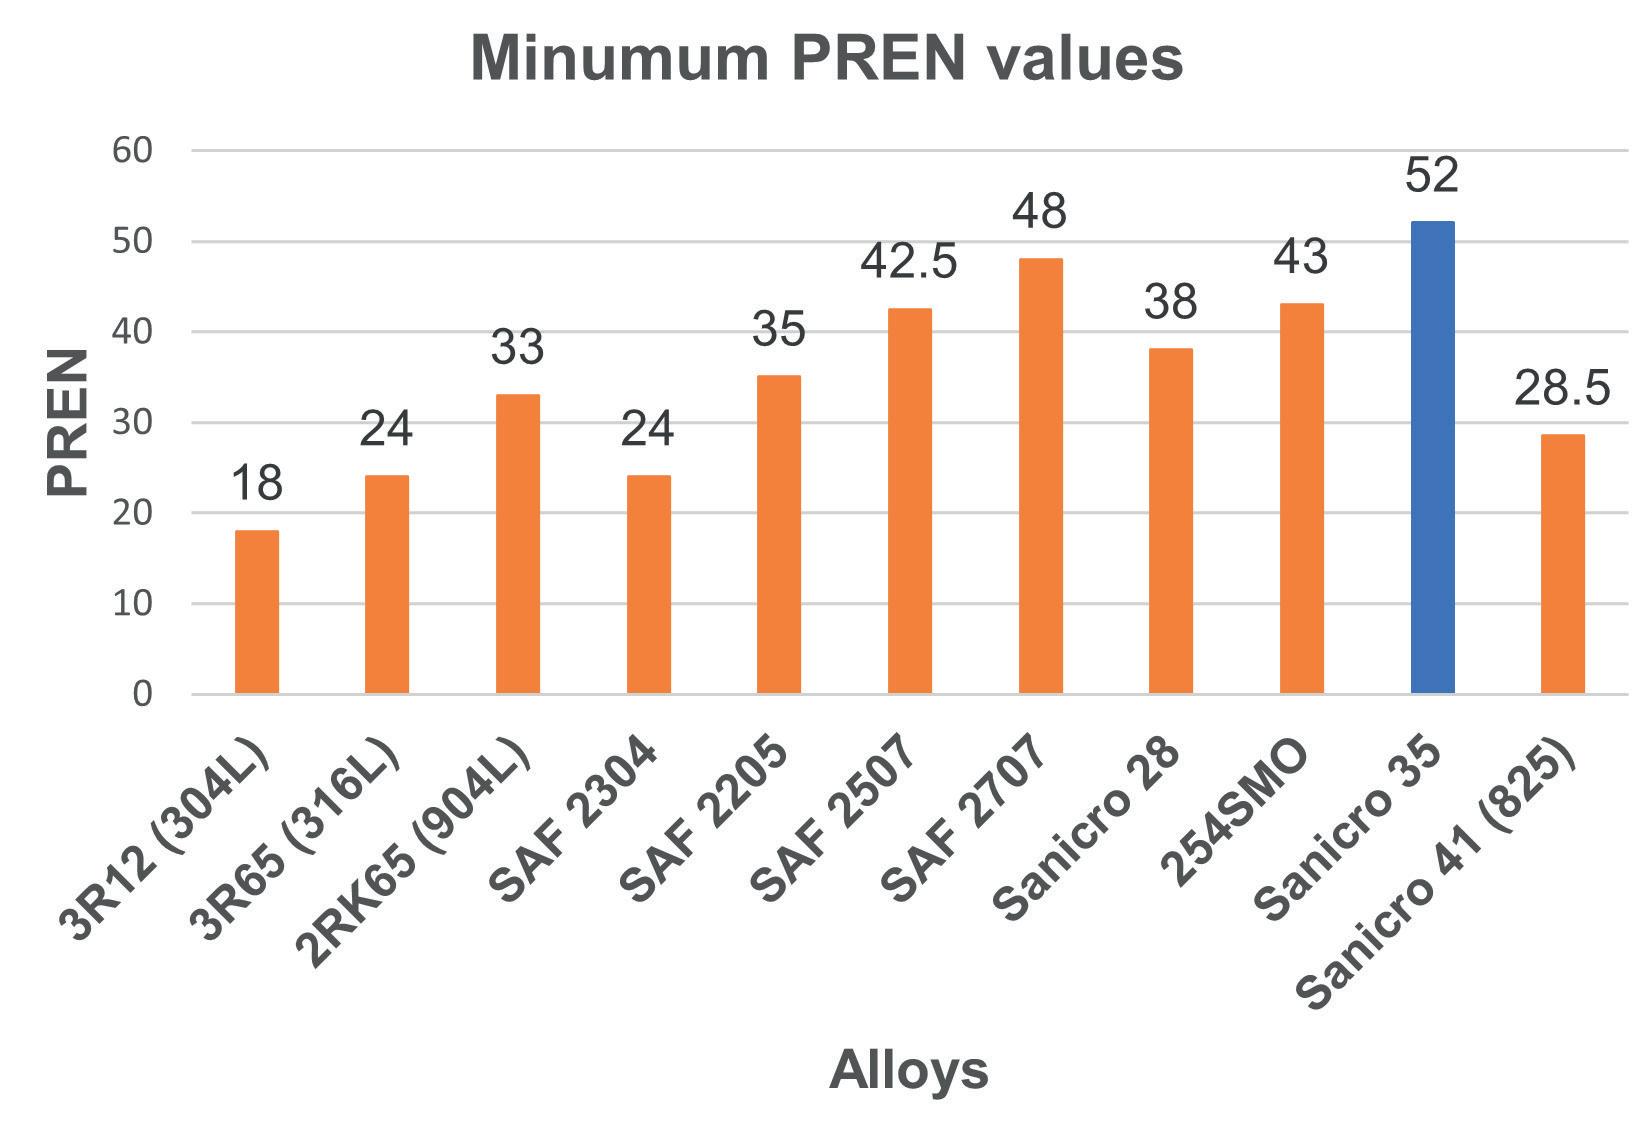
Crevice corrosion
The crevice is always related to the design of the heat exchangers and can occur between tube and tubesheet where there is a stagnant liquid causing oxygen depletion. This can create a differential concentration of oxygen and, when combined with chloride, can initiate crevice corrosion. The crevice corrosion resistance of different alloys is performed according to ASTM G48 methods D and F. These methods help determine the critical crevice temperature (CCT) of the alloy when exposed to a 6% FeCl3 solution utilising a crevice former.
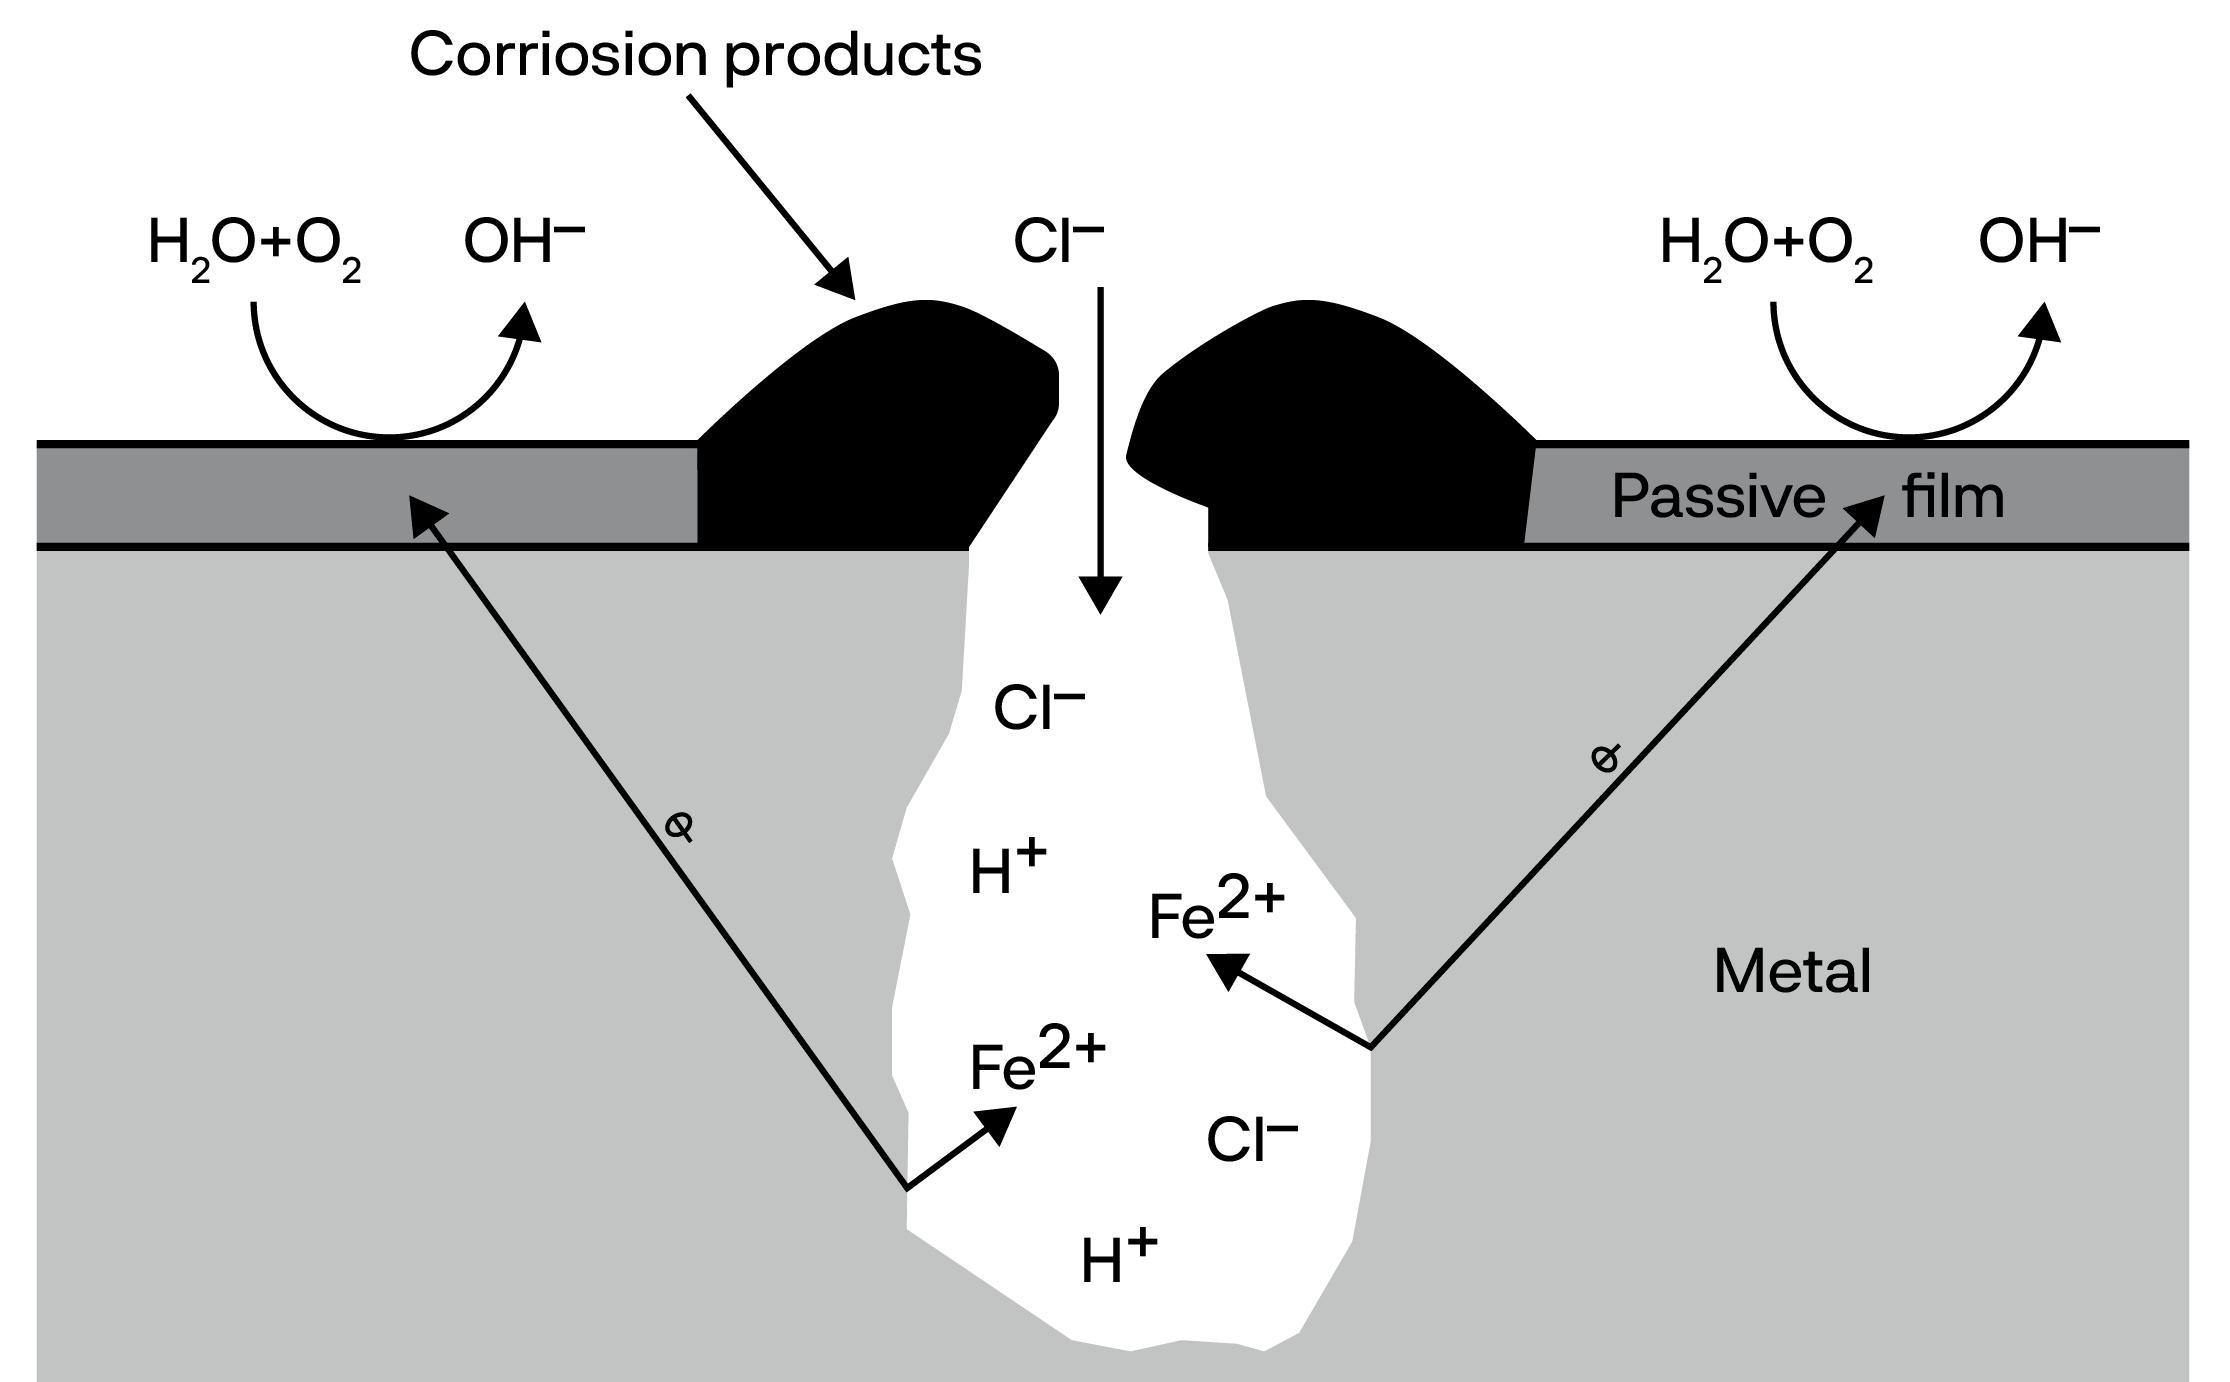
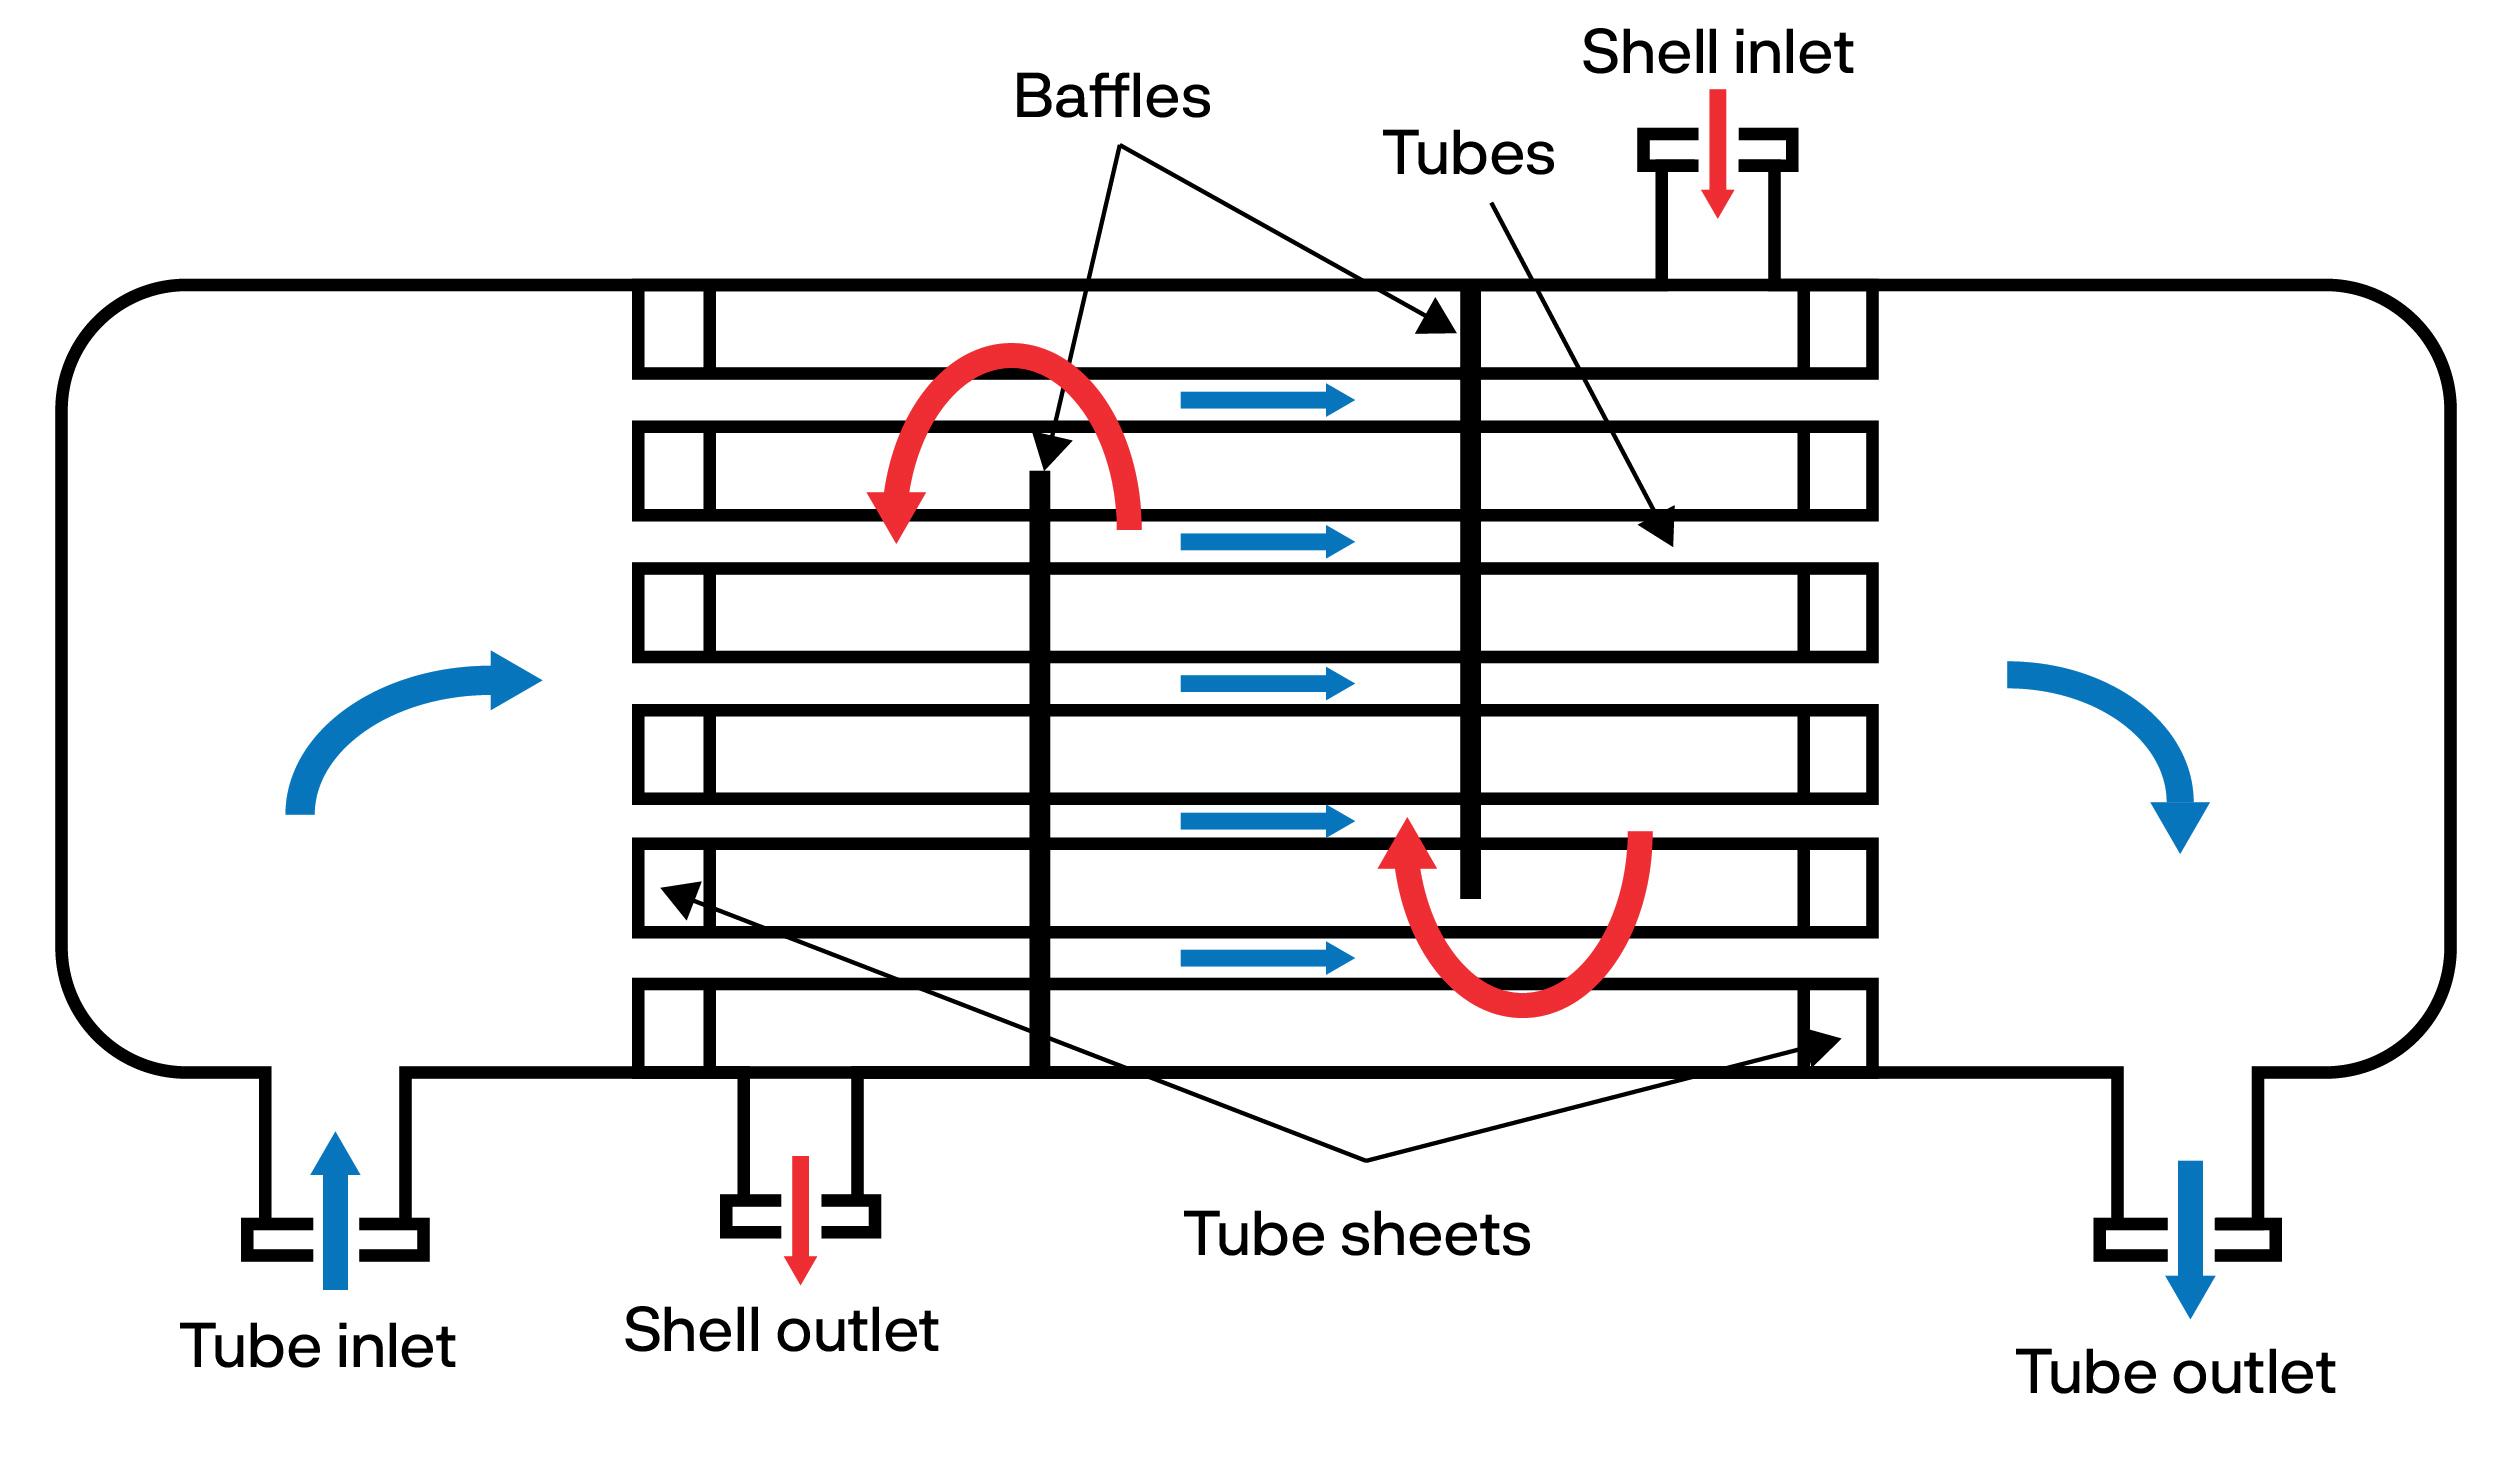
Method D, which is intended for testing nickel alloys, utilises 0.28 Nm force applied for 72 h, while method F, as designed for the testing of stainless-steel grades, requires the use of 1.58 Nm force for 24 h. Figure 4 shows a comparison of the CCT of different alloys from 6Mo grades to high nickel alloys in the two test methods mentioned before. Both tests demonstrate how the high alloyed super austenitic grade Sanicro® 35 has superior performance in crevice corrosion compared to that of high nickel grade Alloy 625 and similar performance to Alloy C-276.
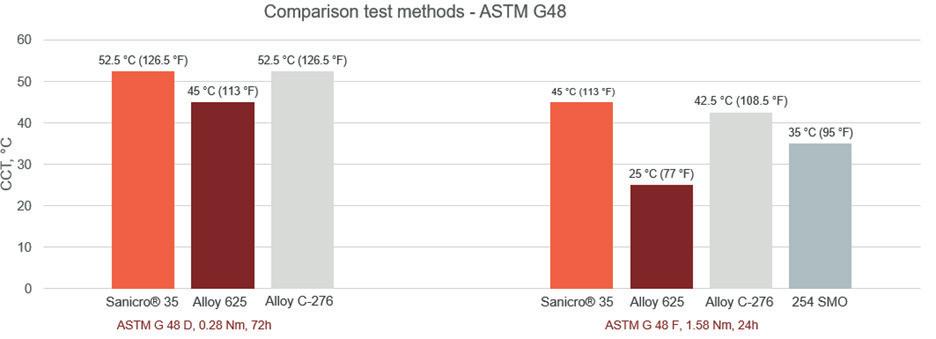
September 2023 HYDROCARBON ENGINEERING 46
Figure 4. Comparison of CCT of different alloys in ASTM G48 - D, F.
Figure 1. Schematic representation of a shell-and-tube heat exchanger adapted from FAES, W. et al.1
Figure 2. A corrosion pit with some possible chemical reactions adapted from ‘Sandvik Steel Corrosion Handbook: Stainless Steel.’3
Figure 3. Pitting resistant equivalent number (PREN) for corrosion resistant alloys.
For over 60 years we have only had one thing in mind: making measured values ever more precise. But we also never lost sight of the need for human values, too. By combining these it makes a remarkable radar level sensor possible. The best value there is: VEGAPULS 6X.


GET TO KNOW THE 6X® www.vega.com/radar WE LOVE RELIABLE VALUES. JUST LIKE OUR RADAR LEVEL SENSOR. THE 6X ®. OUT NOW!
OF VALUES.
VEGA. HOME
Under deposit corrosion
Salt deposits and fouling are common reasons for the failure of heat exchanger tubes. In the case of salt deposits containing chlorides (e.g. NH4Cl, NaCl, etc), austenitic stainless steel should be considered. Under deposit corrosion is generally mitigated by changing the process parameters, cleaning, or changing the design. Higher chromium, molybdenum, and nitrogen improves the under-deposit corrosion resistance.
Stress corrosion cracking (SCC)
The key cause for SCC is the cracking of the alloy by the combination of the corrosive environment and tensile stresses. In shell-and-tube heat exchangers, residual stresses are often found at tube-to-tubesheet expanded joints and U-bends. Weld joints also offer residual stress to the material. Figure 5 shows the SCC of various alloys in environments containing chloride.
Cases studies
Heat exchangers used in acetic acid production can be the most expensive equipment in a plant. Generally, AISI 304L can be used for acetic acid applications up to 60°C, regardless of concentration. However, at higher temperatures up to the atmospheric boiling point, AISI 316L may be applied. In acetic acid above the atmospheric boiling point, there is a risk of hydrochloric acid formation if the solution is contaminated with chlorides. Higher alloyed materials such as Sanicro 28 or super duplex stainless steel 2507 should be considered in these circumstances.
Alloy C-276 (UNS N10276) has been used in some cases with extremely severe conditions. Contamination by formic acid, catalysts, or chlorides can cause severe pitting of 316L, and therefore upgrading to a higher alloyed material is necessary. Anhydrous acetic acid and traces of acetic anhydride will also drastically increase the corrosion rate. Alloy selection depends on the amount and type of contaminants, in some cases with reducing conditions. Alloy B-2 has been applied in these aggressive conditions. More exotic materials such as zirconium are also applicable. Figure 6 shows the corrosion rate of various alloys in acetic acid with acetic anhydride and chlorides. Where acetic anhydride is present, DSS 2205 has a high corrosion rate. Here, either SDSS 2507 or a nickel base alloy, such as Alloy 625, must be used.
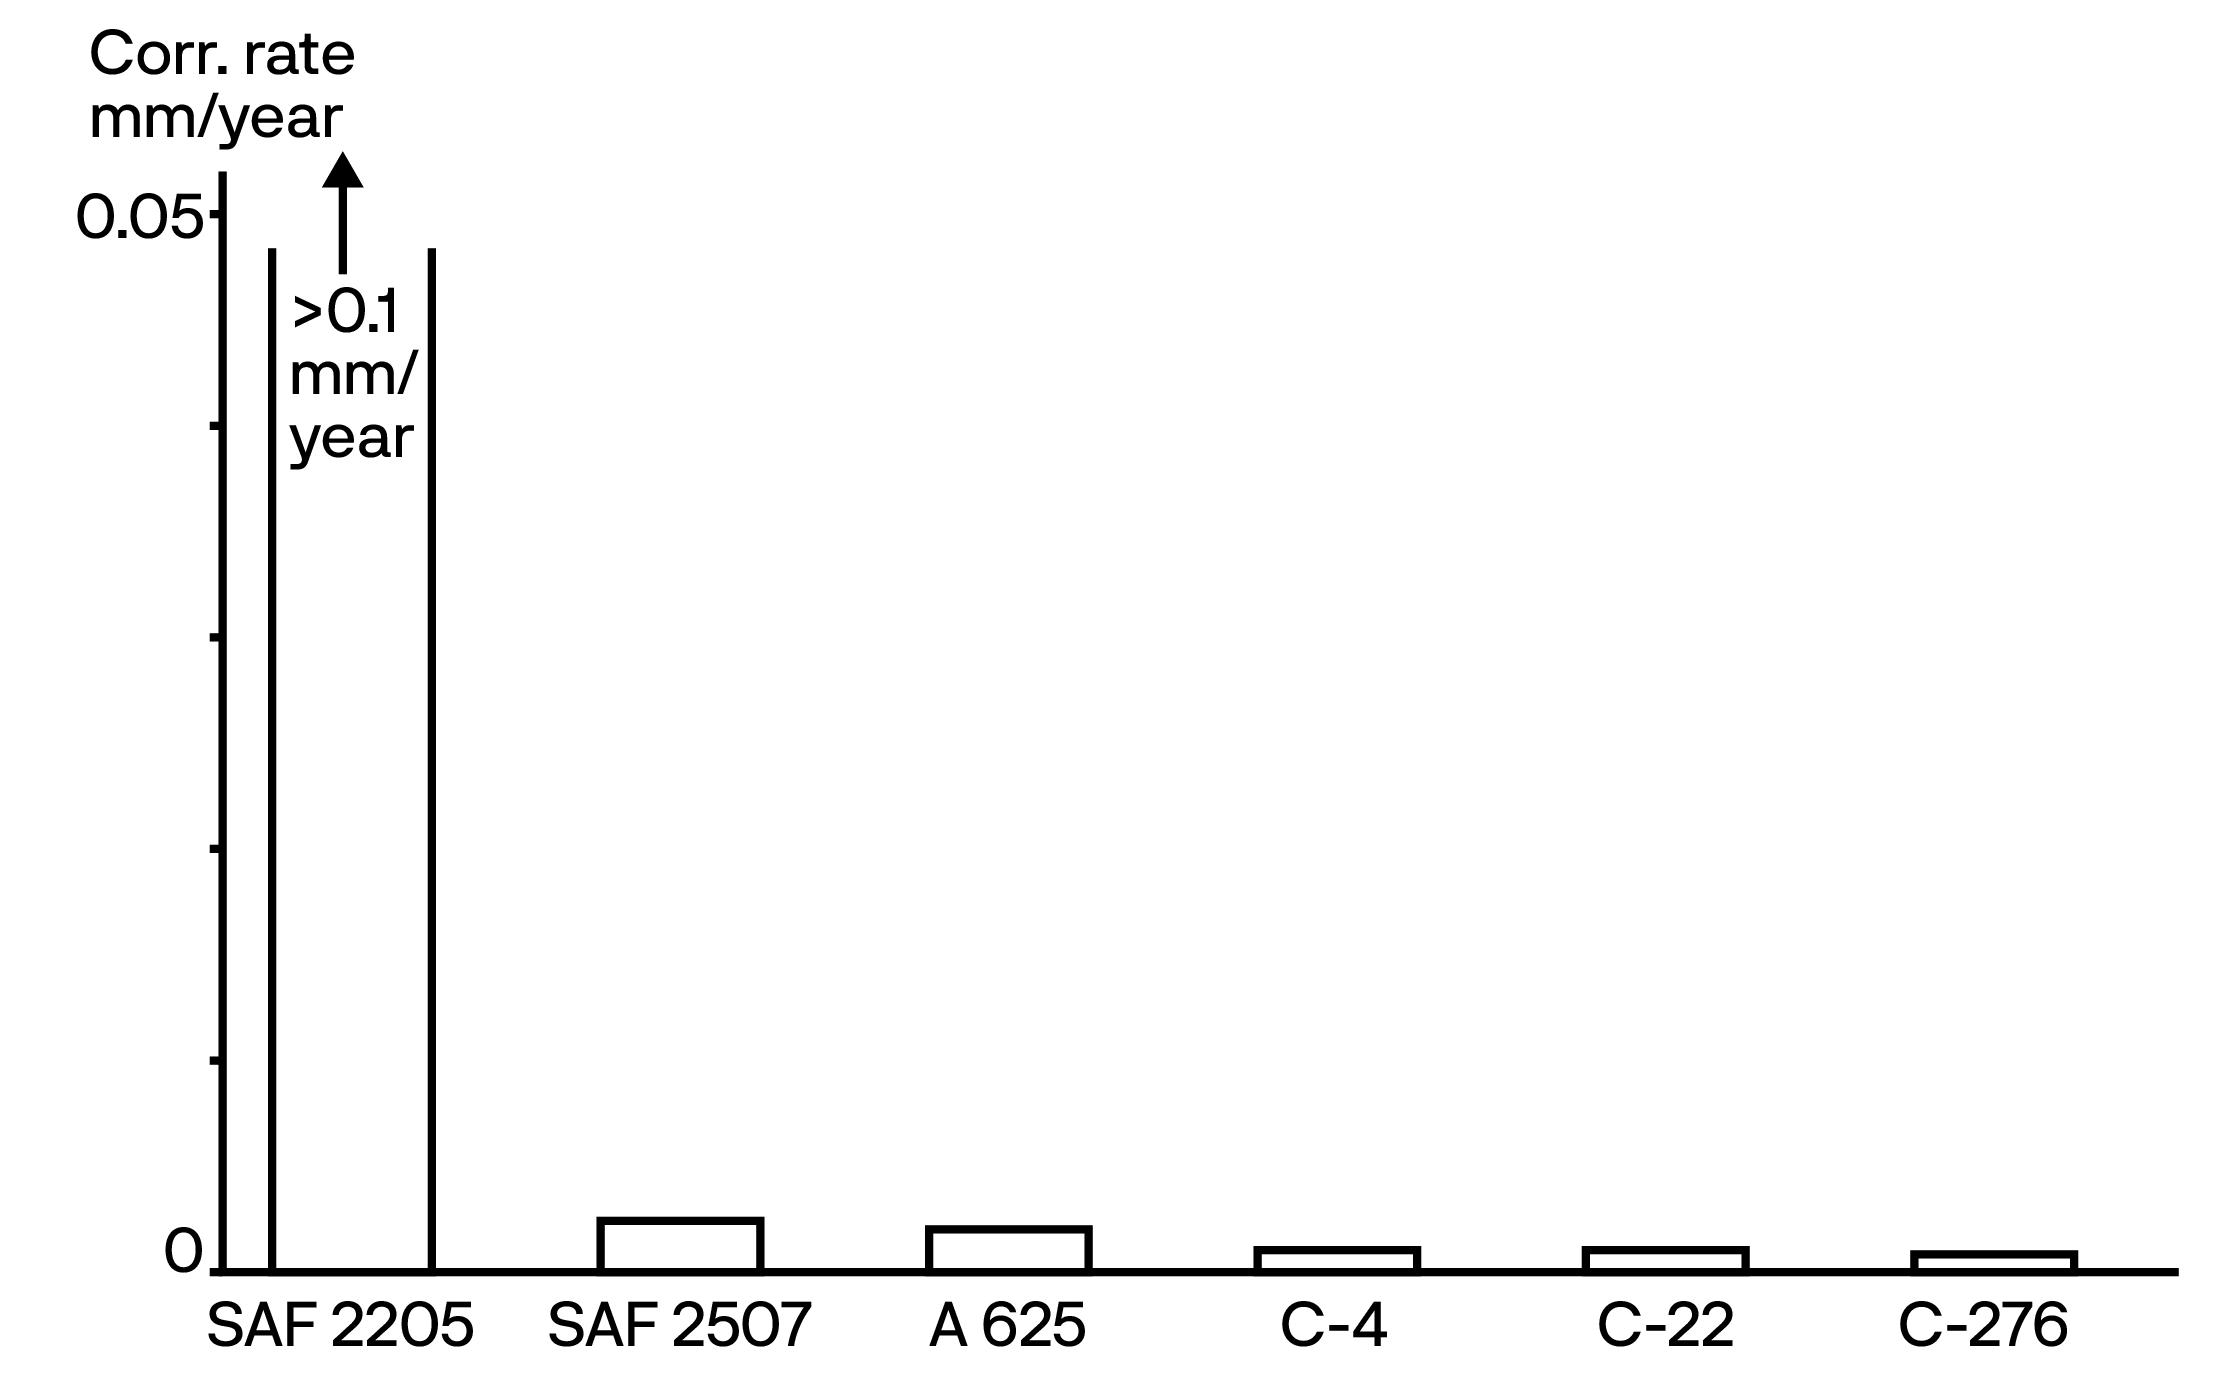
Ethylene oxide plant
A seawater cooled heat exchanger at an ethylene oxide plant (critical recycle column condenser) in Europe was experiencing several corrosion problems such as pitting, crevice, and erosion corrosion.
Many different grades were applied in the past to try to increase the lifetime of the heat exchanger without success. Sanicro® 35 was selected for its high resistance to seawater corrosion at elevated temperatures. The unit was constructed with both tubes and tubesheets in Sanicro 35. The tubesheet material was supplied by Outokumpu.
Conclusion
Plant reliability and service life justify the selection of higher alloyed stainless steel grades in many demanding chemical processes. Corrosion resistance, cost performance, fabricability, and mechanical properties are the most important criteria when choosing the right material for a piece of equipment in the CPI. It is important to highlight the importance of test installation to evaluate the corrosion performance of the alloy in certain applications considering all of the variables within the process.
References
1. FAES, W. et al., ‘Corrosion and corrosion and prevention in heat exchangers’, Corros Rev, (2018).
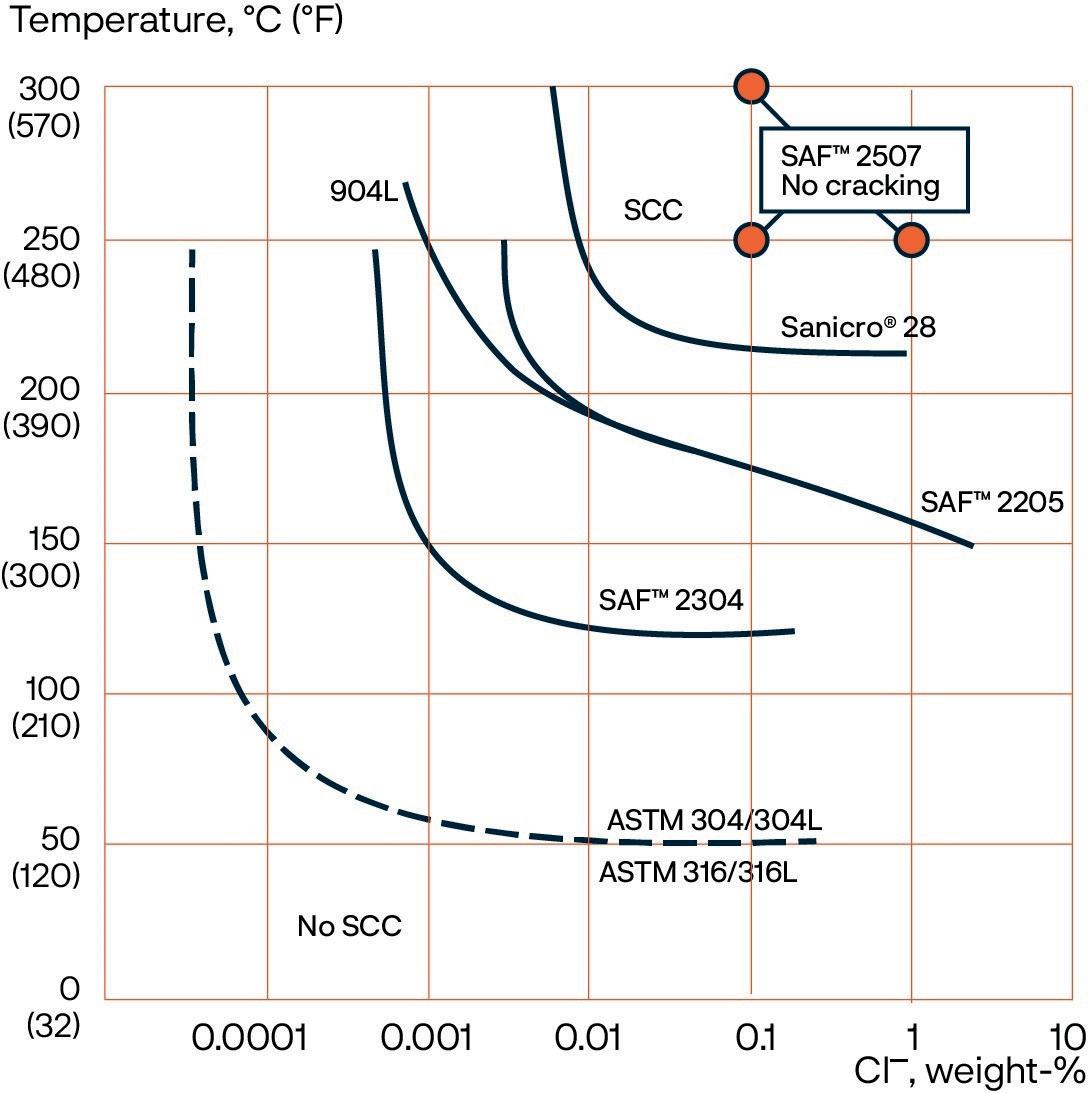
2. HOXIE, E. C., ‘The application of austenitic stainless steels and high nickel alloys for shell and tube heat exchangers’, Shell and Tube Heat Exchangers Second Symposium, ASM, (1981).
3. ‘Sandvik Steel Corrosion Handbook: Stainless Steel’, Sandviken, Ab Sandvik Steel, (1999).
4. ‘Sandvik high-performance heat exchanger tubing’, S-TU309-BENG.09.2018.
5. MCCAFFERTY, E., ‘Introduction to Corrosion Science’, Springer, (2009).
September 2023 HYDROCARBON ENGINEERING 48
Figure 6. Corrosion rates of various alloys in a boiling solution of 99.8% acetic acid, 0.1% acetic anhydride, and 200 ppm chlorides.
Figure 5. SCC resistance in oxygen-bearing (8 ppm) neutral chloride solutions. Testing time 1000 hours. Applied stress equals proof strength at a testing temperature.
Maintenance and reliability teams have traditionally been focused on managing their production assets to maintain and improve operational efficiency at the plant level. Typically, teams have relied on handheld monitors, asset management software, and condition monitoring and predictive maintenance tools to keep their fingers on the pulse of plant health.
Over time, however, these teams acquired a wide variety of tools from disparate sources, and those tools were catalogued, stored, updated and maintained in a multitude of different ways across the diaspora of business areas and plant locations. This is particularly true
in the hydrocarbon industry, where today’s companies are often acquiring new locations as they evolve to meet changing market needs, with many of these acquisitions already in possession of a wide variety of maintenance and reliability tools.
Ultimately, as these organisations grow and expand, they are finding that they not only need to manage their production assets, but also the health of their automation assets in order to sustain an effective and efficient maintenance and reliability programme. Such a strategy becomes increasingly difficult as teams add more tools to their plants as part of their digital transformation journeys, and as
and

September 2023 49 HYDROCARBON ENGINEERING
retirements
Nina Golder and Erik Lindhjem, Emerson, USA, explain how new life cycle maintenance tools can help companies manage the health of their automation assets.
education gaps reduce the number of skilled technicians available to manage programmes. Additionally, the new generation of technicians entering the workforce expect to see technology solutions in place to help them perform their tasks more effectively. Meeting this need whilst staying competitive requires an ever-increasing adoption of improved technology.
Moreover, as companies are embracing a boundless automation vision to democratise data, and move it seamlessly from field to edge, and into the cloud, they are focusing on breaking down siloes across every area of the business. Maintenance and reliability programmes that rely on a wide array of non-integrated tools create additional siloes in the enterprise, trapping valuable data that the enterprise needs to make critical business decisions. Breaking down these siloes is key to unlocking the enterprise-level analytics that improve flexibility and drive competitive advantage.
Fortunately, life cycle maintenance tools – along with a trend toward a more unified, digital life cycle experience in the cloud – are evolving to help companies better manage the health of their automation assets. Understanding the trends at the heart of this evolution is the key to building a more manageable and sustainable maintenance and reliability programme.
A trend toward simplified, enterprise-level management
Consider a chemical manufacturer with 10 sites across four continents. Such an organisation may have dozens, or even hundreds, of handheld devices across all of its facilities. In addition, some, if not all, of those sites have likely embraced the modern trend toward more data analytics by implementing machinery health software. Ensuring that each of those solutions is up-to-date is essential to confirming that all devices are operating optimally.
However, confirming all those devices and systems are updated is a task that cannot be reasonably performed on paper – especially across an organisation running with remote staff. To do so would mean keeping up-to-date records of the most current status of all devices and systems, which would take many hours of onsite work at
each plant, and the process would have to begin from scratch each time a new update was released.
To circumvent these problems, many life cycle services providers are moving toward enterprise-level portals for systems management. These portals collect data from devices and systems across the enterprise, and display it in a single, intuitive user interface. Automation, reliability or maintenance personnel can instantly see the status of machinery health software solutions, maintenance devices, and more, across every plant, from any location where they can securely access the enterprise platform.
Moreover, instead of having to sift through individual parameters – such as software versions, firmware versions, patches and updates, and more – users can opt for system or device level key performance indicators (KPIs), such as a health score ranging from 1 to 10, making it easy to see exactly which units need attention. Furthermore, these KPIs can be rolled up so that it becomes easier to see which plants, locations, business areas, or geographic areas need attention (Figure 1).
This trend toward more centralised management means that teams no longer need to maintain staff at each site to manage local maintenance and reliability programmes. With enterprise-level monitoring, a single user at a remote site can easily manage hundreds or thousands of devices. This user can sort by various areas, business units, or other parameters, to instantly build a picture of overall maintenance and reliability infrastructure health across the globe. They can also track and trend information to compare individual world and business areas against each other to set benchmarks for driving improved performance and response times.
For example, as a chemical manufacturer expands around the globe, they can manage a centralised reliability programme at the enterprise level. A single maintenance manager, or small team, can set the gold standard for how to manage systems, software, and devices across the enterprise. Using a digital life cycle management platform, the central site can see the status of devices, systems, and software across the enterprise, and instantly identify which of these require updating. Centralised managers can then reach out to the local teams to ensure the necessary updates are completed.
This means that the company no longer needs to worry that certain sites may miss out on feature upgrades, bug fixes, or updated device drivers, and that they are confident that maintenance rounds are reporting the most accurate information. With instant visibility of the health of devices and automation systems and software in a life cycle management platform, a much smaller group can easily maintain a far more holistic system and ensure device health across the enterprise.
Bringing data out of the plant
As organisations find it easier to manage their automation assets across the enterprise, they will likely bring even more of those assets into each plant. Beyond managing the automation assets, teams will need to manage the data that each of these devices collects and creates. For example,

September 2023 HYDROCARBON ENGINEERING 50
Figure 1. Tracking and trending tools help local maintenance and reliability teams drive improved performance and faster response times.
We feed on foulants.


Unsuspecting intruders can’t escape the paralyzing effects of ActiPhase advanced filtration technology. Foulants that enter our kill zone are met with an active component that transforms them into solids. Our uniquely reticulated chambers then trap the beasties for good. Want to protect your plant?


Optimize crystaphase.com
edge analytics devices will be collecting and creating data at the site of equipment, while wireless vibration monitoring sensors will be collecting and sending information to machinery health systems. Those systems will simultaneously be crunching the data to create additional information. If all of this data is siloed in individual systems across the plant, or if it is collated onsite, but never able to escape the plant level, its value will diminish rapidly.
To remedy this problem, forward-thinking organisations are implementing a boundless automation vision to seamlessly connect systems from intelligent field devices, to edge devices, to the cloud, empowering cross-functional teams to drive maintenance innovation. By using a single source of information portals, which collect asset health data from devices and systems onsite, teams can standardise and contextualise critical asset health information, and securely transfer it to higher-level enterprise systems in near real time (Figure 2).
The result is an improved capability to use focused calculations and analytics from artificial intelligence (AI) tools available in enterprise platforms. These single source of information platforms provide teams with access to a wider variety of KPIs, making it easier to develop action plans with specific goals for improving system performance. Staff can quickly see problems across the enterprise,

identify their root cause – even if it is the result of process problems further up the line – and perform more effective maintenance actions based on informed decision making. Moreover, asset health portals not only improve awareness, they also empower organisations to be able to do more with fewer resources. When organisations are pushing critical health data up to a central location leveraging AI tools, they do not need a machinery health expert at every site. Instead, small teams of experts can manage a fleet of facilities from one centralised hub, making it easier to ensure consistent asset health – even in the face of expert labour shortages.
Standardisation on all sides
As organisations see the potential in the future of life cycle maintenance and services, they are taking steps to build a foundation that can support the latest technology trends. This has led to standardisation becoming a common trend. When an organisation has a wide variety of maintenance tools from multiple different vendors, many of the problems that slow maintenance (complex records management, lack of visibility from the enterprise, etc.) are compounded. To combat this complexity, many teams are starting to standardise software across all of their facilities to simplify system management with the fewest steps possible. However, the value of standardisation goes beyond simpler visibility, to device health. It is easier for teams to perform analytics of their holistic maintenance programme health when the solutions they are comparing are the same. Moreover, as teams find it increasingly difficult to hire experienced personnel, a standardised software suite can make it easier to train staff. The fewer different interfaces a company uses, the less time staff will spend in training, and the faster they will be upskilled into experienced personnel. In addition, if a company uses the same solutions at each site, one worker can support multiple facilities more easily (Figure 3).
As users standardise systems, vendors are also making the process easier, as by thinking ahead, they can develop tools that can simplify future planning. Standardisation and upgrade tools will examine the performance of systems and identify how they are running. These solutions will help maintenance teams understand when they need to make upgrades, and provide actionable steps that the team can take to successfully optimise their systems.
Prepare for tomorrow, benefit today
In the modern, digital world, people expect services to move quickly so that they can use technology effectively. Solutions are expected to be instantly available in the cloud, and support structures for maintenance and reliability are no exception. Managing the health of automation assets can be a highly automated process with the right systems in place, and those systems will only improve in the coming years.
Whilst not every technology for streamlining the life cycle maintenance process is available today, many of the most exciting ones are just over the horizon. It is now time that teams begin preparing to adapt to these trends in order to gain the biggest advantage as quickly as possible.

September 2023 HYDROCARBON ENGINEERING 52
Figure 3. Lifecycle maintenance tools help enhance overall productivity by providing access to personalised actions and notifications that make it easier to perform maintenance actions.
Figure 2. Teams stay connected and informed with access to one or many system(s) in the enterprise, and they can manage multiple devices and system statuses, no matter where they are located.
Thomas Fahland, Implico, Germany, discusses how new data technology could lead to increased transparency across energy companies’ operations.
Energy and mineral oil companies are investing billions into new technologies and raw materials. There is a want – and need – to become more transparent, prompting such companies to seek out efficient solutions that can be implemented as rapidly as possible. This calls for modern data management and smart, global networks that can optimise supply chains and the value creation process as a whole. Additionally, the industry urgently requires courage, joint action, and new ideas. This article will discuss one such idea.

September 2023 53 HYDROCARBON ENGINEERING
Intelligent technologies can assist with efficient process management, forecasting, and transparency. Examples of these type of technologies include data analysis, blockchain, digital supply chain management, and artificial intelligence (AI). There is a great deal of hope surrounding the data that is identified, collected, measured, analysed and compared on a day-to-day basis. Too often, though, the use of these digital tools remains confined to the bounds of a company and its systems. This did not pose a problem while the industry was still dominated by the major mineral oil players, i.e., those that oversaw virtually all of the steps relevant to production and the supply chain – from crude oil production, to refinement, to service station delivery. However, the addition of far more stakeholders, resulting in market diversification and greater public interest towards the energy industry due to the current climate discourse, and the resulting energy transition, means that data processing needs to be thought about in a new way.
A number of developments are currently underway, a major one being the recent drafting of the EU Supply Chain Act by EU Parliament. Under this law, companies with 250+ employees and a turnover of €40+ million will have to be much stricter when monitoring their entire upstream supply chain, all the way through to the raw materials that they use. The provisions set out by the law are far more stringent than many national regulations that are already in place (such as in Germany). Additionally, companies whose headquarters are located outside the EU will need to comply with the Supply Chain Act if they earn at least €40 million in revenue within the EU. All stakeholders within the supply chain need to uphold certain standards in terms of sales, distribution, storage, transportation and disposal. Even though the EU Parliament still needs to formally inform the EU Council, it is expected that the law will enter into force at the end of 2023, thus creating various short-term, complex tasks for companies to take care of. These need to be monitored and accounted for.
The importance of traceability
When it comes to product information that cannot be measured, full traceability is becoming increasingly important – and not just due to this new law. The following all play a role: geopolitically-determined sanctions; carbon dioxide (CO2) emissions trading; subsidies for renewable products; quality requirements; EU sustainability ordinances; and complex classification and processing of customs and energy tax requirements. If a company manufactures its products or procures raw materials abroad, it will need to know which partners it is dealing with, and be able to document this.
Full traceability of products and raw materials; monitoring that covers all stages of production, refinement and distribution; and information about every stakeholder in the global supply chain will either be requested or required. The following questions may be asked: where does the crude oil in tank farms and refineries come from? Which raw materials can be found in the diesel that is sold to specific service stations? How high is the share of crude oil from certain states at the Port of Hamburg? It is essential to be able to provide all relevant information regarding origin,
suppliers, share of renewable energy sources incorporated into the product, working conditions, wages, transportation, customs duties, and more.
In the near future, consumers, public authorities, investors and other stakeholders will all expect industry players to have ethically-spotless sustainability profiles, transparent supply chains, and comprehensive product information that they can make available as required. This stands to have a significant influence on the energy sector and the mineral oil and petrochemical industry, given that these industries are viewed with greater scepticism than others due to the increasingly rapid pace of the energy transition and the tremendous impact that this has on global politics. The entire industry will be affected by these new requirements. Even terminal managers and other service providers in the supply chain will have to adapt their facilities, parts of their infrastructure and various services to these provisions, and offer the required level of support in order to stay on top of things.
The question is: how can traceability be ensured for the entire history of a liquid or gas product? How can we look at the final product and understand where, when, by whom and with what it was produced and distributed? This is difficult enough with standard consumer goods such as clothing; however in the clothing industry it is possible to use physical labels, imprints, embossing, etc, for traceability purposes. This is not the same for refined oil and gas products. The complexity is further compounded by the fact that knowledge about supply chains is frequently confined to information disclosed by suppliers and data found in Excel tables. As we move into the future, this will no longer be sufficient. In particular, all relevant data, figures and information will need to be made available in near real-time.
What is needed, first and foremost, is end-to-end validation of raw materials across the current IT solutions landscape to ensure transparent, sustainable raw materials management. It is important to consider that, while this branch does have communication standards for parts of the process chain – such as the PIDX/CIDX data format employed by more than 120 oil and gas companies – these ‘standards’ can neither be applied across processes nor used properly by the majority of participants in the supply chain. Additionally, the focus is often placed on customer-specific, modified point-to-point data communication that falls short of meeting modern requirements – unlike, say, real-time networking with an API interface.
Oil and gas companies need to be more agile and open, and quicker. There needs to be a move away from proprietary solutions and silo mentalities, towards cross-company data usage in global process chains – with better interlinking of data, open interfaces, and new data sources. Paperwork and folders need to be eschewed in favour of 21st century technologies that facilitate the secure provision of data across various stages of the supply chain and guarantee consistent data and information flows that are always up to date.
Even more importantly, a meta level for information that can no longer be removed from the physical product through methods of analysis or measurement is also needed.
September 2023 HYDROCARBON ENGINEERING 54

This level should be independent of the ‘measurable’ world of product flows (how much of which product was transferred from A to B and when?) as mapped out by current systems and communication chains – at least in part. A meta level can provide information about the entire history of the product, how it was produced and any changes that have been made, etc., answering the following questions:
n Where did the basic components come from?
n Which technologies and energy sources were used to refine it?
n What was added to it?
n Which types of certification does it hold?
n What is its CO2 emission factor?
n Who had a hand in production and delivery?
n Have customs duties and energy taxes already been paid on the product?
Instead of working on individual solutions, all actors in the supply chain should nourish this meta level with the required information. This would pave the way for the product’s full traceability, transparency and, ultimately, an intelligent platform on which all subsequent processes can be implemented. Only through this will the aforementioned challenges be combatted.
Biotagging: no longer the realm of science fiction
For argument’s sake, this article will assume that every molecule in the extracted crude oil and in all components added to it during subsequent processing has its own clear signature that contains all information of relevance: physical properties, current location, customs status, CO2 emissions values, actual owner(s), etc. Every participant in the supply chain can access the data that they need and change it, correct it, supplement it, and so on. The information can be accessed by owners, customs officers, transporters and hazardous materials authorities, as well as other stakeholders who have an interest in receiving all of the information about the product and, last but not least, the end customer, who can fill up their car with a clear conscience.
There are already some available technologies that allow for the addition of biological or chemical substances that do not negatively affect a product’s properties. These are used as ‘molecular vessels’ in which all relevant information is saved, and which are produced and transported based on the DNA of the product in question. This technology functions as an invisible, non-manipulable pigment that is a messenger for relevant information and that can be sorted and interpreted by computers or special machines.
Furthermore, biotagging offers more than just a guarantee for the purity of the product. It can also be used to provide proof of origin and transfer information. In fact, it appears that there are no limits as to how biotagging could be used.
Digital alternatives that allow for this meta level to be created do exist, one of which is blockchain technology.
Familiar to many thanks to cryptocurrencies, blockchain is a pure peer-to-peer network with no superordinate service providers. All information is stored in blocks, which are copied any number of times and stored on individual computers. If someone in the chain adds or removes data, this changes the information in all of the other blocks. Every actor in the digital network sees and processes the same data, and every amendment is automatically relayed to the other blocks in the chain. Encryption and distribution mean that data in a blockchain cannot be manipulated. Additionally, blockchains can be programmed to automatically trigger events and payments when certain conditions are met. They allow for the secure custodianship of highly-sensitive data and information, while individual actors can only access the information that they actually need.
However, introducing blockchain technology to a strongly diversified environment with many participants and innumerable IT systems is far too complex, time-consuming and expensive as a first step. Solutions to many of the aforementioned challenges can be found in the gradual refinement of existing IT applications and the often proprietary point-to-point integration of individual participants in the supply chain. As an example of this change, Implico has set its sights on using cloud services to track product metadata, starting with neuralgic points in the supply chain, i.e., refinery production, import and customs duties, tank mixing, and taxation.
By using these technologies, essential information can be provided, eliminating the gaps that continue to plague the supply chain today. This is the case in refinery production, for example – a process that transforms crude oil into a number of different end products, each with their own unique properties (diesel, benzine, bitumen, etc).
Although a traditional mass balance can provide information about the relationship between the respective materials used and produced, this leads to the creation of products that have a physically and chemically different composition. The manufacturing process (as well as the type and volume of energy consumed) also shapes the complex requirements that arise in its wake, whether in terms of taxation, within the framework of the EU’s CO2 emissions trading system, or the like.
Ultimately, it will be important to know the type of energy used to power these refineries in order to determine their CO2 emission factors, and those of the end products. Other examples include imports into the EU, customs, the mixing of products in tank farms, changes to the physical state of the product (e.g., LNG), types of packaging and, depending on the situation, multiple changes of ownership. In the future, the required information will be available at the meta level for all of these critical areas.
Once cooperation between all participants from a digital perspective is ensured, steps can be taken towards a future that is easier to shape, thanks to this new transparency. Priorities should be to build bridges, close gaps, and propose new approaches.
September 2023 HYDROCARBON ENGINEERING 56
Pablo Jimenez-Asenjo, Federico Neira and Nicolas Visuara, KBC, alongside Rafael Rebouças de Araujo, Joana Variani and Juan Carlos Moreno, Acelen, explore how real-time emissions monitoring drives decarbonisation.

The Brazilian refining industry is a significant contributor to the world economy. Not only is it a crucial player in meeting energy, raw material, and chemical needs, but it also has a promising future. According to the US International Trade Association, Brazil will be responsible for producing around 50% of the world’s offshore oil in 2040, about 5.2 million bpd.1 As a prominent energy producer, Brazil’s government has worked to increase domestic oil production. In addition, discoveries of pre-salt oil deposits have propelled Brazil into the top 10 of global liquid fuels producers, as reported by the US Energy Information Administration (EIA).2
However, the process of refining raw petroleum into marketable fuels and chemicals is energy intensive, resulting in carbon dioxide (CO2) emissions. Statista reports that Brazil’s refining industry generated about 0.49 gigatonnes (Gt) of CO2 in
2021.3 The Carbon Emission Accounts and Datasets-Global Refinery Emission Inventory (CEADs-GREI) estimates that oil refineries worldwide could generate up to 16.5 Gt from 2020 to 2030.4
Refineries are an indispensable link in the energy supply chain. They also have the power to contribute towards decarbonisation. To achieve this, refineries can implement various mitigation strategies. They can upgrade heavy oil-processing technologies, improve refinery efficiency, use alternative power sources, and integrate energy initiatives with other local manufacturing plants to create an industrial cluster strategy. These solutions have the potential to reduce global cumulative refinery and petrochemical emissions by 10% from 2020 to 2030, according to the CEADs-GREI research.5 To reach these goals, accurate reporting of greenhouse gas (GHG)
September 2023 57 HYDROCARBON ENGINEERING
emissions is paramount. This helps refineries identify areas where they can reduce their emissions and improve their environmental performance. Accurate reporting can also lead to higher credit ratings for disclosing refineries.
Therefore, implementing a GHG emissions management software solution is crucial. This advanced technology measures the composition and concentration of the main emissions from multiple sources throughout the plant and across all its assets – from key stacks, or even a select few. Besides calculating emissions, it also tracks energy production, energy consumption, and process efficiencies. By tracking their performance in real time, refineries can take prompt action.
Case study: Acelen, Brazil
The Acelen Mataripe refinery in Brazil is a key player in the country’s energy sector and has made energy transition one of its top priorities. With a production capacity of 300 000 bpd of oil, Acelen is committed to decreasing GHG emissions from its operations. This effort is crucial considering Brazil’s pledge to reduce GHGs by 50% in 2030 compared to 2005, per Enerdata.5
Therefore, refineries such as Acelen play a crucial role in global sustainability, but how can they ensure their operations do not harm the environment? The answer lies in embracing advanced technologies that continuously monitor GHG emissions and other pollutants. Carbon monoxide (CO), nitric oxide (NO), particulate matter (PM), sulfur dioxide (SO2), and volatile organic compounds (VOC) are some of the contaminants that refiners need to monitor.
Using a model-based approach
Acelen is taking strides to improve its emissions data accuracy and reporting by implementing an energy and emissions management system that uses a model-based approach. Automating data collection leads to more reliable results while minimising human error.
The GHG emissions management software calculates GHGs and other emission pollutants, such as CO, NO, PM, and VOCs, as shown in Figure 1. Engineers can quickly scan this data from a single pane of glass to identify patterns and/or anomalies and make informed decisions.
To ensure accuracy in emissions calculations, the emissions module uses production accounting technology. In addition, a GHG factor is commonly used. This factor considers the characteristics of the fuel, combustion conditions, and other relevant factors, such as combustor type, as shown in Table 1. By multiplying the emissions factor by the corresponding activity data, the emissions can be calculated.
It should be noted that measuring emissions depends on specific emission and regulatory requirements. The following is a general explanation of how emissions are calculated:
n A mass balance approach is often used to determine emissions, such as CO2 and SO2. This involves gauging the plant’s inputs and outputs to determine the corresponding emissions based on chemical reactions and stoichiometry.
n Correlation models provided by governmental organisations, such as the US Environmental Protection Agency (EPA), are used to calculate emissions including CO, PM, and VOCs. These models establish a relationship between certain process parameters and the corresponding emissions.
Calculating fuel gas composition
At the core of every refinery lies the process of crude production. Refining crude oil involves a complex system that involves the use of furnaces and considers each energy vector, including fuels and power, that produce Scope 1 and 2 emissions. For refiners, accurately calculating these emissions is essential, not only to comply with regulations and achieve environment, social and corporate governance (ESG) goals, but also to maintain their reputation as responsible corporate citizens and avoid costly fines. By doing so, refiners can enhance transparency and trust with stakeholders, while also identifying opportunities to reduce costs and improve efficiency within their value chain.
Furnaces module
Furnaces play a pivotal role in the refining process as they help transform crude oil into a range of products. However, burning fuels in these furnaces can trigger the release of GHGs and other emissions, demanding effective monitoring to control emissions.
The Acelen refinery employs GHG emissions management software to track all relevant emissions. These sources include all of the process furnaces, fired boilers, gas turbines, flares, and a detailed model of the fuel gas system. By incorporating the details of the fuel gas system, the model calculates the composition of the fuel gas in real time. This data, combined
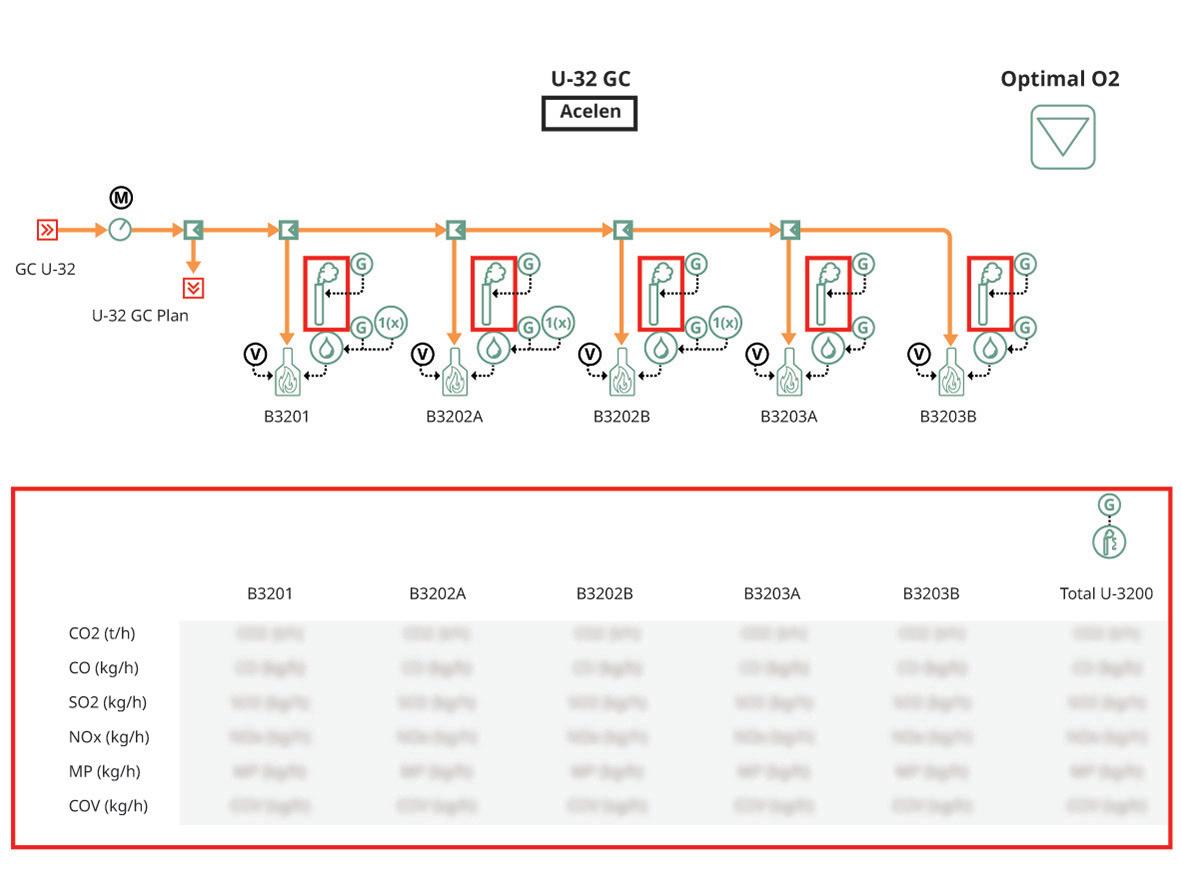
September 2023 HYDROCARBON ENGINEERING 58
Table 1.
Emissions component Correlation CO (1.3452/1000) x (volume flowrate) NO x (0.00495/1000) x (volume flowrate) NO x (0.004/1000) x (volume flowrate) PM (0.1217/1000) x (volume flowrate) VOC (0.0881/1000) x (volume flowrate)
Figure 1. VM-GEM emissions management software represents emissions data in a single pane of glass.
Emissions correlations
Manage Emissions with Accuracy, in Real-Time


Visual MESA® Greenhouse Gas Emissions Management software continuously monitors emissions and energy consumption across the entire plant operations, giving you accurate, real-time data and alerts for decision making.
Whether you choose cloud-based or on-prem, this solution with automated, auditable reporting enables you to both optimize energy and analyze Scope 1 and 2 emissions to identify and implement operational improvements for energy savings and to meet your emissions reduction targets.
Discover how your industrial plant can save over 25k tonnes of CO₂ per year. www.kbc.global/emissions-management

with measurements of fuel volume flow or mass flow for each source, provides the ability to calculate emissions for each specific emissions component. Further details are provided in Figure 2, which illustrates the furnace module.
Fuels module
The emissions management solution encompasses multiple fuel sources, whether they are internally produced or imported. It involves tracking and recording data related to various energy sources, which for Acelen includes natural gas, propane,
hydrogen, and power. This comprehensive approach is facilitated by a single platform that allows for efficient monitoring and management of emissions.
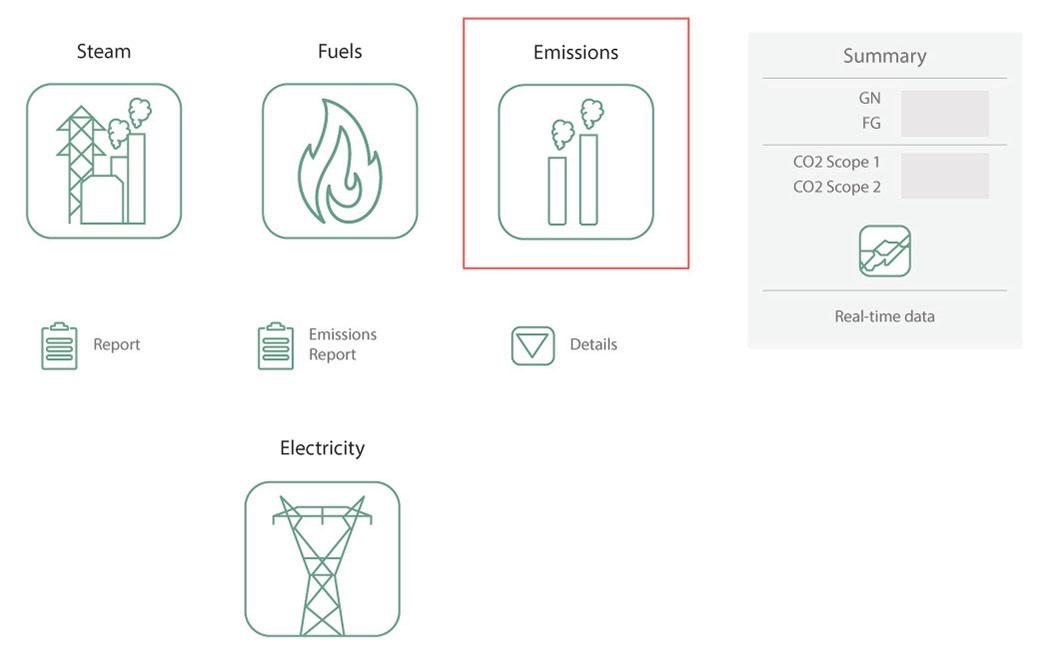
Within the fuels module, as shown in Figure 3, there are interconnected blocks that link to the burners. This configuration enables the calculation of emissions for each emission source. By accurately measuring and assessing emissions at these specific points, refiners gain insights into the environmental impact associated with their fuel use and can take appropriate measures to reduce emissions as necessary.
Visualising KPIs
Acelen employs a system that encompasses multiple modules as depicted in Figures 2 and 3. These modules include the emissions and fuel model networks. Each allows for frequent monitoring of key variables related to energy, such as fuel usage and related emissions. Figure 4 shows that key performance indicators (KPIs) related to emissions are continuously monitored and flagged in real-time, and can be inspected using the software’s drill-down feature.
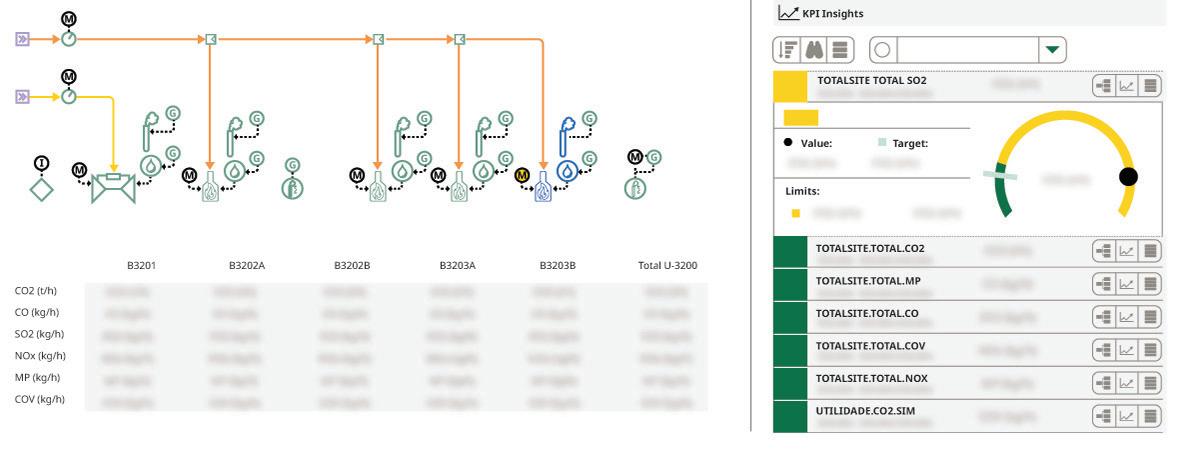
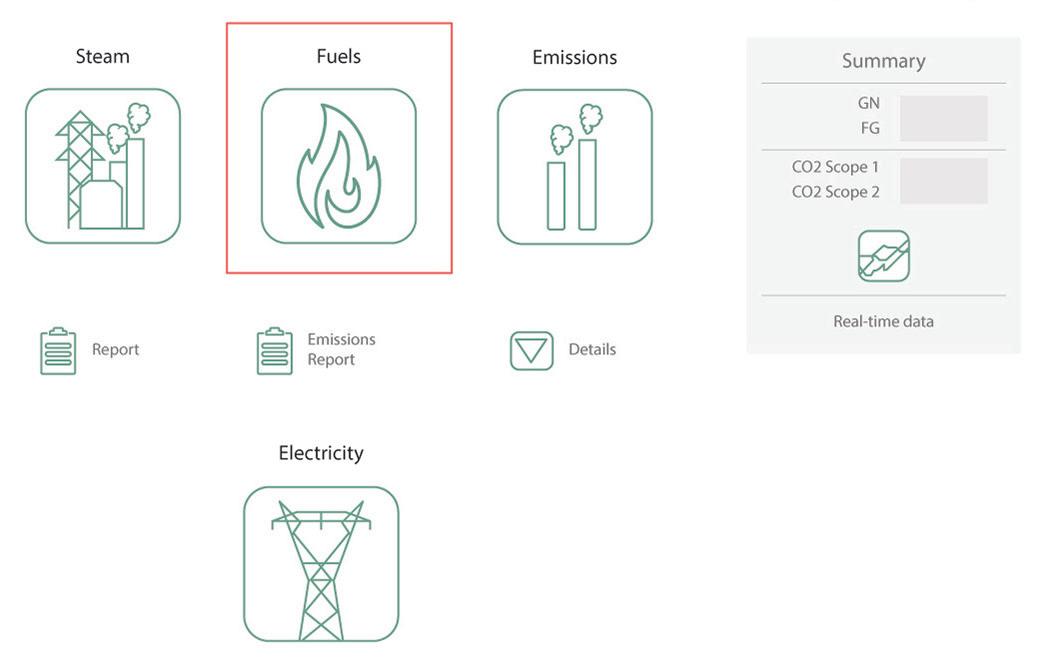
Reporting emissions
The standard protocols for producing quarterly or annual emissions reports can be tedious and time-consuming. As a result, most refineries opt to submit their emissions reports annually, some on a quarterly basis, and even fewer on a monthly basis. Generally, ESG corporate functions prepare these reports using averages, yet the information is not shared or derived from operations. This approach creates a disconnect between the two, making it difficult to take corrective action in case of deviations from targeted emissions.
To bridge this communications gap, Acelen is taking a different approach that uses an emissions reporting module to streamline its reporting process. By pulling data from various sources, including mass balance calculations, correlations models, and GHG factors, refiners can generate comprehensive, real-time reports. This unified reporting system provides a holistic view of the refiner’s emissions profile, enabling engineers to identify areas for improvement, track progress, and take corrective actions swiftly to comply with regulatory bodies.
Furthermore, this software operates in an auditable environment, ensuring compliance with strict emissions standards. The availability of auditable reports is important in terms of transparency and accountability. With full life cycle tracking, the data’s reliability and consistency ensure legal compliance.
Making decarbonisation a reality
Currently, optimising emissions is not typically included in real-time operational variables. However, with the escalating cost of carbon and the growing influence of carbon tax credits on daily trading activities, refiners will soon be more motivated to reduce their emissions on a daily basis. As a result, refiners will likely shift from annual, quarterly, and monthly targets to daily emission goals.
The ability to report emissions more frequently can be achieved through automatic, unattended energy real-time execution. This technology has a
September 2023 HYDROCARBON ENGINEERING 60
Figure 3. VM-GEM emissions management software dashboard depicts flow gas and Scope 1 and 2 emissions output from the fuels module.
Figure 2. VM-GEM emissions management software dashboard depicts flow gas and Scope 1 and 2 emissions output from the furnaces module.
Figure 4. VM-GEM emissions management software continuously tracks and alarms emissions-related KPIs in real time.
proven track record in the refining industry and is the foundation of online optimisation.
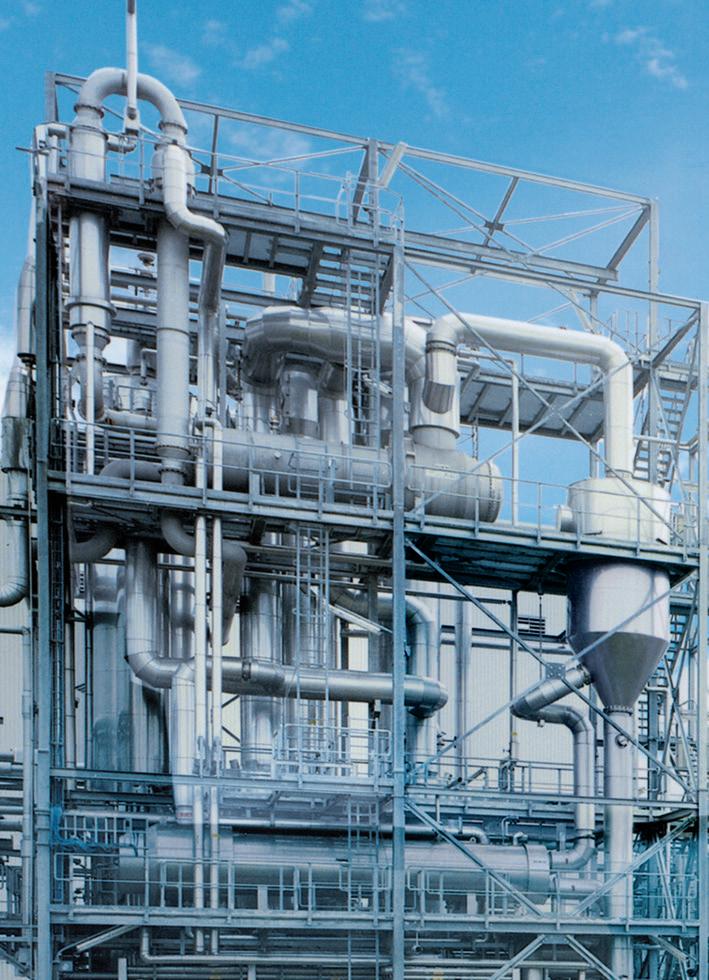
Acelen intends to use GHG emissions management technology to monitor and automatically report Scope 1 and 2 emissions data from plant operations in real time using digital data sources. Based on the energy usage and emissions patterns shown in Figure 5, refiners can optimise their operations and reduce emissions by making data-driven decisions. By meeting emissions reduction targets, Acelen anticipates that all aspects of its ESG practices are in line with the UN Sustainable Development Goals.
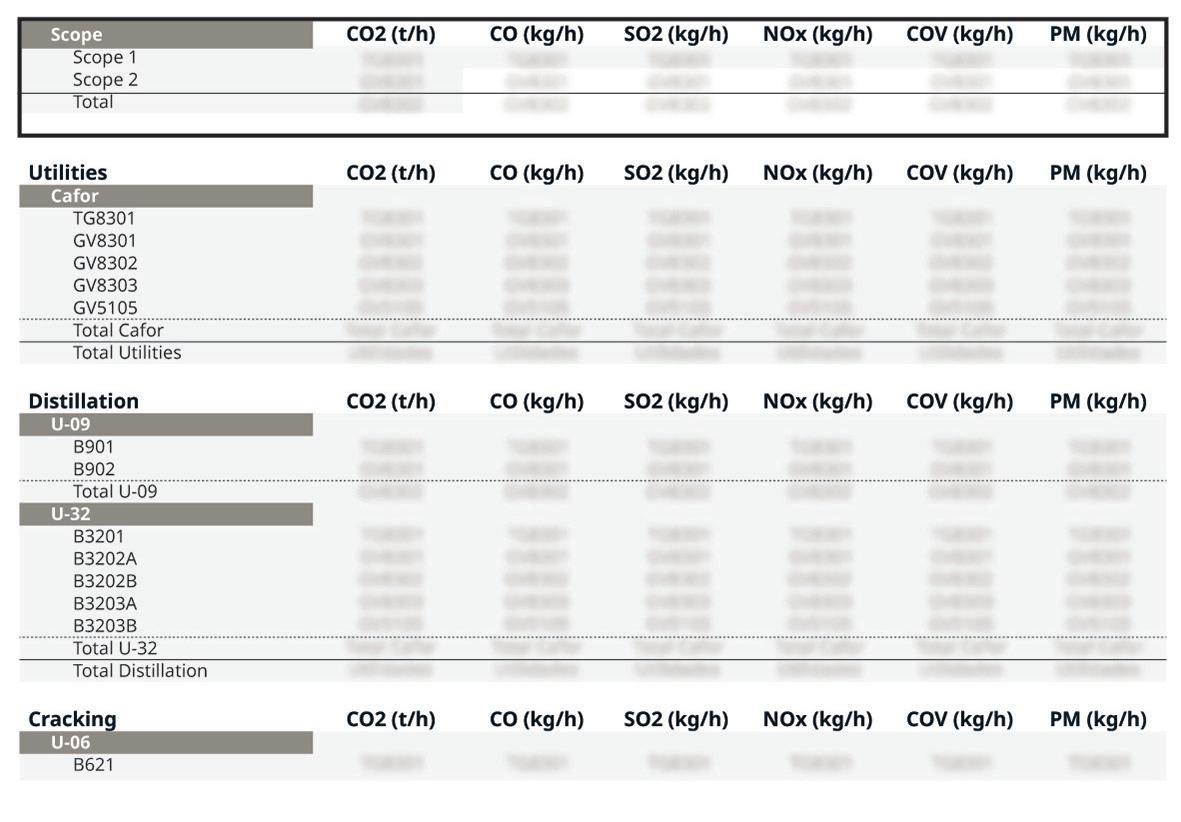
As Brazil introduces its latest carbon pricing system, the GHG emissions management technology will prove to be a critical tool for Acelen in meeting the country’s emissions reduction targets. This two-system initiative consists of an energy trading system (ETS) and offsetting system. Together, these systems aim to establish a carbon market and incentivise emissions reductions.
Acelen, like many refineries, uses ongoing performance monitoring and analysis to optimise operations, reduce emissions, and improve the accuracy of emissions reporting. For instance, Acelen reported reductions including a 6% decrease in electricity consumption, a 268 000 t reduction in CO2 emissions, and a 41% reduction in sulfur emissions. These reductions were a result of Acelen’s teams prioritising energy efficiency initiatives, ranging from the recovery of important systems and equipment, improving work processes, and optimising operations. Overall, the use of GHG emissions management technology has helped the refiner to measure the impact of these actions in emissions, highlight bad actors, and consequently meet their corporate responsibility goals while bringing decarbonisation to life.
References
1. ‘2021 Energy Resource Guide: Brazil - Oil and Gas’, United States International Trade Association, https://www.trade.gov/energyresource-guide-brazil-oil-and-gas.
2. ‘Background Reference: Brazil’, US Energy Information Administration, https://www.eia.gov/international/content/ analysis/countries_long Brazil/brazil_background.pdf, (14 June 2021).
3. https://www.statista.com/statistics/485990/co2-emissions-brazilfossil-fuel-and-industrial-purposes/.
4. https://www.tsinghua.edu.cn/en/info/1418/10889.htm.

5. ‘Brazil Energy Report’, Enerdata, https://www.enerdata.net/estore/ country-profiles/brazil.html, (February 2023).


Recover high purity with less energy.
GEA makes it possible with proven multipleeffect distillation technology & remarkable thermodynamic efficiency. We supply energy-efficient & tailor-made plants of any size for the separation of compound mixtures by distillation/rectification. .................. Be it for specialty & fine chemicals, solvents, white biotech or green energies applications. Download our Solvent Recovery brochure.
Figure 5. VM-GEM emissions management software provides comprehensive energy and emissions reporting campus-wide.


On Demand Webinars Explore our library of free-to-access On Demand Webinars, covering a range of topics in the downstream sector Visit: www.hydrocarbonengineering.com/webinars
According to a recent report from the International Organization of Oil & Gas Producers (IOGP), the oil and gas industry is experiencing an increase in injuries, fatal accidents, and lost time.1 This article examines the context of these increases and how digital technology can contribute to creating a frontline safety culture that is resilient in the face of overwhelming market pressure. It also explores how collecting workplace safety data from the front lines supports predictive analytics that illuminate trends and prevent safety incidents from occurring.
Safety threats in downstream oil and gas
The IOGP Position Statement, entitled ‘2022 Safety Trends and Responses’, summarises the following four trends in the data from its Safety Committee Member Survey:
n Most respondents indicated an increase in fatal accidents and lost time incident rate (LTIR).
n The severity of incidents increased.
n Total recordable incident rate (TRIR) and high potential incident frequency were largely unchanged.
n There was a decrease in Tier 1 and 2 process safety events.

In a complex industry like oil and gas, there is no single explanation for these increases. However, IOGP indicated a number of potential causal factors, including the following:
n The industry is under increased pressure to ensure energy security during a time of significant global disruption. As a result, there is increased worker turnover, reduced capacity, and fewer experienced workers engaged in more complex tasks.
September 2023 63 HYDROCARBON ENGINEERING
Graham Freeman, Intelex Technologies, ULC, examines how a resilient frontline safety culture can be upheld in the oil and gas industry.
n Workers are spending more time on administrative tasks, which detracts from time spent on observations and safety-critical responsibilities.
n Risk awareness and control of work procedures have diminished.
With political tensions rising among countries including the US, Russia, and China, and with an ongoing increase in demand around the world, the downstream oil and gas industry is likely to remain under considerable pressure for the near future. This will continue to disrupt safety culture and potentially lead to more severe incidents, injuries, and fatalities.
Complex work environments, such as refineries, present a myriad of safety threats. Table 1 shows some of the categories of safety hazards, as well as some examples.2
The power of predictive analytics
In traditional approaches to safety, lagging indicators are the prevailing data element for understanding incident causes. Lagging indicators are derived from incident investigation methods such as root cause analysis and corrective actions. Examples of lagging indicators include reported injuries, injury frequency, and lost time injury frequency rate (LTIFR). However, lagging indicators have three significant shortcomings:
n To produce data for lagging indicators, incidents have to occur. As safety programmes improve and incident rates come down, the data from lagging indicators will decrease, meaning predictive models based on lagging indicators will become less accurate.
n According to Wang et al, traditional approaches to safety management assume the organisational system in which frontline workers operate is static. However, complex organisational systems are non-linear and dynamic. As a result, traditional methods of root cause analysis become less effective.
n Predictive models based on lagging indicators can only predict incidents that are similar to those which have happened before. New types of incidents for which there are no lagging indicators will not be identified by existing predictive models.3
To mitigate the diminishing value of lagging indicators for preventative safety, a proactive safety management system needs leading indicators to predict incidents before they happen. Two of the most important contributors to leading indicators are observations (single instances of behaviour or conditions, including those that are safe or at-risk) and inspections (collections of observations). These two elements support four general principles about the value of leading indicators for proactive safety.
n When inspections and observations increase, incidents decrease. The more leading indicators obtained from inspections and observations, the more accurate and preventative predictive models will be.
n The number and diversity of sources providing inspections and observations data leads to fewer incidents. Every worker on the front line should be recording this data continuously.
n Too many safe inspections may lead to higher injury rates. Perfect safety inspections can be obscuring safety threats that workers are not aware of, or are afraid to report because of punishment.
n Repeated at-risk observations can result in higher injury rates. Reoccurring issues reveal hotspots that may require retraining or extensive corrective actions.
Engaging frontline workers for a dynamic safety culture
Frontline workers in the downstream industry are a critical component of a proactive safety management system that prevents incidents before they happen. While annual or semi-annual inspections by auditors and managers will continue to be important sources of data that support leading indicators, frontline workers can be an ongoing source of observations data that provides real-time data analysis for leading indicators. There are two distinct benefits to this approach.
Firstly, frontline workers bear the brunt of safety incidents in the workplace, and therefore, no-one knows the safety threats and the opportunities for improving safety processes better than they do. When frontline workers are empowered with digital applications that allow them to record safety observations as they come across them, organisations can create a continuous cycle of safety as follows:
n Frontline workers empowered with digital applications report safety observations, including substandard conditions and at-risk behaviour.
n Safety management software collects and analyses safety observations data.
n Safety and data leaders use safety observations data displayed in dashboards and visual reports to predict trends and identify hotspots.
n Safety leaders communicate proactive safety information directly to frontline workers in real time to ensure corrective and preventative actions.
n Frontline workers continue to provide data to the management system, creating a feedback loop of continuous safety improvement.
Frontline workers who record continuous safety data essentially become an army of inspectors, constantly
September 2023 HYDROCARBON ENGINEERING 64
Physical hazards from the work environment Mechanical and ergonomic hazards Exposure to chemical agents Exposure to biological agents Psychosocial hazards resulting from work pressure Noise Unshielded machinery Fumes and mist Human fluids Violence Vibration Dangerous tools Metals Pathogens Night work Radiation Hazardous structures Solvents and compounds Animal products Excessive work time
Table
1. Refinery safety hazards

fine-tuning the safety management system. This is far more effective than relying on annual inspections before engaging in corrective actions.
Secondly, frontline workers who are valued stakeholders in a proactive safety management system become critical contributors to an effective, dynamic culture of safety that helps to keep workers safe throughout the organisation. Instead of simply following directions from leadership, frontline workers become owners of their own safety, continuously feeding data directly into the safety management system and being the recipients of the safety intelligence provided by the leading indicators they support. Such a strong culture of proactive safety provides the dynamic engagement that the downstream industry needs to keep workers safe in an increasingly disrupted marketplace.
A digitally empowered front line
To achieve a proactive culture of safety, organisations need the right applications. The following are some basic principles to ensure an effective digitalisation of the safety management system:
n Frontline workers must be able to report observations at any time, from any location, without having to wait until they have access to the internet or a desktop computer. Mobile solutions that allow workers to
record observations and images of hazards and at-risk behaviour are vital tools for collecting data from frontline workers.

n Communicating safety information must be bi-directional so that frontline workers can receive important updates in real time. An application that provides real-time communications and updates of timely safety information is critical to ensure frontline workers can adjust their situational awareness and make immediate corrective actions to prevent incidents.
n Before buying digital solutions, leaders must understand how frontline workers do their jobs. Spending time on the front line is still one of the most important things leaders can do to understand what workers need. Buying a digital solution and implementing it without consulting frontline workers about their daily tasks will not yield results for a proactive safety culture.
n When it comes to safety data, having more is not always better. Many leaders make the mistake of not addressing the importance of data quality before looking to digital solutions to solve their problems. A lack of data standards, ungoverned data swamps, and isolated data storage can all contribute to data quickly becoming useless.
n A truly effective proactive safety culture is more than just a collection of tools. It requires constant communication and a dedication to continuous safety improvement, with frontline workers engaged as process owners and active leaders in their own safety initiatives.
Conclusion
As the market pressure on the downstream oil and gas industry continues to rise, safety culture will continue to be at risk. Leaders trying to navigate disruption will always be tempted to neglect safety culture in favour of strategic initiatives with more external exposure and grandeur. However, as the IOGP data indicates, when economic disruption is leading to declining safety in the industry, the time to address the challenge is now.
A digitally empowered front line is one of the most effective tools the industry can utilise to create a proactive culture of safety that improves engagement and reduces injury rates. When frontline workers feel valued and have ownership of their safety culture, injury rates decline and productivity increases. As the industry faces continued disruption, it is important to embrace the data and listen to the lessons it can teach us.
References
1. ‘2022 Safety Trends and Responses’, International Organization of Oil & Gas Producers (IOGP), https://www.iogp.org/bookstore/ product/2022-safety-trends-and-responses/, (accessed 23 March 2023).
2. EYAYO, F. et al, ‘Evaluation of Occupational Health Hazards among Oil Industry Workers: A Case Study of Refinery Workers,’ IOSR Journal of Environmental Science, Toxicology and Food Technology, 8(12), pp. 22 – 53, https://doi.org/10.9790/2402081212253.
3. WANG, B. and YUANJIE, W., ‘Big Data in Safety Management: An Overview’ Safety Science 143, pp. 1 - 15, (2021).

September 2023 HYDROCARBON ENGINEERING 66
Figure 2. Workers at a refinery with pipes and machinery.
Figure 1. Chemical specialists wear safety uniform and gas masks whilst inspecting a chemical leak.
Tim Gale, 1898 & Co., USA, explores how a broader cybersecurity programme is required to protect critical process control and safety systems in the oil and gas industry.
The rapid advancement of technology and the increasing interconnectivity of industrial systems have transformed operations and brought about many benefits. However, this digitalisation and integration of systems introduces new challenges, including the security of safety systems that provide critical layers of protection against health, safety, and environmental risks.

September 2023 67 HYDROCARBON ENGINEERING
Traditional cybersecurity focuses on protecting the confidentiality and integrity of data and information systems, while industrial cybersecurity addresses the need for protection of critical process control and safety systems, such as those used in the oil and gas industry. The availability and integrity of systems that perform safety controls, alarms, and interlocks (SCAI), must have security at the core of their design and operating environments.
As operational technology (OT) and information technology (IT) systems converge, process control systems may be exposed to cyberthreats. A successful cyberattack on these systems could disrupt the normal functioning of critical processes, leading to equipment failure, environmental damage and the endangering of human lives.
Challenges
Many industrial facilities rely on legacy systems that were not originally designed with cybersecurity in mind. These ageing systems often lack any security features, which make them more vulnerable to cyberattacks.

The integration of OT and IT networks enables data exchange and real-time monitoring, but also creates potential entry points for malicious actors. This connectivity between OT and IT networks requires carefully considered security measures to prevent unauthorised access and protect critical assets.
Malicious actors have knowledge of the inherent vulnerabilities in these systems and have access to increasingly sophisticated tools which can exploit those weaknesses. Newly discovered vulnerabilities and evolving technology make it difficult for asset owners to maintain security through patches or introduction of cybersecurity measures. Adversaries can now use artificial intelligence (AI) as a development tool to quickly exploit systems. A layered approach to security is required to deal with these risks.
Safety system security
The primary goal of cybersecurity, in the context of process safety, is to protect the availability of safety systems as a critical layer of protection against catastrophic events.
The most secure approach is to preserve the independence of basic process control systems and safety systems. Maintaining separate controllers, networks and engineering stations results in an environment that is far more difficult to compromise than an environment where a common network with a single engineering station for combined system engineering and maintenance is utilised.
Typically, the justification for combining the networks and engineering stations in a basic process control system and safety system design is to increase convenience and capital savings. Regarding convenience, proper engineering and configuration of the safety instrumented system (SIS) should eliminate frequent interaction with the code of the protection system. Nothing about the separated systems approach limits the ability to perform normal maintenance and/or provide appropriate proof test capabilities.
The risk of compromise at the engineering station or the network (the two common components) – which could allow access and manipulation of both the basic process control system and the safety system – is sufficiently high that it should be designed out of the system. Passwords and manual procedures for user authentication may be in place; however, each technical measure has its own inherent vulnerabilities.
The following should be used as the minimum basis when designing safety systems:
n Provide for the physical security of safety system controllers and their associated network. These should be isolated in their own locked panel that is located in a room protected by appropriate physical security measures. Safety system engineering stations should also be in a secure area. Access should be limited to approved and trained personnel only. Remote access to any safety system engineering station should not be permissible under any circumstances.
n The engineering stations used to maintain safety systems should be automatically locked when they are not in use and should log out of engineering functions after a reasonable timeout.
n All controllers, specifically safety controllers, should have a method to disable downloads, and that should be their normal operating mode (i.e., a key switch). Any download to a safety controller should be detected and alerted to management. Full downloads typically put all outputs into the safe state, but partial downloads may be possible depending on the manufacturer and model of the system. No downloaded or forced logic should be permissible without the knowledge of the operations team through indication on operational graphics.
n Safety system network connections should be limited to controllers and engineering stations only. These should be physical networks, not virtual local area networks (VLANs), on the basic process control network. This network infrastructure should be isolated and secured in locked panels.
September 2023 HYDROCARBON ENGINEERING 68
Figure 1. Cybersecurity for ICS helps protect health, safety, environmental and critical assets.


For all your critical infrastructure needs, o shore and onshore. O shore automation control systems face cyber risks that may not have been identified or addressed. Enhanced risk assessments and mitigation, field verification, training and continuous detection improves system preparedness to meet threats and challenges head-on. Learn more at 1898andco.com/hydrocarbonengineering23
n The safety requirements specification (SRS) for the safety systems should include, in addition to the safety requirements, the security requirements. Documentation of the controls in place, the testing methodology, and the conditions for any bypass of these controls should be maintained just as it would for the safety requirements.
n Safety systems should be managed separately by an independent group maintaining separation of duties between the basic process control system and critical safety systems. Accounts for these two different sets of users should be separate and governed by the principle of least privilege.
Broader cybersecurity programme
Incident response plans should account for business continuity scenarios and include lines of communication and precise definitions of specific events and the actions that should be considered in response.
Industrial facilities should conduct vigorous tabletop exercises designed to enhance the organisation’s ability to respond and recover from a cybersecurity incident. Weaknesses and areas of improvement can be identified by simulating realistic scenarios and allowing responders to exercise their response.
Existing components of the cybersecurity programme that are not effective can be identified and corrected or replaced. These tabletop exercises should be performed regularly, and as a training mechanism for new personnel, to allow for changes in technology and threats.
Asset owners should think of cybersecurity as a life cycle and not as a destination. The process is never-ending, much like a programme to safeguard the safety and health of plant personnel. The programme must be continually maintained and include a training component designed to raise the awareness of personnel. Training should be targeted to the stakeholder’s role in the life cycle of the industrial control systems (ICS).
Developing prudent cybersecurity strategies for the ICS means analysing the possibilities and reducing the risk to acceptable levels. Risk associated with OT systems should be assessed in a dedicated risk assessment that is conducted by a team of industrial cybersecurity professionals and a team of relevant stakeholders including operations, maintenance, engineering, management and vendors. Any significant risk identified should be addressed with a mitigation plan that targets the specific causes and mitigates the consequence of the risk. Risk should be reevaluated during plant upgrades or additions of new equipment so that design decisions and assumptions are challenged.
The entire OT environment should have strong controls on access in place, both from a physical perspective and from a network access perspective. Only approved and trained personnel should be able to physically interact with an ICS, and any permitted
remote access should be controlled by technology that limits access to approved users and allows for careful monitoring of activity. Multifactor authentication should be a requirement for any remote access to OT systems.
A comprehensive industrial cybersecurity management system should be developed that includes policies and procedures designed to provide guidance on the controls to be deployed, as well as the allowable activity of personnel. Technical measures that provide layers of protection against cyber incidents should include allowance for legacy systems and cover greenfield construction where the systems can be designed with security as part of the initial design.
The architecture of the ICS should be designed to limit the ability to navigate across the network from one subsystem to another. Data that needs to transition the boundary of subsystems should be limited to the specific endpoints and protocols required. This segmentation of systems also allows for detection of network activity that is out of the normal communications behaviour and alerts management for investigation.
Where possible, the endpoints of the industrial control system should be hardened against known vulnerabilities. Patching of computers should be conducted in careful collaboration with the vendor that includes a backup plan should components of a system stop functioning as expected. User accounts should be limited to the least privileges possible and be monitored for changes in access patterns or unusual activity.
Malware should be protected against with robust anti-malware software. Application control is a powerful tool that helps limit the execution of unapproved software. The system vendor should be consulted to assess its tested and approved applications supporting malware detection and protection.
A better approach to design
For the most critical safety functions, engineering should follow the guidance of the Cyber-Informed Engineering (CIE) and Consequence-driven Cyber-Informed Engineering (CCE) frameworks from Idaho National Labs. Both systems involve a rigorous process to engineer risk out of critical systems. Cybersecurity should be included as a core element of engineering in the same way process safety is, and these systems facilitate the appropriate thinking and cultural elements into the process.
Be aware of today’s realities
To maintain safe operation of processes, it is critical to ensure the resiliency of critical process control and safety systems. Asset owners must consider a shift in the culture of design and operation that recognises the risks of technological change in an evolving operational landscape and prioritises security.
September 2023 HYDROCARBON ENGINEERING 70


13 - 16 NOVEMBER 2023 Lago Maggiore, Italy Brought to you by Sandil Sanmugam, Portfolio Director, Europe, World Refining Association T: +44 207 384 7744 E: sandil.sanmugam@wraconferences.com If you want to discuss how you can get involved in ERTC 2023, please contact: THE MUST-ATTEND CONFERENCE FOR REFINERS AND TECHNOLOGY PROVIDERS Speakers include: • 700+ downstream business leaders in one place • Keynotes from our 2023 Co-host Eni, sharing their vision for the refining industry • Regulatory announcements from the European Commission, FuelsEurope, and Concawe • 8 technical streams • The first-ever ERTC Industry Awards to recognise refining excellence over the past year! What you can expect from ERTC 2023: Join us in Lago Maggiore, Italy: Chief Climate Change Advisor,
Jeremy
Shell
Mineau Downstream Onshore Process Engineering Studies, OneTech, TotalEnergies Berta
Cabello Renewable Fuels Director, Repsol
Sorin Ivanovici Head of Department Hydrogen & Synthetic Products, OMV
Amber Russell VP Refining, BP
Carine Strand Low Carbon Solutions, Equinor
Antonio Joyanes Head of Energy Parks, CEPSA
Ignazio Arces Head of Refinery Asset Management, Energy Evolution and Transformation, Eni


www.globalhydrogenreview.com A new magazine focused on the global hydrogen sector Read the issue here Subscribe for free: The Summer issue of GlobalHydrogenReviewis out now
The cybersecurity of critical national infrastructure (CNI) is hardly a new source of concern. Research conducted in the past year revealed that 65% of CNI in the UK and US has been hit by a cyberattack. But what is often harder to determine is how they are being targeted. Having more visibility where cyberattacks originate helps security teams to visualise their impact, prioritise imminent threats and build defences. This is why it is important for energy companies to monitor the dark web: the ‘hidden’ part of the internet which cannot be accessed by standard browsers. Here, energy companies are frequently discussed on forums, and stolen company data, as well as access to company networks, is auctioned to the highest bidder. While this activity can have a dramatic impact on energy companies, it also allows them to build threat models for better protection.
A growing concern
On 7 May 2021, Colonial Pipeline, the largest pipeline for refined oil products in the US, reported a cyberattack. At the

time, the company said the attack on its IT systems forced it to close down operations, but the real impact only became clear in the following days: millions of people panicked and tried to quickly fill their tanks, some even using plastic bags. Petrol prices increased significantly while many petrol stations were running completely out of gas. After more than a week, operations started to resume but full functionality was only achieved later on. To this date, it is still unclear how exactly the cyberattack took place. Despite this, it is likely that this was one of the first major corporate cyberattacks that started with a password from a breached employee email account that was sold on the dark web.
Since then, threat actors have become more specialised in targeting critical infrastructure. Attacks are also increasingly severe based on an increased knowledge in developing new malware. In 2022, a state-aligned hacking group called ‘Sandworm’ used a particularly dangerous type of malware that can directly control electricity substation switches and circuit breakers, in a targeted attack on Ukraine’s power supply. In May 2023, cybersecurity researchers identified
September 2023 73 HYDROCARBON ENGINEERING
Dr. Gareth Owenson, Searchlight Cyber, UK, discusses how dark web intelligence can protect the oil and gas sectors.
novel operational technology (OT) / industrial control system (ICS)-oriented malware, designed to cause electric power disruption.
How dark is the web?
The starting point for these, and many other attacks, is often the sharing of company credentials by cybercriminals on the dark web. This part of the internet requires a special browser to access and is purposely hidden for various reasons. Often, this is to avoid scrutiny by law enforcement and government, so the dark web is an important channel for citizens in repressive regimes. However, the majority of dark web services host illegal and harmful content, from tools like exploits and malware, to drugs, stolen personal information and counterfeit goods.
The dark web has been in existence for decades, but really grew with the emergence of cryptocurrencies such as Bitcoin. With both providing a high degree of anonymity, most activity on the dark web is now of a commercial nature. Many cybercriminals sell access to company networks, stolen email logins or confidential documents, safe in the knowledge that their transactions are hard to trace and interrupt by law enforcement. This makes it vital for companies to ‘see’ the activity in the dark web so that they can take measures to minimise the impact of attacks.
Shedding a light on dark web activity
In order to help energy companies better understand the risks that they are facing, Searchlight Cyber recently published a report looking into threat actor activity targeting the energy sector. A key finding is that routinely, auctions for initial access to energy companies happen on the dark web. These work like conventional auctions: the seller sets a start
price for a bundle of, for example, company credentials, the increments of the bids and a ‘buy it now’ price. Most auctions specify the country of the organisation and its revenue and, in some cases, company names. It is clear that cybercriminals target companies all over the world, and across the whole spectrum (upstream, midstream and downstream) in both oil and gas, and also renewable energy organisations.
It is also clear that different types of access are for sale. Most common are remote access software and compromised VPNs. Auctions for corporate credentials – email addresses and passwords, usernames, and even password-keys in some instances – can also be observed. These give the buyer everything they need to gain access to a system. In some cases, sellers also revealed how they obtained these credentials. Finally, auctions for sensitive company data, often referring to OT, and tutorials and documents relating to the vulnerabilities of components of industrial systems can also be found. All of these insights are very concerning, but also show where energy companies are vulnerable and which gaps in their security systems they should address in their threat models.
Taking action
As cybercriminals continue to evolve their capabilities and skill sets to be able to bypass existing security solutions, security professionals must find new ways to gather intelligence and proactively protect their assets. One way to do this is to harness the power of dark web intelligence.
Dark web intelligence enables security teams to conduct an effective ‘reconnaissance’ stage, right at the beginning of the ‘kill chain’ when threat actors are planning their cyberattacks on dark web hacking forums, and buying the exploits and tools they need on dark web marketplaces. By starting this early, oil and gas companies can make a dent in an attack plan and take preventative action that stops their networks from being breached in the first place. However, concerningly, more than a quarter (27%) of oil and gas Chief Information Security Officers (CISOs) still believe that activity on the dark web has no impact on their company, which suggests they are missing this opportunity. Furthermore, recent research shows that 72% of oil and gas companies are already gathering data from the dark web. While this is a promising start, it is notably less than comparable high-risk industries such as financial services (85%), manufacturing (83%), and transportation (81%).
Intelligence-based threat modelling
One way to stay ahead of cyber threats is by building threat models and feeding them with intelligence gathered from the dark web. The intent is to provide defenders with a systematic analysis of the probable attacker’s profile, most likely
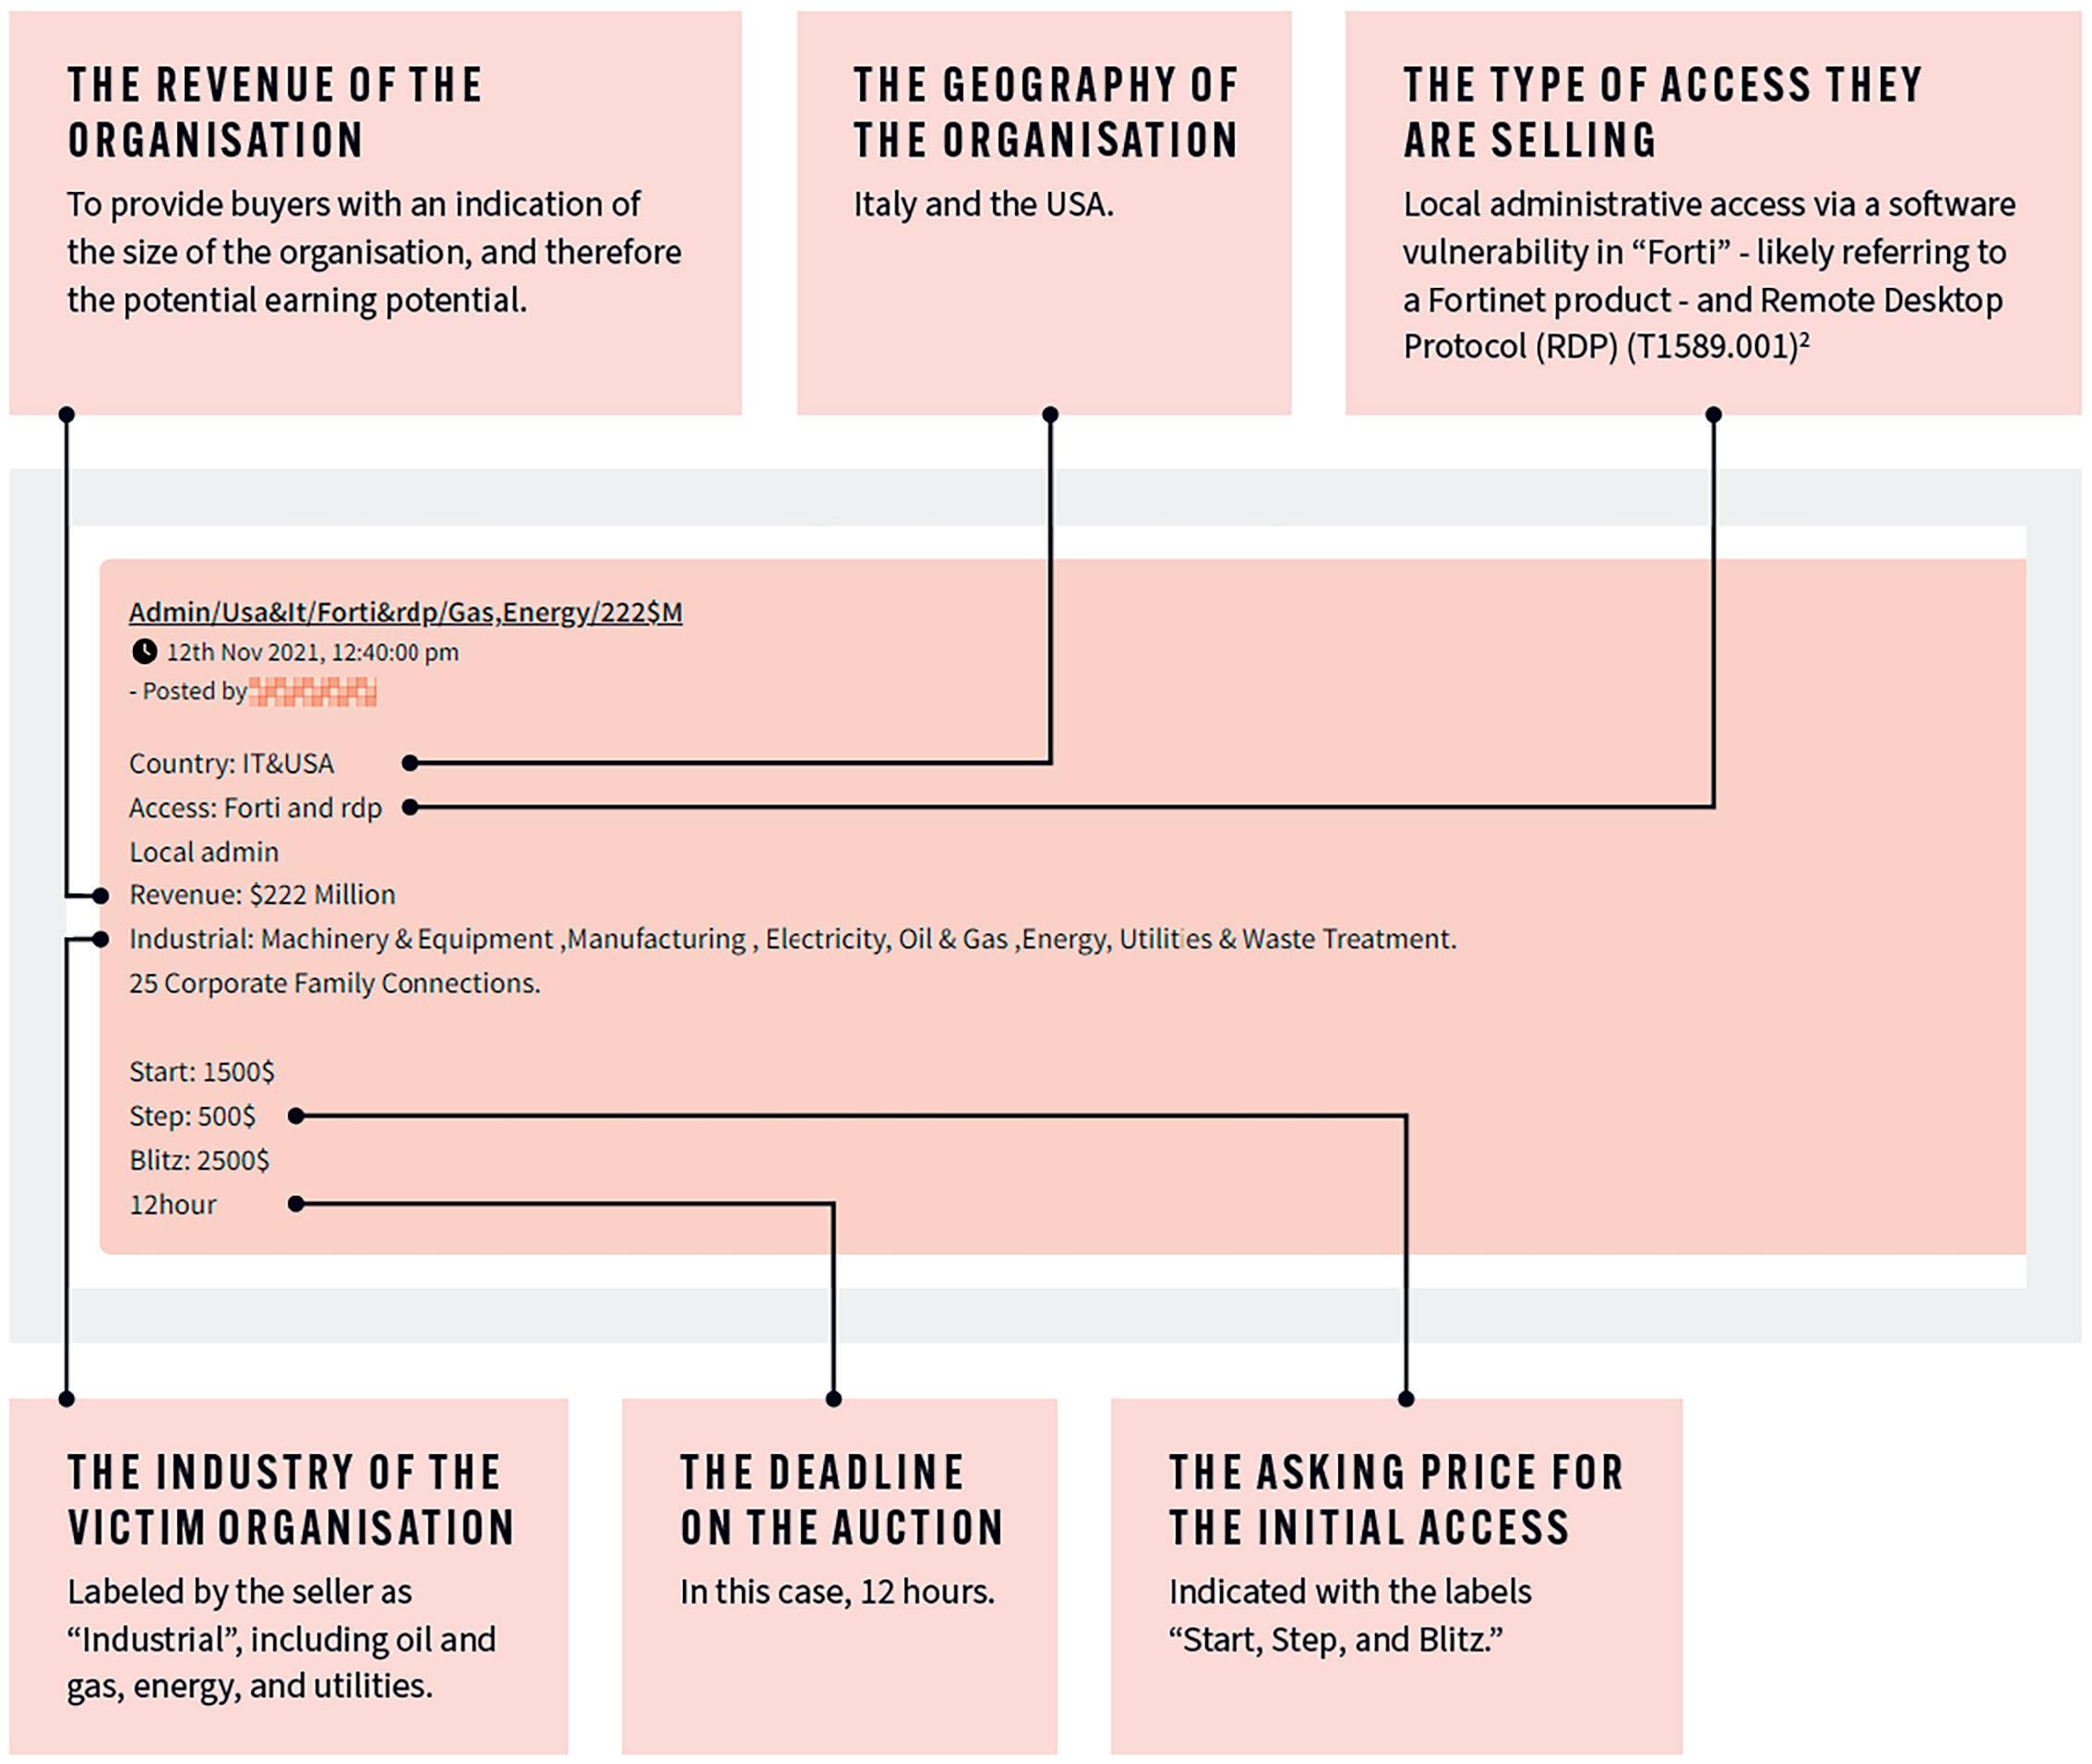
September 2023 HYDROCARBON ENGINEERING 74
Figure 1. An example of a dark web forum post targeting an energy organisation and the details that cybercriminals include.
Join the leading technical conference for the refining and petrochemical industries.
attack vectors, and the assets most desired by an attacker. Threat modelling aims to answer questions such as: “where are my high-value assets?”, “where am I most vulnerable to attack?”, “what are the most relevant threats to me?”, and “is there an attack vector that might go unnoticed?”
The first step of threat modelling involves identifying the assets that are likely to be targeted by adversaries. This includes critical and sensitive systems, customer data, employee data, financial data, intellectual property, and IT network information. In addition, energy companies need to consider their ICS, OT network information, and system availability.
By understanding the assets, security teams can establish the threat actors and their tactics, techniques, and procedures (TTPs) through a combination of first-party and third-party collection, such as threat intelligence and open-source intelligence.
After identifying the targeted assets, the next step is to analyse the potential areas of weakness and possible countermeasures. This involves the understanding of how each asset may be attacked and continuously updating this analysis to keep pace with the changing threat landscape.
Security teams must establish adversaries that target their specific sector. By utilising threat intelligence and open-source intelligence, security teams can gain insights into known threat actors, recent campaigns, and the techniques used.
During the third step, security teams must identify trigger events that could lead threat actors to initiate an attack, such as the announcement of a new software vulnerability or the timing of financial results. By incorporating these events into
the threat model, organisations can determine their most vulnerable periods.
The final step is the creation of an attack map that integrates all of the components discussed above. The visualisation provides a comprehensive view of the organisation’s specific threat landscape, including targeted information, likely attack types, TTPs of the attackers, detection opportunities, and prioritised countermeasures.
By creating a threat model with dark web insights, security teams are able to identify and mitigate potential threats on time. But as attackers constantly evolve their tactics and new actors emerge, it is important to remember that threat modelling is an ongoing process and must be regularly updated to adapt to the evolving threat landscape.
Better decisions based on insights
As cyberthreats are growing more sophisticated, dark web threat intelligence should be considered as an integral component to enhancing an organisation’s security posture. As most cybercriminals rely on dark web infrastructure to conduct their operations, monitoring this channel can vastly reduce the chance of threats taking hold and disrupting business operations.
The good news for energy companies is that while the attacks aimed at them originate in the dark web, it can also be the place to gather invaluable insights. With these insights, they can fill crucial knowledge gaps and make the right strategic, operational, and tactical decisions.

September 2023 HYDROCARBON ENGINEERING 76
Page Number | Advertiser 69 | 1898 & Co., part of Burns & McDonnell 75 | AFPM Summit 07 | Avantium 29 | BASF 43 | Chevron Lummus Global (CLG) 51 | Crystaphase 23 | Curtiss-Wright EST Group 39 | Distillation Equipment Company Ltd 71 | ERTC 17 | Eurotecnica 61 | GEA 12 - 13 | Halliburton, Multi-Chem 33 | Heurtey Petrochem Solutions OBC | Hitard Engineering 59 | KBC, a Yokogawa company 04 | Ketjen IBC | Merichem Company 11 | Optimized Gas Treating, Inc. 55, 62, 65, 72 | Palladian Publications 25 | Paratherm 20 | Rembe® GmbH Safety+Control 37 | Sabin Metal Corp. IFC | Selective Adsorption Associates, Inc. 02 | Topsoe OFC & 19 | UNICAT 47 | VEGA 26 | Watlow 35 | W. R. Grace & Co. AD INDEX