March 2023


www.mercuryadsorbents.com Optimized Mercury Removal With MERSORB® mercury adsorbent pellets MERSORB® mercury adsorbent pellets – a Trademark of Nucon International, Inc. (NUCON®) • PROVEN RELIABLE – EVEN IN CRACKED GAS • HIGH MERCURY CAPACITY – HOT, COLD, WET or DRY • MORE PELLET SIZES – MORE PROCESS DESIGN FLEXIBILITY • LOW MOISTURE – FAST START-UP • 40 YEARS EXPERIENCE – ADSORPTION PROCESS DESIGN Your Experts for Mercury Removal – in Ethylene Plants PROVEN PROCESS – PROVEN PRODUCTS AntiMercure® is a Registered Trademark of Selective Adsorption Associates, Inc. for its Process Engineering Services MERSORB® is a Registered Trademark of NUCON International, Inc. for its mercury adsorbent pallets • Cracked Gas • Ethane Feed Gas • LPG, Naphtha, & Light Condensate Feed Liquid • Regen. Gas from Cracked Gas Driers • Light Olefin Gas from FCC Units • AntiMercure® Process Engineering • MERSORB® mercury adsorbent pellets
in order to develop a more mature cybersecurity posture.
36 A step change in catalyst development

Mark Stuckey, UNICAT Catalyst Technologies LLC, discusses the emergence of next generation spherical catalysts and their impact on yield increases and reduced carbon dioxide (CO2) emissions in tubular reformers.
THIS MONTH'S FRONT COVER
44 Racing to find the right separation technology
Vic Scalco, General Atomics Electromagnetic Systems, USA, details the importance of selecting the correct separation technology in order to support growing petrochemical demand.
51 Trays for mega towers
Ang Chew Peng, Hou Peng-Cheng and Senthil Krishnamoorthy, Sulzer, discuss various types of high-performance trays for large diameter propylene fractionators.
59 Lessons in VDU performance

Jim Lines, Graham Corp., USA, lists the VDU ejector system field lessons learned by a performance improvement engineer, through the lens of four specific case studies.
69 Time for a retrofit?
Nathan Hill, CALGAVIN, UK, discusses how to increase product retention through retrofitting condensers.
73
Breaking down the barriers

Dennis Long, Watlow, USA, explains the role that electric process heaters will have to play in the decarbonisation of hydrocarbon processing.
79 Heater tube cleaning and verification
Tom Gilmartin, Zerosumheater and a consultant for Quest Integrity, considers the effect of fouling on heater services, and introduces a new approach for confirming coil cleanliness.
85 Monitor, manage and minimise
Mark Naples, Umicore Coating Services Ltd, details how connected gas detection technology can help companies to comply with ESG needs.
UNICAT’s ‘next generation’ spherical catalysts have a proven advantage of energy efficiency, lower CO2 emissions, increased hydrogen production, and extended tube life. Magcat has been shown to increase hydrogen production, as well as reduce CO2 emissions by 10 – 20%, in ways that are easily implemented and which avoid equipment investment costs.

CONTENTS Hydrocarbon Engineering Like Join Hydrocarbon Engineering @HydrocarbonEng Follow CONVERSATION JOIN THE 2023 Member of ABC Audit Bureau of Circulations Copyright© Palladian Publications Ltd 2023. All rights reserved. No part of this publication may be reproduced, stored in a retrieval system, or transmitted in any form or by any means, electronic, mechanical, photocopying, recording or otherwise, without the prior permission of the copyright owner. All views expressed in this journal are those of the respective contributors and are not necessarily the opinions of the publisher, neither do the publishers endorse any of the claims made in the articles or the advertisements. Printed in the UK. CBP006075 March 2023 Volume 28 Number 03 ISSN 1468-9340 03 Guest comment 05 World news 10 American gasoline: conditional love Nancy Yamaguchi, Contributing Editor, examines changing production, price and demand in the US gasoline market. 18 The next digital frontier: industrial autonomous operations Praveen Sam, Honeywell, USA, introduces a novel digital operating approach within the oil and gas industry. 23 Digitalisation with a clearer view Mika Kulin, Neste, explains how the company’s refinery in Porvoo, Finland, is integrating its different digital sources and automation systems into a single source of information. 27 Fending off threat Mike Hoffman, Dragos Inc., USA, discusses how refineries can protect critical ICS/OT systems from cyberattacks. 33 Building resilient infrastructure Leo Simonovich, Siemens Energy, USA, lists the important steps to be taken
TAKE-OFF. FROM AMBITION TO ACTION.
Ramp up production of sustainable aviation fuel. Together we can transform the aviation industry’s carbon intensity for the better. Keep planes in the air, and still be on track to zero. SAF reduces CO2 emissions by at least 85% when compared to conventional fuel. And we have the proven technologies to make it all happen. Now.
Turn your sustainable ambitions into a sustainable business.
Join Flight Plan Green. Find out how: topsoe.com/saf
FLIGHT
PLAN GREEN
GUEST COM MENT
CONTACT INFO
MANAGING EDITOR James Little james.little@palladianpublications.com
SENIOR EDITOR Callum O'Reilly callum.oreilly@palladianpublications.com
ASSISTANT EDITOR Bella Weetch bella.weetch@palladianpublications.com
SALES DIRECTOR Rod Hardy rod.hardy@palladianpublications.com
SALES MANAGER Chris Atkin chris.atkin@palladianpublications.com
SALES EXECUTIVE Sophie Birss sophie.birss@palladianpublications.com
PRODUCTION MANAGER Kyla Waller kyla.waller@palladianpublications.com
EVENTS MANAGER Louise Cameron louise.cameron@palladianpublications.com
EVENTS COORDINATOR Stirling Viljoen stirling.viljoen@palladianpublications.com
DIGITAL CONTENT ASSISTANT Merili Jurivete merili.jurivete@palladianpublications.com
DIGITAL ADMINISTRATOR Leah Jones leah.jones@palladianpublications.com
ADMIN MANAGER Laura White laura.white@palladianpublications.com
CONTRIBUTING EDITOR Nancy Yamaguchi Gordon Cope
SUBSCRIPTION RATES
Annual subscription £110 UK including postage /£125 overseas (postage airmail).
Two year discounted rate £176 UK including postage/£200 overseas (postage airmail).
SUBSCRIPTION CLAIMS
Claims for non receipt of issues must be made within 3 months of publication of the issue or they will not be honoured without charge.
APPLICABLE ONLY TO USA & CANADA
Hydrocarbon Engineering (ISSN No: 1468-9340, USPS No: 020-998) is published monthly by Palladian Publications Ltd GBR and distributed in the USA by Asendia USA, 17B S Middlesex Ave, Monroe NJ 08831. Periodicals postage paid New Brunswick, NJ and additional mailing offices. POSTMASTER: send address changes to HYDROCARBON ENGINEERING, 701C Ashland Ave, Folcroft PA 19032.
15 South Street, Farnham, Surrey
GU9 7QU, UK Tel: +44 (0) 1252 718 999
CHET THOMPSON PRESIDENT & CEO, AMERICAN FUEL & PETROCHEMICAL MANUFACTURERS (AFPM)

In a tight refined product market – which is certainly how we would characterise much of the past two years – it has been US refiners that have stepped up. Our industry ran full-out for most of 2022 making sure American consumers, our domestic economic centres and our allies had enough gasoline, diesel and jet fuel to keep everyone moving. Our refining sector leads the world in liquid fuel production and is effectively doing more than any other to bring better balance to the global market.
This is a utilisation story. The US refining kit (which is how we refer to our collective refining machinery across nearly 130 refineries) is one of the two largest in the world, with approximately 18 million bpd capacity. It is also the most complex, which means we have the greatest capability to refine the toughest types of crude oil.
Our facilities process more crude oil every day than the US upstream produces, and we make more finished fuels, collectively, than the US consumes. For a kit of our size, to consistently have at least 90% of our refining muscle actively engaged in fuel production is a tremendous accomplishment, and a testament to the men and women of our industry who maintain our facilities and keep them running safely. To say I am proud of their work is an understatement.
Refineries regularly undergo maintenance, and every few years they undergo larger scale ‘turnarounds’ where production is halted and up to 1000 specialised workers – including engineers, electricians, pipefitters and steelworkers – come in to inspect entire facilities, refurbish units and complete building projects. As any veteran refiner will tell you, running full-out for as long as we have can be a source of wear and tear on facilities. And to maintain high utilisation rates when the market was at its tightest, some facilities elected to reschedule planned maintenance if that could be done safely.
Safety is the key word. Everything we do in the refining industry begins and ends with safety. While the US refining industry will continue to produce as much fuel as we safely can, there’s going to be some necessary dialing back for maintenance. Of course, ‘dialing back’ is relative, because US refineries – even while some facilities undergo maintenance – are still likely to maintain much higher utilisation rates than the rest of the world and continue leading in fuel production.
Refinery upkeep is a good thing because maintenance is a long-term investment in safe operations and will help us be ready, if needed, to run full-out for extended stretches in the future. And as an industry of ‘planners’, refiners also have arrangements in place before any turnaround starts to make sure customers have uninterrupted fuel deliveries.
Even while facilities are being maintained, global fuel supply and demand will continue rebalancing with our contributions and with significant refining capacity projects preparing to come online around the world. This next phase of US refinery leadership in a reconfigured global market is sure to be one to watch.

THE FUTURE OF CATALYSTS IS HERE


MAXIMIZING EVERY DROP
Ketjen's advanced catalysts are the industry's gold standard. Our tailored solutions deliver ever-increasing performance and technology for our customers so they can be more competitive in the marketplace.

Scan and learn more
WORLD NEWS
USA | EIA: US refinery utilisation to average more than 90% in 2023 and 2024


In its February ‘Short-Term Energy Outlook’ (STEO), the US Energy Information Administration (EIA) forecast that US refinery utilisation will remain similar to 2022, at above 90% over the next two years.
It is forecast that US refinery utilisation will average 90.8% in 2023, and then decrease slightly to 90.3% in 2024.
In 2020, average refinery utilisation dropped to 78.8%, the lowest annual rate since the EIA began collecting this data in 1997. However, by 2022, utilisation rates averaged closer to pre-pandemic levels at more than 91%.
Global refined product prices and crack spreads, which represent an estimate of refinery margins, grew substantially in the US in 2022, increasing refinery utilisation.
Slower economic growth is predicted in 2023 and 2024, which would reduce gasoline and diesel consumption compared with 2022, leading to a gradual decrease in petroleum product prices.
It is also forecast that increased production of finished petroleum products as a result of high refinery utilisation rates will contribute to lower prices.
Germany | First Middle East LNG cargo successfully delivered
ADNOC and RWE have announced the successful delivery of the first shipment of LNG from Abu Dhabi, UAE, to the Elbehafen floating LNG terminal in Brunsbüttel, Germany.
Produced by ADNOC Gas at Das Island, Abu Dhabi, the shipment of 137 000 m3 of LNG is the commissioning cargo for the new floating LNG terminal in Brunsbüttel, and the first ever LNG cargo to be shipped to Germany from the
Middle East. This landmark cargo follows the inaugural ammonia shipment in October 2022, and furthers cooperation on energy security, decarbonisation, and lower-carbon fuels between the UAE and Germany. It also marks an important milestone in developing Germany’s domestic LNG supply infrastructure, supporting the country’s energy security with natural gas.
Denmark | Technip Energies awarded FEED contract by Arcadia eFuels
Technip Energies has been awarded a FEED contract by Arcadia eFuels for the world’s first commercial e-fuels facility for sustainable aviation fuel (SAF) production in Vordingborg, Denmark. Pre-FEED and early works recently concluded, and the parties aim to support plant start-up in 2026.
Arcadia eFuels will use renewable electricity, water, and biogenic carbon dioxide (CO2) to produce e-fuels that can be used in traditional engines and supplied to the market in existing liquid fuel infrastructures.
The FEED covers the engineering of the first e-fuels plant that will produce approximately 80 000 tpy of e-jet fuel and e-naphtha, using novel yet proven technologies. It also covers the engineering of a 250 MW electrolyser plant to produce green hydrogen. The plant will be designed with a flexible product slate to allow for the production of e-diesel. These fuels allow airlines to cut carbon emissions proportionally, therefore providing the ability for airlines and heavy transportation to meet voluntary carbon reductions and proposed EU mandates for e-fuels use.
China | Shell Catalysts & Technologies to support CSPC Phase III
S hell Catalysts & Technologies (SC&T) has announced that it will provide its technologies and catalysts to the China National Offshore Oil Corp. (CNOOC) and Shell Petrochemicals Co. Ltd (CSPC) joint venture (JV) Phase III expansion.
Incorporated by CNOOC and Shell, CSPC is one of the largest petrochemicals JVs in China. Following the success of the existing Phase I and II projects, CSPC Phase III will include a
new 1.6 million tpy cracker, creating one of the world’s largest and most flexible integrated complexes.
In Phase III, some of Shell’s technologies will be deployed for the third time in CSPC with the latest state-of-the-art designs in terms of energy efficiency, scale and flexibility.
In addition, CSPC will build the largest linear alpha olefins (LAO) plant ever designed as part of a JV. The LAO are being licensed from Shell for the
first time. The rest of the process includes the Higher Olefins and Derivatives (HODer) value chain.
“We are very pleased to further support the growth of CSPC which is a world-scale asset,” said Seng Yee Loh, Vice President Sales Asia Pacific, SC&T. “The collaboration with the local team will produce operational efficiencies and is expected to help bring economic benefits to the facility.”
March 2023 HYDROCARBON ENGINEERING 5
IN BRIEF
the netherlands

Sulzer has signed an agreement with circular technology company, Fuenix Ecogy, to acquire a strategic stake in its plastic upcycling business. The partnership will drive the development, commercialisation and adoption of advanced, fully-integrated solutions for plastic waste processing.
south korea
LOTTE INEOS Chemical has announced plans to increase vinyl acetate monomer (VAM) production capacity to 700 000 t with the addition of a third VAM plant. The new plant is scheduled to start up by the end of 2025.
canada
Flowserve Corp. has reached an agreement to acquire Velan Inc. in an all-cash transaction valued at approximately US$245 million. The transaction is expected to close by the end of 2Q23.
europe
Neste and Wizz Air have agreed on the supply of Neste MY Sustainable Aviation FuelTM from 2025 onwards. The agreement gives Wizz Air the opportunity to purchase 36 000 tpy of Neste-produced sustainable aviation fuel (SAF) over a period of three years for the airline to use across its route network in Europe and the UK.
china
Venture Global LNG and China Gas Holdings Ltd have announced that the wholly-owned subsidiary, China Gas Hongda Energy Trading Co. Ltd, and Venture Global LNG have signed two 20-year LNG Sales and Purchase Agreements (SPA). Under the deals, China Gas will buy 1 million tpy of LNG on a free on board (FOB) basis from Plaquemines LNG, and another 1 milion tpy from the CP2 LNG export facility – both of which are located in Louisiana, US.
Colombia | Ecopetrol selects Honeywell technology for carbon capture study

Honeywell has been selected by Ecopetrol S.A. to develop a pre-feed engineering study for a HoneywellTM Advanced Solvent Carbon Capture (ASCC) modular demonstration unit, which will be used to evaluate carbon dioxide (CO2) capture from Ecopetrol fluid catalytic cracking (FCC) units.
FCC units are significant sources of CO2 emissions, accounting for 15 – 20% of overall emissions in a typical FCC-based refinery, including Ecopetrol’s refineries.
Honeywell UOP’s ASCC technology has been designed to
capture CO2 from post-combustion flue gases, which are more challenging to treat due to the low CO2 concentration and low pressure inherent in these sources.
The design target of the demonstration unit is to capture 30 tpd of CO2 from Ecopetrol FCC flue gas. If implemented, the demonstration unit will provide valuable information into the performance of this technology in reducing FCC emissions, with learnings that can be used to inform deployment of commercial-scale units in FCC service.
Belgium | INEOS secures financing for Project ONE
INEOS Olefins Belgium has raised €3.5 billion to support the construction and operation of Project ONE.
This is the largest investment in the European chemical sector for a generation. The new cracker, located in Antwerp, Belgium, will have the lowest carbon footprint in Europe – three times lower than the average European steam cracker, and less than half that of the 10% of best performers in Europe.
The plant also has the capability to operate entirely with low-carbon hydrogen, and has room for a carbon capture facility and future electric furnaces.
Jason Meers, CFO INEOS Project ONE, said: “Project ONE is a game changer for Europe. It will bring new opportunities to the chemical cluster in Antwerp as well as strengthen the resilience of the whole of the European chemical sector.”
Europe | Growing LNG demand to intensify competition with Asia
Europe’s increased need for LNG looks set to intensify competition with Asia for limited new supply available over the next two years, and may dominate LNG trade over the longer term, according to Shell’s ‘LNG Outlook 2023’.
European countries, including the UK, imported 121 million t of LNG in 2022, an increase of 60% compared to 2021, which enabled them to
withstand a slump in Russian pipeline gas imports following its invasion of Ukraine. A 15 million t fall in Chinese imports, combined with reduced imports by South Asian buyers, helped European countries to secure enough gas and avoid shortages. Europe’s rapidly rising appetite for LNG pushed prices to record highs and generated volatility in energy markets around the world.
March 2023 HYDROCARBON ENGINEERING 6
WORLD NEWS
WELCOME TO CALDERYS
We are a leading global provider for industries operating in high temperature conditions. Pushing the boundaries of innovation and excellence, we deliver high-quality materials and services adapted to a new, low-carbon era across a range of industries.


Chemicals Engineering & Petrochemicals:


- custom-made refractory solutions


- full range of services: from planning to project execution
- sustainable solutions, helping you transition to a low carbon era
www.calderys.com

WORLD NEWS
DIARY DATES
19 - 23 March 2023
AMPP Annual Conference & Expo Denver, Colorado, USA ace.ampp.org
26 - 28 March 2023
AFPM International Petrochemical Conference San Antonio, Texas, USA afpm.org/events/IPC23
12 - 14 April 2023
25th International Aboveground Storage Tank Conference & Trade Show Orlando, Florida, USA www.nistm.org
25 - 27 April 2023
Sulphur World Symposium Edinburgh, Scotland www.sulphurinstitute.org/symposium-2023
08 - 12 May 2023
RefComm
Galveston, Texas, USA events.crugroup.com/refcomm
22 - 24 May 2023
ILTA 2023 International Operating Conference and Trade Show Houston, Texas, USA www.ilta.org
07 - 08 June 2023
Valve World Americas Expo & Conference Houston, Texas, USA www.valveworldexpoamericas.com
07 - 08 June 2023
Downstream USA 2023
Galveston, Texas, USA events.reutersevents.com/petchem/downstream-usa
13 - 15 June 2023
Global Energy Show Calgary, Alberta, Canada www.globalenergyshow.com
10 - 13 July 2023
LNG2023
Vancouver, British Columbia, Canada www.lng2023.org
05 - 08 September 2023
Gastech Singapore www.gastechevent.com
The Netherlands | Shell and Hapag-Lloyd sign multi-year LNG supply agreement
Shell Western LNG B.V and Hapag-Lloyd have announced the signing of a multi-year agreement for the supply of LNG to Hapag-Lloyd’s ultra-large dual-fuel container vessels of 23 500+ 20 ft equivalent units (TEU).
Bunkering for these 12 new vessels is expected to commence during 2H23, and LNG will be supplied in the Port of Rotterdam, the Netherlands.
The modern ships will be deployed on Europe-Far East routes and call at major ports including Rotterdam (the Netherlands),
Hamburg (Germany), Singapore, and Shanghai (China).
Shell and Hapag-Lloyd have also entered into a strategic collaboration agreement intended to accelerate the further decarbonisation of alternative marine fuels. Initial focus will be given to developing the potential of additional low-carbon fuel solutions including liquefied biomethane and the hydrogen-based fuel, liquefied e-methane. Liquefied biomethane as a marine fuel has the potential to reduce greenhouse gas emissions by between 65 – 100%.
USA | ExxonMobil to utilise Topsoe technology for hydrogen facility
Topsoe has announced that it will deliver technology to ExxonMobil’s planned low-carbon hydrogen production facility in Baytown, Texas, US.

ExxonMobil’s low-carbon hydrogen, ammonia, and carbon capture facility is expected to generate up to 1 billion ft3/d of hydrogen, delivering low-carbon fuel to the Baytown olefins plant and other Houston-area facilities. Replacing natural gas with hydrogen at the Baytown olefins plant could
reduce the integrated complex’s carbon dioxide (CO2) emissions by up to 30%.
To produce the large amount of hydrogen needed by ExxonMobil, Topsoe will apply its SynCORTM technology, which enables mega-scale hydrogen production as well as cost-efficient carbon capture.
As technology integrator, Topsoe will guarantee the carbon intensity of the integrated low-carbon facility, as well as hydrogen production and carbon capture.
USA | Freeport LNG to restart operations
Freeport LNG Development L.P. has announced that it has received regulatory approval to commence commercial operations of its natural gas liquefaction and export facility.
This authorisation provides for the immediate full return to service of one liquefaction train that has already restarted, and the incremental restart and full return to service of a second train.
The restart and return to service of Freeport LNG’s third liquefaction train will require subsequent regulatory approval once certain operational conditions are met. A conservative ramp-up profile to establish three-train production of approximately 2 billion ft3/d is anticipated to occur over the next several weeks as stable operation of each incremental train is established and maintained.
March 2023 HYDROCARBON ENGINEERING 8
SPECIALIZED CATALYSTS

JOINTLY DEVELOPED SOLUTIONS FOR CLEANER FUELS AND MAXIMUM PERFORMANCE
Together with Advanced Refining Technologies LLC, CLG offers the most complete portfolio of hydroprocessing catalysts in the industry. We offer more experience than any other licensor providing leading technologies, expertise, and innovative solutions for refiners worldwide. To get the performance and flexibility needed to keep pace with changing market dynamics, start by visiting www.chevronlummus.com.


10 March 2023 HYDROCARBON ENGINEERING
Nancy Yamaguchi, Contributing Editor, examines changing production, price and demand in the US gasoline market.
“Americans love gasoline” is a statement that has been accepted as a fundamental, evolving from images of a car-crazy culture enjoying the freedom of a vast country and the wide-open road. With gasoline demand at approximately 8.8 million bpd, the US is the largest market in the world. For comparison, Europe in its entirety consumes only around 1.9 million bpd of gasoline. Yet American love for gasoline is not unconditional. Today, a more correct statement would read along the lines of “Americans love cheap, plentiful gasoline, with reduced emissions, in formulations specific to their locations, seasons, and vehicles, with loyalty programmes and clean convenience stores, perhaps from sellers less aligned with Greedy Big Oil.”
Recent years have brought extreme volatility to the gasoline market, bringing back memories of past price spikes and reviving consumer dissatisfaction. COVID-19 lockdowns forced a massive collapse in demand, followed by an oil price crash. Recovery came in fits and starts, hobbled by supply chain problems, waves of COVID-19 variants, rising prices, and inflationary pressures. Then, Russia invaded Ukraine in February 2022, contributing to record-high gasoline prices
during the summer 2022 driving season. Consumers generally find it easier to adjust to gradual increases in fuel prices than to cope with sudden price spikes. The optics have not been helped by the fact that the major oil companies are reporting record-high profits, which were projected to be over US$200 billion in 2022.

From the standpoint of ‘Greedy Big Oil’, the US is an essential market, and the goal is to keep it a profitable one. The US refining industry evolved largely to produce gasoline for US consumers, and the presence of this massive consumer base helped it to become the largest and most sophisticated in the world. It is a close, symbiotic relationship, but also one where both parties take the other for granted, and have other interests.
Current energy prices are a key contributor to overall price inflation. The US Bureau of Labor Statistics (BLS) reported a jump of 29.3% in Consumer Price Index (CPI) energy prices in the December 2020 – December 2021 period, declining to 7.3% in the December 2021 – December 2022 period. The COVID-19 pandemic caused a huge collapse-rebound cycle, the impacts of which are still
March 2023 11 HYDROCARBON ENGINEERING
affecting the market. Additionally, the Russia-Ukraine war constrained supply just as demand was rising. This article will focus on the US gasoline market, examining production, price and demand, and noting how the market is changing.
A gasoline-maximising industry shifts away from gasoline
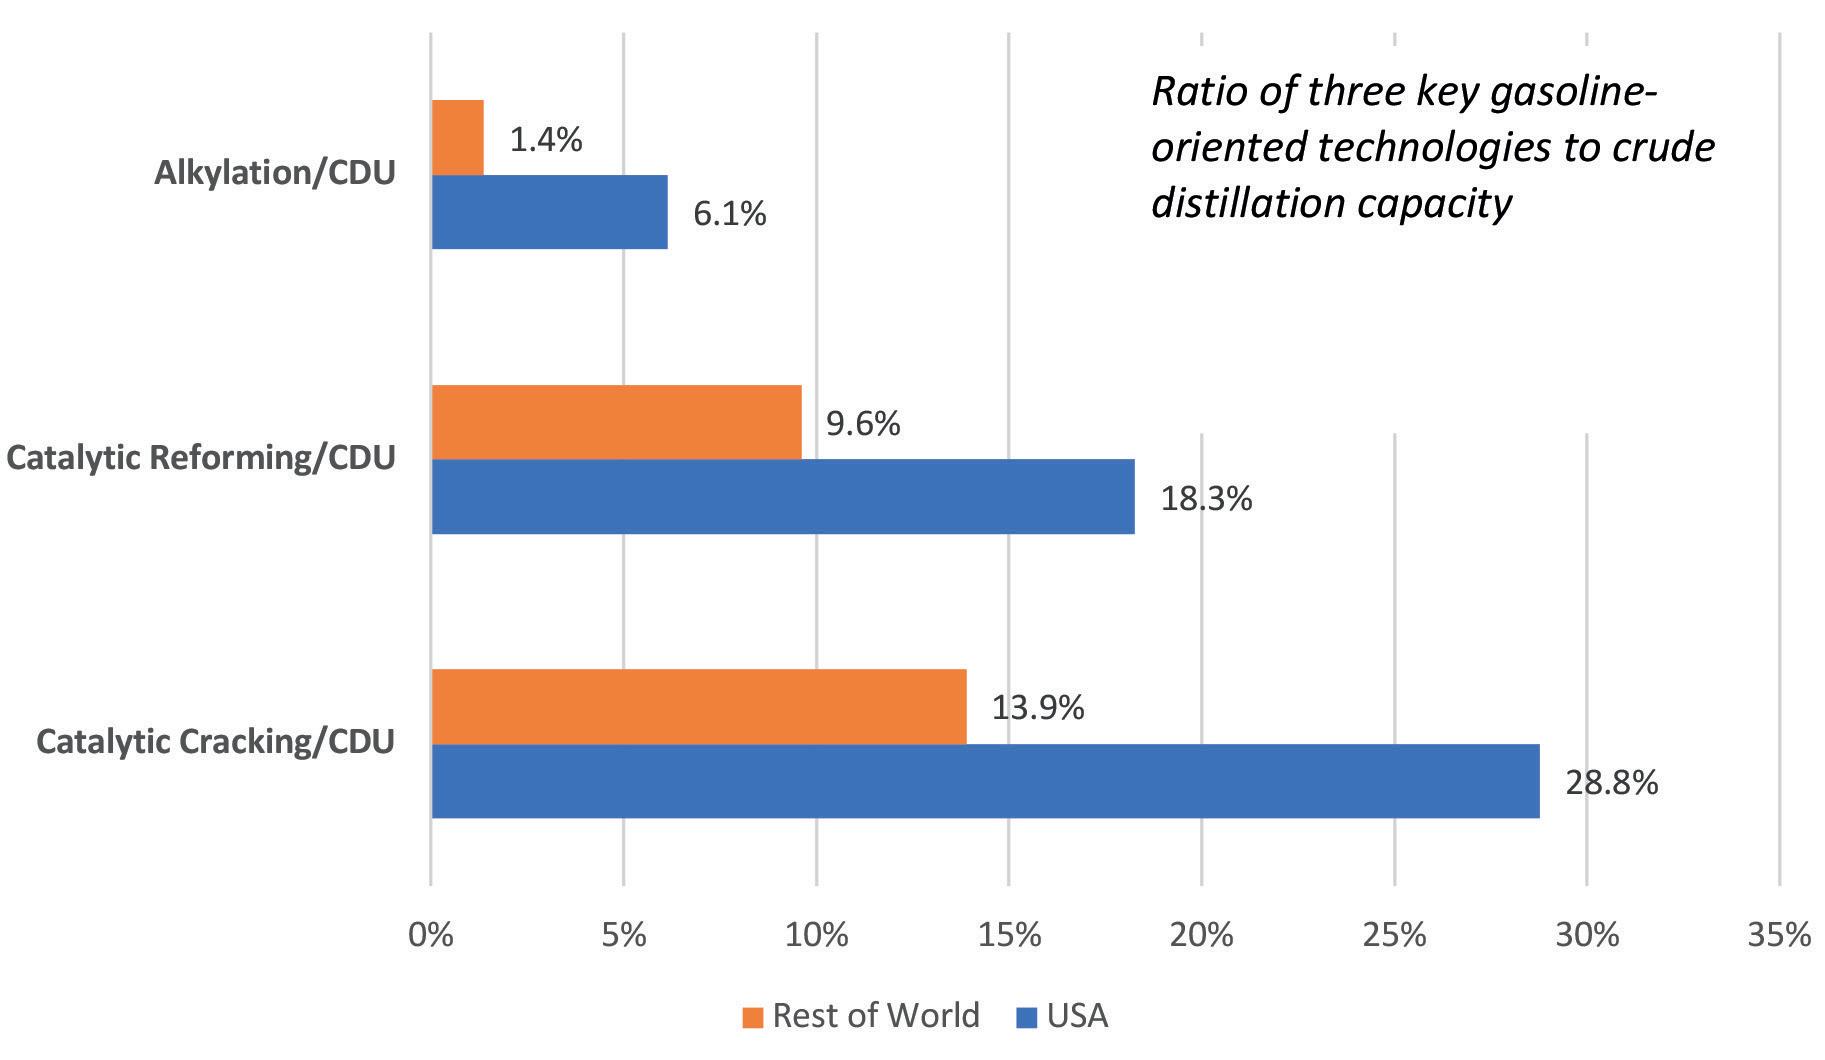
Serving the world’s largest gasoline market motivated the US refining industry to invest in a massive amount of gasoline-oriented technology. Figure 1 compares the ratios of three key gasoline-maximising technologies with crude distillation unit (CDU) capacity in the US vs the rest of the world. In the US, the alkylation to CDU ratio is 6.1%, relative to 1.4% in the rest of the world; catalytic reforming to CDU ratio is 18.3%, vs 9.6% in the rest of the world; and catalytic cracking to CDU is 28.8% in the US, vs 13.9% in the rest of the world.
These technologies helped the US industry to achieve and maintain an exceptionally high yield of gasoline – the largest output in the world. Figure 2 shows US refinery yield of gasoline since 1993. The yield has ranged from a low of 44.2% in 2008 to a high of 47.8% in 2021, and it averaged approximately 46.1% in 2022. In volume terms, US refiners and blenders (who finish gasoline-ethanol blends) produced 9.529 million bpd of gasoline in 2021, and an estimated 9.574 million bpd of gasoline in 2022. Production records of over 10 million bpd were set in
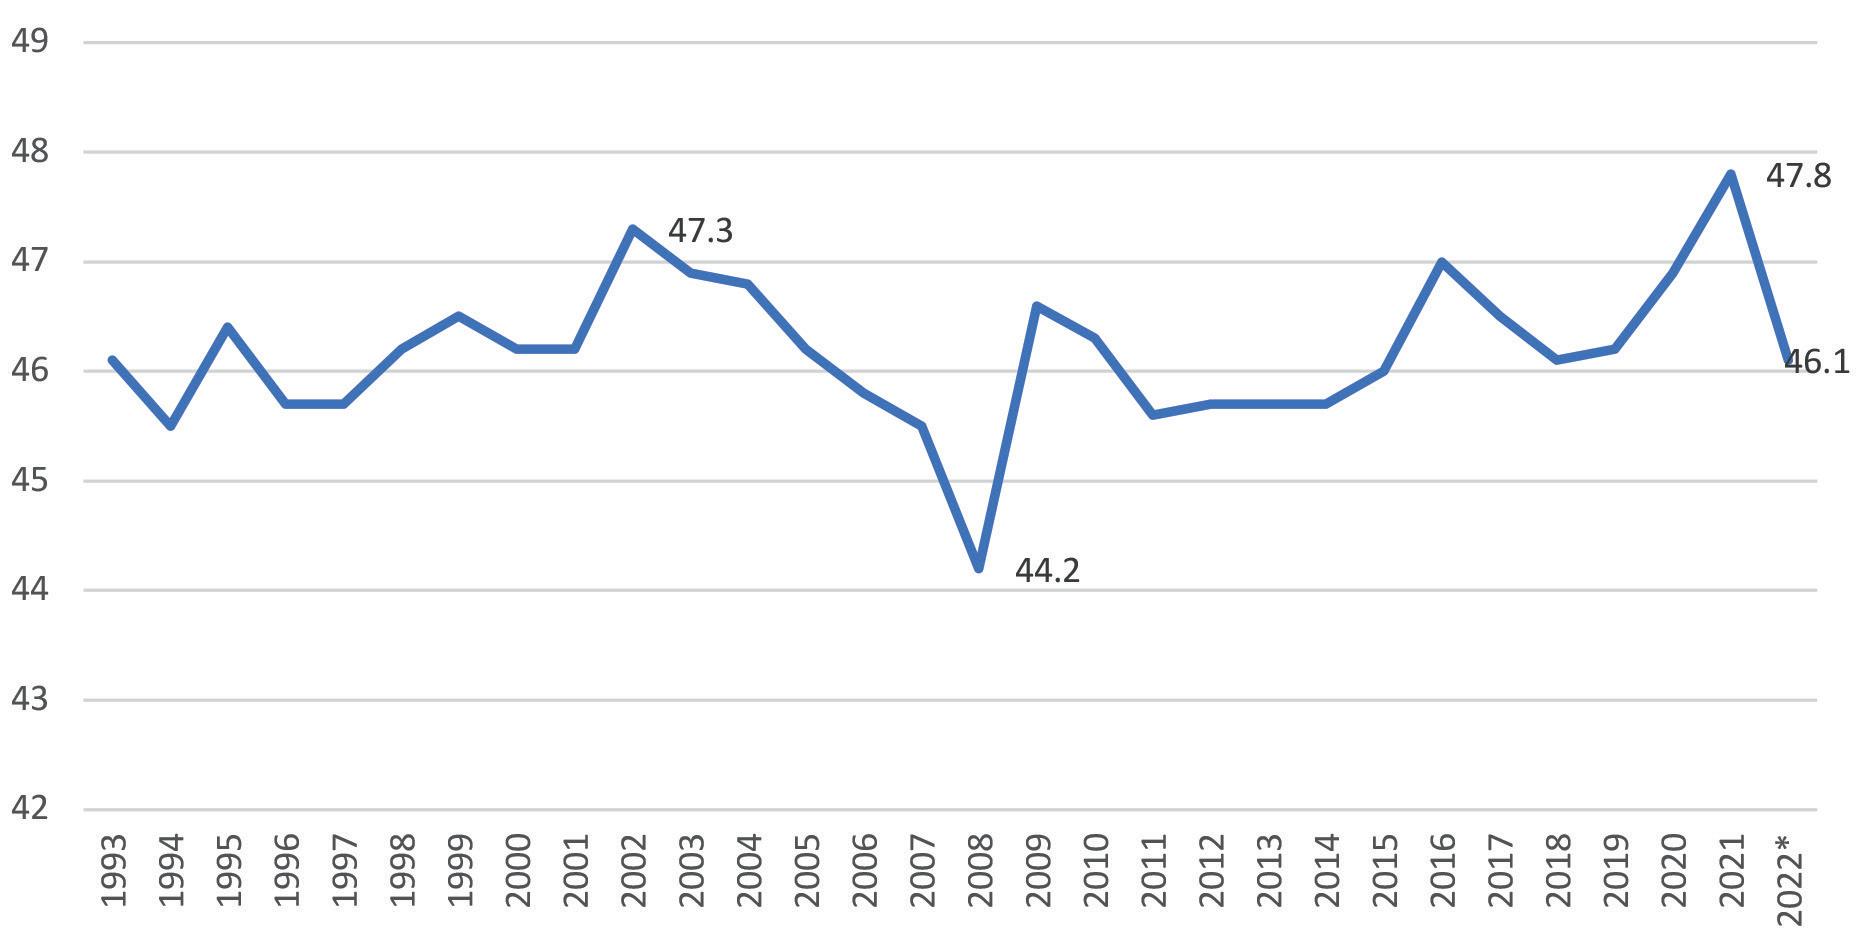
2018 and 2019, before the COVID-19 pandemic prompted a drop to 8.742 million bpd output in 2020.
Yet, while the US industry can easily achieve a 47 – 48% yield of gasoline, there has been a shift away from gasoline maximisation. In its continual quest to optimise refinery operations, the industry has cut output of low-value fuel oil and other products, reducing their yield from 13.7% in 2004 to 9.64% in 2022. This represents an average drop in yield of -1.9%/yr between 2004 – 2022. In recent years, the focus on maximising gasoline output has also shifted. Gasoline’s percentage yield of output fell modestly, at a rate of -0.1%/yr between 2004 – 2022. In 2004, gasoline accounted for 46.8% of refinery yield. In 2022, this share declined to approximately 46.1%. Yields of kerosene-based jet fuel also declined at -0.1%/yr between 2004 – 2022. In contrast, the new focus has been on increasing the yield of diesel. Diesel accounted for 23.9% of output in 2004, and this grew to 30.27% in 2022. This amounts to an increase in yield of 1.3%/yr on average between 2004 – 2022. In volume terms, US refiners are producing approximately 1.17 million bpd more diesel than they were in 2004. In 2000, the US was a modest exporter of diesel. In 2022 (January – October average), US diesel exports had surged to over 1.2 million bpd of diesel, and imports had essentially vanished.
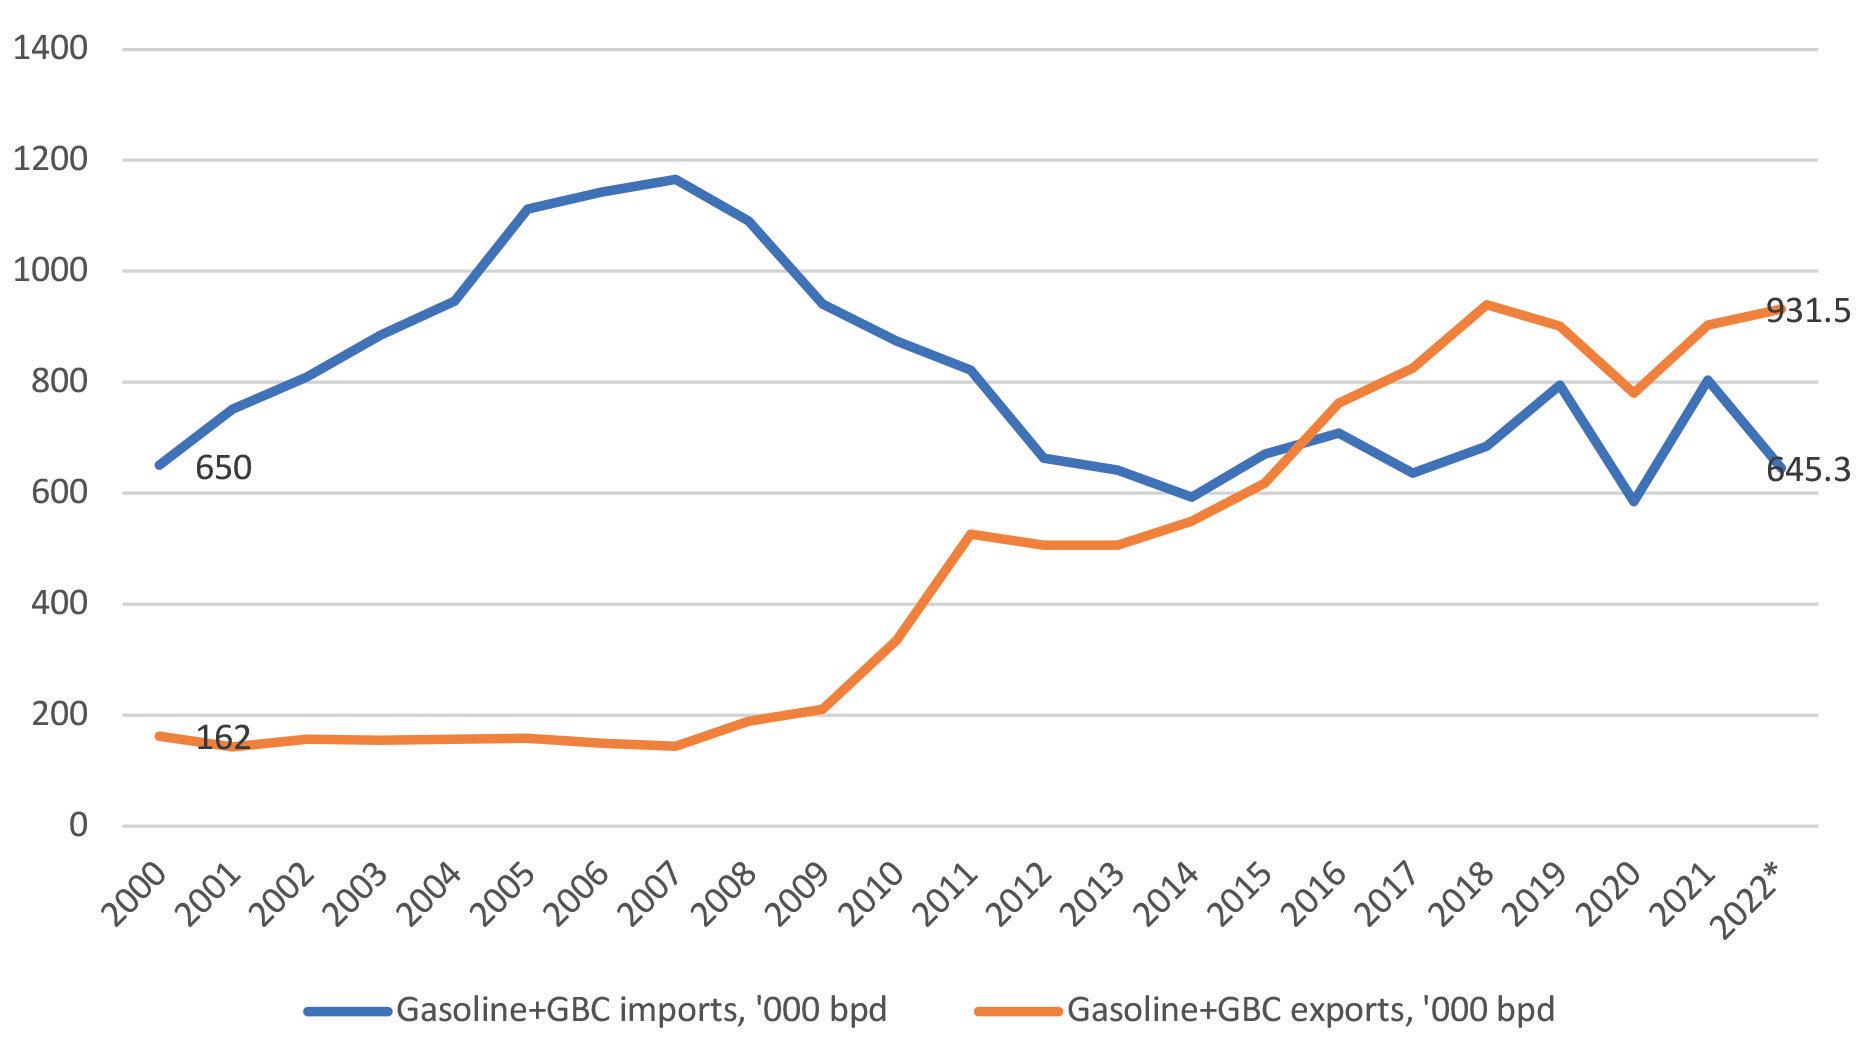
US refineries are therefore increasingly looking to export markets, and the incremental barrel of crude processed is processed for export. After years of being a significant importer of gasoline and gasoline blending components (GBC), the US has now transitioned into a net exporter of these materials. Figure 3 depicts this dramatic shift. In 2000, the US imported approximately 650 000 bpd of gasoline and GBC, while exporting 162 000 bpd. Imports grew to 1.166 million bpd in 2007, while exports remained flat. As will be discussed in the following section, oil prices spiked in 2008, and the Great Recession followed. Gasoline and GBC imports fell, and exports rose as refiners tried to cope with burgeoning inventories. Since then, imports have bumped along in the range of 600 000 – 800 000 bpd, while exports have continued to grow. In 2016, the two lines crossed, and the US became a net exporter of gasoline and GBC, with exports averaging 932 000 bpd, and imports averaging 645 000 bpd.
When confronted with high oil prices, consumers may look at exports with suspicion, positing that these excess supplies should be sold at discounted prices in the domestic market rather than being exported. This is not rational behaviour for a for-profit company. As domestic demand stagnates and production rises, exports have risen for nearly all petroleum products. Crude oil exports have also risen, particularly in places where pipelines are available to deliver crude oil to coastal export terminals. Balancing supply and demand in the US has always required two-way trades, but in recent years export markets have become a key determinant of the last barrels produced and processed.
March 2023 HYDROCARBON ENGINEERING 12
Figure 1. US refineries focus on gasoline-oriented technologies.
Figure 2. US refinery gasoline yield, % (source: EIA).
Gain a better perspective on hydroprocessing solutions. ART catalyst systems are designed to outperform and outlast the competition. Turn flexibility into opportunity. Learn more at arthydroprocessing.com
Volatility in gasoline prices
US consumers sometimes overlook the fact that gasoline prices are strongly moved by crude oil prices, and that pump prices will be influenced by geopolitics. The US Energy Information Administration (EIA) calculated that, in December 2022, the national average retail gasoline price was US$3.21/gal., and the components of this price were:
n 58% crude oil cost.
n 9% refining cost.
n 18% distribution and marketing cost.
n 16% taxes.
In the US, crude oil prices have a relatively stronger influence on pump prices because fuel taxes are low by the standards seen in other OECD countries. The US average pump price cited includes 16% tax; however, many countries face much higher tax burdens – as high as 50% or even 75%. A number of European consumers marvel at the fact that US consumers find prices of, say, US$4/gal. excessive, when they may pay twice this amount. Nonetheless, consumers grow accustomed to what is normal in their own markets, and they assess price swings from their own baseline.
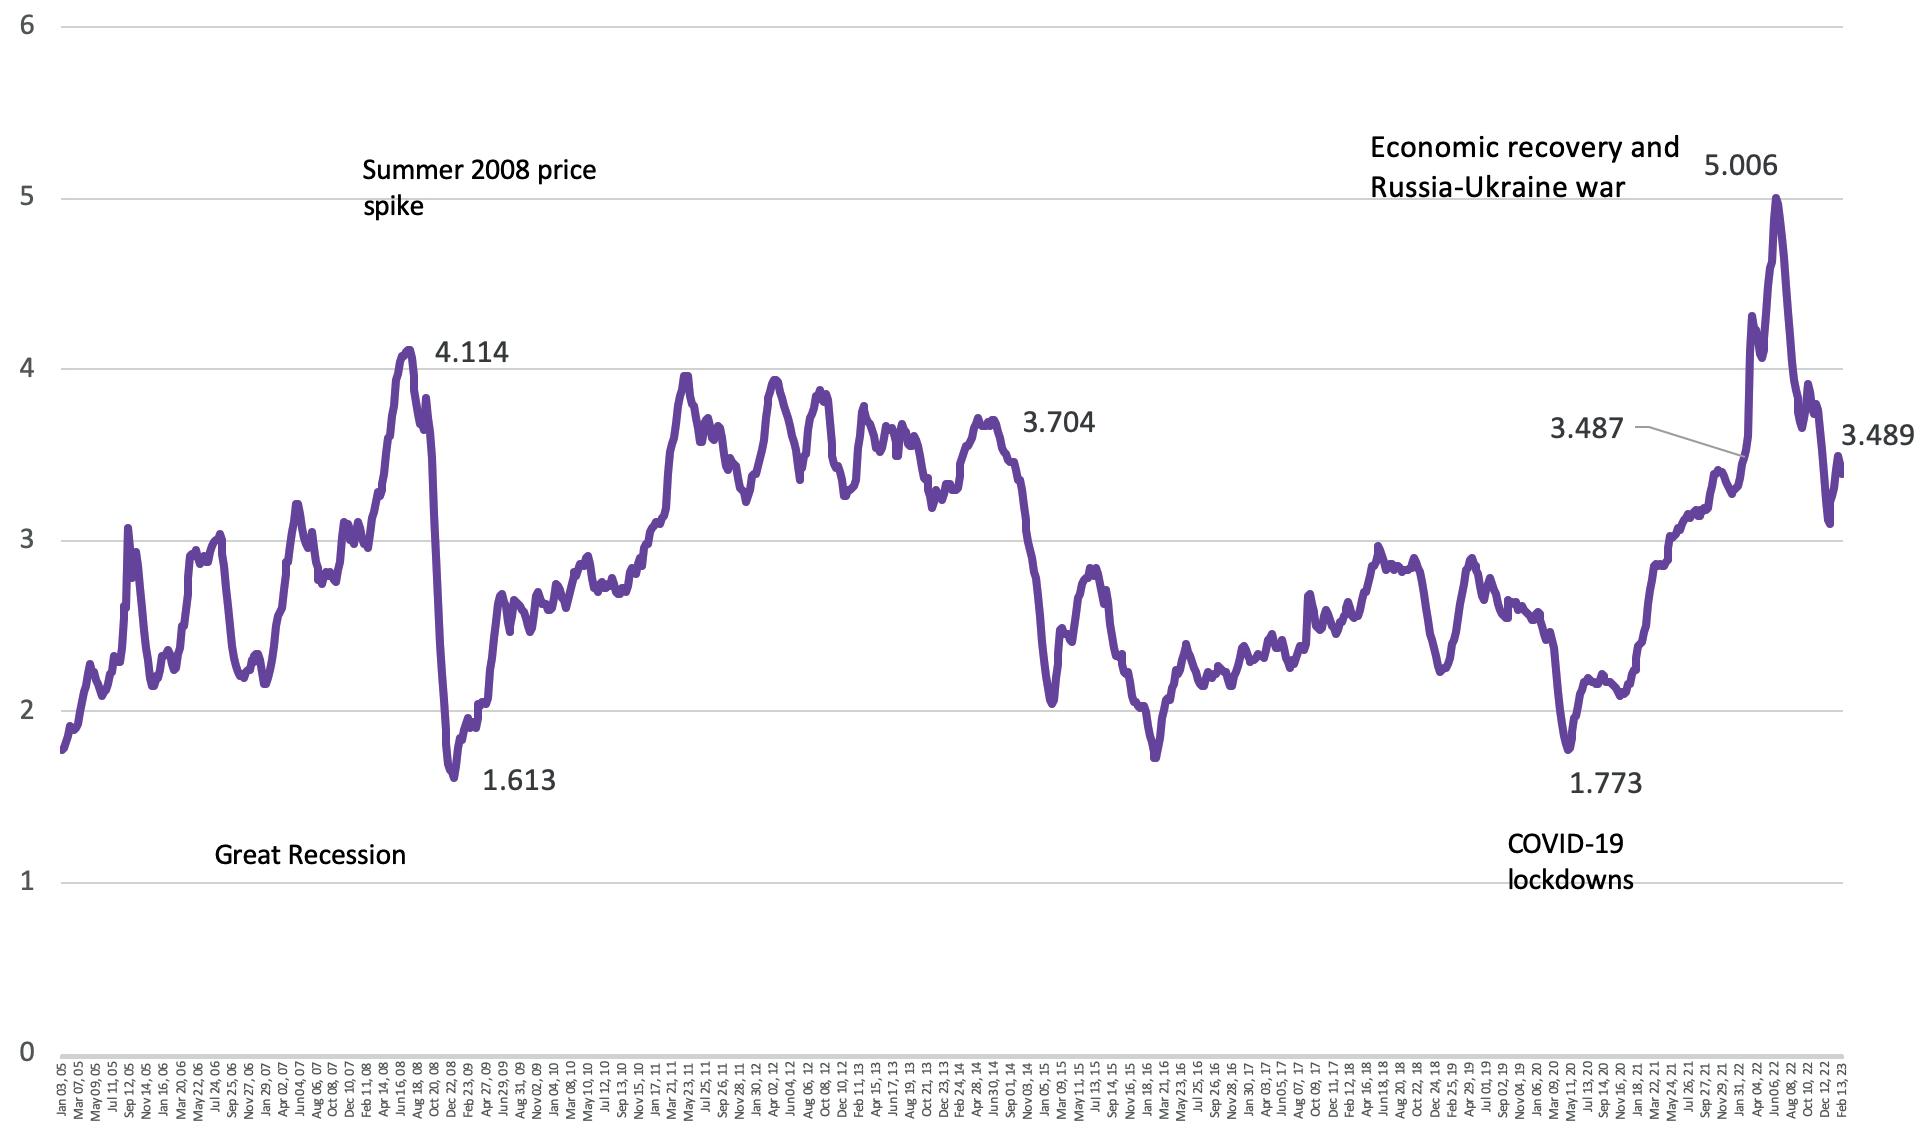
Figure 4 charts the course of retail gasoline prices over the 18-year period from January 2005 through to January 2023 (data as of the week of 30 January 2023). The price spike experienced in the summer of 2008 brought retail gasoline prices to all-time highs of US$4.11/gal. in July. The Great Recession in 2007 – 2009 was named the second-worst economic crisis in US history. Gasoline prices collapsed to lows of US$1.61/gal. in December 2008; unemployment rates hit 10% in 2009 – the highest since the Great Depression, when unemployment rates were estimated at over 24%. Gasoline prices recovered to the US$2 – 3/gal. range in 2010 – 2011, before surging again to the US$3 – 4/gal. range in 2011 – 2014, pushed up by economic recovery and strong demand for oil, particularly in the US and China. Conflict in the Middle East and Africa constrained the supply side, which further bolstered prices.
Demand growth waned, and the supply side received a surprise when the success of US hydrofracking created a major rebound in US crude production. Crude prices began to slide when Saudi Arabia launched its oil price war, intending to drive out some of the higher-cost producers. Prices dropped sharply when sanctions on Iran were lifted. Retail prices for gasoline fell below US$3/gal., and did not recover. COVID-19 lockdowns caused another price crash in 2020, with prices bottoming out at US$1.77/gal. in April 2020. It took over a year for prices to creep back to the US$3/gal. level.
From there, however, post-pandemic economic recovery was underway, plagued by supply chain issues. Prices began to climb; inflationary pressures mounted. According to the BLS, the December 2020 to December 2021 period brought an overall CPI increase of 7%, with gasoline showing the highest jump at 49.6%. In 2022, the gasoline CPI fell -1.5%, bringing some consumer relief, though the CPI for all items rose 6.5%. In 2022, one of the largest jumps was seen in airline fares, which rose 28.5%.
Russia’s invasion of Ukraine in early 2022 caused more market upheaval, and this long-lasting war is creating untold misery in Europe, where many consumers are facing a cold winter with high fuel prices. In the US, gasoline prices spiked to a new record-high of US$5.01/gal. during the summer driving season of 2022. Although gasoline prices retreated to below the US$4/gal. mark, they trended up during January 2023, and it appears likely that the 2023 summer driving season could see prices back in the vicinity of US$4/gal. Consumers widely perceive prices to be too high, particularly when contending with what the BLS reports as 2022 CPI increases of 10.4% in food prices, 14.3% in electricity prices, 19.3% increases in piped natural gas prices, 8.3% increases in rent, and 28.5% increases in airline fares. As will be discussed in the following section, demand has not bounced back.
Gasoline demand flattens and falls
US consumers are feeling the impacts of high fuel prices and inflation, and a number have felt
March 2023 HYDROCARBON ENGINEERING 14
Figure 4. US retail gasoline price, all regular formulations, US$/gal. (source: EIA).
Figure 3. US exports of gasoline and gasoline blending components, ‘000 bpd (source: EIA).

powerless as price-takers in the gasoline market. For many, gasoline is an essential commodity; switching away is not always possible in the short-term. However, each successive price shock has flattened the upward trajectory of demand recovery that followed. Figure 5 presents US annual demand
for gasoline from 1960 through to the January – October period of 2022. Demand grew swiftly from 1960 until the Arab Oil Embargo of 1973 – 1974. Demand recovered quickly until the Iranian Revolution in 1979 – 1980, cutting demand once again. US gasoline demand fell from 7.412 million bpd in 1978 to 6.539 million bpd in 1982.
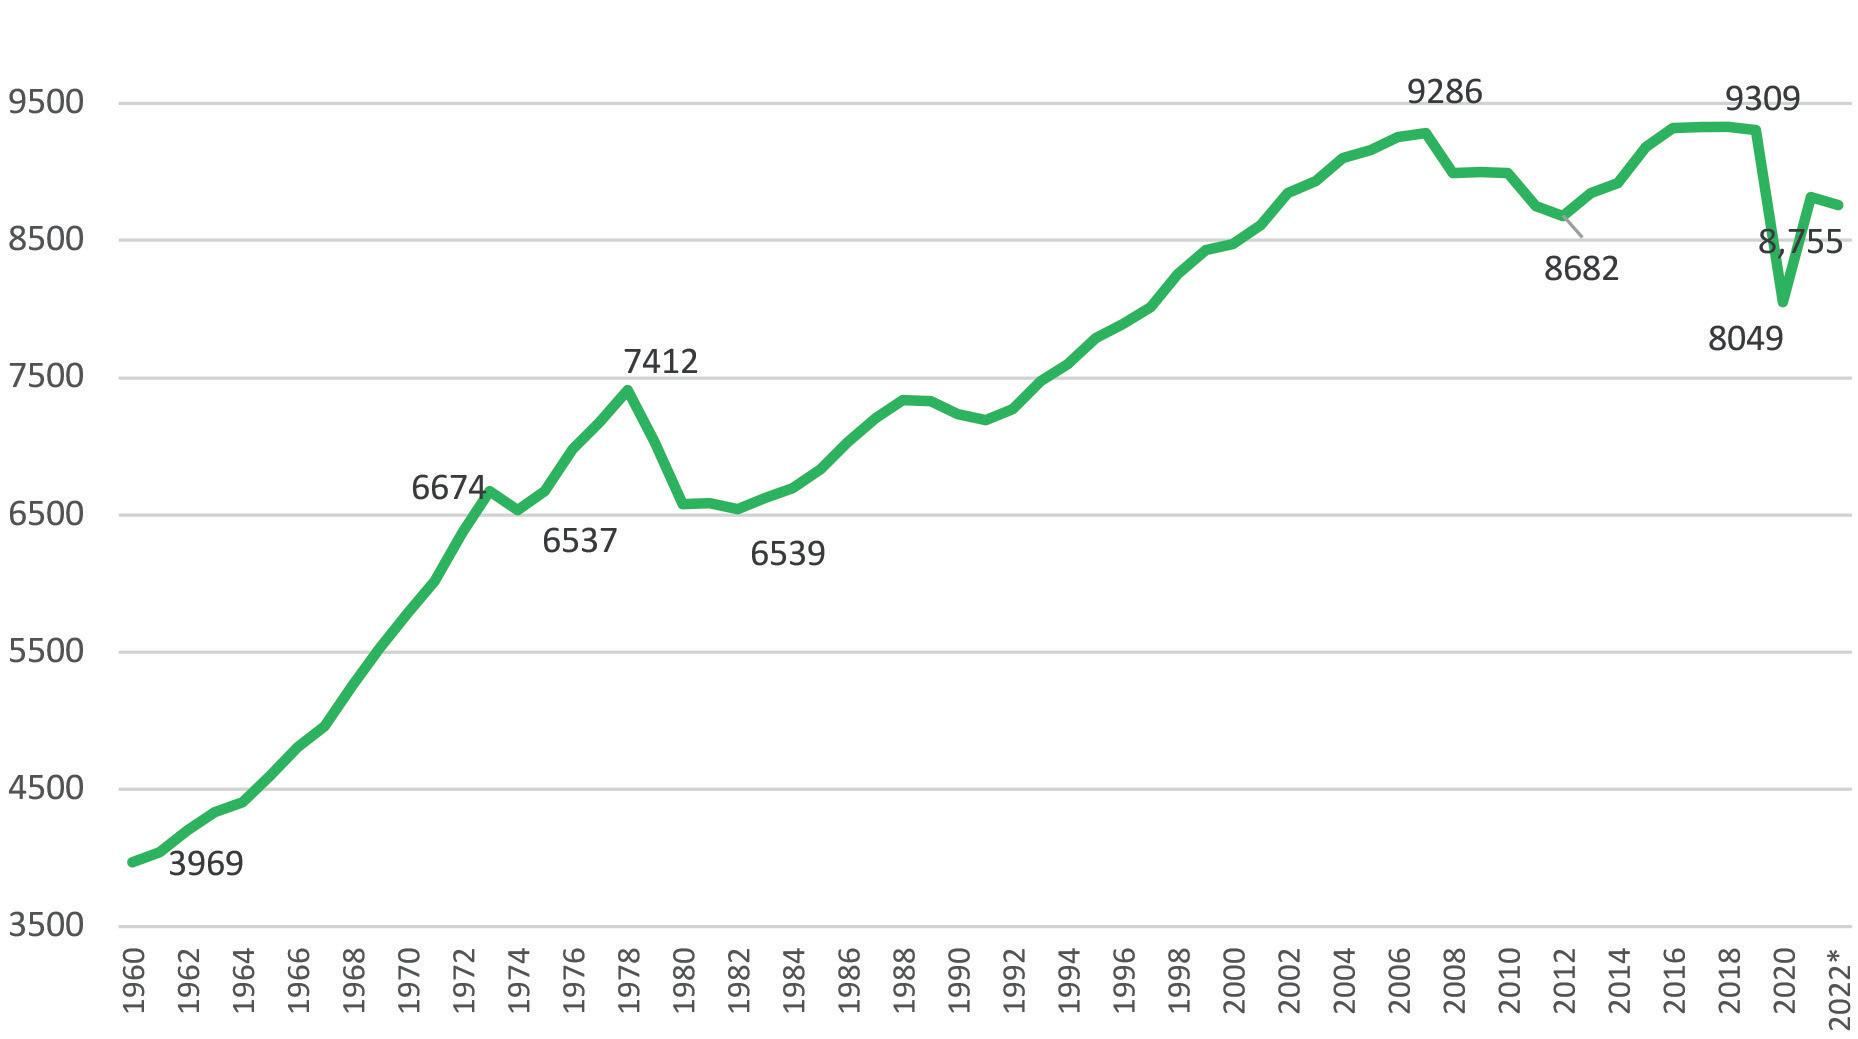
By the mid-1980s, oil prices collapsed, and demand growth picked up, peaking at 9.286 million bpd in 2007 before the price spike of 2008 and the Great Recession. It then climbed back to 9.329 million bpd in 2018 and 9.309 million bpd in 2019. COVID-19 then caused a collapse to 8.049 million bpd in 2020 – a loss of 1.28 million bpd. Demand has not recovered to its pre-pandemic levels, and the author estimates that 2022 demand will be 8.755 million bpd.
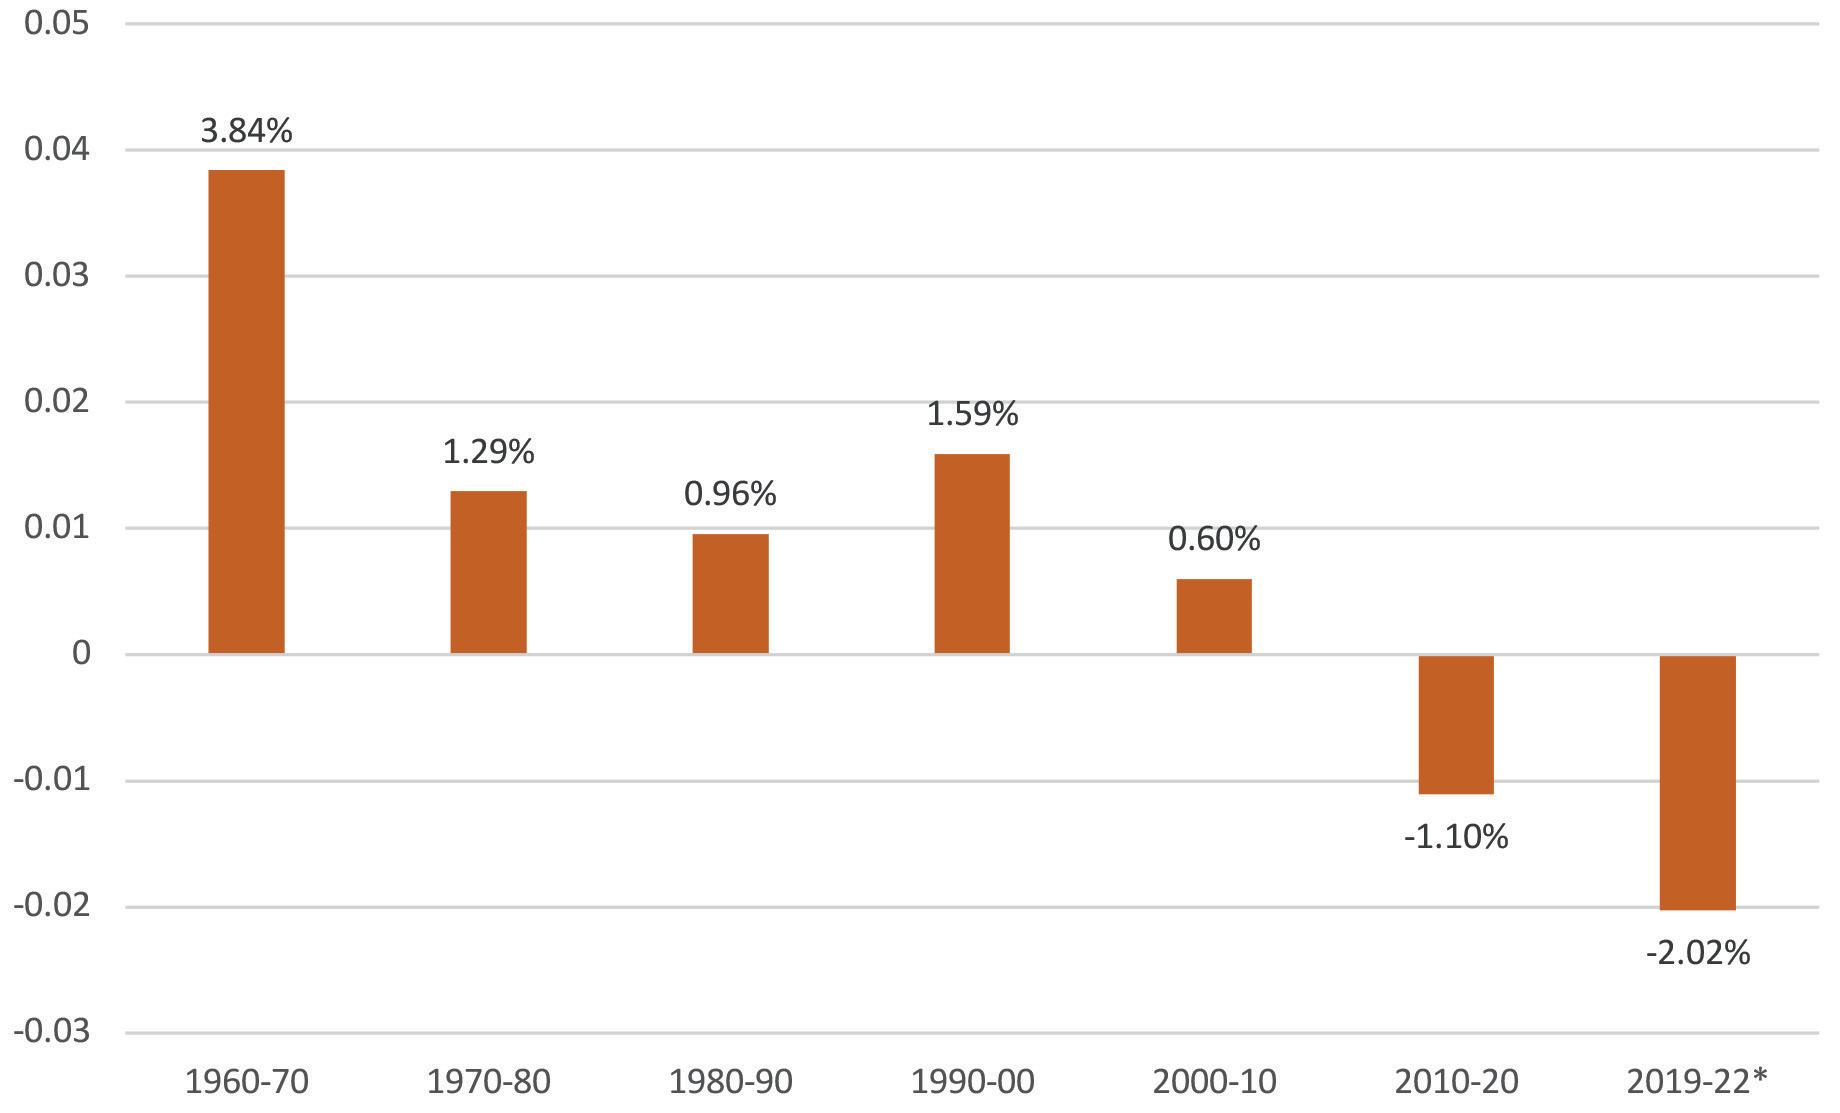
It is entirely possible that US gasoline demand will never again recover to the 9.3 million bpd level seen in the pre-pandemic years. Although the US will remain the world’s largest gasoline market for the foreseeable future, the rates of demand growth have slowed, and have gone negative in recent years, as illustrated in Figure 6. During the 1960s, gasoline demand grew robustly at rates averaging 3.8%/yr. The 1970s brought two oil price shocks, and demand growth rates fell to 1.3%/yr. The downturn extended into the 1980s, when growth rates averaged 1.0%/yr. By the mid-1980s, oil prices fell. During the 1990s, gasoline demand grew at a strong rate of 1.6%/yr. This was slashed to 0.6%/yr during the decade 2000 – 2010, which included the Great Recession.
The 2010 – 2020 decade included the COVID-19 pandemic, and demand for gasoline shrank at an average rate of -1.1%/yr. The author estimates that between 2019 – 2022, US gasoline demand shrank by -2.0%/yr.
Alternatives to gasoline
Switching away from gasoline is a slow process, but it appears that the US has turned the corner. Demand has fallen, and Corporate Average Fuel Economy (CAFE) standards are also having a sustained impact on cutting fuel use and emissions. The government of President Biden is vigorously promoting clean energy technologies and moving to reduce carbon emissions.
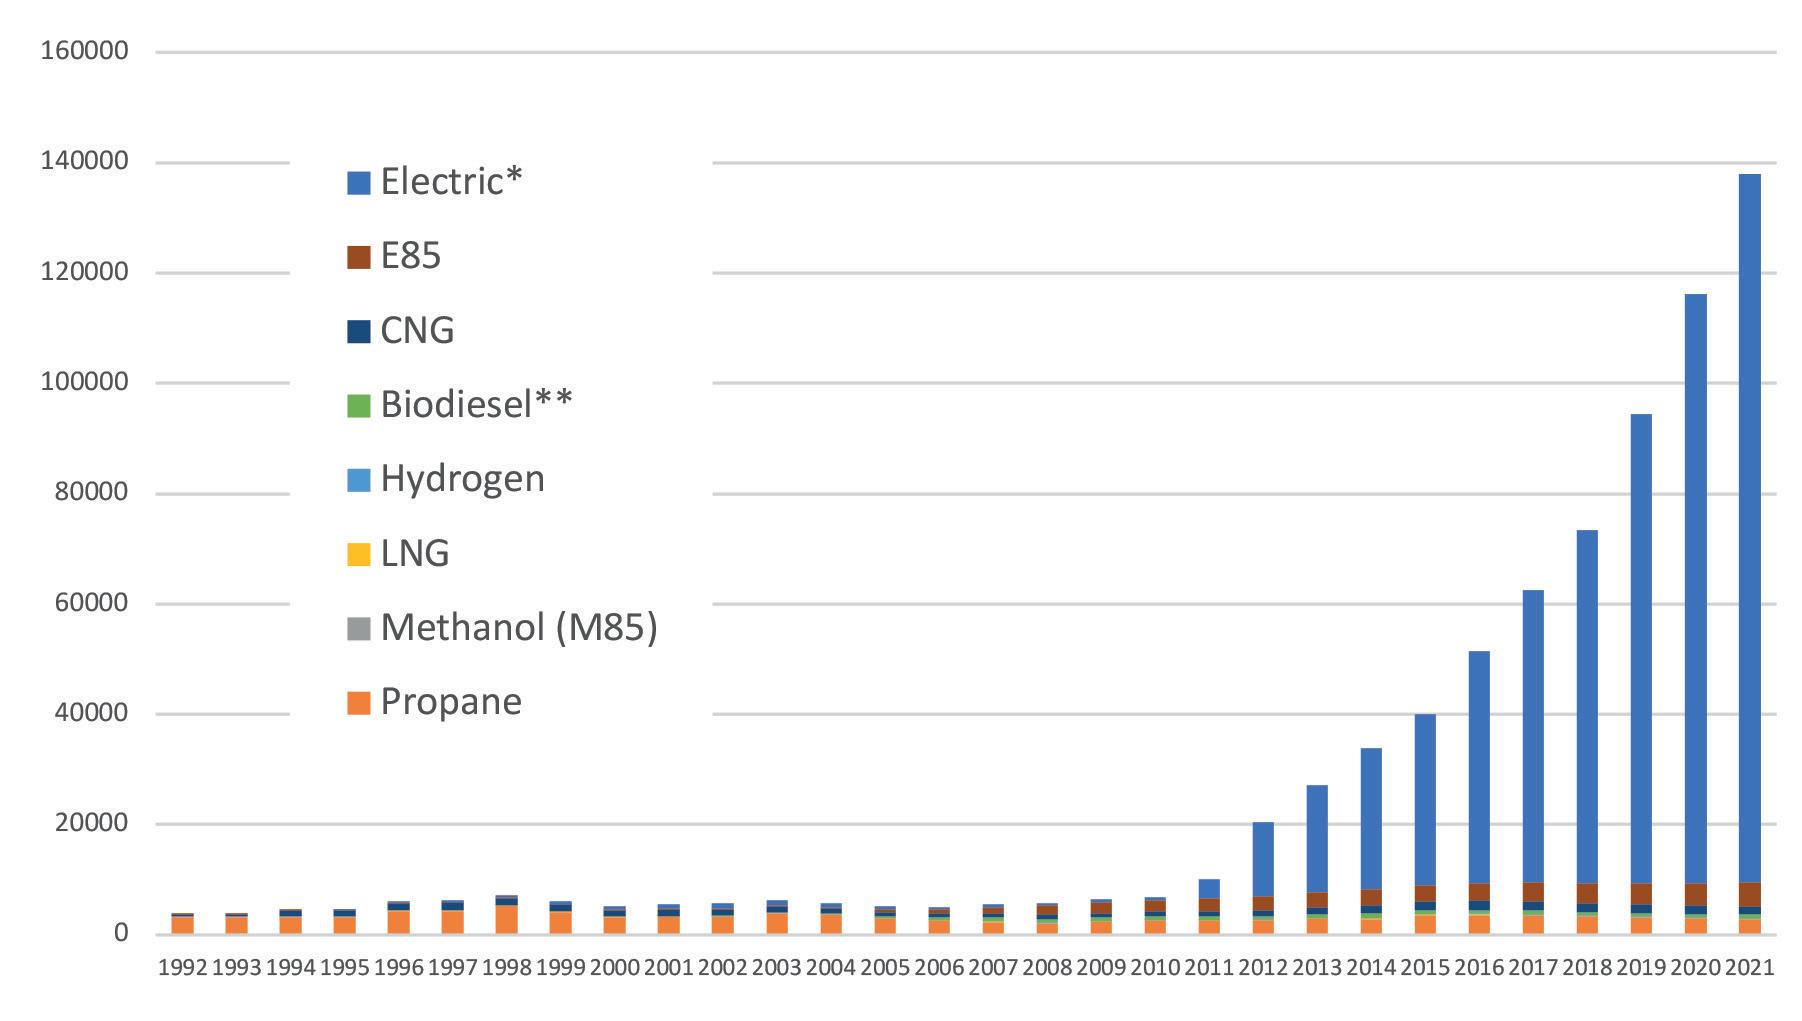
Alternative fuels are picking up pace. The Alternative Fuels Data Center (AFDC) tracks the number of fuelling stations each year for alternatives including propane, methanol, LNG, CNG, hydrogen, biodiesel, E85 and electric, shown in Figure 7. Over the years, these alternatives have contributed to the fuel mix, and many forecasts expected strong if not spectacular growth across the board. However, a number of these alternatives did not flourish, and some seemed to compete with each other rather than with gasoline. Methanol in its M85 blend has vanished; a hydrogen economy has not materialised; LNG as a transport fuel has
March 2023 HYDROCARBON ENGINEERING 16
Figure 5. US product supplied of finished motor gasoline, ‘000 bpd (source: EIA. 2022 is the author’s estimate).
Figure 6. US gasoline supplied, annual growth rates by decade, % (source: EIA, and author’s estimate of 2022).
Figure 7. US alternative fuelling stations by type (source: Alternative Fuels Data Center).
stagnated; propane use has dwindled. Modest growth has been achieved in stations dispensing CNG and biodiesel. E85 (blends of approximately 85% ethanol and 15% gasoline) stations have shown recent growth. In contrast, electric vehicle (EV) charging plugs have emerged in droves, and their numbers exceed all others by orders of magnitude. In 1995, AFDC reported 188 electric charging stations. In 2021, this number had skyrocketed to 128 474. There are several alternatives to gasoline, but the technological and economic advances in EVs have been astounding, while many other options have failed to gain traction. The Biden Administration has set a goal to ensure that 50% of all new passenger cars and light trucks sold in 2030 are EVs.
Conclusion: a new phase in the consumer-gasoline relationship
Gasoline is a valuable commodity; a single gallon of this energy-dense liquid can propel a car and driver for 30, 40 or even 50 miles, in vehicles that are safe and comfortable, cool in summer, warm in winter, wherever and whenever the driver wishes to go. What is all of that freedom and convenience worth? In some countries, such as Venezuela and Libya, government subsidies keep gasoline prices absurdly low – pennies per gallon. In other countries, governments place hefty taxes on gasoline to control consumption, and prices may be US$6 – 8/gal., or higher. In the US, prices are currently under US$4/gal. – well below all other OECD countries. Yet many consumers consider prices of US$4 – 5/gal. too high.
Gasoline producers and consumers are interdependent, but high prices to consumers, when coupled with record-high profits to oil companies, have heightened public resentment – despite the fact that the lion’s share of profits are being made in upstream petroleum, not in refining and marketing. During the Great Recession and COVID-19 lockdowns, for example, many refineries suffered negative margins. At the retail marketing level, the National Association of Convenience Stores (NACS) reported that 60% of the convenience stores selling fuel were owned by single-store operators rather than big oil companies. Many of these operators consider themselves fuel-neutral, and believe that their interests are more closely aligned with consumers than producers. Price spikes can squeeze the profits of a single-store operator. It takes a very patient consumer to listen to these points, however, when confronted with high prices and a possible recession in 2023.
withHybrid
The relationship between the American consumer and gasoline is changing. From the price spikes of the 1970s until now, each wave of demand recovery has been more sedate. The existing fleet is more efficient and less polluting; and more alternatives have emerged –particularly EVs. COVID-19 has popularised remote work, making it a permanent fixture. Refiners are thinking of export markets for their marginal barrels of output. Perhaps the relationship between gasoline producers and consumers is a mature one, and both parties are pursuing new interests. US gasoline demand may be on its way to a long, slow decline, but not a farewell.

Optimized Gas Treating, Inc 212 Cimarron Park Loop, Buda, TX 78610 www.ogtrt.com +1 512 312 9424 Now
Solvents N o withHybridSol S me Proven Technol OGT | ProTreat® Process Simulation

18 March 2023 HYDROCARBON ENGINEERING
We live in a world that continues to change and adapt to different industrial, technological, political and social realities. As a result of these changes, the oil and gas industry will inevitably need to adapt. The industry is responding to unprecedented levels of change driven by factors such as an increased focus on improving sustainability, new economic realities, and adapting to the future of the workforce.
As such, it is important to rethink the role of industrial digital transformation, which is now expected to deliver the next step change in ensuring safety, improving sustainability and reliability, enabling people, and increasing margin predictability. Making this a reality requires a shift towards industrial autonomous operations.

Envisioning industrial autonomous operations
Industrial autonomous operations is a vision for the future, where functions in operations embed higher levels of intelligence and close the loop with people and systems. This will enable people to focus on higher-level tasks. Although the industry has not reached the highest level of full autonomy, technology advancements have provided a good set of ingredients to allow for autonomous operations. Automation and control systems in a closed loop are becoming pervasive, and they continue to be complemented by different software-enabled capabilities such as advanced process control, alarm management, asset performance management, and remote monitoring. As automation and control systems move closer towards software and converge, current advances in cybersecurity, self-learning intelligent systems, and digital twins allow for increased autonomous operations.
With industrial autonomous operations, systems and processes will have increased adaptive capabilities enabled
through self-learning capabilities. These systems and processes will be bound by guardrails of cybersecurity, safety and reliability, which will be built with explainable artificial intelligence (AI) systems that utilise multiple simulation models serving as digital twins. Together, this will bring the next step change for industry, unlocking benefits that current digital capabilities do not support by intelligently, reliably and securely closing the loop with people and systems.
Setting objectives for the next digital frontier
The next frontier in industrial digital transformation will be the move towards intelligent and autonomous operations. Industrial autonomous operations will provide a step change in how the oil and gas industry can create its digital future. Over the past 40 years, some of the defining moments in the digital evolution of the industry include the adoption of automation systems and manufacturing execution systems, the implementation of applications such as advanced process control, and the use of enterprise resource planning systems. Currently, we are in a phase of broader adoption of cloud and AI/ML technologies as more use cases become scalable. The next major step will be closing the loop between intelligence displayed on a software application and an action through either people or systems. This will allow the industry to envision higher targets for digital transformation. These include:
n Zero-harm operations that keep people away from harm, predict operational risk, and ensure the integrity of operations.
n Significant sustainability improvements, achieved by maximising efficiencies or supporting new products such as renewable fuels.
n Maximising human potential by allowing people to focus on higher-level tasks.
March 2023 19 HYDROCARBON ENGINEERING
Praveen Sam, Honeywell, USA, introduces a novel digital operating approach within the oil and gas industry.
n Unlocking additional margin by optimising across a much broader envelope.
n Eliminating unplanned downtime, made possible by prevention of failures or autonomous recovery.
Accelerated innovation in the last decade has allowed us to create a path toward achieving this vision. As digital
technologies continue to mature, they also become more affordable, secure, and capable of faster value realisation.
The need for industrial-grade software
The road to an intelligent, autonomous future will require a change in how software is built. Industrial autonomous operations require industrial-grade software, which adds greater levels of trust, safety and reliability to software. This predictability is needed for autonomous operations. Some of the ingredients that make industrial-grade software are:
n Zero-trust cybersecurity: cybersecurity must move to a higher level of zero-trust whereby implied trust within each interaction is eliminated, and verification is built at each interaction.
n Explainable AI: AI provides intelligence, but autonomy requires AI to be self-learning in order to adapt to changes in the world over its life cycle. AI should also be explainable, as workers need to know why AI does what it does in order to let it autonomously control. Similarly, AI-enabled actions should always be safe and reliable.
n Digital twins: digital twins support deep learning for new AI models, and provide for verification before implementation. They can also evaluate many what-if scenarios to verify safety and expected results, before recommending or performing controlling actions.

n Secure integration with machines: software must also be able to safely integrate with smart machines such as control systems, robots, drones and other systems.
n Openness and interoperability: software must embrace a nature of being open, vendor-agnostic, and interoperable in order to allow industries to maximise their existing investments in multiple systems.
Opportunities for the industry
The future of autonomous operations is a vision that should not be relegated to the impossible, or an all-or-none ultimatum. Several aspects of industrial autonomous operations have already been implemented, and have generated value for the industry. Opportunities for applying autonomous operations include:

n Remote operations: decoupling the need for a physical presence near the control system or at any part of the operation is a big step forward – enabling control remotely, digitally enabling and connecting field workers with the control room, and permitting execution away from the control room.

n End-to-end optimisation: scaling optimisation from a single unit to multiple sites through integration with economic planning and scheduling allows for the achievement of a much broader optimisation envelope. Plantwide Optimizer is a proven technology in the market that empowers autonomous operations with intelligent closed-loop optimisation.
n Enterprise intelligence: setting the foundation for closing the loop between man and machine, industrial analytics deliver production insights at an enterprise scale, which delivers real-time monitoring of operations and analysis of multiple what-if scenarios to support decision making.

March 2023 HYDROCARBON ENGINEERING 20
Figure 1. Safety and people first: technologies such as drones and robots will ensure safety and elevate workers to focus on higher-level tasks.
Figure 2. Closing the loop between man and machine: the next frontier in industrial digital transformation will be the move towards intelligent autonomous operations.
Figure 3. Remote operations: decoupling the need for a physical presence, and connecting field workers so that actions can be executed away from the control room, is a big step forward.
The leader in Energy Optimization.
GEA means worldwide recognized evaporation, crystallization and distillation plants, in-house R&D facilities, vast know-how and expertise. We develop and design multi-stage, TVR & MVR heated plant concepts tailored to your specific needs. Get in touch today at gea.com/contact
Keeping people at the centre
Moving towards autonomous operations is a journey. This journey is human-centric and should not be viewed as a means to replace people. It allows us to rethink the future of work in the industry and adapt to changing workforce realities. As the industry continues to struggle with rebuilding lost expertise, worker enablement provides support for the emerging workforce through greater degrees of human inclusion, and elevates the current workforce to focus on higher-level tasks. Leaders who embark on a journey of autonomous operations must continuously embrace a human-centric approach.
Where to begin?
Realising value through intelligent operations requires a shift in mindset and the execution of a structured plan. In addition to setting targets for digital transformation, leaders should take the following steps:
n Prioritise the right function to prove value with autonomous operations: prove value with a digitally-mature use case of high business value. Opportunities such as end-to-end process optimisation or closing the loop with economic planning and scheduling demonstrate results that can create interest in attaining even higher objectives.
n Create an organisational foundation with supporting policies and practices: adapt organisational policies and digital practices to support industrial autonomous operations. Carefully designing organisational roles and responsibilities, security and audit policies, safety functions, and technology governance are necessary practices.
n Create a technology foundation with industrial-grade software: while industries can reuse most of their technology investments, leaders must strategically rethink the need to adopt new capabilities. Capabilities such as OT cybersecurity, explainable AI, monitoring for AI, and managing digital twins must be set up to ensure reliability of closed-loop functions.
n Continue to keep people at the centre and organise for change: everyone should be taken along as part of this journey toward autonomous operations. Managing change for people, supporting them through new processes, and elevating them towards higher-level tasks is necessary to ensure the long-term success of autonomous operations.
n Build the right governance and guardrails: increasing levels of AI and self-learning capabilities will require proper governance and guardrails to manage safety and reliability, including organisational practices that monitor the health and functioning of all AI systems.
Honeywell is building towards industrial autonomous operations with industrial-grade software that profitably improves safety, sustainability and productivity. The company brings learnings through its experience in shifting the industry towards greater levels of autonomous operations, and can effectively help drive this transformation.
Mika Kulin, Neste, explains how the company’s refinery in Porvoo, Finland, is integrating its different digital sources and automation systems into a single source of information.

In 2019, Neste Corp. started to further develop the digitalisation of its refinery in Porvoo, Finland. The refinery is in the Kilpilahti industrial area, which is the biggest chemical industry consortium in the Nordics. Its production capacity is approximately 12.5 million tpy, with the most important products being transportation and marine fuels, and base oil. It employs some 1000 people. It is a very complex plant comprised of four production lines and more than 40 production units, including two units that produce renewable diesel made from different types of waste. As a single product can have tens of different qualities, the refinery requires a high level of digitalisation and skilled personnel to enable efficiency.
High level of digitalisation
The refinery already had a high level of digitalisation and automation before the new project, Nappi, started up three years ago. The problem was that, for example, data from the processes, the material flow and the laboratory were split on different systems, making it hard to obtain an overall view of what was going on at the different process stages, and to optimise the process at any given time. When the project started in 2019 it was like a ‘digitalisation rehearsal,’ carried out as an agile development process in incremental steps. By not having a predetermined goal for the project, and by continuously listening to the end users,
March 2023 23 HYDROCARBON ENGINEERING
it was possible to smoothly adjust the solutions according to the input from operators and other staff involved.
The overall goal for the ongoing project is to provide the operating personnel, refinery management and supply chain management with new tools to monitor and adjust the processes according to changes in feedstock qualities, product requirements, and laboratory readings, for example.
The project started with the panel operators and the shift managers in mind, and in the beginning around 200 people had access to Nappi. Now, the system is expanding within the refinery; it has more than 500 users, and this number is rising.
More transparent process
Neste has put a lot of effort into digitalising the refinery’s process during the last few decades, using state-of-the-art tools to optimise the different processes in a number of ways. One of the key suppliers of the software solutions used at the refinery is NAPCON – a company that specialises in solutions for the process industry, and is also managing the Nappi project.
The problem was that although all of the systems at the refinery continuously collected a lot of information and were great tools for running production, they lacked transparency. As such, Neste decided to develop a kind of parachute system that was able to show a large amount of relevant data in a single view that could be expanded when needed, and was accessible to anyone involved in production at the refinery.
The term ‘agile’ is the key word in the process, as the project is light-footed and open to new ideas at any point during the course of the process. By involving operators and other potential end users at the refinery from day one, it was possible to change direction immediately if the users felt that the selected path did not live up to the real needs.
This means that Nappi is not just another refinery digitalisation programme; the key thing is the organisational change that the system enables. In essence, the system is an online platform that provides real-time situational awareness, enabling the whole organisation to be more efficient, and making it possible to react quickly to changing market needs, for example.
Centralised view
For different user groups at the refinery, the project means somewhat different things. While the refinery leadership team mainly uses the system for overall performance monitoring, a shift manager may enter production targets into the system for operators to follow, and to monitor how well the targets are achieved. For operators, the system offers an easy way to check the production targets and how they are met.
The way a modern refinery is working with the aid of digitalisation is not news to anybody working in the business, but one common challenge is that different systems run different parts of the refineries. With Nappi in place, it is now possible to gather and share common information in a centralised view and to combine it with the different dashboards used in production. The system also
enables more efficient communication within the refinery, which in turn leads to continuous performance improvements.
Gaining popularity
An example of how Nappi has evolved over time is that the system’s main screen has changed from a view with a lot of subgroups that was comprehensive but quite difficult to navigate, to a view now consisting of only a few dropdown menus and two important gauges: the refinery’s utilisation rate, and the number of production key performance indicators (KPIs) alarming. More precise data is then available through the expandable menus beneath the gauges, where the user can dig into the flows, qualities, scheduled targets, production constraints, blending performance and analysers.
It is now easy for any user to choose only the required information. Initially, Nappi was about providing data for end users, but further development has made it possible for end users to write data back into the system. Plant engineers are now using Nappi to inform users of changes in capacity constraints. These background comments enable organisation-wide learning. The simplified screen is a result of the fact that the users could offer their input throughout the project’s progress. Now, it is also possible for development ideas to be added into the system through a dedicated menu – a feature that is being used increasingly.
A fundamental consideration when developing Nappi is that the use of the system is totally voluntary. When analysing its usage over a period of two years, it is striking how this has constantly grown as new features have been introduced to meet the exact needs of the users. This demonstrates the strength of agile development compared to normal, large digitalisation projects with slow feedback circles.
Complex facility
As mentioned, the refinery is a complex plant, producing a number of different products – from gasoline and diesel, to base oil and renewable diesel. As the product mix is not based on four product lines producing strictly one quality each, but rather four production lines sharing the same assets while producing several different products, the system forms a complex four-way, end-to-end supply chain. When all the parameters are right, it is very efficient, but demands a lot of automation and harmonised production.
There were two main reasons why the refinery started to develop Nappi as an overall management system that utilises multiple pre-existing digital systems: to maintain the production at a high and profitable level, and to ensure the production of just the right quality of any product.
Nappi also offers the opportunity to have a long-term, future-oriented overview of the production, using data-based management, to an even larger extent than before. At the same time, the maintenance systems have also been improved by connecting them to Nappi, thus enhancing the transparency and improving the predictability of production. This has raised the safety and energy efficiency at the refinery, resulting in more carbon-efficient refining.
March 2023 HYDROCARBON ENGINEERING 24
Capturing green opportunities

Carbon capture and storage or utilization (CCS/CCU) is a key strategy that businesses can adopt to reduce their CO2 emissions. By selecting the right technologies, pressing climate change mitigation targets can be met while benefitting from new revenue streams.
Sulzer Chemtech offers cost-effective solutions for solvent-based CO² absorption, which maximize the amount of CO2 captured and minimize the energy consumption. To successfully overcome technical and economic challenges of this capture application, we specifically developed the structured packing MellapakCC™. This packing is currently applied in several leading CCS/CCU facilities worldwide, delivering considerable process advantages.
By partnering with Sulzer Chemtech – a mass transfer specialist with extensive experience in separation technology for carbon capture –businesses can implement tailored solutions that maximize their return on investment (ROI). With highly effective CCS/CCU facilities, decarbonization becomes an undertaking that can enhance sustainability and competitiveness at the same time. For more information: www.sulzer.com/chemtech

Utilising existing systems
However, Nappi does not mean that the traditional way of working itself has changed at the refinery; panel operators are still using the same dashboards as before to make fact-based decisions on how to improve performance, and how to utilise the full potential of the feedstock. Instead, it is a shortcut to utilising the huge amounts of data that are constantly collected in the distributed networks regarding feedstock, flows, temperature and pressure, for example.
Another big change is that the system provides both the operators and the staff involved in the production with an instant view over the process and the state of it, without them having to dig into different dedicated systems. As an example, the numerical targets that previously had to be sent by email or were found in different files can now be shared within Nappi. When considering all of the different organisational levels that might need the information, this feature alone has hugely streamlined the process at the refinery.
Smooth transformation
Nappi aims to optimise the processes of the four production lines as an entirety at the refinery. Because the system makes it possible to look at the processes from different angles, it also provides an opportunity to optimise the overall product mix by enhancing how the feedstock, energy and additives are used when producing different products.
Since the project started in 2019, the world has changed significantly due to COVID-19, the energy crisis, and the war
in Ukraine. The refinery has successfully and smoothly adapted to the changed world thanks to the overall level of digitalisation, and due to the advantages that Nappi offers the whole plant with regards to planning the production efficiently.
For example, the refinery management, engineers and maintenance have their own information needs, each of which were addressed during the project. It is now possible for maintenance to better plan and schedule service actions through Nappi, so that the production is disturbed as little as possible. The next step is to make the system even easier to use, but the refinery’s gap between targeted and realised production goals has already decreased thanks to the project.
A different project
As a result of the agile development praxis used while developing Nappi, feedback from the users was continuously sent to the developers at NAPCON. The project was quite different from most other digitalisation projects that the company has been involved in; the biggest difference being that large industrial systems are usually developed out of sight of the real users until it is time to release version A. It can then be a time consuming and slow process to change the system if needed. By being continuously able to adapt the system according to immediate feedback at every small step along the way, the system has gradually grown according to the real needs of the users.
George, an industrial control systems (ICS) engineer at a large petrochemical plant, is monitoring operations when he notices something amiss with a burner management system on the sulfur recovery unit (SRU)’s thermal reactor, which appears to be malfunctioning and is on the verge of releasing high amounts of sulfur dioxide (SO2) and hydrogen sulfide (H2S) from the incinerator stack.
George’s first thought is that it is an equipment failure, but he should have been alerted by the base layer control system. The safety instrumented system (SIS) that is monitoring the burner management systems to ensure that processes stay within their defined engineering limits has failed to trip the unit.
This is the first sign that the incident is not the result of an equipment malfunction, but rather of a targeted attack – one that George and the plant’s cybersecurity team are unprepared for. The adversary carrying out the attack has been lurking in the plant’s network for nearly a year, dwelling unnoticed in the network and developing malware capabilities targeting emergency shutdown systems – ultimately leading to the first of two plant shutdowns. This scenario, drawn from a 2017 TRISIS malware attack on a Saudi Arabian plant, underscores the potential threats to oil and gas refineries and the lack of protections and detections that many plants have for their ICS and operational technology (OT) environments. The plant, being unable to identify the TRISIS intrusion, was blindsided by the attack, and did not have a robust plan for such a response. Ultimately, the plant was fortunate that the damage it suffered was not worse, because it very well could have been.

The question is: how do attacks like this happen? And what could the plant have done differently?
The threats are real
The downstream segment of the oil and gas value chain remains at risk of cyberattacks. Refining facilities are a key target for adversaries due to the centralised nature of operations, the presence of control systems, and the possibility for damage or destruction from highly-volatile processes.
March 2023 27 HYDROCARBON ENGINEERING
Mike Hoffman, Dragos Inc., USA, discusses how refineries can protect critical ICS/OT systems from cyberattacks.
All industrial operations are increasingly under attack. A 2021 Ponemon Institute study of industrial cybersecurity found that 63% of respondents said their organisations experienced an ICS/OT cybersecurity incident in the previous two years, at an average cost of nearly US$3 million per incident.1
Many industrial facilities are not especially well-prepared for these types of attacks, owing to a historic cultural divide between IT and OT security. Most industrial sites have partly integrated their IT systems with ICS/OT to improve efficiencies, but cybersecurity has not kept pace.
The study found that only:
n 43% of respondents said that their organisation’s cybersecurity policies and procedures were aligned with their ICS and OT security objectives.
n 35% said that IT and OT teams have a unified security strategy that secures both the IT and OT environments.
IT and OT may be linked via a plant’s network, but they are different. A lot of OT components are older and were not designed with security in mind. Whilst newer equipment is designed with security features, it can take a while to replace hardware that typically will run for 20 – 25 years. IT security methods will not work well with older OT systems, which require a different approach to deal with the type of threats that it faces.
In planning to protect ICS and OT, the downstream segment needs to be aware of the following types of attacks:
Targeted disruptions
Nation-state attacks on infrastructure and industry, such as those regularly occurring in the Russia-Ukraine war, can have serious consequences.2 The Colonial Pipeline ransomware attack, attributed to the DarkSide group based in Russia, shut down the
pipeline for almost a week and caused jet fuel shortages for many airlines, panic buying of gasoline in southern US states, and other disruptions.3
Attacks can have direct and indirect consequences. Many refineries have communities that have been built up around them, which would be affected. Shutting down a refinery will also affect the supply chain, for instance, because petroleum byproducts are used as feedstocks in many chemical processes.
Vendor compromises
These facilities receive frequent visits from vendors – for maintenance and for a variety of other reasons. A vendor might be upgrading a vibration monitoring system by installing a new server into the control network, for example. That vendor could very easily plug an infected laptop or USB drive into the network and unintentionally introduce malware into the OT environment.
Vulnerabilities of OT systems
Refineries are replete with physical safety systems, such as pressure release valves, flare systems, etc. As plants undergo process upgrades and debottlenecking projects to increase throughput, these physical systems are often not upgraded due to cost. As such, they are no longer capable of providing the protection required. As a result, plants, realising the need to mitigate residual process risks from these changes, have turned to safety instrumented systems (SIS).
SIS are highly-available systems that include sensors, logic solvers and actuators to monitor critical process systems and take action to shut the process down if predefined limits are exceeded. These systems provide the ultimate target for an attacker if the goal is to cause a catastrophic event.
In a scenario such as the Saudi Arabian plant attack, an SIS could be compromised and disabled so that it does not act. For example, it may be modified so that no trip is issued when a process reaches unsafe levels. If an attacker then goes after the distributed control system (DCS) that runs the plant and moves the pressures, flows or temperatures of a particular process outside of its operating envelope, an explosion could occur.
Today, plants generally have common architectures with a demilitarised zone (DMZ) or buffer zone between IT and OT to allow for remote access, file transfers, and other data movement. Many plants, however, rely on older ‘best practice’ architectures that are relatively flat across systems with the same functional level as opposed to smaller ‘zoned’ networks. These flat networks are ripe for lateral movement by adversaries, especially if they are protected with atrophying controls.
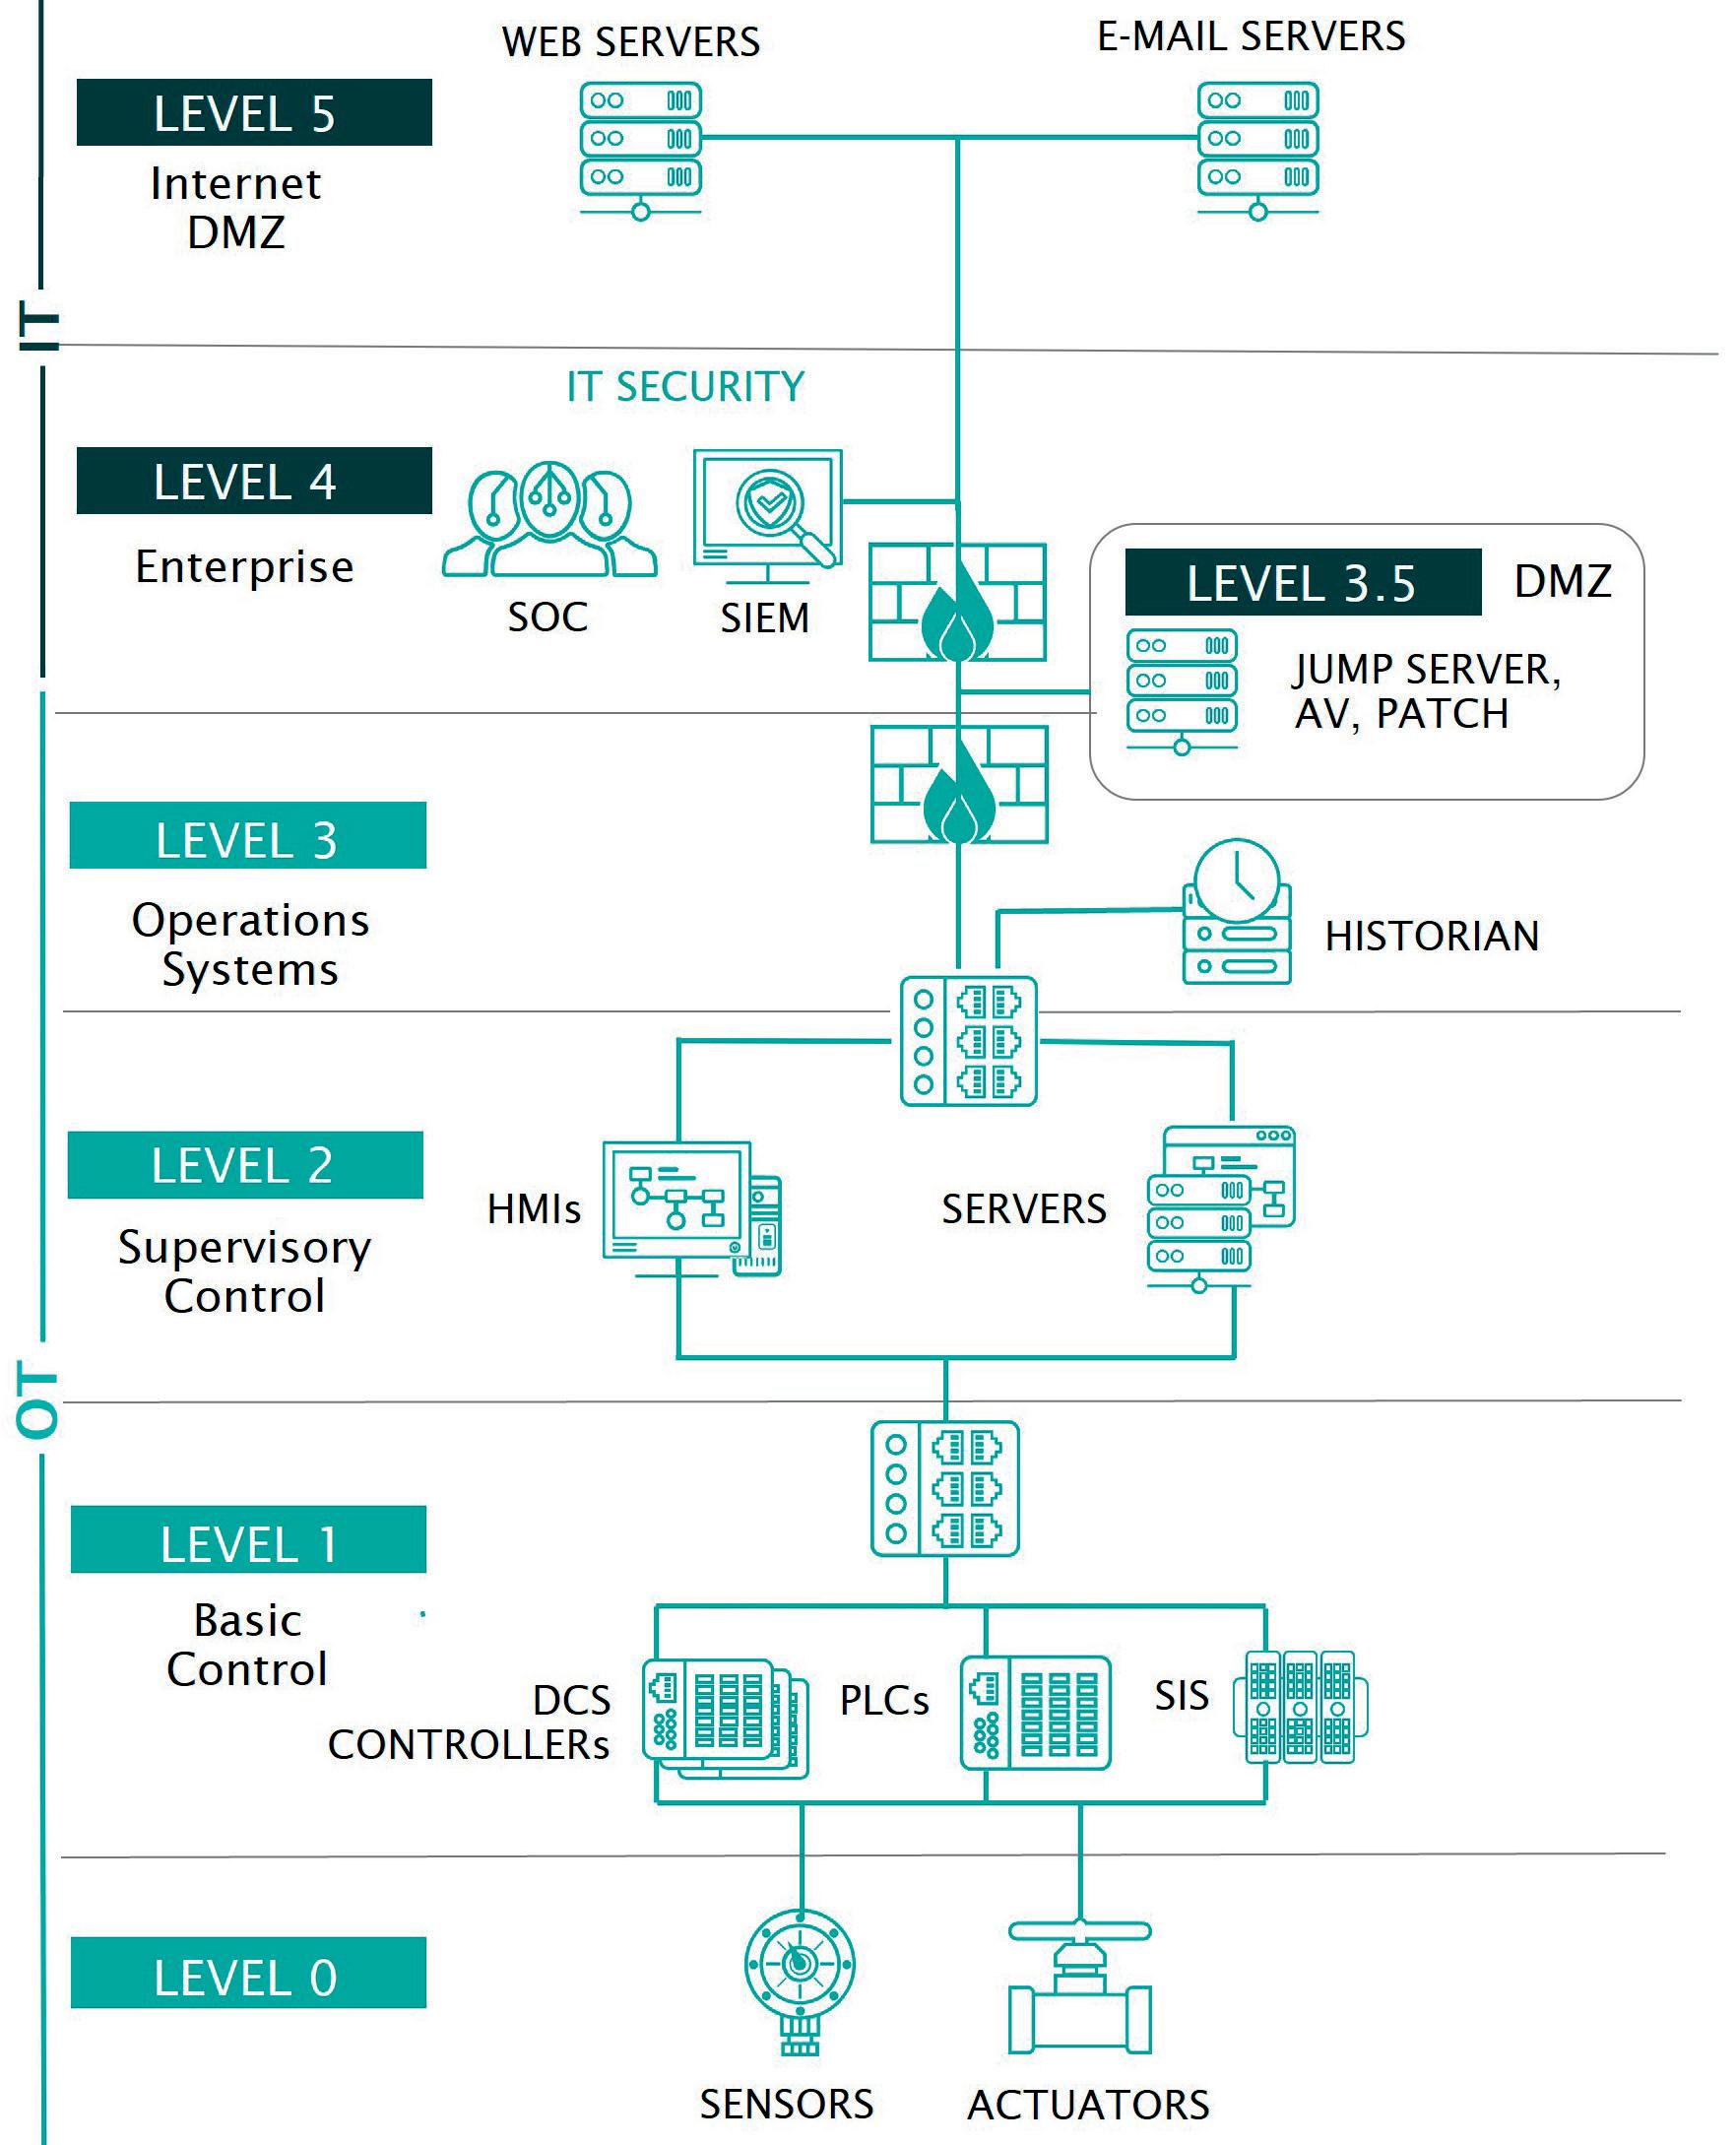
Many attacks will start by targeting corporate systems via phishing and other attempts to gain access, and then try to get through the DMZ – if one exists. Next, adversaries work to get past the operations systems (Level 3), supervisory controls (Level 2), and basic controls such as DCS controllers and programmable logic controllers (PLCs) (Level 1) to perform their final action or objective, which may include process manipulation (see Figure 1).
Firewalls typically sit between each functional level, or zone, including the firewalls that create the DMZ, but the fact is that many operators do not properly maintain their firewalls and are unaware of the actual data flows going across them, because they are not monitoring the network. Without having visibility
March 2023 HYDROCARBON ENGINEERING 28
Figure 1. Common plant IT/OT architecture.
Only ActiPhase® fi ltration technology has an active component that attacks soluble foulants in its reticulated chambers and transforms them into solids, so they can’t escape and wreak havoc deep in your reactor.


Foulants, beware.


Optimize crystaphase.com
into network traffic flows, it is challenging to ensure that firewall rule sets are correct.
Preparing for an attack
Refineries need to be sure that they have a defensible architecture, which starts with having equipment in place to monitor operations effectively. Monitoring can help detect attacks early on, before a physical impact is realised.
Adversaries performing targeted attacks must slowly work their way through an OT environment looking for DCS, SIS or PLCs, and they can spend months inside a network before acting. Such an attack requires a considerable amount of reconnaissance and reverse engineering before realising the action on objective. The numerous months that the adversary spent inside the Saudi Arabian system while developing TRISIS might be unusual, but the average ICS/OT cybersecurity incident is a nearly year-long event.
The amount of time it takes to carry out a targeted attack is one advantage that defenders have within OT. If the right protections and monitoring are in place, this gives defenders that much more time and opportunity to catch the attack before equipment or process manipulation occurs.
The necessary steps in preparing for an attack include:
Develop an incident response (IR) plan
Plant operators need to have a documented plan in place in order to respond to unusual activity involving OT. Practically all organisations have IR plans for IT, but those plans fail when leveraged directly in OT because of the differences in how the technologies operate and the actions to take on the systems once an incident is called. A response plan should address several important stages.
Detection
When unusual activity is detected by a SIS, for example, it is important to consider that there may be a cyber element at play. Equipment malfunctions, but times have changed, and the industrial community is beginning to adopt a cybersecurity mindset.
The first thing to do is determine whether an event is malicious through network security monitoring, collecting logs from systems and hosts, and analysing them. If the activity looks at all suspicious, the event can be raised to the level of an incident, which will trigger a response from the appropriate teams.
An IR plan serves as the foundation for every other stage of response, but only comes into play once equipment malfunction has been ruled out.
Containment
Once an event is raised to the level of an incident, the response stage shifts to containment. This involves scoping the incident to determine affected systems, which often includes collecting forensics evidence from systems, reviewing logs, and performing network monitoring. Foundational to containment is preparation by having contingency plans in place to understand what systems are required for minimal operation, or when a controlled shutdown may be required. Planning for containment is a team effort that should involve engineering, ICS/OT security, and operations.
This stage is likely to be when the plant would begin to isolate networks. During the Colonial attack, pipeline operators separated their OT from IT as part of containment. Isolating the OT network is one of the primary containment steps, but this can also have indirect business impacts. Containment can be broadly applied across OT and processing units, or isolated down to individual system(s), depending on the respective network architecture and intrusion scope.
Eradication
As systems are scoped for intrusion and contained, eradication begins to immediately remove the threat from the environment. There is no clean break in each of these steps, and containment, followed by eradication, is very much an iterative process. After systems are cleaned, monitoring levels must be drastically increased to ensure that the malware or adversary is completely removed from the environment. Otherwise, the threat may regain a foothold and start successive attacks.
Recovery
Once systems have been cleaned and the threat removed, the plant can bring systems back online. Crucial to this step is understanding minimal operating requirements and order of restoration. For example, domain controllers, application servers, and critical human-machine interfaces (HMIs) are often needed first before other OT systems are brought online.
An important part of recovery is having reliable back-ups. This is one area where OT and IT are similar, taking regular snapshots of servers and databases to aid in recovery.
One step to consider is having offline back-ups, which are essential in cases of ransomware, for instance. Ransomware actors will often target connected back-up systems along with production systems to prevent quick recovery and ensure that ransom payments are made. A secondary back-up that is disconnected or replicated to a secure cloud storage system can help speed up the process of restoring systems.
Conclusion
Current adversaries have shown that they can conduct attacks in the downstream segment while new, increasingly sophisticated adversaries are emerging. Refineries must adopt controls to counter these growing threats. A primary control that can be implemented is to have a tested incident response in place for OT, which includes steps for detecting a cyber event, followed by containment, eradication and restoration. Network security monitoring is foundational to enabling these incident response steps. Whilst ‘defence is doable’, it takes a plan with the right protective, detective and responsive capabilities to safeguard critical refinery operations.
References
1. ‘2021 state of industrial cybersecurity’, Ponemon Institute, (November 2021), https://hub.dragos.com/hubfs/Reports/2021Ponemon-Institute-State-of-Industrial-Cybersecurity-Report. pdf?hsLang=en
2. ‘Relentless Russian Cyberattacks on Ukraine Raise Important Policy Questions’, (5 October 2022), https://www.darkreading.com/threatintelligence/russian-cyberattacks-ukraine-raise-important-policyquestions
3. ‘Colonial Pipeline hack explained: Everything you need to know’, (26 April 2022), https://www.techtarget.com/whatis/feature/ColonialPipeline-hack-explained-Everything-you-need-to-know
March 2023 HYDROCARBON ENGINEERING 30
Pop-A-Plug ® Tube Plugs


ASME PCC-2 Compliant Heat Exchanger Tube Plugging System


Trusted by plants around the world as their go-to tube leak solution, Pop-A-Plug Tube Plugs from Curtiss-Wright are engineered for optimal performance throughout the life cycle of heat exchanger equipment. Controlled hydraulic installation eliminates welding and time-consuming pre-/post-weld heat treatments that can cause damage to tubes, tube sheet ligaments, and joints.


• No Welding Required
• Pressure Ratings Up to 7,000 PsiG (483 BarG)


• Simple Hydraulic Installation
• Helium Leak Tight Seal to 1x10 -10 cc/sec


• 100% Lot Tested to Ensure Unmatched Quality


• Wide Range of Sizes& ASME/ASTM Certified Materials Available


877.383.1029 l est-sales@curtisswright.com l cw-estgroup.com/he-23


Read the issue here Subscribe for free: www.globalhydrogenreview.com A new magazine focused on the global hydrogen sector The Winter issue of Global Hydrogen Review is out now
Pipelines make money by moving fuel. But on 9 May 2021, no fuel was moving through the US’ largest refined petroleum product pipeline. As the Colonial Pipeline’s operators scrambled to understand the extent of the cyber breach, the pipeline – responsible for moving nearly half of the transportation fuel used on the Atlantic Coast – was at a standstill. A ransom of US$4.4 million had already been paid, but this represented a fraction of the mounting economic impacts felt by the breach, as roughly
100 million gal. of fuel went undelivered each day. Consumer prices at the pump jumped to seven-year highs, and gas stations ran dry across the US southeast. Airlines rearranged flight schedules; the President of the US weighed in to prevent further economic disruptions, declaring an emergency.
All of these impacts flowed from a single cyberattack targeting the billing department of the Colonial Pipeline operators. When these operators were confronted with a clear breach in their information technologies (IT)

March 2023 33 HYDROCARBON ENGINEERING
Leo Simonovich, Siemens Energy, USA, lists the important steps to be taken in order to develop a more mature cybersecurity posture.
systems, the operational technologies (OT) systems also had to cease operations – the workflows could not be separated. That disruption caused headaches up and down the supply chain. As the US Secretary of Energy pointed out, “it certainly is a reminder that we need to take a hard look at how we need to harden our necessary infrastructure, and that includes cyber threats.” 1
Even after the highly public example of a ransomware attack halting real-world operations, it is already clear that this will not be the last of such incidents. In December 2022, a ransomware attack against the Copper Mountain Mining Corp. prompted a shutdown of its mill while the company’s team determined the effects of the attack on their control systems.
The digital age
Cybersecurity is now a make-or-break capability for many companies that do not yet think of themselves as digital companies. Workflows seamlessly integrate digital tools with physical equipment, and cannot operate safely when the digital components of said workflows are compromised.
This is particularly true for hydrocarbon supply chains. At every stage from wellhead to pipeline, and refinery to distribution, digital technologies are deeply integrated with physical systems. The separation between IT and OT has blurred. The same capabilities that give pricing algorithms up-to-the-minute reports on how much product has been shipped, for example, also unavoidably create connections that bad actors can exploit. At the same time, the sophistication and scale of cyberattacks have escalated. Robust for-profit

ransomware attacks target energy infrastructure, while geopolitical motivations lead government-backed hacking groups to seek backdoor access to energy infrastructure in rival nations.
Problems faced
For leaders in the hydrocarbon industry, this poses a new set of challenges. Increasingly, chief information security officers (CISOs) must protect not just IT, but also OT. Even for CISOs who have a background in OT, the cybersecurity needs of a changing asset base, as well as the moving target of regulatory compliance for cybersecurity, pose ongoing challenges. How long will IT systems that have support cycles averaging four years really be able to protect OT systems with expected life cycles measured in decades? What is the right investment strategy when cybersecurity advancements become available years faster than regulatory guidance for defending the equipment in question? How can an organisation buy down risk, when cyber insurance offerings do not match the identified risk profile?
These are high-stakes questions for organisations of every size. Moderately-sized companies are particularly challenged because they cannot expand budgets to hire more cybersecurity personnel, or research, develop and deploy their own systems for risk management. Yet even major organisations with resources that are available for internal solutions are susceptible to disruptions when the value chain breaks at its weakest link.
Finding solutions
Cyber defences need to evolve. In the wake of the Colonial Pipeline attack, US government and private sector officials have moved to prevent and mitigate future disruptions. A wave of new regulations, policies and industry actions seek to address key vulnerabilities and build more resilient cybersecurity into critical infrastructure. The Transportation Security Administration (TSA), in particular, has worked to transform pipeline security in the US.
The TSA’s new risk-based approach, published in the security directive ‘Pipeline Security Mitigation Actions, Contingency Planning and Testing’, calls for new technologies, procedures and planning guidelines to protect against cyber threats. Companies are encouraged to leverage artificial intelligence (AI), cloud computing, and big data for cyber hygiene, incident reporting, and anomaly detection.
This change is an important paradigm shift. The old regulatory model was designed around a less sophisticated operating environment. Networked physical systems used to be separated from other IT systems. This air gapping approach aimed to prevent cyberattacks by ensuring no digital pathway could connect from the internet to the infrastructure that actually carries fuels. The TSA collected voluntary reports of cyber incidents, but did not have mandatory reporting requirements.
Today, the competitive business environment drives close integration in IT and OT in order to maximise
March 2023 HYDROCARBON ENGINEERING 34
Figure 1. Cybersecurity is a make-or-break capability to protect hydrocarbon supply chains at every stage – from wellhead to pipeline, and beyond (source: Siemens Energy).
efficiency and seek every competitive advantage possible. That integration means that attacks can – and will – affect both IT and OT, even if the attack does not directly penetrate OT systems. The TSA rightly embraces that reality in its new regulatory requirements, emphasising the need for expansive and detailed understanding of the IT and OT devices that are connected to their network and the need to identify anomalous behaviour. Instead of assuming that cyberattacks will not breach air gaps, the idea is for companies to identify and intervene in attacks as swiftly as possible, and quickly share information about said attacks.
In order to comply with regulations and succeed in the face of escalating cyber threats, CISOs and their security teams must build new capability. There is a need to monitor billions of connections between physical assets, industrial control systems, and corporate IT software on a minute-by-minute basis. Companies need to sift through that information at machine-like speeds to detect the interactions that could indicate a nascent cyberattack. If a breach is detected, pipeline security teams must be able to isolate the attack and prevent its spread to other physical or digital assets, and must report the incident to the Department of Homeland

technological assistance. Purpose-built monitoring and detection technologies can leverage AI and cloud computing to identify threats within company networks, notify relevant authorities, and begin impact mitigation. Using such systems, relatively small analyst teams can quickly review anomalies and understand their likely consequences for workflows and equipment. This type of threat hunting shifts the balance of power from attackers toward defenders. In an actively-monitored system, it is difficult for attackers to learn their way around operating technologies without alerting defenders to their presence.
Conclusion
Combining AI-driven automation with reporting requirements will help to rapidly harden targets across the energy ecosystem. These are important steps toward a more mature cybersecurity posture for the industry. This is how defenders diminish the reach and power of novel attack methods – by detecting attacks quickly, and sharing detailed threat intelligence quickly and widely. This will result in reliable and resilient infrastructure being built and sustained.
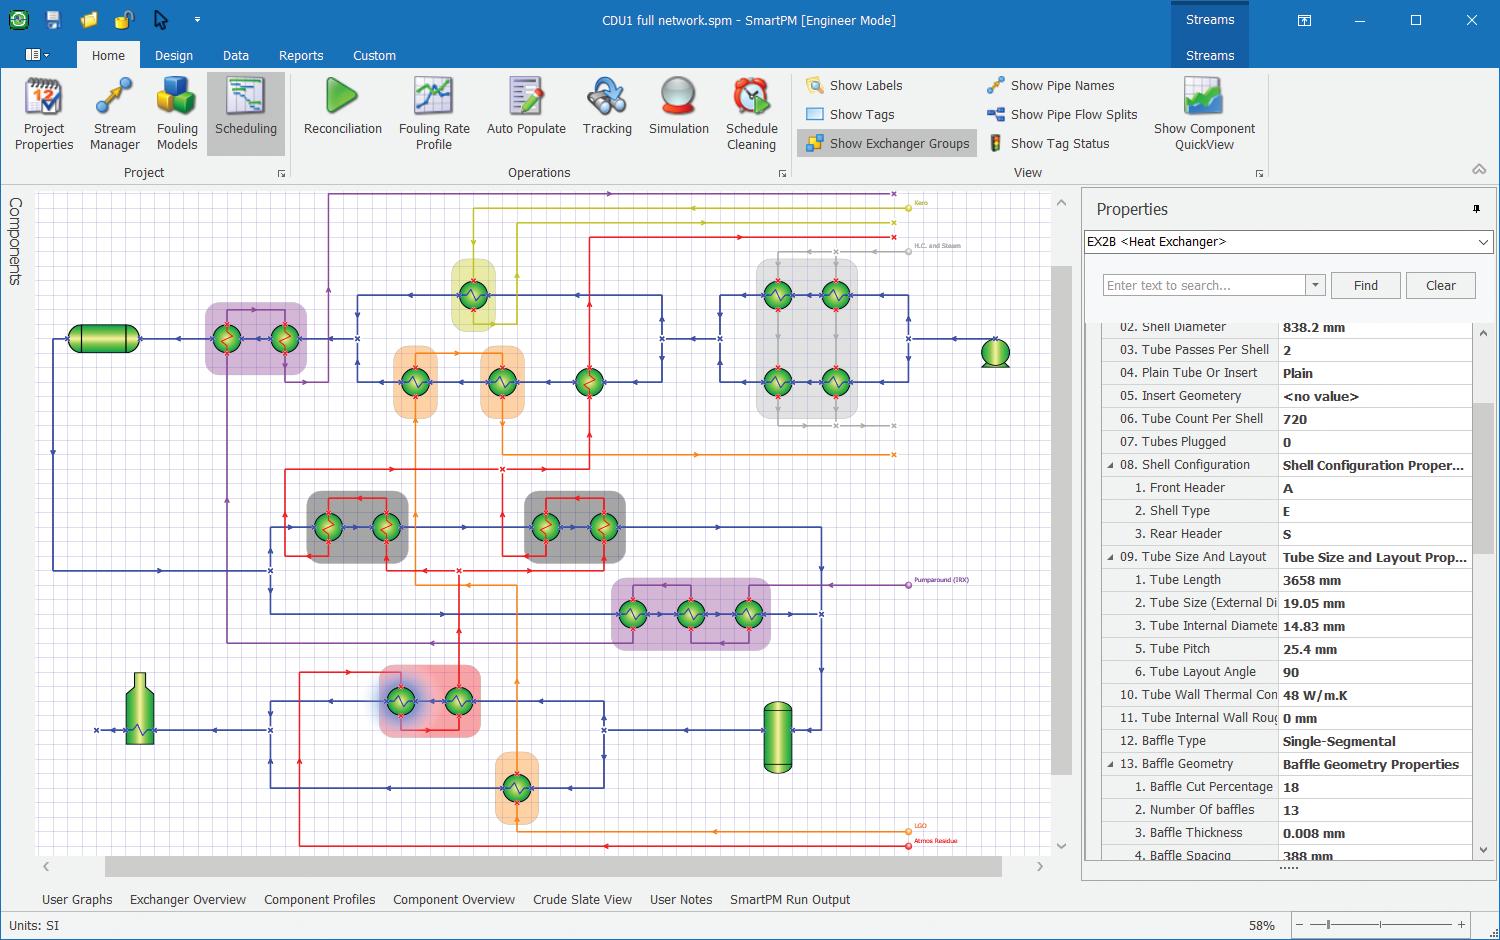
SmartPMHalfPgResize_final.pdf 1 8/9/22 12:25 PM
‘Remarks as Delivered by Secretary Granholm at the White
Mark Stuckey, UNICAT Catalyst Technologies LLC, discusses the emergence of next generation spherical catalysts and their impact on yield increases and reduced carbon dioxide (CO2) emissions in tubular reformers.

Designs of tubular steam methane reformers (SMRs) have, wherever possible, been optimised around the limitations of key component capabilities, i.e. dimensions and high temperature creep of tubes, together with the pressure drop and activity of the conventional catalysts within the tube. Over the years, tube and catalyst manufacturers have improved their respective products, but limitations of conventional catalyst carrier manufacturing processes have slowed any significant developments over the last 20 years.
The next generation of catalyst required a step change in carrier manufacturing processes. It is generally known that spherical shapes pack better in tubes than alternate cylindrical types, but it has been difficult to manufacture spheres in volume, so all conventional carriers have been non-spherical. However, 12 years ago, UNICAT, knowing the packing benefits, introduced the first spherical catalyst into a tubular steam reformer.
This article will detail two industrial cases which demonstrate the effect of catalyst shape optimisation – moving to spheres from non-spheres. The first case will be UNICAT’s
plain spheres, with 12 years of operation in a 450 Tube DRI reformer. The second is a US refinery installed with UNICAT’s Magcat Textured Sphere technology.
Background
The overarching efficiency of a reformer is derived from the efficiency of heat transfer through and into the tube. This heat energy, combined with the catalyst, promotes the reaction between the process gas (steam and methane) to produce hydrogen.
The effectiveness of getting heat into the tube and facilitating the efficiency of the reforming process is highly dependent on the flow of the process gas through the tube. The aim is to facilitate the lowest amount of process gas flow restriction whilst allowing for sufficient time for the reforming reaction to take place.
The catalyst shape and how the thousands of individual catalysts pack impact the flow dynamics of the process gas. Conventional catalysts pack chaotically due to their non-spherical shape, and this leads to uneven flow, flow bottlenecks, and sub-optimal heat transfer.
36 March 2023 HYDROCARBON ENGINEERING
Conventional catalysts are produced using either extrusion or hydraulic pressing. As a result of these manufacturing techniques, only mono-directional shapes are able to be manufactured. Holes are added to try and reduce the shape pressure drop issues and to introduce mathematically-calculated geometric surface area.
However, this has a limited benefit. Firstly, the mono-directional shape and alignment of holes within that shape will not pack within a tube with the holes aligned to the process gas flow. Secondly, process gas will always look to follow the easiest path through a restricted tube. The majority of the flow will preferentially look to find the voids between the shapes, and these voids in a tube packed with conventional catalysts are chaotic.
Spheres pack uniformly, naturally resulting in the voids being the same shape and size, meaning even distribution of the process gas across and through the tube. The benefit of this even distribution effect with spheres is that the process gas restriction (pressure drop) is lower, allowing for significantly more flow through the tube. Additionally, because the process gas evenly reaches every individual catalyst sphere within the
tube, all of the active surface area is available and involved in the reforming.
UNICAT’s plain spheres (see Figure 1) have a low geometric surface area (GSA) relative to their volume, and so deliver the pressure drop benefits but are not optimised for active surface area. The Magcat technology added golf ball-like surface texturing, maintaining all of the process flow distribution benefits of spheres whilst optimising the active surface area.
Tubular SMRs are used extensively in the production of hydrogen, generating 96% of hydrogen produced worldwide.1 On average, 65% of global refinery hydrogen demand is satisfied by reforming and cracking processes, and 32% is provided by on-purpose units.2

Sphere catalyst technology
Generation 1.0 technology is based on plain four-holed spheres, under the brand MYD-S (see Figure 1). The sphere was introduced to facilitate uniform packing and flow. The holes were added for customer visual acceptance rather than any process benefits. The sphere manufacturing technology is economically-viable for the larger > 20 mm spheres, and as such
March 2023 37 HYDROCARBON ENGINEERING
was only offered to the Direct Reduction of Iron (DRI) market in July 2012.
27 mm four-holed spheres were supplied into a 450 x 11 in. dia. tube DRI SMR in the Americas. Tubes were loaded with the same-sized 28 mm MYD-S sphere containing between 8 – 11 wt% nickel. They replaced a previous charge of ribbed cylinder-shaped catalysts.
The customer referenced the following differences in performance in March 2018:
n The overall reformer pressure drop had fallen by 60% as compared to the previous charge.
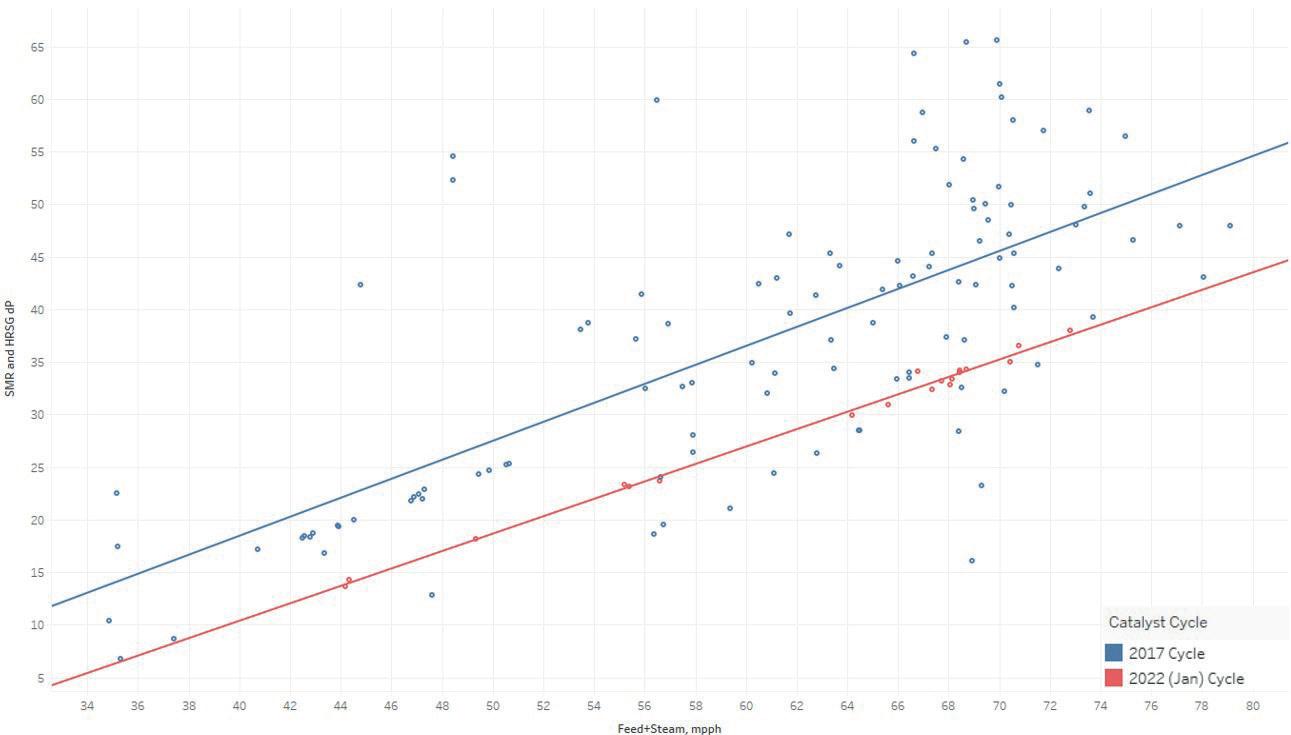
n Reformer gas quality remained equal.
n Approximately 15% energy savings were achieved.
n An increase in total plant capacity to 210 tph from 190 tph.
n No intermediate plant shutdown was required over the five years for dust removal.
The customer could have increased plant capacity further, however they were limited due to the compressor capacity. The change from cylinders to spheres delivered other physical benefits which will be explained in the following sections.
Next generation SMR sphere catalyst technology
Magcat Textured Spheres’ manufacturing processes and shapes were designed to optimise the compromises of plain spheres. Essentially, the manufacturing process was developed to enable the mass production of any sized spheres with surface textures.
Magcat is compatible with all tubular steam reformers (primary reformers) used for SMR, and is now installed in over 27 hydrogen plants worldwide.
Generation 1.0 spheres and Generation 2.0 Magcat have been shown to increase hydrogen production and reduce carbon dioxide (CO2) emissions by 10 – 20% in ways that are easily implemented, and which avoid equipment investment costs. Spheres demonstrate lower pressure drop than previous charges, which in turn allows for higher process gas flows. Traditionally, SMR pressure drop is reduced by moving to larger catalyst pellet sizes. Larger pellets provide more voids, which translates to lower pressure drop. However, the trade-off of larger size pellets is lower total bed surface area, which results in higher methane slip, particularly late in cycles. The use of spheres and, more recently, externally-textured spheres, decouples concerns with surface area and pressure drop.
This premise is supported by SMR operating data (see Figure 2) for a site that installed Magcat in early 2022. The data demonstrates that, for fixed conditions, this technology generates 10 psi (0.7 bar) lower pressure drop at all corresponding feed rates, compared to previous installations of conventional, cylindrical SMR catalyst. Counterintuitively, Magcat of smaller size than the previous catalyst was loaded into this reformer to prove the advantage of spherical shaped catalyst in promoting uniform flow. To make use of this benefit, total feed to the reformer (feed gas plus steam, at constant or lower steam-to-carbon ratio) can be increased 10% at constant pressure drop or observed hydraulic limit. Operating at constant feed rate, this pressure drop benefit significantly offloads feed gas compressor duty at fixed reformer outlet pressure, reducing unit power consumption. Magcat and MYD-S spherical shapes have no straight edges, reducing excessive pressure drag associated with cylindrical pellets. Plain spheres have a drag coefficient of 0.47, textured spheres 0.27, and cylinders between 0.82 – 1.15.3 The lower the drag coefficient, the lower the pressure drop. Additionally, a regular surface flow over the sphere is maintained (see Figure 3/4), adding symmetrical spheres into a
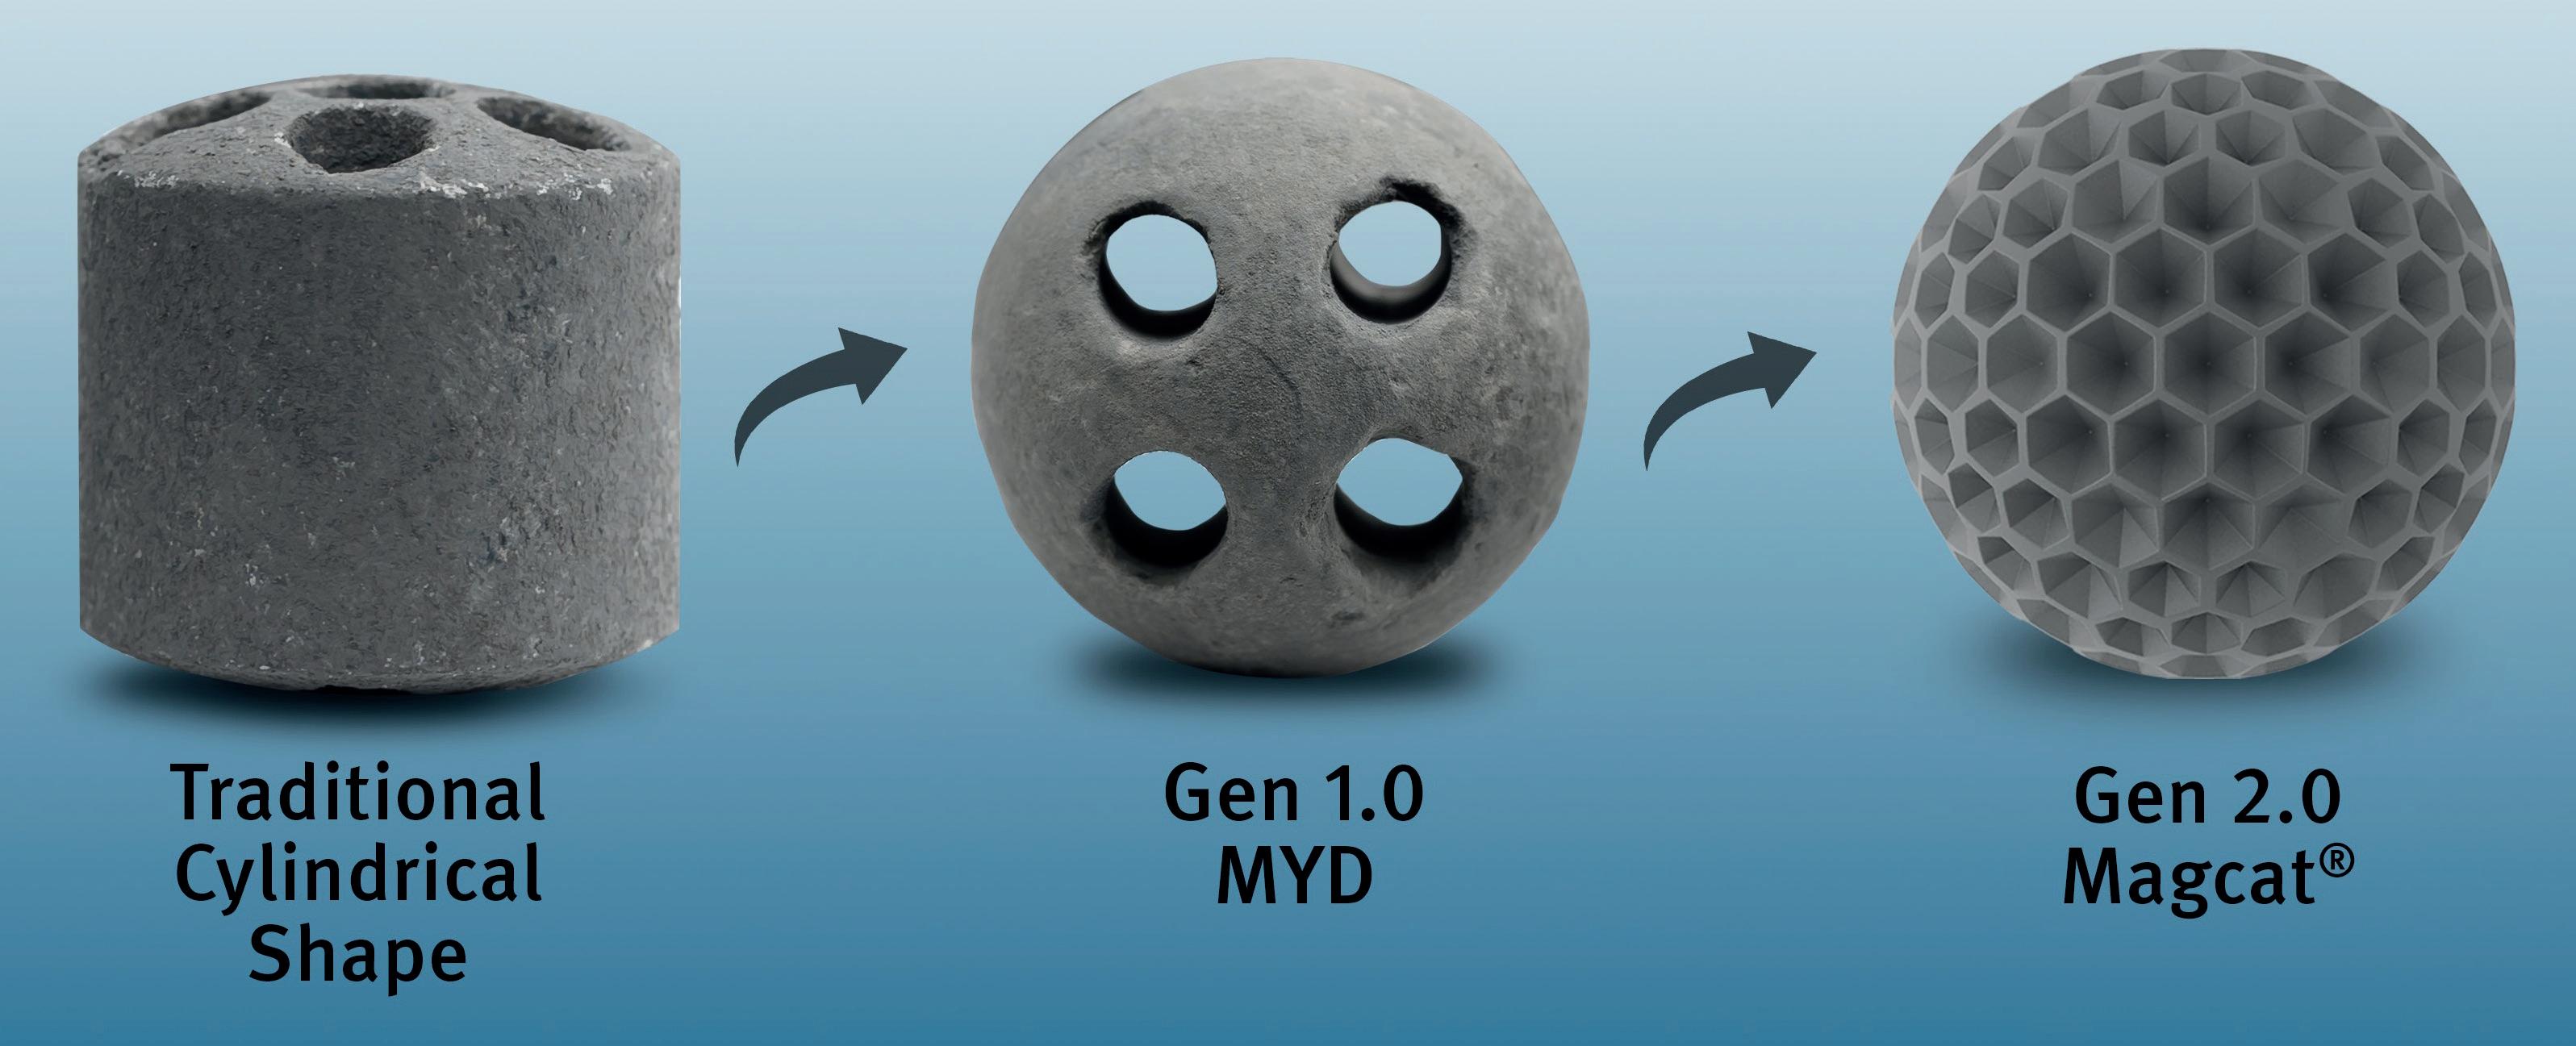
March 2023 HYDROCARBON ENGINEERING 38
Figure 1. Examples of SMR catalysts in traditional cylindrical shapes, UNICAT’s Gen 1.0 plain spheres and Gen 2.0 textured sphere (left to right conventional cylinders, MYD-S plain spheres, Magcat® textured sphere).
Figure 2. Operating data from a top five US refiner comparing throughput to unit pressure drop with different SMR catalysts.
tube naturally generates repeatable and predictable packing patterns not otherwise associated with random loadings of cylindrical pellets.
Effects on fluid flow from uniform packing vs chaotic packing are profound. Gases entering tubes filled with spheres divide evenly to flow around full hemispheres of each sphere. Uniformity of spherical packing creates unbiased and equal flow paths for the entire cross-section. Upon exiting the initial layer of spheres, via regular and homogeneous void apertures between adjacent spheres, reactant gas flow immediately encounters the next layer of uniformly-packed spheres, over which it will again divide and reconnect with contiguous flow paths. This ‘snaking’ fluid flow across spheres encourages
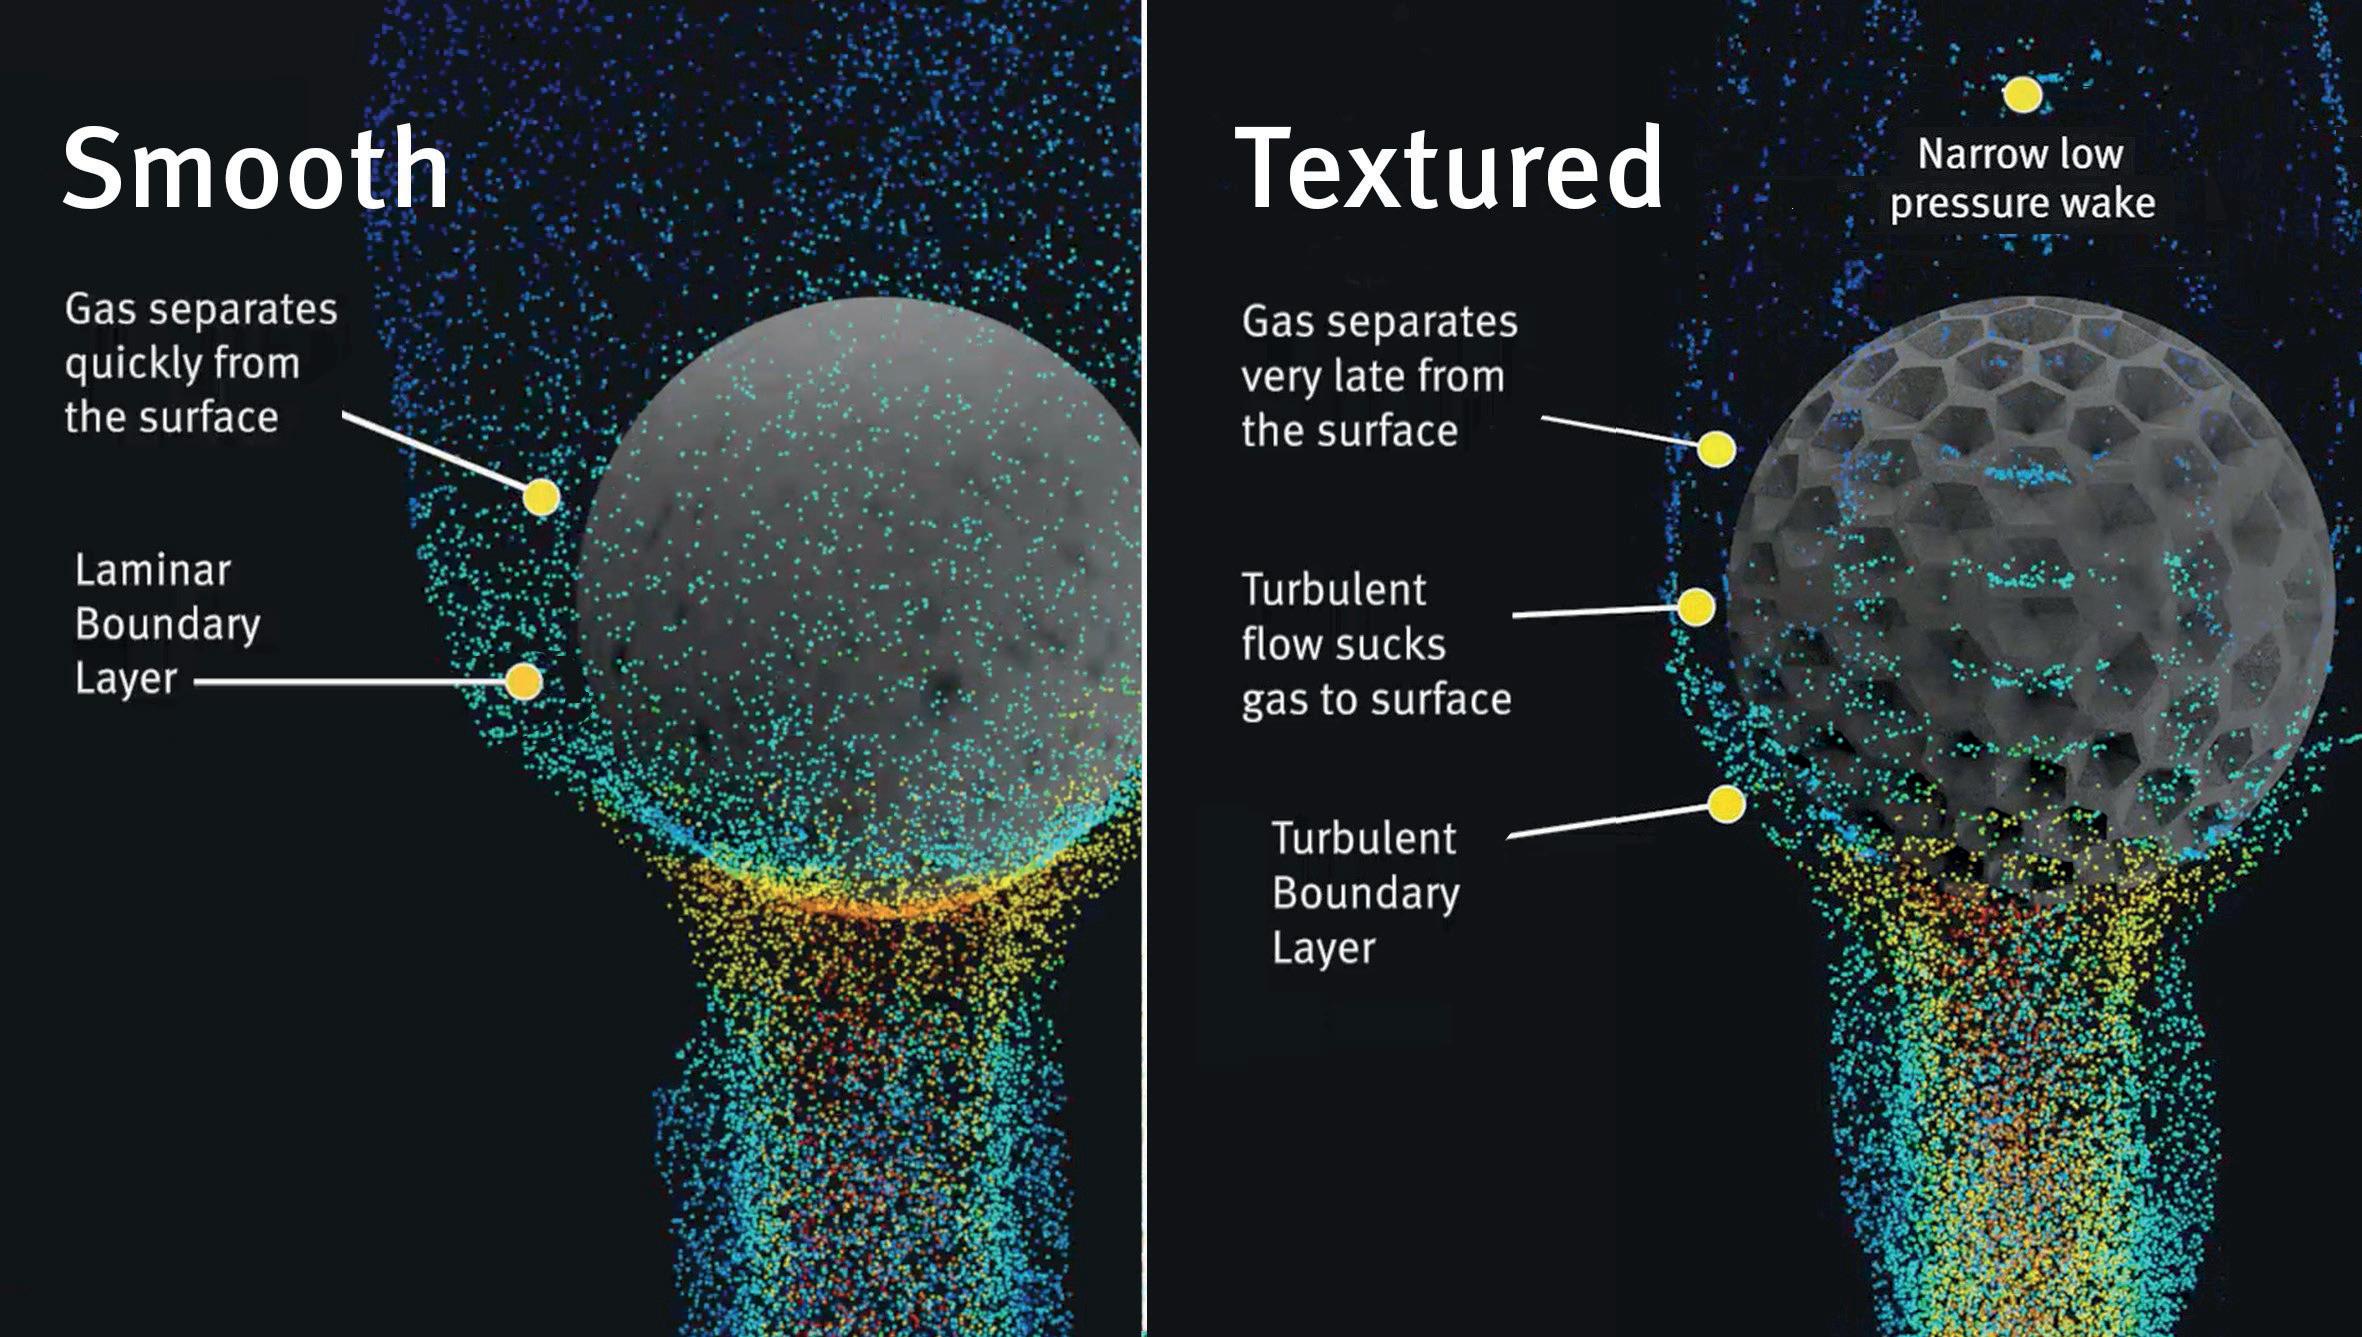
excellent mixing and intimate gas-to-surface contact. More crucially, lateral movement promotes heat collection from the tube wall and transportation of heat energy to the core of the tube to satisfy endothermic reforming reactions and equilibrium conditions favouring conversion to hydrogen at high temperatures.
In comparison, tubes packed randomly with cylinders induce high pressure drag over bluff bodies in most aspects, and generate chaotic fluid flow paths, resulting in dead spots; back-eddies; bypassing; and hosing through catalyst holes when vertically orientated, thus diminishing lateral movement that is critical for effective radial heat transfer.4 Spherical catalysts generate numerous, predictable pellet-wall contacts disturbing convectional boundary layer thickness along the wall and redirecting heated flows laterally into the bed (see Figure 5).
Magcat’s SMR catalyst does not incorporate holes. Literature lists the advantages of multiple holes in cylindrical pellets as: increased voids (associated with lower pressure drop in conventional loadings), and increased active surface area. Magcat is not limited in either, due to expanses of surface area from external texturing and internal porosity, and substantial and regular voids between particles when packing solid spheres.5
Another benefit is lower inherent pressure drop imparted by spheres in comparison to other common SMR catalyst shapes. Further, observed void increases during bed movement of textured sphere packing during heat up, which allows smaller Magcat sizes to be selected than would be traditionally expected for an application.3 Smaller spheres further increase surface area, wall contact points, and promotion of radial flow without compromising overall system pressure drop compared to a loading of larger cylinders.
Disadvantages for holes that are listed in literature are particle weakness and reduced radial flow. Additionally, holes will not offer the gains proposed unless available to flow by being orientated vertically or near-vertically. Random packing results in proportions of pellets not oriented in ways that are beneficial. Without strength, surface area or pressure drop concerns, Generation 2.0 Magcat spheres exclude holes to maximise radial heat transfer, which benefits steam reformers the most.
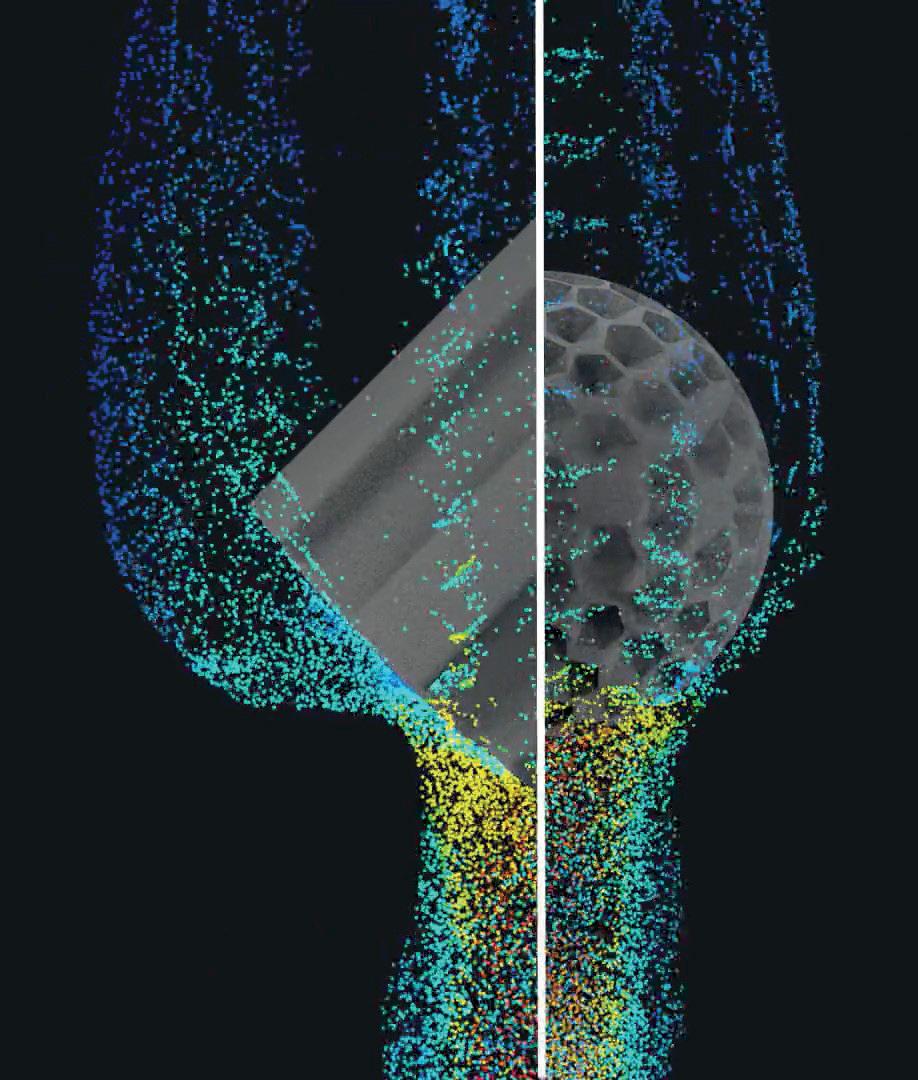
Radial heat transfer is key for efficient hydrogen production in SMR. Energy movement from externally-heated tube surfaces to the inner bed core replenishes energy debts generated by net endothermic reforming reactions. UNICAT’s Generation 1.0 and Generation 2.0 Magcat applications observe much lower tube wall temperatures (TWT), typically decreasing tube failure due to creep by at least 40%. Further, hot spots and red bands are less likely in spherical catalyst loadings as uniform packing minimises bridging. This means further increased tube lifetimes and the avoidance of common points of failure.
The same industrial user observed that, after switching to Magcat, the same methane slip could be achieved at significantly lower combustion outlet temperature under other constant conditions as a result of the heat transfer improvements discussed (see Figure 6). It is this unlocking of
March 2023 HYDROCARBON ENGINEERING 40
Figure 4. Flow simulation of gas passing over a half, static Magcat® textured spherical catalyst (gas moving from bottom to top) and a half ribbed cylinder showing the flow differences.
Figure 3. Flow simulation comparison of gas passing over a smooth spherical catalyst next to Magcat® textured spherical catalyst (gas moving from bottom to top).

constraints, particularly the most challenging and most limiting factor of improved radial heat transfer, that allows MYD-S and Magcat users to increase hydrogen production above nameplate capacity and historical maximums via increased throughput.
A further advantage of spherical catalysts can be seen in Figure 7. As the tube cycles from hot to cold for any number of reasons, it exerts radial pressure on the catalysts packed in the tube. The sphere packing, due to its uniform nature, provides support for all of the spheres. This limits the voids between the pellets to less than half the diameter of an individual sphere, and creates a relaxing effect with subsequent hot/cold/hot tube movements. As there is nowhere for the spheres to go, the radial pressure pushes the spheres closer to each other on cooling, and opens up the voids slightly during heating – stopping the catalysts from crushing each other. The opposite happens with a conventional cylinder packed system, i.e. on heating, holes are opened up between catalysts, allowing corners or edges to drop into gaps that have opened up; and on cooling the tube diameter closes, crushing catalysts against each other.
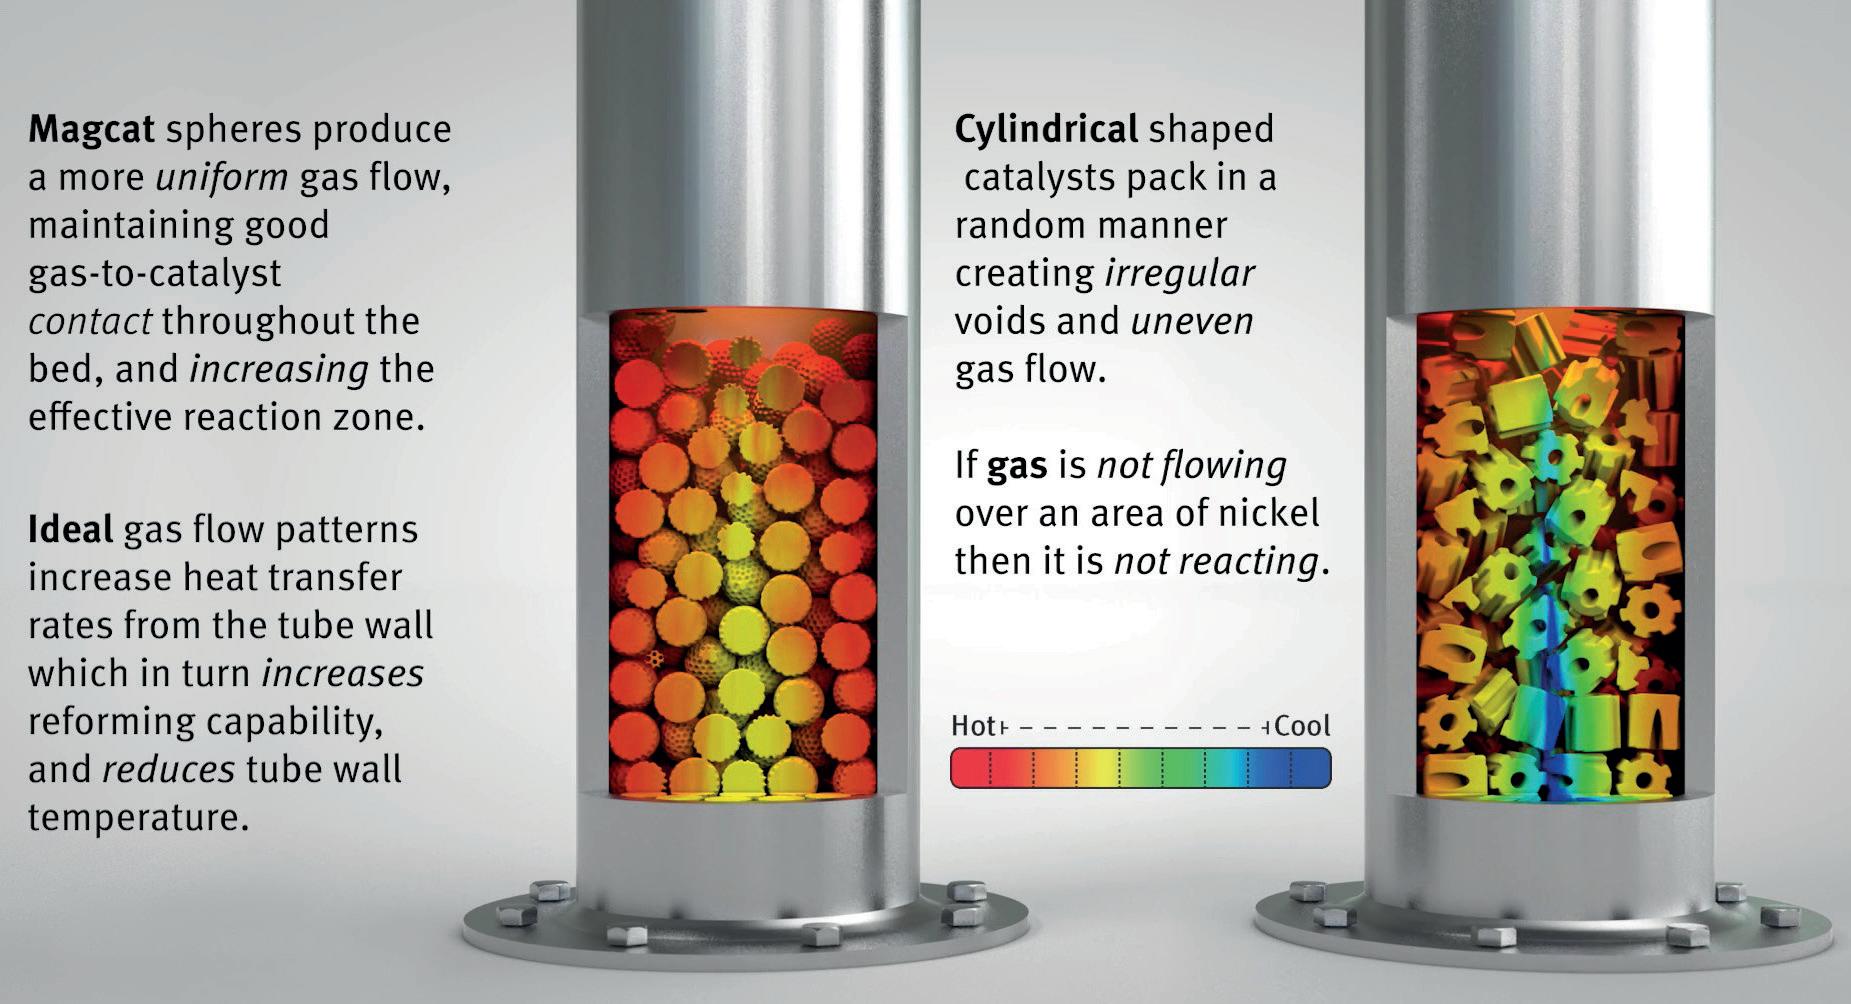
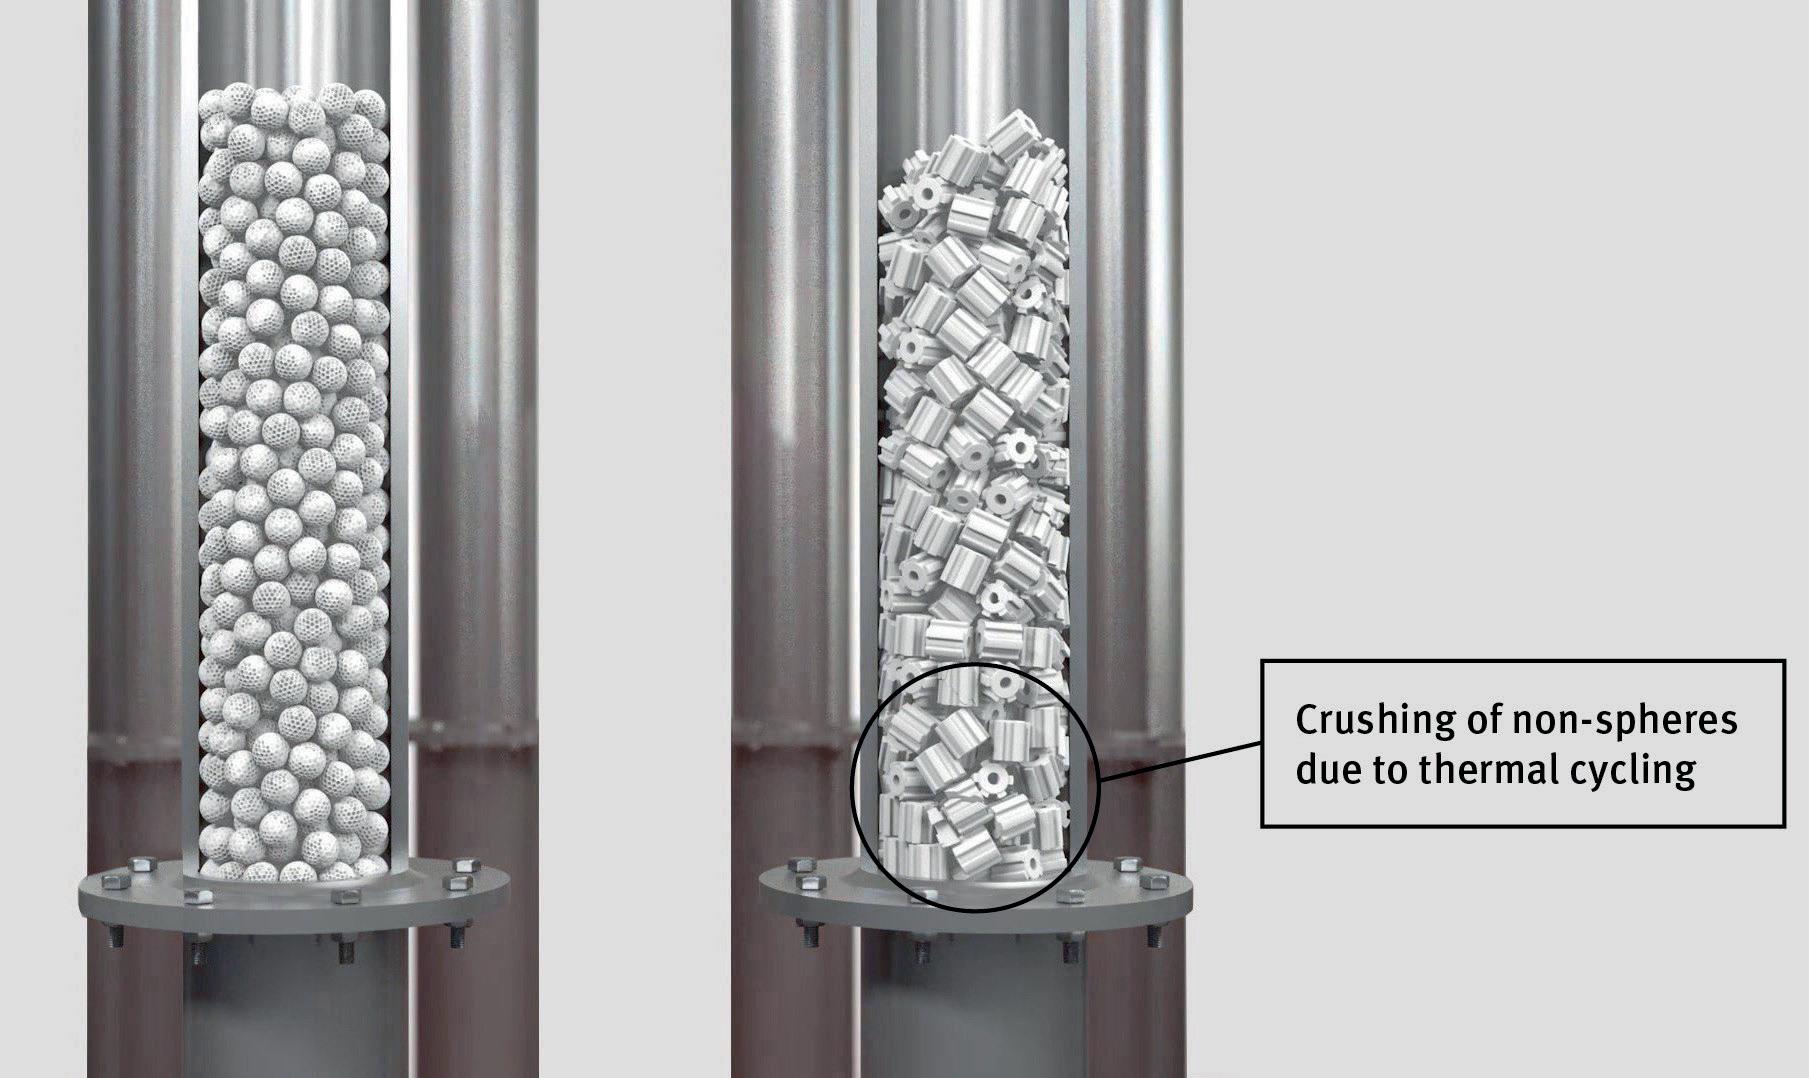
Conclusion
UNICAT’s MYD-S and Magcat spheres are demonstrating excellent performance in tubular SMR reformers, as shown in one such example operated by a top five refiner in the US, and as referenced by a global steel company operating a DRI reformer. These benefits can be clearly understood from underlying effects on fluid dynamics, thermodynamics, and heat transfer of spheres vs conventional shapes. Energy efficiency, lower CO2 emissions, increased hydrogen production, and extended tube life are some of the advantages of next generation spherical catalysts.
References
1. TAGLIABUE, M., ‘Refinery off-gas in hydrogen production’, Air Liquide, PTQ (Q1 2022), https://cdn. digitalrefining.com/data/articles/file/1002727-q1air-GBPiquide-dr.pdf
2. ‘Low-carbon hydrogen demand in refining could reach 50 Mtpa by 2050’, Wood Mackenzie, (June 2022), https://www.woodmac.com/pressreleases/low-carbon-hydrogen-demand-in-refiningcould-reach-50-mtpa-by-2050/
3. HOERNER, S. F., ‘Fluid-Dynamic Drag : Practical Information on Aerodynamic Drag and Hydrodynamic Resistance’, 2nd Edition, (1965), pp. 3 – 17.
4. DIXON, A., BOUDREAU, J., ROCHELEAU, A., TROUPEL, A., ERTAN TASKIN, M., NIJEMEISLAND, M., and STITT, E. H., ‘Flow, Transport, and Reaction Interactions in Shaped Cylindrical Particles for Steam Methane Reforming’, Industrial & Engineering Chemistry Research, (2012).
5. TURNER, J., ‘Hydrogen Consumption for Fuels Production’, National Renewable Energy Laboratory (NREL), (2013), p. 5, https://www.hydrogen.energy. gov/pdfs/htac_oct13_9_turner.pdf

March 2023 HYDROCARBON ENGINEERING 42
Figure 6. Increases in reformer outlet temperature through operating cycle using conventional SMR catalyst compared to low outlet temperature with Magcat® installed.
Figure 5. Simulation of gas flow in packed tubes with Magcat® (left) and cylindrical catalyst (right), emphasising preferential flow path differences.
Figure 7. Cut through tube view of spherical catalyst (left) showing even and supported fill, and conventional catalyst (right) showing crushing impact of tube thermal cycling due to lack of support facilitating catalyst dropping and crushing.


44 March 2023 HYDROCARBON ENGINEERING
Vic Scalco, General Atomics

The global pandemic, economic slowdown, and instability caused by regional conflicts have significantly impacted the approximately 735 petroleum refineries worldwide. Today’s highly complex and competitive refining environment, coupled with eroding profits and difficulty maintaining a positive bottom line, is forcing over half of these refineries to seek new market opportunities from the bottom of the barrel in order to remain competitive. In addition to this, compliance with tougher climate regulations is further taxing refineries’ ability to invest in technology innovations to help keep pace with changing market demands, while maintaining profitability. 1
Refining management’s balancing act between new technology investment and increasing revenue potential is driving a trend toward utilising severe catalytic cracking technology to increase profits while taking advantage of the existing crack spreads. Over 18 million bbl of crude oil are processed daily through a fluidised catalytic cracking (FCC) system, along with three-quarters of worldwide gasoline. FCC systems have become the refinery’s most versatile operating units to improve the bottom line. With the increase in crude prices, environmental compliance cost, and current International Maritime Organization (IMO) 2020 regulation enforcement, the spread between lighter, less severe crudes and heavier, opportunistic crudes will become a bigger part of the refining sector’s economics. The FCC’s capability to convert heavy atmospheric gas oils, vacuum gas oils, and atmospheric resids into more valuable gasoline and middle distillates can be exploited to support more positive profit margins. 2
Heavier, opportunity crudes are pushing the limits of catalytic cracking. Refiners are increasingly considering the utilisation of more complex technologies for deeper conversion of challenging feedstocks arising from the processing of opportunity crudes. There are a range of technologies tailored for processing heavier crudes and producing high-quality final products. As the future of refining has the industry moving towards the use of higher severity conversion units and synthetic crudes, the FCC will remain the workhorse of the refinery.
March 2023 45 HYDROCARBON ENGINEERING
Electromagnetic Systems, USA, details the importance of selecting the correct separation technology in order to support growing petrochemical demand.
Asia joins the race
In Japan, approximately 30 petroleum refining companies are utilising FCC or resid fluid catalytic cracking (RFCC) units to produce propylene, LPG, gasoline and light oil. S-Oil Korea installed its first high severity FCC, and PERTAMINA Indonesia is investing in new RFCC units to increase overall international market supply. India is expanding its ability to produce polypropylene through RFCC units, as petrochemical feedstock production is in high demand. New products generated from these RFCC units can be consumed in the global market for transportation, power generation, and petrochemical supply, or shipped as a product blended for marine fuel. With years of operation in the RFCC market, Asia is now faced with a need to generate increased profits in a competitive environment, and will have to address applications for the bottom of the barrel streams from these units ladened with concentrated catalyst. 1
The challenge
Creating greater profits from an FCC unit comes with a cost. Driving the FCC technology into higher severity for increased propylene demand for petrochemical feedstocks is a growing trend. Along with fuel gas, C3S and C4S, FCC units also produce a 650+°F heavy aromatic oil, known as slurry oil, as a byproduct. Slurry oil nomenclature refers to the catalyst fines carried over from the FCC reactor which end up in these bottoms. Because catalyst fines must be separated or be allowed to settle out of the oil, the product is more correctly referred to as main column bottoms (MCB), decant clarified oil (DCO), clarified oil (CO), or clarified slurry oil (CSO). 3
Slurry oil is the lowest-value stream produced by an FCC unit (FCCU), representing only 3 – 7 vol% of the total products. A typical 50 000 bpd FCCU would produce 2000 bpd or 125 000 tpy of slurry oil as a byproduct. The quality varies according to numerous factors including crude oil origin, FCC design, and fractionation equipment. The two most important factors affecting quality are catalyst type and conversion level. Quality may also vary for marketing reasons by dilution in the FCC fractionator with heavy cycle gas oil. Table 1 shows the typical concentration range of catalyst in marketable slurries. 3

Meeting market demands
Severe FCC feed hydrodesulfurisation can reduce the sulfur content of slurry oil to less than 0.5 wt%, however the hydrotreating would result in decreased slurry aromaticity unless conversion is greatly increased. Currently, approximately 40% of the US FCC feed is hydrotreated primarily at mild conditions so that slurries contain 0.5 – 1.5% sulfur. Refiners do not desulfurise FCC feed just to lower the slurry oil’s sulfur content; they have other objectives such as lowering gasoline sulfur, reducing sulfur emissions from catalyst regeneration, improving product yields and quality, or meeting new market requirements. Efforts to meet the IMO 2020 marine fuel regulation entail a joint process of hydrodesulfurisation to less than 0.5%, and fines removal to comply with less than 50 ppm catalyst fines required by MARPOL IV. 2, 5
Sediments are composed of large particles that are greater than 20 µ m, while filterable solids are composed of smaller particles typically in the range of 20 µ m to submicron level. The sources of the solids are iron sulfide, silica, clays, scales, ash, coke, and catalyst fines. Feedstock contamination starts upstream after the desalter, reaching downstream of the catalytic cracking unit. While new catalysts, co-catalysts and additives benefit the process, they simultaneously add more sediments, solids, and poisoning metals to the bottom of the barrel, creating more challenges facing the removal of these contaminants. Severe catalytic cracking activities come with the challenge of producing a higher concentration of these sediments and filterable solids within the slurry oil stream. 6
Ash, or catalyst fines, are a particular problem for slurry, especially for heavy and viscous oils that require long residence time to allow for catalyst settling. Obtaining low ash (less than 0.05 wt%) requires dedicated techniques, such as specialised catalyst selection, heating, chemical additives, separation technology, electrostatic precipitators, centrifuges and cyclones. The selection of an attrition-resistant catalyst helps to a great extent, and a few refiners buy higher-priced hard catalysts to alleviate ash problems in slurry oil. If a higher-priced catalyst or the idea of a new upper cyclone system is not
March 2023 HYDROCARBON ENGINEERING 46
Figure 1. Carbon black industry supply.3
CSO clarity (ppm) Carbon fibre feedstock 5 – 10 Carbon black feedstock (specialty) 10 – 20 Hydrotreater feedstock 10 – 50 IMO 2020 marine fuel 50 – 60 Pitch feedstock 25 – 100 Needle coke feedstock 25 – 100 Refinery fuel 50 – 100 Carbon black feestock (tyre) 100 – 500 Hydrocracker feedstock 200 – 300
Table 1. Typical slurry market feedstock properties4 CSO market/opportunity
The Ariel Smart Compressor. The next generation in compression monitoring, optimization, and management. Our unique electronic platform includes sensors that relay measured data to an onboard central processor that delivers compressor operational and condition data to your preferred location or personal device via the Ariel Fleet Manager. Reduce downtime, cost of ownership, and environmental impact, while operating at peak efficiency with the Ariel Smart Compressor.
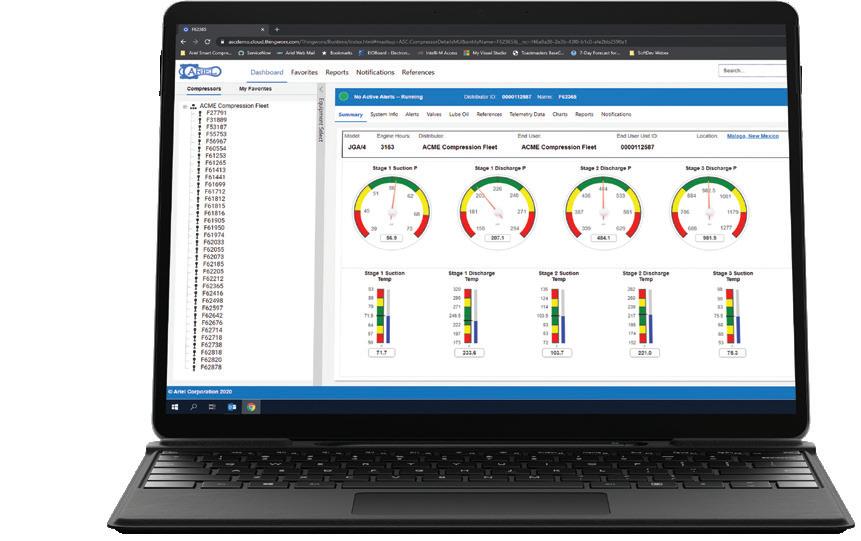
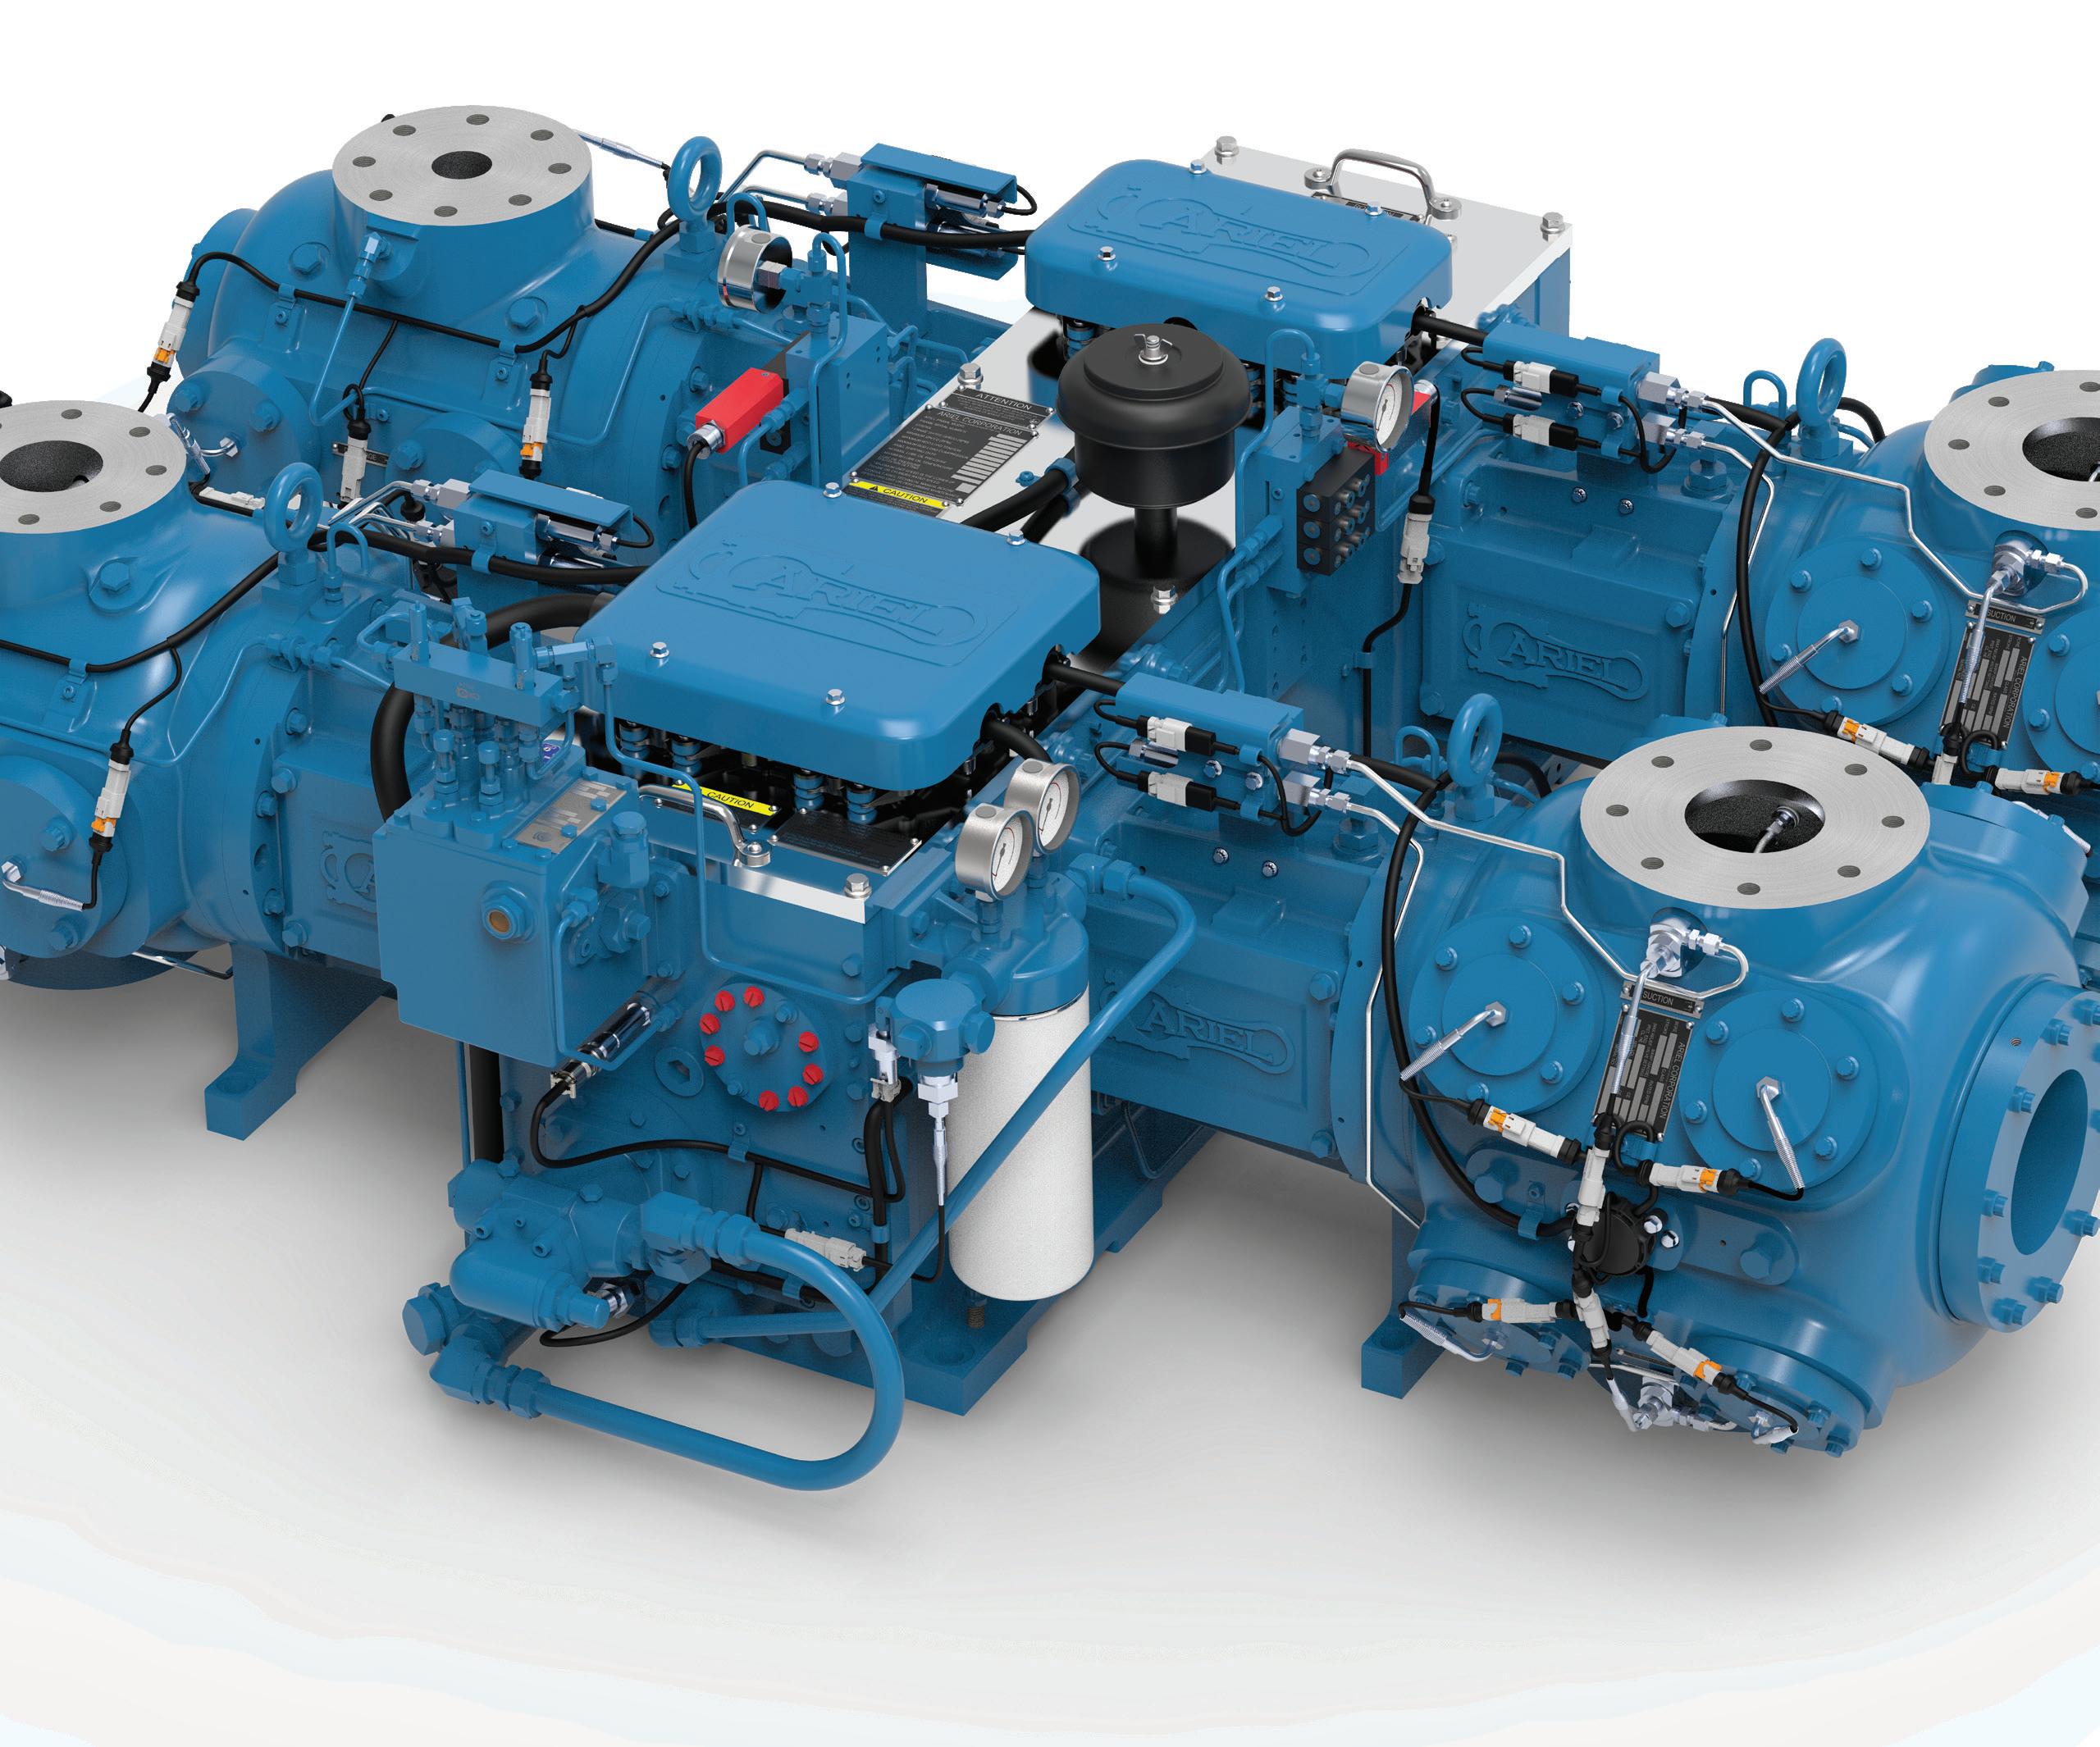
www.arielcorp.com/arielsmartcompressor
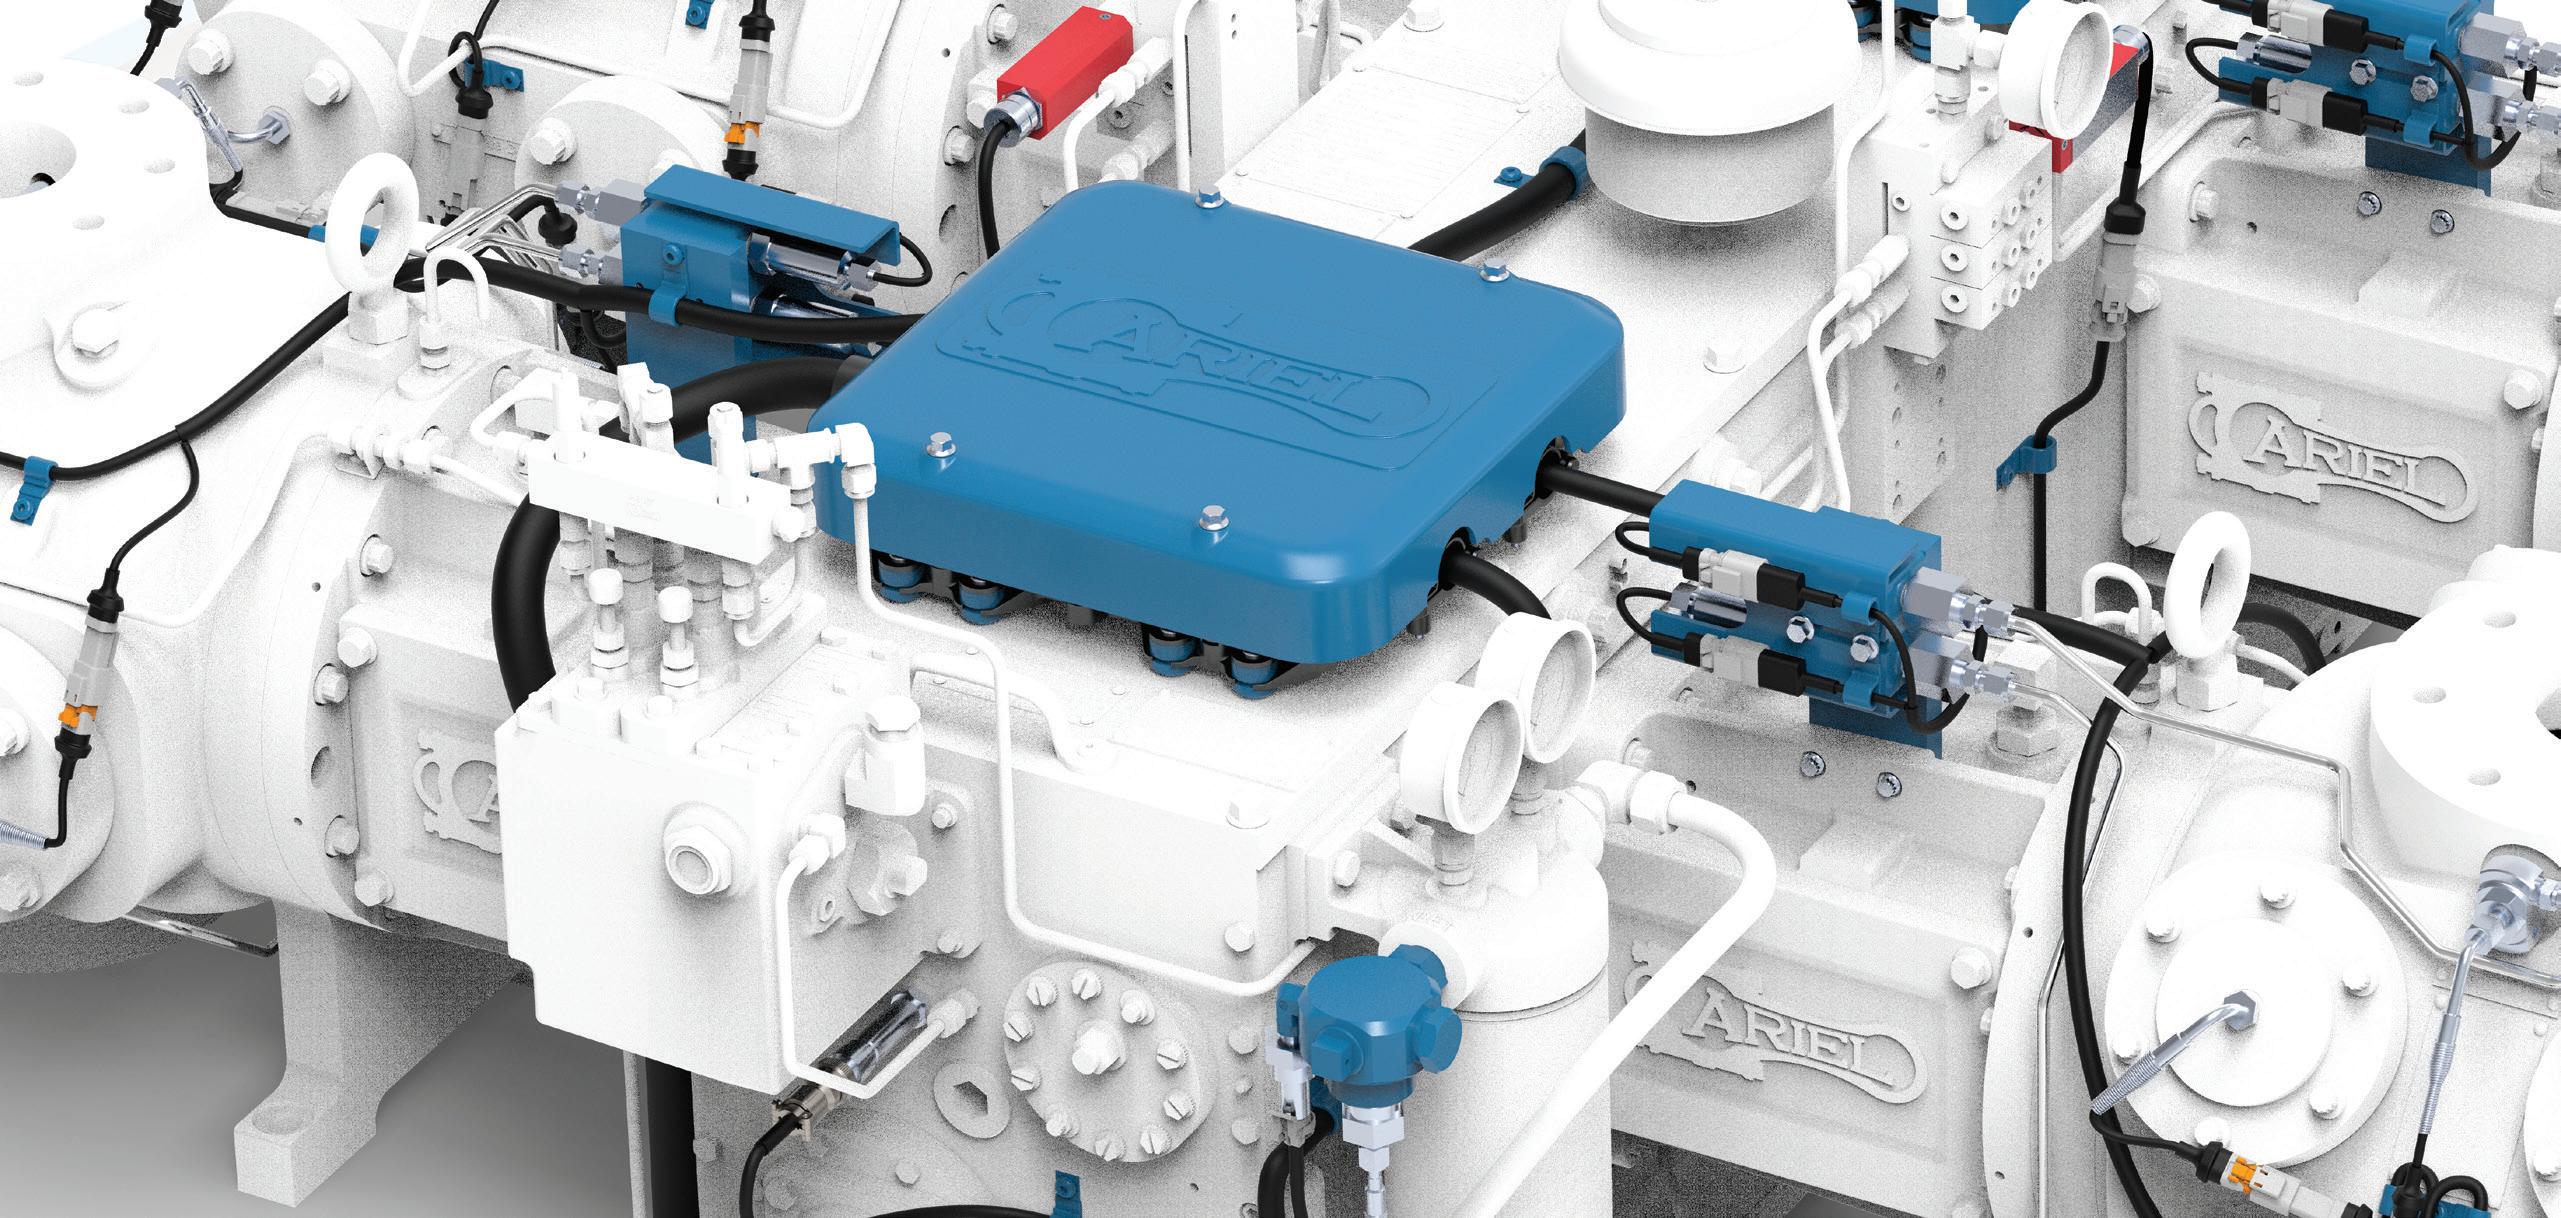
an option, the challenge of catalyst fines separation and the recovery of lost profits can be efficiently addressed by adopting the right (MCB) separation technology. 7
The race for profits
Higher severity FCC units operate at critical conditions and concentrations in the production of higher ends for petrochemical feedstock supply. This makes the process more challenging, especially at the bottom of the barrel where high concentrations of solids, contaminants and catalysts are undermining the possibility of upgrading the slurry oil stream. Upgrading catalytic cracking technology must coincide with increasing efficiency, reducing maintenance cost, and improving the catalyst equilibrium cycle. Removing solids and ultimately increasing the lifespan of the FCC system is part of this equation, and is directly related to incrementing the bottom line in refining.
The success of higher severity production relies on providing clarified slurry oil at < 50 ppm to maintain a marketable DCO. Several different filtration and separation technologies have been reviewed to find the most suitable solution capable of upgrading the challenging DCO stream. Many refiners ‘de-ash’ with chemical aids to accelerate ash settling in storage. These chemicals are polymeric compounds that adhere to the catalyst surface, causing agglomeration of the fine particles to accelerate separation.8 For some time, refiners have found it economical to cat crack increasing quantities of 1000+°F boiling material. Current analysis shows that approximately 40% of the industry is cracking some resid. Cracking an unhydrotreated resid might result in a heavier, more viscous slurry oil with low aromaticity and high metals content. When resid is added to an existing FCC, ash separation might be more difficult because the catalyst removal system must handle a greater volume of more viscous slurry.9
Settling tanks for decanting slurry oil have been in use for more than 40 years, and this remains the most popular separation process for removing catalyst in slurry oil. Today, over 61% of refineries use settling tanks to separate catalyst and other contaminates from slurry oil. The settling process is very lengthy and creates a larger challenge once the tank is full of sediment. Refineries must resort to using settling agents to assist in speeding up the process. This creates sludge, hazardous waste, and
increased cost over time for the refinery. One tank per year can cost a refinery US$40 000 in settling agent, US$500 000 in cleaning and maintenance, and US$150 000 in landfill and waste disposal fees. This represents approximately US$690 000 in increased costs to accomplish a bunker fuel at 500 ppm. DCO resulting from the settling tank process will continue to experience rising costs as environmental laws direct the handling of hazardous waste, and as the decline in construction causes stockpiles of dried catalyst to collect at concrete kilns.8
In addition to recovering profits eroded by tank settling, by installing catalyst fines separation technology at the outlet of the FCC slurry oil rundown, most of the fines can be collected and sent back to the riser. With this technology in place, the returned catalyst fines would support fresh catalyst reactivity while finding more acceptable avenues of escape via gas scrubbers, electrostatic precipitators, and spent catalyst collection hoppers, ultimately leaving through the flue stack. Additional profit recovery occurs by removing fines from escaping through the bottoms circuit and rundown to tank settling. By keeping the fines out of this process, the refiner can realise additional profit by adding the now-retired settling tank to a refinery’s marketable inventory tank list. This is an added benefit to any refinery, and could be worth as much as US$1 million in annual revenue.9
World demand for refined products is unique to the domestic market and international demand for each region. North American FCCs operate at high severity to maximise gasoline and polypropylene. The result is a very heavy, aromatic decant oil. Due to low fuel oil production and specific-gravity limits, US refineries are only able to blend low quantities of decant oil in resid, allowing the excess to be sold for other uses such as carbon black feedstock.10
The quality of CSO for carbon black feedstock can generate as much as US$18.00/bbl of increased revenue, and increase middle distillate inventory. With separation technology in place, a refiner can increase annual revenue by not having to use heavy cycle oil (HCO) or light cycle oil (LCO) as cutter stock with the CSO to meet lower concentration specifications, and more middle distillate can be used to produce lighter products such as diesel. Regarding the use of LCO, mechanical filtration is limited in backwash mediums, and costly HCO/LCO is required for back washing the filters. Electrostatic separation, however, provides an economic advantage over other processes. This technology uses raw feed from the FCC/RFCC for back flushing and does not decrease the overall production of the reactor or rob valuable lighter products. Middle distillate production is therefore increased, along with profitability.3
CSO used as carbon black feedstock carries the best value in lower conversion markets. When sourcing markets for MCB production, whether it is marine fuel or highly-profitable specialty carbon black feedstock, a refiner must decide to increase the quality of the CSO to meet the unique specification for each market. The efficiency and reliability of the fines removal technology is critical to realising increased profits from these markets. The properties of MCB make it difficult to find a solution
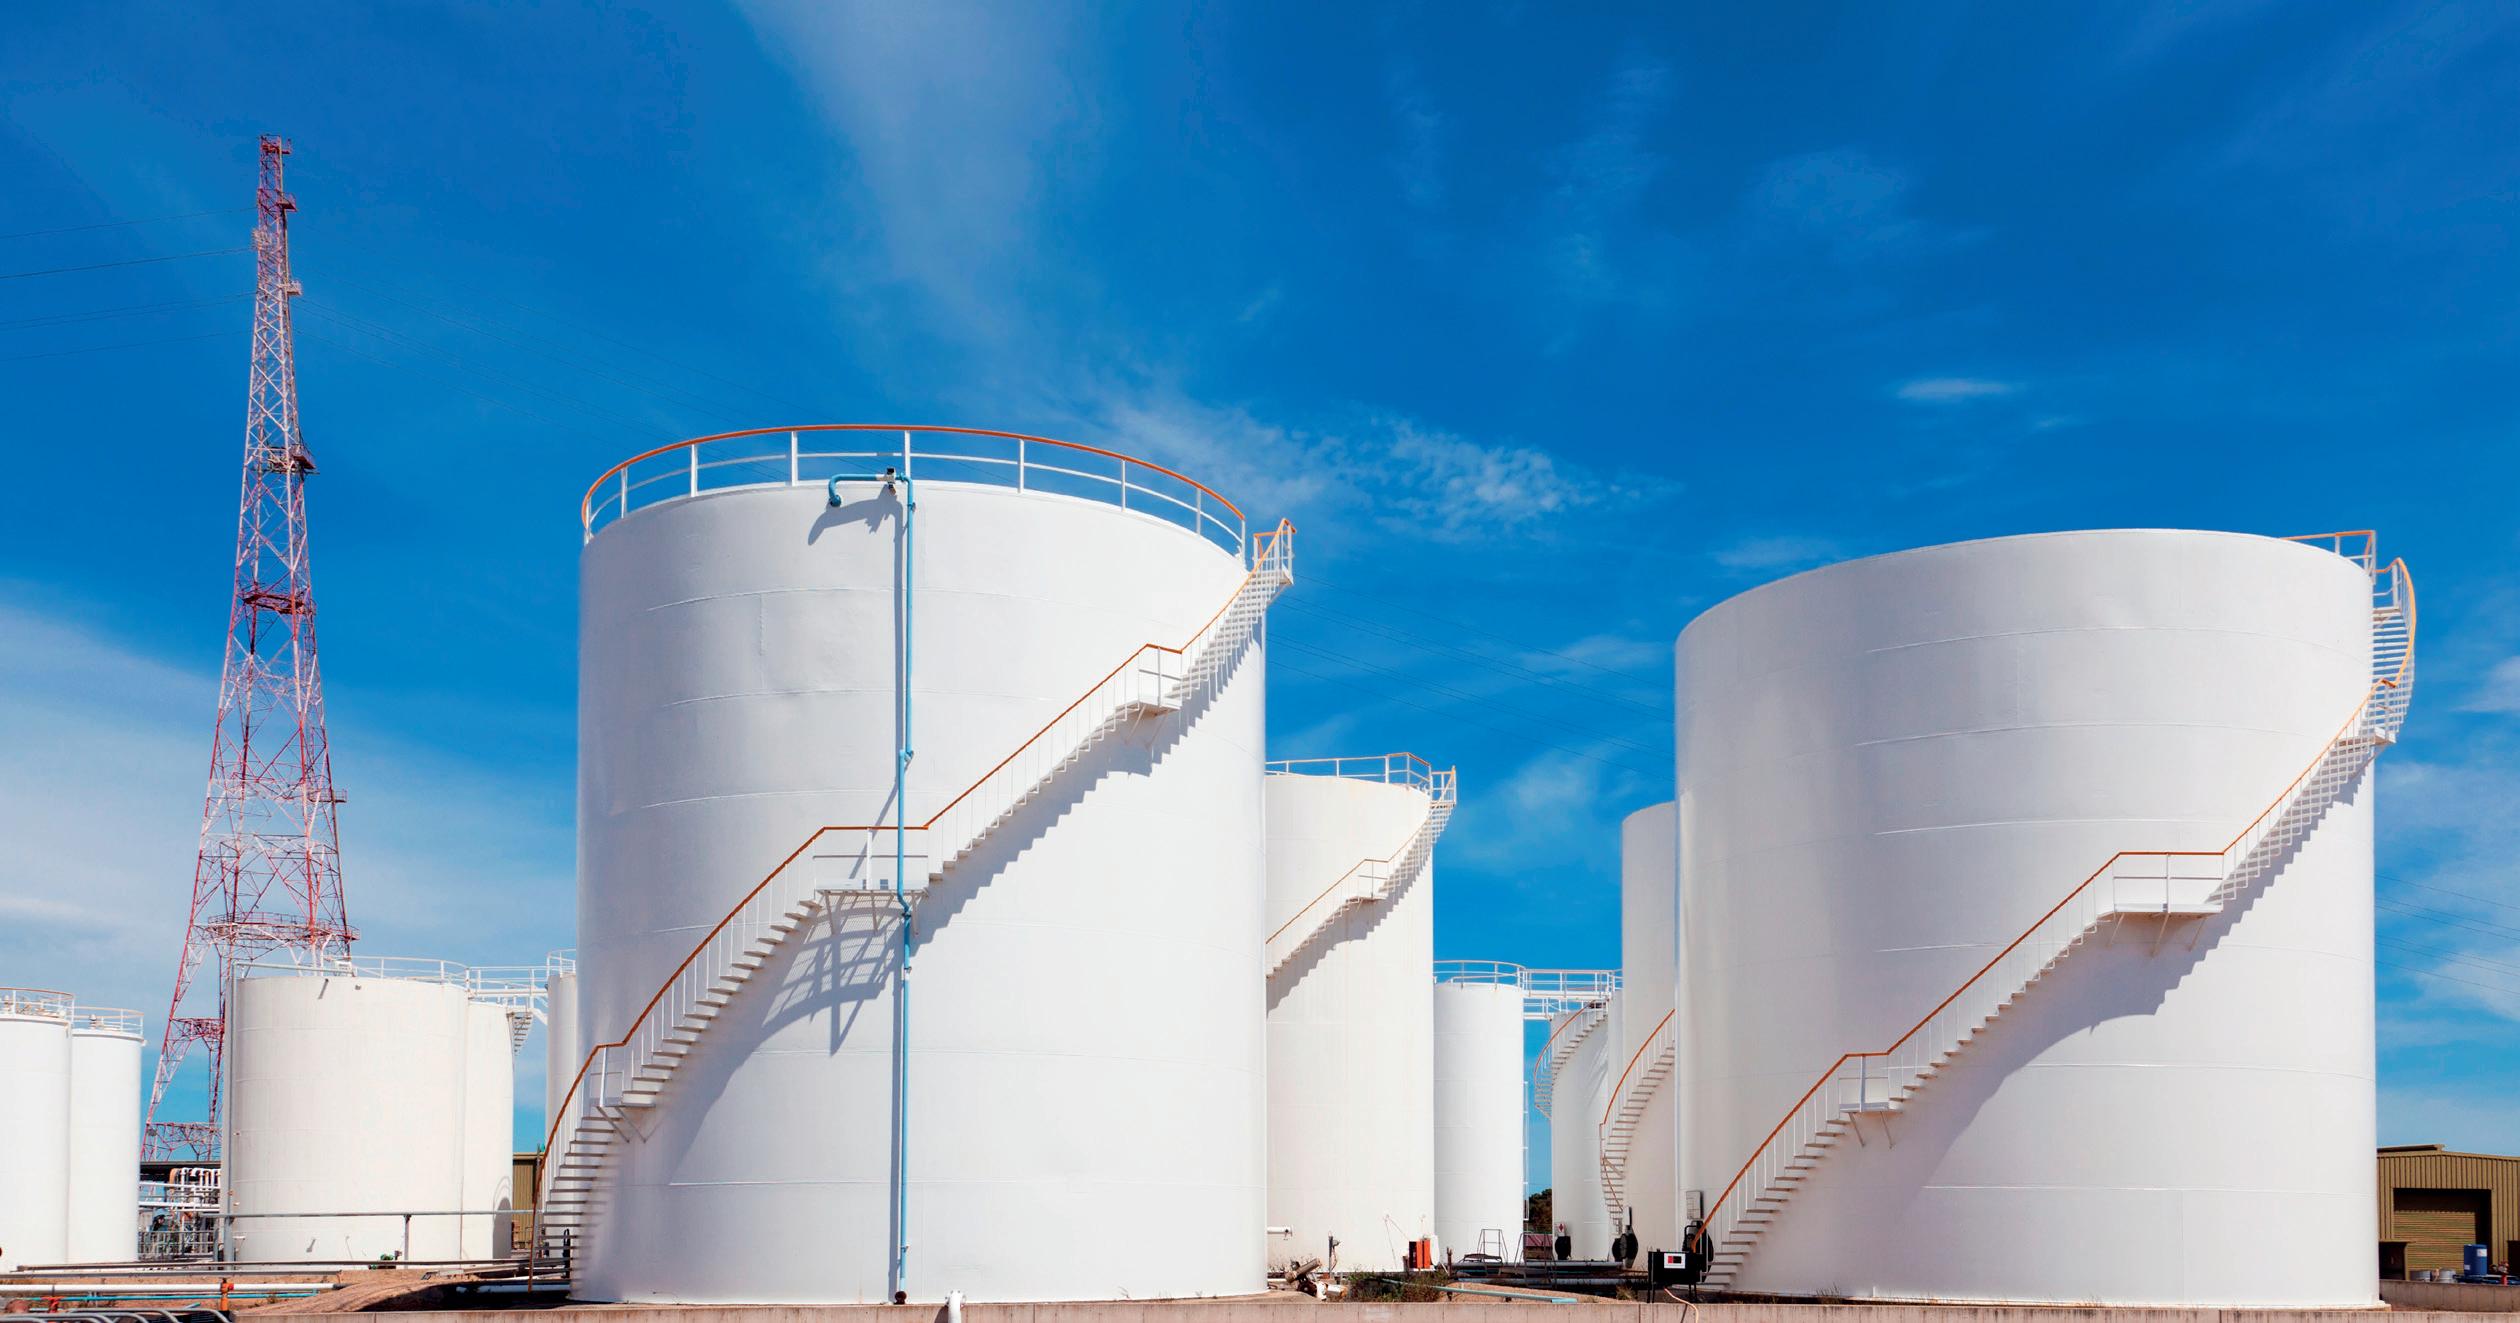
March 2023 HYDROCARBON ENGINEERING 48
Figure 2. Slurry oil settling tanks.

2009 Renaissance Blvd., King of Prussia, PA 19046 USA I Int’l: +1 610-941-4900 www.paratherm.com RELIABILITY I TRUST I RESULTS Proven, advanced formulations ideal for your processes, industry, and applications. More choices and better choices in heat transfer fluids based on our 35 years experience.
without understanding the downsides of each technology. Centrifuges have been found to be unsafe and inefficient over time. Decanting or settling is only able to provide bunker-grade products with long residence time. With the heavy asphaltene and coke content in severe RFCC or FCC operation, mechanical filtration solutions become blocked or severely eroded, requiring complete disassembly or replacement of costly cartridges in order to continue operating. Other technologies are susceptible to plugging or blocking due to the inherent plugging properties.6,7
An electrostatic separator system, referred to as the ‘Gulftronic® Electrostatic Slurry Separator’, has been found to work in concentrated slurries without plugging or blockage. The electrostatic separator for slurry oil operates continuously without plugging or blockage from asphaltenes, with an efficiency at the outlet averaging < 10 ppm catalyst fines after separation. To successfully increase refinery profits from the bottom of the barrel, proven robust technologies such as electrostatic separator technologies are needed to handle the challenges accompanying high severity processing while driving the FCC to increase propylene yield.2
Active response
There are three factors that should be considered when determining the feasibility of separation applications to downstream refinery processes. The first is refinery economics. Not all refineries with the FCC or RFCC process have the economic parameters needed to justify the installation of a catalyst fines removal system. The second is the severity of the fines. Controlling the quality of the slurry oil produced can influence the refinery’s marketable products and downstream maintenance. The third is the cost associated with the environmental impact of removing catalyst fines and particulates from the settling tank.
Not all refineries using FCC/RFCC have a market or economic requirement for producing CSO < 100 ppm. Slurry oil is typically 6% of the overall production of the FCC when the focus is on making transportation feedstock. If an FCC is smaller than 30 000 bpd, the economic driver to upgrade a small amount of slurry is not beneficial, and it becomes more economical to blend cutter stock to meet desired specifications. Larger complex refineries processing over 30 000 bpd are in the best economical position to increase profits from departiculating process streams such as slurry oil.10
Aside from the profitability of increased production and middle distillates, consideration should also be given to decreasing downstream maintenance and downtime. With over 60% of the fines in slurry oil’s distribution being < 15 µm, it is very difficult for mechanical filtration or centrifuges to capture smaller fines. Instead, these processes allow them to pass through. The corrosive element of catalyst passing downstream erodes valves and other critical piping systems.
Taking control
A reactor running at 80 000 bpd can produce 5600 bpd of slurry. At this production level, over 16 t of new catalyst is
added to the FCC. With constant unit operation, cyclones in the reactor release fines and, over time, larger catalyst can escape through this process. With the proper separation technology in place, lost catalyst, especially in older FCC units, can be recovered and sent back to the riser. This adds greater attrition to the life of the catalyst equilibrium cycle in the FCC, and assists in better production and operation of the unit. With the recovery of 1900 tpy, savings of over US$1.6 million could be claimed just in catalyst loss and environmental savings.
Conclusion
The evolution of the refining industry is racing toward more severe catalytic cracking technologies that are capable of processing heavier opportunistic crudes and meeting the profitable petrochemical demand. Refining improvements and petrochemical integrations are allowing for refineries to make increased profits from every barrel processed. Implementing more severe catalytic technologies is an important step toward improving refinery flexibility. However, as licensors begin to develop new innovative processes and the demand for new synthetic pyrolysis oil blended crudes becomes more of a reality, the need for selecting the right separation technology is critical.
Regardless of the separation path chosen, spent catalyst removal and waste management will remain one of the most difficult processes in the refinery. Settling is expensive in terms of lost time and profits. Mechanical separation processes are limited and come with costly downtime and maintenance schedules. The refining industry has evolved away from centrifuges, and filtration technology is becoming harder to operate in the more concentrated slurries. Electrostatic separation is a proven solution for trouble-free separation of high severity FCC and RFCC slurries. The solution exists with the technology of today to increase profits from new markets or recover profits from lost revenue for every refinery with an FCC or RFCC. It is now up to the refiner to take advantage of this solution.
References
1. Website data from http://abarrelfull.wikidot.com/
2. SCALCO, V. M., ‘The plight of the modern refinery: racing to meet IMO 2020 regulations’, Hydrocarbon Processing, (November 2019), pp. 69 - 73.
3. GUERICO, V. J., ‘US Producing, exporting more slurry oil’, Oil & Gas Journal, (4 October 2018).
4. ‘Methodology and Specifications Guide, Petroleum Product & Gas Liquids: US Caribbean and Latin America’, Platts, (January 2021).
5. SCALCO, V., ‘AFPM ‘19: IMO 2020 and beyond’, (19 March 2019), https://www.hydrocarbonprocessing.com/conferencenews/2019/03/afpm-19-imo-2020-and-beyond
6. HOUSER, T., GIBSON, S., and SCALCO, V., ‘Confronting unconventional oil’, Hydrocarbon Engineering, (October 2018), pp. 57 - 62.
7. BAI, Z., WANG, H. L., and TU, S. T., ‘Removal of Catalyst Particles from Oil Slurry by Hydrocyclone’, Separation Science and Technology, (2009), pp. 2067 - 2077.
8. MINYARD, W. F., and WOODSON, T. S. ‘Upgrade FCC Slurry Oil with Chemical Settling Aids’, World Refining, (November/December 1999).
9. SILVERMAN, L. D., WINKLER, S.., TIETHOF, J. A., and WITOSHKIN, A., ‘Matrix effects in catalytic cracking’, presented at the 2018 AFPM Annual Meeting, (23 – 25 March 2018).
10. ‘S&P Global Commodity Insights’, S&P Global, https://www.platts. com/IM.Platts.Content/InsightAnalysis/IndustrySolutionPapers/ SR-IMO-2020-Global-sulfur-cap-102016.pdf
March 2023 HYDROCARBON ENGINEERING 50
The demand for ethylene and propylene is growing at approximately 4% annually due to the rapid increase in demand for polymer and plastics material used in the packaging, construction and automobile industries. These basic raw materials are produced either in gas- or liquid-based crackers, and propane dehydrogenation units. With the increase in the capacity of world-scale olefins plants, the column diameters for ethylene and propylene splitters are also increasing.
Propylene fractionators, operating in the range of 8 – 20 bar, are characterised by a high number of trays and high reflux rates. The low relative volatility between propane and propylene requires tall columns with 200 – 300 actual trays in order to meet the stringent product specifications of more than 99.5 mol% for polymer-grade propylene. While minimising the propylene loss to usually less than 1 mol% in the bottom stream, these propylene fractionators normally operate at high reflux ratios, typically in the range of 10 – 15. Due to the high liquid loads and large diameter in these columns, high-capacity trays with high-performance valves and enhanced downcomers are the preferred mass transfer equipment for these super-fractionators for an optimised column design.

March 2023 51 HYDROCARBON ENGINEERING
Ang Chew Peng, Hou Peng-Cheng and Senthil Krishnamoorthy, Sulzer, discuss various types of high-performance trays for large diameter propylene fractionators.
Propylene fractionators can be designed with different types of trays. These columns, with low density difference between the vapour and liquid phases, require careful tray design that is optimised to handle the high liquid and vapour volumetric flow rate.
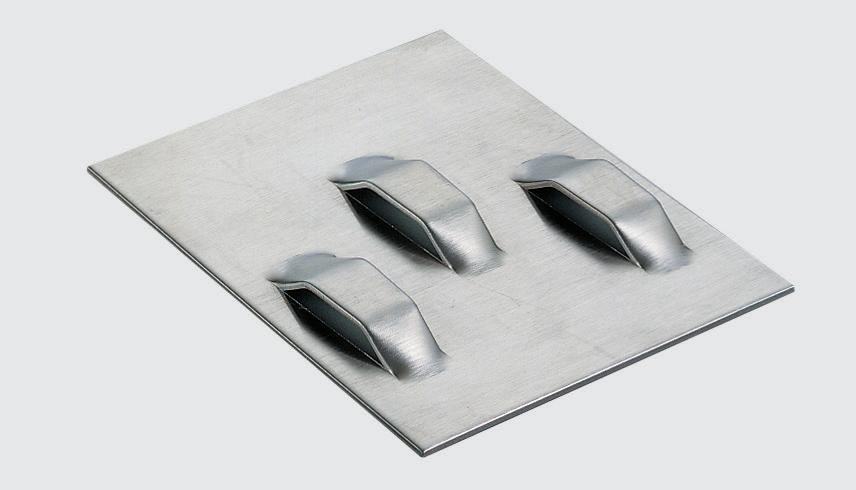
This article will discuss the various types of high-performance trays that Sulzer designs for large diameter propylene fractionators. It will also describe the selection of the number of liquid passes as well as the type of downcomers and tray valves, and share a few successful case studies of commercial propylene splitters.
Selection of number of liquid passes
As with any large columns, the propylene fractionators may require multi-pass trays with chordal downcomers. The number of liquid passes usually increases with column diameter. For example, 2-pass trays for column diameters in the range of 3 – 4 m; 4-pass trays for column diameters in the range of 5 – 6 m; and 6-pass trays for column diameters of more than 7 m. Increasing the number of tray passes as the column diameter increases is the natural geometrical progression. As the requirement for tray active area increases to meet the higher vapour loads, the downcomer area and weir length also need to increase proportionally to handle the corresponding high liquid loads.
Figure 1 shows the geometrical comparison between a 1 m and 2 m 1-pass tray. The image illustrates that doubling the column diameter quadruples the active area and
downcomer area, while the weir length only doubles. Increasing the number of liquid passes of the 2 m column to two, while maintaining the same downcomer area, would increase the overall tray weir length by at least 70%. Similarly, the weir length of a 4-pass tray will be 2 – 3 times longer than that of a 1-pass tray, with the same column diameter, downcomer and active area. The longer weir length will result in lower weir loading, thereby reducing the tray clear liquid height on the deck. This will also increase the vapour capacity of the trays.
As such, as the column diameters increase for the same service, the number of liquid passes progresses from 2-pass to 4-pass, and even to 6-pass. 1 Case study 1 details two propylene fractionators in a series that were designed with both 4-pass and 6-pass trays, for different diameters.
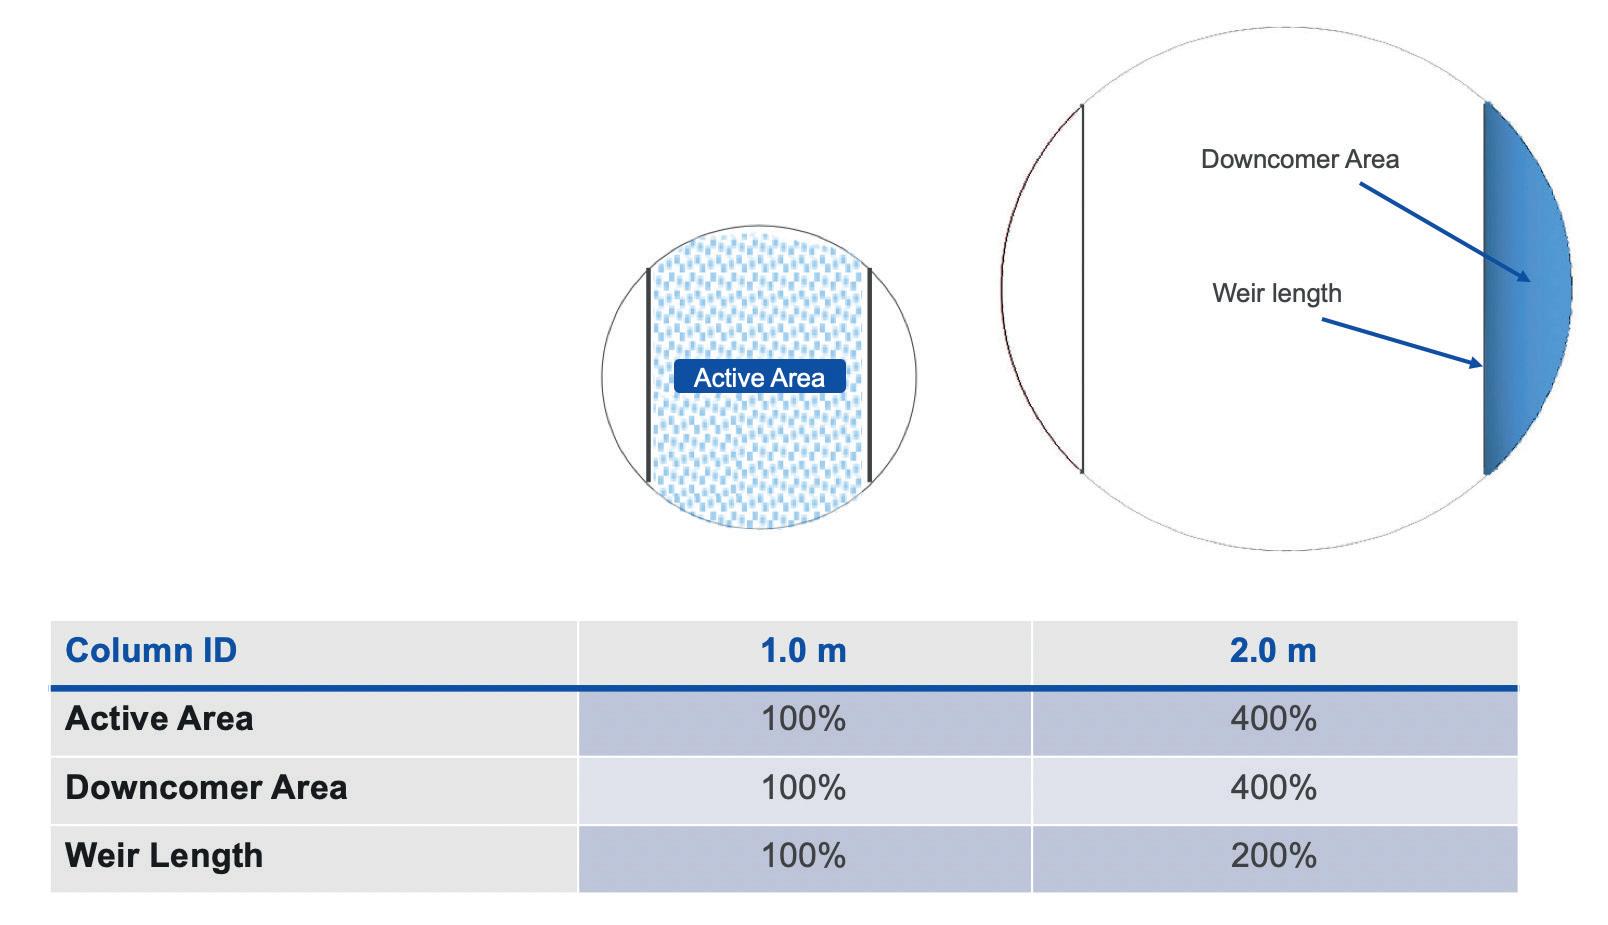
Case study 1
This propylene splitter, built in 2014, is equipped with 228 actual trays in two physical columns. The end user preferred conventional straight or sloped downcomer trays for these new columns, for the possibility of revamping to high-performance trays for future capacity expansion. The upper column, C3 rectifier of 8.8 m dia., was designed with 6-pass MMVGTM trays, while the lower column, C3 stripper of 6.3 m dia., was designed with 4-pass MVGTM trays.
The tray flow path lengths of these trays are approximately similar, at 0.9 m. MMVG and MVG are Sulzer’s high-performance V-Grid TM valves, as seen in Figure 2. To ensure that the multi-pass trays were balanced for the optimum mass transfer, Sulzer applied picket fence weirs to the centre and off-centre downcomers, to control the liquid split. This propylene splitter achieved a top propylene specification of more than 99.7 mol%, while the propylene loss in the bottom stream was less than 1 mol%, achieving an overall tray efficiency of 95%.
Application of enhanced downcomer to improve hydraulic performance
Multi-pass trays such as 2, 4 and 6-pass have two layouts, whereby the layout with the side downcomers will have the shorter total tray weir length. For example, in 4-pass trays the layout with two off-centre downcomers will have a longer total weir length, compared to the layout with one centre and two side downcomers. To increase the total weir length of the tray, Sulzer ModArcTM downcomers, as seen in Figure 3, can be applied to the side downcomers of multi-pass trays. Application of the ModArc side downcomers will minimise the weir length difference between the layouts, ensuring consistent hydraulic behaviour on all trays in the section.
The ModArc profile also improves the distribution of liquid exiting the bottom of the downcomers. Push valves are applied at specific locations, especially at the tray inlets, to ensure that liquid is well distributed across the tray decks for optimum tray performance. Case study 2 details a successful application of 6-pass trays designed with these downcomers.
March 2023 HYDROCARBON ENGINEERING 52
Figure 1. Geometrical comparison of 1 m and 2 m 1-pass trays.
Figure 2. Sulzer high-capacity V-Grid.

PRECISION, SIMPLICITY, COMPATIBILITY. THE 6X ®. OUT NOW! The new 6X radar level sensor is so easy to use, it’s simply a pleasure. Because we know customers value not just ‘perfect technology’, but also making everyday life better and less complicated. We wouldn’t be VEGA if measurement technology was our only value. VEGA. HOME OF VALUES. GET TO KNOW THE 6X® www.vega.com/radar
Case study 2
This new propylene splitter, built in 2017, is equipped with 248 trays in two physical columns: Tower 1 with 127 trays of 7.8 m dia., and Tower 2 with 121 trays of 8.2 m dia. For these
new trays, 6-pass trays with ModArc downcomers were applied, as seen in Figure 4. This propylene splitter achieved a top propylene purity of 99.94 mol% as compared to the design specification of 99.6 mol%, and the bottom propylene loss was less than 0.5 mol% as compared to the design specification of maximum 2 mol%, obtaining a high overall tray efficiency of 100%.
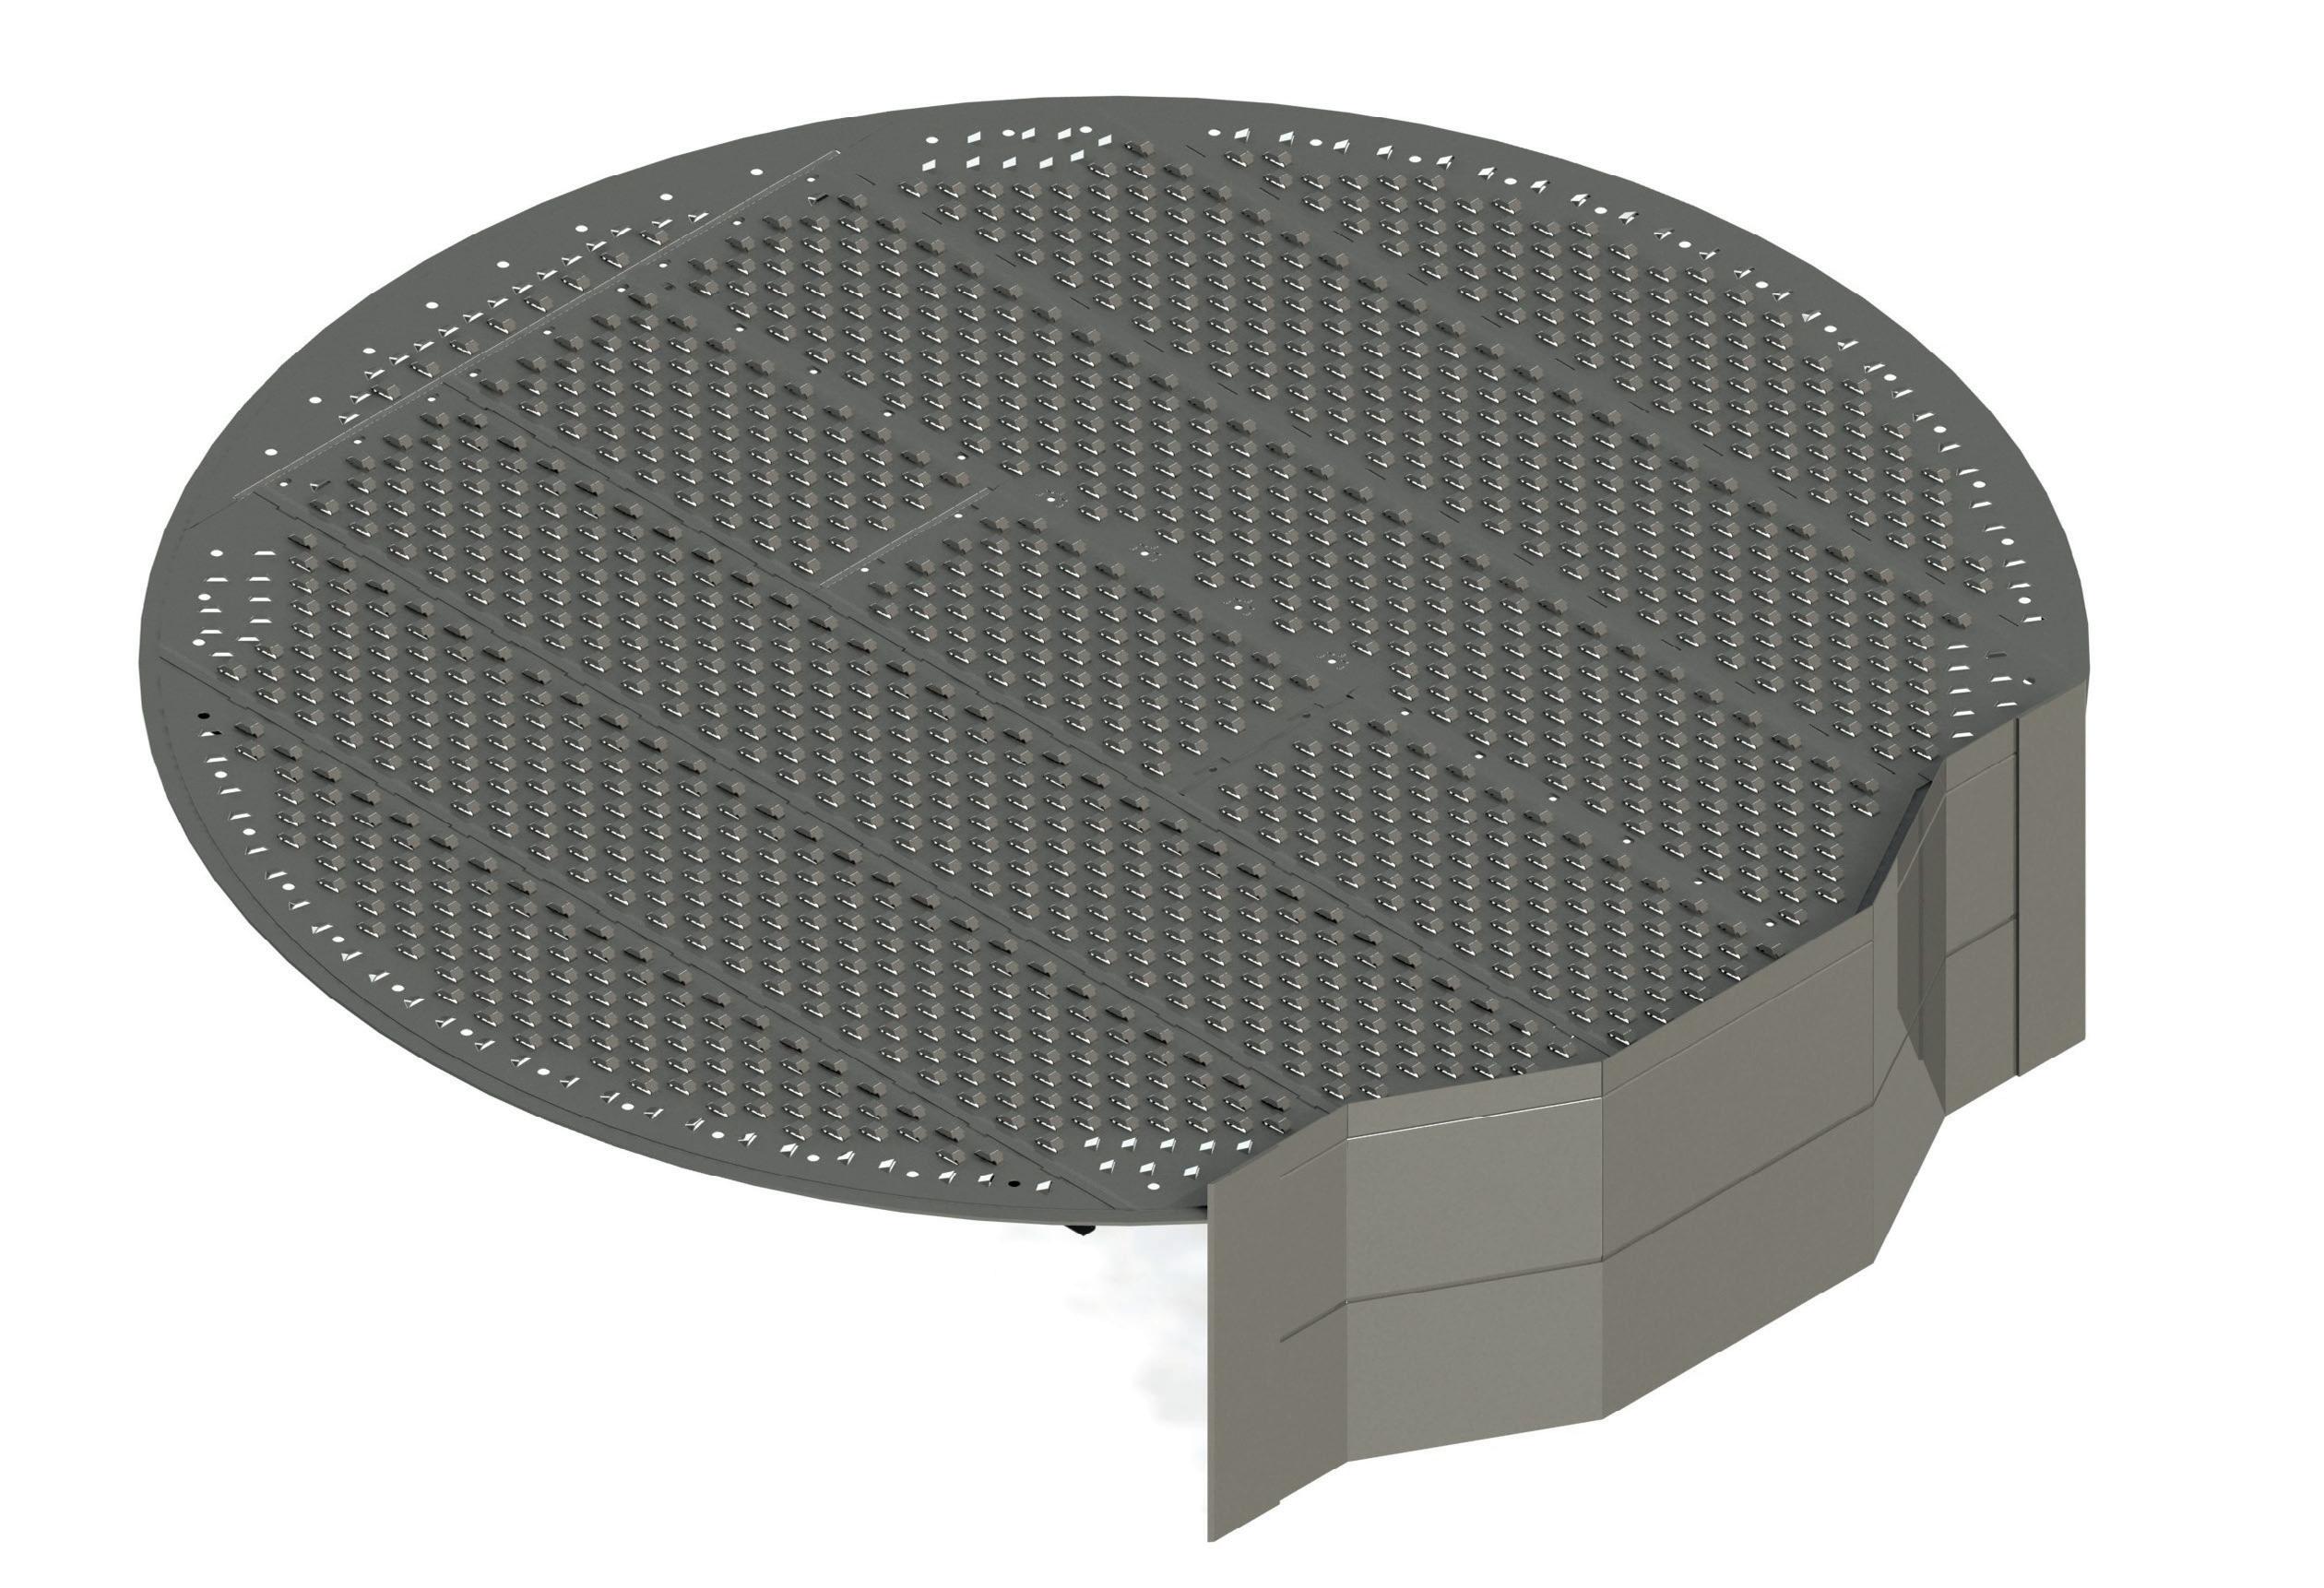
Application of high-performance trays with high-capacity fixed valves
For new columns, reducing the column diameter through the use of high-performance trays, especially when the column diameters are large, can result in significant savings in capital investment. Sulzer high-performance trays, VGPlusTM, as seen in Figure 5, are designed for multi-pass propylene fractionators. They feature high-capacity MVG or MMVG fixed valves which boost vapour handling capacity while minimising tray pressure drop. This is essential for super-fractionators with high tray count. These trays also feature enhanced downcomers such as ModArc side downcomers, as well as truncated downcomers to maximise bubbling area.

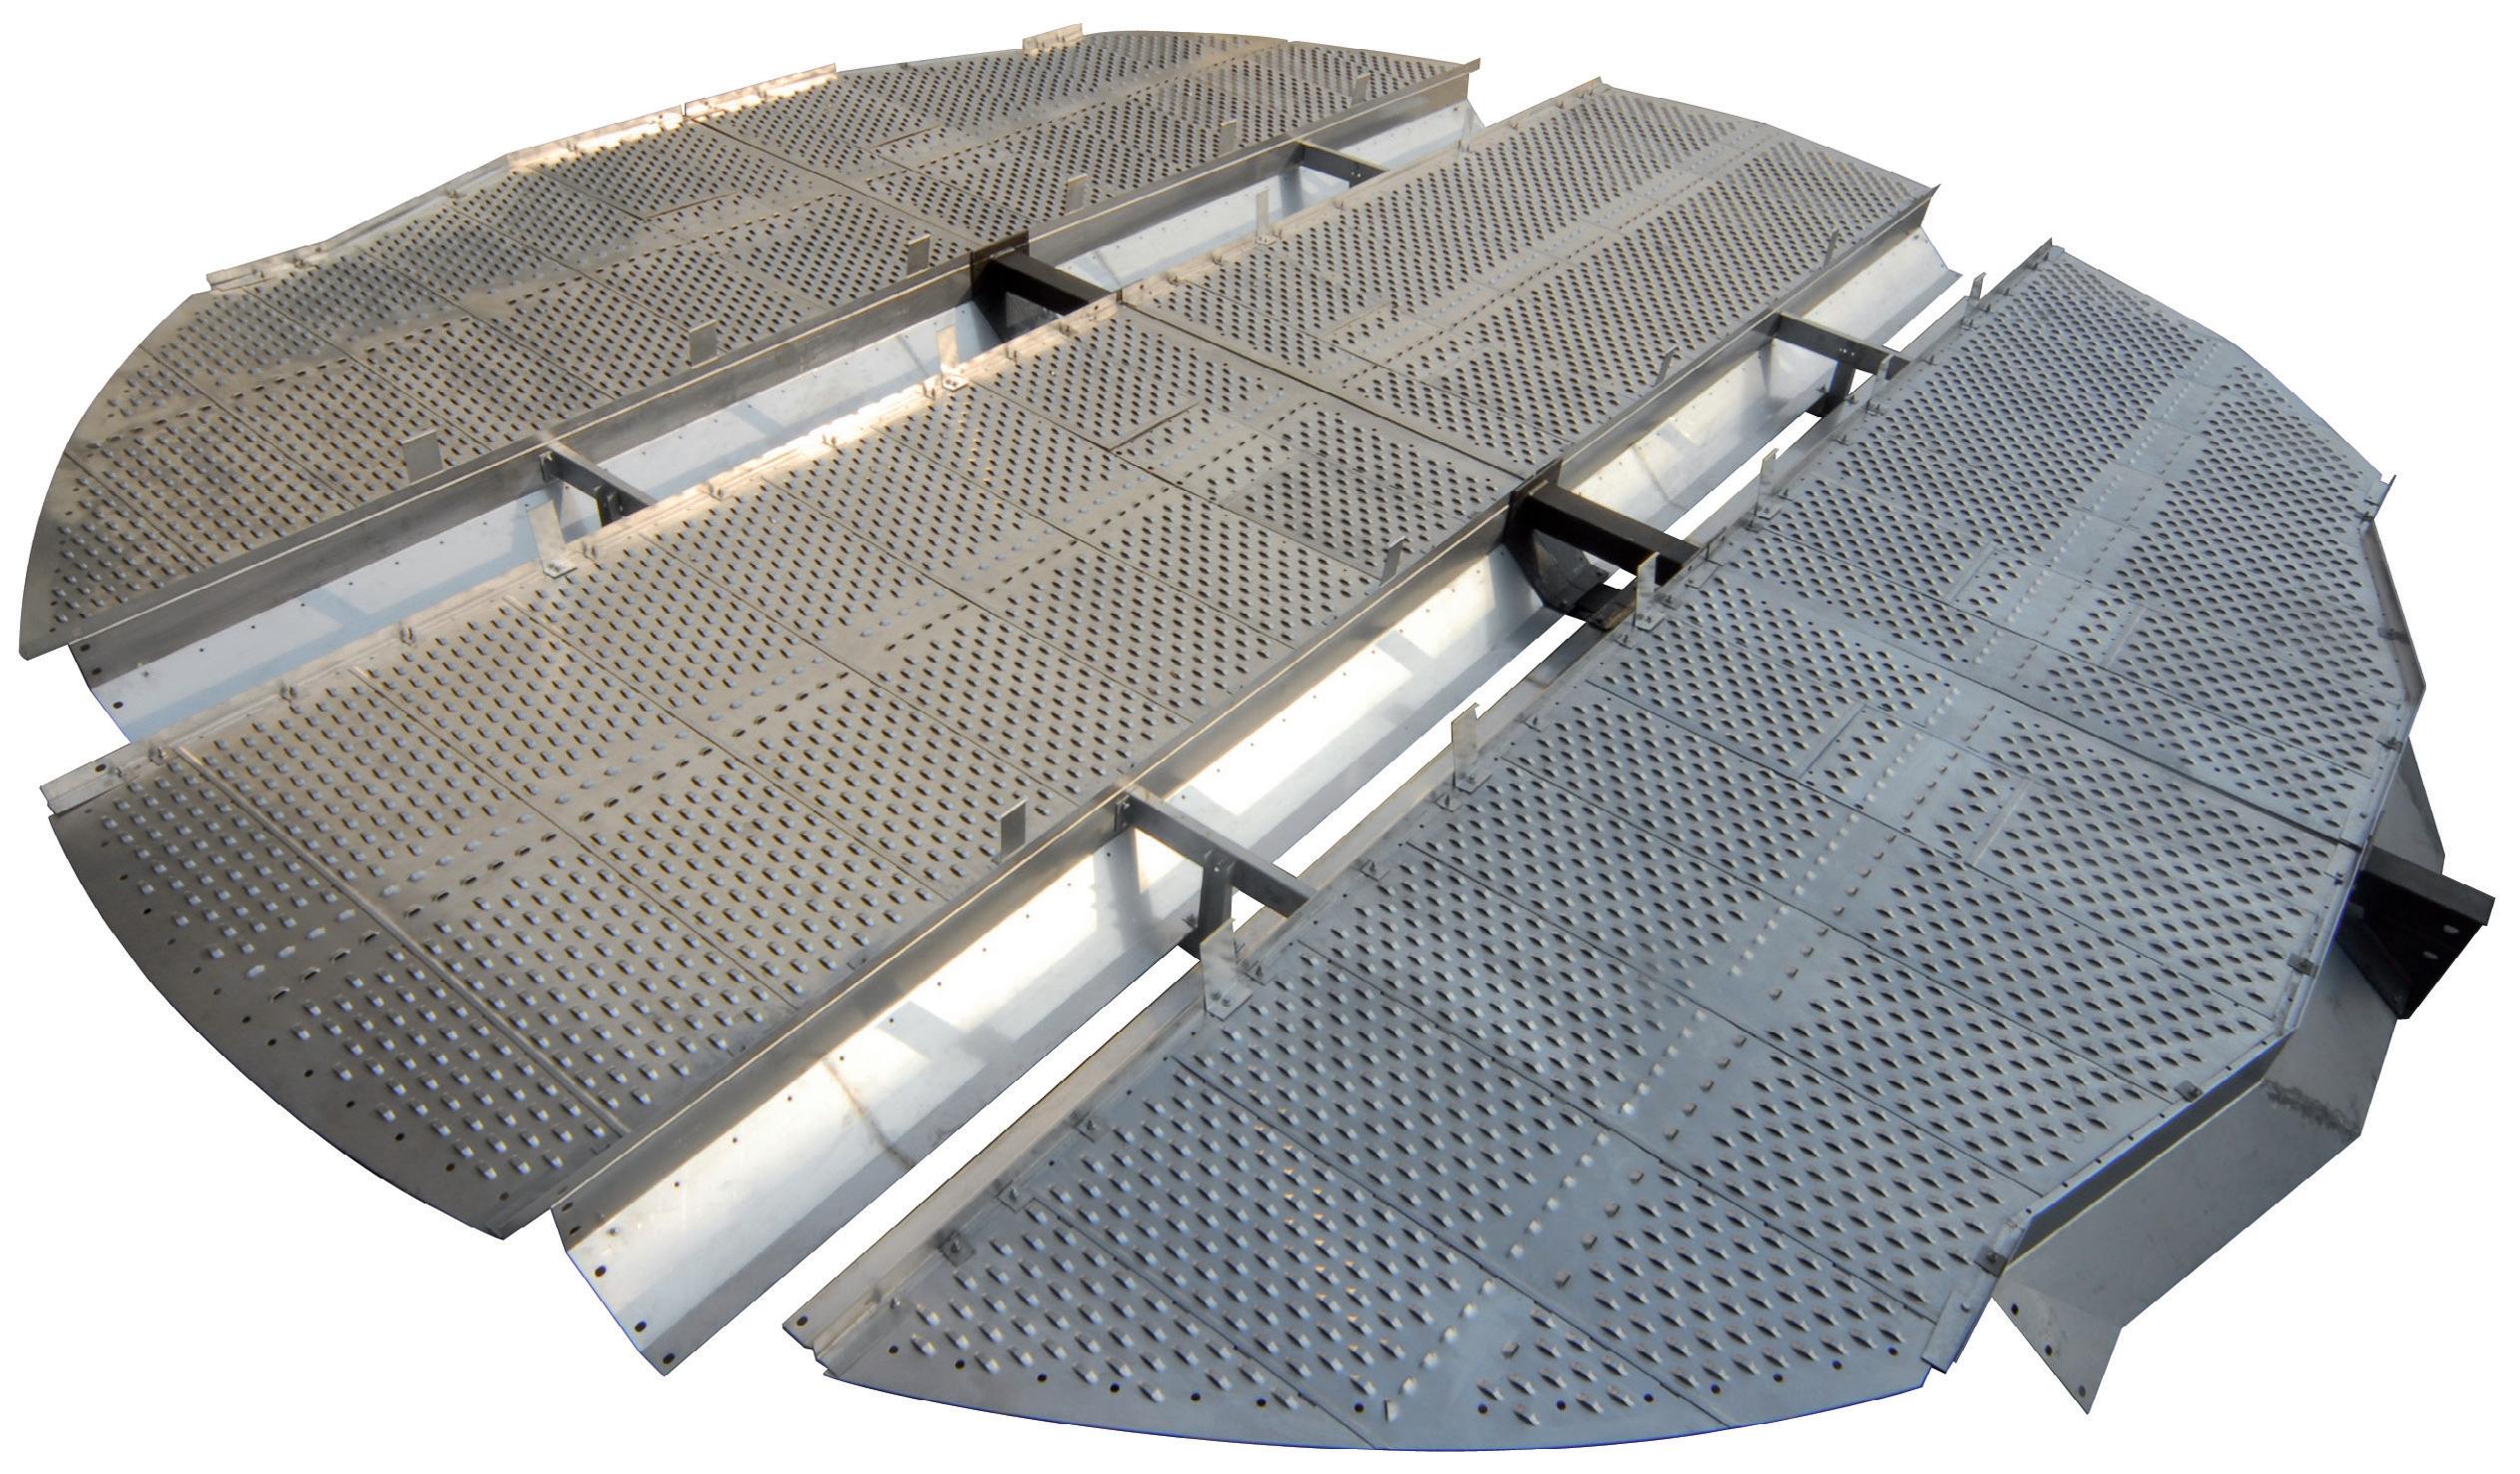
The efficacy of the tray technology has been demonstrated at the independent Fractionation Research Institute (FRI), in the iso-butane/n-butane system at both 7 and 11 bar. The trays deliver approximately 30% higher capacity than conventional round valve trays.
For revamps, Sulzer VGPlus high-performance trays are effective in debottlenecking columns that are fitted with conventional trays, with proven successes in the revamps of numerous propylene fractionators. Case study 3 summarises the revamp of propylene fractionators from 4-pass conventional trays to 4-pass VGPlus with ModArc downcomers for higher capacity, while case study 4 discusses the revamp of propylene fractionators from 4-pass sieve trays to 4-pass VGPlus with ModArc downcomers for higher tray efficiency.
Case study 3
This propylene splitter is equipped with 263 trays: C3 rectifier with 170 trays of 7.8 m column dia., and C3 stripper with 93 trays of 6.6 m column dia. These columns were originally equipped with 4-pass conventional float valve trays before being revamped to 4-pass VGPlus trays with MVG valves to handle a 30% increase in capacity in 2019. ModArc downcomers were also applied to increase the tray weir length. The propylene splitter achieved a top propylene purity of 99.79 mol% as compared to the design specification of minimum 99.6 mol%, and the bottom propylene loss was less than 4.07 mol% as compared to the design specification of maximum 4.3 mol%, obtaining a high tray efficiency of 95%.
Case study 4
This propylene splitter is equipped with 200 actual trays in two physical columns of approximately 8 m dia. The column was originally equipped with 4-pass sieve trays. During the operation, the column suffered significant loss of propylene in the bottom product at more than
March 2023 HYDROCARBON ENGINEERING 54
Figure 4. 6-pass trays with ModArc side downcomers.
Figure 5. Sulzer 4-pass VGPlus with ModArc side downcomers and MVG fixed valves.
Figure 3. 1-pass tray with ModArc downcomers.
Discover our Tail Gas Treatment Catalysts How to achieve up to 99.9+% sulfur recovery?
15 mol%, as compared to the design specification of less than 2 mol%. The calculated tray efficiency was around 64%. The original sieve trays with tray dimensions specified by the engineering company did not employ any tray balancing techniques, resulting in different vapour/liquid ratio in each flow pass of the tray design.
Sulzer revamped the columns with 4-pass VGPlus with MMVG tray decks and ModArc side downcomers, applying picket fences to the centre downcomers to control the liquid split to the panels. After the revamp, the column achieved the top propylene specifications of more than 99.6 mol%, and the bottom propylene loss was less than 0.98 mol%. Based on the match back of operating condition with measured reflux flow rates, the propylene splitter achieved a tray efficiency of more than 95%, which is an increase of more than 30%. Additionally, the steam flow rate used to drive the heat pump compressor was reduced by 25%, resulting in substantial savings.
Multi-downcomer trays for propylene fractionators
Multi-downcomer trays such as Shell HiFiTM trays, as seen in Figure 6, are also often applied in columns with high liquid loads – including propylene fractionators. These
trays have multiple downcomers and can have more downcomers than chordal downcomer trays (2-pass, 4-pass, 6-pass) at the same column diameter. A Shell HiFi tray of 5 m dia. can have eight downcomers, analogous to a 7-pass tray, while a Shell HiFi tray of 7 m dia. can have 12 downcomers, analogous to an 11-pass tray. Their large downcomer top area can handle high liquid loads, while the longer weir length results in a lower weir loading, which may improve vapour handling capacity, thereby reducing the column diameters. These trays are also self-balanced as they allow for liquid communication on the tray decks.
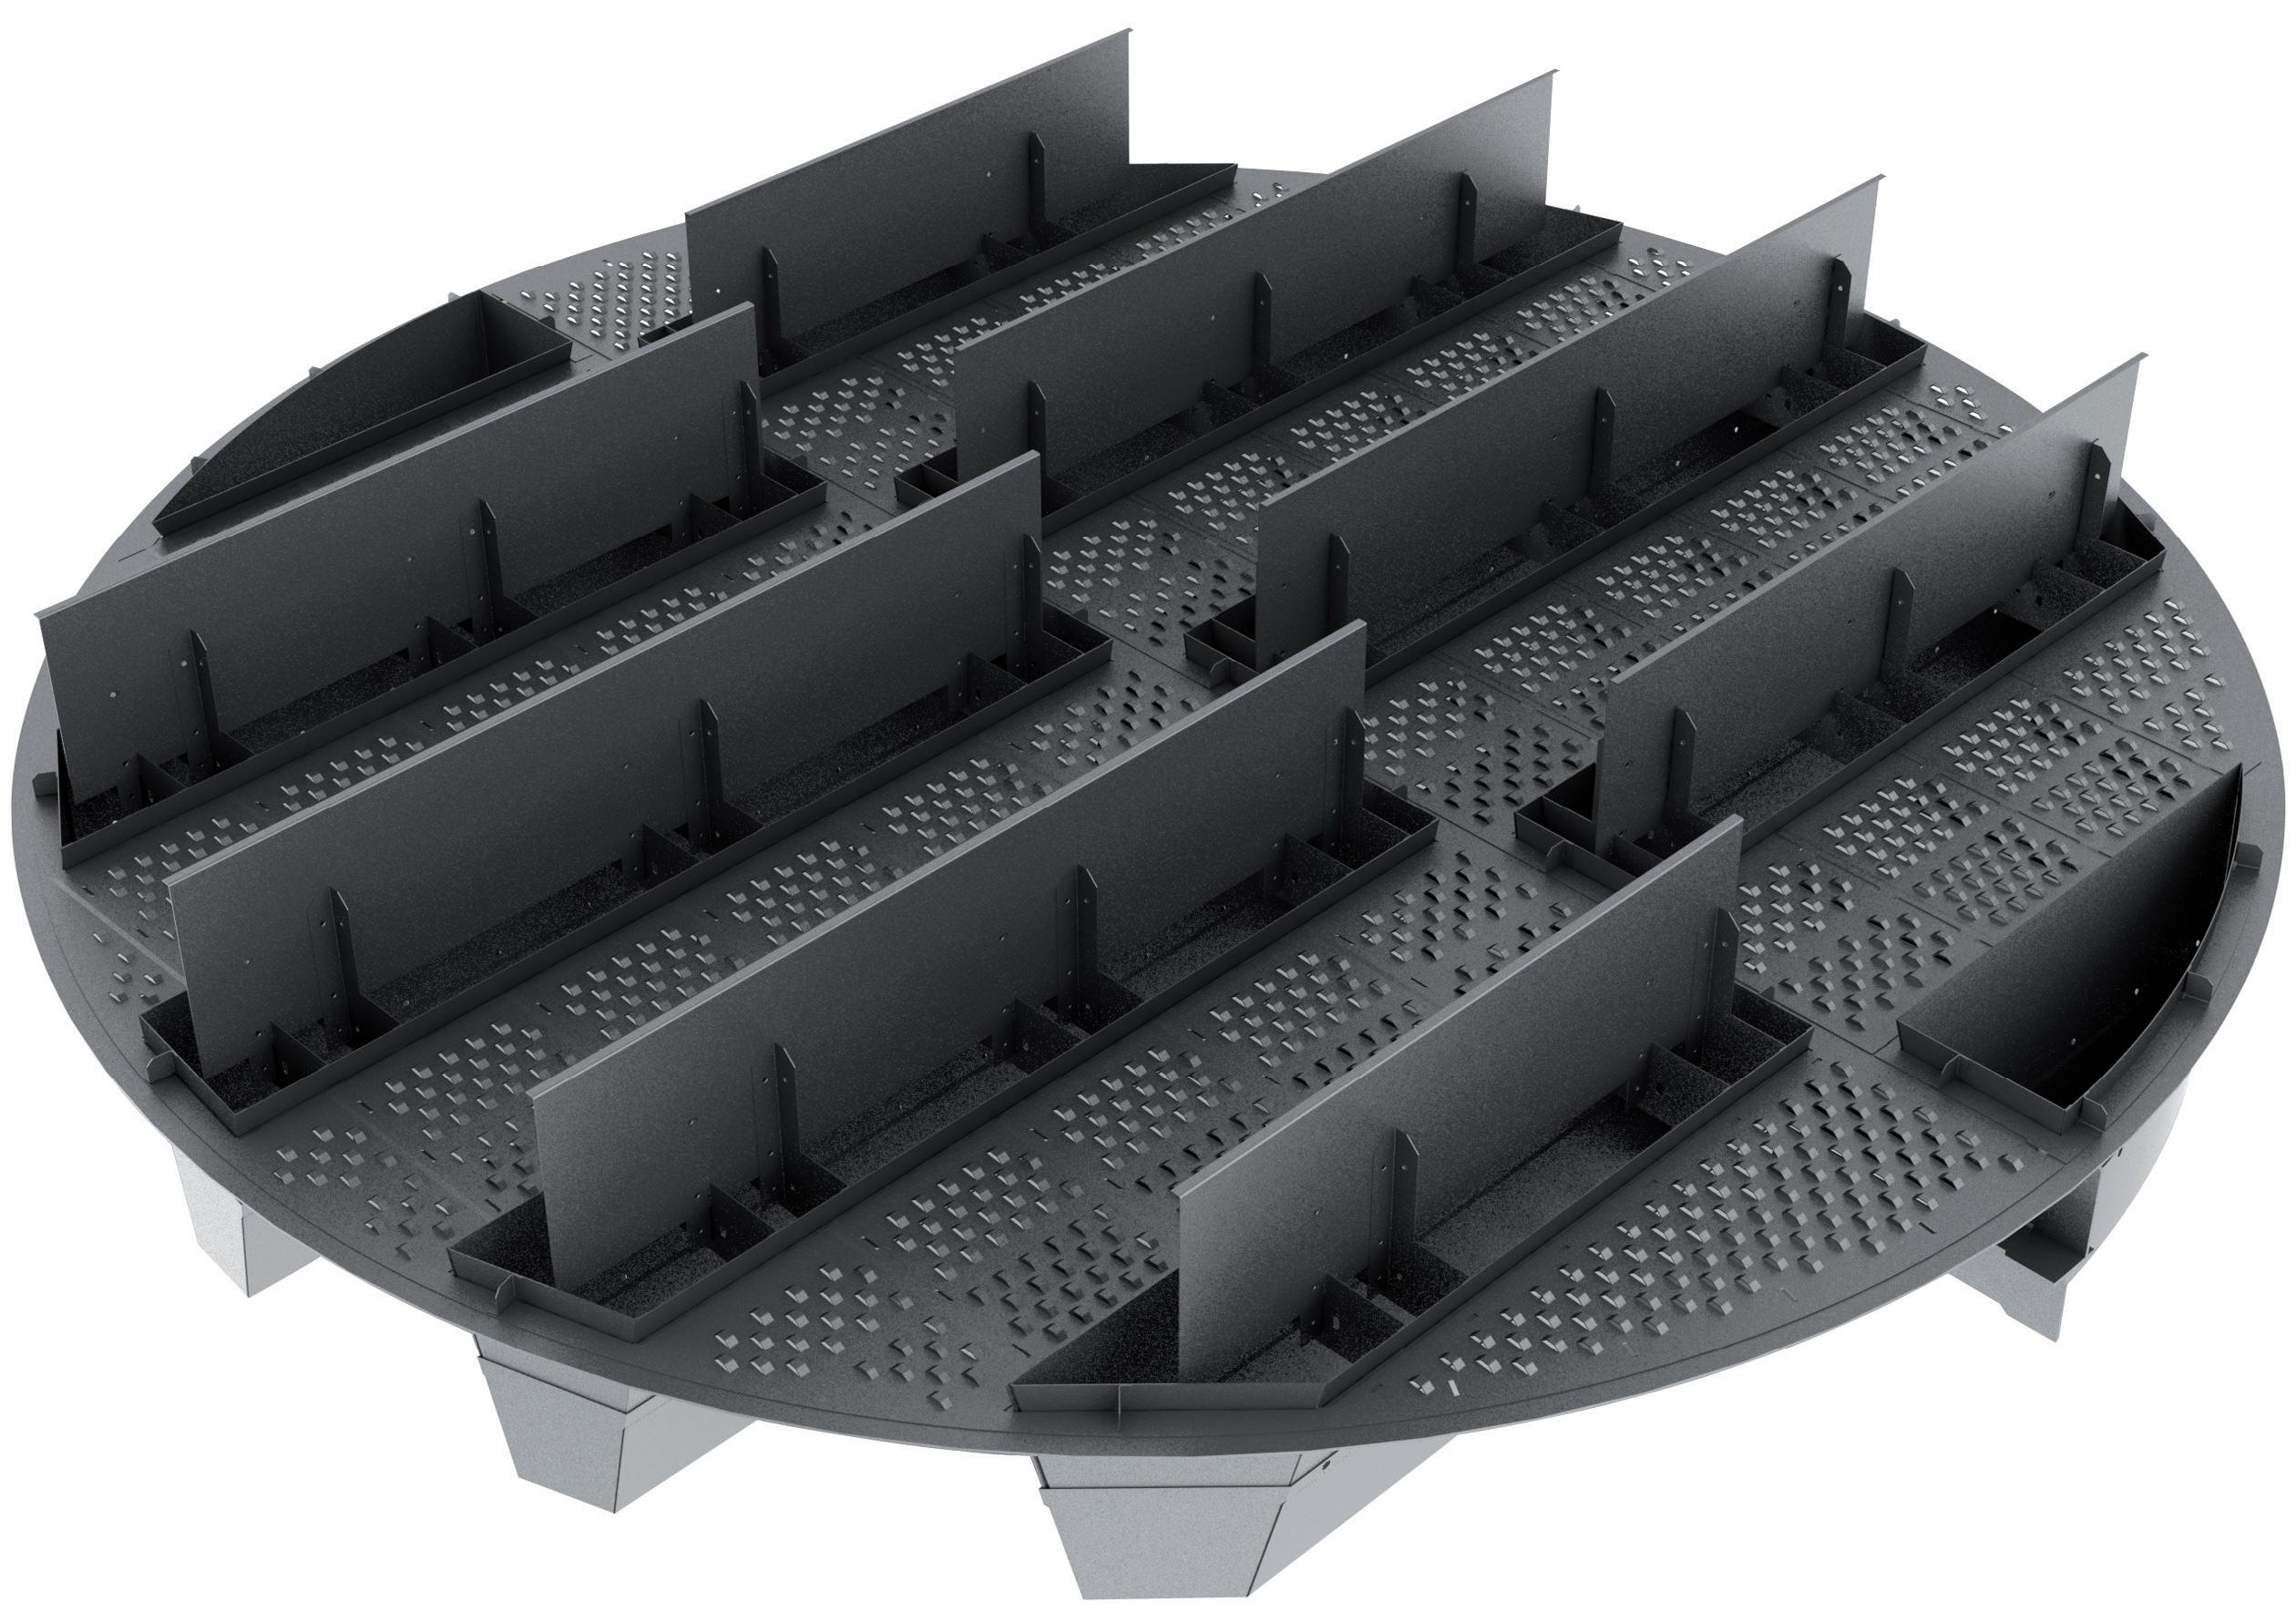
Case study 5 summarises one successful application of Shell HiFi Plus trays in propylene fractionators. These are Shell HiFi trays enhanced with Sulzer high-capacity valves such as MVG or MMVG.
Case study 5
This new propylene splitter is equipped with 238 trays in two physical columns: C3 rectifier with 187 trays of 6.9 m dia., and C3 stripper with 51 trays of 5.2 m dia. These columns were designed with Shell HiFi Plus trays with high-capacity MVG valves for an optimum column size. The C3 rectifier had 10 downcomer boxes, and the C3 stripper of smaller diameter had eight downcomer boxes. The propylene splitter achieved the top propylene specifications of 99.66 mol% as compared to the design specification of minimum 99.5 mol%, and the bottom propylene was less than design, achieving a high overall tray efficiency of 100%.
All of these propylene fractionators success stories are summarised in Table 1.
Conclusion
Large propylene splitters with high liquid loads have been designed with a variety of tray designs, ranging from 4-pass and 6-pass high-performance trays, to multi-downcomer trays.
This article has discussed the selection of a number of passes and how the features of VGPlus high-performance trays, such as high-capacity MVG and MMVG fixed valves and enhanced ModArc downcomers, can deliver high vapour and liquid handling capacity as well as enhanced separation performance. As evidenced by the five case studies, optimised design of high-capacity trays is crucial to achieving superior performance of these super-fractionators.
March 2023 HYDROCARBON ENGINEERING 56
Figure 6. Shell HiFi Plus trays with MVG valves.
Reference
1. ANG, CP., and PILLING, M., ‘Tray design for high liquid load applications’, Digital Refining, (July 2014).
Case study New/revamp Column Column dia.
Tray
efficiency (%) 1 New C3 rectifier 8.8 6-pass MMVG 95 C3 stripper 6.3 4-pass MVG 2 New Tower 1 7.8 6-pass VGPlus 100 Tower 2 8.2 6-pass VGPlus 3 Revamp C3 rectifier 7.8 4-pass VGPlus 95 C3 splitter 6.6 4-pass VGPlus 4 Revamp Upper column 8.0 4-pass VGPlus 95 Lower column 8.0 4-pass VGPlus 5 New C3 rectifier 6.9 Shell HiFi
C3 stripper 5.2 Shell
Table 1. Summary of Sulzer propylene fractionators
(m)
type Overall tray
Plus trays 100
HiFi Plus trays
Water and Process Treatment
SUPERIOR SERVICE AND CHEMICAL APPLICATION EXPERTISE TO MAXIMIZE ASSET VALUE

Our experienced team provides customized water and process treatments, dedicated engineering, and expert technical support to refineries worldwide.
We can help you improve reliability, increase throughput, and enhance the efficiency and flexibility of your operating units. We have a proven history of working with refineries to identify, deliver, and document process improvements and cost avoidance.
halliburton.com
© 2023 Halliburton. All Rights Reserved.
Multi-Chem
San Antonio, Texas · March 26 – 28, 2023
One of the largest petrochemical events in the world. Join thousands of participants from companies from all over the globe.

International Petrochemical Conference
afpm.org/events/IPC23
Register today!
Jim Lines, Graham Corp., USA, lists the VDU ejector system field lessons learned by a performance improvement engineer, through the lens of four specific case studies.

Reliable vacuum distillation unit (VDU) performance rests on a number of variables and equipment that support the distillation process. Proper ejector system performance is vital to successful operation of the VDU, and for a refiner to achieve economic goals. For decades, ejector systems have been the mainstay for evacuating vacuum column overhead vapours and ensuring that desired column pressure is maintained. Much has been written about ejector systems – how they operate, what variables impact performance, how to troubleshoot performance, and best practices. This article discusses recent ejector system performance issues that a refiner experienced, how the root cause was diagnosed, and the steps taken to achieve required performance.
Actual VDU process operation is often different from the original design, especially over two or three decades of service. Process simulations, request for purchase (RFP) design data sheets, crude slate characteristics, utility supply conditions, and extent of fouling over time, as examples, all may be different in operation than was originally designed. The lessons learned from the four case studies
March 2023 59 HYDROCARBON ENGINEERING
outlined in this article are not unusual as they cover fouling, overhead loading composition, replacement parts that are not from the original equipment manufacturer (OEM), and mechanical failure. Fouling is common in a process such as crude oil vacuum distillation, be it shell side or tube side fouling. Overhead load variation from design is typical with changing crude slate or as refiners strive to push for more yield or throughput. For expediency or cost, local fabricated equipment suppliers may provide replacement equipment rather than the OEM. Mechanical issues can arise with ejectors or condensers over the life of this equipment, which is typically 30+ years. Each can create ejector system performance shortfall, with significant economic consequences for a refiner.
The cases that will be covered are from the many sites visited and performance assessments conducted by ejector system performance improvement engineers. The author wishes to acknowledge that these case studies are from Graham performance improvement engineer reports where detailed notes, observations and customer exchange were documented. No two performance issues may be exactly alike and it is best to consult with specialists in ejector system design, construction, integration into process units, and troubleshooting. Failure to do so may extend the search for root cause or lead to corrective action that may not resolve a particular performance shortcoming. The original equipment supplier is typically the best choice for diagnosing what is causing a performance shortcoming with equipment. If the cause is upstream of the ejector system, then it makes sense to bring in other stakeholders, such as a process licensor or process troubleshooting specialist, to complement the ejector OEM.
Case study 1: intercondenser excessive fouling
A refiner observed deteriorating vacuum column pressure between turnarounds (see Figure 1). Shortly following initial commercial operation, a benchmarking pressure and temperature survey was conducted. Column pressure was 1 torr above design, however this was acceptable given that the charge rate was higher than design. Performance throughout the system appeared satisfactory, with cracked gases below design level
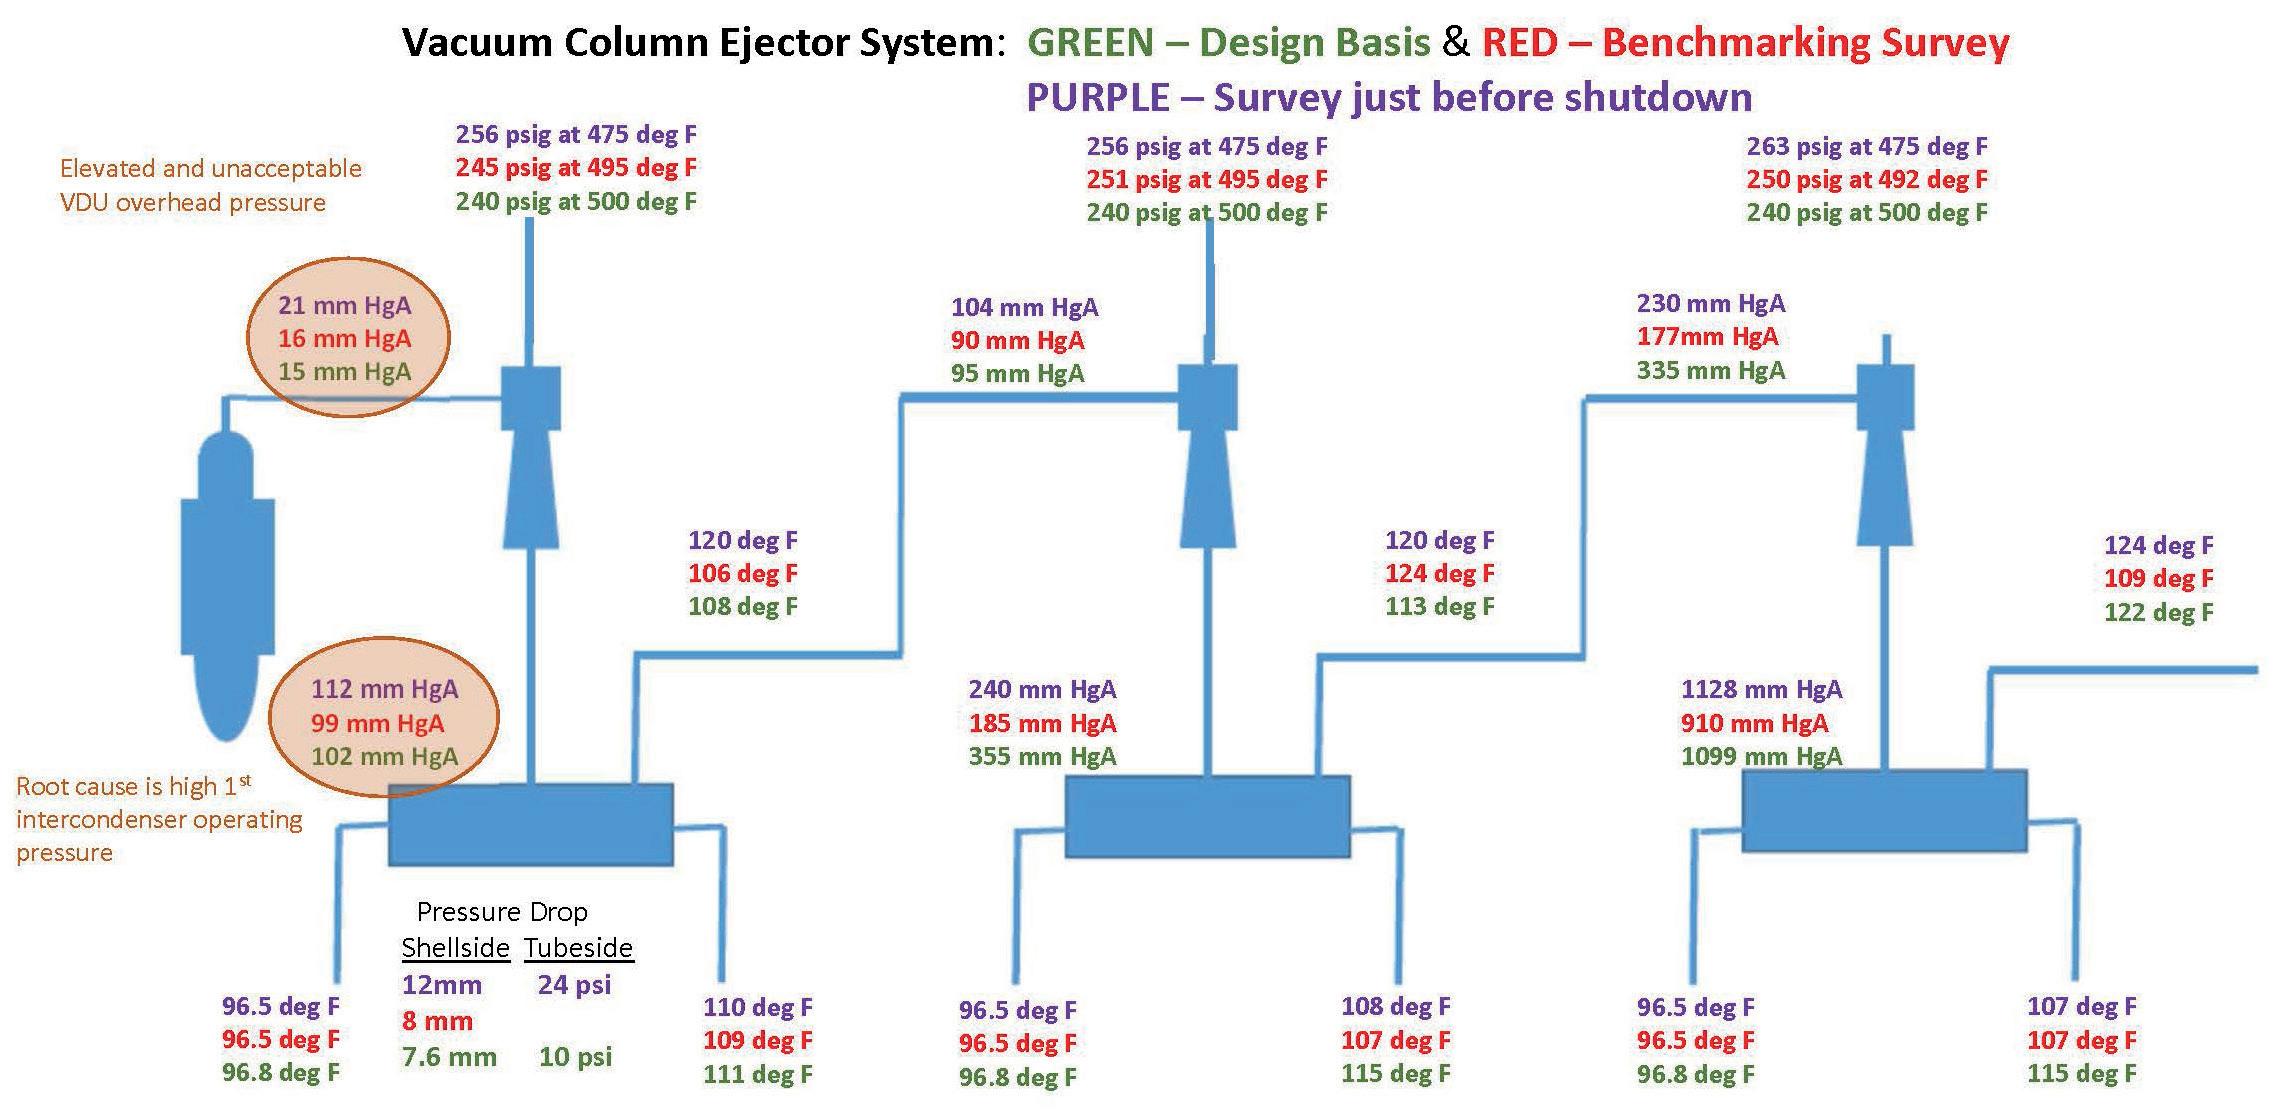
given the operating pressure of the second and third stage ejectors. Both the second and third stage ejectors were operating at pressures below design values, while cooling water temperature was essentially at the design inlet temperature, indicating low cracked gas level and low air leakage.
As time progressed, pressure of the vacuum column overhead increased to above 20 torr, and the first stage ejectors broke performance. This increased vacuum tower residium and lowered gas oil yield, causing economic loss for the refiner. Fouling was suspected, however this could not be completely confirmed without inspecting the tube bundles. An engineer was dispatched to the site to conduct a pressure and temperature survey ahead of the shutdown, and they remained onsite to inspect the tube bundles once they were removed from the shells. Tube side fouling was expected due to pressure drop, as the first intercondenser on the tube side was approximately three times design. Figure 1 illustrates the design pressure and temperatures, along with those from the benchmarking and last survey before shutdown.
From the benchmarking survey (red) nothing stood out as a problem. It is observed that the first intercondenser had an elevated shell side pressure drop. That does not necessarily suggest a problem. The system is operating with fewer non-condensible gases than design, as evidenced by the lower pressure for both the second and third stage ejector. What occurs in such a circumstance is the ejector downstream of a condenser that will set the condenser’s outlet temperature, outlet pressure, or both in order to match that ejector’s mass flow handling capacity. It is referred to as ‘over venting’. The ejector pulls more mass flow rate from the condenser than if the condenser could independently establish its thermal equilibrium. When this is occurring and the ejector system has parallel ejectors in operation, one can observe that the pressure drop is reduced in the preceding intercondenser and vapour outlet temperature may lower, when taking one of the ejectors offline. Note: this should only be done if over venting is appreciable, suggesting one of the ejectors may be shut down.
The survey just ahead of the shutdown (purple) highlights a problem at the first intercondenser. Tube side pressure drop is up significantly, and shell pressure and vapour outlet temperature are elevated compared to the benchmarking survey. It was believed that fouling was the issue. The tube bundle was pulled for inspection and cleaning, and extensive fouling build-up was evident on the shell side of the first intercondenser. The cooling water inlet side of the tubesheet had substantial debris and tube hole blockage. As a result, operating pressure for the first intercondenser rose to 112 mm HgA. This was well above the
March 2023 HYDROCARBON ENGINEERING 60
Figure 1. Case study 1: pressure and temperature survey.


MERYT Catalysts & Innovation c/Berlín Parcela 3F Polígono Industrial Cabezo Beaza 30353-Cartagena Murcia SPAIN MERYT Catalysts & Innovation Your global supplier of catalysts, adsorbents and additives focused on new technologies and sustainable processes. Improve the profitability of your processes with MERYT catalysts and our outstanding technical knowledge, experience, and excellent service Face the Energy Transition with MERYT as your best partner to achieve your objectives Reduce your energy consumption and your emissions with MERYT Catalysts and Technologies info@meryt-chemical.com www.meryt-chemical.com +34 868 086 998 +34 670 518 438
maximum discharge capability of the first stage ejector and, consequently, performance broke down, resulting in vacuum column pressure increasing to an undesirable level. When thermal efficiency declines due to fouling, a condenser will respond by increasing its operating pressure. This in turn increases log mean temperature difference (LMTD) to compensate for a lower overall heat transfer rate (Uobserved < Udesign). Tube hole blockage may render a portion of the surface area unutilised. Hereto, condenser operating pressure will rise. It must be understood that a condenser downstream of an ejector will reject the exhaust duty of the ejector. What is important is the pressure at which that occurs. If it is below the maximum discharge capability of the preceding ejector, then there should not be a problem. However, if above, then the ejector may break operation and dissipate its compression shockwave.
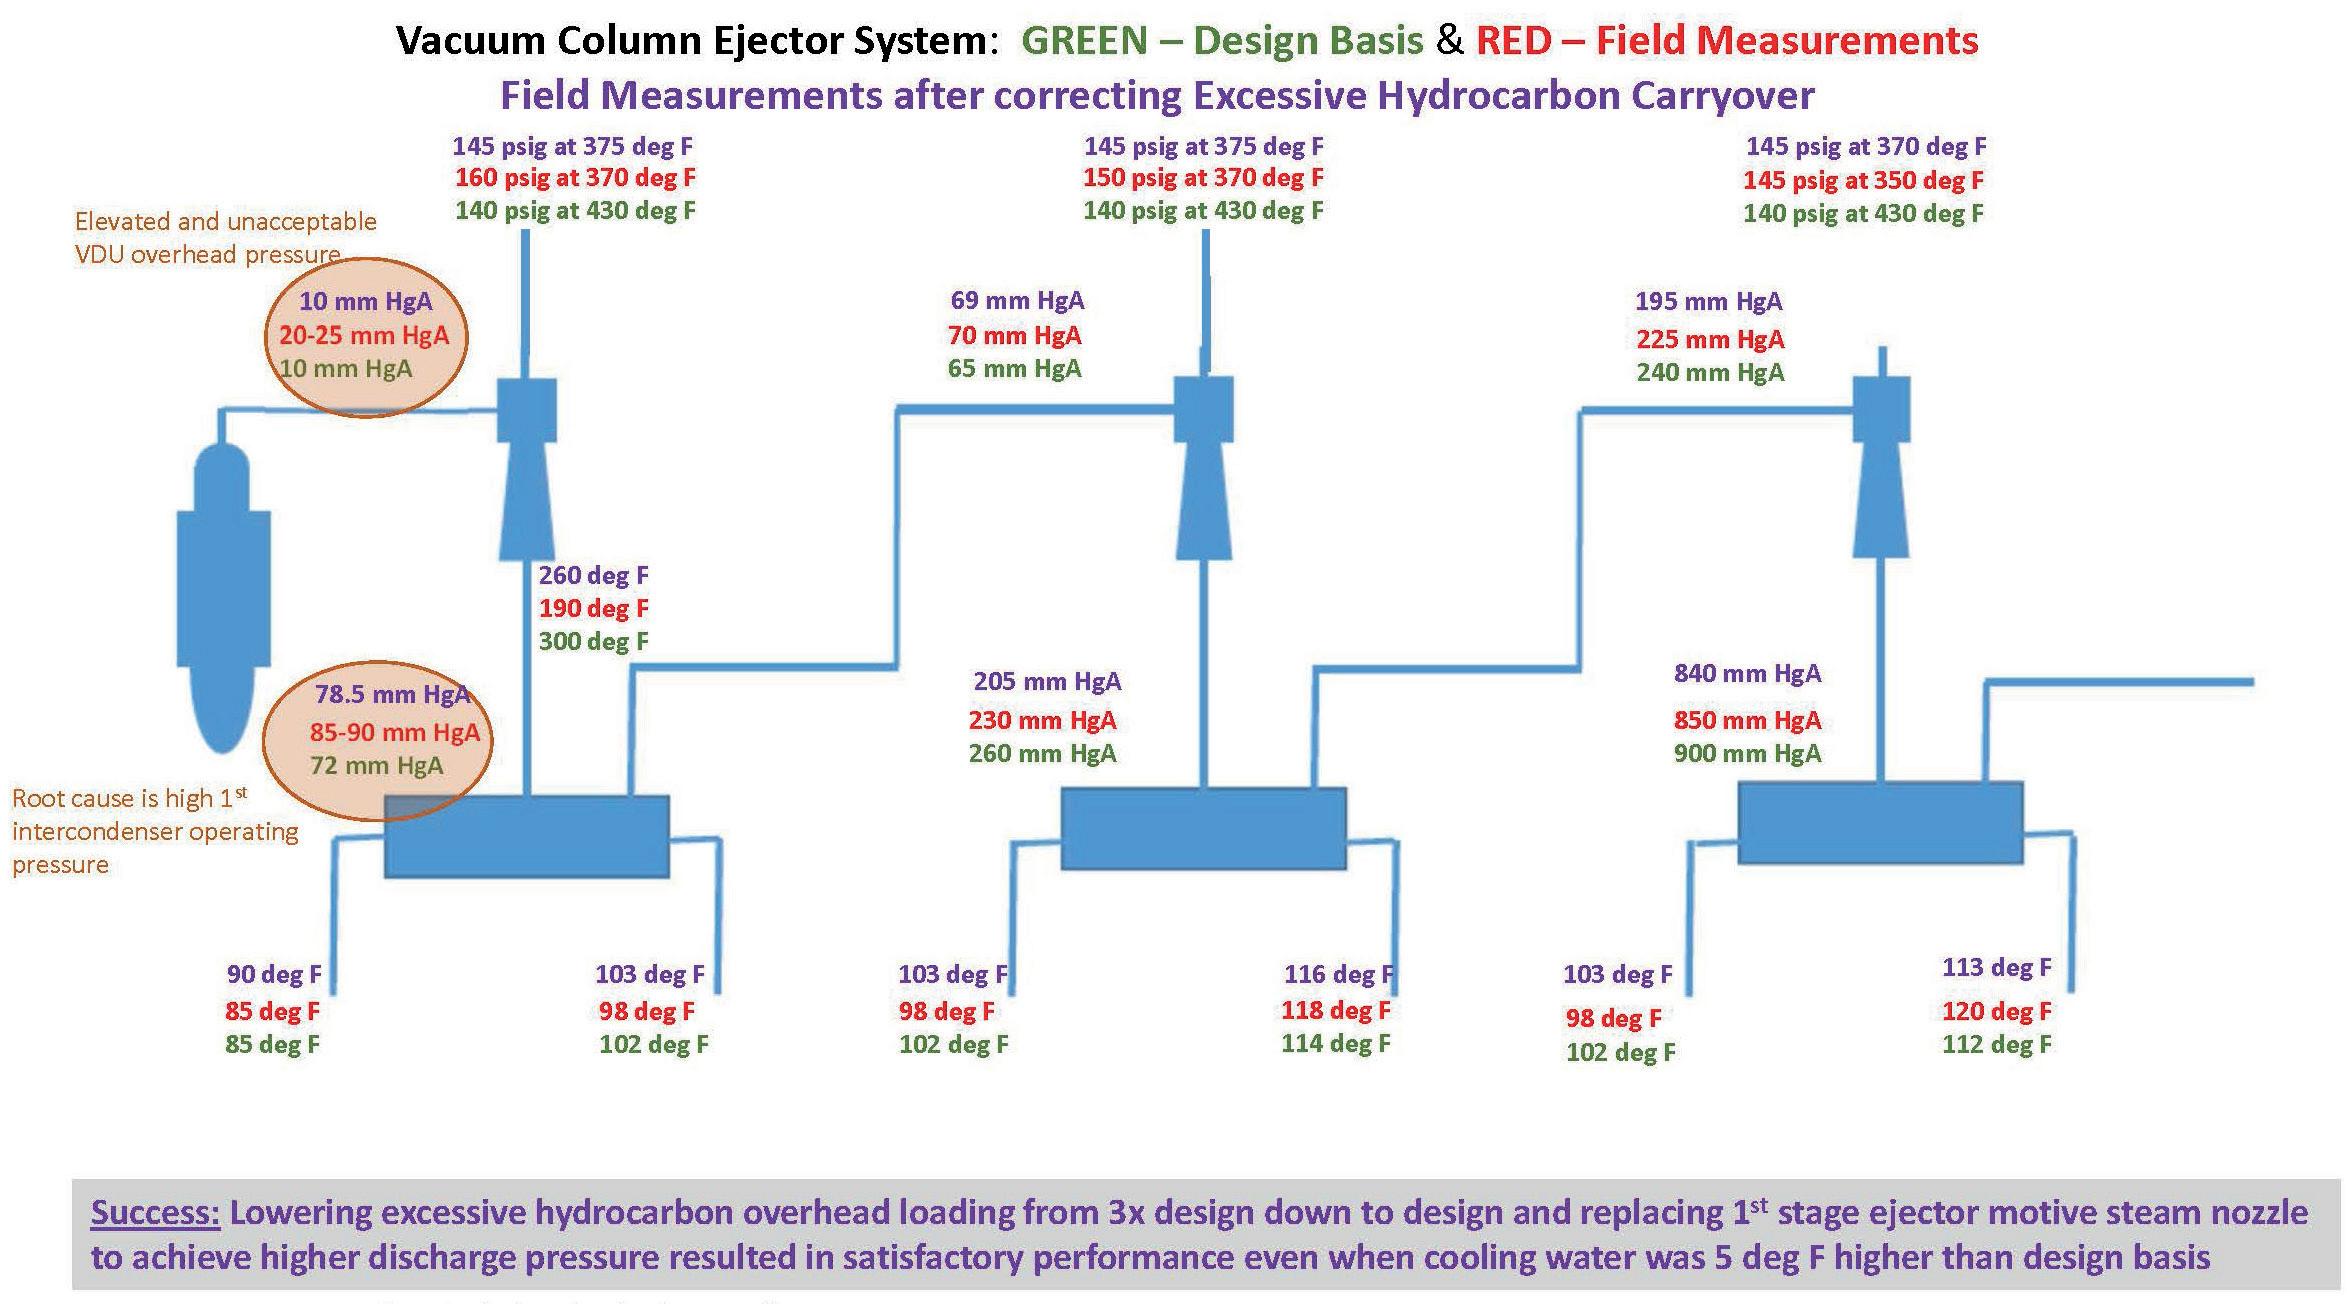
Case study 2: excessive hydrocarbon flow
A refiner was unable to achieve VDU column pressure from the commencement of commercial operation. Design column overhead pressure was 10 mm Hg abs. For most of the year, the overhead pressure was in the 12 – 15 mm Hg abs range. In the summer months, when cooling tower water was warmest, pressure would jump higher, to 20 torr or greater. The refiner was losing approximately US$10 million/yr in lost yield, due to increased vacuum tower bottoms.
There were a number of site visits by an engineer to perform pressure and temperature surveys of the ejector system (see Figure 2). A pressure and temperature survey of the ejector system in operation identified that the exhaust temperature for the first stage ejector was well below what is expected. Measured exhaust temperature was 190˚F, but was expected to be above 300˚F. There are two possibilities for the low exhaust temperature: poor quality motive steam supply conditions (wet steam), or liquid in the VDU overhead load. Steam supply conditions proved to be perfectly fine, with steam to the ejectors dry and superheated. This left two-phase VDU overhead as a possibility. The engineer requested trend
information on the slop oil from the three-phase separator in order to understand mass flow rate and composition of the hydrocarbon carried over from the vacuum column.
Hydrocarbon loading was confirmed to be excessive – three times the design level. Additionally, it was much heavier (higher MW and higher normal boiling point composition). The hydrocarbon in the overhead had a composition more weighted toward kerosene/diesel cut point material.
A rough estimate of vapour-liquid equilibrium indicated that at 12 – 15 torr and 150˚F, the hydrocarbon in the overhead load would consist of 8500 pph liquid mist droplets, and 5500 pph vapour.
The engineer and refiner discussed what might be causing such unusual levels of overhead hydrocarbon load, and why it is two-phase flow. The refiner advised that the tower top reflux spray distributor was allowing a lot of liquid entrainment in the overhead load. The engineer discussed their concerns, which were two-fold. Liquid droplets in the overhead load would negatively impact ejector performance; and the excess hydrocarbon and the fact that it enters the condenser as a two-phase flow would suppress the overall heat transfer rate within the condenser.
There are two adverse consequences from excess two-phase hydrocarbon loading in the overhead. One is that the first stage ejector maximum discharge pressure capability is reduced. Steam ejectors are momentum transfer devices, transferring momentum from high-velocity steam to entrain and accelerate vapours/gases. The presence of liquid droplets or mist diminishes the momentum transferred to gases due to the density of liquids being so much greater than that of gases.
The second is that the first intercondenser overall heat transfer rate will become suppressed due to the presence of much greater mass flow rate of hydrocarbon that initially wets the tubing at a much hotter temperature.
In this case, 8500 pph of entrained liquid in the overhead reduced the maximum discharge capability of the first stage ejector 4 to 5 torr. Additionally, the first intercondenser operated with a reduced overall heat transfer rate due to the excess hydrocarbon. The design outlet temperature was 95˚F, yielding 3400 pph of steam equivalent load to the second stage ejector. Due to excess hydrocarbon, the condenser was thermally limited, only able to cool and condense down to 100 – 101˚F. This resulted in the steam equivalent load to the second stage ejector increasing approximately 35% to 4500 pph. To reject the necessary heat and match the capacity of the second stage ejector, first intercondenser operating pressure
March 2023 HYDROCARBON ENGINEERING 62
Figure 2. Case study 2: pressure and temperature survey.
A Better Vanadium Trap for Increased Profitability

W. R. Grace & Co., the global leader in FCC catalysts and additives, pioneered the use of rare earth-based vanadium traps. Our latest advance in vanadium trapping is a catalyst which goes beyond Grace’s current premium technology.

PARAGON™ is a high-MSA catalyst solution which uses a novel, rare earth-based vanadium trap to deliver maximum bottoms upgrading and improved coke selectivity.
Go ahead, take on that heavier feed slate. With PARAGON™ technology and Grace working in your refinery, you can widen your operating window and increase your feed flexibility for greater profitability.
Talk with your Grace partner about the advantages of PARAGON™ technology today.
Learn more at grace.com
Expand your operating window and feed flexibility with PARAGON™ technology from the pioneers of V traps at Grace.
rose 3 to 4 torr, thereby increasing LMTD to compensate for a lower overall heat transfer rate. As a result, the first stage ejector operated in a broken condition during the summer months.
The refiner understood the issues at that point. Next came how to resolve the poor performance problem to achieve design capacity and yield from the VDU. Both the engineer and refiner felt that it was necessary to address the excessive hydrocarbon two-phase flow in the overhead. This would be addressed by adding a trough distributor into the vacuum column during an upcoming shutdown in order to reduce liquid entrainment.
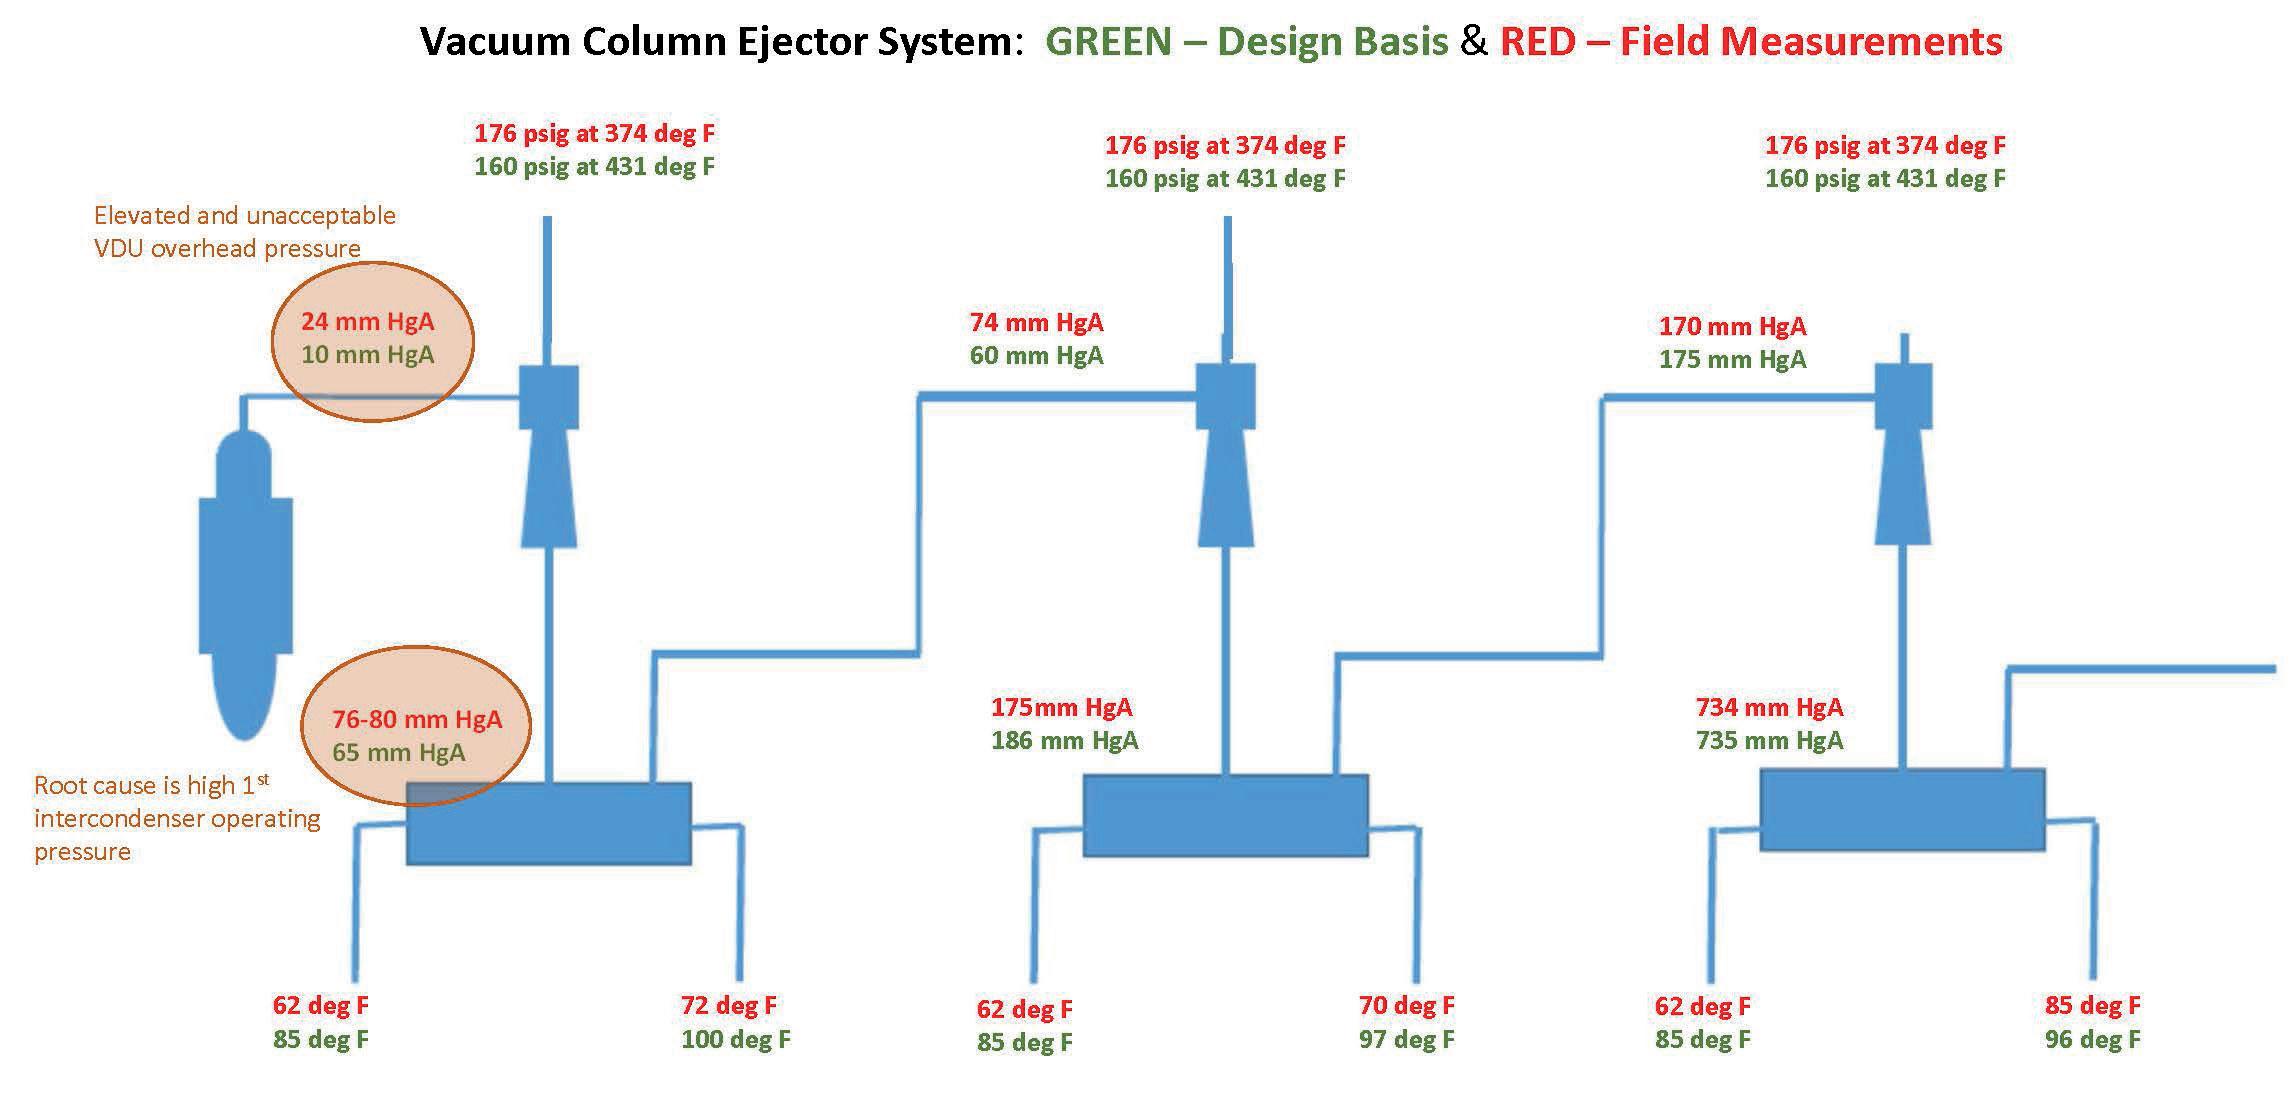
The refiner then asked whether it was possible to provide greater summertime flexibility and ensure no breakdowns during operation, and jump up into the 20 – 25 mm Hg range. The engineer felt that eliminating the excessive hydrocarbon loading along with droplets would be enough. However, the ejector motive steam nozzles could be replaced. Using the same motive steam consumption and the installed first stage ejectors, the new motive steam nozzles would have 5 mm Hg greater discharge capability – 80 mm Hg in lieu of current 75 mm Hg. Providing this added discharge capability would safeguard against performance break for up to 2.5 – 3˚F increase in water temperature above the design basis. However, the trade-off was 1.5 – 2 mm Hg increase vacuum column overhead pressure. The refiner went in that direction, willing to trade off 1.5 – 2 mm Hg in operating pressure to avoid 15 mm Hg higher tower pressure in the summer months.
The revamp added a trough distributor and the new steam nozzle for the first stage ejectors. Vacuum column overhead pressure after the revamp was 7 – 10 mm Hg, and slop oil rates confirmed hydrocarbon overhead load was closer to the 4000 pph design basis. The refiner realised anticipated economic gains from the revamp, and did not have summertime performance breakdown. In circling back to the refiner, it was confirmed that performance of the VDU was on-spec and there had not been a summertime performance break since the revamp.
Case study 3: non-OEM replacement equipment
A refiner had a vacuum distillation ejector system that was originally supplied in 1980 but that had its first intercondenser
removable bundle replaced in the late 2000s (see Figure 3). The bundle was designed, built and supplied to the refiner by a local shell and tube company rather than the OEM. The company did not have the OEM fabrication details for an in-kind replacement. After installing the new bundle, the refiner was unable to achieve required vacuum column operating pressure. Vacuum column overhead pressure was more than twice the expected operating pressure, holding 24 torr at the overhead at 50% of charge rate vs a design of 10 torr at full charge rate. The economic impact on the refiner was untenable.
The refiner returned to the ejector system OEM for assistance. A performance improvement engineer was dispatched, and a partial system pressure and temperature survey was completed for a quick assessment of how the system was performing. The first intercondenser was operating above its design operating pressure, even though the refiner was running it at about 50% charge rate. Motive steam supply condition was good; the first intercondenser performance did not hint at fouling or cooling water supply issues.
A thermographic scan of the first intercondenser was carried out. It was clear that there was maldistribution that lead to poor performance, as it appeared that flow was compartmentalised with certain cross passes unable to vent non-condensible gases.
The engineer requested the replacement bundle drawings or any pictures of it before they were installed. The drawings indicated that while a longitudinal baffle was included, as was true for the original design, the baffling was actually full tube supports. This resulted in compartmentalising flow. Each cross flow section of the bundle – the space between full tube supports – trapped gases and uncondensed vapour, as they were unable to pass longitudinally to the condenser vapour outlet connection, rendering a large percentage of the effective surface area unusable.
The shell and tube supplier, unfamiliar with vacuum condenser design, built the bundle like a complete condenser without noncondensible gases, assuming 100% of the flow would condense. That is never the case for ejector system condensers operating in VDU service or simply operating under vacuum. There was no way to make the existing new bundles work aside from adding a vapour outlet connection for each cross flow compartment, which was not practical. On an emergency basis, the refiner ordered a replacement bundle from the OEM, built to the original design.
Performance returned to satisfactory condition upon installing a correctly-built first intercondenser bundle. It was a costly undertaking for the refiner to replace recently-purchased tube bundles, and the process incurred lost revenue from an unscheduled shutdown between turnarounds.
March 2023 HYDROCARBON ENGINEERING 64
Figure 3. Case study 3: pressure and temperature survey.
PETROLEUM & PETROCHEMICAL CATALYST RECYCLING EXPERTISE
With best-in-class techniques and over seven decades of experience, we deliver the highest possible metal returns for our customers.
We recover and refine precious metals from petroleum catalysts and materials used in processing from various supports, including Carbon, Zeolite, Silica-alumina, and Soluble and insoluble alumina. Also, our proprietary Pyro-Re® process o ers the only pyro-metallurgical recovery of rhenium in the industry. With it, we recover total rhenium content from spent semi-regenerative and cyclic fixed-bed hydrocarbon processing catalysts—and get you a full return.
Find out more about Sabin Metal Corp’s services, operations, and why a partnership with us is the right choice at sabinmetal.com

Case study 4: mechanical damage
A refiner was experiencing poor vacuum column performance and had noted differences in the thermal scan imagery between parallel 50% precondensers. The imaging suggested that there was some type of flow maldistribution negatively impacting one precondenser (see Figure 4). Flow maldistribution led to poor condensation and heat rejection by the precondenser, ultimately increasing vacuum column pressure.

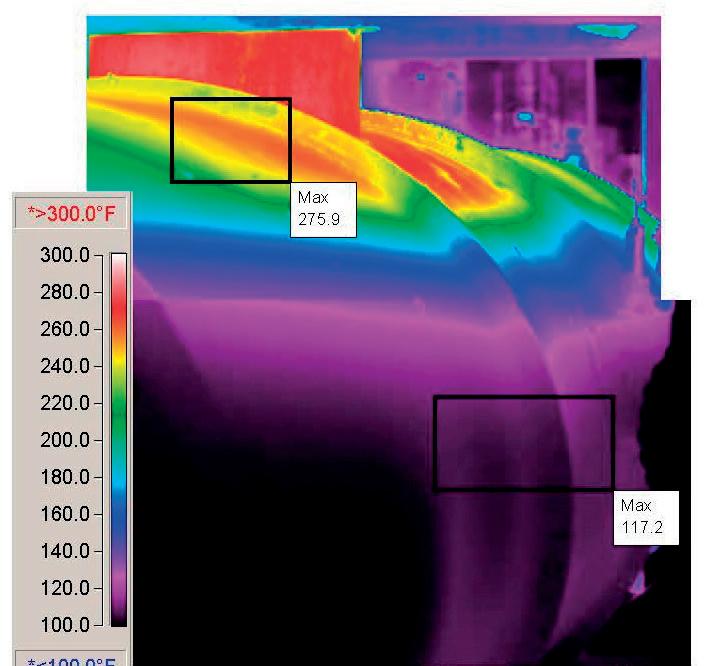
It was not necessary to conduct a performance survey. It was evident that there was a mechanical issue with one of the precondensers; most likely there was failure at the seal strips, which aid in blocking flow from entering a particular section of the tube bundle and directing flow into the primary condensing section.
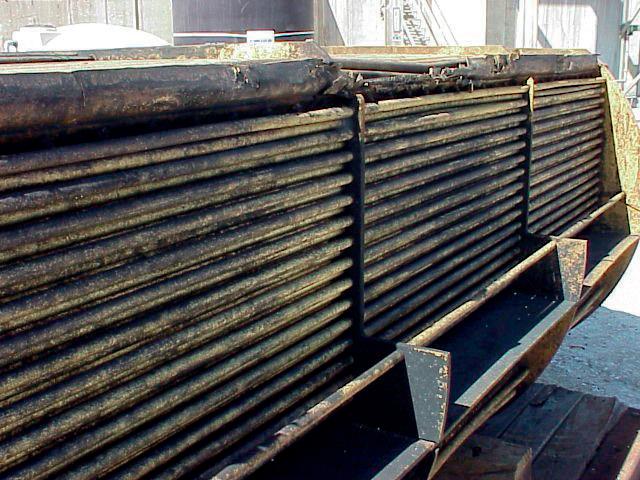
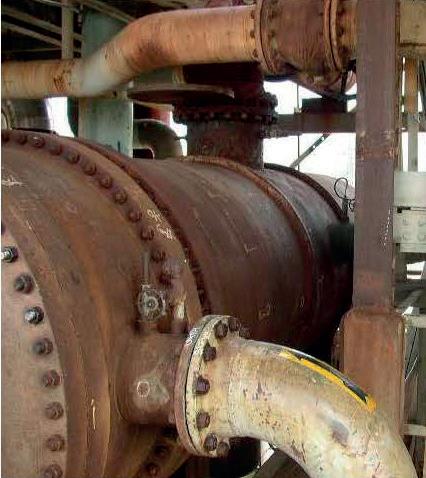
The engineer requested that the bundle be pulled from the poorly-performing precondenser. It was confirmed that the sealing strips had failed, and this permitted short circuiting of the vapour flow bypassing the primary condensing section of the bundle and flowing directly to the vapour outlet connection (see Figure 5).
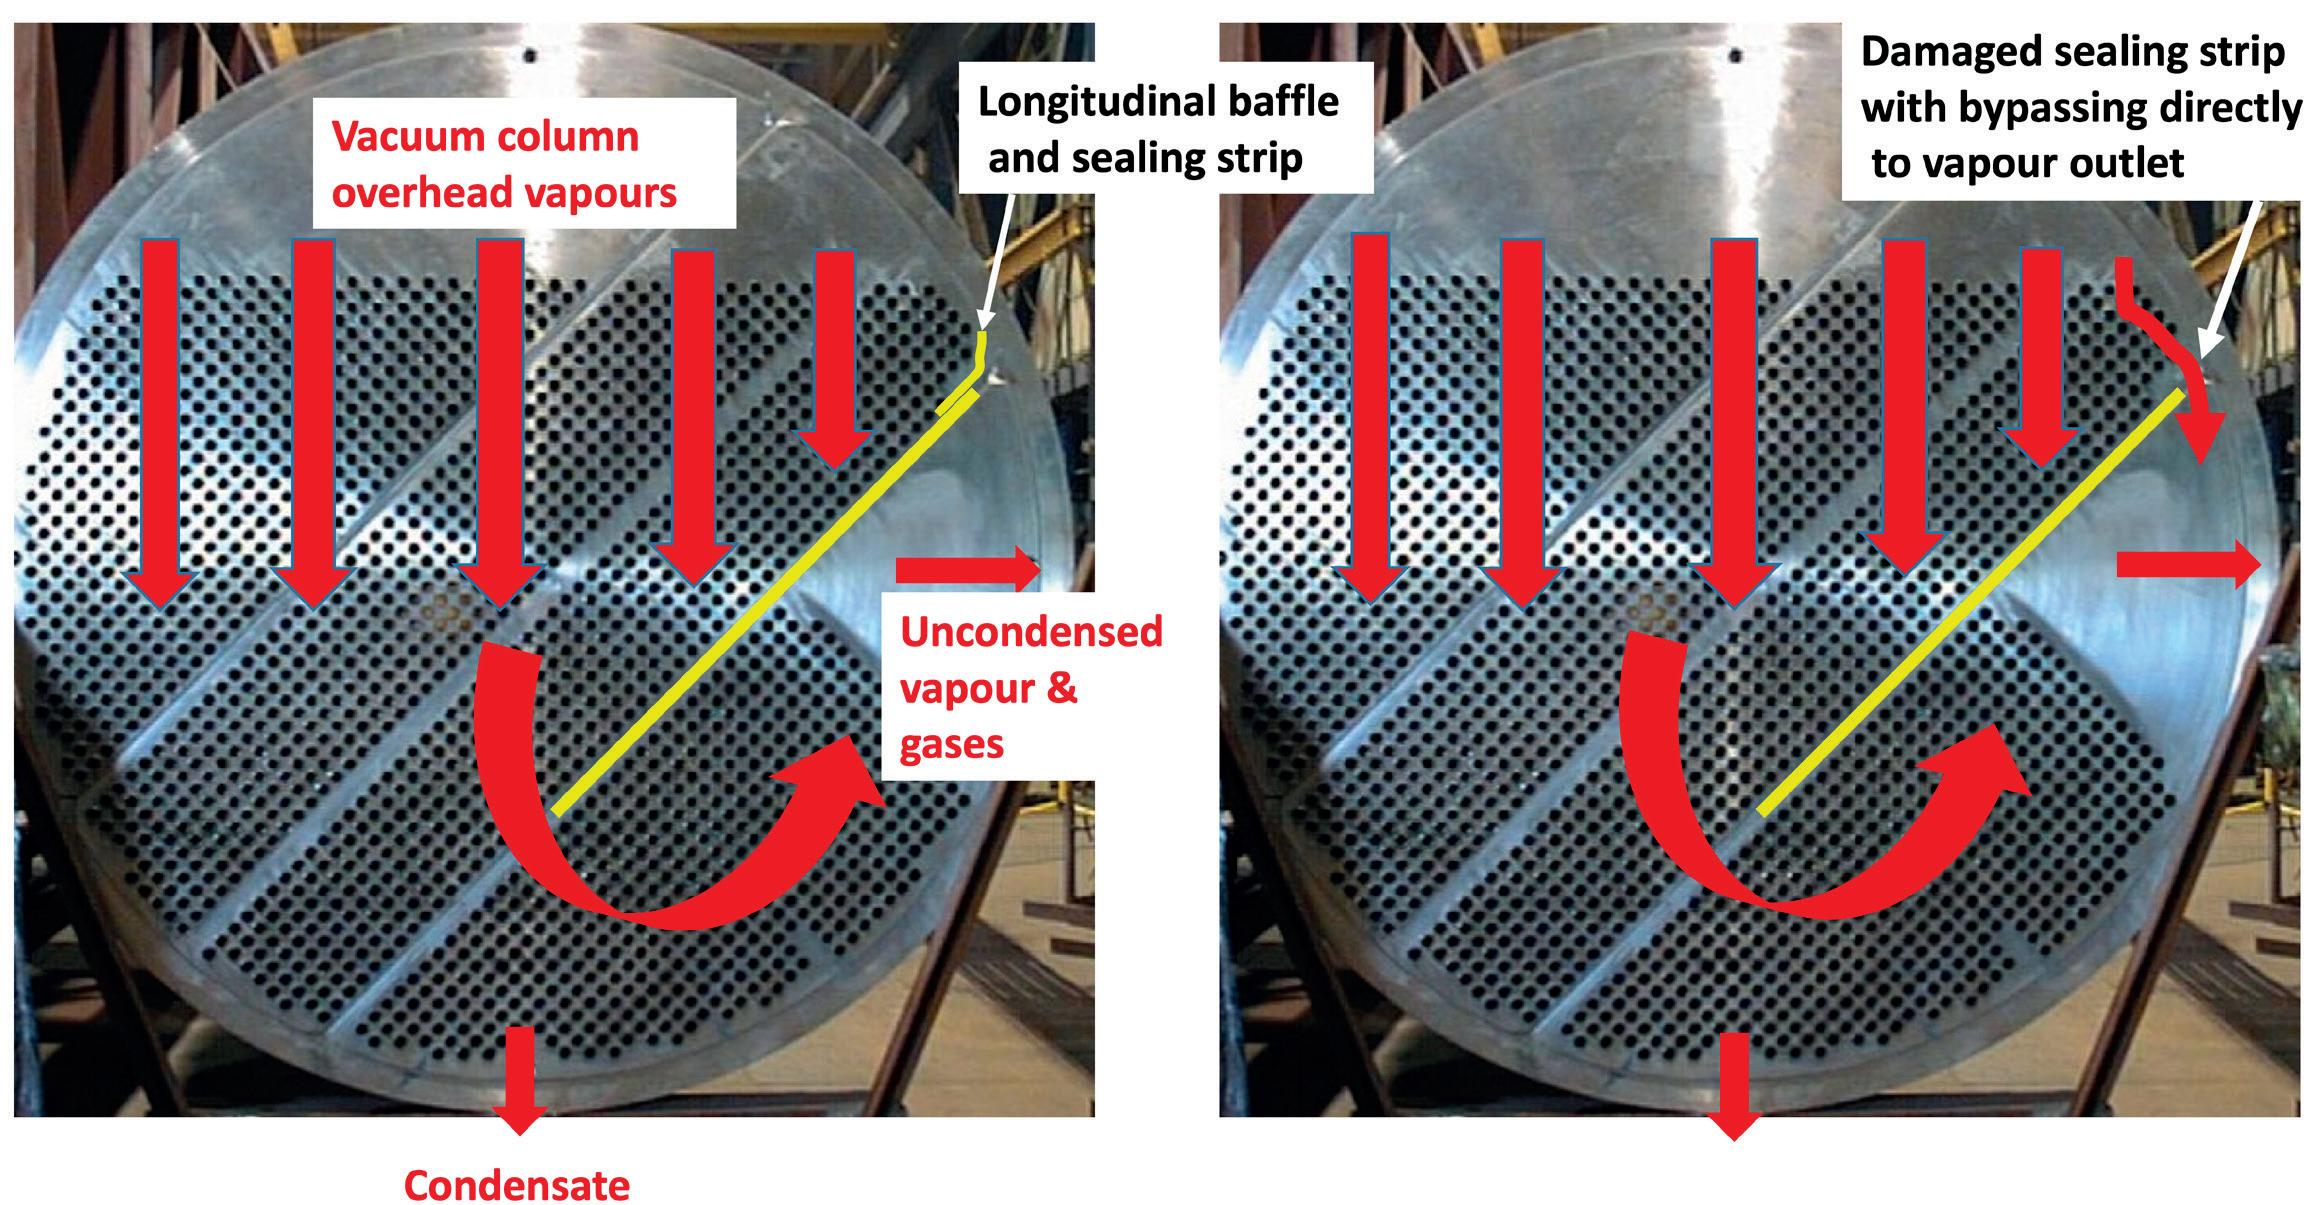
Sealing strips can become damaged during bundle insertion or pulling, and due to corrosion or erosion. In this case, the brass sealing strips experienced corrosion or erosion damage where the vacuum column overhead vapours entered the precondenser at 300 ft/sec. To provide operational reliability, the bundles were replaced with a design that did not require seal strips. An alternative consideration was to replace the tube bundles with duplex tubing, bundle cage and sealing strips. However, the refiner elected to utilise a TEMA ‘E’ vs an ‘X’ shell configuration.
Conclusion
An ejector system does provide reliable performance and enable refiners to achieve the established operating objectives for VDUs. As with any process equipment, performance limitations or shortcomings can arise. Having trend data for the ejector system, as well as system performance surveys that collect relevant pressures, temperatures and flow rates, is always helpful. It is best to not jump to conclusions or take corrective action hastily, but rather to conduct a methodical performance evaluation and outline potential root causes, working through the analysis with the ejector system OEM and process licensor when appropriate. Ejector system suppliers with staff dedicated to field performance assessment and improvement have a wealth of experience that can be brought to bear for a unique performance shortcoming. Additionally, suppliers with R&D and Production Test Facilities will have thousands of data sets for how ejectors respond to various operating conditions.
It is always beneficial to have a benchmarking performance survey during summer months. This is when an ejector system is usually operating under the most extreme conditions, when cooling water is warmest. From a planning perspective, carrying out a performance survey approximately 18 – 24 months before a planned shutdown/turnaround is also a good idea. If large maintenance CAPEX is needed, this planning will permit ample time to identify opportunity for performance improvement and to fabricate required replacement or upgraded equipment.
Bringing ejector system suppliers into troubleshooting early can quickly help a VDU to perform well. Bringing together three key stakeholders to discuss the performance issue is also valuable. It is not uncommon that the views and interpretation of the observations or root cause will vary. Sometimes this is because data and background may unwittingly not be fully provided by stakeholders. Through healthy and open dialogue among the stakeholders, a deeper understanding evolves, resulting in consensus for root cause and remedy. All three stakeholders have the same objective: enable the refiner to achieve operating and economic objectives. When all three come to the troubleshooting table with refiner needs, ahead of self interest, the best outcome for the refiner is found.
March 2023 HYDROCARBON ENGINEERING 66
Figure 4. Thermographic image of properly and improperly performing parallel vacuum precondensers.
Figure 5. Failed sealing strips (left), proper flow pattern (middle), and improper flow (right).
TRI-BLOCK Double Block and Bleed Valve SIL3 WWW.ZWICK-ARMATUREN.DE
TAKE-OFF. FROM AMBITION TO ACTION.

Ramp up production of sustainable aviation fuel. Together we can transform the aviation industry’s carbon intensity for the better. Keep planes in the air, and still be on track to zero. SAF reduces CO2 emissions by at least 85% when compared to conventional fuel. And we have the proven technologies to make it all happen. Now.
Turn your sustainable ambitions into a sustainable business. Join Flight Plan Green. Find out how: topsoe.com/saf


HYDROGEN CONFERENCE 23


VIRTUAL CONFERENCE 20 APRIL 2023


FLIGHT PLAN GREEN
An interactive Virtual Conference showcasing the innovative technology and solutions that are advancing the hydrogen industry worldwide. Register for free here: https://bit.ly/3jtoh4h


With participation from:

The processing and refining industries commonly use tube-side condensers when driven by requirements such as low inventories, use of expensive pressure- or corrosion-resistant materials, or as a necessity in air-cooled heat exchangers.
When condensing single-component vapours, heat transfer coefficients tend to be high. The situation changes when condensing multi-component mixtures. Under such conditions, the performance of condensers is often controlled by the additional limitations of vapour cooling and mass transport between the liquid and vapour phases, particularly when designing for low vapour velocities.
It is possible to improve several aspects of the tube-side condensation process. The flow regime can be significantly altered, allowing for potential benefits to heat and mass transfer.
This article will use an industrial case study as an example of how to ascertain which variables are important to consider in order to determine whether it would be beneficial to install tube-side enhancement technology.
Condensers: an introduction

Condensers are an important piece of equipment for the chemical processing and refining industries. They are a necessary component of many processes, i.e. overhead condensers for distillation columns, and as separators of volatile and condensable products. They are also a key feature of HVAC-R systems.
There are different options for the design of shell-and-tube condensers in particular, with condensation possible on the shell-side or tube-side, and in vertical or horizontal arrangements. When the condensing fluid is allocated to the tube-side, the presence of two-phase flow introduces complexities in the thermal design. An incremental calculation is needed, and it becomes necessary to consider how different flow regimes will affect the heat and mass transfer within the tubes. This can make the creation of an efficient and reliable design more difficult.
The application of tube-side enhancement devices can provide significant benefits in many applications.
March 2023 69 HYDROCARBON ENGINEERING
Nathan Hill, CALGAVIN, UK, discusses how to increase product retention through retrofitting condensers.
CALGAVIN’s hiTRAN® Thermal Systems technology is a form of a removable wire matrix-type enhancement device, consisting of a pattern of wire loops supported by a central core wire (see Figure 1). In general, it increases the single-phase convective heat transfer coefficients, helping to accelerate the rate of vapour cooling. Also important in multi-component condensation, the device improves mass transfer and disrupts the interface between the two phases. This can ensure that condensable vapour is continually transferred toward the cold tube wall, and that the liquid is redirected into the bulk flow.
Pure component condensation
It is useful to first consider the simplest case of pure component condensation – where there is only a single substance present within the tubes – and how the characteristics affect heat transfer.
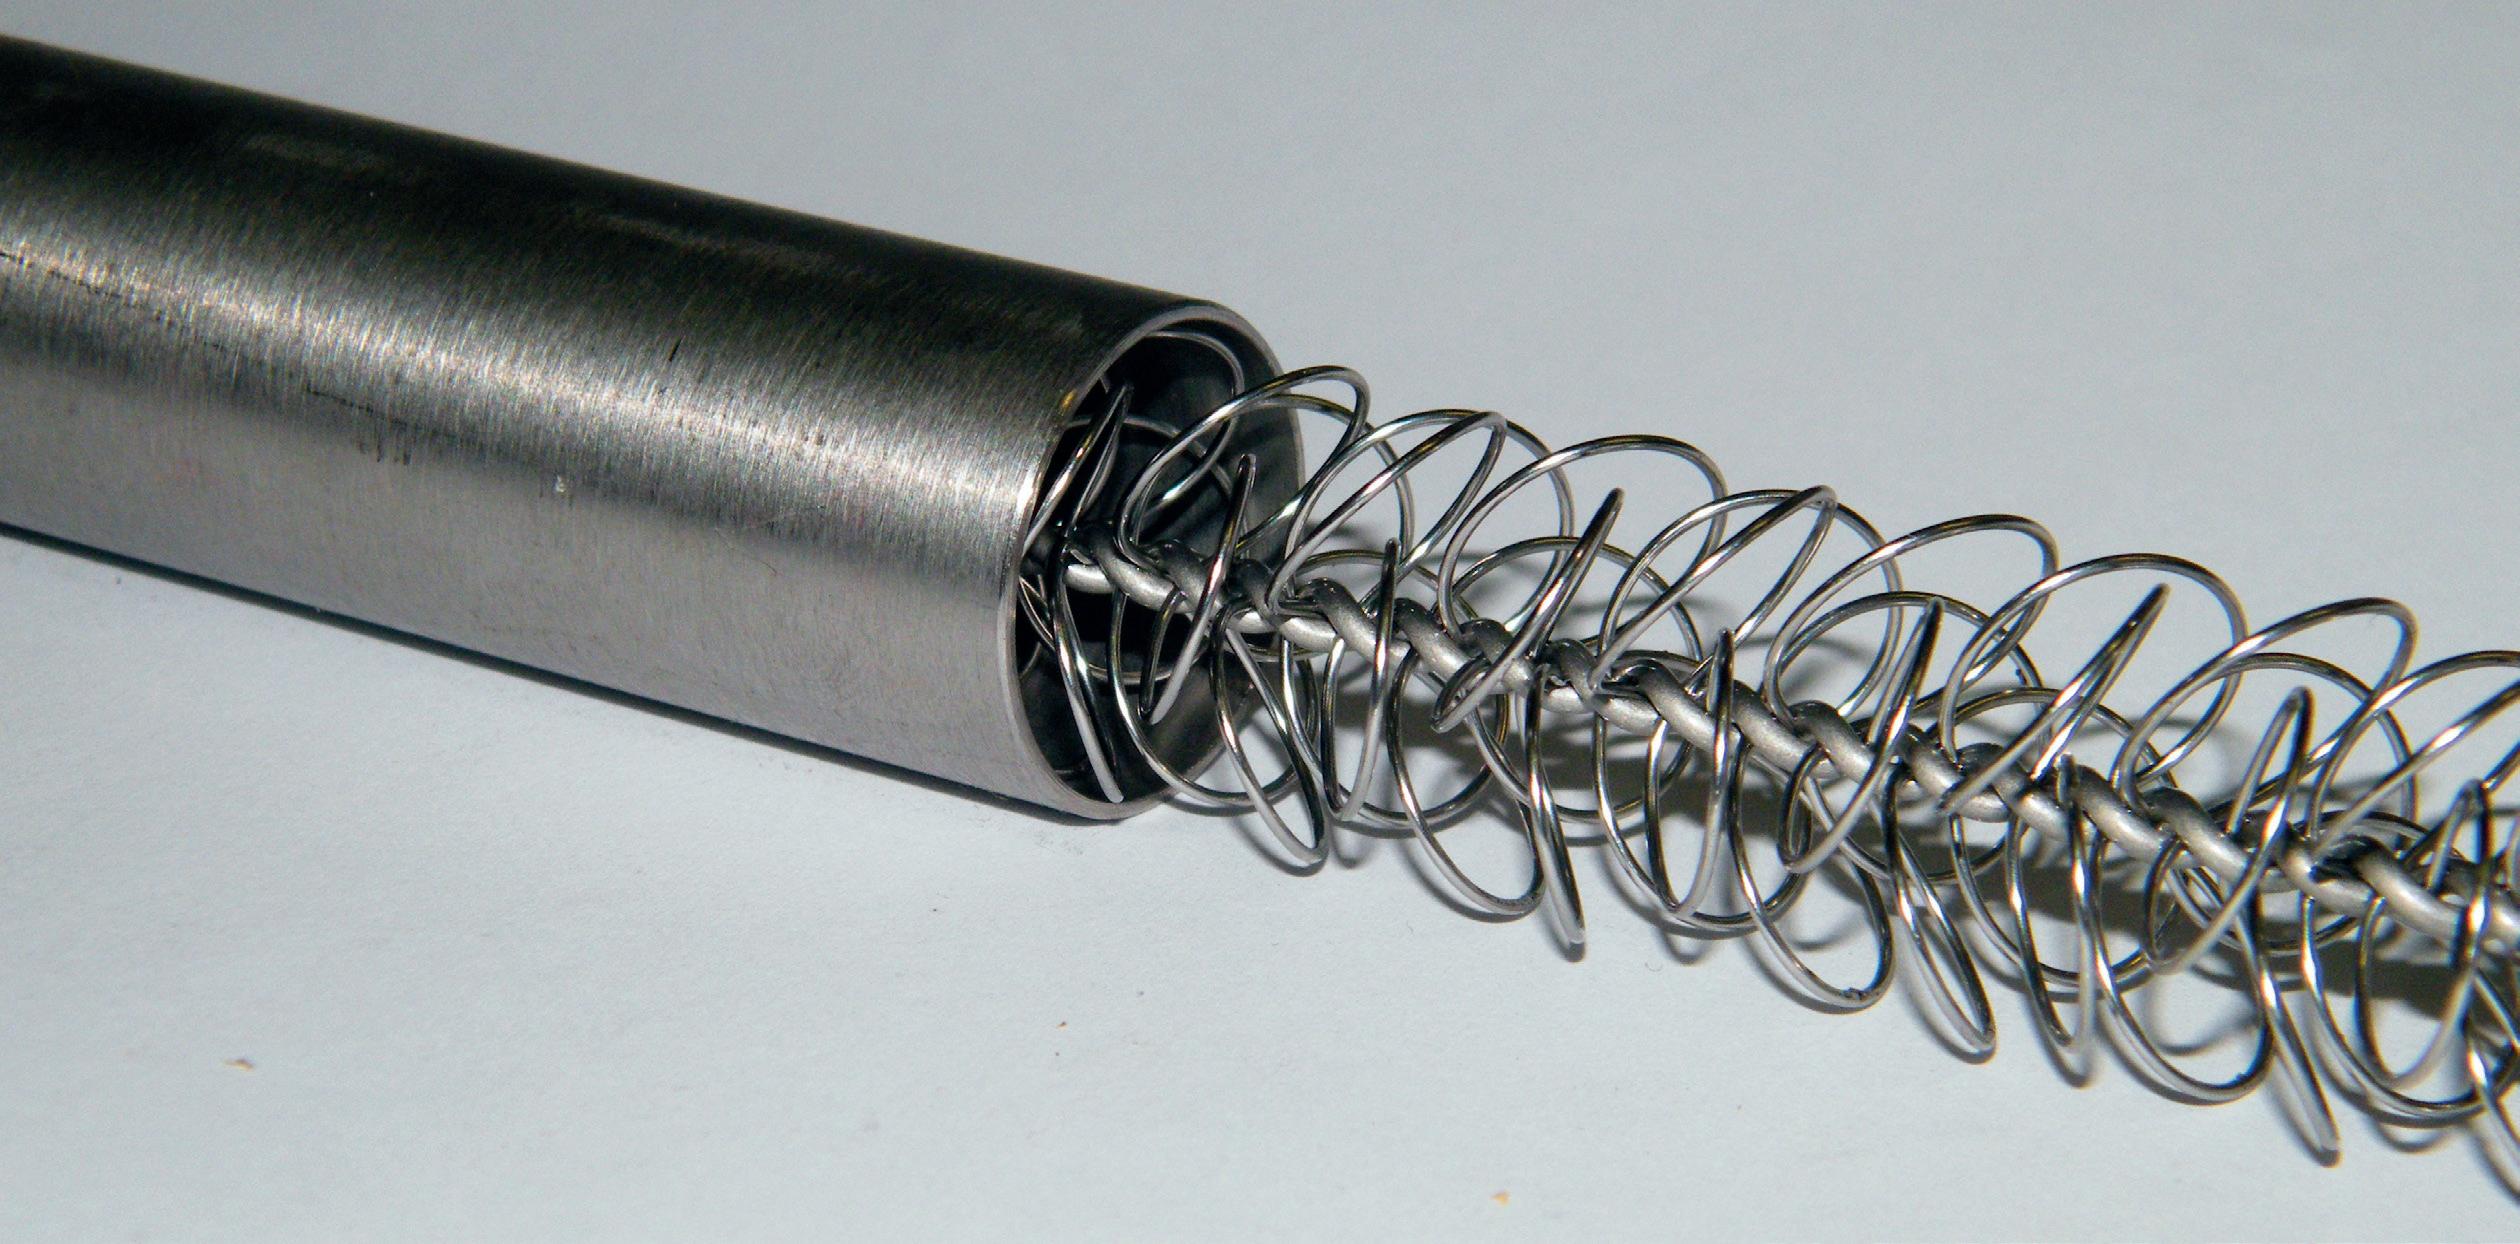
In pure component condensation, there is no change in the concentration of the condensing substance throughout the tube. As such, there is no mass transfer resistance preventing the vapour from reaching the cold liquid interface. Meanwhile, the bulk temperature is uniform and equal to the saturation temperature at the corresponding vapour pressure.
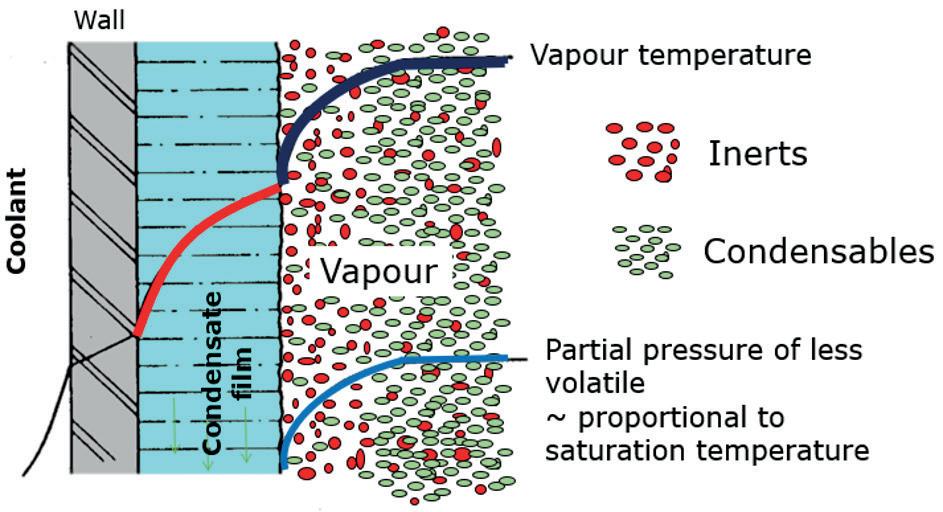
As the vapour condenses, a layer of liquid forms on the tube wall (see Figure 2). The thermal conductivity of the liquid film causes additional thermal resistance, reducing the rate of heat transfer from the condensing vapour. The thermal resistance through the liquid condensate often dominates. Only at near-complete condensation, where the vapour velocities are much slower, does the convective heat transfer of the vapour become a significant factor.
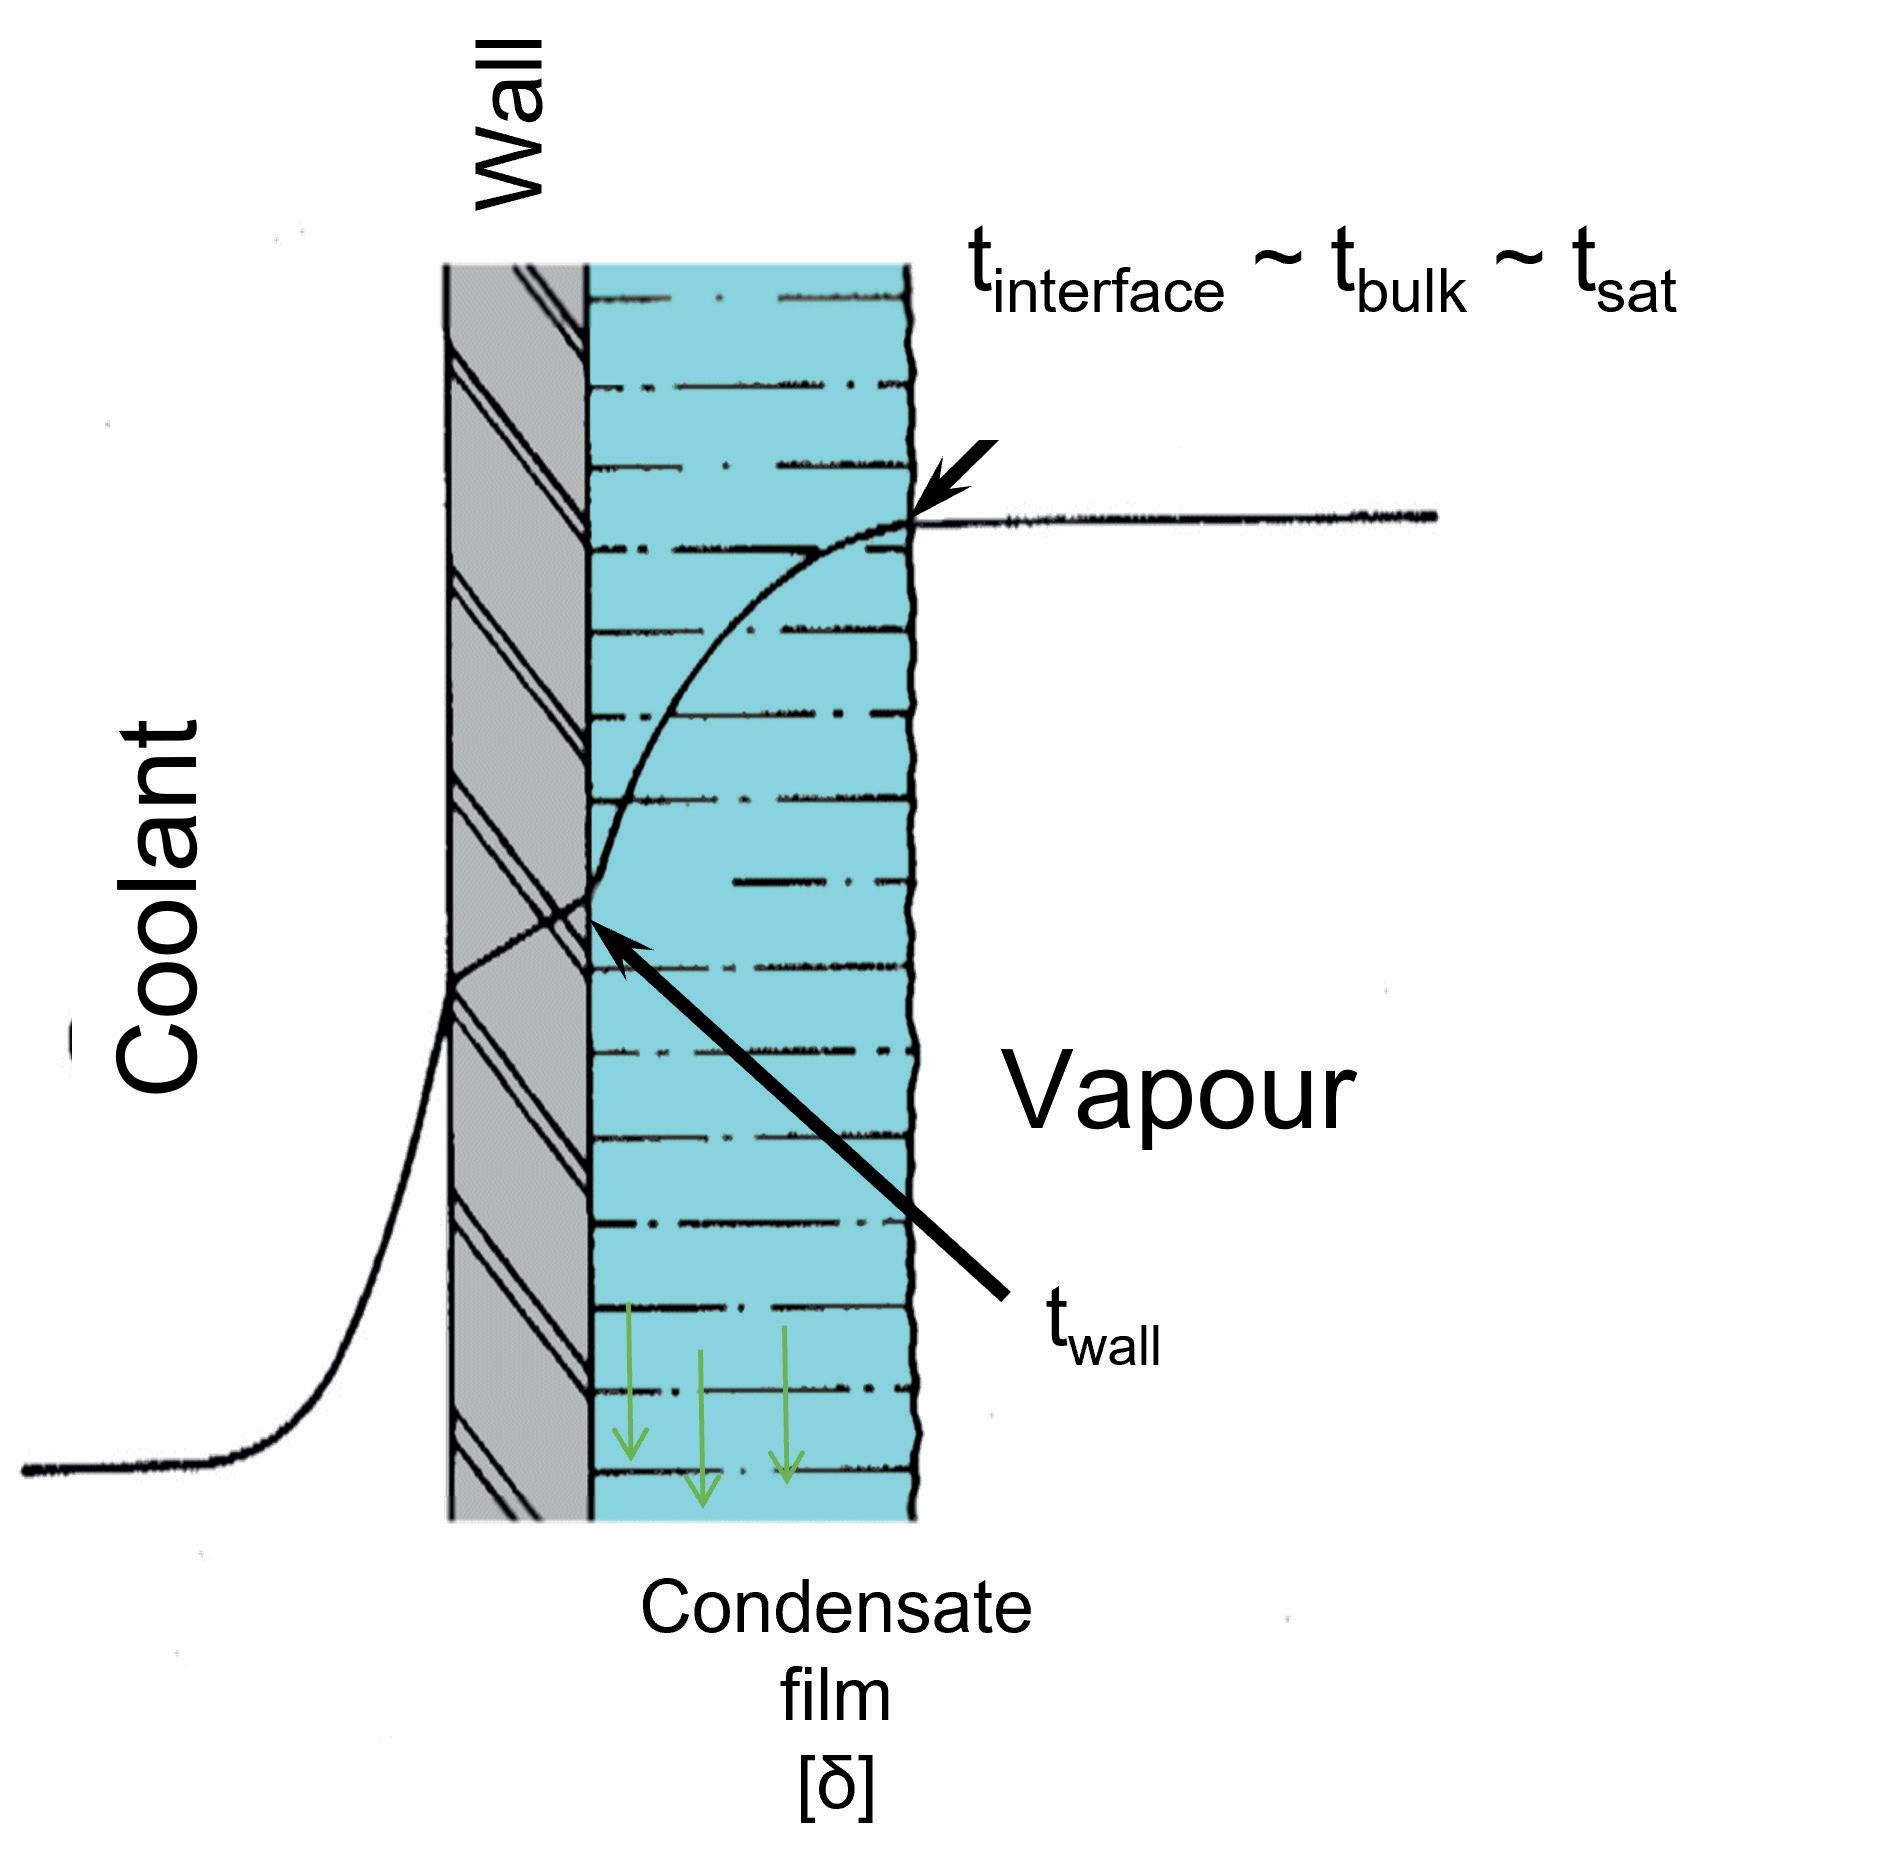
Because the thermal conductivity is an intrinsic property of the liquid, applying hiTRAN in pure component condensation tends to have a minimal effect on the heat transfer rate. The increase in pressure drop also tends to decrease the saturation temperature, therefore reducing the effective temperature difference, which often offsets any heat transfer increase. An overall benefit may be realised towards the end of the condensation process, where the flow velocities are lower, by enhancing the convective heat transfer.
Multi-component condensation
When condensing mixtures containing multiple – or non-condensable – components, the process can change fundamentally. Firstly, the vapour temperature is not constant along the condensing path. As each component condenses, the mole fraction and partial pressure of the less volatile components in the vapour reduce, and this in turn decreases the associated saturation temperature. This introduces a requirement for sensible cooling of the vapour, in addition to the removal of the latent heat, in order to advance the condensation process.
The second major difference vs single-component condensation is that the concentration of the different components is not necessarily uniform over the cross-section of the tube. The less volatile components condense close to the cold liquid film, depleting the region of condensable molecules (see Figure 3). Due to the change in concentration, the local saturation temperature decreases and reduces the temperature difference across the vapour-liquid interface. Furthermore, the concentration gradient also creates a mass
March 2023 HYDROCARBON ENGINEERING 70
Figure 1. A hiTRAN wire matrix element.
Figure 2. Temperature profile across a vapour-liquid interface.
Figure 3. Temperature profile across a vapour-liquid interface with inert components.
TEMA type AEM Orientation Vertical Number of tubes 76 Tube length 3.677 m Tube diameter 19.05 mm
Table 1. Geometry of the heat exchanger for case study
transfer resistance, preventing condensable components from reaching the liquid film.
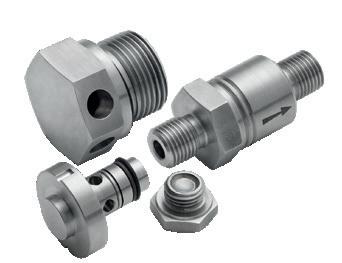


Both of these effects can substantially affect the heat flux, particularly towards the end of the condensation path where the lower vapour velocities lead to lower vapour phase heat transfer coefficients. It is in under these conditions that the use of hiTRAN can offer the greatest benefit. Enhancement of the single-phase heat transfer coefficients aids cooling of the vapour, and the induced turbulence improves mixing of the different components. Furthermore, the lower velocities in this region bring about a lower pressure drop penalty and less effect on the condensing temperature. Due to the effect of momentum recovery, it is sometimes the case that the pressure drop penalty with hiTRAN will be lower, compared to an empty tube.
Case study
CALGAVIN was contacted by a customer to evaluate the potential for correcting the observed under-performance of a vent gas recovery condenser. The condenser was part of a refrigeration system that utilised a mixture containing liquid polypropylene as the refrigerant. It was a crucial component to recovering the polypropylene from a waste stream, as this stream would otherwise continue onto a flare header, resulting in the irrecoverable loss of the product. The objective was to reduce the mass fraction of polypropylene in the vapour by increasing the degree of condensation.
Tables 1 and 2 show the key geometry information and process conditions of the heat exchanger in question. The first important observation is that the heat transfer coefficient of
the condensing product on the tube-side was much lower than that of the evaporating feed stream on the shell-side. Hence, the overall heat transfer coefficient was more strongly controlled by the tube-side, which meant that applying enhancement to the tube-side would likely have a significant effect overall.
Focusing on the tube-side heat transfer performance, a plot of the cumulative duty against temperature and vapour fraction highlighted the areas of concern (see Figure 4).
Throughout the full length of this condenser, the vapour temperature decreases rapidly as the condensation proceeds, indicating a significant requirement for vapour cooling. In total, more than 40°C of sensible cooling was required simply to maintain the vapour mixture at the condensing temperature, in addition to the latent heat removal. Under these conditions, the vapour phase heat transfer was controlling thermal resistance.
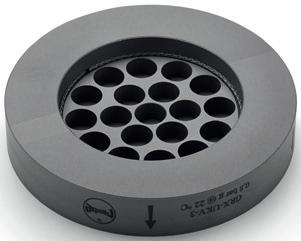
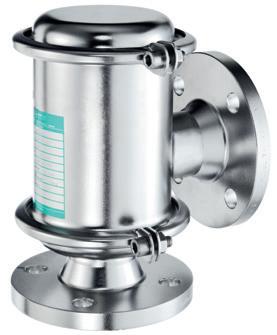
Owing to the nature of the mechanical design of the exchanger, which was made in three sections that were then fixed together to form the body of the whole heat exchanger, a full-length installation of hiTRAN elements was not possible. Using the thermal design model that CALGAVIN had created, it was established that the section of the interchanger where the most significant duty took place was the bottom third. As such, the hiTRAN elements were designed to fit only the bottom section of the exchanger in order to provide the maximum level of enhancement within these limitations.
After start-up, the measured plant data was able to confirm the predicted increase in performance. The outlet temperature of the condenser decreased from 10°C to -23°C
REMBE® Your Specialist for Pressure Relief Solutions. © REMBE® | All rights reserved rembe.com hello@rembe.com 9567 Yarborough Rd. | Fort Mill, SC 29707, USA T +1 704 716 7022 hello@rembe.us
with the hiTRAN elements installed. The mass fraction of polypropylene of the outlet stream correspondingly reduced from 25% to 6%. The reduction in mass fraction was equivalent to a quantity of 476 tpy of the polypropylene at the design flow rate. This led to a substantial improvement in operating costs of the process, as more product was able to be recovered, and less vapour flared off.
Economic evaluations carried out by site engineers concluded that the propylene savings made from this installation had a payback period for the project of less than one month, which exceeded initial expectations.
Conclusion

Through in-house experimental data and customer feedback, CALGAVIN has seen that the performance of hiTRAN can be modelled reliably in condensing processes. Through modelling and analysis, cases where there is a potential for enhancement can be identified. While there is limited potential in pure component and shear-controlled conditions, there are much greater benefits in multi-component applications involving gravity-controlled flow. The installation of hiTRAN can also be targeted specifically in areas of the tubes where there is the greatest benefit overall.
This article has demonstrated the benefits that enhancement technology can offer to improve the performance of existing condensers. The use of such technology is not restricted to retrofitting existing equipment; it may also be utilised in new designs to reduce the size of a condenser and alleviate uncertainties in the calculations.


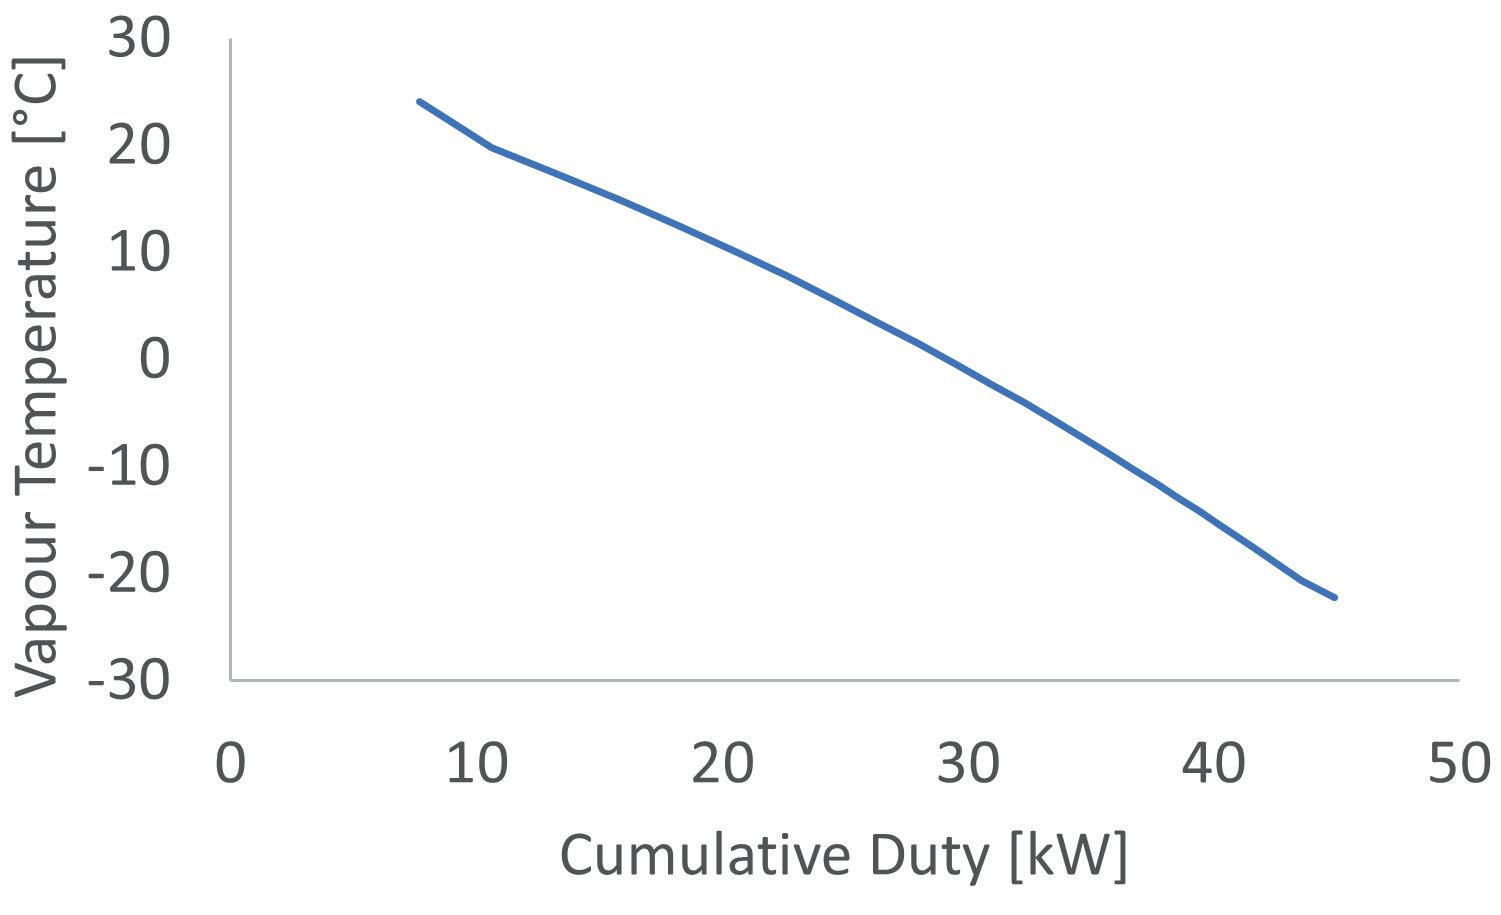 Figure 4. Integral condensing curve and vapour fraction along the condensing path.
Shell-side Tube-side Fluid Feed stream Waste stream Mass flow (kg/hr) 412 843 Temperature in/out (˚C) -38 -21 27 -23 Vapour fraction in/out 0.1 1 0.74 0.41 Inlet pressure (bar) 1.55 40.3 Heat transfer coefficient (Wm2-K) 1000 160 Need a reprint?
reprints@hydrocarbonengineering.com
Table 2. Process conditions of the heat exchanger for case study
+44 (0)1252 718999
We can tailor to your requirements, produce 1 - 12 page formats, print colour or mono and more
Processing and refining hydrocarbons ultimately requires the use of high heat for a number of critical steps, and heaters based on fossil fuels have traditionally filled those roles. But with mounting pressure to mitigate carbon dioxide (CO2) emissions and advance long-term decarbonisation goals, engineers have been exploring the potential for electric process heaters. This would allow several heating steps to be completed using clean electricity from renewable sources.
Importantly, replacing fossil fuel heaters with electric heaters would allow for a reduction in Scope 1 CO2 emissions. Scope 1 emissions are the direct result of burning fuels such as natural gas or fuel oil for process heating. Scope 2 emissions result from the need to import energy, while Scope 3 emissions are produced while using a product (e.g. emissions from car and truck tailpipe emissions). All three types of emissions must be reduced in order to hit decarbonisation targets.
What is holding back Scope 1 emission reduction?

An informal survey of Watlow® customers and prospects has revealed that 90% of oil and gas leaders are already actively engaged in decarbonisation efforts. Hydrocarbon processors are no longer focused on whether they should decarbonise, but rather on how they will decarbonise.
The question is: why are electric process heaters not more ubiquitous in the energy sector today? Surprisingly, familiarity might be the main reason. Until now, such heaters have only played very limited roles in hydrocarbon processing and have tended to be smaller, operating at lower voltages. Although larger heaters are easily imaginable, engineers recognise that a number of questions then arise when it comes to their control and maintenance. In short, no one wants to be first when it comes to running larger medium-voltage thermal systems.
March 2023 73 HYDROCARBON ENGINEERING
Dennis Long, Watlow, USA, explains the role that electric process heaters will have to play in the decarbonisation of hydrocarbon processing.
What engineers might not know is that medium-voltage process heaters have been developed and used, and their operation is already well understood. Implementing such heaters simply requires having the right technical experience, and this is experience that is made possible by contracting with the right partners.
The good news for industry is that modern electric heaters can provide the same – or improved – performance that hydrocarbon engineers have come to expect from fossil fuel-powered heaters, and thus can play a key role in decarbonisation efforts.
Rethinking the size and scope of electric heaters

To even consider replacing fossil fuel-burning heaters, there needs to be a clear understanding of the current capabilities of electric process heaters. Replacement does not make sense to begin with if electric heaters do not come with the required size and power needed to heat processes that currently
depend on fossil fuels. Many of those processes would require larger electric heaters well above the well-known 1 MW variety, for example:
n Feed/product exchanger, 2 MW (or larger).
n Dehydration inlet preheater, 3 MW (or larger).
n Heater treater, 4 MW (or larger).
n Molecular sieve regenerator, 6 MW (or larger).
n Waste gas heater, 6 MW (or larger).
n Once-through steam generator, 20 MW (or larger).
n Crude heater, 28 – 200 MW (or larger).
n Hot oil heater, 32 MW (or larger).
n LNG vaporiser, 34 MW (or larger).
n Thermal oxidiser, 54 MW (or larger).
n Hot water heater, 56 MW (or larger).
n FCC heaters, 150 – 200 MW (or larger).
Fortunately, heaters that can handle these power requirements do exist. In terms of physical size, 60 in. nominal pipe size (NPS) tubesheets are highly attainable. Nothing prevents even greater sizes; the technology exists to produce electric heat exchangers of physical size comparable to a shell and tube heat exchanger. An electric heat exchanger of the same physical size (as a shell and tube) will have a larger available heating duty, due to the constant heat flux technology.
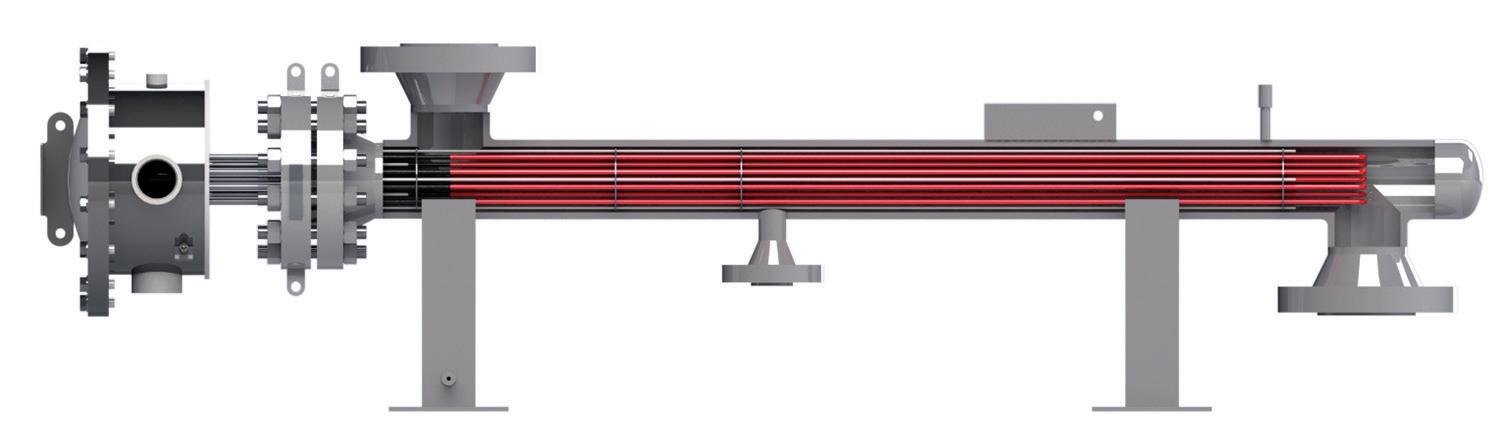
With equipment of this size, a single vessel can have two heat exchanger bundles. Such a set-up can produce a single process vessel with a 15 MW duty rating or more. The few suppliers providing electric heaters at this scale can raise or lower the duty rating as technical requirements dictate. This kind of size and power presents a viable alternative for operations currently fired by fossil fuels.
What about control?
Some of the most common questions about larger process heaters have to do with control:
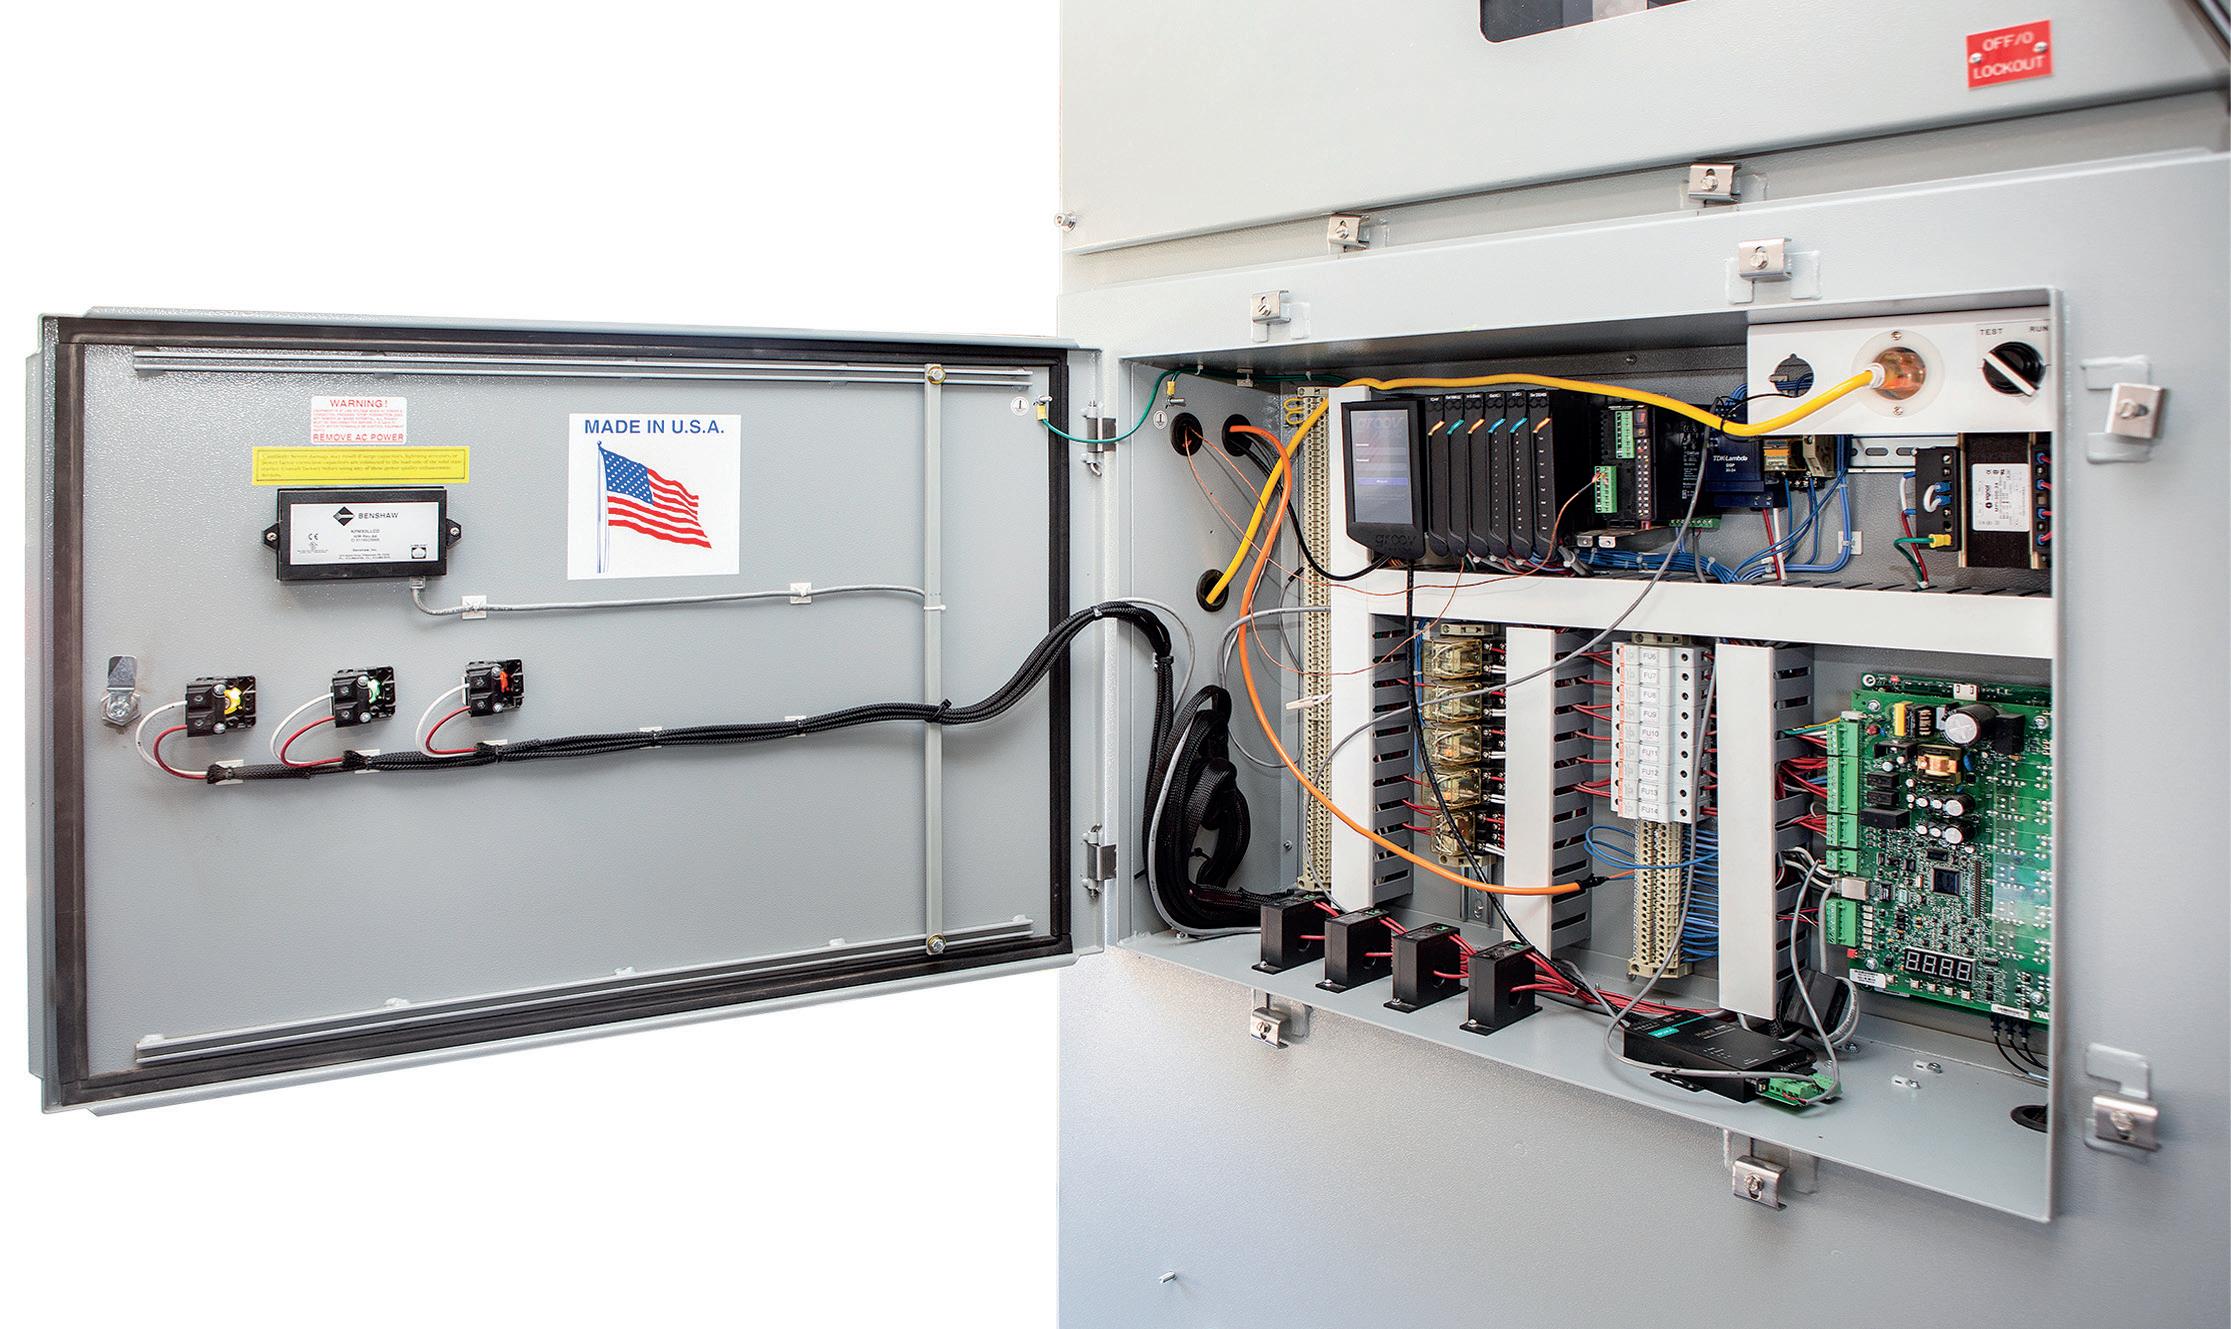
n What additional elements are needed to ramp up the heater?
n How does turn-on/ramp-up affect the existing electrical system?
n How is temperature monitored and controlled?
n What additional safety precautions are needed?
Just because larger electric heaters have not traditionally been used to heat all processes in the petrochemical industry does not mean that the technology is theoretical or untested – far from it. Field-proven power switching devices have been in use for low-voltage electric process heaters and electric medium-voltage motors in a number of industries for years, and the ability to control voltage is well established.
Programmable logic controllers (PLCs) and similar power management systems bring heaters online in ways that do not cause problems for other devices connected to the same power source. The heater and controller are part of one closed-loop system, which streamlines integration and yields more control over the entire system. This technology’s tried and true nature in other applications reduces the risk for petrochemical process heating.
Watlow’s engineers have built such controls into the company’s POWERSAFETM solution. This is a medium-voltage
March 2023 HYDROCARBON ENGINEERING 74
Figure 1. An electric heat exchanger.
Figure 2. The POWERSAFE solution.


10-13 JULY10-13 JULY
heating and control solution that combines both an electric heat exchanger and a control system. The system has been proven to operate safely and reliably even at 4160 V and higher. It also offers a flexible combination of a silcone controlled rectifier (SCR) and contactor circuits of up to 25 MW within a single control package, delivering high-efficiency power greater than 99%, which reduces the overall size and weight of the power controller solution. Medium-voltage connections result in much lower amperage as compared to low-voltage, so the end user realises much lower connection cabling costs. The system meets strict requirements for safety and reliability, too. It has been designed with a high-speed protective relay, rapid shutdown breaker, optimal fluid dynamics, and safety interlocks to maintain control over a wide variety of thermal processes. Thus, control and safety are built into the technology, offering a clean, safe and long-lasting asset for engineers tasked with decarbonising thermal systems.
The other consideration: investment and cost
While familiarity might be the biggest barrier to implementing electric heaters into hydrocarbon processing, one cannot ignore the fact that cost is also a huge consideration. There are three primary types of expenses to consider when transitioning to electric-powered equipment: CAPEX, OPEX, and human learning expenditures.
CAPEX to change equipment
The equipment itself is the first significant cost associated with electrification. Beyond the cost of new equipment, there is also the cost of integrating electric process heaters into the existing electrical grid and ensuring their smooth operation, including technology to store electricity that comes from renewable sources as well as control technology to ensure that the local grid is not stressed or overloaded.
OPEX
OPEX includes things such as routine maintenance, as well as the cost of electricity itself. The routine maintenance cost of electric heating systems is typically lower than a natural gas or similarly-fired system. Electrical systems have no burner to maintain, and the heat exchanger bundle cleaning schedule is typically the same as a non-electric shell and tube technology. As for electricity, costs will vary by region if electricity is bought from the existing grid. That said, the cost of renewable generation systems themselves has dropped dramatically since 2010, and continues to fall. Many organisations may well choose to generate their own renewable power anyway.
Human capital and the learning curve
Finally, there is the question of human capital and the availability of relevant engineering expertise. Manufacturing processes with fossil fuels are ubiquitous; as is the equipment that runs said processes. Additionally, while most companies will have electrical engineers or staff familiar with large electrical equipment such as motors, not all will have extensive field experience with electric process heaters. This means something of a learning curve, though that learning curve is much easier when an organisation can team up with a knowledgeable partner.
Electrification is even more worthwhile now
The discussion of costs might trigger some decision makers to get their spreadsheets out. If there is going to be significant CAPEX, not to mention operating costs and human capital costs, when can operators begin to see a return on investment (ROI)? What is the break-even point?
Of course, every organisation will have to factor in their own local regulations and incentives, and so the mathematics might look different in each instance. However, the pressure to reduce emissions leaves little doubt that the pace of electrification will only intensify.
There are other benefits of electrification to consider, too, as well as new developments in the technology. Today, processors are in an even better place when it comes to efficient electric heaters for hydrocarbon processing than, say, five years ago.
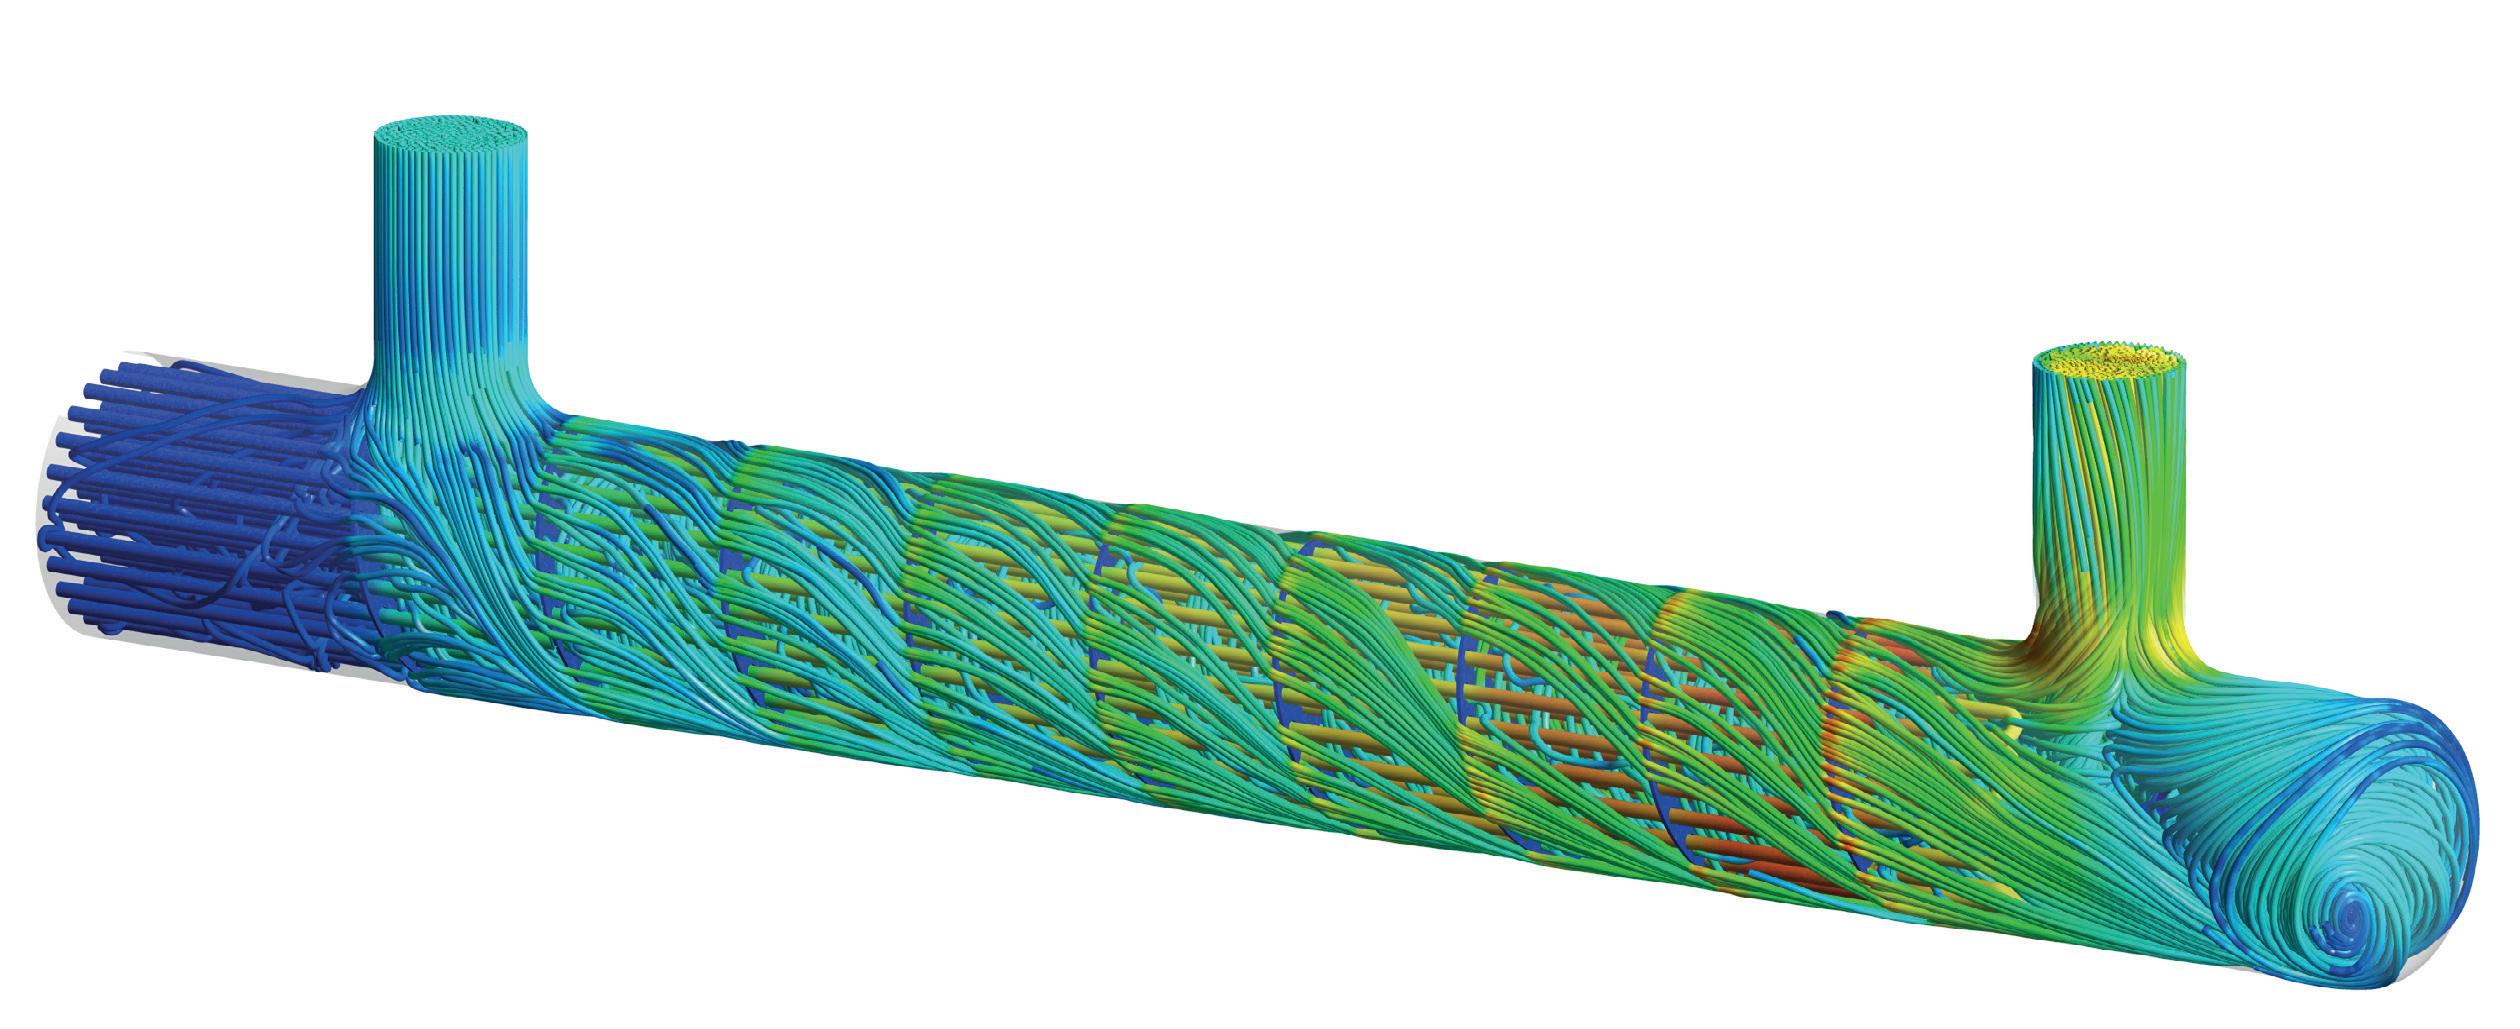
Additional advantages of electrification
Besides reducing the use of fossil fuels, electric heaters and heat exchangers have other well-documented advantages, including the following:
n Less thermal lag: temperature is controlled through direct application of electricity.
n Safer operation: no fossil fuels to burn or combust.
n Less coking/fouling: with the right electric heater, coking/fouling becomes a thing of the past, meaning longer heater life.
n Increased watt densities: higher watt density ratings allow equipment to be designed smaller, thus lowering capital equipment costs, keeping costs down, and reducing the overall footprint – while meeting temperature requirements.
n Smaller overall footprint: constant heat flux capability results in a smaller footprint as compared to the non-constant heat flux in shell and tube heat exchangers.
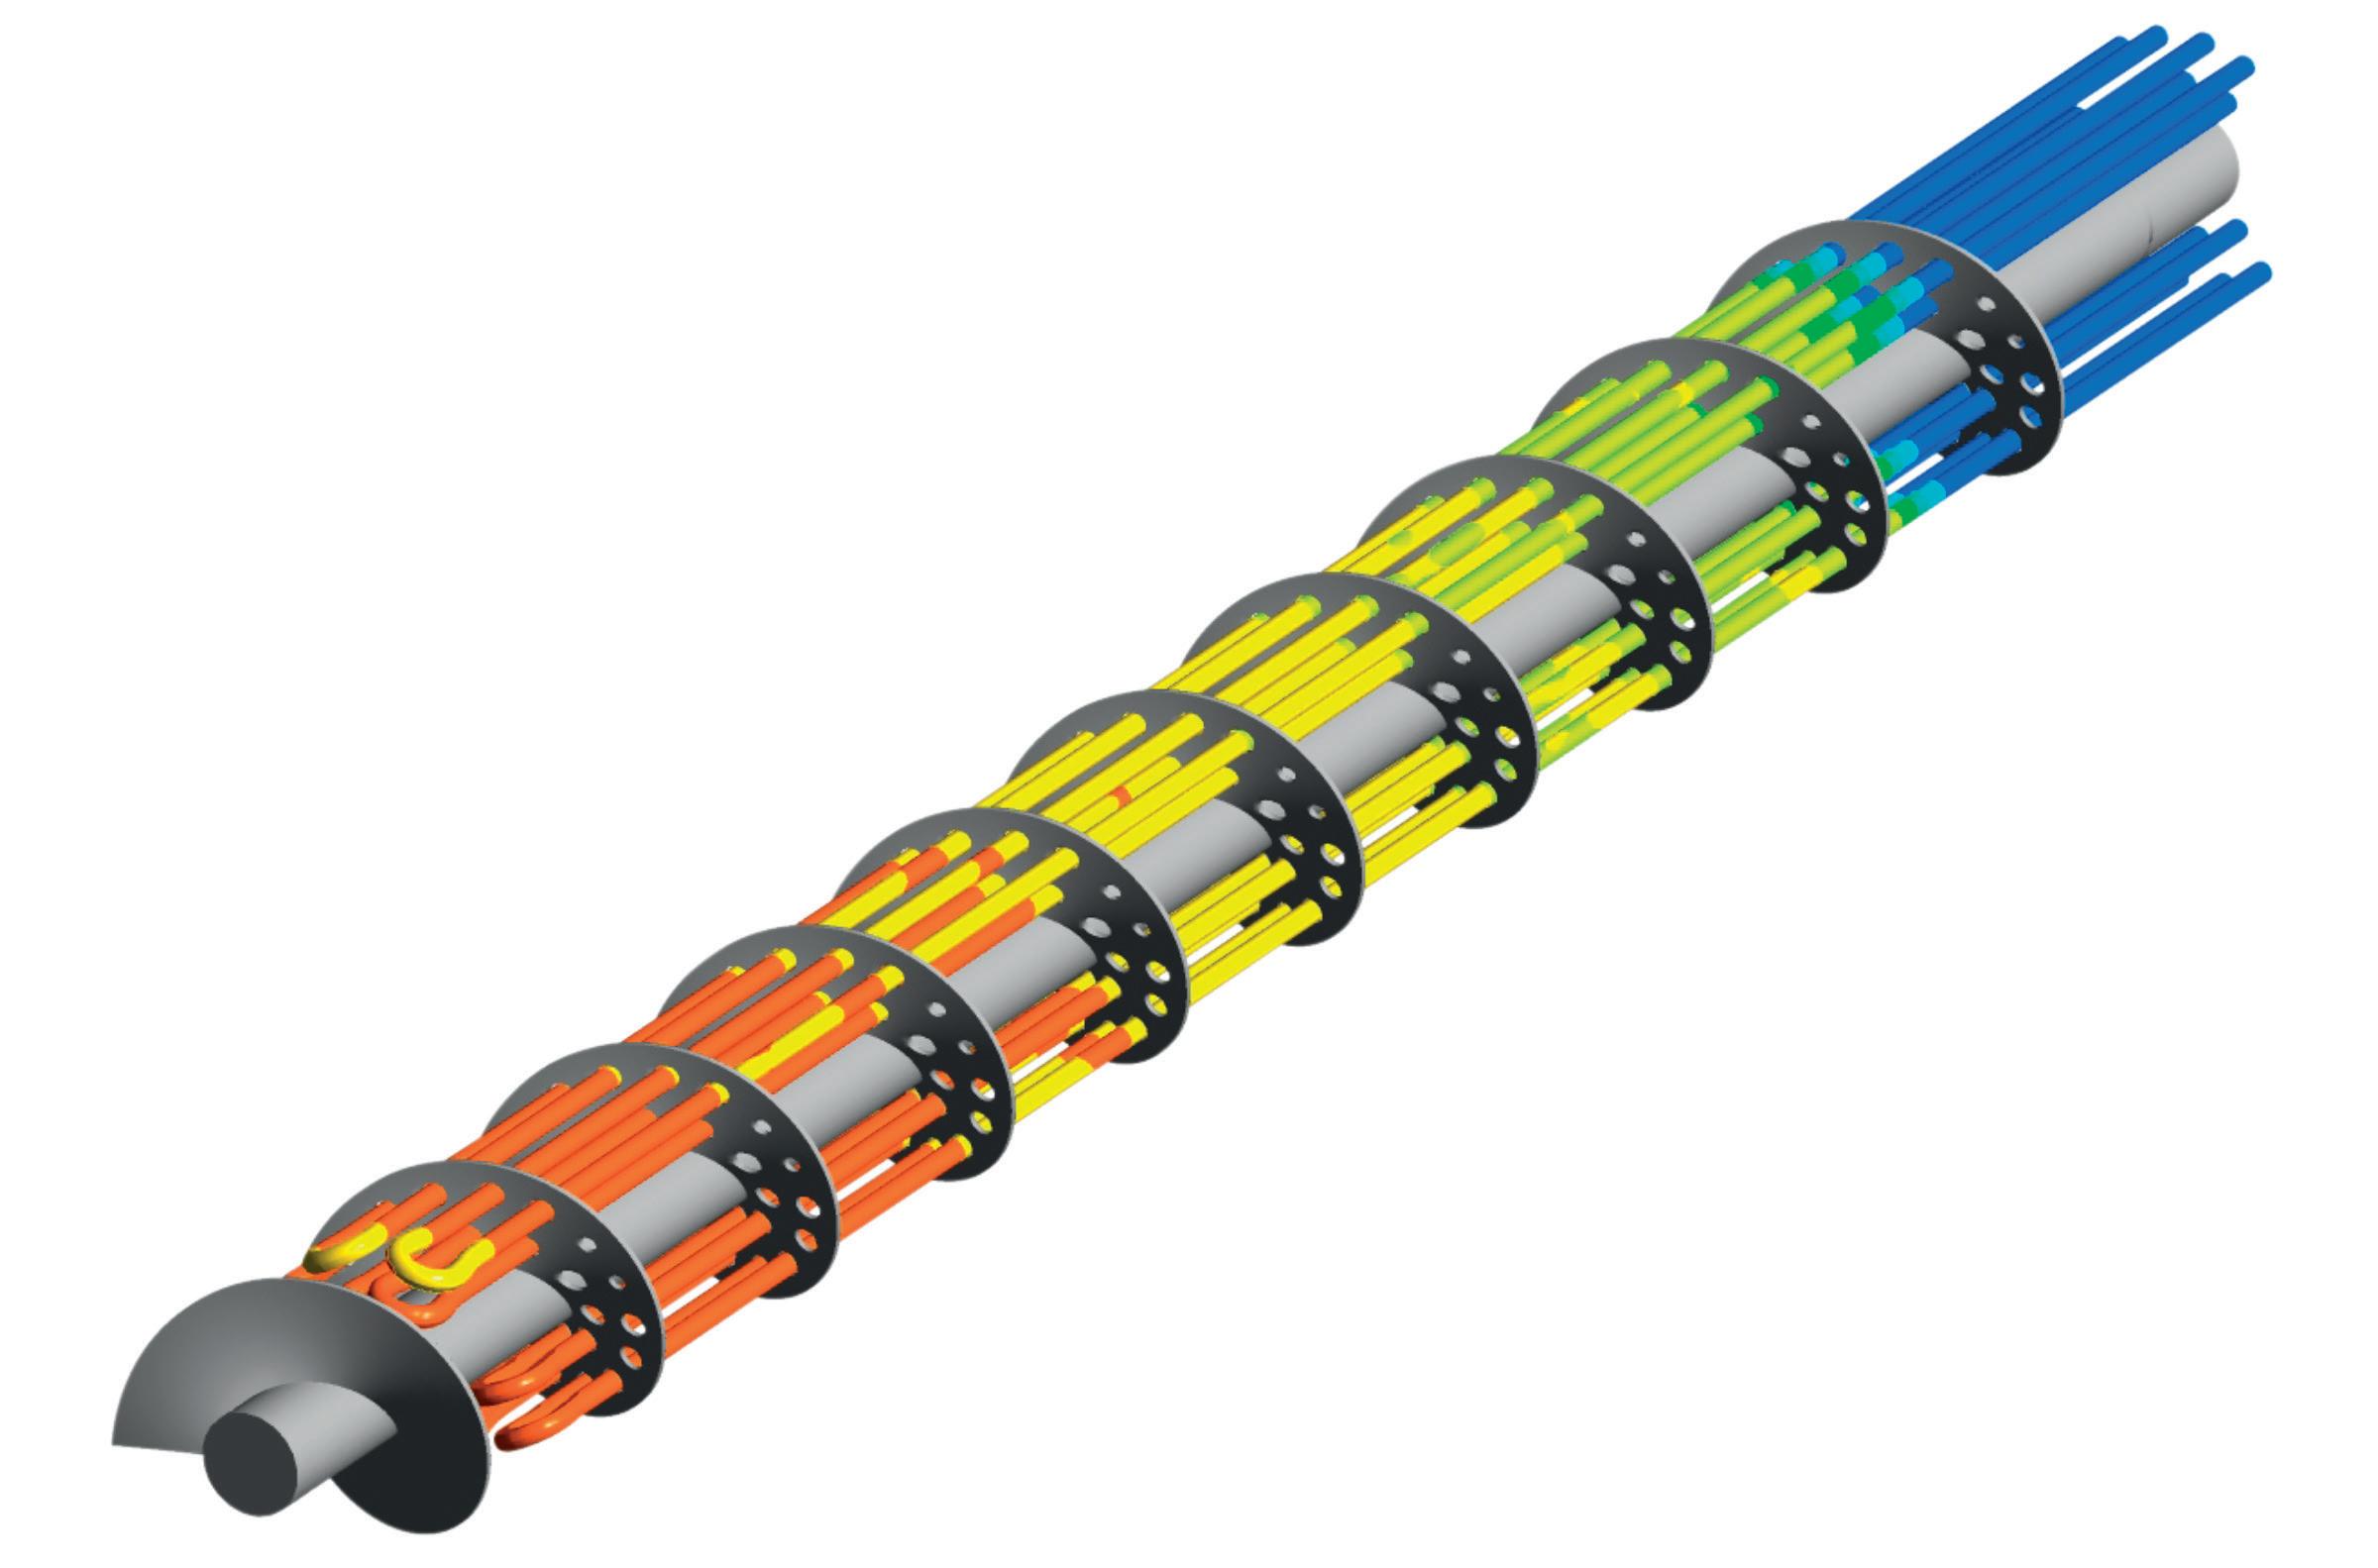
March 2023 HYDROCARBON ENGINEERING 76
Figure 3. The HELIMAX solution. Top: CHF technology. Bottom: fully-developed flow pattern.
Different technologies
An example of a heater that achieves all of the above is Watlow’s HELIMAXTM, which uses Continuous Helical Flow (CHF) TechnologyTM. With CHF, the baffles within the heater do not exist as discrete elements, but rather as a single continuous spiral winding around the interior of the shell side of the heater. This further forces the flow to be rotational and helical, resulting in an even better heat transfer coefficient per unit pressure drop compared with more traditional segmental baffles.
Because the flow is continuous and uniform, the heater does not experience dead zones or areas with insufficient flow. There are no disruptions to flow either, and so there is dramatically less likelihood that hot spots can develop. Without hot spots or dead zones where material can collect and adhere, there is potential for greatly reduced fouling rates. The improved heat transfer compared to legacy technologies also means that these heaters have a much smaller footprint, thus allowing the process machinery to make a much more efficient use of space.
A single, removable HELIMAX bundle can supply up to 5 MW of power duty range, even with a smaller footprint than fuel-based heat exchangers. Combining this efficiency with the reduced need for maintenance to address coking creates a product that increases productivity even as it contributes to decarbonisation efforts. This heat exchanger can also last longer and avoid system failure because it is not as susceptible to fouling.
Finally, modern heaters such as HELIMAX have been proven to achieve higher watt density ratings. Note: watt density is the

heat flux emanating from the effective heater surface, while a heater’s watt density rating is used in thermal calculations to determine approximate heater skin temperatures in the application. Smaller heater package designs using higher watt densities will always meet critical specifications for sheath temperature, shell temperature, and other customer constraints – while also reducing overall footprint.
Conclusion


Now is a good time for engineers who are not already familiar with electric process heating systems and heat exchangers to introduce themselves to new technologies. Gaining familiarity with electric process heating systems now will reduce the burden of the energy transition later.
Specifically, engineers are realising two things. First, there are far more opportunities to use electric process heating systems – and with far fewer size constraints – than previously imagined. Second, control of these MW-size heating systems is demonstrated in field applications, with precise control of process and skin temperatures.
Companies such as Watlow are solving the world’s most challenging and essential thermal problems. The work includes breaking down the barriers to energy transition to provide clean, efficient and reliable ways to electrify processes traditionally heated with fossil fuels. Working with a reliable partner to electrify process heating systems is one of the surest ways to progress toward climate action goals without interrupting productivity or profitability.

Santa Croce 664/a, 30135 VENICE (ITALY) www.sate-italy.com Predictive diagnostics, simulation and knowledge extraction from telemetry data of hydrocarbon and energy systems Travelling from sea depths to outer space with simulation and diagnostics since 1991
Keynote Speakers

CLOSING KEYNOTE
Tuesday, May 23
Daniel Yergin

Global Authority on Energy, Geopolitics and the Business, Economic and Societal Impacts of the Changing Energy World; Pulitzer Prize-Winning, Bestselling Author; Vice Chairman, S&P Global; Chairman, CERAWeek; Director, Council on Foreign Relations; Trustee, Brookings Institution; Author, The New Map (2020), The Prize (2011, Pulitzer Prize Winner), The Quest (2011) and The Commanding Heights (2002); 2020 Energy Writer of the Year.
OPENING KEYNOTE
Monday, May 22
Jason Dorsey

Leading researcher, advisor and author focusing on uncovering hidden insights and new strategies that future-proof organizations. He has led nearly 100 research studies to separate myth from truth for leaders.Author, Zconomy: How Gen Z Will Change the Future of Business and What to Do About It
KEYNOTE BREAKFAST
Tuesday, May 23
Captain Scott Kelly
History-making NASA Astronaut; First to complete a Year-in-Space mission. A former U.S. Navy fighter pilot, test pilot, and veteran of four spaceflights, Kelly commanded the space shuttle ENDEAVOUR in 2007 and twice commanded the International Space Station. Author, Endurance: A Year in Space, a Lifetime of Discovery

2023 INTERNATIONAL OPERATING CONFERENCE & TRADE SHOW MAY ilta. org Register today! JOIN US AT THE PREMIER ANNUAL EVENT for liquid terminal owners and aboveground storage tank operators.
22-24
Houston, TX
Tom Gilmartin, Zerosumheater and a consultant for Quest Integrity, considers the effect of fouling on heater services, and introduces a new approach for confirming coil cleanliness.
Heater tube inspection is almost exclusively looked after by the inspection team at a facility. Innovative inspection techniques such as smart pigging and, most recently, Quest Integrity’s Advanced Decoking and Cleanliness Verification (ADCVTM) inspection (Figure 1), offer additional information that is particularly useful to a process engineer in order to avoid production slowdowns or unplanned mechanical cleaning (pigging) outages.
Even a small amount of fouling in the radiant section of a vacuum heater adversely affects nitrogen oxides (NOx), production run times, and overall performance of the fired heater. What is sometimes not realised is that even a localised area of 5 mm of coke left in a coil can have a significant impact on margin capture. This could lead to a yearly loss in production of US$12.6 million, or significantly more. Test results discussed in this article will demonstrate the benefit of knowing where fouling (e.g. coke and scale) has formed in a heater coil, and why being confident that the coils are cleaned properly after a decoke or descale is crucial.
The consequences of some strategies that may be used to alleviate high tube temperatures caused by fouling will be expanded upon – from running the furnace inefficiently, to cutting coil outlet temperature and finally throughput. The commercial impact of this will be discussed for these cases. In short, using a more advanced cleaning method, as compared to convection mechanical decoking, can provide many benefits.
Example simulations and cases

Using a range of coke thermal conductivities and thicknesses, a vacuum heater was simulated to show the effect of coke laydown on heater tubes, and its impact on heater performance in terms of fired and process duty and environmental emissions.
A 27.9 MW process duty vacuum furnace was used to demonstrate the effect of fouling on the overall heater performance. The heater coils are horizontal, with four passes and incremental tube sizes increasing in size towards the outlet. The tube material used is 5% chromium (Cr) with a maximum design temperature of 650˚C. A coil outlet temperature (COT) of 383˚C was selected,
March 2023 79 HYDROCARBON ENGINEERING
as this bridges the temperature range used in vacuum and crude heaters.
Nine cases were considered:
n Base case (no internal fouling).
n 1 mm and 5 mm fouling throughout the entire radiant section tubes, with coke thermal conductivities of 1.5 and 3 W/mK.
n Localised fouling with 1 mm and 5 mm coke, again in the radiant section, with coke thermal conductivities of 1.5 and 3 W/mK.
Fouling thickness was held constant at 1 mm and 5 mm for widespread and localised fouling, using the aforementioned coke thermal conductivities. This reflects
the thermal properties of coke, which changes with the temperature and morphology of the accumulated coke. As a comparison, the thermal conductivity of 5% Cr is around 40 W/mK at 20˚C.
The process duty was maintained during this exercise, with the firing rate adjusted to compensate.
The effect of the fouling on key aspects of the fired heater radiant and convection section performance is shown in Table 1 for fouling throughout the entire radiant section.
Review of data for heater performance
Environmental – NOx
n 1.5 W/mK case: 2.4% increase (1 mm fouling) and 12% increase (5 mm fouling) in the radiant section.
n 3 W/mK case: 1% and 6% increase. The driving source is the added fire box temperature.
Note that some units may have a fixed maximum environmental-permitted NOx limit that may lead to a consequential reduction in firing.
Fired duty increases slightly with fouling added
The overall heater efficiency decreases a small amount with fouling, with a more significant decrease in radiant section absorbed duty (0.7 – 3.5% reduction for the 1.5 W/mK case and 0.4 – 1.7% for the 3 W/mK case). The reason for this is less effective heat pick up in the radiant section.
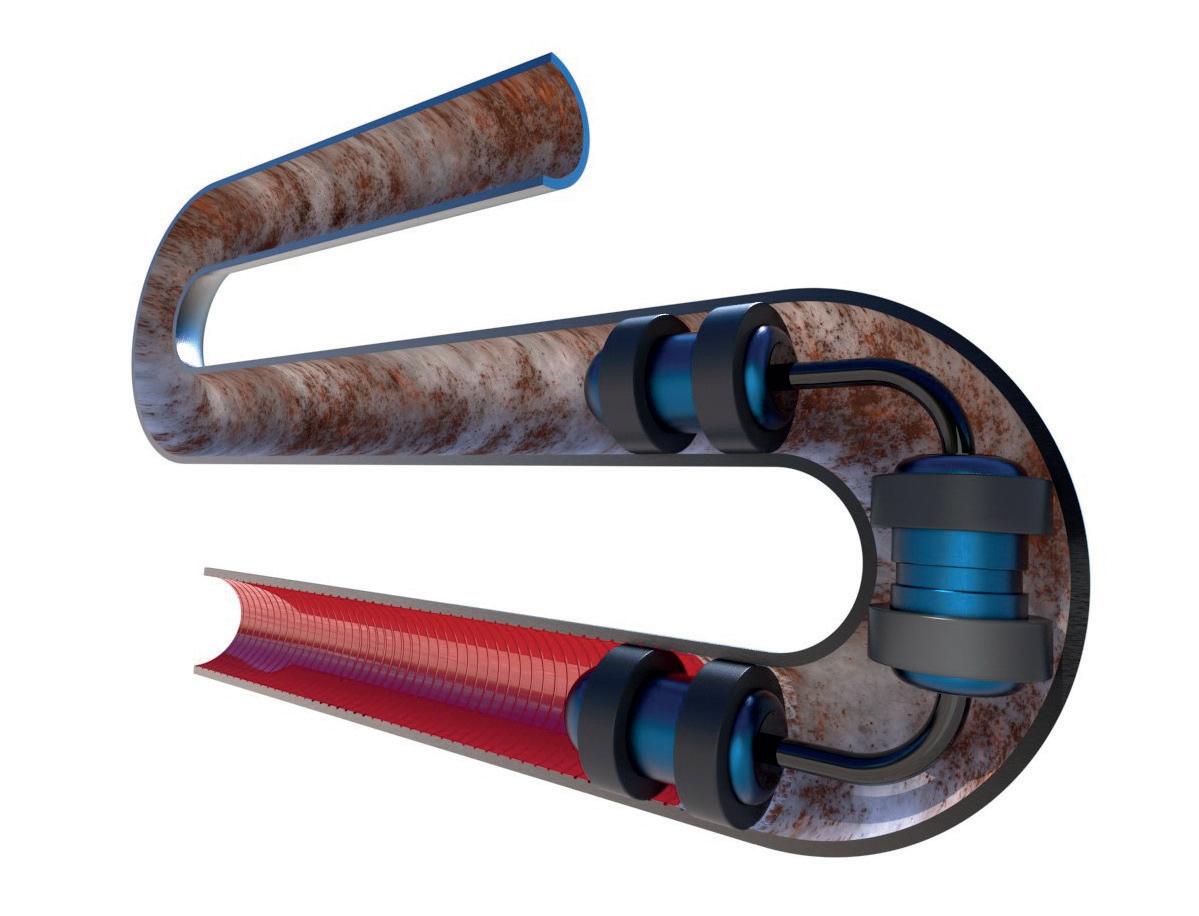
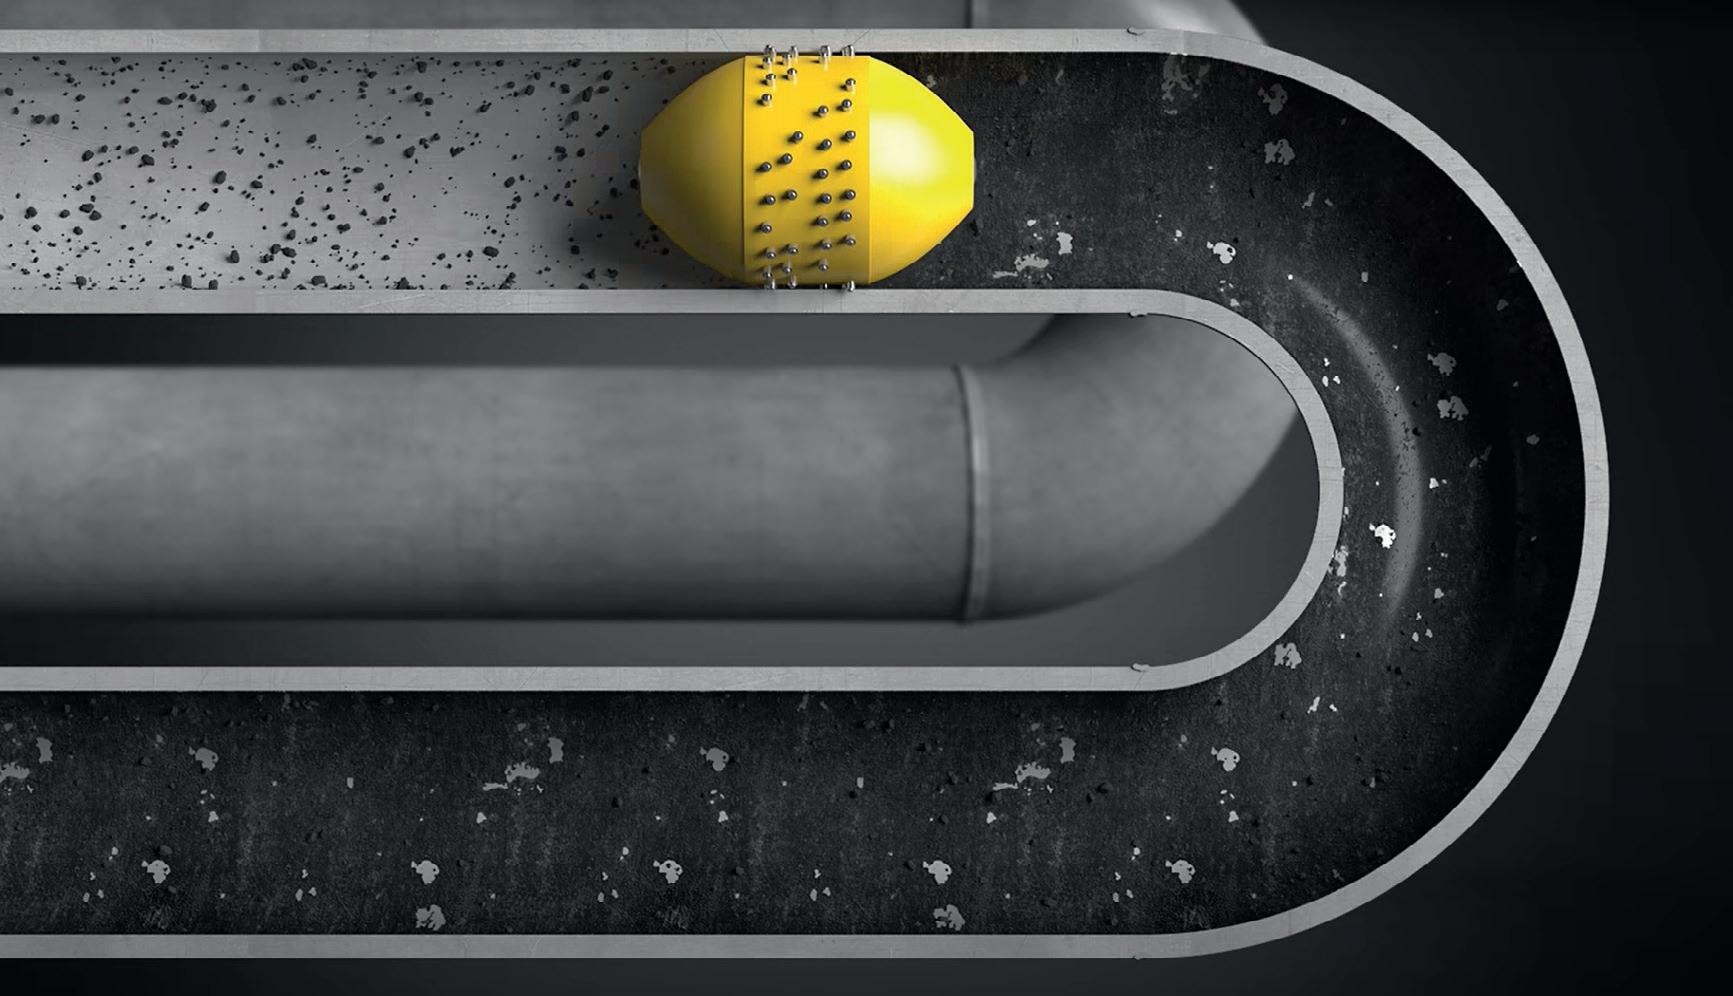
As the radiant section fouls, several things happen:
Note: a constant process duty of 27.9 MW was used for all cases
*A bulk process temperature of 383°C is calculated at the referenced skin thermocouple location
n Efficiency drops. The effective heat pick up in the radiant section decreases. The process duty absorbed in the radiant section reduces, dropping from a base level of
March 2023 HYDROCARBON ENGINEERING 80
1.5 W/mK thermal conductivity 3 W/mK thermal conductivity No fouling (base) 1 mm thick Change 5 mm thick Change 1 mm thick Change 5 mm thick Change Firing rate (MW) 33.55 33.56 +0.1% 33.7 +0.4% 33.57 +0.1% 33.6 +0.1% Bridge wall temperature (BWT) (˚C) 736 746.3 +10.3 789.6 +53.6 741 +5.1 762.3 +26.3 Tube skin temperature (°C) * 419 463 +44 635 +21 441 +22 530 +111 NOx (ppm) 25 25.6 +2.4% 28.2 +12% 25.3 +1% 26.5 +6% Absorbed fire box duty (%) 74.6 73.9 -0.7% 71.1 -3.5 74.2 -0.4 72.9 -1.7 Stack temperature (°C) 324.6 325.9 +1.1 330.4 +5.6 326.8 +0.6 327.6 +2.8 Total heater fired efficiency (%) 82.9 82.9 - 82.6 -0.3 82.9 - 82.7 -0.2
Table 1. Fouling throughout the radiant section only (no fouling in convection)
4% oxygen: no fouling 4% oxygen: 5 mm thick, 1.5 W/mK 9.7% oxygen: 5 mm thick, 1.5 W/mK Firing rate (MW) 33.5 33.7 37.1 BWT (°C) 736 790 768 Skin (383˚C bulk) 419 635 606 NOx (ppm) 25 28.2 34.4 Absorbed fire box (%) 74.6 71.1 62.3 Stack temperature (°C) 324.8 330.4 364.2 Efficiency (%) 82.9 82.6 74.9
Table 2. Alleviating skin temperatures by running furnace at maximum oxygen
Figure 1. Quest Integrity ADCV service.
74.6% to 71.1% in the most fouled case. As such, an increase in flue gas temperature to the convection section, as well as an increase in NOx production, will occur.
n Tube skin temperatures increase. In the worst case scenario (1.5 W/mK, 5 mm) there is a significant impact despite the fouling thickness remaining minor. Tube metal temperatures increase from 419˚C to 635˚C to achieve the same COT with a less effective radiant section. This is close to the tube temperature limits for a 5% Cr tube (650˚C). This article will go on to discuss why some end users may use a lower temperature limit of 593˚C.
n Radiant section fire box temperature is still acceptable at a maximum case of 789.6˚C. Typically, fired heaters have a maximum fire box temperature of 850 – 900˚C in this service, partially to protect the tube hangers, and also to reduce coking tendency of the feed in the radiant coil. This limit is important when processing opportunity feeds, which may be more sensitive to thermal breakdown. Fouling is driving the radiant section closer to these limits.
The following is a process engineer’s perspective on these numbers during routine monitoring:


n Tube skin temperatures: the largest noticeable change, but assumes thermocouples are in the correct location.
n BWT or fire box temperature: the next indicator with a significant change.
n Fired duty and heater efficiency: changes too small to notice.
Visual inspection and thermography of the fire box can provide further insights on fouling.
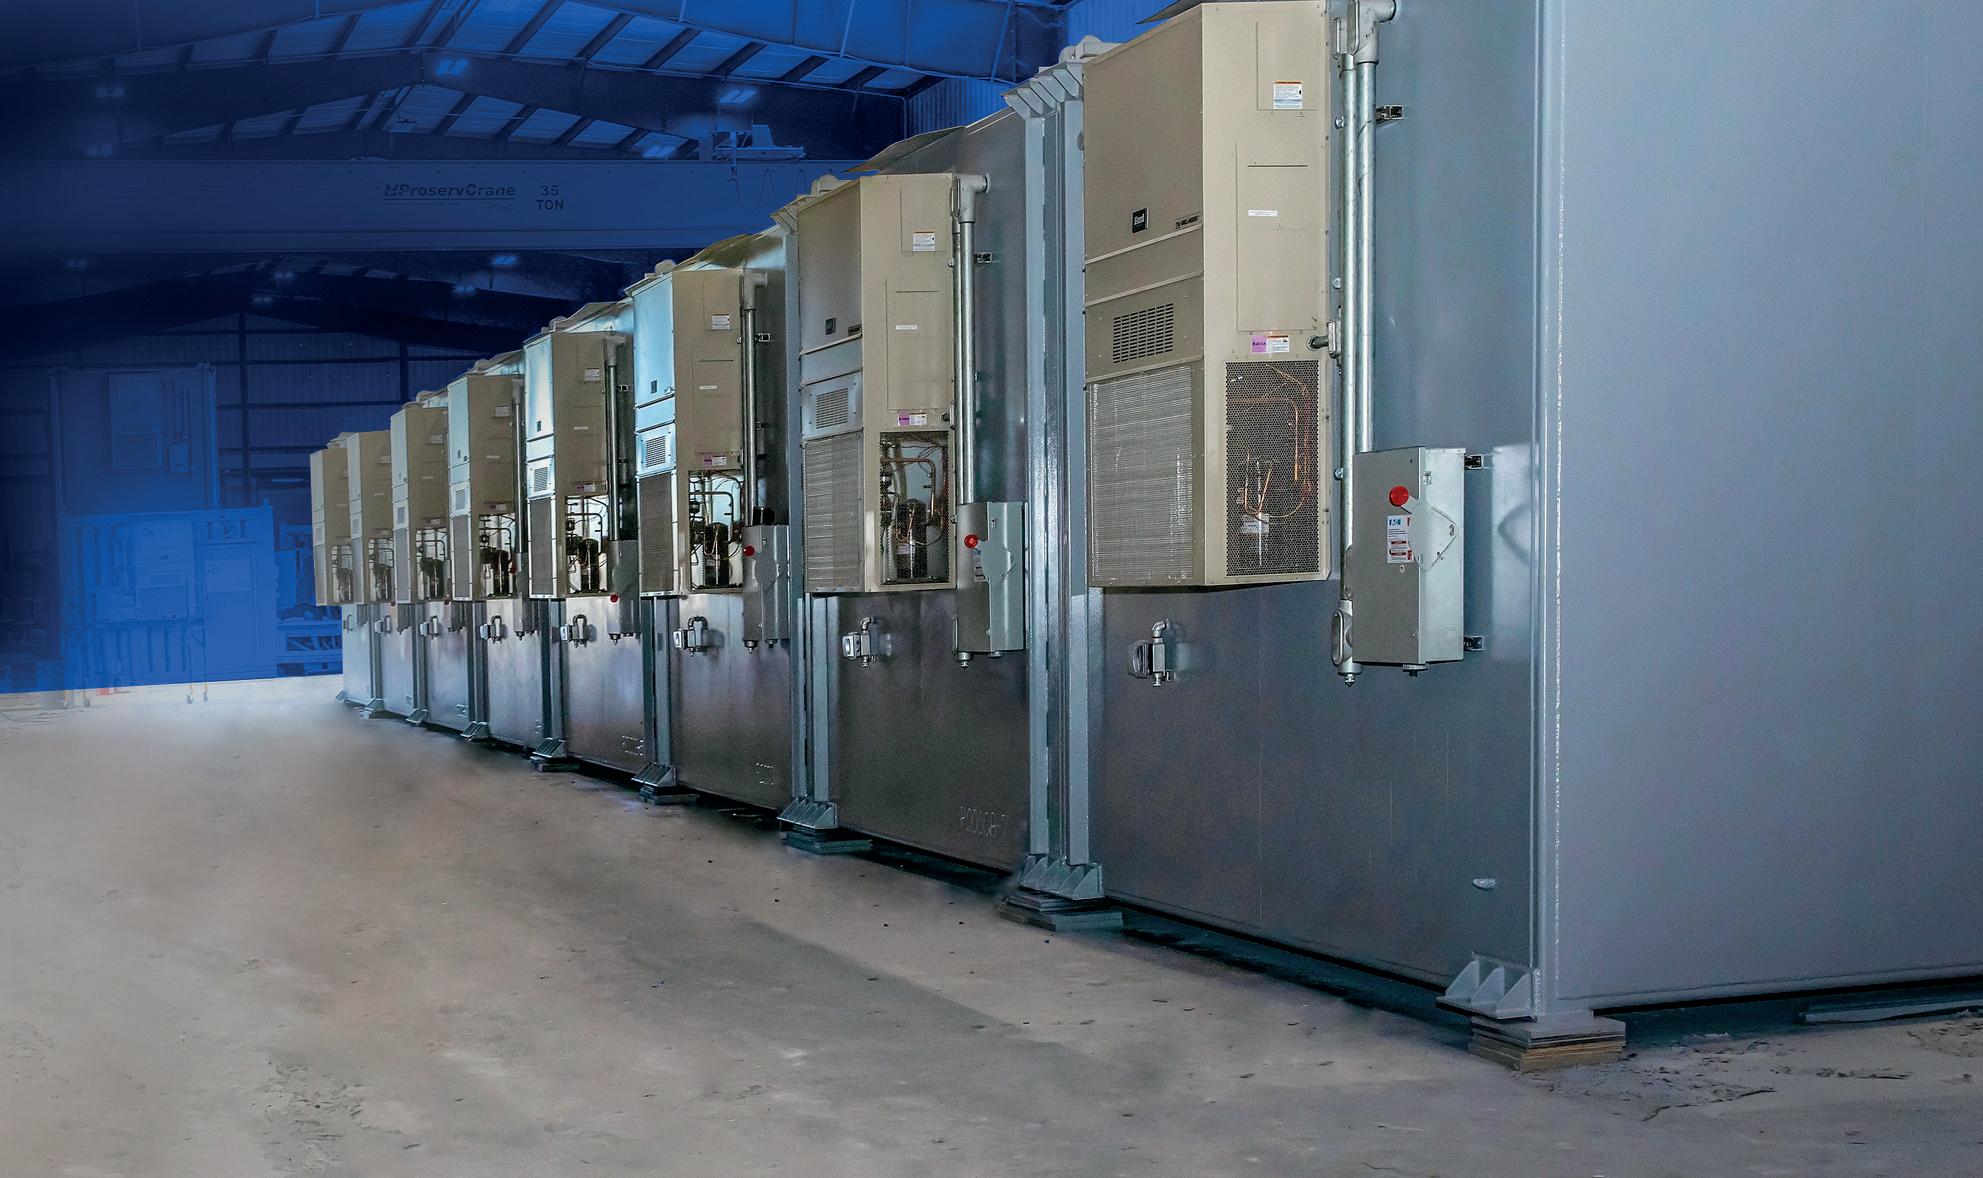
In addition to this, there is severe impact on tube temperature limits and heater performance. In this service, tubes are typically 5 – 9% Cr with tube metal temperature (TMT) limits of usually 650˚C (5% Cr) and 705˚C (9% Cr). In this simulation, using 5% Cr, API530 gives a limiting design temperature of 650˚C , however this is for creep properties. A more commonly used limit is 593˚C to avoid rapid oxidation of the tube external surface. In this case, if 593˚C was used instead of 650˚C , a cut back in heater operation may be required. Options are considered in the next section.
Options to deal with high tube skin temperatures
n Material choice: 9 Cr steel (705˚C limit) would provide some headroom, but not much.
n Special operational techniques: used to mitigate and maintain run time – sometimes they work, sometimes they do not. Increasing oxygen, cutting COT, and cutting rate are discussed.

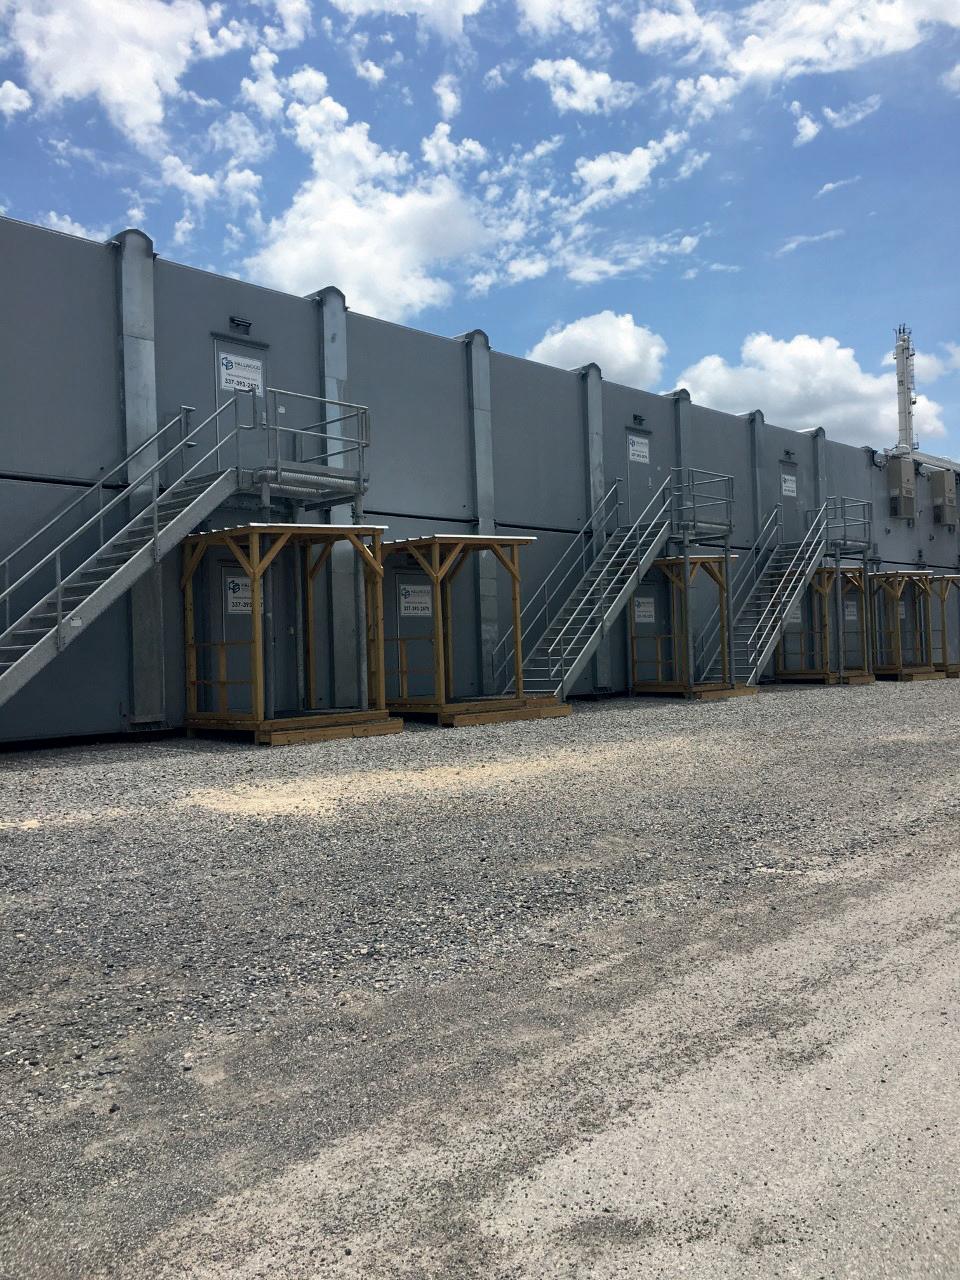
A technique sometimes used to alleviate skin temperatures is to run the furnace at maximum oxygen in order to move furnace duty from the radiant to the convection section. Table 2 lists an example of this.
Skin temperatures have dropped by approximately 30˚C , but at the cost of a significant increase in fired duty.
Hallwood_HE_March_05.pdf 1 15/02/2023 08:50
Additional fuel duty and furnace efficiency drop off significantly. The NOx is likely to go up as well, requiring correction.
Some critical comments on these results
This is just a simulation. It is unrealistic to lay coke down through the whole radiant section, with two exceptions:
n There are times where an entire coil can coke up quickly, such as a low flow situation occurring in a coil; a coil control valve closing or jamming; incorrectly-set low flow trips; or a slow response to a low flow event.
n The heater has never been pigged and does not suffer from high skin temperatures. In this situation, coke may be present but has been accepted as the normal baseline for heater operation.
The more common situation
Although fouling across an entire heater coil is not typically seen, there tends to be specific areas that are most exposed to formation in terms of heat flux. Data is reviewed again in Table 3, this time ignoring all changes apart from skin temperatures. The localised coke is driving up skin temperatures. An important thing to note is that tube temperatures are controlled by the effective heat transfer across the tube.
Dealing with localised fouling
Here, only the simulated cases are used without the additional allowance for skin thermocouple type.
The 1.5 W/mK case
The tube temperature needs to come down below the oxidation temperature of 593˚C for 5% Cr, rather than the API 530 limiting metal temperature of 650˚C. Increasing oxygen in the previous example worked to an extent, but reached a draft limitation. Shutdown for a mechanical cleaning to remove this coke is not preferred. The other options are as shown in Table 4:
n Drop COT by 10˚C: tube temperatures reduced by 10˚C to 626˚C, which did not help much, and column cuts may go off specification.
n Cut the rate: a 20% cut brings tube temperatures back to the tube limit.
Commercial consequences of a 20% rate cut
Example: 3250 bpd rate cut example at US$10/bpd margin. US$12 million/yr
A unit must be ready to take advantage of margin capture whilst it lasts. Even a small amount of fouling affects the overall ability of the heater, reducing margins and run time. A special case is outlined in Table 5, where just a 2 mm increase in coke can have a dramatic effect on heater operation. 7 mm coke is not that abnormal to find (in fact 10 – 15 mm is more common) after tubes have been removed following a coking event. In this case, the heater will need to go offline for unplanned pigging, with an estimated outage of 10 days – not including time to replace damaged tubes.
Routinely pigged heaters
A coke layer increases tube metal temperature. Above 593˚C (5% Cr) the external surface of the tube starts to oxidise, removing tube thickness. Over time, the tube develops a classic bulge profile. The coke sits in that bulge (see Figure 2). This is well documented: leaving this coke in place or in other places on the tube wall where conventional mechanical decoking cannot detect and remove it can lead to instant regret at start-up. Pressure drop and coke fines during a pigging operation is a very subjective method of cleanliness verification, and is rarely supervised by plant personnel.
A question to ask is whether it is sufficient to carry out an ultrasonic (UT) smart pigging run after
March 2023 HYDROCARBON ENGINEERING 82
Tube skin temperatures only 1.5 W/mK thermal conductivity 3 W/mK thermal conductivity Constant process duty 0 mm thick (no fouling) 1 mm thick Change 5 mm thick Change 1 mm thick Change 5 mm thick Change Tube skin temperature for a 383°C bulk process feed temperature 419°C 463°C +44°C 635°C +216°C 441°C +22°C 530°C +111°C Adding allowance for thermocouple design +20°C 439°C +64°C 655°C +236°C 461°C +42°C 550°C +131°C Adding allowance for thermocouple design +40°C 459°C 503°C +84°C 675°C +256°C 481°C +62°C 570°C +151°C
Table 3. Localised fouling in radiant section only (no fouling in convection)
Condition Skin (˚C) BWT (˚C) Average heat flux (W/m2) Peak film temperature (°C) Start COT 383°C 636 789 32 777 402 COT reduction 10°C cut 626 - -Rate reduction -10% 612 761 30 078 400 Rate reduction -20% 590 731 27 275 398
Table 4. Dropping COT to reduce tube temperatures

NATIONAL INSTITUTE FOR STORAGE TANK MANAGEMENT NISTM
mechanical pig cleaning in order to confirm cleanliness. The answer is that whilst this works, operators have no idea where the fouling was and what tubes were exposed to it before the start of mechanical cleaning. Knowing this information provides insight into the firing profile, correct skin temperature indicator (TI) placement, where thermography readings should be taken, future run time forecasting, and possible carburisation and oxidation damage locations – to name a few.
Innovative techniques
Standard mechanical pigging uses hard body metal studded pigs that are oversized. There is an oversize limit – too large, and tube metal is removed.
How does a pigging contractor know whether tubes are clean? This can be accomplished by monitoring water quality during cleaning operation and looking at the pressure traces for each pass. However, this approach leaves a lot of doubt. If there are bulges in the tube, these will not show as being significantly different from
other areas. These areas may have coke present. Hard fouling left over from previous cleanings can be left behind in areas of non-deformed tubing, going completely unnoticed during current mechanical cleaning operations.
The ability of a mechanical pig to clean tubes is typically based on two things:
n Size and type of mechanical pig (studs).
n Number of cleaning cycles required to grind out coke (500 – 1000 cycles).
For stubborn areas of coke, there is a risk of damaging (grooving) the actual tube in clean areas. ADCV has the advantage of identifying areas of coke and allowing for close attention of the pigging cycle in only those areas.
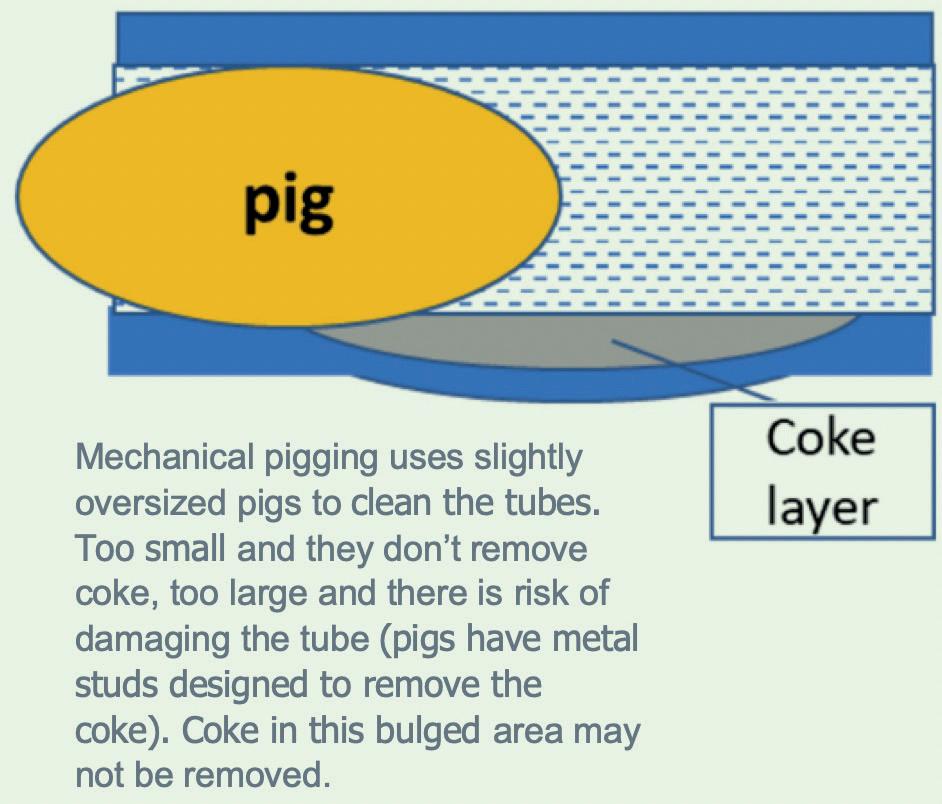
Initial inspection results
Localised areas of 5 mm coke were found in several crude and vacuum heaters. ADCV was used to identify these areas and selectively target them for coil cleaning, completely removing the coke. The process impact of these areas was not reported by the end users, however the previous simulations offer a good indication of potential consequences. Integrating the ADCV results with heater process data before and after will assist with the optimisation of the heater.
Outline of the process steps:
n Initial ADCV survey using smart pigs ultrasonically maps the location and thickness of the fouling.
n Mechanical cleaning team removes the bulk of the fouling using studded pigs.
n Cleanliness verification using the smart pig checks the result, fine tuning any additional mechanical pigging operations.
n Areas that were not able to be cleaned are reported to the client for further investigation. These are important areas; any bulging or major deformation in a tube caused by overheating may not be cleanable by a mechanical pig.
Conclusion
Fouling in a heater makes a significant difference to a heater’s safety, environmental and commercial performance. As coke is the dominant reason for high tube skin temperatures for normal furnace parameters, the thickness of the coke matters. Knowing that all of the fouling has been removed and where it initially formed – and where it did not – allows an informed view on past and future heater operations, and most importantly avoids running the heater sub-optimally until the next turnaround.
Notes
1. The original expanded version of this article is available as a white paper on Hydrocarbon Engineering’s website. Download a copy for added insights: https://www.hydrocarbonengineering.com/ whitepapers/quest-integrity/heater-tube-cleaning-and-verificationthe-effect-of-fouling-on-heater-services-that-are-prone-to-cokingfrom-a-process-engineers-perspective/
March 2023 HYDROCARBON ENGINEERING 84
2. The author of this article, Tom Gilmartin (Bsc, Msc, C.Eng), is a 30-year BP veteran and the company’s former fired heater and flare advisor.
Tube skin temperatures only 1.5 W/mK thermal conductivity Constant process duty 0 mm thick (no fouling) 5 mm thick Change 7 mm thick Tube skin temperature for a 383°C bulk process feed temperature 419°C 635°C +216°C 727°C Adding allowance for thermocouple design +20°C 439°C 655°C +236°C 747°C Adding allowance for thermocouple design +40°C 459°C 675°C +256°C 767°C
Table 5. Localised fouling in radiant section only excerpt (no fouling in convection)
Figure 2. Coke in bulged tube.
Mark Naples, Umicore Coating Services Ltd, details how connected gas detection technology can help companies to comply with ESG needs.
We cannot always see the consequences of air pollution around us, and there are communication issues surrounding efforts to get people to see the invisible costs of pollution. The global economy loses more than US$8 trillion annually, according to The World Bank 1 , but action to identify its presence and catalogue its make-up and levels still lags.

March 2023 85 HYDROCARBON ENGINEERING
Figure 1. Capturing the natural gas or methane wasted each year across the oil and gas industry would mean progress for both the climate and energy crisis.
The problem is that when we visualise air pollution, we tend to picture a blanket of smoke. However, just because we cannot see visible clouds of pollution does not mean that it is not affecting us. Not only are these harmful pollutants invisible to the human eye, but they are sometimes odourless and tasteless. Yet another layer of difficulty is that they are often found in volatile and inaccessible environments. The most common types of toxic gases found in modern industrial workplaces include ammonia, methane, hydrogen sulfide (H 2 S), chlorine, carbon monoxide (CO), and carbon dioxide (CO 2 ).
Thankfully, huge advances in sensor technology have activated a range of reliable options for gas detection, and the enormous advantages of infrared (IR) spectroscopy in detecting hydrocarbons and hazardous chemicals are now well established.
Mitigating risks
It is incumbent on all of us across our industries to deliver improvements in efficiency, embrace technological advances, streamline our work, and ultimately reduce the environmental impact of our activities. The rise in environmental, social and governance (ESG) focus is driven by a growing urgency for individuals and corporations alike to tackle one of the world’s most pressing problems: climate change. Many companies are committing to the incorporation of ESG and net zero targets into operations as they face increasing investor and consumer pressure, mandatory government climate risk disclosure, and stricter environmental regulations. By adopting measures based on data provided by intelligent sensors, organisations can improve their ESG compliance and enhance their contributions to people, the planet and profit.
With increased levels of corporate transparency, organisations are exercising a high degree of moral and ethical leadership, and companies are looking more
closely at their health and safety, environmental, and social practices to ensure compliance with legislation and ethical expectations.
By embracing data, the industry can be empowered to make more informed decisions to improve processes and drive efficiencies. The net result is more sustainable performance, heightened productivity, better quality products, reduced energy usage, fewer emissions, and less landfill, and this is the sort of future that we all need to invest in.
Technology is now more affordable and accessible than ever, and can help companies to comply with ESG needs. Connected gas detection is not the technology of the future anymore; it is right here, and more money-saving, sustainable and straightforward than one might think.
Industrial gas is used extensively by various industries – from medical oxygen in hospitals, to being used in the production process to manufacture chemicals, electronics and metals. Its critical position at the heart of the industry presents an opportunity to better track, monitor and assess gas usage to reduce the industry’s environmental impact and boost its efficiency.
The gas detection system market is expected to grow at a CAGR of 8.64% through to 2026 2 , and for good reason. With increasingly critical decisions reliant upon gas and particulate monitoring, the appetite for meticulous IR gas sensing is growing.

It remains vital that technology is adapted to the application. Increasingly, Umicore Coating Services is working with clients at an early stage of sourcing, and defining optimum solutions.
The hardware and firmware configuration can also significantly affect the performance and stability of an IR gas detector. The use of processors, algorithms and optical hardware configurations can distinguish between a highly stable device that minimises cross-interference from other gases such as CO 2 , and compounds such as water, or a device that produces spurious alarms and other operational issues.
Industrial gas detection is a mature market that continues to expand as devices become cheaper at the compliance end of the market, and smarter at the top end. On the one hand, Umicore works with original equipment manufacturers (OEMs) – stripping their devices back to basics, focusing on functionality and cost for low-cost markets. On the other, the company assists in driving advances to open up new opportunities and allow end users to use their devices in ways that have not been considered before.
In today’s industrial workplace, if you are a safety or operations manager looking to build or sustain a robust safety culture, it is no longer a ‘nice-to-have’, but rather a key requirement of the business.
March 2023 HYDROCARBON ENGINEERING 86
Figure 2. Corporations leading on climate action are looking for the next generation of climate technologies to invest in and scale to meet deep decarbonisation targets.
Keep sensing it
Climate change and its perceived impacts – from projected warming of the Earth through to anthropogenic global warming – have instituted profound changes in how the world approaches energy sources. The primary focus is on reducing CO 2 and methane – CO 2 because it is by far the most prevalent greenhouse gas (GHG), and methane because of the intensity of its impact in the first several years after it is emitted into the atmosphere. GHGs are generated at almost every step in production, delivery, processing or refining, and especially the consumption of fossil fuels.
Companies that are proactive in minimising leaks and eliminating vents must acknowledge that the effort is a long-term investment, requiring a multi-tool approach and active engagement.

Regulation enforcement has increasingly restricted the emissions that oil and gas producers may release, but industry opinion and corporate responsibility have pushed that objective further.
In the market for measuring emissions, there are many different measuring technologies. Umicore’s IR gas detection filters are essential to many of these.
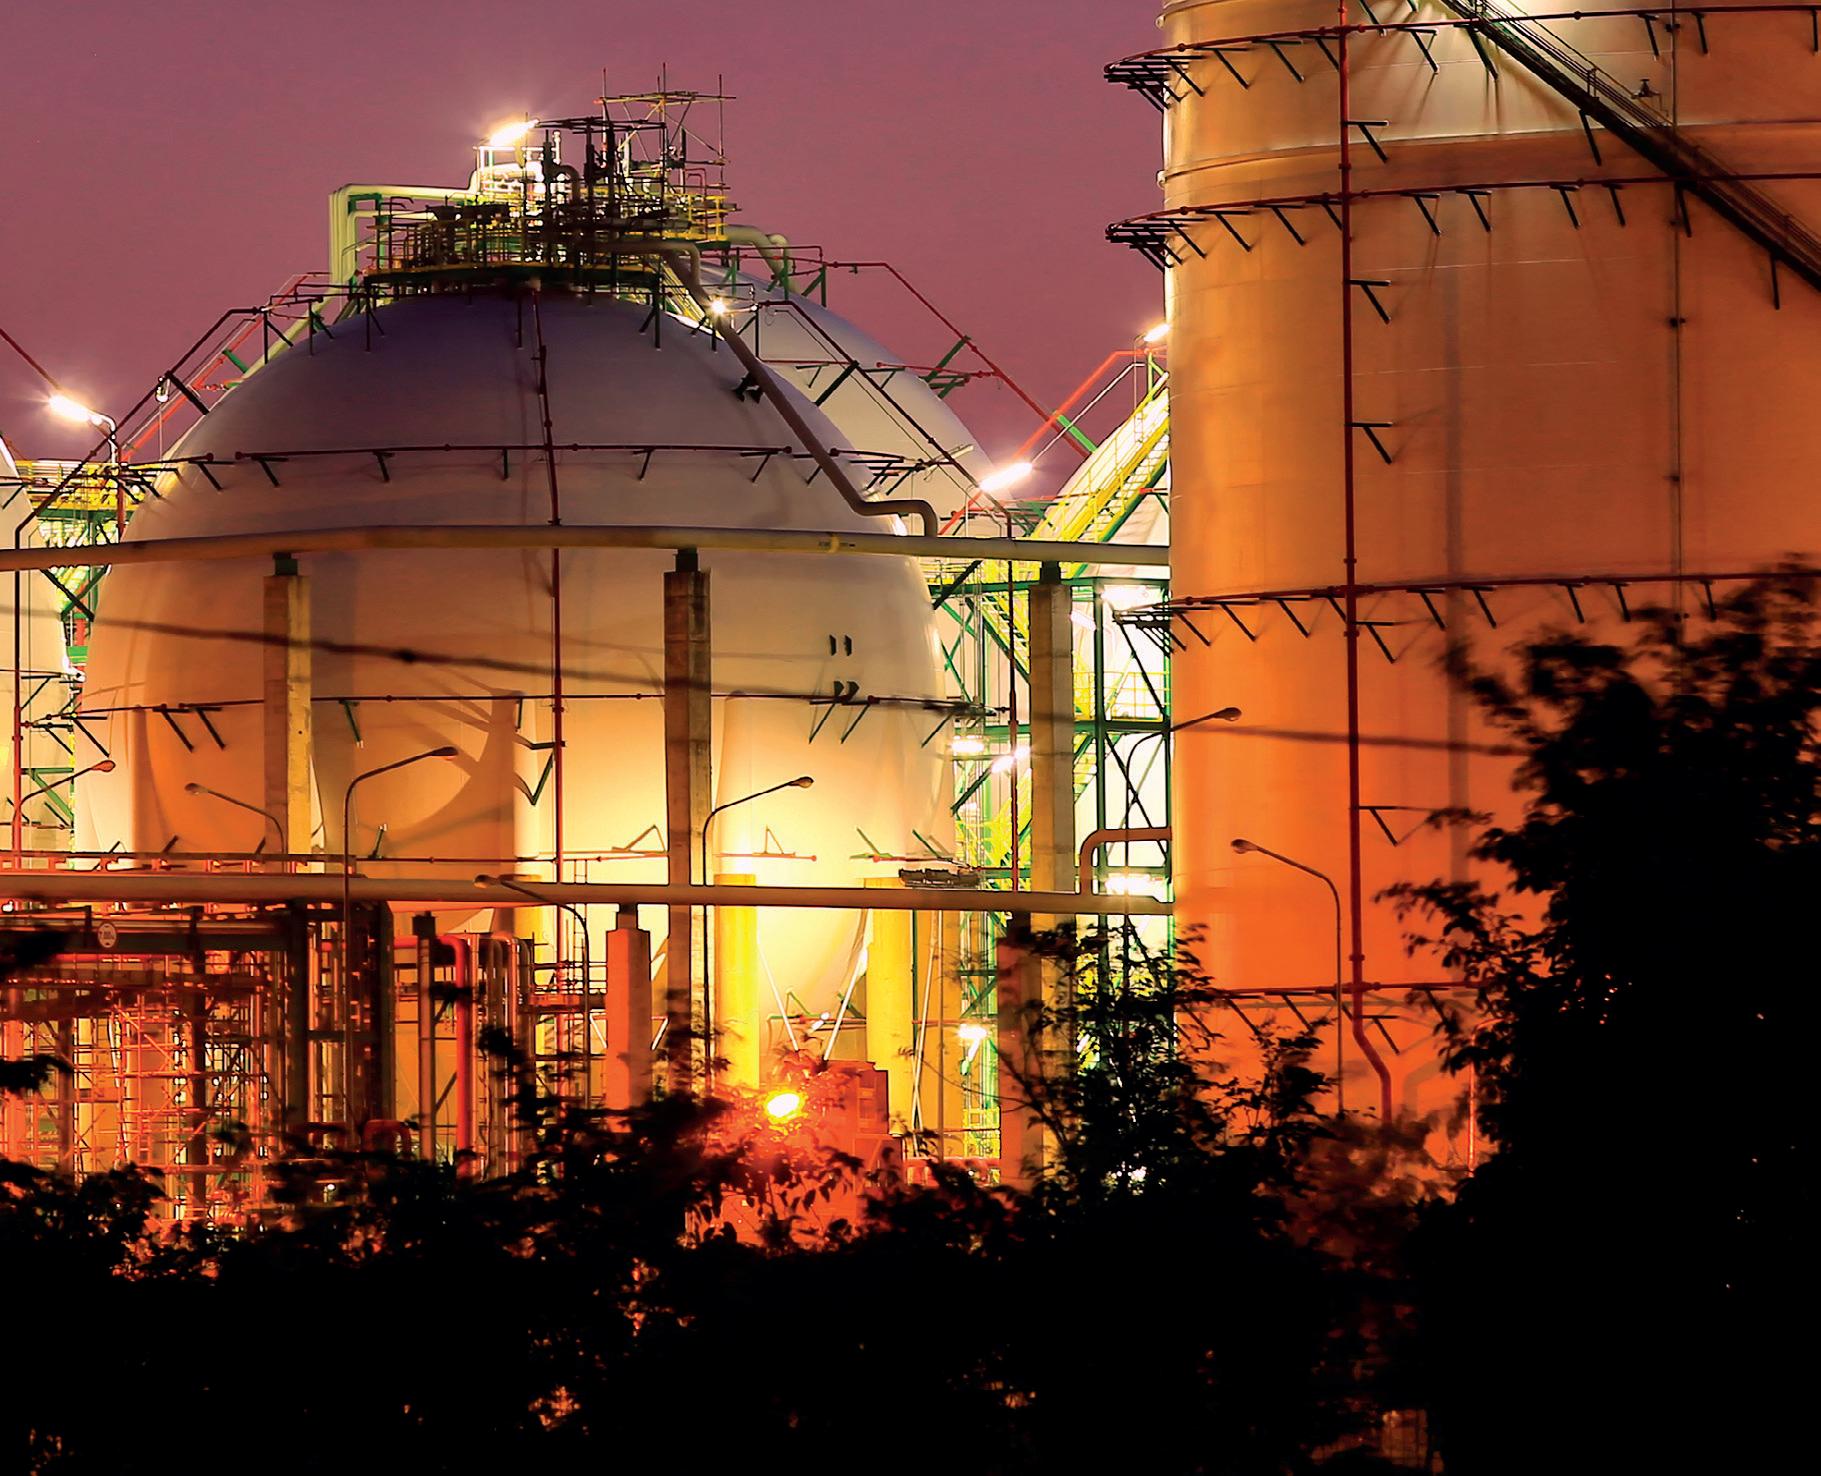
IR emitters within the sensor generate beams of IR light. And, having passed through a sampling chamber, a filter in front of the detector blocks out light that is not at the desired wavelength. In contrast, the detector measures the intensity or attenuation. This is then used to determine the concentration based on the
absorption of IR radiation as it passes through a volume of the gas.

Among their benefits are fast response times and accurate results, without the requirement of additional gases for operation. Technological advances have also resulted in detectors that continuously monitor combustible gases and vapours within the lower explosive limit, and provide alarm indications. These can be deployed within oxygen-deficient or enriched areas, require little calibration, and are immune to sensor poison, contamination or corrosion.
Newer gas analyser instruments use a laser diode mounted on a thermo-electric cooler to tune a laser wavelength to the specific absorption wavelength of a particular molecule. They exploit their high-frequency resolution, which results in enhanced sensitivity – more significant levels of interaction between gas molecules and light in the order of parts per billion (ppb) – and selectivity, as they are tuned to a specific compound of gas. This absorption technology ensures precise gas recognition, eliminating the potential for false alarms, which is an issue with other commonly used gas detection technologies.
Safety is not expensive; it is priceless
Even with the most reliable instruments, the likelihood of workers being injured or killed on the job remains high if the devices are not used properly. In an organisation with a weak safety culture or poor
Umicore Coating Services Ltd Tel: +44 1382 833 022 Email: coatingservices@umicore.com Website: eom.umicore.com/infrared-solutions From prototype design to production scale-up services NIR to FIR filter expertise on Ø100mm/4” wafers with deep blocking In-house dicing capability Complete filter wheel assembly manufacture 30+ years of optical coating experience D i scove r Keep Updated For more news visit: www.hydrocarbonengineering.com Keep up to date with us to hear the latest downstream oil and gas news
processes, team members might not use gas detectors correctly. Worse yet, they might not use them at all.
All teams – even those with the highest skills, experience, and best intentions – need to be supported by safety-conscious management. Too often, gas detection data is collected, stored, and never reviewed. Or worse yet, it is not reviewed until a catastrophic event forces a post-mortem investigation of the numbers. The best way to improve safety culture is by using data. It is essential to take corrective action and mitigate the hazards before it is too late.
As an increased focus on controlling emissions has matured, concerns about evaluating the true depth of individual company commitment to the cause have arisen. These are driven in some measure by environmental activists’ impatience with the rate at which companies have made the energy transition a core part of their focus.
In industry, corporate emissions mitigation metrics are set at the C-level, while the critical details tied to the detection and quantification of GHG emissions are found at ground level. Optical gas imaging (OGI) cameras excel at discovering and identifying such information, which might otherwise be overlooked. They are at the
forefront and drive growing demand for Umicore’s high-precision, thin-film optical filters from OEMs.
Ultimately, companies can positively influence their bottom lines via responsible operations. Investors are careful to avoid risk: if an oil and gas producer’s contribution to climate change represents a business or public relations risk, investors are less likely to judge it worthwhile over the long-term.

From increasing disclosures to stronger investor sentiment, we continue to see upward growth of ESG initiatives in energy-intensive industries. Regulation enforcement has progressively restricted the emissions that can be released, but industry opinion has become a driving force pushing that objective further. Many businesses now view their emissions detection through the lens of ESG. In effect, they hold themselves accountable to their own responsibly-set targets.
References
1. ‘The Global Health Cost of PM2.5 Air Pollution : A Case for Action Beyond 2021’, World Bank, (31 January 2022), https://openknowledge.worldbank.org/handle/10986/36501
2. ‘Gas Detection System Market Evolving Technology and Growth Outlook 2020 to 2025’, Market Insights Reports, (8 April 2020), https://www.openpr.com/news/2102892/gas-detectionsystem-market-evolving-technology-and-growth
41 | KBC, a Yokogawa Company 04 | Ketjen 75 | LNG 2023
15 | Merichem Company
61 | MERYT Catalysts & Innovation
83 | NISTM
17 | Optimized Gas Treating, Inc.
32, 68, 72 & 87 | Palladian Publications 49 | Paratherm
71 | REMBE® GmbH Safety + Control
65 | Sabin Metal Corp.
77 | S.A.T.E.
IFC | Selective Adsorption Associates, Inc. 25 | Sulzer Chemtech
02 | Topsoe
87 | Umicore Coating Services Ltd
OFC & 43 | UNICAT 53 | VEGA
63 | W. R. Grace & Co. 67 | Zwick Armaturen GmbH
March 2023 HYDROCARBON ENGINEERING 88
Page Number | Advertiser 13 | Advanced Refining Technologies (ART) 58 | AFPM International Petrochemical Conference 47 | Ariel Corp. 55 | Axens OBC | BUCHEN-ICS GmbH 07 | Calderys IBC | CALGAVIN
09 | Chevron Lummus Global (CLG) 29 | Crystaphase 31 | Curtiss-Wright EST Group 22 | GEA 26 | General Atomics Electromagnetics 57 | Halliburton, Multi-Chem 81 | Hallwood Modular Buildings 35 | Heat Transfer Research, Inc. (HTRI) 39 | Hitard Engineering 21 | Honeywell Connected Industrial 78 | ILTA 2023 International Operating Conference and Trade Show
AD INDEX
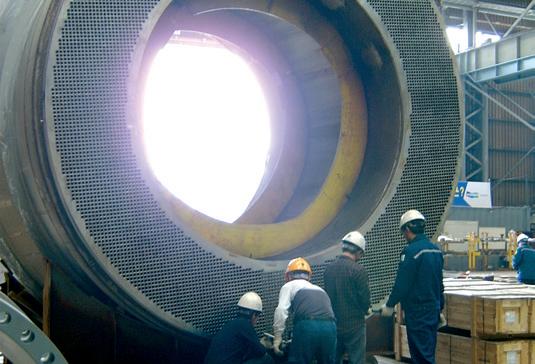
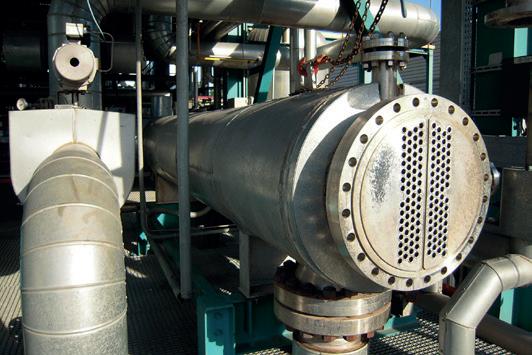
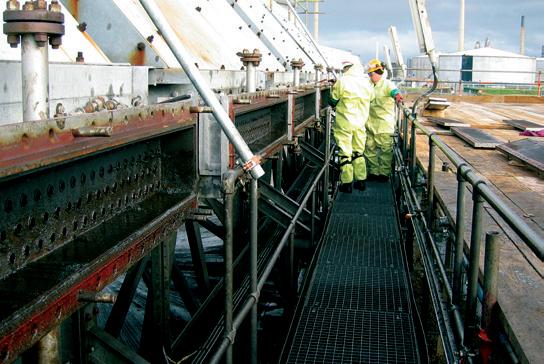
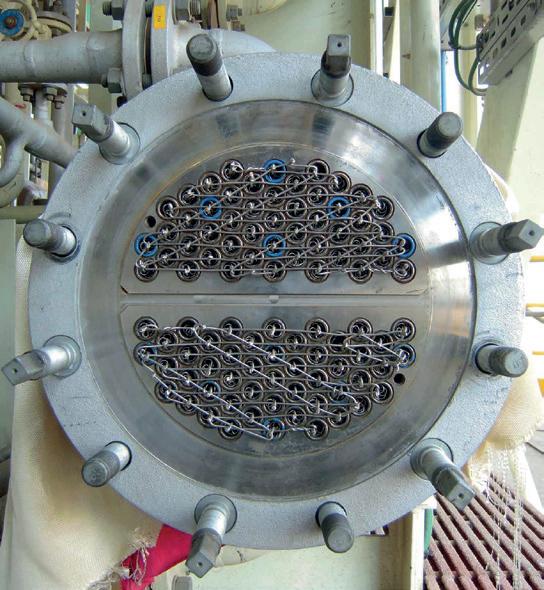
ENHANCING EXCHANGERS FOR SUSTAINABLE AND OPTIMAL PERFORMANCE Reducing energy Increasing performance Reduced carbon emissions Reducing capital costs Reducing operating costs SINOPEC China, EOG Condenser PTT Thailand, Lean/Rich TEG Exchanger VALERO UK, Crude Oil Preheat Exchanger TOTAL Angola, Wet/Dry Crude Exchangers USA, Vent Condenser ESSO Australia, Condensate Heaters PEMEX Mexico, Dry/Wet Crude Exchangers BP Germany, Gas Oil/Crude Cooler LUKOIL Russia, Feed Effluent Exchangers LINDE GAS France, Demin Water Heater ESSAR OIL UK, Diesel Rundown Cooler LUKOIL Russia, Feed Effluent Exchangers PEMEX Mexico, Dry/Wet Crude Exchangers ESSO Australia, Condensate Heaters ESSAR OIL UK, Diesel Rundown Coolers TOTAL Angola, Wet/Dry Crude Exchangers BRASKEM USA, Vent Condenser PTT Thailand, Lean/Rich TEG Exchanger BP Germany, Feed Effluent Exchanger VALERO UK, Crude Oil Preheat Exchanger BP Germany, Gas Oil/Crude Cooler SINOPEC China, EOG Condenser NEXEN PETROLEUM UK, Lean/Rich Glycol Exchanger NEXEN PETROLEUM UK, Lean/Rich Glycol Exchanger CALL US ON +44 (0) 1789 400 401 CALGAVIN.COM
Non-man-entry N catalyst unloading solutions
2
In today’s modern world, there are many good reasons for finding ways to facilitate the unloading of pyrophoric catalysts without entry, in order to minimise the time that specialist workers spend under immediately dangerous to life or health (IDLH) conditions in reactors under a nitrogen blanket.
BUCHEN-ICS has developed a number of technologies in order to achieve this goal. One of these systems is our remote vacuum robot (RVR) – a hydraulically-powered, remotely-operated device that allows dry granular catalyst to be unloaded from outside the confined space. Compared to manual unloading, this system not only reduces the time spent under IDLH conditions, but also increases efficiency by avoiding time-consuming entry checks and preparation.
If you would like to take your safety record to the next level, then be a game changer and simply contact us to find out how this technology can be used for your next turnaround.

BUCHEN-ICS GmbH // Emdener Str. 278 // 50735 Cologne // Germany // T +49 221 7177-0 // vertrieb.ics@buchen.net // buchen-ics.com A company of the REMONDIS Group