April 2023
Understanding fugitive emission technology limitations in severe service


Dr. José-Francisco
(CCUS).
34 Know your limitations
Asmaa Kassab and David Ashwill, MOGAS Industries Inc., USA, discuss fugitive emission technology limitations in severe service valves.
41 Reliable valve operation
Dhanesh Bhaskaran, Valmet, India, details the valve-related challenges and solutions associated with molsieve dryer processes.
45 Performance under pressure
Eric Sallee and Laura Ball, OsecoElfab, USA, explain how to minimise over-pressure risks and maximise performance with rupture discs in a refining or chemical processing facility.
49 Reaping the benefits of optimisation

Andrew
Technip Energies,

Peter Trefzer, Dr. Laurent Solliec and Norbert Strieder, GEA Wiegand, explore how to reduce a refinery’s operating costs by way of optimising vacuum systems.
55 Minor improvements for significant savings
Dr. Sander Willems, Antonio Batistini, Andrea Angeletti and Barbara Morico, Maire Tecnimont Group, Italy, discuss the company’s circular recycling model that is aimed at maximising the valorisation of plastic waste.
29 Know thyself, know thy enemy
Duncan Mitchell, KBC (A Yokogawa company), explains how integrated process and energy models are capable of providing critical insight in the battle against emissions reduction.

THIS MONTH'S FRONT COVER
Johannes Poth, Integrated Global Services, introduces a technology for reducing fuel consumption and carbon dioxide (CO2) emissions in fired heaters.
61 Delivering a greener product
Michael F. Ray and Michael J. Ray, ThioSolv, USA, discuss the use of refinery sulfur processing in anaerobic digester gas clean-up.
65 Sulfur Review
In this year’s annual Sulfur Review, Hydrocarbon Engineering presents a selection of sulfur services and technologies that are available and in use within the downstream oil and gas sector.
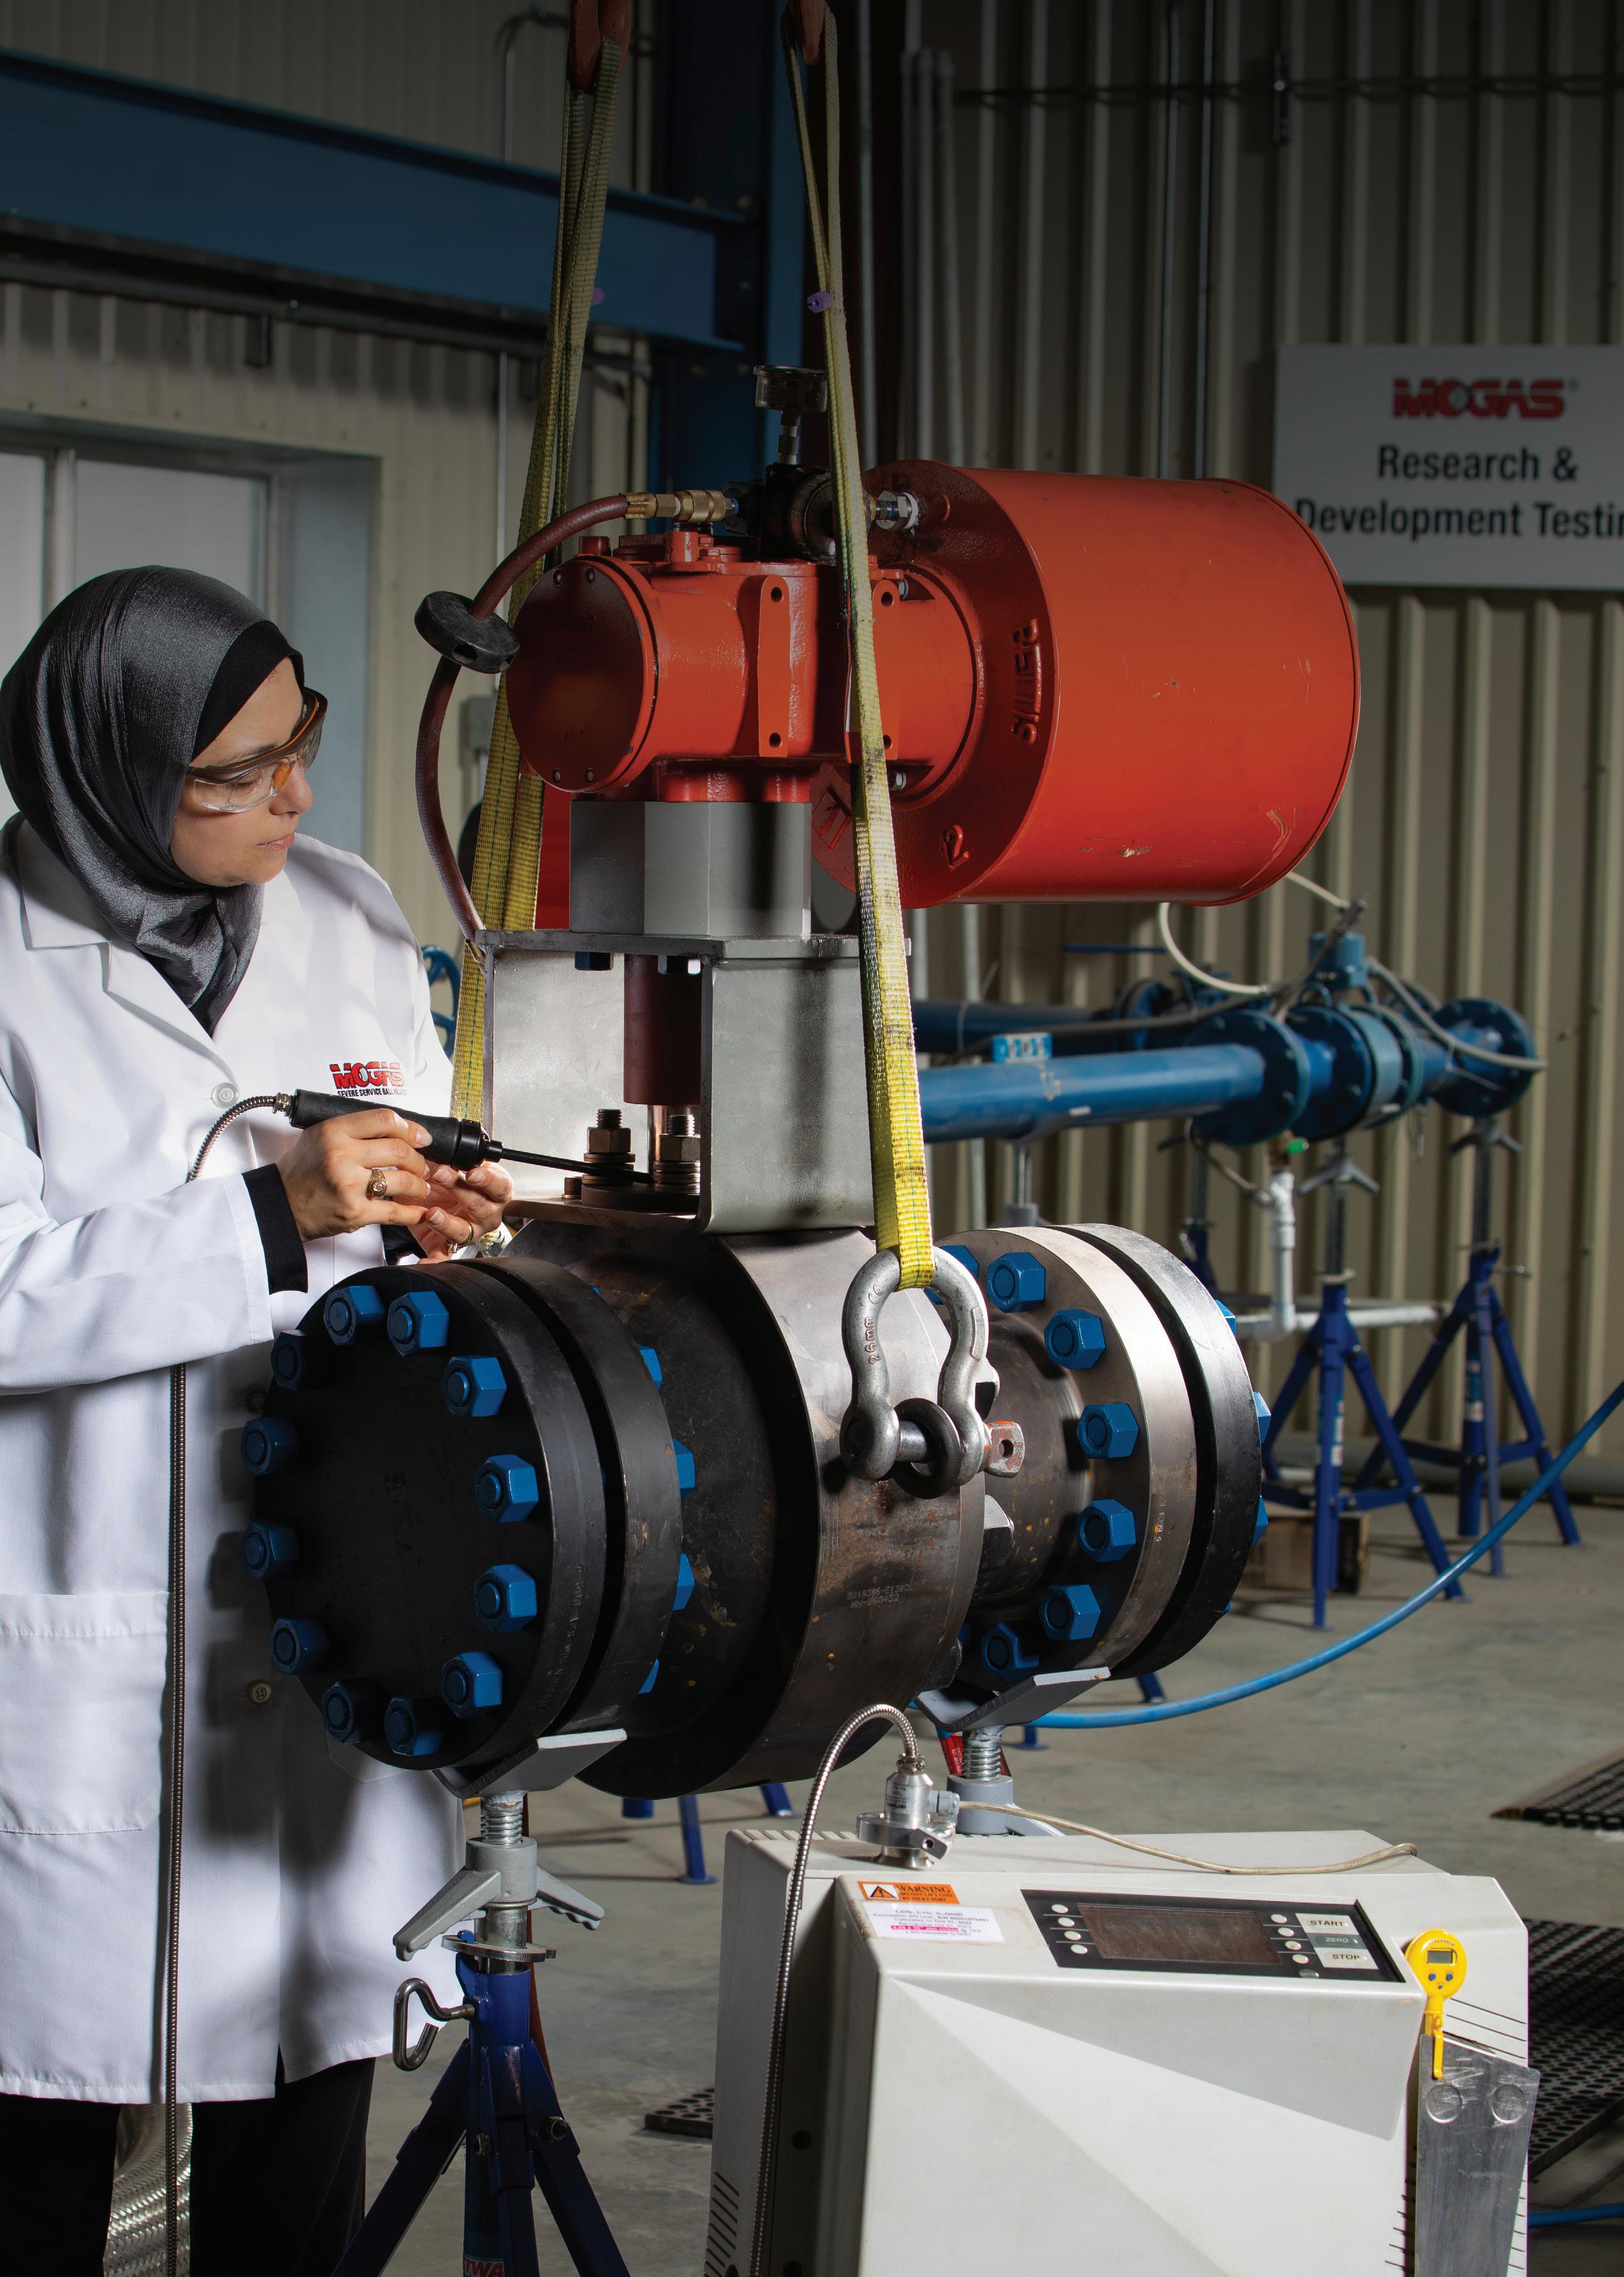
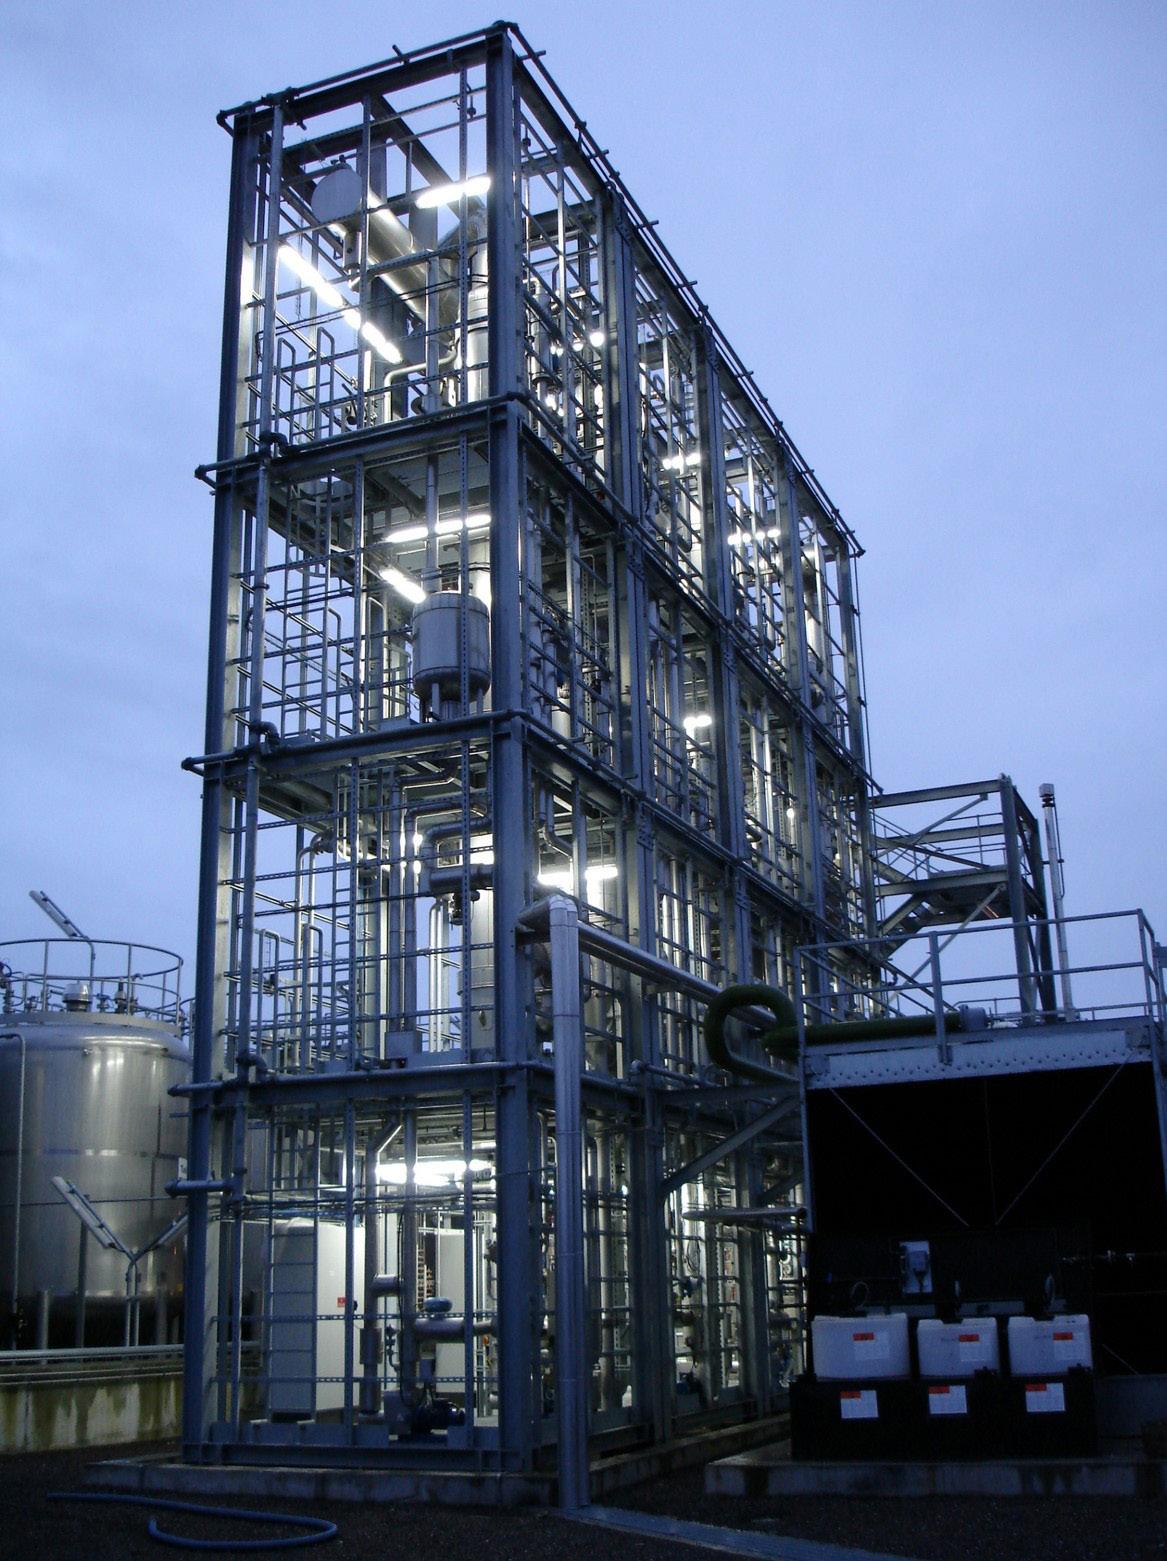
Sustainable low emission valves installed in high temperature severe service applications are a standard offering from MOGAS. The valve pictured is a 6 in. MOGAS ISOLATOR 2.0, ASME 600 Class, that was API 607 fire tested with low FE packing, then FE tested to API 641. Both passed.

CONTENTS Hydrocarbon Engineering Like Join Hydrocarbon Engineering @HydrocarbonEng Follow CONVERSATION JOIN THE 2023 Member of ABC Audit Bureau of Circulations Copyright© Palladian Publications Ltd 2023. All rights reserved. No part of this publication may be reproduced, stored in a retrieval system, or transmitted in any form or by any means, electronic, mechanical, photocopying, recording or otherwise, without the prior permission of the copyright owner. All views expressed in this journal are those of the respective contributors and are not necessarily the opinions of the publisher, neither do the publishers endorse any of the claims made in the articles or the advertisements. Printed in the UK. CBP006075 April 2023 Volume 28 Number 04 ISSN 1468-9340 03 Comment 05 World news 08 Local market growth in MENA Nancy Yamaguchi, Contributing Editor, discusses the trends in production and petroleum product
in the MENA region, and unpacks the knock-on effects of the
15 Capturing
demand
COVID-19 pandemic.
the right opportunities
Pérez-Calvo,
facilities
in carbon capture, utilisation
19 Sustainable chemicals
Sulzer Chemtech, outlines what hydrocarbon processing
should consider when investing
and storage
enabled by circularity
consider ways in which
order to meet the net zero challenge. 23 Plastic waste: the crude oil of the third millennium
Reynolds and Andreas Bormann,
the chemical industry is adapting in
Cut your CO2 emissions in half with ET Black™ Carbon Black Technology
ET Black™ is a state-ofthe-art technology that complies with the most stringent environmental regulations now and in the future.


Plus, the flexibility to produce all ASTM grades, and specialty grades, in a single plant. ET Black™, the technology of reference for producing carbon black obtained by thermal decomposition of highly aromatic oils.


Find out more at: www.igoforETBlack.com
CONTACT INFO
MANAGING EDITOR James Little james.little@palladianpublications.com
SENIOR EDITOR Callum O'Reilly callum.oreilly@palladianpublications.com
ASSISTANT EDITOR Bella Weetch bella.weetch@palladianpublications.com
SALES DIRECTOR Rod Hardy rod.hardy@palladianpublications.com
SALES MANAGER Chris Atkin chris.atkin@palladianpublications.com

SALES EXECUTIVE Sophie Birss sophie.birss@palladianpublications.com
PRODUCTION MANAGER Kyla Waller kyla.waller@palladianpublications.com
EVENTS MANAGER Louise Cameron louise.cameron@palladianpublications.com
EVENTS COORDINATOR Stirling Viljoen stirling.viljoen@palladianpublications.com
DIGITAL CONTENT ASSISTANT Merili Jurivete merili.jurivete@palladianpublications.com
DIGITAL ADMINISTRATOR Leah Jones leah.jones@palladianpublications.com
ADMIN MANAGER Laura White laura.white@palladianpublications.com
CONTRIBUTING EDITOR
Nancy Yamaguchi Gordon Cope
SUBSCRIPTION RATES
Annual subscription £110 UK including postage /£125 overseas (postage airmail).
Two year discounted rate £176 UK including postage/£200 overseas (postage airmail).
SUBSCRIPTION CLAIMS
Claims for non receipt of issues must be made within 3 months of publication of the issue or they will not be honoured without charge.
APPLICABLE ONLY TO USA & CANADA
Hydrocarbon Engineering (ISSN No: 1468-9340, USPS No: 020-998) is published monthly by Palladian Publications Ltd GBR and distributed in the USA by Asendia USA, 17B S Middlesex Ave, Monroe NJ 08831. Periodicals postage paid New Brunswick, NJ and additional mailing offices. POSTMASTER: send address changes to HYDROCARBON ENGINEERING, 701C Ashland Ave, Folcroft PA 19032.
15 South Street, Farnham, Surrey
GU9 7QU, UK Tel: +44 (0) 1252 718 999
COM MENT
CALLUM O'REILLY SENIOR EDITOR
Back in November, I commented on the wave of discontent spreading across Europe as workers from various industries downed tools over pay and working conditions. Although some of these disputes have now been resolved, many strikes are still ongoing. As I write this, Germany’s transport sector is at a near standstill as the country experiences a ‘mega strike’ (as it has been dubbed by the German media) with staff at airports, ports, railways, buses and subways all walking out. Meanwhile, in France, national strikes over the government’s proposed pension reforms are causing chaos, particularly for the country’s oil processing industry, which is running at a fraction of normal capacity. Bloomberg reports that four of the country’s six refineries are barely operating after ExxonMobil started taking its largest facility out of service due to the fact that it cannot get crude into the site.1 This, of course, has repercussions for the global oil market.
At a time when worker unrest is widespread, Airswift’s latest ‘Global Energy Talent Index’ report makes for particularly interesting reading. The annual energy workforce trends report suggests that job satisfaction in both the oil and gas and petrochemicals sectors is high. The petrochemicals sector, in particular, records a very settled workforce, with 57% of respondents not considering a move outside of the sector. Perhaps unsurprisingly, given the global cost of living crisis, remuneration was listed as having the most positive impact on job satisfaction, followed by factors including benefits, job excitement and flexible working conditions.
However, there are some red flags within the report. Airswift warns that the oil and gas sector risks losing its multi-skilled, mobile workforce to other industries. Ilda Andaluz, Executive Vice President of Global Human Resources at Varel Energy Solutions, notes: “The digitalisation and diversification of industry portfolios means the workforce increasingly has skills synergies with other sectors, such as technology, that make them appealing.” 80% of respondents have been approached about another job in the past year, and 85% are considering switching to another role, with renewables (49%) top of the wish list. Career progression is the main driver for a change of jobs, while interest in the wider industry and ESG are also key factors. And on the topic of the environment, 21% of oil and gas workers say their employers are not doing enough to enable the energy transition, which could impact efforts to attract and retain an ESG-conscious workforce. The majority of respondents welcomed changes as a result of the energy transition, with 38% noting that they enjoy their role more as a result. Interestingly, responses in the petrochemical sector were a little more split, with 37% of respondents enjoying their role more as a result of changes brought about by the energy transition, and 20% enjoying it less.
There is also a warning that recruitment and retention have been casualties of recent inflation and supply chain costs, while investments in technology and digitalisation have also been negatively impacted, particularly in the petrochemicals sector. And there are some concerning statistics about the gender divide within the report. In the oil and gas sector, 36% of female respondents said that their views are listened to and have an impact on company policy (vs 46% of men), and in the petrochemicals sector 42% of men feel comfortable expressing their values and views at work compared to just 16% of women. These are statistics that obviously need immediate attention as the energy sector seeks to expand its recruitment and retention efforts to improve gender equality.
 1. GRAHAM, R., ‘French Refining Is Barely Running as Strikes Enter Week Four’, Bloomberg UK, (27 March 2023).
-------END TO END SULPHUR PROCESSING AND HANDLING SOLUTIONS

We are a world leading manufacturer of sulphur processing equipment as well as solutions for downstream silo/stockpile storage and reclamation, and bulk loading systems for truck, rail and ships.
ROTOFORM PASTILLATION
With 700+ systems in use by the sulphur industry, Rotoform is the world’s most widely used process for small to mid-capacity production of premium quality pastilles and offers unrivalled product uniformity and environmentally friendly operation.
SG DRUM GRANULATION
Where higher capacity is required, our SG rotating drum system is a fully automated, ‘once through’, sulphur granulation process based on a size enlargement process by continued coating of seed material.
KEY FEATURES
Solidification capacity up to 280 mtpd.
Duplex steel belts alloyed for maximum lifetime.
Pastilles according to SUDIC premium quality spec.
KEY FEATURES
Capacity up to 2,000 mtpd.
Single pass, no need for screens.
Process simulation to suit all conditions.
Simple operation, precise control.
ipco.com/sulphur
Pastilles Steel belt Rotating shell Heating channel Heating channel Cooling spray Sulphur nuclei particles Sulphur granules Sulphur spray Rotating drum Flights
WORLD NEWS
China | Aramco JV HAPCO to commence construction of refinery and petrochemical complex
Aramco and joint venture (JV) partners NORINCO Group and Panjin Xincheng Industrial Group plan to start construction of a major integrated refinery and petrochemical complex in northeast China.
Huajin Aramco Petrochemical Co. (HAPCO), a JV between Aramco (30%), NORINCO Group (51%) and Panjin Xincheng Industrial Group (19%), is developing the complex that will combine a 300 000 bpd refinery and a petrochemical plant with a
production capacity of 1.65 million tpy of ethylene and 2 million tpy of paraxylene.
Construction is due to start in 2Q23 after the project secures the required administrative approvals. It is expected to be fully operational by 2026.
Aramco will supply up to 210 000 bpd of crude oil feedstock to the complex, which is being built in the city of Panjin, in China’s Liaoning province.
India | Chevron Lummus Global technology chosen for Mumbai Refinery
Chevron Lummus Global LLC (CLG) has announced that Bharat Petroleum Corp. Ltd (BPCL) has selected its ISOFINISHING technology for a catalytic processing unit at the Mumbai Refinery in Mumbai, India.
Once complete, the unit will have a capacity of 200 000 tpy and will be the first catalytic process unit to manufacture de-aromatised
solvents and white oil in India. These specialty products will meet India’s domestic standards and international standards, and will serve as a substitute for these types of products that are currently being imported into India.
CLG’s project scope includes the technology license, engineering services, proprietary equipment, and catalyst supply.
USA | Sempra launches Port Arthur LNG project
Sempra has announced that its 70%-owned subsidiary, Sempra Infrastructure Partners LP, has reached a positive final investment decision (FID) for the development, construction and operation of the Port Arthur LNG Phase 1 project in Jefferson County, Texas, US.
Sempra Infrastructure closed its joint venture (JV) with an affiliate of ConocoPhillips, and announced an agreement to sell an indirect, non-controlling interest in the project to an infrastructure fund managed by KKR. Additionally, Sempra Infrastructure announced the closing of the project’s US$6.8 billion non-recourse debt financing and the issuance of the final notice to proceed under the project’s engineering, procurement and construction (EPC) agreement.
The Port Arthur LNG Phase 1 project is fully permitted and is designed to include two natural gas liquefaction trains, two LNG storage tanks and associated facilities with a nameplate capacity of approximately 13 million tpy. Total CAPEX for the Port Arthur Phase 1 project is estimated at US$13 billion.
USA | Technip Energies commences study for Texas Green Fuels export complex
Technip Energies has been selected by Texas Green Fuels (TGF) to commence pre-FEED for the TGF Galveston Bay clean fuels export project.
TGF’s export complex will produce industrial-scale, cost-effective, and sustainable fuels such as clean ammonia, hydrogen, and methanol for both domestic and export markets.
Technip Energies will perform pre-FEED, which will enable TGF to confirm the technical and economic feasibility of the project.
The partnership will leverage Technip Energies’ global expertise to extend through engineering, procurement and construction (EPC) of the TGF complex.
TGF’s mission is to support global net zero objectives that mitigate the
adverse impacts of climate change by developing projects that convert the world’s abundant, low-cost renewable electricity into clean fuels. These clean products are produced using renewable electricity for all electricity requirements.
Final investment decision (FID) on the TGF export complex is expected in 2025, with commercial operations commencing in 2028.
April 2023 HYDROCARBON ENGINEERING 5
DIARY DATES
12 - 14 April 2023
25th International Aboveground Storage Tank Conference & Trade Show
Orlando, Florida, USA www.nistm.org
20 April 2023
Global Hydrogen Conference
Online
www.globalhydrogenreview.com/events/globalhydrogen-conference-2023/
25 - 27 April 2023
Sulphur World Symposium
Edinburgh, Scotland www.sulphurinstitute.org/symposium-2023
08 - 12 May 2023
RefComm
Galveston, Texas, USA events.crugroup.com/refcomm
22 - 24 May 2023
ILTA 2023 International Operating Conference and Trade Show
Houston, Texas, USA ilta2023.ilta.org
07 - 08 June 2023
Downstream USA 2023
Galveston, Texas, USA events.reutersevents.com/petchem/downstream-usa
07 - 08 June 2023
Valve World Americas Expo & Conference Houston, Texas, USA www.valveworldexpoamericas.com
13 - 15 June 2023
Global Energy Show Calgary, Alberta, Canada www.globalenergyshow.com
10 - 13 July 2023
LNG2023
Vancouver, British Columbia, Canada www.lng2023.org
05 - 08 September 2023
Gastech Singapore www.gastechevent.com
26 - 28 September 2023
Turbomachinery & Pump Symposia Houston, Texas, USA tps.tamu.edu
USA | Europe became primary destination for US LNG exports in 2022
US exports of LNG averaged 10.6 billion ft3/d in 2022, increasing by 9% (0.8 billion ft3/d) compared with 2021, according to the latest ‘Natural Gas Monthly’ report from the US Energy Information Administration (EIA).
The increase in US LNG exports was driven by strong LNG demand in Europe, high international natural gas prices, and expanded US liquefaction capacity. US LNG exports to Europe increased 141%, or 4 billion ft3/d, compared with 2021.
US LNG exports to Europe increased as a result of both natural gas supply challenges in Europe after Russia’s pipeline exports to the region declined to 40-year lows, and higher prices at Europe’s natural gas trading hubs relative to other LNG markets.
Europe became the primary destination for US LNG exports in 2022, accounting for 64% (6.8 billion ft3/d) of total exports. France, the UK, Spain, and the Netherlands accounted for a combined 74% (5 billion ft3/d) of US LNG exports to the region.
UK | Shell Blue Hydrogen Process selected
Uniper and Shell UK Ltd have awarded Shell Catalysts & Technologies a contract to deliver a process design package for the Humber H2ub® project, using the Shell Blue Hydrogen Process (SBHP).
The deal could see the technology deployed at Uniper and Shell UK’s proposed project in the Humber, UK, which aims to produce low-carbon hydrogen.
Two other companies are also working on plant design proposals for the project, and the one that is selected will become the project’s preferred low-carbon hydrogen
production technology provider. That company will also support the project’s FEED and EPC stages, ahead of the final investment decision (FID), which is expected by around 2025.
The proposals involve building a blue hydrogen production unit at Uniper’s Killingholme site in the UK, which will be capable of generating 720 MW of low-carbon hydrogen from natural gas. The carbon dioxide (CO2) produced as a result of this process, estimated to be 1.6 million tpy, would be captured and stored permanently in a geological formation in the North Sea.
USA | Chart Industries completes acquisition of Howden
Chart Industries Inc. has completed its acquisition of Howden from affiliates of KPS Capital Partners LP (KPS).
The strategic combination of Chart and Howden expands the company’s offering of products and solutions across clean power, clean water, clean food and clean industrials. The combination also provides access to new specialty
products and ESG-linked end markets such as nuclear, energy recovery and electrification.
In a statement, Chart said that the complementary nature of the equipment and solution portfolios results in a differentiated offering across stationary and rotating equipment.
Chart paid a purchase price of approximately US$4.4 billion in cash.
April 2023 HYDROCARBON
WORLD NEWS
ENGINEERING 6
MAKE EVERY MOLECULE MATTER

At Shell Catalysts & Technologies, we understand how small, unseen chemical reactions can affect the health of our loved ones, neighbours, and the planet at large. That’s what motivates us in our mission to Make Every Molecule Matter. Every member of our team is focused on the same goal — developing cleaner energy solutions that enable industries to tackle global climate challenges starting at the molecular level. Together, our experienced scientists and expert engineers put our diverse, unique owneroperator expertise to work — collaborating with you to create solutions that can solve your specific emissions and energy efficiency challenges.
Learn more at catalysts.shell.com/MEMM

8 April 2023 HYDROCARBON ENGINEERING
The Middle East and North Africa (MENA) region, encompasses the Middle Eastern countries of Bahrain, Iran, Iraq, Kuwait, Israel, Jordan, Kuwait, Lebanon, Oman, Palestine, Qatar, Saudi Arabia, Syria, the UAE and Yemen; and North African countries of Algeria, Egypt, Libya, Morocco and Tunisia. MENA is home to the key OPEC members that are collectively responsible for the bulk of OPEC crude production, plus some significant non-OPEC oil producers, such as Bahrain, Egypt, Oman and Qatar. Qatar left OPEC effective January 2019, citing its decision to focus on natural gas development rather than petroleum. Qatar remains a member of the Organization of Arab Petroleum Exporting Countries (OAPEC) which includes all of MENA’s oil exporters save Iran, as Persians are not Arabs. While most of the MENA countries possess oil resources, some produce little or no oil, and are import-dependent. These include Morocco, Tunisia, Jordan, Lebanon, Israel, Palestine, Syria and Yemen. OAPEC tracks fuel consumption data for MENA countries excluding Israel and Palestine.
This article will provide an update on MENA’s petroleum sector, chiefly trends in production and petroleum product demand, and the recent dip-recovery cycle caused by the COVID-19 pandemic. Data quality and timelines vary significantly among these 19 countries. Most data series on consumption extend only to 2020 or 2021, though data on crude production among OPEC countries is available through to January 2023. The discussion and graphics in this article rely on the most recent series that can be completed for all 19 MENA countries.

Oil export revenues rebound
The COVID-19 pandemic cut global oil demand, and as oil prices fell, so did net export revenues for MENA oil producers. As demand recovered, oil prices began to climb. Russia’s invasion of Ukraine led to a price spike in the summer of 2022, with Brent crude spot prices averaging US$122.71/bbl in June 2022. Prices have retreated from this peak, and Brent spot prices averaged US$82.50/bbl in January 2023. These remain strong prices, however, when
April 2023 9 HYDROCARBON ENGINEERING
Nancy Yamaguchi, Contributing Editor, discusses the trends in production and petroleum product demand in the MENA region, and unpacks the knock-on effects of the COVID-19 pandemic.
recalling that in late 2019, before the pandemic hit in force, Brent spot prices were in the range of US$55 – 70/bbl.
The strength of oil prices is creating a resurgence in oil export revenues. This favours the OPEC countries, and in many ways acts against the interests of OPEC’s neighbours, as it widens the gap between the oil ‘haves and have-nots’. Replenishing government coffers with oil revenues is supporting energy sector investments once again, but new projects cannot be built overnight, and many MENA countries struggle to maintain the energy infrastructure that they already possess.
Civil conflict has hindered development in many areas over the years. Libya offers perhaps the most famous example, with its staggering fluctuations in crude production, refinery utilisation, exports and demand. Syria has also been plagued with civil conflict since 2011, which caused a collapse in its oil output. In 2010, the country produced approximately 383 300 bpd of oil. This plunged to 70 800 bpd in 2021. Sadly, the region is now suffering a severe humanitarian crisis in the aftermath of the 2023 Turkey-Syria earthquakes. In early
February 2023, an extreme 7.8 magnitude quake hit south-central Turkey and northwestern Syria, followed by a 7.5 magnitude quake, and then followed by a 6.3 magnitude aftershock. At the time of writing, over 51 000 deaths have been confirmed, approximately 44 300 in Turkey and 6700 in Syria. Dealing with this disaster will be at the forefront of regional priorities in 2023.
The COVID-19 pandemic caused a sharp contraction in OPEC oil export revenues. The US Energy Information Administration (EIA) calculated that OPEC net oil export revenues dropped from US$595 billion in 2019 to US$320 billion in 2020. In 2021, revenues recovered to US$570 billion. In 2022, the EIA estimates that revenues jumped to US$907 billion, propelled upward by demand growth and Russia’s invasion of Ukraine. The EIA forecasts that OPEC revenues will decline from this peak in 2023, though at a hefty US$835 billion this level will remain comfortably above pre-pandemic levels.
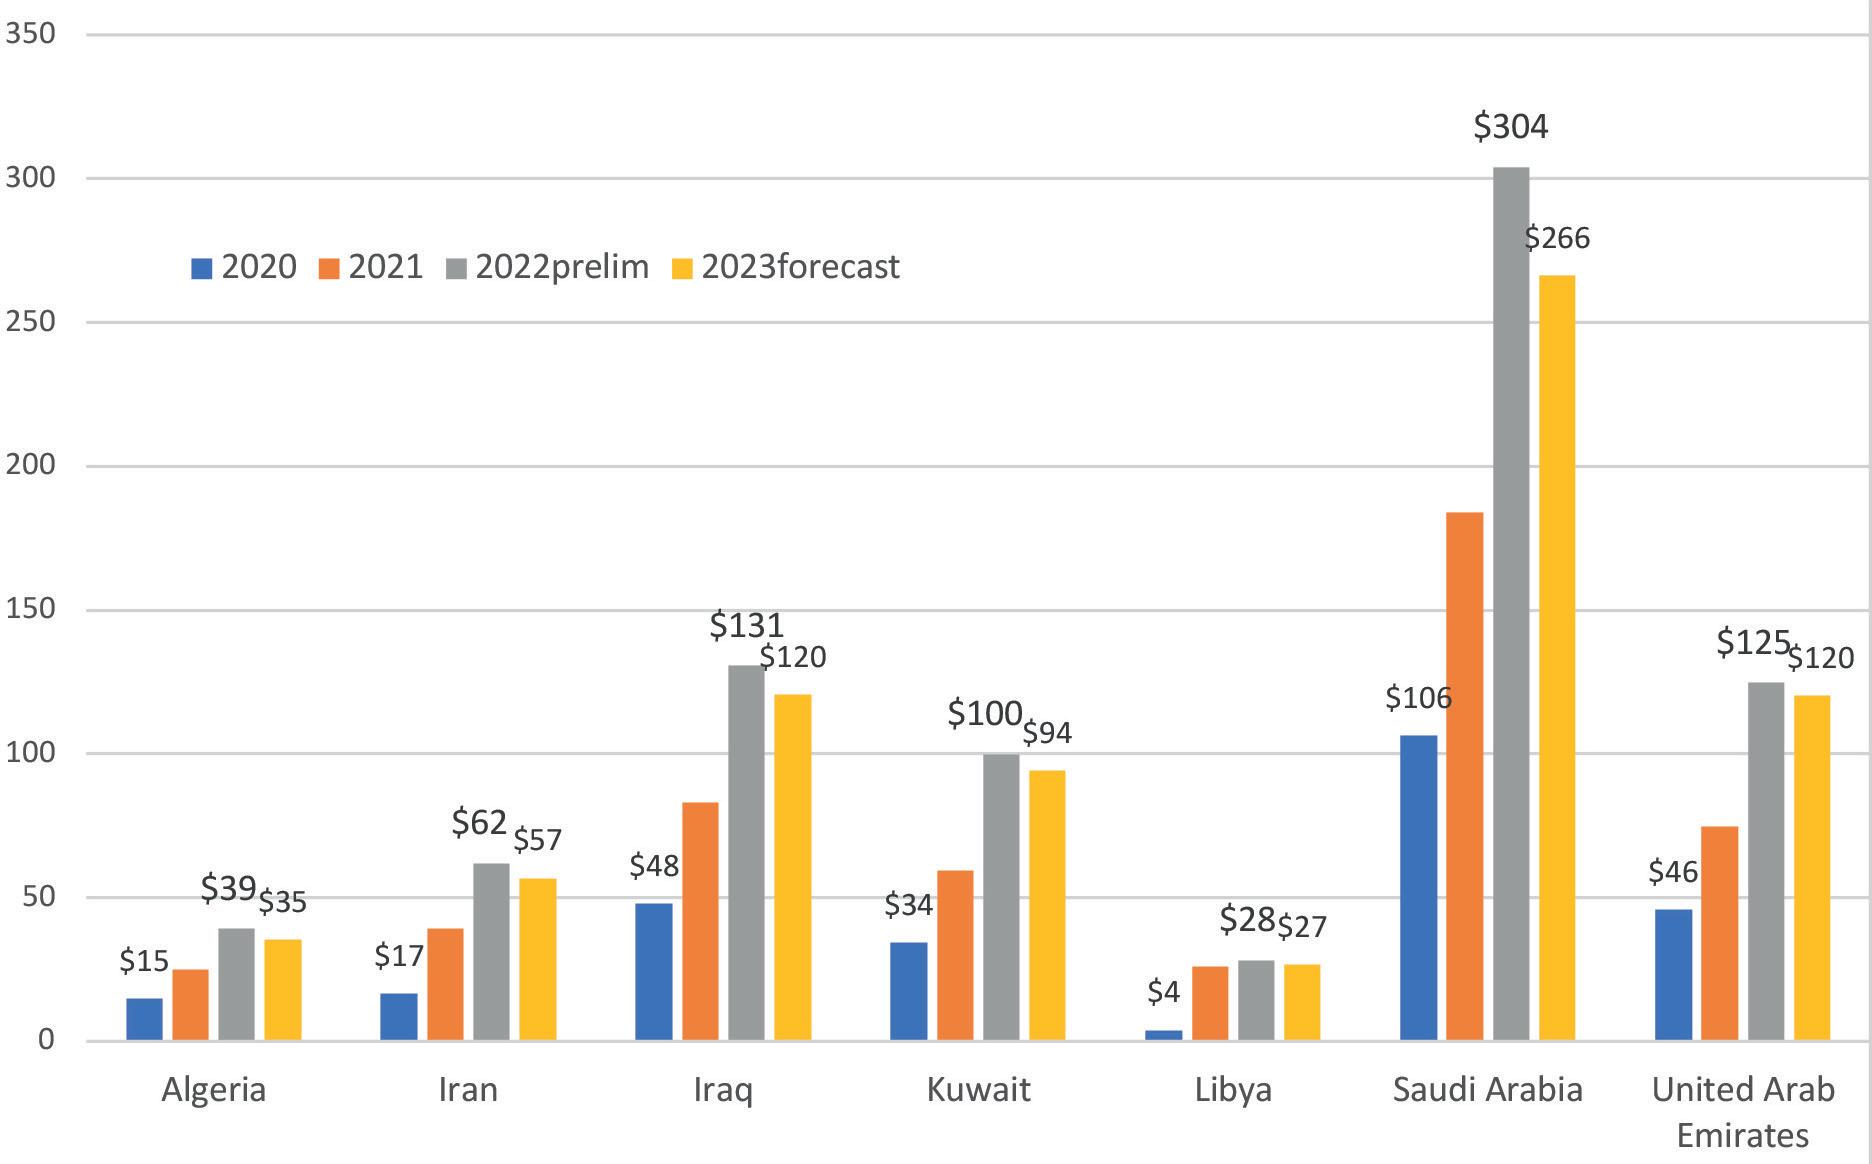
Figure 1 presents details of oil export revenues in the MENA OPEC countries. Saudi Arabia is the largest earner by far, followed by Iraq and the UAE. Saudi Arabian revenues jumped back nearly threefold from US$106 billion in 2020 to US$304 billion in 2022. Revenues are forecast to decline to US$266 billion in 2023. In Iraq, revenues recovered from US$48 billion in 2020 to US$131 billion in 2022, with a forecast US$120 billion in 2023. UAE revenues of US$46 billion in 2020 rebounded to US$125 billion in 2022, and they are forecast to be US$120 billion in 2023. MENA OPEC revenues dropped to US$270 billion in total in 2020, recovered to US$491 billion in 2021, soared to US$789 billion in 2022, and are forecast to retreat slightly to US$720 billion in 2023. These seven MENA countries accounted for 87% of total OPEC net oil export revenue in 2022, the non-MENA OPEC countries being Angola, Nigeria, Congo, Equatorial Guinea, Gabon and Venezuela.
Recovery in MENA oil production
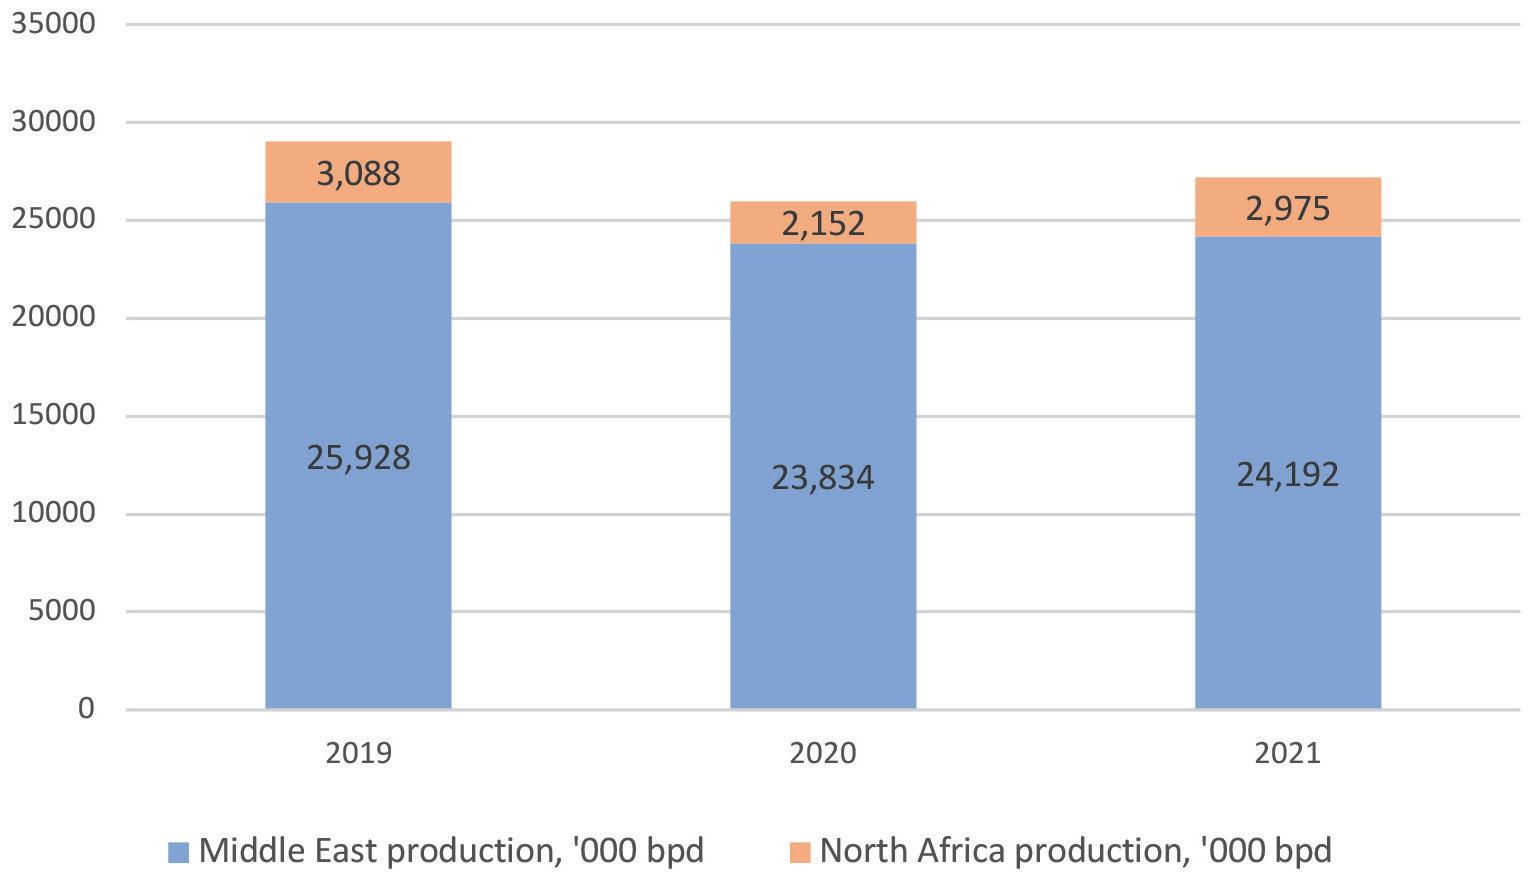
From 2019 to 2020, MENA crude and condensate production fell by 3.03 million bpd. Middle Eastern production fell by 2.09 million bpd while North African production fell 0.93 million bpd. In 2021, Middle Eastern production regained 0.359 million bpd, and North African production recovered by 0.823 million bpd, for a total of 1.18 million bpd. This pattern is depicted in Figure 2. Production continued to rebound in 2022 for most of the MENA countries. However, according to OPEC, North African crude production declined slightly in 2022 because of a production decrease in Libya. OPEC reported that all Middle Eastern OPEC countries saw
April 2023 HYDROCARBON ENGINEERING 10
Figure 1. MENA OPEC net oil export revenues pre-and post-pandemic, US$ billion (source: EIA).
Figure 2. Decline and recovery of MENA crude and condensate production 2019 – 2021, ‘000 bpd (source: EIA).
License to thrill Process alternative feedstock with confidence
Adjusting existing units to new feedstocks is challenging and uncertain. As you transform your operations to meet new market demands, Sulzer Chemtech brings expertise to help operators efficiently process pyrolysis oils from waste plastics and biofuels with innovative licensing technologies and purification systems.


Contact us for more information chemtech@sulzer.com
Sulzer Chemtech – We make chemistry happen!
production continue to rise, with 2022 crude production rising by 2.587 million bpd above 2021 levels.
As prices have recovered and revenue has risen, oil rigs have been returning to active status. According to the Baker Hughes Rig Count, active rigs in the Middle East fell from 414 in 2019 to 265 in 2021, but 2022 brought a recovery to 308 rigs. In Africa, the rig count fell from 117 in 2019 to 69 in 2021, then recovered to 82 in 2022.1
MENA fuel demand
Fuel demand is often difficult to measure precisely and to report quickly. This section focuses on country-level and fuel level MENA demand through the year 2021. It relies mainly on the work of the EIA, supplemented by OAPEC data. These organisations make data available to the public, and they cover each country individually.
The fact that the table and figures within this article appear crowded is part of what defines the region. MENA countries cover a large geographic area, composed of numerous markets – many of which are quite small. Yet taken as a whole, MENA constitutes a significant and growing market. According to BP, during the decade 2011 – 2021, Middle Eastern oil demand grew at 0.6%/yr on average, and African demand grew at 1.4%/yr on average.2 Only the Asia Pacific market grew more swiftly, averaging growth of 2.3%/yr, led by giants China and India. Demand in the CIS region expanded by 0.9%/yr. In contrast, North American demand declined by -0.1%/yr, whilst demand in South and Central America fell by -0.8%/yr. European demand declined by -1.0%/yr.
OPEC forecasts that Middle Eastern oil demand rose by approximately 46 000 bpd in 2022, and that another 33 000 bpd of demand will be added in 2023. African demand rose by 16 000 bpd in 2022, and another 19 000 bpd of demand will be added in 2023.
Table 1 presents country-level demand for the MENA countries, ranging from small markets of under 100 000 bpd (Bahrain, Jordan, Palestine, Yemen and Tunisia) to large markets
of 500 000 bpd and above (Iran, Iraq, Saudi Arabia, the UAE and Egypt).
At the fuel level, MENA’s demand barrel is weighted toward diesel. In 2021, North Africa consumed approximately 768 000 bpd of diesel, while the Middle East consumed approximately 1 876 000 bpd, for a MENA total of 2 644 000 bpd. This may not seem large by European standards, but according to BP, it exceeded diesel demand in South and Central America, which was 2 220 000 bpd in 2021.2 MENA’s largest diesel markets are Iran, Saudi Arabia and Iraq.
Gasoline demand in 2021 averaged approximately 405 000 bpd in North Africa and 1 681 000 bpd in the Middle East, for a MENA total of 2 086 000 bpd. The largest gasoline consumers in MENA are Iran, Saudi Arabia, the UAE and Iraq. MENA’s gasoline market is significantly larger than the EU market, where BP reported that 2021 market demand was 1 465 000 bpd.2
MENA internal product trade
Refinery utilisation and domestic markets
The COVID-19 pandemic caused MENA refinery utilisation rates to drop significantly in 2020. According to BP, Middle Eastern utilisation rates fell from 87.2% in 2018, to 83.9% in 2019, then to 76.5% in 2020. African utilisation fell from 62.3% in 2018, to 61.4% in 2019, then to 54% in 2020. BP reported that Middle Eastern utilisation rates improved to 79.2% in 2021, while African utilisation rates rose to 56%. These rates are well below what most refineries require to be considered profitable.2
Although some of the MENA countries are small markets, together they make a sizeable market that is still desirous of growth and development. This contrasts with many larger markets, where growth rates are slow or perhaps already in negative territory. In the 1980s and 1990s, Saudi Arabia led the region by becoming the first major export-oriented refining centre. The goal was to capture the value-added of processing domestic crude oils and gaining market share in Europe, Asia and the Americas. Other countries followed suit, and MENA refinery capacity expanded dramatically. As time passed, local demand began to absorb more refined product output, and some of the focus on exports transitioned into satisfying domestic markets. The investments made to produce ultra-low-sulfur fuels and EURO standard fuels also helped domestic markets to switch to higher-quality fuels. MENA market demand tended to grow more rapidly than demand in European markets, which helped keep local refineries running even when global overcapacity pressured margins.
Growth in internal trade
MENA is not monolithic, and some countries are so distant from one another that they can scarcely be called neighbours. Google Maps calculates that the journey from Muscat, Oman, to Casablanca, Morocco is 8007 km. A glance at the map shows that Morocco is more likely to import fuel from Europe, the Mediterranean, or West Africa than from Oman and its Persian Gulf neighbours. National borders also may stymie trade when the countries involved have poor relations, or when one or the other faces internal unrest that jeopardises oil infrastructure. Nonetheless, many MENA demand centres are relatively close to MENA refiners, and proximity has encouraged trade.
April 2023 HYDROCARBON ENGINEERING 12
Middle Eastern countries Demand North African countries Demand Bahrain 61 Algeria 439 Iran 1989 Egypt 816 Iraq 853 Libya 223 Israel 219 Morocco 310 Jordan 90 Tunisia 99 Kuwait 346 Total North Africa 1887 Lebanon 166 Oman 206 Palestine 24 Qatar 275 Saudi Arabia 3351 Syria 132 UAE 855 Yemen 62 Total Middle East 8630 Total MENA 10 517
Table 1. MENA oil demand by country, 2021, (‘000 bpd)
Gain a better perspective on hydroprocessing solutions. ART catalyst systems are designed to outperform and outlast the competition. Turn flexibility into opportunity. Learn more at arthydroprocessing.com
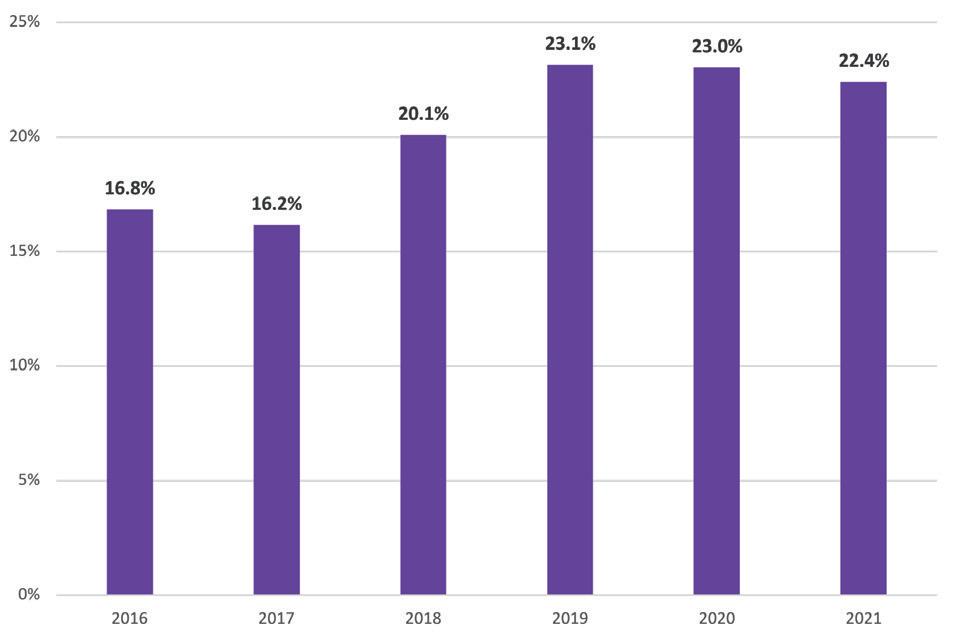
Figure 3 illustrates the growing importance of internal product trade in MENA. According to BP’s data on product trade, 16.8% of MENA fuel exports went to the region in 2016.2 After declining to 16.2% in 2017, this grew to 23.1% in 2019. The COVID-19 pandemic caused a slight retreat thereafter. Nonetheless, in 2021, 22.4% of MENA product exports remained in the region’s markets – a significant share relative to the 16.8% and 16.2% seen in 2016 and 2017.
Conclusion
MENA is composed of 19 countries with widely varying levels of petroleum sector development. It is home to some of OPEC’s largest oil producers, as well as several key non-OPEC producers. It also includes countries that produce little or no petroleum, relying on imports – often from their neighbours. When oil demand and prices rose in the post-COVID-19 world, the gap between the oil ‘haves and have-nots’ widened. Russia’s invasion of Ukraine has had a mixed impact on MENA. The import-dependent countries
are facing higher prices and inflationary pressures, while the exporters are reaping higher revenues. On the other hand, sanctions on Russia are raising interest in oil and gas investments, including European interest in Algeria’s gas resources as an alternative to pipeline gas from Russia. Additionally, market tightness caused by reductions in Russian oil exports has prompted Kuwait to start ramping up production from its giant Al Zour refinery. The refinery is anticipating significant growth in middle distillate exports to Europe, naphtha and very low sulfur fuel oil (VLSFO) exports to Asia, plus increased use of VLSFO in Persian Gulf bunkering. Other MENA refineries are also expanding product exports to Europe. The EIA reported that Russia provided 53% of Northwest Europe’s seaborne diesel imports between October 2021 and September 2022. In February 2023, however, sanctions took effect, and these diesel imports fell to a mere 2%. They were replaced mainly by imports from the Middle East and Asia.
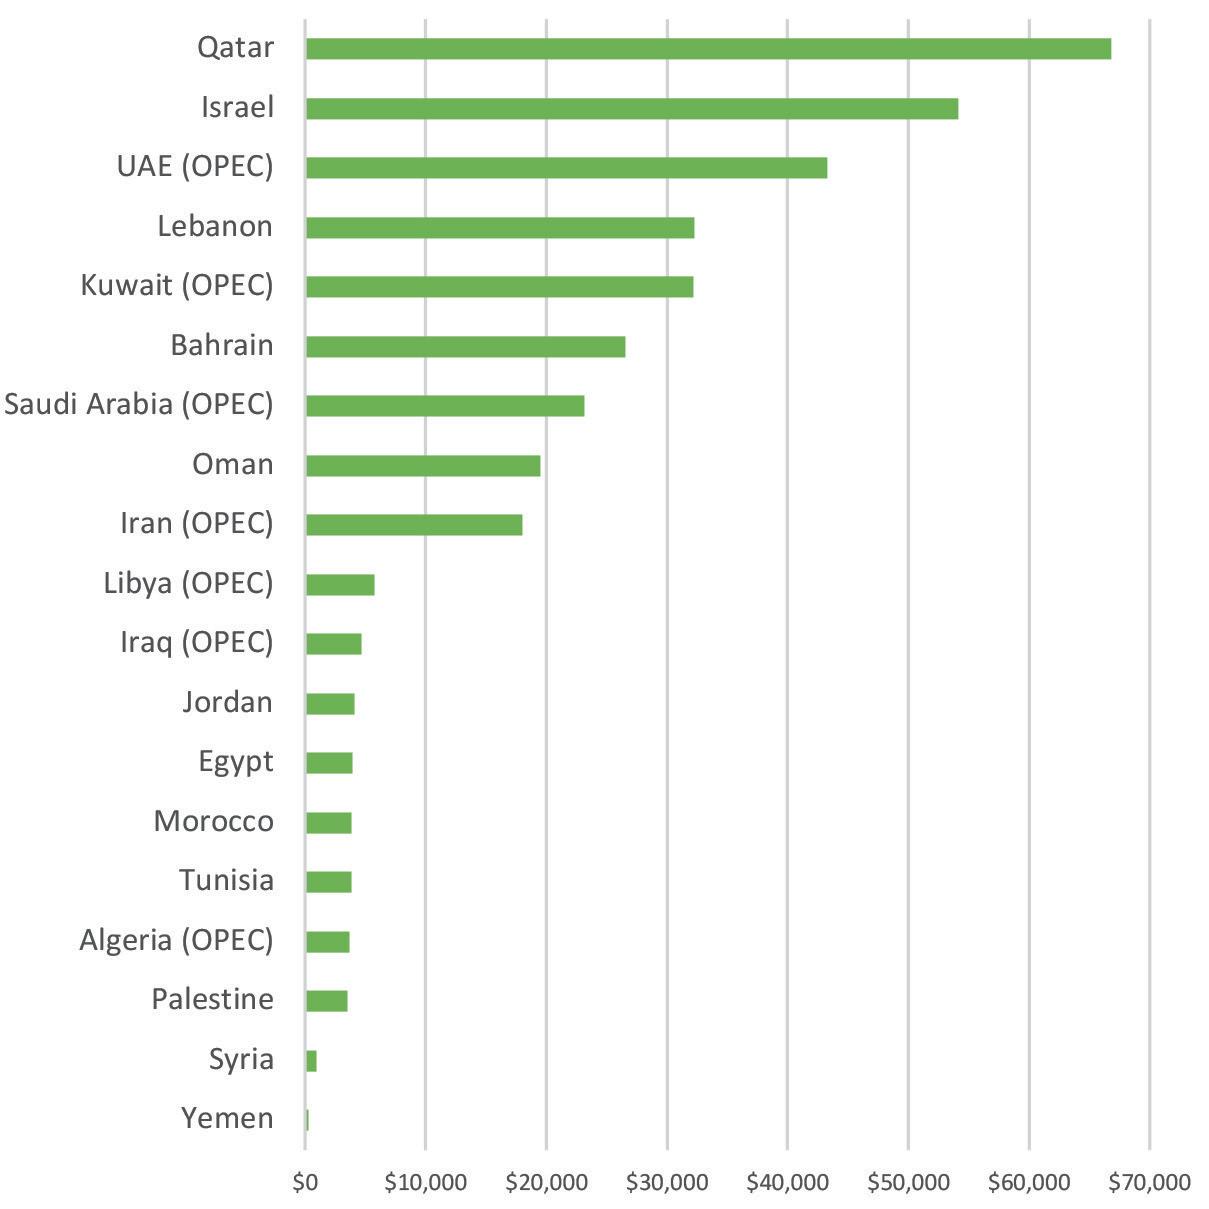
The presence of an active hydrocarbon industry may not be definitive of a successful economy, but in MENA it certainly helps. Figure 4 ranks the 19 MENA countries according to GDP per capita in 2021, as reported by the UN. The OPEC countries clearly dominate the top half. A former OPEC member, Qatar, is at the top, with a GDP per capita figure of US$66 799. The country is the world’s foremost exporter of LNG. Bahrain and Oman are also in the top half. They are not OPEC members, but they are significant oil producers with established refining industries. Iran’s oil production has been constrained for years by sanctions, and progress on this front could allow Iranian production to increase by 1 million bpd or more, greatly increasing its ability to pay for additional development. Oil wealth in the region also has allowed for the diversification of economies, and many oil producers are already planning for a future when oil demand and prices decline. The UAE, for example, has emerged as a major financial centre and a hub of international trade.
Finally, political stability and peace may not be definitive of a successful economy either, but this clearly helps. The bottom half of Figure 4 is populated by countries that have contended with civil strife and outright war – sometimes for years, if not decades. Developing energy resources and infrastructure relies on stable markets that attract both domestic and foreign investors, and upon agreeable international relations. These things have eluded some MENA members. Still, most of the members cooperate in regional groups or accords, such as OPEC, the OPEC+ Group and OAPEC, and there are signs that intraregional trade is growing. In the petroleum sector, there are multiple opportunities for mutually-beneficial development and trade within the MENA region.
References
1. ‘International Rig Count’, Baker Hughes, https://rigcount. bakerhughes.com/intl-rig-count
2. ‘Statistical Review of World Energy’, BP, https://www.bp.com/en/ global/corporate/energy-economics/statistical-review-of-worldenergy.html
Bibliography
• EIA, https://www.eia.gov/
• OPEC, https://www.opec.org/opec_web/en/
• OAPEC, http://www.oapecorg.org/Home
April 2023 HYDROCARBON ENGINEERING 14
Figure 4. MENA GDP per capita, 2021, US$ (source: UN).
Figure 3. MENA fuel exports to other MENA destinations, % of exports (source: BP).
Dr. José-Francisco Pérez-Calvo, Sulzer Chemtech, outlines what hydrocarbon processing facilities should consider when investing in carbon capture, utilisation and storage (CCUS).
Global climate policies are driving the decarbonisation of the energy, manufacturing and processing sectors, setting them on a path towards net zero. While carbon capture and storage/utilisation (CCS/CCUS) technologies are considered crucial to slashing emissions, the available solutions can differ greatly in terms of performance, cost and profitability. It is therefore important for hydrocarbon processors to identify the set-ups that are best suited to supporting specific operations and maximising carbon dioxide (CO2) capture, as well as energy and cost-efficiency.
Due to the fact that they sequester large volumes of CO2 from flue gases before they are released into the atmosphere, post-combustion CCS and CCUS facilities are regarded as one of the enabling technologies to achieve carbon-neutrality by 2050. To address this ambitious goal, the global capacity of CCS is expected to increase more than sixfold in less than a decade, from 43 million t in 2022 to 279 million t by 2030.1
While the vast majority of current and past CCS and CCUS projects are being used or built in order to decarbonise power plants, it is important to drive adoption

April 2023 15 HYDROCARBON ENGINEERING
by industrial point sources, which are estimated to be among the top capturers by 2030.1 As the oil refining industry is the world’s third-largest emitter of greenhouse gases (GHG), with 4% of the total global CO2 output in 2018 coming from this sector2, hydrocarbon processors implementing carbon sequestration solutions can play a key role in abatement efforts.
Additionally, this action can help companies to reduce costs from ever-increasing carbon taxes, with the highest rates currently at US$129.89/t of CO2 emitted.3 These charges are already a reality in the EU, Canada, Japan,
South Africa and various countries in Latin America, and they are being scheduled or considered in a number of other regions. At the same time, it is necessary to lower the CAPEX and OPEX of CCS and CCUS plants to ensure that refineries and petrochemical complexes can remain profitable.
Defining operations and processing conditions
As the flue gases and carbon emissions from these facilities substantially differ from power plants, adopting process conditions and solutions for the energy sector, even if proven, is not necessarily ideal for maximising profitability. For example, power stations often use mega-columns to reduce the vast majority of their emissions, whereas smaller units are generally sufficient for industrial emitters, including hydrocarbon processing facilities. In addition to this, while the concentrations of CO2 in flue gas from gas- and coal-fired power plants are typically 4% and 13.5% by volume, respectively,4 the composition in refineries is estimated to be between 8 – 20% by volume.5
A recent study analysed the financial performance of CCS for industrial emitters by means of in silico models.6 The study concluded that well-designed absorption-based CO2 capture systems that leverage Sulzer Chemtech’s structured packing, MellapakPlusTM, are expected to annually cost below €45 (US$46)/t of CO2 captured for plants treating 1000+ tpd of flue gas, with concentrations ranging from 20% to 12% by volume. These values combine both CAPEX and OPEX. According to the simulation, the optimum capture efficiency of the set-up to benefit from minimal costs is around 90%. However, more effective sequestration,
April 2023 HYDROCARBON ENGINEERING 16
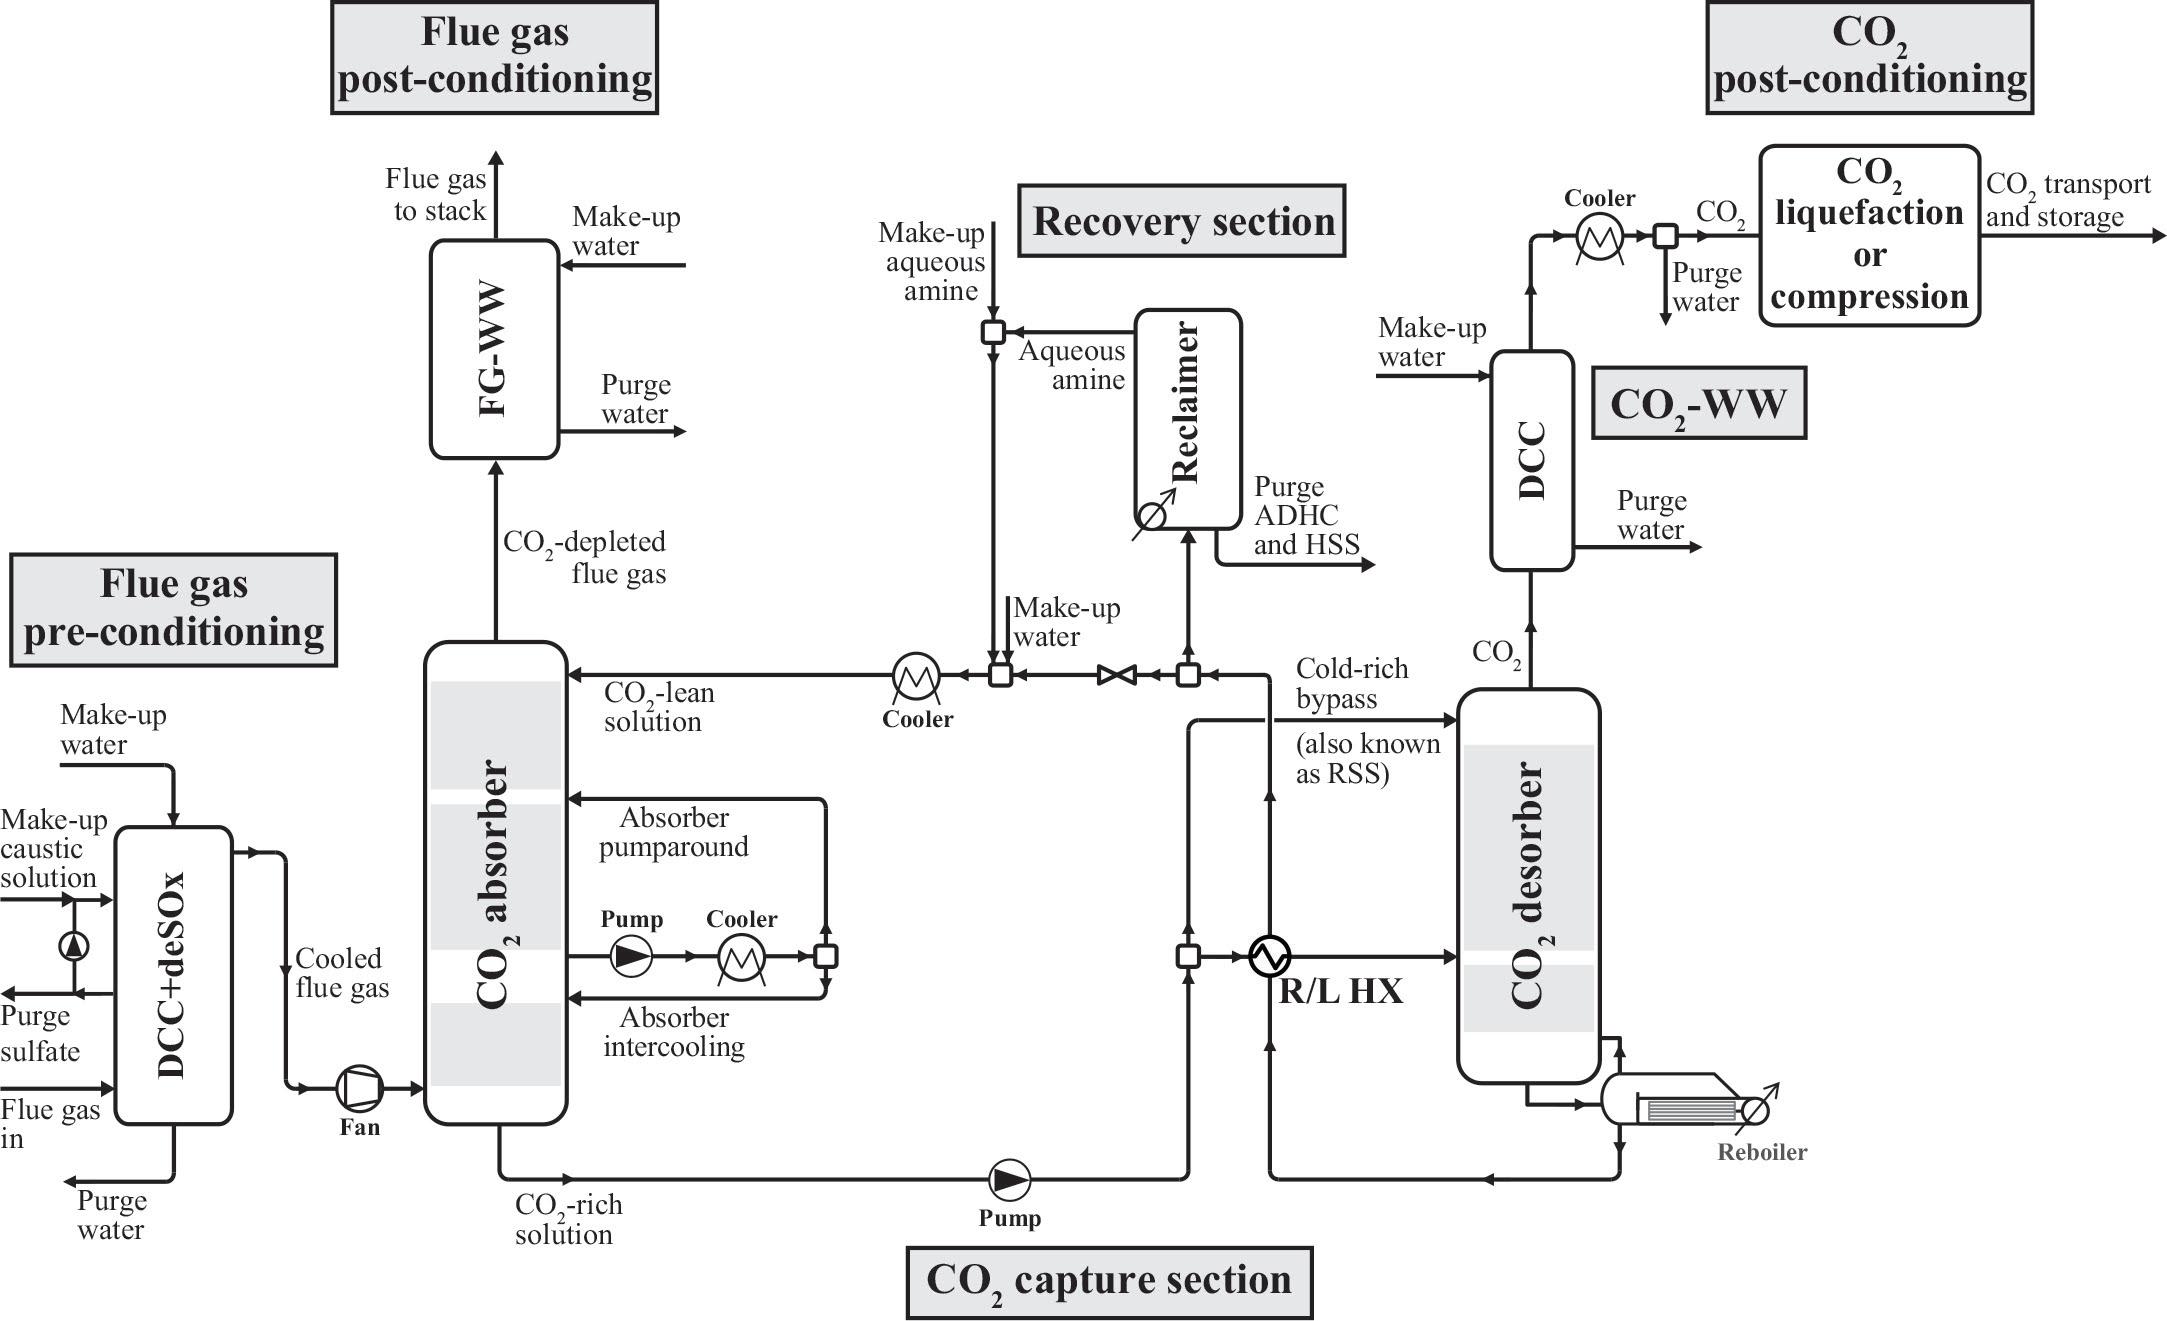
Figure 1. Typical flow scheme of absorption-based post-combustion CO2 capture processes (source: ETH Zurich7, and reproduced with author’s permission).
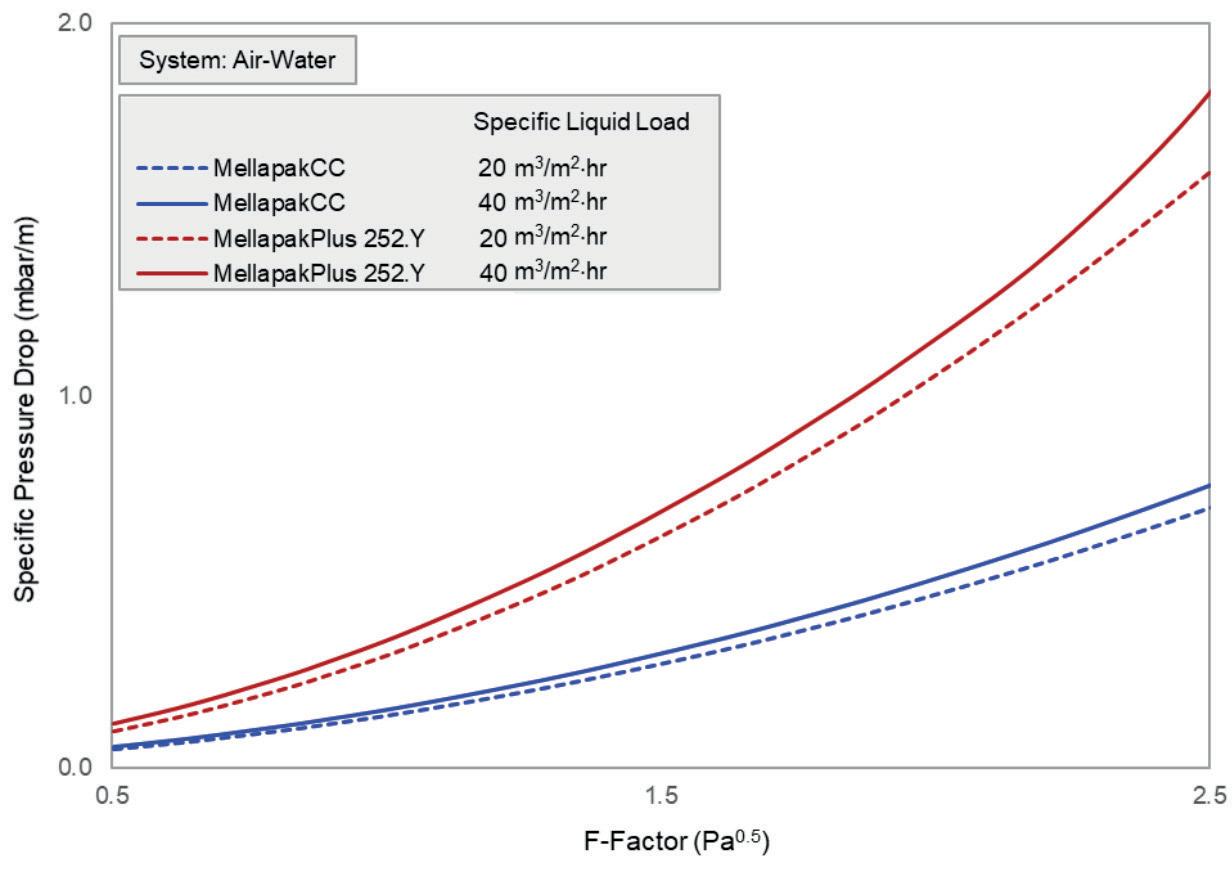
Figure 2. Comparison of the specific pressure drop trends of MellapakCC and MellapakPlus 252.Y, at two specific liquid loads.
D o n’ t M i s s t h e B o a t
G e t o n b o a r d w i t h a s u p p l i e r w h o w i l l g e t y o u w h a t y o u n e e d o n t i m e
W i t h m a n u f a c t u r i n g p l a n t s i n t h e N o r t h A m e r i c a , Eu ro p e a n d A s i a , y o u g e t t h e c e ra m i c c a t a l y s t b e d s u p p o r t y o u n e e d , w h e n y o u n e e d i t G e t t i n g D e n s to n e ® m e d i a s u p p l i e d f ro m o u r r e g i o n a l p l a n t s r e d u c e s h e a d a c h e s o n f r e i g h t a n d s u p p l y c h a i n i s s u e s A n d , s i n c e y o u ’ r e p u rc h a s i n g c l o s e r to y o u r o p e ra t i o n s , i t ’s a m o r e s u s t a i n a b l e s h i p p i n g p ro c e s s
D e n s to n e ® s t a n d s a p a r t i n s u p p o r t m e d i a f o r f i x e d c a t a l y s t c e ra m i c b e d a p p l i c a t i o n s b y d e l i v e r i n g e xc e p t i o n a l q u a l i t y a n d c o n s i s t e n t r e l i a b i l i t y , ev e n i n t h e m o s t s ev e r e p ro c e s s e s
M a k e s o m e w av e s w i t h D e n s to n e ® s u p p o r t m e d i a , i n c l u d i n g D e n s to n e ® 5 7 , 9 9 , 2 0 0 0 a n d t h e r evo l u t i o n a r y D e n s to n e ® d e l t a P ® m e d i a b e d s u p p o r t t e c h n o l o g y
Reliability. Delivered. w w w d e n s to n e c o m
NORPRO
reaching as high as 99%, is possible without incurring significant cost increases. The flow scheme of absorption-based post-combustion CO 2 capture processes considered in this study 6 is shown in Figure 1.
Sulzer Chemtech has recently developed a new type of structured packing, MellapakCCTM, which is specifically designed to support CCS and CCUS processes and is already installed at sites around the world. This packing offers enhanced overall efficiency by minimising pressure drop and column size requirements (see Figure 2). This means that total annualised costs for refineries are likely to be lower, when a suitable set-up is selected, making decarbonisation even more commercially-attractive for industry players.
Strategic investments
Another key aspect to consider is the scale of the emissions generated by the hydrocarbon processing plant, combined with the capacity of the CCS unit. More precisely, the latest research indicates that for large facilities emitting more than 1000 tpd of flue gases, running costs are typically higher than CAPEX.6 As such, it is more important than ever to optimise the process parameters in these set-ups in order to improve operations and their efficiency. Conversely, CAPEX represents the larger portion of the total cost of ownership for infrastructures treating lower masses.
Furthermore, as the costs and features of the different types of energy available at a given CO2 point source greatly influence OPEX, the optimal CO2 capture plant design
should be able to integrate low-cost excess heat for solvent regeneration as much as possible.6
By considering all of these aspects, companies can define strategic plans to improve their return on investment (ROI).
Identifying the right technology partner
Partnering with a CCS/CCUS technology specialist that can support facilities with complete processing solutions and plants, in addition to providing individual pieces of equipment, can help companies optimise CAPEX and OPEX. Experts with a proven track record can help determine the strategies that are most effective for addressing specific requirements and the scale of the intended project by engaging in technical discussions and identifying the most suitable technologies.
For large infrastructures with capacities of above 1000 tpd, a skilled full-service provider can deliver fully-integrated licensed processing technologies that are designed and proven to operate with high efficiency in order to minimise running costs. When supporting smaller facilities, such a partner can drive lean strategies, reducing the expenses and logistics issues associated with dealing with multiple contractors.
By working with an expert in CCS/CCUS technology, it is possible to take advantage of all of these benefits. As an example, Sulzer Chemtech has a portfolio of mass transfer components and internals for absorption applications, such as MellapakCC and AYPlusTM DC. Its teams also have extensive know-how in CO2 capture technologies and solvents, as well as process optimisation and system integration. Additionally, the company has experience in delivering complete processing plants on a modular scale, and can offer modules for carbon removal with a capture rate of up to approximately 100 000 tpy.
With the right support, refineries and petrochemical complexes that are interested in reducing their environmental footprint can leverage effective CCS/CCUS solutions that can help to ensure optimal profitability.
References
1. ‘Global Carbon Capture Capacity Due to Rise Sixfold by 2030’, BloombergNEF, (18 October 2022), https://about.bnef.com/blog/ global-carbon-capture-capacity-due-to-rise-sixfold-by-2030/
2. LEI, T., GUAN, D., SHAN, Y., ZHENG, B., LIANG, X., MENG, J., and TAO, S., ‘Adaptive CO2 emissions mitigation strategies of global oil refineries in all age groups’. One Earth, vol. 4, no. 8, (2021), pp. 1114 - 1126.
3. The World Bank, Carbon Pricing Dashboard, last updated on 1 April 2022, https://carbonpricingdashboard.worldbank.org/ map_data
4. ABU-ZAHARA, M. R. M., EL NASR, A. S., Al HAJAJ, A., and GOETHEER, E. L. V., ‘Techno-economics of liquid absorbent-based post-combustion CO2 processes’, Absorption-Based Post-combustion Capture of Carbon Dioxide, Woodhead Publishing, (2016), pp. 685 - 710.
5. ‘Understanding the Cost of Retrofitting CO2 capture in an Integrated Oil Refinery’, IEAGHG, (August 2017).
6. PÉREZ-CALVO, J. F., and MAZZOTTI, M., ‘Techno-economic assessment of post-combustion CO2 capture using aqueous piperazine at different flue gas compositions and flowrates via a general optimization methodology’, International Journal of Greenhouse Gas Control, (2022).
7. ‘Process Development and Optimization of Absorption-Based Post-Combustion CO2 Capture Technologies Applied to Industrial Point Sources’, ETH Zurich, (2021), https://www.researchcollection.ethz.ch/handle/20.500.11850/530962
April 2023 HYDROCARBON ENGINEERING 18
Figure 3. Example of Sulzer’s skid-mounted solution: modular process plants are predestined for decentralised applications such as carbon capture from hydrocarbon processing facilities.
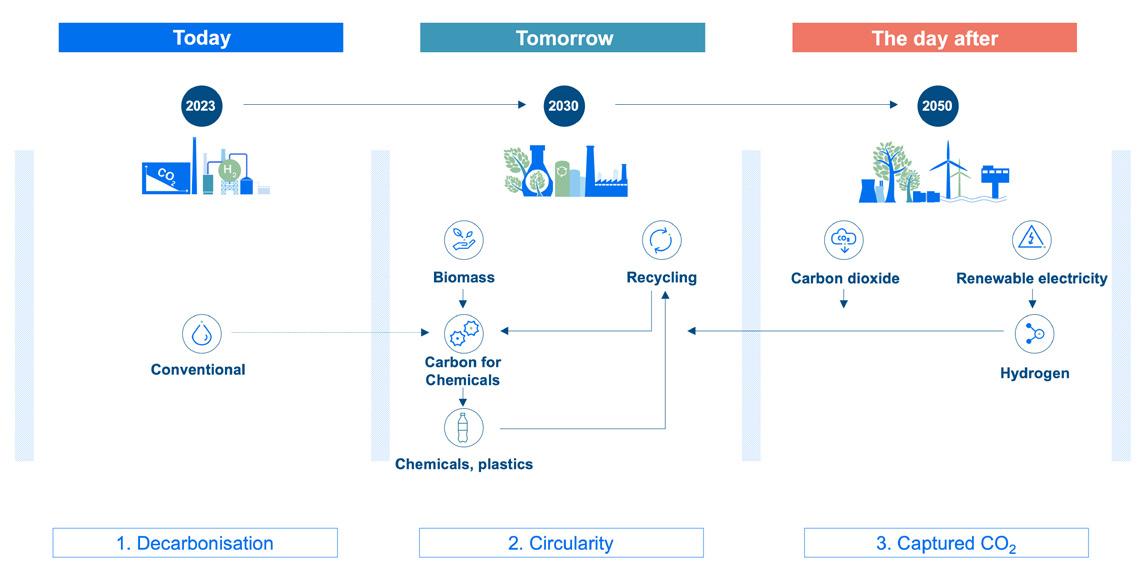
Limiting global warming to acceptable levels, whilst still maintaining our current lifestyles and continuing to produce and use carbon-containing products such as plastics or fuels, is the major challenge of the energy transition. The only solution to this challenge is a net zero emission scenario where carbon dioxide (CO2) levels in the atmosphere are kept at least constant. In other words, the carbon offtake, mainly through biomass generation (short regenerative carbon cycle), must match CO2 emissions.
Consequently, this means that fossil carbon emissions need to be either completely avoided via decarbonisation, which is not always practical or economically-feasible, or that fossil carbon emissions are replaced by biogenic (derived from biomass) carbon emissions over time. Such a transition will take time, as it involves the adaption of many industries, but the good news is that the journey has started and that the principles of circularity and sustainable chemistry will help to achieve the target (Figure 1).
The beginning of the journey to decarbonise the manufacturing base was the introduction of more carbon-efficient catalytic processes, the use of renewable electricity as a source of energy instead of fossil fuels, and a more intimate and optimised integration between the monomer production facilities and their derivative units.
In addition to these decarbonisation methods, circularity principles offer further reduction of the CO2 footprint to achieve the chemical industry’s emission targets

April 2023 19 HYDROCARBON ENGINEERING
Andrew Reynolds and Andreas Bormann, Technip Energies, consider ways in which the chemical industry is adapting in order to meet the net zero challenge.
via a shift to circular feedstocks. The replacement of fossil-based carbon feedstocks by circular feedstocks with increasing amounts of recycled end-of-life plastic resin is an accessible and short-term solution that has started with mechanical and chemical recycling (thermal pyrolysis route). These recycling techniques will soon be followed by even more carbon-efficient chemical recycling solutions, at least for functional polymers, that render high-purity recycled monomers.
The second big driver towards a zero-emission target is via sustainable chemicals. CO2, captured during photosynthesis and converted naturally to carbohydrates where it is then stored in plants, is an ideal certifiable source of sustainable, biogenic carbon. The incorporation of biogenic carbon into the materials’ value chain reduces the carbon footprint to net zero, unlocks the use of agricultural waste streams, and has a direct impact on the reduction of fossil feedstocks.
A truly sustainable solution can therefore be obtained when end-of-life plastics recycling is combined with the introduction of biogenic carbon feedstock co-processing.
Thinking one step further, besides using biomass and recycled wastes as a major feedstock source for sustainable carbon, usage of captured CO2 from the air or from sustainable chemistry processes will provide another source of sustainable carbon, consequently enhancing sustainability.
While most of the technologies required for circularity and sustainable chemistry are already available, or at least in their advanced development stages, and despite increasing prices of oil and CO2, there will still be a need for a more eco-oriented legislation and consumer awareness to bring these new value chains to fruition.
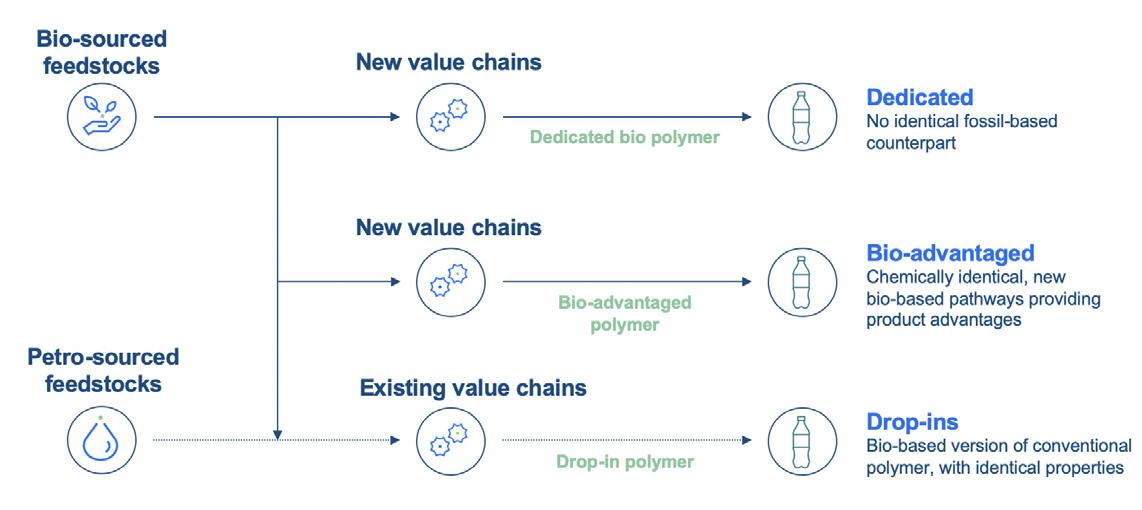
Biopolymers
Although advanced recycling techniques are starting to be deployed on a wide-scale in Europe, pulled by favourable legislation, we are seeing a more focused introduction of biodegradable polymers in Southeast Asia – and more specifically, in China. The introduction of bio-sourced polymers is yet to be seen on a large-scale (Figure 2).
High-volume polyolefin resins that are essentially polyethylene and polypropylene are intrinsically difficult to recycle due to the strong intra-molecular
April 2023 HYDROCARBON ENGINEERING 20
Figure 1. The path to sustainability.
Figure 2. Biopolymer routes.
Figure 4. Economics of bio-PE production from ethanol.
Figure 3. Ethanol-to-ethylene preparation unit.
bonding, and are currently at best valorised by pyrolysis. In the future, and to avoid a wide-scale ban, the industry must find a sustainable solution for these resins. A few alternative solutions are presented in the following case studies.
Case study: retro-feeding a bio-sourced feedstock to an existing European polyethylene unit
Industry cannot rely entirely on favourable legislation and carbon credits to move forward towards a cleaner environment. The introduction of climate-friendly solutions that are economically-justifiable is a low-hanging fruit solution that should be adopted quickly.
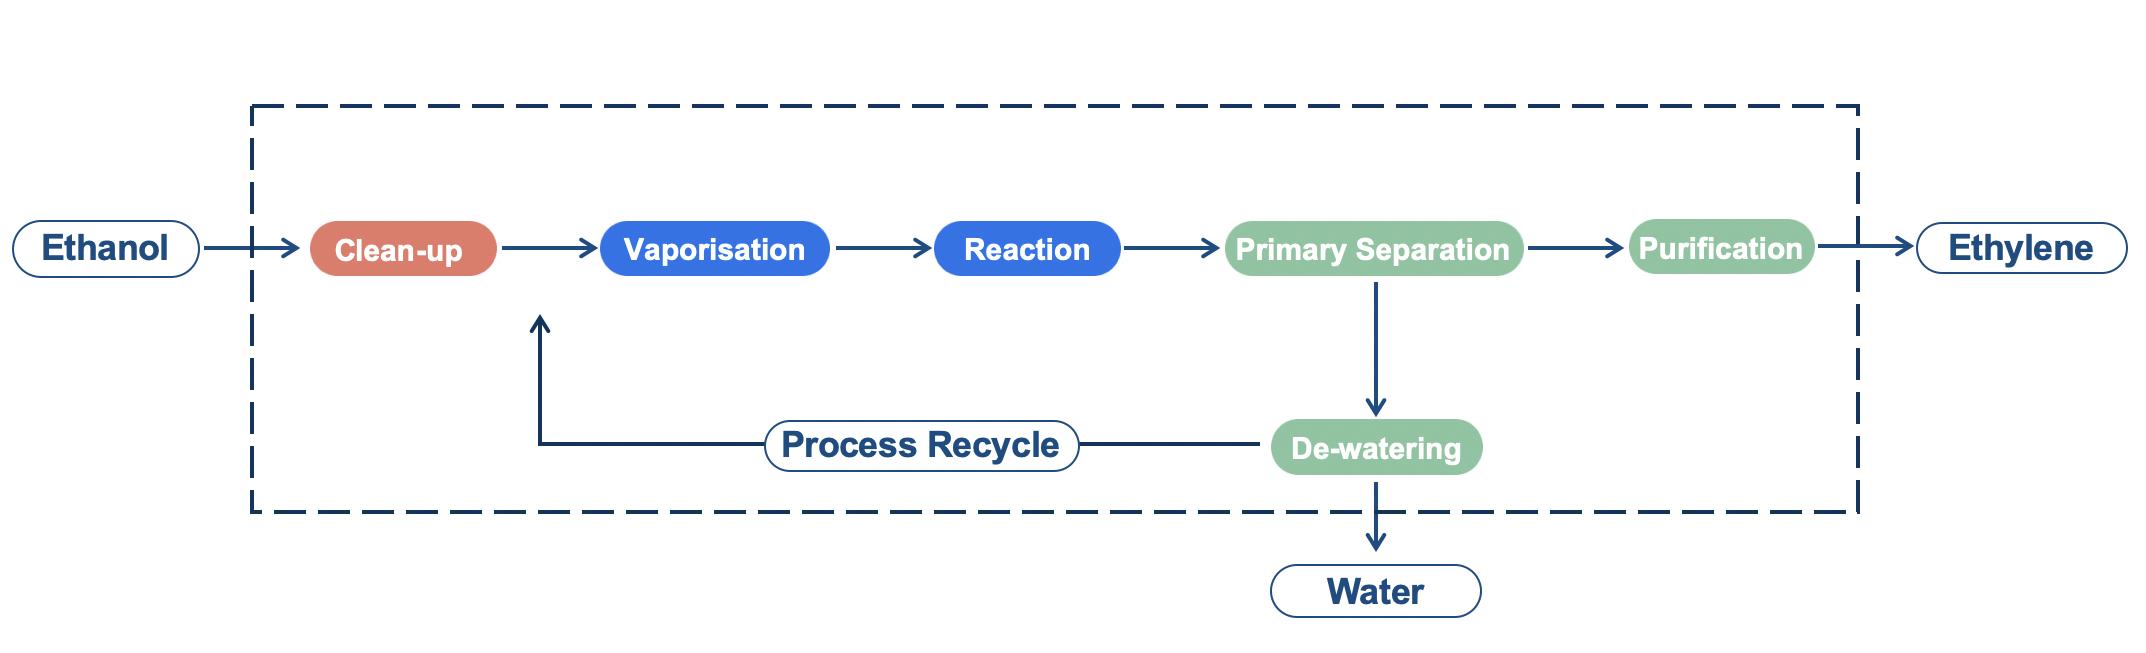
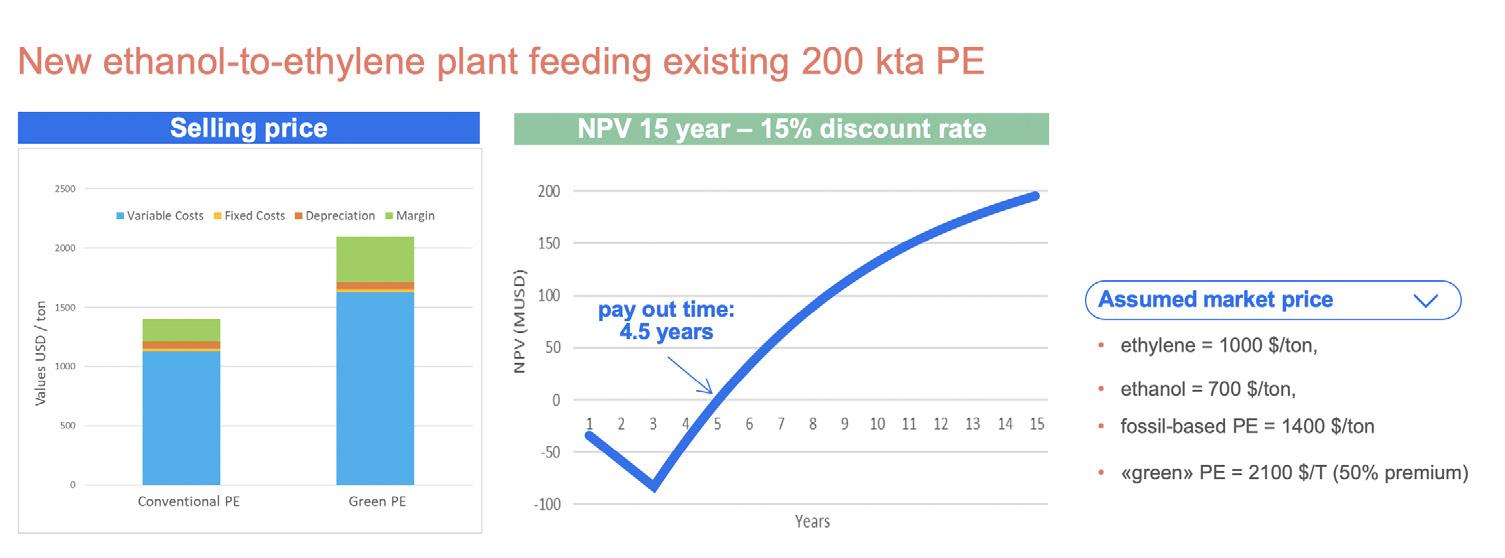
Figure 3 is an example of a drop-in polymer solution for polyethylene that may provide favourable economics by way of customer proximity and acceptable green premiums on the products. From a technology point of view, ethylene produced from ethanol is chemically-identical to conventional sources, and may be used as a drop-in substitute. Ethanol is a liquid that is freely traded and transportable, thus easily accessible. Specifically, Figure 3 shows a typical block flow diagram of an ethanol-to-ethylene plant that uses Technip Energies’ Hummingbird® technology.
Commercially, ethanol-derived ethylene would face difficulties when competing with its fossil-based cousin, if it were traded at the same market prices. The key to achieving competitiveness is via premiums associated to the green polymer. Price premiums for this bio-sourced, green polyethylene can be more than 100% above conventional resins. As the contribution of the resin price to the overall cost of the consumer goods is small, the incremental cost burden may be easily absorbed by the retailer and maintained in the long-term. As an example, a typical running shoe weighs less than 300 g, so material cost for the polymer sole material lies in the range of €3 or less.
Production of sustainable ethylene should ideally be close to polyethylene polymerisation plants with smaller capacities to allow for full captive offtake of the sustainable ethylene produced, and should be close to consumer markets that accept green premiums.
Both of these boundary conditions are a given in Europe. The production base in Europe is composed of ageing and smaller naphtha-based units that are often stranded with fourth-quartile production costs. These units face head-on competition from the new integrated, gas-fed mega complexes in the Middle East, and will not survive global competition without a shift in strategic positioning.
withHybrid

The contribution of feedstock price to the cost of production of a polymer is preponderant, and represents more than 90%. Processing plants located in regions close to cheap feedstocks are truly advantaged. The remaining production costs are often optimised through economies of scale, with new polymer units being larger than 500 000 tpy in capacity. Smaller units have inherent economic challenges to overcome.
European polymerisation units with a newly set up ethanol-to-ethylene plant can be a good solution for rendering these plants profitable, while increasing sustainability of the product.
The return on investment (ROI) associated with building a new ethanol-to-ethylene conversion unit is attractive (Figure 4).
Optimized Gas Treating, Inc 212 Cimarron Park Loop, Buda, TX 78610 www.ogtrt.com +1 512 312 9424 Now
Solvents N o withHybridSol S me Proven Technol OGT | ProTreat® Process Simulation
The unit is simple, with low operating costs and capital expenditure (CAPEX). Marginal additional capital is required for modifying the existing polyethylene unit. The price premium of green polyethylene more than compensates for the higher feedstock price of ethylene produced from ethanol. Furthermore, product differentiation avoids head-on competition based on cost only. It is of note that no carbon credits are required to ensure profitability.
The use of bio-sourced feedstocks has a direct impact on reducing carbon footprint. The use of cellulosic feedstocks may also be envisaged to produce 2G ethanol, further enhancing the carbon balance.
Case study: a bio-sourced feedstock to produce a biodegradable polymer
Biodegradability of polymers can help to solve the problem of plastic waste in the environment, and if combined with bio-sourced feedstocks, will add additional carbon benefits to achieve the net zero emission target. It should be noted that not all bio-sourced polymers are biodegradable.
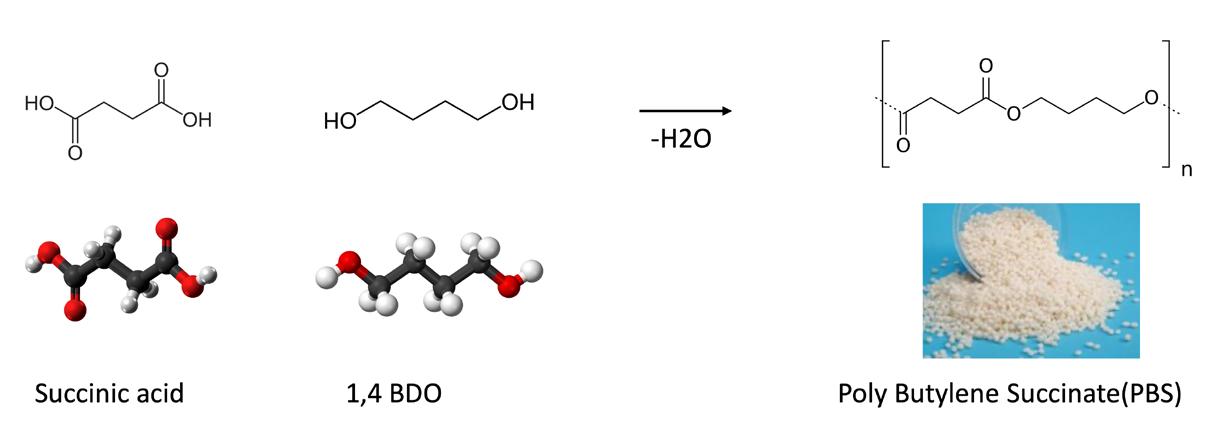
This case study takes the example of such a biodegradable, potentially bio-based polymer, polybutylene succinate (PBS),
which is a polyester with interesting intrinsic mechanical properties that can be degraded under natural environmental conditions by bacteria and fungi, according to the EN 13432. PBS is an ideal replacement for polypropylene for packaging applications, with excellent processing qualities.
Today, PBS is mainly manufactured from the synthesis of fossil-feedstock-derived succinic acid (SA) and butanediol (BDO) via maleic anhydride routes, making it biodegradable but not bio-based.
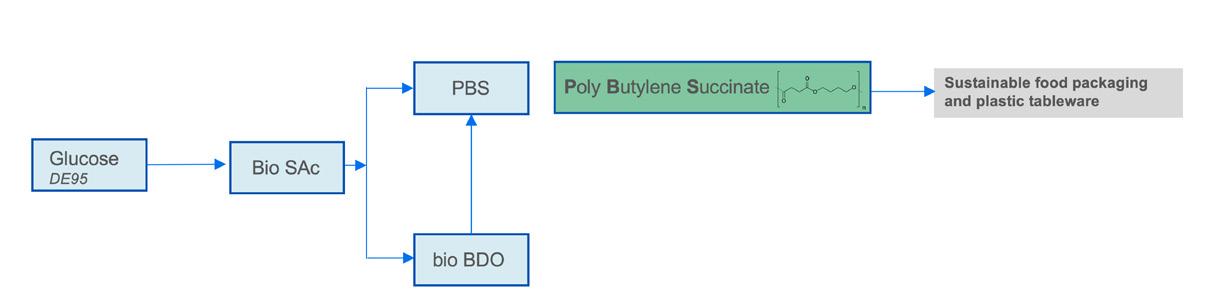
On the other hand, PBS can be produced with 100% bio-based monomers. With the introduction of a novel technology to produce SA from glucose by fermentation, bio-based SA is available as both a monomer and a base chemical to produce BDO (Figure 5).
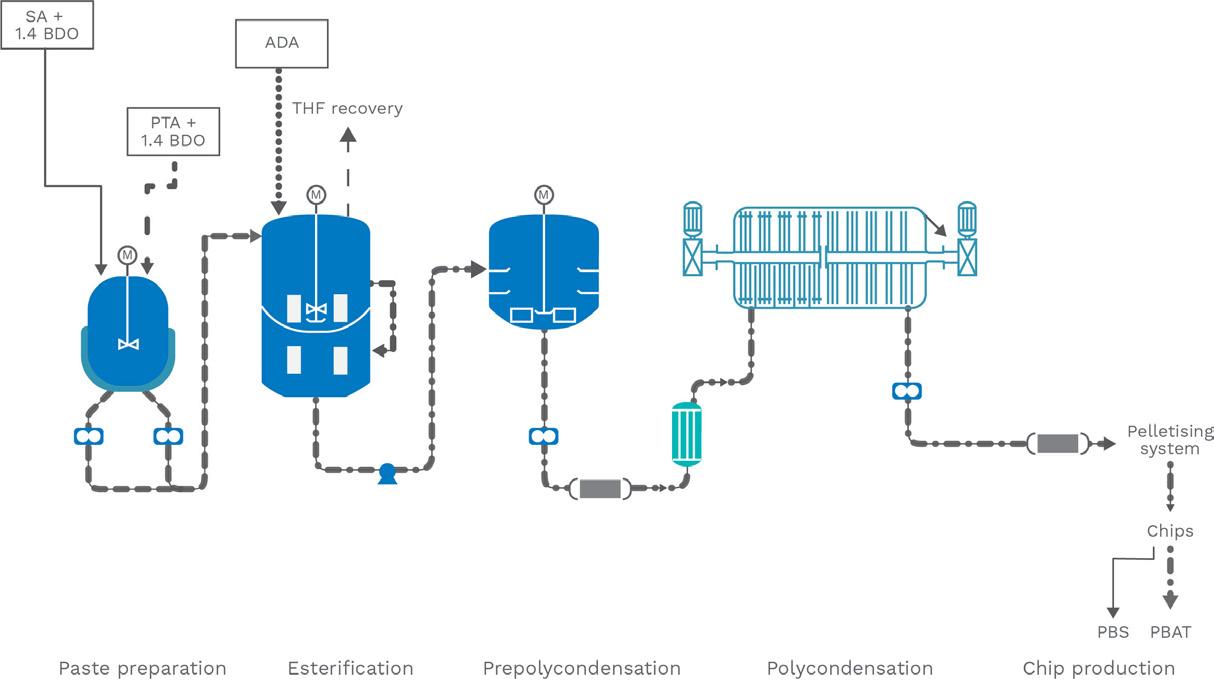
Using this bio-based SA, BDO can be synthesised by esterification and hydrogenation, thus yielding the two required monomers for PBS from a single feedstock: glucose. By combining these two bio-monomers, PBS can be produced – as depicted in Figures 6 and 7.
Life cycle analysis studies suggest that the use of low pH yeast fermentation with direct crystallisation is the most beneficial process to SA from an environmental perspective, with more than 50% reduction in greenhouse gas emissions.
From a carbon perspective, and specifically useful to the packaging industry, the triple advantage of reducing the cost of waste collection, reducing the carbon footprint due to the absence of energy required to incinerate waste plastics, and reducing waste plastics pollution is of interest.
Biosuccinium® is a novel technology for bio-succinic acid production with referenced full-scale production facilities ready for license. Zimmer® licenses its commercialised swing technology for PBAT/PBS bio-polyester production.
Conclusion
The challenge of sustainability will rely on a concerted effort by consumers, governments and the industry. The challenge will be difficult but necessary with a continued focus on the optimal use of carbon applying multiple but complementary solutions.
Bibliography
• International Energy Agency, https://www.iea.org/
• Ellen MacArthur Foundation, https://ellenmacarthurfoundation.org/
• Boston Consulting Group, https://www.bcg.com/
• Renewable Carbon Initiative, https://renewable-carbon-initiative.com/
• COK, B., et al., ‘Succinic acid production derived from carbohydrates: an energy and greenhouse gas assessment of a platform chemical toward a bio-based economy’, (2 August 2013), https://onlinelibrary.wiley.com/ doi/full/10.1002/bbb.1427
• ‘Technip Energies Process Technology Handbook’, Technip Energies, (January 2023), https://edition.pagesuite.com/html5/reader/ production/default.aspx?pubname=&pubid=9f345b4c-683a-40dcb3b4-dbb8fce57a5b
April 2023 HYDROCARBON ENGINEERING 22
Figure 5. Bio PBS value chain.
Figure 7. Fabrication scheme of PBS from bio-SA and BDO.
Figure 6. PBS chemistry from bio-SA and BDO.
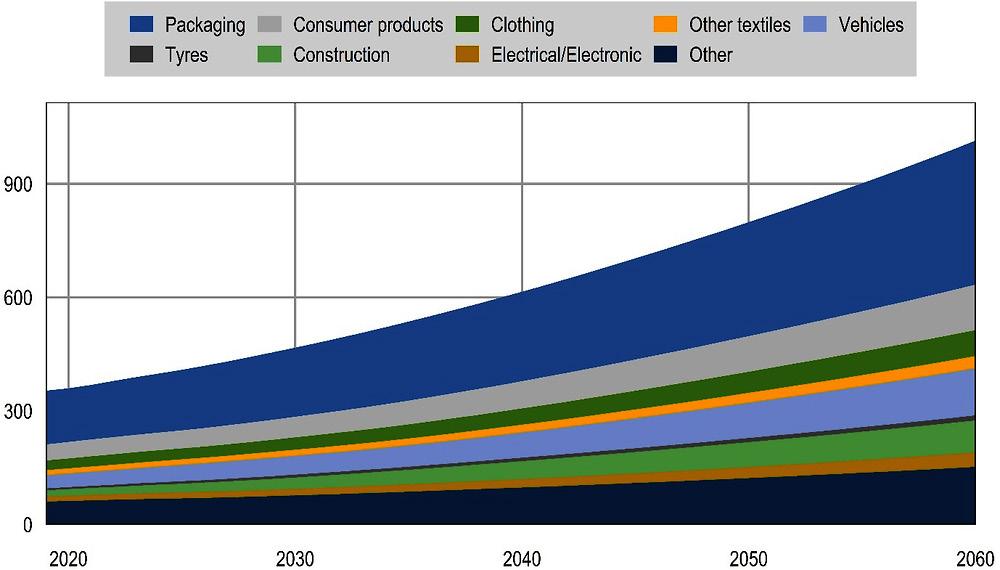
According to the Organization for Economic Cooperation and Development (OECD)’s ‘Global Plastics Outlook’, published in February 2022, global plastics production has doubled from 234 million t in the year 2000 to 460 million t in 2019, outpacing economic growth in this period by almost 40%.1 In the same timespan, global annual plastic waste has more than doubled to 353 million t in 2019 (from 126 million t in 2000). The OECD report concludes that humanity’s current use of plastics is far from circular, with only 55 million t (out of 353 million t) of plastic waste being collected for recycling – half of which is disposed of in sanitary landfills, whereas 19% is incinerated and only 9% (33 million t)

ultimately recycled. This leaves 22% of plastic waste that is disposed of in uncontrolled dump sites, burned in open pits, or leaked into the environment.
Beyond being a hazard to the marine and terrestrial environment, as well as to humans, the report also identifies plastics as a substantial contributor to greenhouse gas (GHG) emissions (approximately 3.4% [1.8 Gt] of emissions globally). 90% of these GHGs come from their production and conversion from fossil fuels, so closing material loops could lower the carbon footprint of plastics substantially.
With global plastic waste on track to almost triple by 2060 (see Figure 1), radical global action will be needed to curb demand, increase
April 2023 23 HYDROCARBON ENGINEERING
Dr. Sander Willems, Antonio Batistini, Andrea Angeletti and Barbara Morico, Maire Tecnimont Group, Italy, discuss the company’s circular recycling model that is aimed at maximising the valorisation of plastic waste.
product lifespans, and improve waste management and recyclability of plastics in order to achieve a world free of plastic pollution, according to the ambitions of the United Nations Environment Assembly.2
Today, most plastics are still produced from fossil-based feedstock. Transitioning to a circular, climate-neutral economy calls for investments and innovation from the entire plastics value chain to develop new business models for reuse, produce more recycled plastics, and generate new feedstocks that are less dependent on fossil-based oil and gas.3
The OECD categorises the policies required into three main pillars (see Figure 2), each of them spanning multiple available technologies or instruments.2
While there are significant opportunities to reduce, redesign or, in some cases, substitute plastic in the system, these are
expected to tackle waste disposal and GHG emissions only partially, even if solutions are scaled up drastically. Similarly, downstream solutions are essential but limited by economic-viability, speed of infrastructure development, and feedstock tolerances and quality. Relying only on an ambitious scale-up of mechanical and chemical recycling also leaves substantial waste disposal and GHG emissions in the system. According to an independent study commissioned by Plastics Europe, all of these solutions have an important role to play in the future plastics system, and only a combination of all available solutions and technologies will facilitate the achievement of the challenging but necessary targets.4
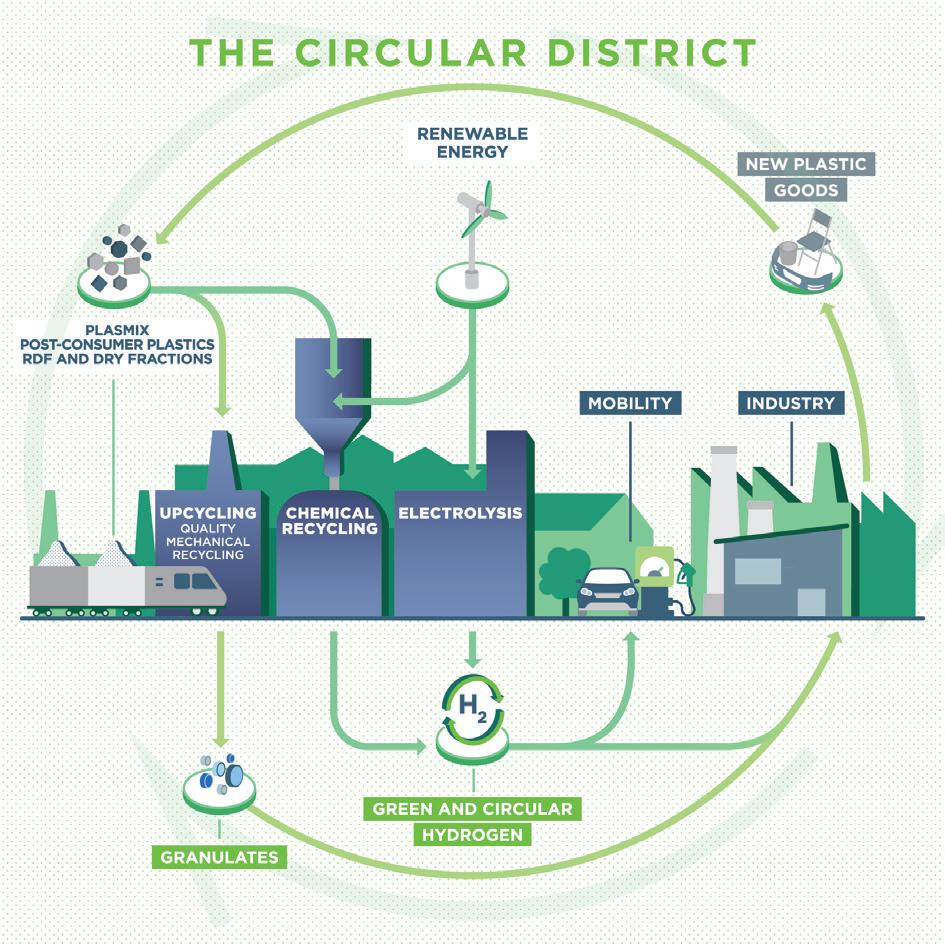
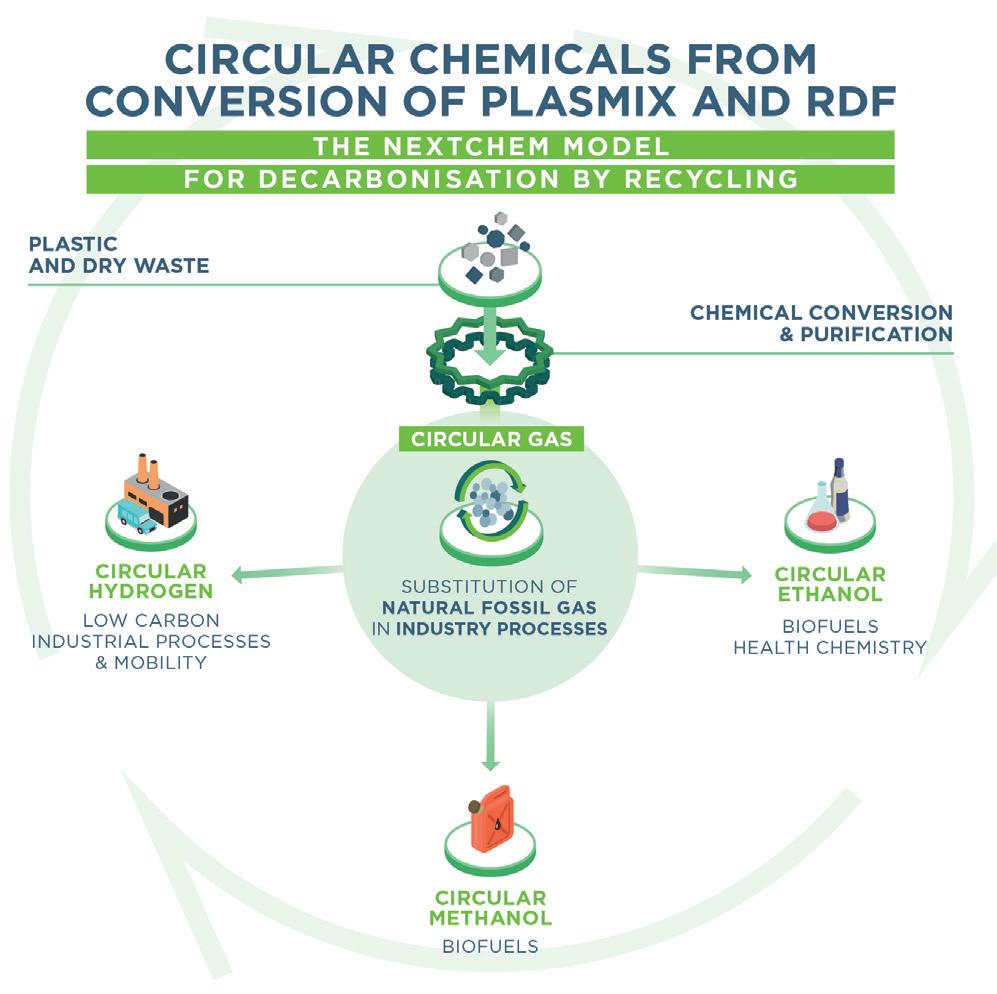
For this purpose, Maire Tecnimont Group, through its subsidiary NextChem, has developed its Green Circular Districts model (Figure 3).5 This model integrates various green chemistry technologies, including plastic and other waste recovery technologies, in order to support a circular economy, as well as decarbonisation in general.
The future of plastics recycling
Even if reduced drastically, the plastic waste that humanity is likely to continue producing for decades to come, along with the plastic waste currently at large in the world, will still need to be managed and preferably recycled (as opposed to incinerated or disposed of otherwise) according to the circularity principle. In addition to this, a switch to renewable feedstocks for plastics, which is highly desirable from a carbon footprint point of view, would not render the recycling step obsolete, as the derived plastics still need to be managed, making recycling a key step in the circular pathway.
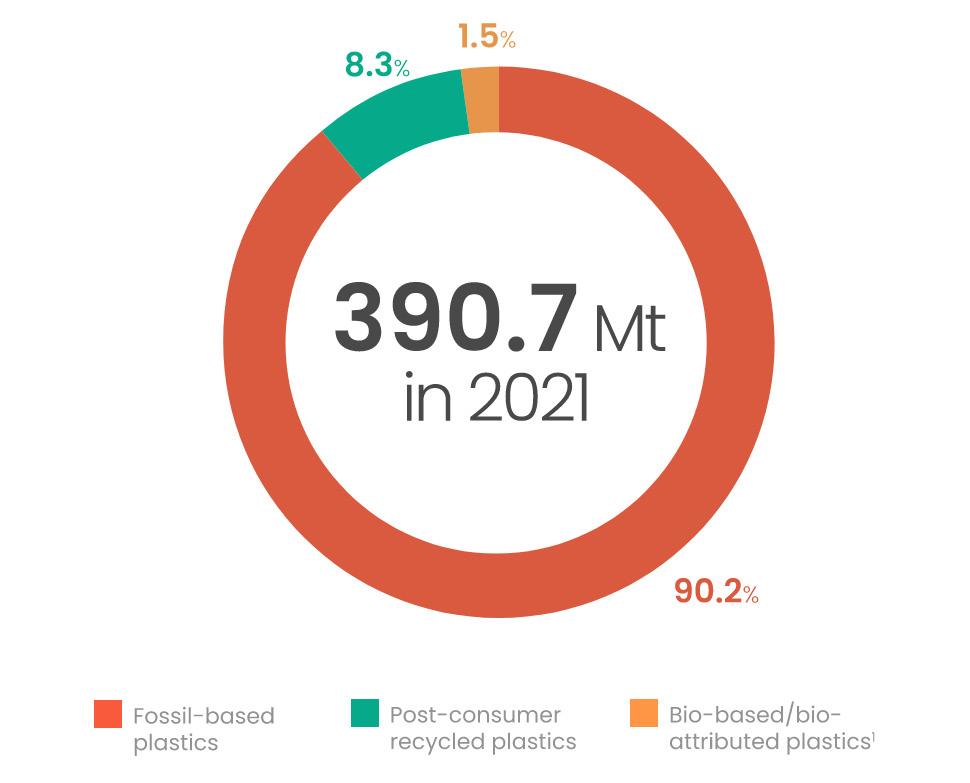
The current low share of plastic recycling (see Figure 4) implicates significant losses for the economy and the environment. Almost two-thirds of plastic waste results from relatively short-lived products (e.g. packaging, consumer goods, textiles)1 and it is estimated that 95% of the value of plastic packaging material alone is lost to the economy after a short first-use cycle.6 To be able to extract the value from the vast pool of post-consumer feedstock currently not made available for recycling, large investments in waste collection capacity and logistics, as well as in existing mechanical and chemical recycling capacities and technologies, are needed.
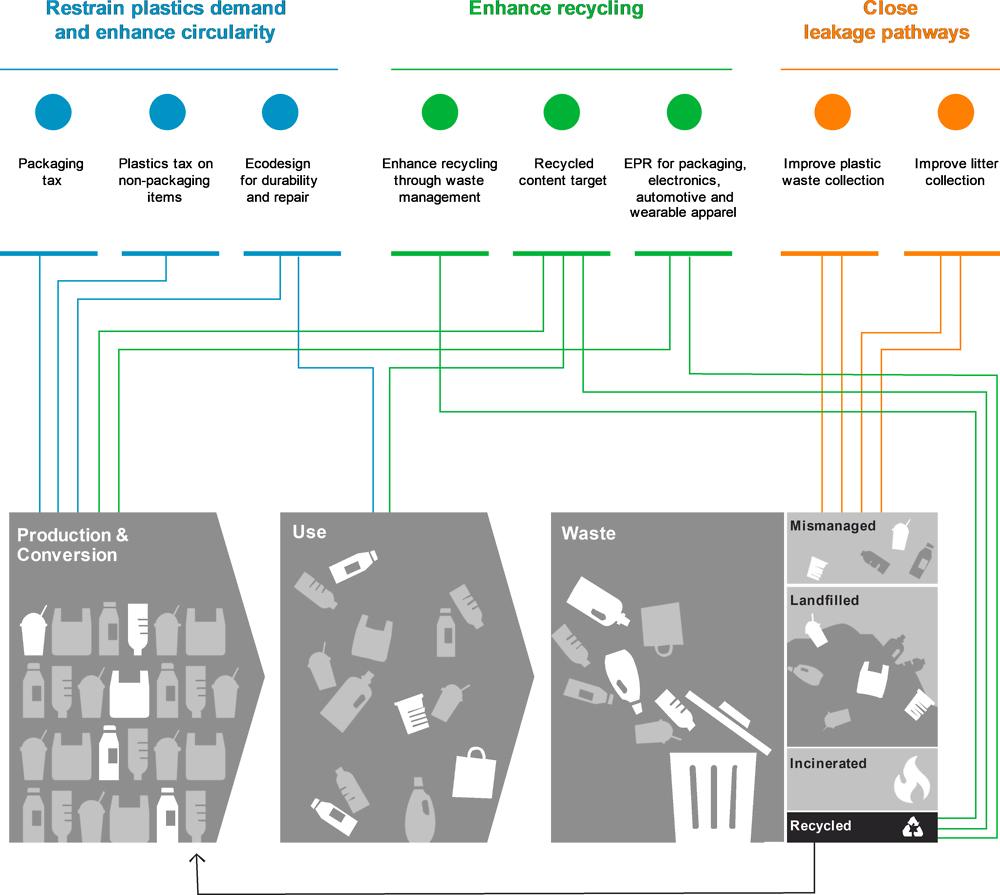
The available technologies for producing recycled plastics can be divided into mechanical recycling or upcycling and chemical recycling, the latter also being referred to as advanced recycling (enhanced recycling in the US), or feedstock recycling.
By combining various technologies in the Green Circular District, synergies can be achieved, such as the dedication of part of the mechanical recycling process (pre-treatment and possibly some separation and decontamination steps) to the preparation of feedstock for downstream recycling technologies.
April 2023 HYDROCARBON ENGINEERING 24
Figure 1. Plastic waste by application (million t), OECD baseline scenario 2020 – 2060 (source: OECD).
Figure 2. Circularity policies along the entire plastics life cycle (source: OECD).

Mechanical recycling
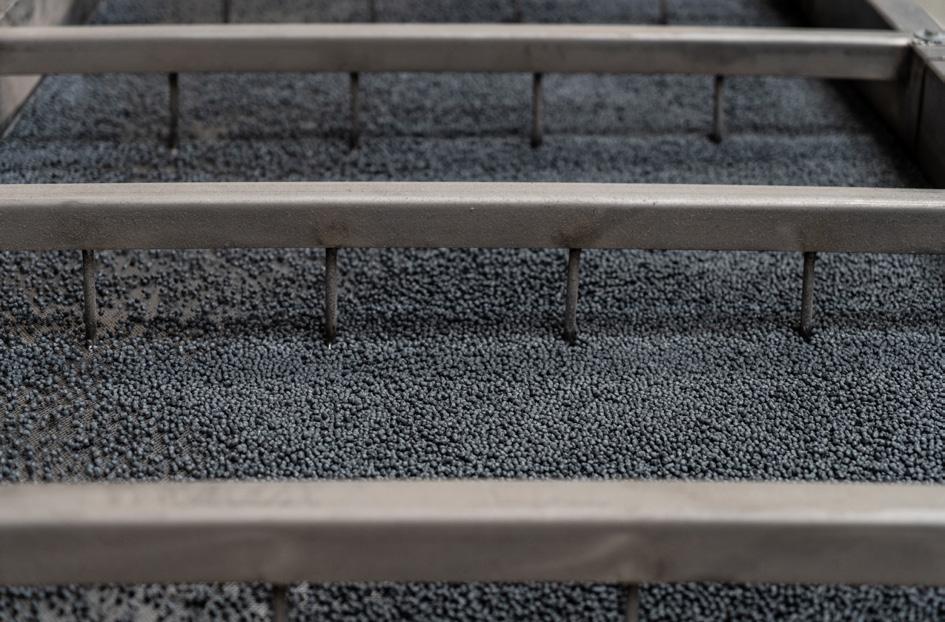
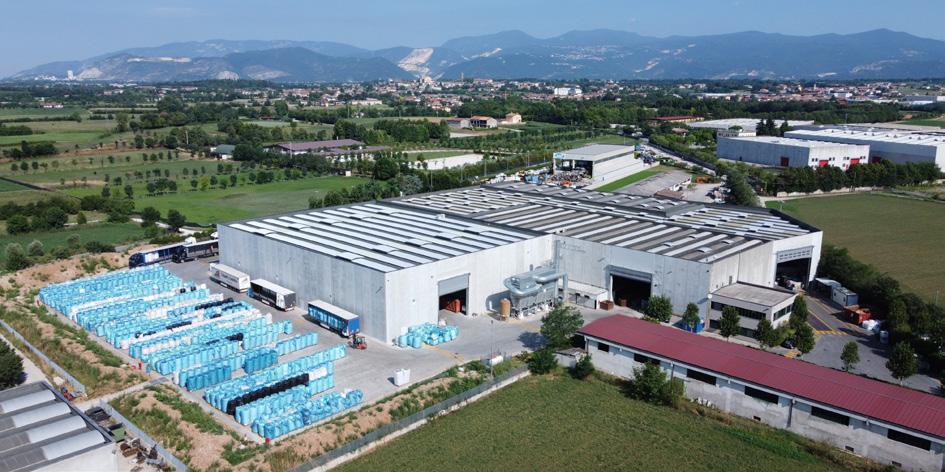
The term mechanical recycling refers to a combination of treatment steps and technologies in which the molecular structure of the original polymer is not altered. A mechanical recycling process typically starts with a sequence of pre-treatment steps, followed by a separation and decontamination phase. The mechanical recycling process can then be concluded with a granulation step to achieve what NextChem calls ‘upcycling’. Through upcycling, a process applied at NextChem’s MyReplast Industries plant (see Figure 5), the properties of recycled plastics can be modified and improved to achieve properties similar to those of the virgin plastics that they replace.
Pre-treatment
n Manual selection.
n Ballistic separation (2D vs 3D fraction).
n Size reduction (pre-grinding and post grinding).
n Dry cleaning: dust and light fraction removal through air-sifting or aspiration.
n De-metallisation: ferrous (e.g., magnetic belt) and non-ferrous (eddy current).
Separation and decontamination
n Washing: cold or hot wash, friction wash.
n De-inking.
n Flotation separation: gravimetric separation in water or in multiple density-adjusted solutions.
n Tribo-electric (electrostatic) separation.
n Optical selection (detection combined with air-jet expulsion):
§ Laser scanning – shape recognition.
§ Visible light – colour selection.
§ Infra-red recognition – near-infrared (NIR) or mid-infrared (MIR) sensors.
Pelletisation (upcycling)
n Melt filtering (removes inclusions as small as 80 �m).
n Melt degassing and deodorisation (removal of volatile components).
n Extrusion and pellet cutting.
n Deodorisation of pellets (additional removal of low boiling volatile components).
During pelletisation, several types of plastic flakes can be compounded with other types of flakes or pellets, mineral fillers, and impact modifiers to obtain upcycled products with improved performance (see Figure 6).
As the separation and decontamination steps are based on different principles, the configuration of a mechanical recycling process strongly depends on the feedstock composition and targeted output and purity.
Solvent-based recycling
The European Coalition for Chemical Recycling defines chemical recycling as “[a process] that converts polymeric waste by changing its chemical structure to produce substances that are used as products or as raw materials for the manufacturing of products. Products exclude those used as fuels or means to generate energy”.7 Going strictly by the definition of chemical recycling, the recycling processes using solvents for decontamination falls under mechanical recycling, as the structure of the original polymer is largely preserved and only contaminants and additives are removed. Through solvent recycling, high-purity recycled polymers with natural colour can be obtained. Solvent recycling does require a relatively pure input stream in terms of polymer composition, to be efficient.
Chemical recycling
As opposed to mechanical recycling, in chemical recycling the chemical structure of the polymers in the plastic waste is modified. More specifically, the polymer chains are partially or completely broken down into their constituting monomers, into heavy and/or light hydrocarbon fractions similar to crude oil fractions, or into syngas.
April 2023 HYDROCARBON ENGINEERING 26
Figure 3. Maire Tecnimont’s Green Circular District model.
Figure 4. World plastics production in 2021 (source: Plastics Europe).
Chemical recycling is generally divided into three main categories: depolymerisation, pyrolysis and gasification.
Depolymerisation
The depolymerisation process – often referred to as chemolysis or solvolysis – uses different combinations of solvents and heat to break down polymers into their monomers or into intermediates for polymerisation. Depending on the polymer and the related chemistry, depolymerisation is achieved by water (hydrolysis), methanol (methanolysis) or other alcohols (ethanolysis, glycolysis, etc, or more generally ‘alcoholysis’), usually in combination with heat and in some cases with the help of a catalyst.
Polycondensation polymers such as PET and nylon (PA) and polyurethanes (PUR) are suitable for depolymerisation, whereas poly-addition polymers tend to break up into fragments in a less specific manner, not yielding the original monomers in a selective way but randomly, typically requiring more downstream refining.
Depolymerisation processes require a highly pure plastic waste fraction, in terms of polymer composition, to be efficient. Such fractions can either be obtained through closed-loop recycling schemes (e.g., an EPR scheme) or through a pre-treatment and separation process similar to that applied in mechanical recycling.
NextChem is a development partner in the EU-funded DEMETO project for the high-performance microwave technology for PET depolymerisation. In such a technology, coloured or highly-contaminated PET from food packaging and polyesters from textile waste that cannot be mechanically recycled are depolymerised using an alkaline hydrolysis process, assisted by microwaves. The downstream processing allows for the purification of the monomers that can be used to produce a new virgin polymer, closing the loop between PET and polyester materials.8
Pyrolysis
Pyrolysis is a thermal degradation process performed at temperatures of over 400°C in an inert (oxygen-free) atmosphere. Mixed plastic waste fractions that are not suitable for mechanical or solvent recycling can be recycled through this thermal degradation process into a mixture of gaseous and liquid hydrocarbons. After a hydrogenation step, these can then be employed as fuels or as feedstock for traditional petrochemical refining and cracking processes to produce, among other things, new monomers for polymerisation. Pyrolysis technology is especially suitable for multi-layer plastics that cannot be separated mechanically or by selective dissolution.
Although pyrolysis processes perform well with mixed plastics, pre-selection and pre-treatment is required to reduce the amount of inerts and undesired polymers that can generate unwanted or harmful byproducts (e.g., chlorine content due to presence of PVC) or reduce the yield (e.g., due to the presence of oxygen-rich polymers such as polycarbonate or PET).
Waste-to-chemicals
Through the waste-to-chemicals process, a thermal partial oxidation process, a Circular Gas® (mixture of hydrogen and
carbon monoxide[CO]) is obtained that can be used as substitution for syngas, as fuel, or as feedstock for producing several molecules such as Circular Hydrogen®, Circular MethanolTM, Circular EthanolTM, Circular Ammonia, and combinations thereof (e.g., co-production of Circular Hydrogen and Circular Methanol). From these products,
April 2023 HYDROCARBON ENGINEERING 27
Figure 6. MyReplast granules.
Figure 7. NextChem’s waste-to-chemical technology concept.
Figure 5. MyReplast plant in Bedizzole, Italy.
a range of other chemicals can be synthesised, including monomers for polymerisation (e.g., polyethylene and polypropylene) and fuels such as sustainable aviation fuel (SAF). The waste-to-chemicals process can be combined with green hydrogen to enhance the overall yield while reducing CO2 emissions to zero.
Waste-to-chemicals processes, such as those offered by NextChem’s subsidiary MyRechemical, require high temperatures for thermal oxidation (1000 – 1800°C) while using pure oxygen as a gasifying agent, and need to be operated at a scale above 50 000 tpy in order to be economically-viable. They are able to process difficult-to-recycle mixed waste streams that can include non-plastic impurities, such as organic waste, requiring less pre-treatment and less pre-selection in terms of inerts and undesired polymers (e.g., chlorinated plastics).
Conclusion
To achieve the targets for recycling and recycled content, large recycling capacities need to be developed, leveraging all available recycling technologies – from mechanical to chemical recycling.
Full potential can only be reached if a level playing field is created for all recycling, collection and sorting technologies to develop and attract investments. This requires science-based material and technology-neutral regulations that consider the environmental impact of the recycling process, as well as the complete life cycle impact of recycled plastics.9
On Demand Webinars

Especially when it comes to sensitive plastic packaging, chemical recycling is expected to help fill the gap between the current mechanical recycling capacities and to overcome some of its shortcomings while addressing the large gap in supply and demand for recycled content. To stimulate investments in chemical recycling, end-of-waste criteria for its outputs need to be harmonised globally, and at the same time the mass balance approach to tracing and certifying recycled content needs to be clarified and embedded in legislation. In summary, through the application of a Green Circular District approach, plastic waste is poised to become the crude oil of the third millennium.
References
1. ‘Global Plastics Outlook: Economic Drivers, Environmental Impacts and Policy Options’, OECD, (2022), https://doi.org/10.1787/ de747aef-en
2. ‘Global Plastics Outlook: Policy Scenarios to 2060’, OECD, (2022), https://doi.org/10.1787/aa1edf33-en.
3. ‘Plastics - The Facts 2022’, Plastics Europe, (October 2022), https:// plasticseurope.org/knowledge-hub/plastics-the-facts-2022/)
4. ‘ReShaping Plastics: Pathways to a Circular, Climate Neutral Plastics System in Europe’, SYSTEMIQ, (April 2022).
5. ‘Environmental sustainability’, Maire Tecnimont, https://www.mairetecnimont.com/en/sustainability/energytransition/green-circular-districts
6. ‘Plastic waste and recycling in the EU: facts and figures’, European Parliament, (2023), https://www.europarl.europa.eu/news/ en/headlines/society/20181212STO21610/plastic-waste-andrecycling-in-the-eu-facts-and-figures
7. European Coalition for Chemical Recycling, https://www.coalitionchemical-recycling.eu/#chemicalrecycling


8. DEMETO, https://www.demeto.eu/
9. Plastics Europe, https://plasticseurope.org/
Explore our library of free-to-access On Demand Webinars, covering a range of topics in the downstream sector Visit: www.hydrocarbonengineering.com/webinars
Globally, refiners are facing the challenge of reaching net zero emissions – and this is daunting. According to the 2018 Conservation of Clean Air and Water in Europe (CONCAWE) report, the EU has clear ambitions to significantly reduce carbon dioxide (CO2) across its economy and society.1 Currently, the EU aims to reduce greenhouse gas (GHG) emissions by 40% by 2030 and 80 – 95% compared with 1990 by 2050, with industry-specific targets of 83 – 87%. Meeting these targets will require significant change; the ambitious goals will demand an adaptation of the entire EU energy system and consumer behaviour, as well as the development of innovative solutions, which will demand both funding and technological expertise.
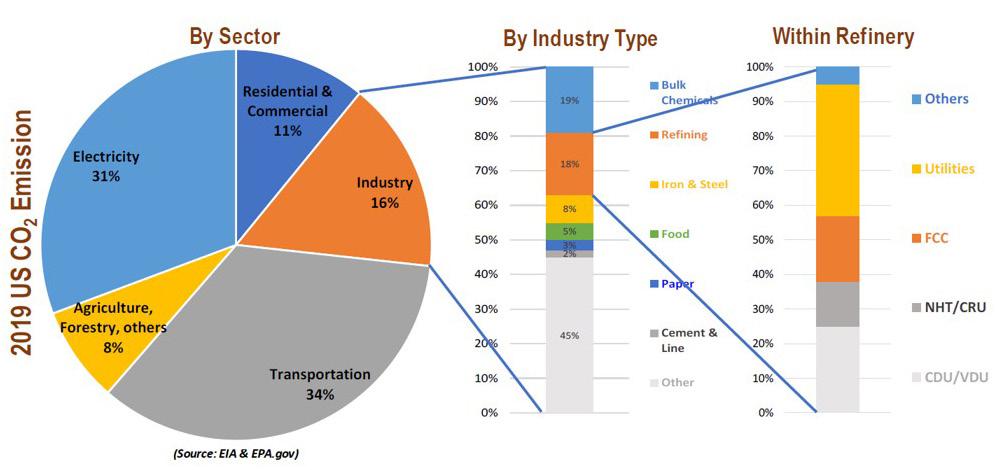
As shown in Figure 1, US oil refineries are the second largest emitters of GHG in industry, ranking only behind the

April 2023 HYDROCARBON ENGINEERING 29
Duncan Mitchell, KBC (A Yokogawa company), explains how integrated process and energy models are capable of providing critical insight in the battle against emissions reduction.
bulk chemicals industry in terms of annual tonnes of CO2 emissions. If all existing and proposed refineries operate as usual, without the adoption of any carbon emissions abatement measures, they will emit up to 16.5 Gt of CO2 from 2020 to 2030, up from 1.3 Gt in 2018.2
Many refiners such as ExxonMobil, Shell, Total and Valero, to name a few, have committed to significantly reducing their direct GHG emissions (Scope 1) and indirect emissions (Scope 2), as depicted in Table 1.
The response required to meet the goals of the global energy transition has been likened by some to fighting a war, such is the intense and prolonged focus on understanding and overcoming the challenge. Sun Tzu famously wrote in ‘The Art of War’: “know thyself, know thy enemy,” and this provides insight that is helpful to develop
and execute a roadmap of short- and medium-term projects (battles, if you will) in the ‘war’ against Scope 1 and 2 emissions.
Attack by stratagem
Using a two-pronged strategic approach, ‘know thyself’ refers to the refinery’s configuration, its unit operations, its energy demand and use, and its GHG emissions.
‘Know thy enemy’ refers to the old battles familiar to all refineries; those of energy integration, efficiency, yield maximisation, and cost control.
The point here is that these two aspects are linked for success. How a refinery is configured, what it processes and produces, and how it provides the energy needed by those processes is critical to understanding how much and where GHG emissions are derived. Then, based on that information, determining which carbon emissions and mitigation strategies are necessary to meeting reduction targets is also important. This is where the full value of integrated modelling of the processes and energy systems becomes clear. Modelling provides a comprehensive tool that can be used to analyse the current situation and, most importantly, identify the adjustable mechanisms to improve the situation in one area without causing negative consequences in another. Consider, for example, the impact on the fuel gas balance from continuously replacing fuel gas in a fired heater with hydrogen, without flaring any excess.
Organising your forces
These integrated models cover more than just fuel refineries. They are available for upstream systems, including LPG and LNG plants, aromatics plants, and olefin crackers. Some of the most exciting use of these models involves extending their range beyond normal plant battery limits to multiple contiguous facilities such as neighbouring refineries, power plants, steel plants, and chemical plants.
Figure 2 shows a schematic of one such integrated process, energy, emissions and economics model (IP3EM). The model uses industry-standard process simulation tools to map the process and energy flows of a generic fuel refinery.
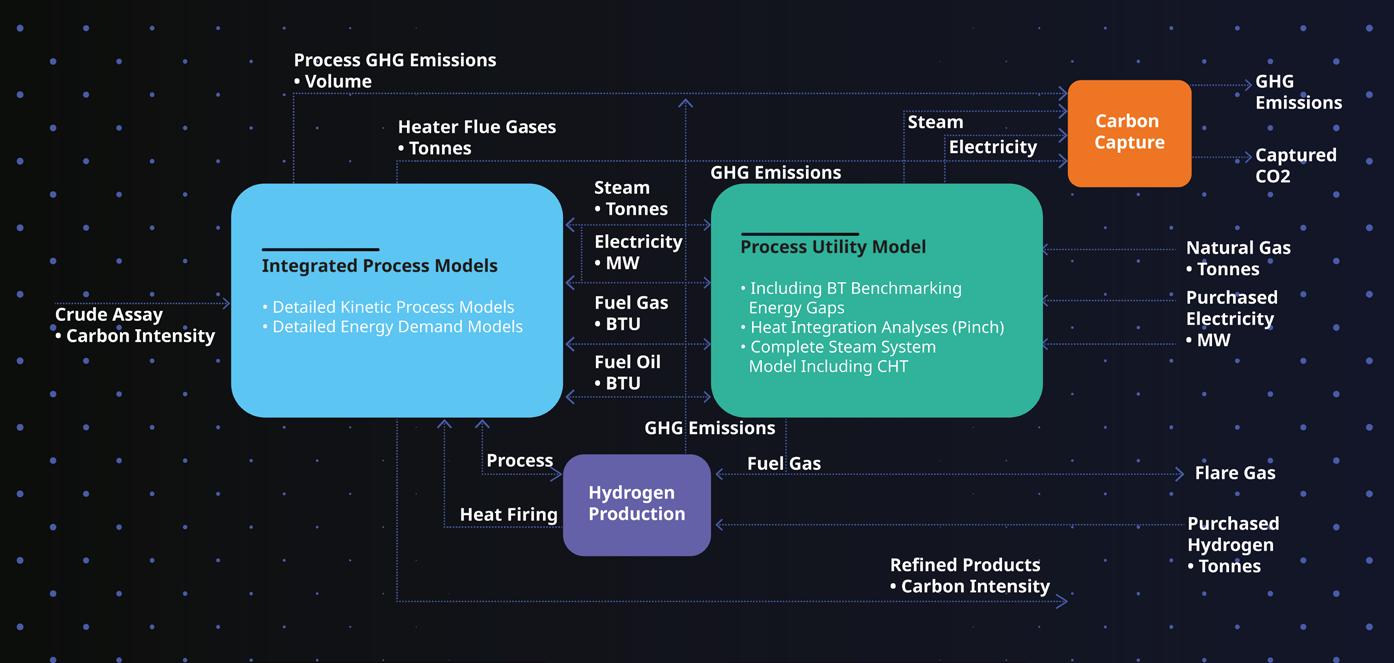
A typical energy supply system is integrated, including the steam (and boilers), fuel gas, electricity (and gas turbine generator [GTG]/heat recovery steam generator [HRSG]) and hydrogen
In practice, this model is
April 2023 HYDROCARBON ENGINEERING 30
systems.
Figure 1. 2019 US CO2 emissions by sector.
Table 1.
Emission
ExxonMobil Reduce Scope 1 and 2 emissions intensity by 9% while progressing toward 2030 GHG emission-reduction plans Marathon Petroleum Corp. Reduce Scope 1 and 2 GHG intensity/boe to 30% below 2014 by 2030 Shell Decreased Scope 1 and 2 emissions by 18% between 2016 – 2021, while aiming to reduce Scope 1 and 2 emissions by 50% by 2030 TotalEnergies Cut Scope 1 and Scope 2 net emissions by at least 40% in 2030 compared to 2015 Valero Reduce and displace 63% of its global refinery Scope 1 and Scope 2 GHG emissions by 2025, and 100% by 2035
Figure 2. Schematic of the IP3EM approach.
Emission reduction targets by refinery Refinery
reduction targets
TRI-BLOCK Double Block and Bleed Valve SIL3 WWW.ZWICK-ARMATUREN.DE
2. CO2 emissions (tph)
integration (pinch analysis), optimising heater operations, and converting energy systems, such as condensing steam turbines. Real reductions are possible in relatively short timeframes of 12 – 24 months, and often with low capital investments. As refining margins and energy prices rise, these reductions are wholly aligned with a refiner’s need to improve operating margins without jeopardising operating reliability.
In the past 20 years, many refineries have focused on energy efficiency improvements to increase sustainable operating margins. Clearly, not all refineries are ‘above average’. However, in terms of energy efficiency, the spread between high- and low-efficiency refineries has narrowed. Refiners face a range of solutions to reduce short-term Scope 1 and Scope 2 energy costs, but reductions from baseline by 20% or more are becoming increasingly difficult to find, as shown in Figure 3.
Variations in tactics
At this point, the emissions reduction battlefront shifts. If refinery throughputs are to be maintained, further Scope 1 and 2 emission reductions must come in the form of active carbon mitigation, either through carbon capture, hydrogen (or carbon-reduced alternatives, such as ammonia), or electrification. These tools significantly increase the time, capital cost requirement, and asset integration challenge. Again, here the integrated models offer critical insight. They scope process technology options, size solutions as a key input to estimate capital cost, predict emissions and carbon intensity impacts, and estimate refinery operating margins while analysing the integrated impact on the whole facility.
easily adapted for actual refineries and tuned to match the existing configuration, throughputs, flows and emissions. The example shows this refinery’s overall best technology (BT) performance by quartile in Table 2, operating at 150 million bpd emitting just under 250 tph CO2, while operating at around 3 quartile of benchmarked energy efficiency.
Manoeuvering with advantage
Immediately, the model shows the distribution of those CO2 emissions by process (such as FCC flue gas), fired heaters (such as crude train) and boilers, as well as how the energy efficiency impacts the emissions from those same sources. As can be seen in Table 3, changes in emissions occur when specific improvements are made on a process level in energy benchmarks.
The enemy in the first battle to be fought in the war against Scope 1 and 2 GHG emissions is energy efficiency. The model flags opportunities for improvement and the extent to which they can be achieved. In this case, a global database of similar units is used to establish credible targets of possible emission reductions by improving heat
The first insight demonstrates that some combination of carbon capture, hydrogen firing, and electrification solutions cannot practically eliminate emissions within refineries alone. The model shows that even limited use of these options (in this case, to mitigate the emissions from the crude and vacuum heater stacks) with the refinery’s existing resources increase Scope 1 and 2 emissions, or at the very least, have less impact than expected – as depicted in Figure 4.
Carbon capture
Carbon capture is a technologically-mature option. In its most common form, it uses an amine absorption system to separate CO2 from flue gases into concentrations and partial pressures suitable for capture, compression and either sequestration or utilisation. Many existing process simulators accurately model these systems and can predict their energy requirements. Their use requires a significant and relatively close footprint and, most importantly, an export option – what is to be done with the hundreds of thousands of tonnes of captured CO2 annually? Exporting pipelines to remove and sequester the refiner’s captured emissions are more common but still very limited in geographic scope and often not an option for the refiner. Even within a refinery’s operations envelope, however, the capture systems require significant steam to regenerate the amine and large amounts of energy to compress and move the gas, which significantly reduces the solution’s impact.
April 2023 HYDROCARBON ENGINEERING 32
Table
4 quartile 3 quartile 2 quartile 1 quartile Crude 43 37 32 25 Coker 14 12 11 10 FCC 63 57 52 47 Isom + Alky 8 6 4 4 Reformer 30 23 19 14 Hydrotreating 14 9 6 3 Boilers 16 16 16 16 Gas turbine (GT) + HRSG 11 11 11 11 SMR 54 50 45 39 Total 253 221 196 169 Scope 2 40 28 29 13 Scopes 1 + 2 293 249 225 182 Table 3. Energy
impact on emissions by quartile 4 quartile 3 quartile 2 quartile 1 quartile Delta Delta Delta Delta Scope 1 14% Base -11% -24% Scope 2 21% Base 2% -26% Crude 16% Base -14% -32% Coker 17% Base -8% -17% FCC 11% Base -9% -18% Isom + Alky 33% Base -33% -33% Reformer 30% Base -17% -39% Hydrotreating 56% Base -33% -67% Boilers 0% Base 0% 0% GT + HRSG 0% Base 0% 0% SMR 8% Base -10% -22%
efficiency
The integrated model accurately evaluates the emissions impact due to increasing the steam and electricity loads.
Hydrogen firing
Hydrogen firing is another choice. Fired heaters can be adapted to fire up to 60% hydrogen with firing system adjustments, and rebuilt to fire 100% hydrogen to eliminate Scope 1 emissions from that source. However, as the model demonstrates, simply using excess refinery fuel gas to burn in heaters increases Scope 1 emissions. This solution is best applied when there is green or low-carbon-intensity hydrogen available to the refinery, normally from an external source. Even then, careful modelling of the refinery’s existing fuel gas balance is necessary to ensure that excess does not require flaring.
Electrical heat
Electrical heat is another well-understood and technologically-feasible energy solution. Heaters, reboilers, boilers and even crackers are increasingly using it. By switching the energy from gas to electric duty, the model example demonstrates that buying more electricity off the grid at normal carbon intensities disproportionately increases the refiner’s Scope 2 emissions. Any significant Scope 1 and 2 emissions reduction requires the use of green or low-intensity purchased electricity, which still demands an accurate assessment of the refiner’s fuel gas system to ensure that excess gas is not flared.
Simulating emissions credibly and within an operator’s battery limits is one of the benefits of integrated process and energy models. Sophisticated, integrated models have been built to look at the energy systems within and between large industrial facilities. These models work thanks to the modern models’ improved analytical power, ability to gather and exchange considerable amounts of data to sub-minute optimisations, and a coordinated approach to confidentiality and data security. Emissions reduction insights derive from increasingly-sophisticated analyses of production schedules, energy demands and emissions drivers within these extended networks, such that significant improvement in emissions are possible while allowing for appropriate collaboration and planning, including scheduling and capital project analyses.
The terrain
Fuel refiners, aromatics producers, and chemicals and petrochemicals manufacturers will travel a torturous path to achieve net zero targets of 2030 and 2050. The path requires roadmapping opportunities and the evaluation of different options. It is further complicated by the changing demands of today’s markets and the future energy needs
informed by a broad array of existing and emerging products, regulations and technologies. No one has a clear solution, and no one considers the task simple. The role of integrated process and energy models to work through the complexity with accuracy and credibility is clear. The scope of these models will increase as wider solution spaces are considered. The good news is that these models exist. They are being tested, constantly improved, and cost a fraction of potential capital solutions, if those investments are implemented blindly.
Fighting the good fight
2000 years ago, Sun Tzu may not have had sophisticated modelling tools. However, had he been faced with an energy transition challenge such as ours, it is likely that he would turn to integrated process, energy, emissions and economics models in order to understand the situation better and plan his battles against the enemy.
References
1. ‘The Low Carbon Pathways Project’, Concawe Working Plan, https://www.concawe.eu/wp-content/uploads/2018/04/Workingplan_Low-Carbon-Pathways.pdf
2. ‘We can expect more emissions from oil refineries in the near-term future, analysis finds’, ScienceDaily, (20 August 2021), https:// www.sciencedaily.com/releases/2021/08/210820111125.htm
Bibliography
• For a full bibliography, please refer to: https://www. hydrocarbonengineering.com/the-environment/19032023/knowthyself-know-thy-enemy-references/
April 2023 HYDROCARBON ENGINEERING 33
Figure 3. A great start, but inadequate for Scope 1 and 2 improvements.
Figure 4. Going at it alone on CO2 emissions abatement.

April 2023 34 HYDROCARBON ENGINEERING
Asmaa Kassab and David Ashwill, MOGAS Industries Inc., USA, discuss fugitive emission technology limitations in severe service valves.
With increasing strictness of regulations, there has been additional stress on fugitive emission (FE) reduction from industrial facilities. This has resulted in end users placing pressure on valve manufacturers to comply with FE testing standards and guarantee low emissions from their valves. While there have been some advances in recent years, there is still a lack of clarity regarding what the standards require and where they apply, especially in severe service applications.

Inconsistency of pressure and temperature limits in FE standards
There are several standards that influence the design and performance of certified FE valves, such as API 641, ‘Type Testing of Quarter-turn Valves for Fugitive Emissions’ and ISO 15848-1 and -2 ‘Measurement, Test and Qualification Procedures for Fugitive Emissions – Part 1: Classification Systems and Qualification Procedures for Type Testing of Valves; and Part 2: Production Acceptance Test of Valves’. However, none of these standards address high-temperature applications above 752°F (400°C), such as delayed coker, fluid catalytic cracking (FCC), hydrotreating and hydrocracking.
API 641 was designed to focus on approximately 80% of the refining and petrochemical applications. Although the latest edition of API 608 (January 2020) requires all metal ball valves to be FE-qualified to API 641, this standard was never intended for all applications – and certainly not high-temperature applications or higher pressure classes – as it is limited to 1500 and lower pressure classes.
Quarter-turn valves, such as ball valves and butterfly valves qualified to API 641, must use qualified packing as per API 622, ‘Valve Packing for Fugitive Emissions’. API 622 indicates that the packing’s maximum testing temperature is 500°F (260°C), however their qualification goes up to twice the testing temperature: 1000°F (538°C). Similar to API 622, API 641 tests valves to a maximum temperature of 500°F (260°C) and does not extend a ‘qualification temperature’; it just lists the test temperature.
ISO 15848-1 is another common standard that is more applicable for high-temperature severe service valves, as it offers several classes of temperature qualification and includes testing for higher temperatures of up to 752°F (400°C), and does not extend the qualification above the test temperature.
April 2023 35 HYDROCARBON ENGINEERING
Figure 1 shows the comparison between ISO 15848-1 and -2, and API’s 622 and 641. The figure highlights the differences between test pressure and temperature. In terms of testing, ISO 15848-1 is more stringent than API 641, with the maximum testing temperature of 752°F (400°C) for the ISO standard compared to 500°F (260°C) for the API standard. Currently, testing temperatures above 752°F (400°C) are not considered in FE standards.
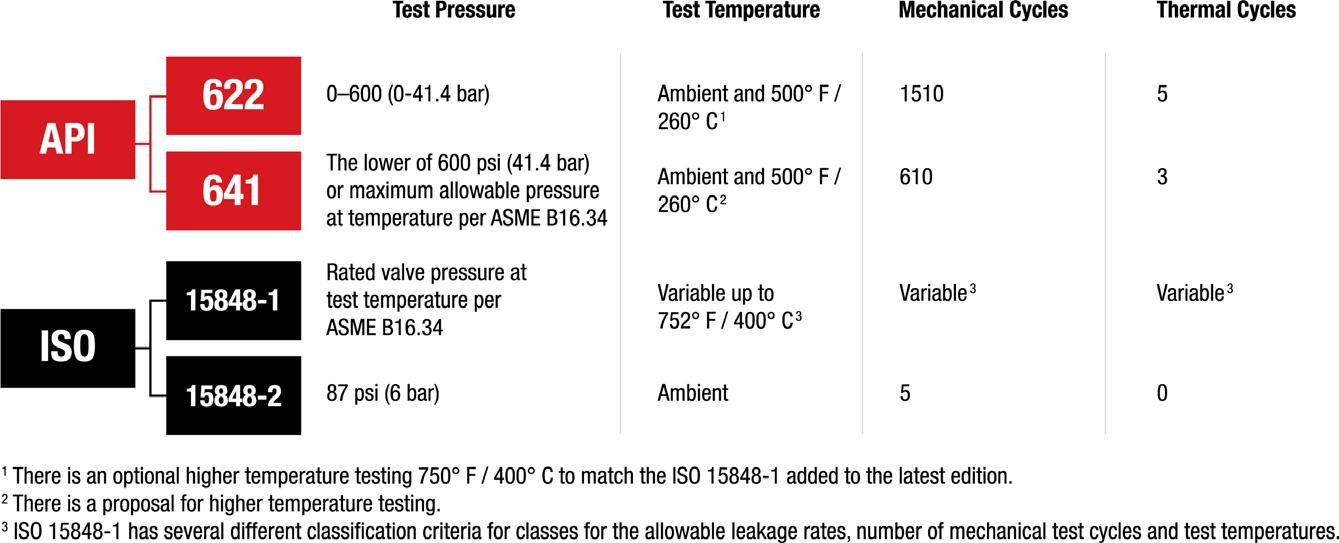
End users are starting to realise this inconsistency, and standard committees are having discussions to change the scope of the API test standards in order to align more closely with the ISO qualification standard.
On a positive note, a March 2022 revision to the API 622 FE standard added an optional high-temperature testing. This is a significant step forward towards removing the temperature discrepancy between standards.
Limitations of FE packing
Typically, the packing used for API 622 qualifications contains some volume of additives that serves a dual purpose as lubricant and blocking agent. These additives seem to significantly increase the sealing performance of the packing and block emissions. However, additives tend to experience a weight loss in the packings at elevated temperatures, creating a potential leak path and likely increasing emissions to the environment, especially over time.
Moreover, it is proven that packing without those volatile additives is highly unlikely to successfully meet FE stringent qualification testing requirements, notably when
testing with helium, which has a smaller molecule size than methane, or at high pressures and temperatures. For example, polytetrafluoroethylene (PTFE) is widely used as a lubricant and blocking agent in packing for FE purposes. However, PTFE’s melting temperature is 599 – 642°F (315 – 339°C), and it is proven that at 750°F (400°C) PTFE gases off (sublimes) and leaves no residue. Studies show that for temperatures above 750°F (400° C), packing with PTFE content will lose between 2 – 17% in volume due to PTFE sublimation.
As a result, the qualification to FE standards does not guarantee low emission performance valves at temperatures of over 752°F (400°C) because of the temperature limitations of both API and ISO standards, and due to the sublimation lubricants present in FE packings at elevated temperatures.
One common question that end users ask is: what is the temperature difference between the media and the packing? During FE testing it has been observed that the packing box temperature typically lags the body temperature by a differential of approximately 100°F (56°C), as shown in Figure 2. However, in steady state conditions, the packing on some insulated heavy oils and delayed coking valves will operate at a much similar temperature than the media in the range of 850°F (454°C) or above, which is considerably higher than the testing standards.
Valve design considerations for FE service
Compliance with API 641 and ISO 15848-1 standards impacts valve design and performance. FE qualified valves are not standard valves, because the following additional changes are required:
n Higher packing compression at assembly, as recommended by FE packing manufacturers.
n Depending on the pressure class and packing structure, FE packing has the potential to double the stem packing torque and can increase the overall operating torque, therefore potentially increasing the actuator size – especially on smaller valves and lower pressure classes. In smaller valves, the percentage of total torque due to stem packing torque is higher than in larger valves (Figure 3).
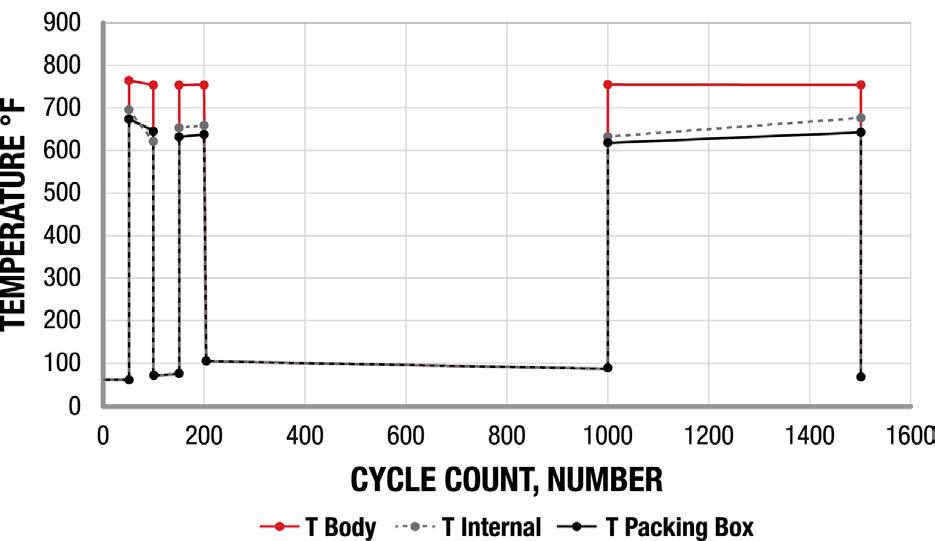
n To adequately compress the packing, more or larger gland fasteners or higher strength bolts may be required, as well as heavy gland flanges to accommodate the increased loads. This could change the design of the top works and result in a larger valve body to accommodate larger fasteners.
Low emission valves in high-temperature applications
Nearly 10 000 MOGAS valves equipped with a standard high-temperature flexible graphite packing set – containing no volatile additives – have been shown to operate reliably in refinery applications with design conditions of up to
April 2023 HYDROCARBON ENGINEERING 36
Figure 1. Brief comparison of FE standards, highlighting the difference in temperature, pressure and thermal cycles.
Figure 2. FE temperature test data for MOGAS valve.
CLEAN PROCESS + CLEAR PROGRESS
Proservo NMS81:
Most accurate tank gauging instrument (±0.4mm) for SIL3 applications runs independent of boil-off gas.
We understand how you need to reduce complexities at your plant. Do you want to learn more? www.endress.com/oil-gas


You strengthen your plant’s safety, productivity and availability with innovations and resources.

Promass F 300: Mass flowmeter provides highest measurement performance for gases under demanding process conditions.


Field Xpert SMT77: Tablet PC allows mobile device configuration and plant asset management, even in hazardous areas Ex Zone 1.

Improve your processes with our comprehensive portfolio of measuring instruments, solutions and services:
1000˚F (540˚C), without objectionable in-service emissions. MOGAS’ standard packing set with standard assembly protocols has repeatedly and reliably passed ISO 15848-2 helium emissions production testing, as shown in Figure 4.
Considering the testing temperature limitations of APIs 622 and 641, and ISO 15848-1, when it comes to FE standards and the sublimation of volatile additives commonly present in FE packing, there is the need to develop technologies for high-temperature applications that will help end users to lower emissions at industrial sites.
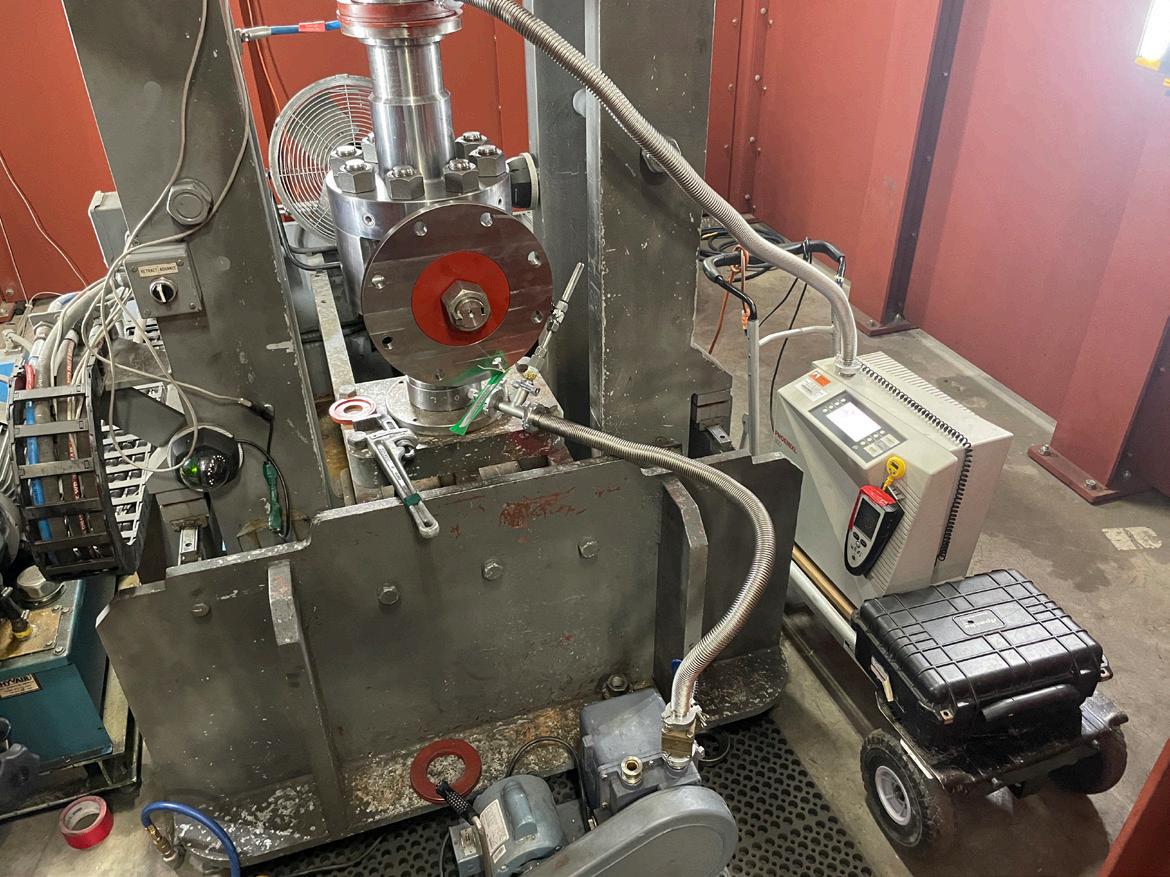
MOGAS’ commitment is to supply severe service valves that comply with industry standards and offer valves that are qualified to API 641 and ISO 15848-1. To achieve low emissions in high-temperature applications, the company recommends a packing with no volatile content.
Figure 5 illustrates the degradation of API 622 FE packing at various temperatures, as compared to standard high-temperature packing with no PTFE content. It clearly shows that the weight loss of the API 622 packing increases exponentially over 800˚F (427˚C), while MOGAS’ standard high-temperature packing weight loss remains linear. Additionally, the MOGAS packing is much lower at the actual operating temperatures of heavy oils applications, as it does not contain any blocking agents. What the graph cannot illustrate is the effect of the initial packing box pressure (internal packing stress), which is typically required to be twice as high for the API 622 packing.
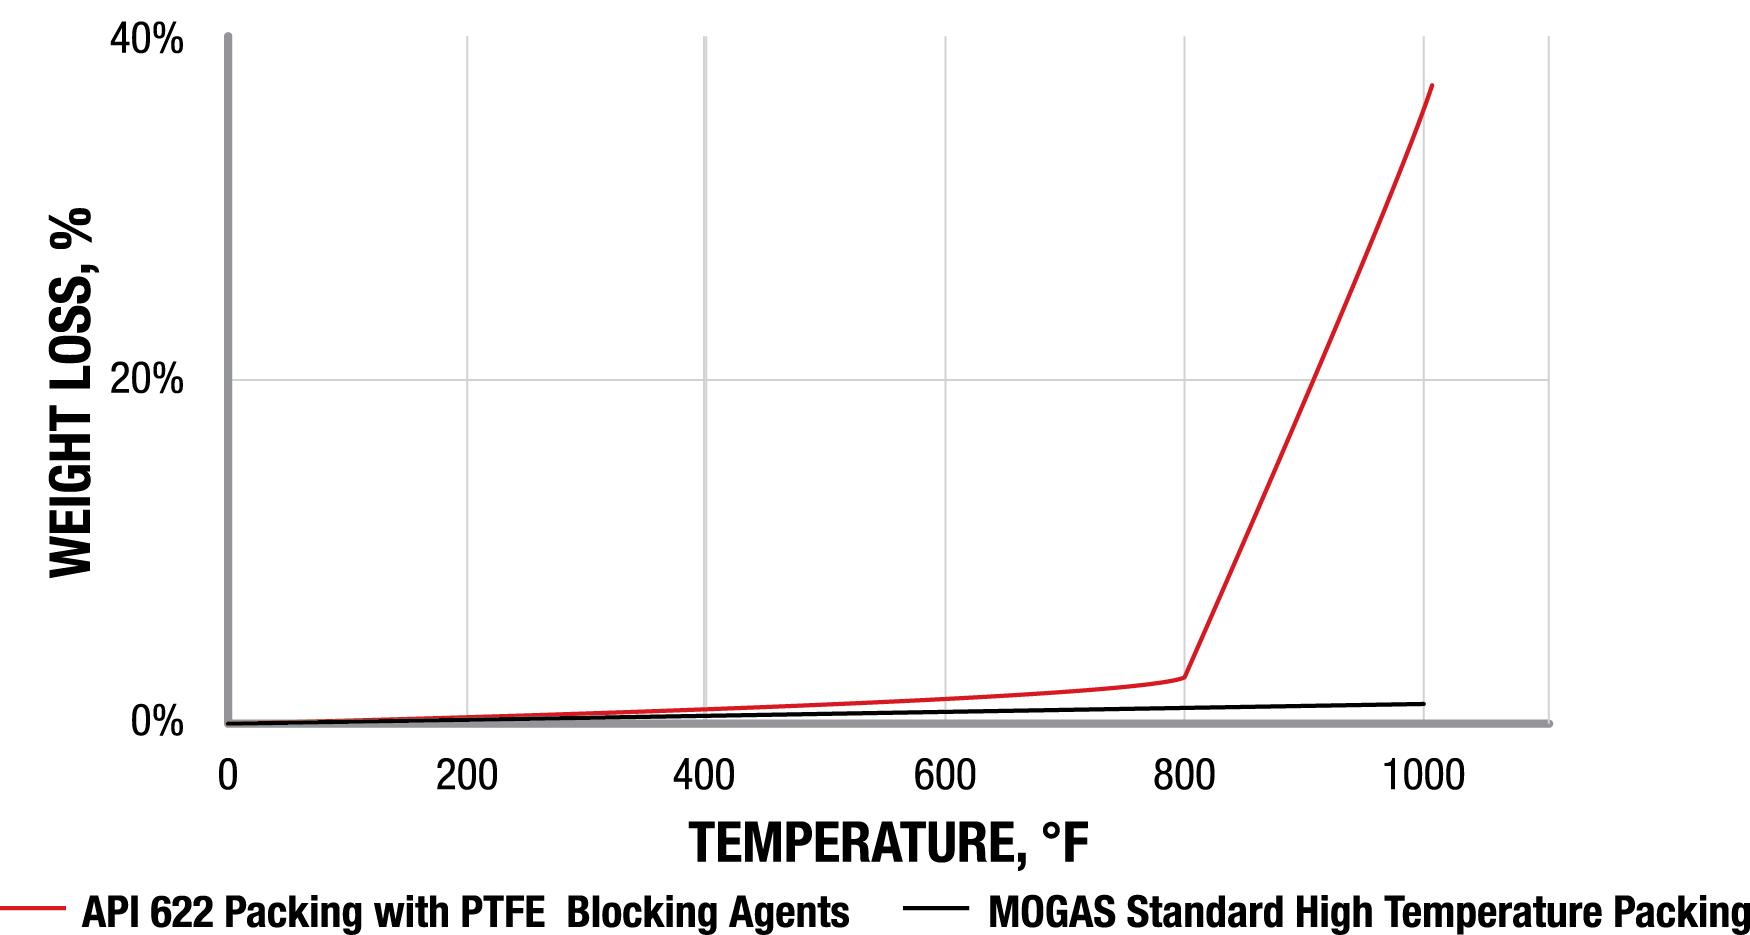
MOGAS can provide valves qualified to API 641 and ISO 15848-1 when required, as per the aforementioned limited scope. However, qualification to these standards does not guarantee low emission performance at temperatures of over 752°F (400°C) because of the limitations of both API 641 and ISO 15848 standards. Due to the sublimation of volatile additives (present in fugitive emissions packings) at elevated temperatures, API 622 packings are more likely to lose volume and impact the performance of the packing in higher temperature services than MOGAS’ standard packing.
The company understands the need for low emissions valves in high-temperature applications, and therefore offers a packing solution for high-temperature applications that guarantees packing sealing capabilities even at temperatures of above 752°F (400°C).
As mentioned, qualification to these standards does not guarantee emission performance for valves exposed to temperatures higher than the test temperatures:
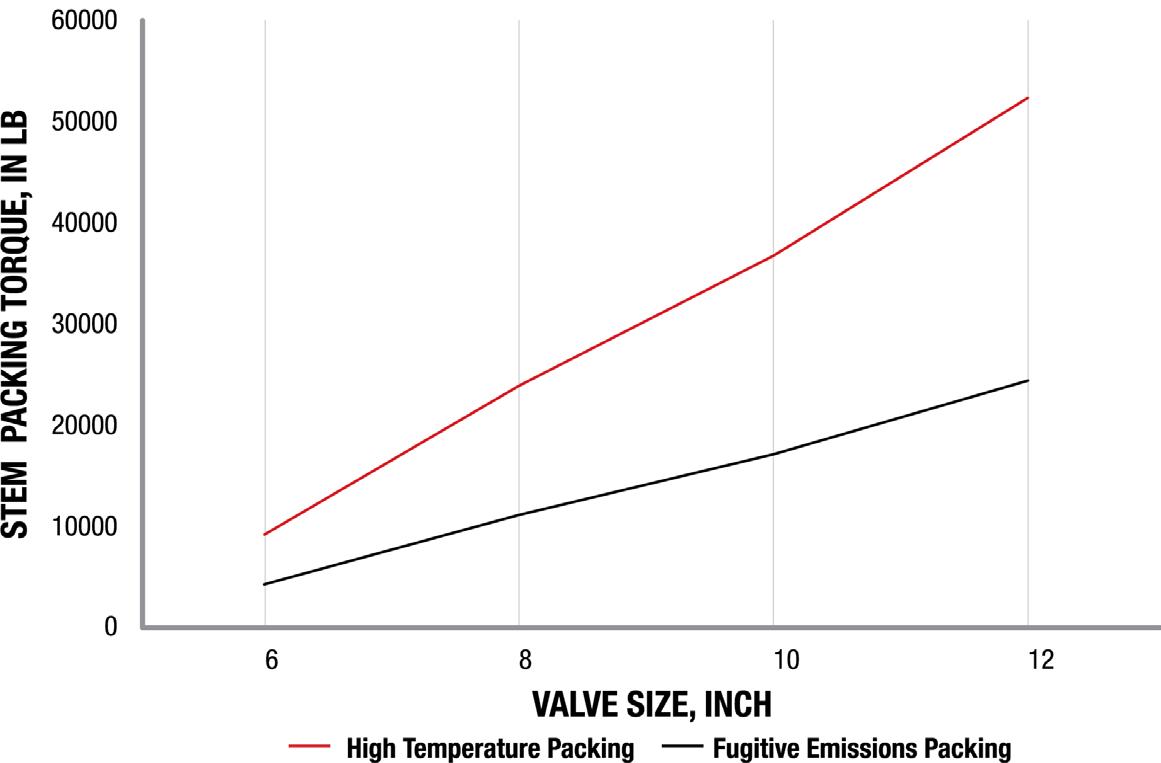
n API 641: 500°F (260°C).
n ISO 15848-1: 752°F (400°C).
April 2023 HYDROCARBON ENGINEERING 38
Figure 3. Comparison between stem packing torques for FE packing and high-temperature packing for ASME 300 class valves.
Figure 4. MOGAS ISO 15848-2 helium emissions production testing (photo courtesy of Leak Detection Specialists Ltd, Houston, Texas, US).
Figure 5. Comparison of packing weight loss curve.
Overhead Vapor Isolation
• Heavy-duty mounting flange
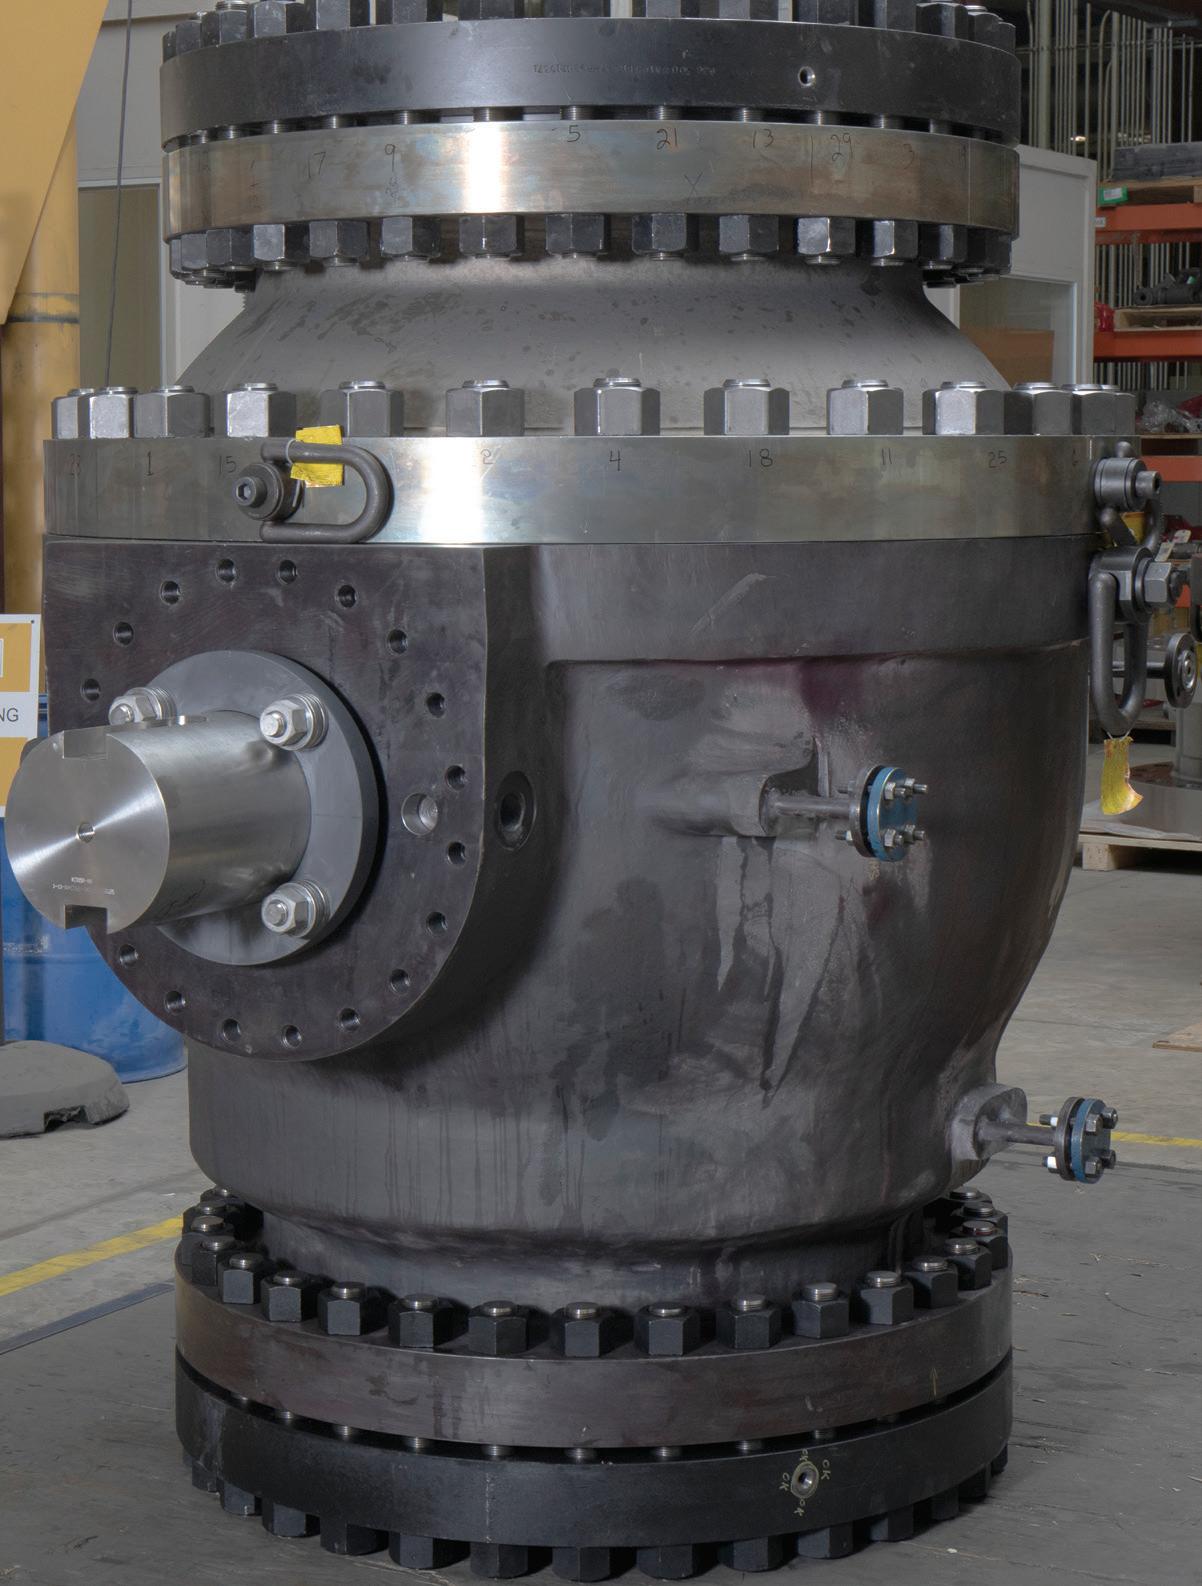
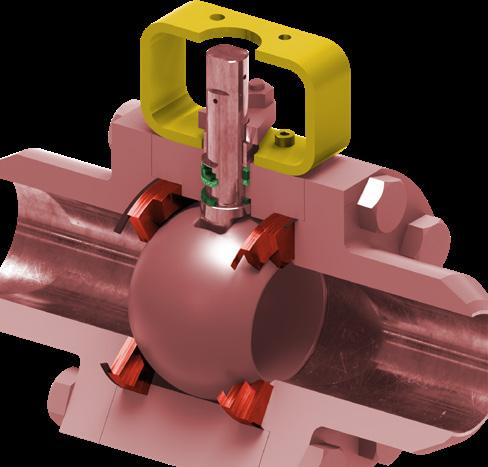
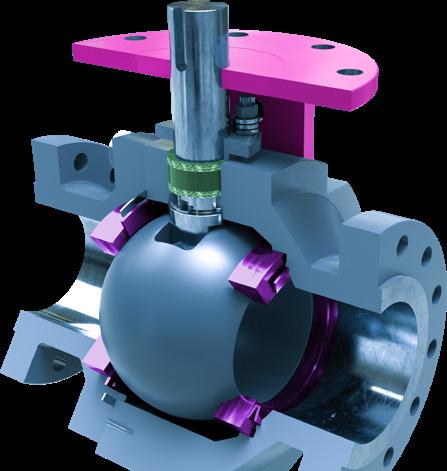
• Wider seats
• Dual-guided stem
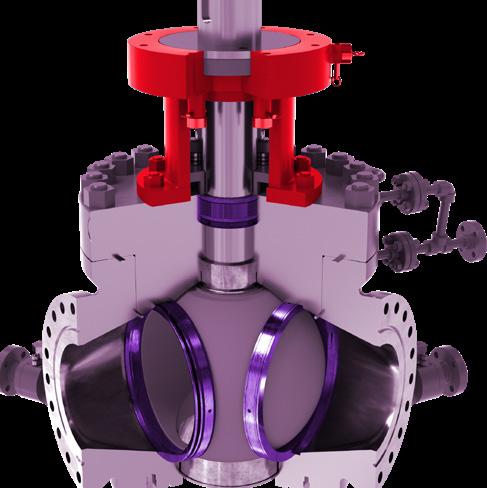
• Consistent torque requirements
• Minimal purge ports
• Belleville springs (no bellows)
MOGAS Valves for Delayed Coking
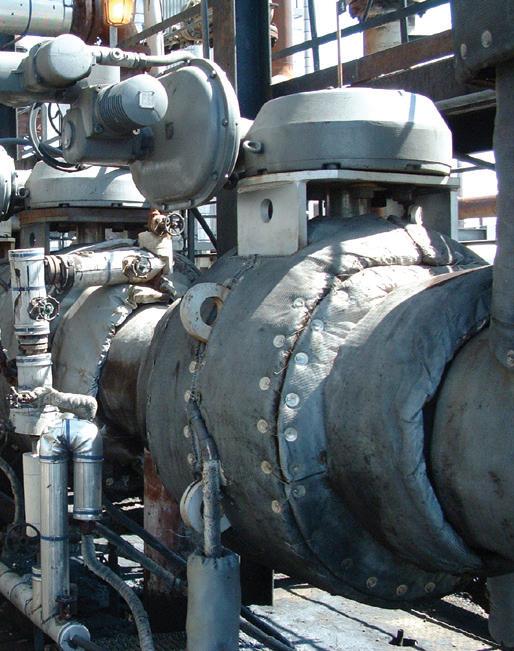
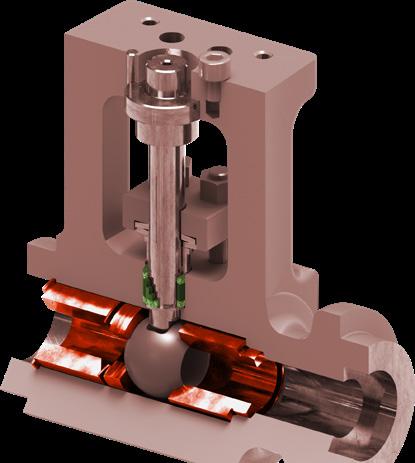
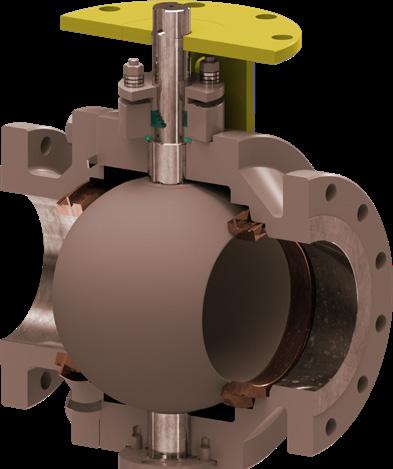
A G-Series – general drain and vent
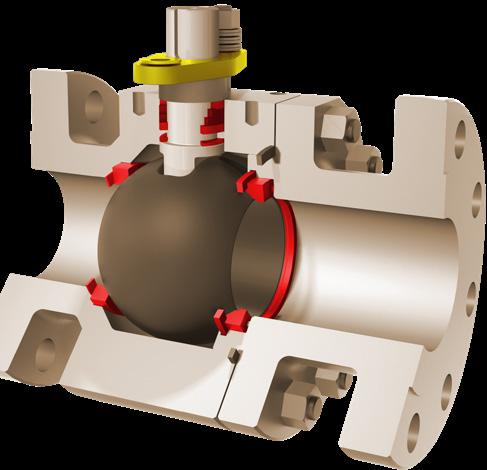
B iRSVP – severe service steam / water / condensation utility and drain
C T-Series – high pressure pump inlet, cutting water, general steam and drain
D ISOLATOR 2.0 – high pressure pump inlet, coker gas pump emergency block
E C-Series – cutting water, quench extraction, overhead vapor, coke drum bypass and feed, frac bottoms, coke filter, furnace charge pump inlet / discharge / feed
F DV-4 – coker drum switching
Call today 800.544.0291
increased reliability and increased run time. mogas.com A B C D E F
for
Four 20-in ASME 300 Class overhead vapor valves have been installed since 1991 at this refinery. After eight years of continuous service, less than 0.001 inch of the coating was worn away.
MOGAS’ Engineering Technology group designs valves in partnership with end users and licensors. When you select MOGAS products you get timely access to our knowledgeable and experienced service team, anytime, anywhere.
Additionally, ASME 2500 Class valves cannot be certified to API 641 because they are outwith the scope of that standard.

Even though MOGAS has achieved the highest API and ISO fugitive emission standards requirements (see Figure 6), as a severe service manufacturer it advises the use of FE packing with volatile additives at or below the temperatures specified in the test standards.
Moving forward
While end users understand the need for low emissions, it is important to recognise the limitations of existing technology.

As a manufacturer of severe service technology, MOGAS will continue to educate customers on existing FE packing limitations. The topic of FE compliance is constantly evolving, and some manufacturers are counting on customers to not fully recognise the resulting ramifications.
It is critical to understand the difference between FE test qualifications and low emissions. The FE test qualifications are pressure and temperature limited, and it is well proven that the existing packing will degrade significantly at temperatures higher than 500°F (260°C), causing even higher emissions. In such instance, the requirements of FE represent a case where meeting the specification will likely result in excessive emissions from the valves that fail to meet performance expectations.
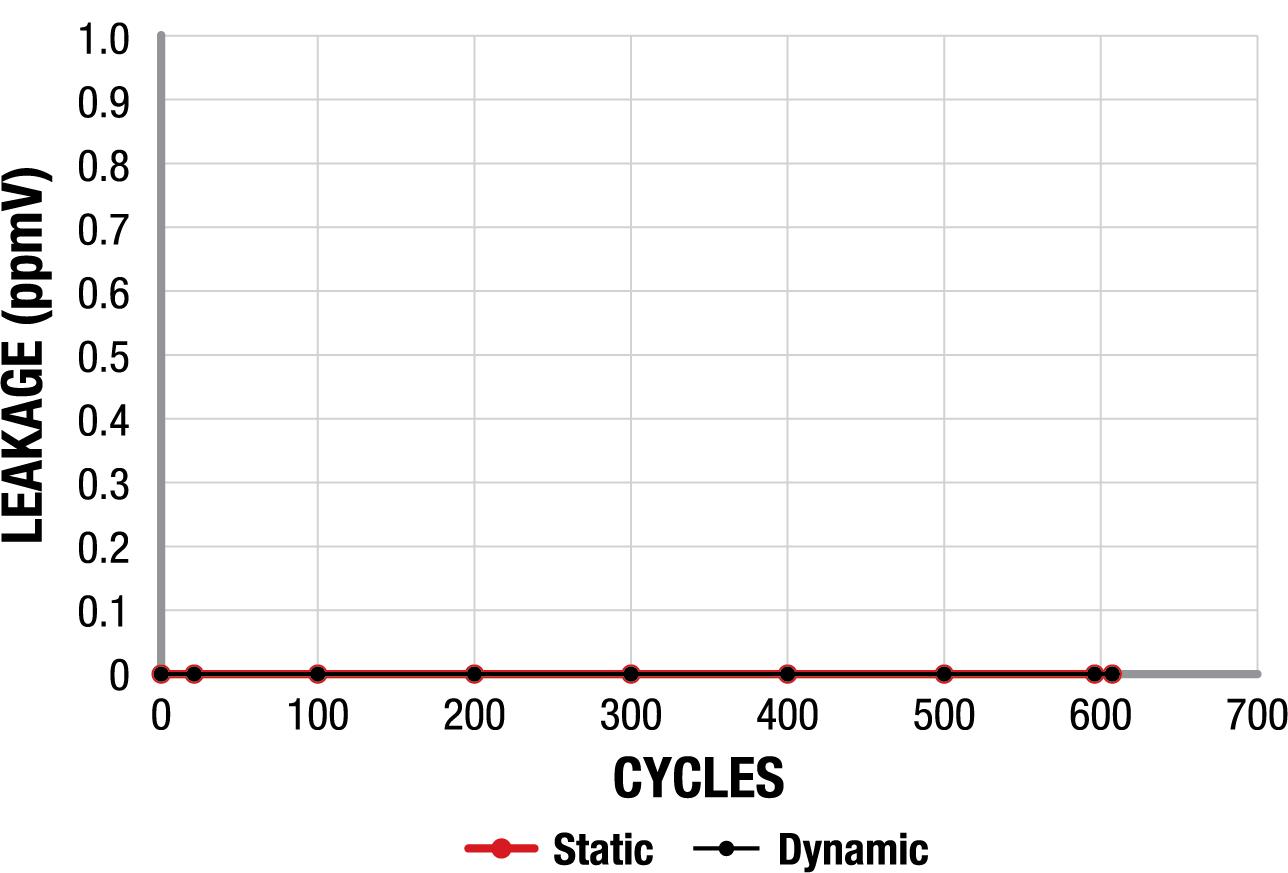
Packing manufacturers are aware of this limitation and are working on the next generation of FE packings that do not contain lubricants or blocking agents. Until then, it is critical to understand and accept the limitation of existing technology.
Bibliography
• API STD 641 – Type Testing of Quarter-turn Valves for Fugitive Emissions, 1st Edition, (October 2016).
• ISO 15848-1 – Industrial valves – Measurement, Test and Qualification Procedures for Fugitive Emissions (Part 1: Classification system and qualification procedures for type testing of valves), 2nd Edition, (June 2015).

• ISO 15848-2 – Industrial valves – Measurement, Test and Qualification Procedures for Fugitive Emissions (Part 2: Production acceptance test of valves), 2nd Edition, (June 2015).
• API STD 622 – Type Testing of Process Valve Packing for Fugitive Emission, 3rd Edition, (October 2018).
Need a reprint? +44 (0)1252 718999 reprints@hydrocarbonengineering.com We can tailor to your requirements, produce 1 - 12 page formats, print colour or mono and more
Figure 6. API 641 stem seal leak results showing zero PPM for MOGAS 3 in. ASME 1500 Class valve.
Dhanesh
Molecular sieves, or molsieves, are used in the refining and petrochemical process industries as adsorbents. They are mainly used in scenarios whereby very dry streams are required, helping to remove water and other oxygen sources to avoid catalyst deactivation and potential corrosion problems in the process plant. Molsieves exist in different pore sizes and their use varies between applications.
The drying process typically happens in two stages: adsorption and regeneration. During the adsorption phase, fluids pass through the molsieve beds, adsorbing the water content that is present in the fluid stream. Once the molsieves are saturated, they must be regenerated. In dryers, this regeneration happens by passing hot gas through the molsieve beds which carries the adsorbed water content, thereby
regenerating the beds for further adsorption. This is a continuous process involving several adsorption beds.
While there are many process challenges involved in the dryer process, this article will discuss those related to the valves that are required in these dryer units.

Sequencing valve challenges in molsieve dryers
On-off valves used in conjunction with molsieve dryers face certain challenges, which need to be considered during the process of selection.
Firstly, there is a possibility of molsieve dust entering critical areas of the valve. In particular, this is an issue that has been reported by some customers as related to switching valves. Over time, the molsieve produces small particles which
April 2023 41 HYDROCARBON ENGINEERING
Bhaskaran, Valmet, India, details the valve-related challenges and solutions associated with molsieve dryer processes.
can escape from the molsieve beds and eventually enter the pipeline and valves. These particles are not part of the actual process fluid but are a result of normal operation. The challenge is to ensure that the impact of the particles on the equipment and valves is minimised. If particles enter the critical areas of the valve, they can disrupt its operation and hamper overall process efficiency.
In addition to this, valves undergo thermal cycling. In the adsorption phase the molsieves adsorb water in the bed, while in the regeneration phase hot gases pass through. Therefore, valves typically experience one set of process conditions with lower temperatures during the adsorption phase, and higher temperatures during the regeneration phase. There have been cases where a customer has issues with a valve that cannot be operated during the high temperature phase. As a result, they have to wait for the temperatures to fall.
Thirdly, the molsieve dryer process demands that the valves frequently switch from one phase to another, meaning that valve cycling can be higher than in traditional on-off valves. High cycling can lead to performance issues, higher maintenance costs, and frequent soft part replacements. Because these processes are often required to run for years without disruption, cycling can be another challenging part of the process.
Finally, valve tightness is another important criterion. Challenging process conditions make it difficult to maintain the required tightness of on-off valves over a long period of time.
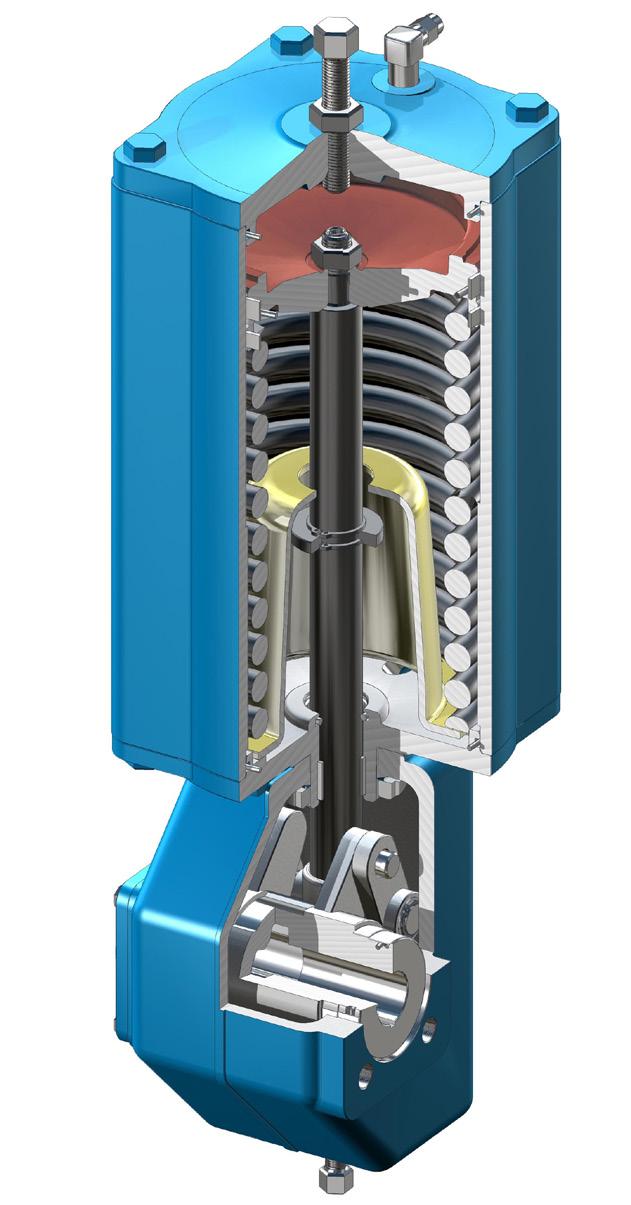
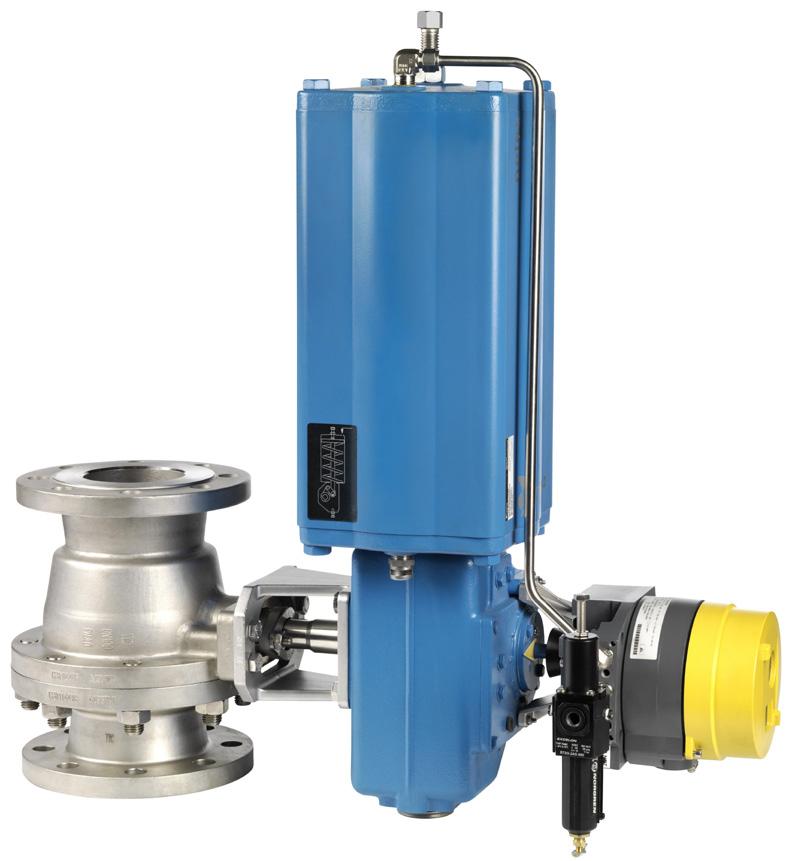
Meeting molsieve challenges
With these challenges in mind, the next question to ask is: what is the right valve selection for these conditions? Customers often select valve types based on their previous experiences and recommendations from licensors. Valmet’s experience shows that metal seated ball valves are the right solution. It is important to note that metal seated ball valves are not a standard ball valve typically used in other general services, but rather are capable of handling the aforementioned challenges. Valmet’s Neles product brand specialises in rotary ball valves and metal seated technology, both in relation to materials and coatings.
To combat the first challenge related to molsieve dust, these metal seated valves have a scraping seat design feature. If particles get stuck to the ball surface, the scraping seat design will help remove those particles when the valve cycles. This ensures that the particles do not obstruct the valve operation by getting stuck between the ball and seat. Without a scraping seat design, the chances of valve failure are high. Additionally, keeping the sealing surfaces clean and preventing scratching (galling) not only helps to maintain tightness but also keeps operating torque constant and prevents valve jamming.
Another important feature is the closed seat design. This ensures that any particles in the process medium do not enter the cavities behind the seat area. In a standard ball valve seat design, there will be certain open cavities behind the seat area, which is typically not an issue with a clean fluid. However, in applications such as molsieves where there is the possibility of particles in the fluid, this can cause issues. A closed seat design helps to address this challenge.
April 2023 HYDROCARBON ENGINEERING 42
Figure 1. Neles intelligent metal seated ball valves with SwitchGuard.
Figure 2. Neles B1 series actuators, for cycling services.
Figure 3. Metal seat design for dryers.
Neles is now part of Valmet
Neles was merged into Valmet on April 1, 2022 and is now Valmet’s Flow Control business line. Valmet now offers an extensive flow control portfolio of industryleading valves, valve automation solutions and related services, including the renowned Neles, Neles Easyflow, Jamesbury, Stonel, Valvcon and Flowrox solutions.
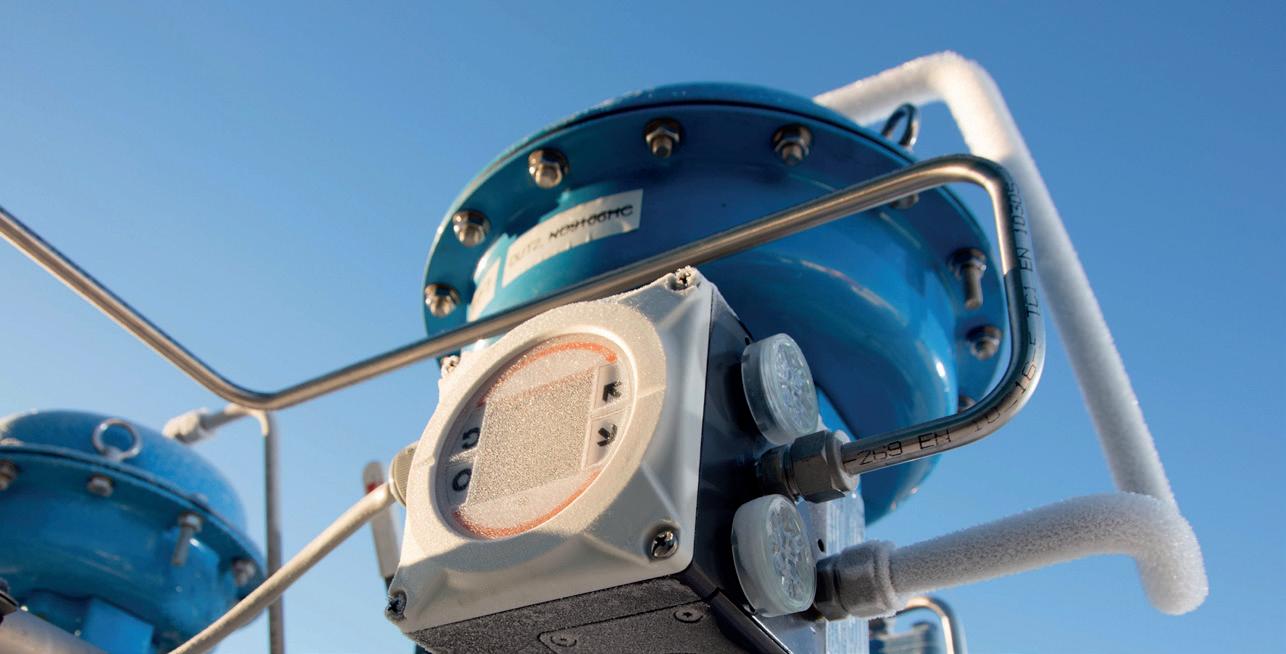
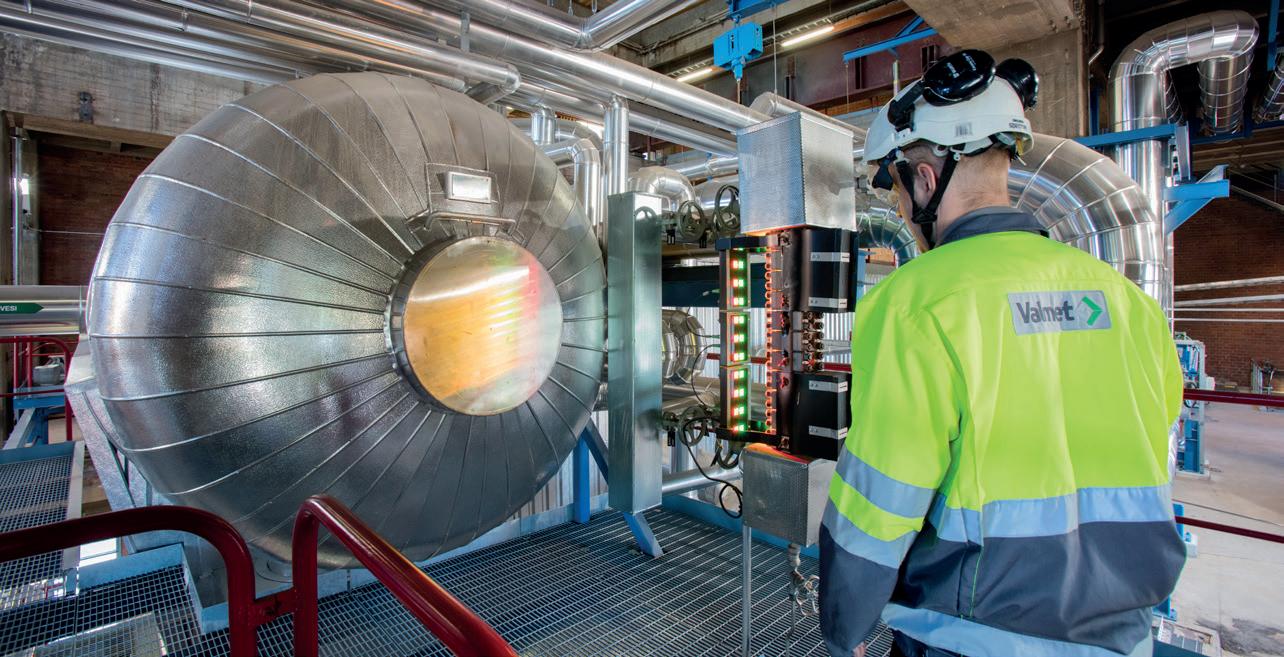
Valmet is now an even stronger, globally leading company with a unique and competitive offering of process technologies, services, automation systems and flow control solutions for process industries.
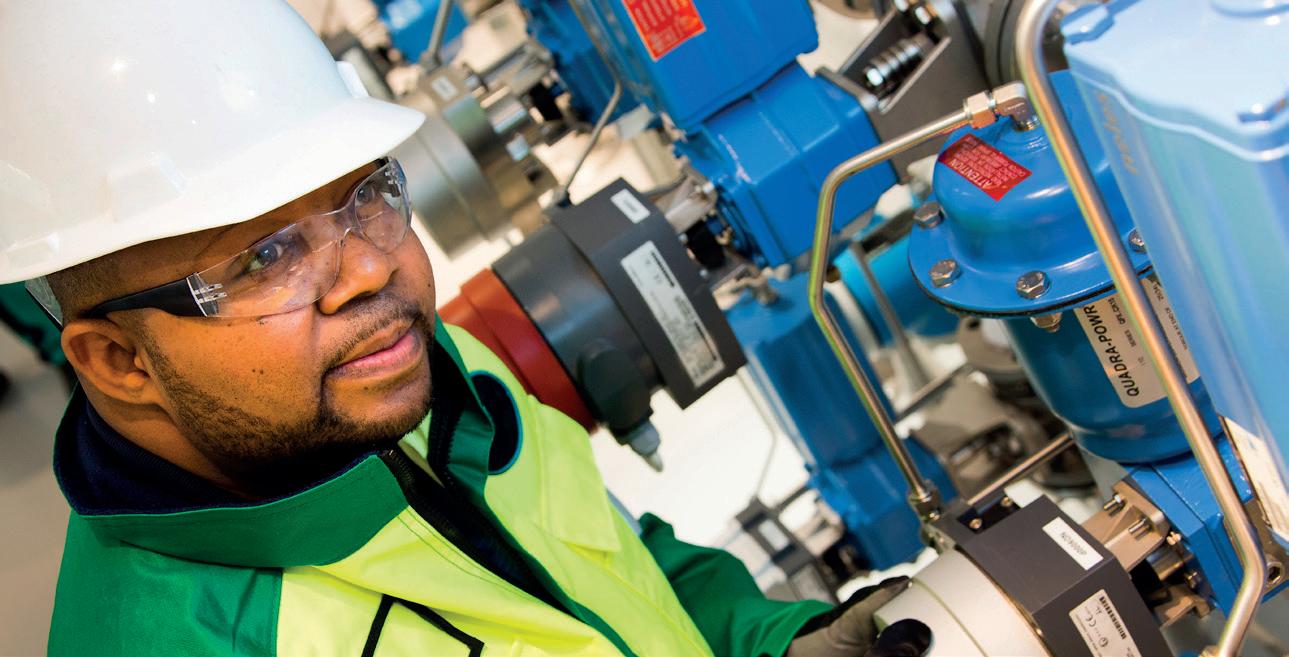

Our global team of around 17,000 professionals is committed to moving your performance forward — every day.
For more information, visit valmet.com/flowcontrol
Forward together –
Another important consideration is the materials that are used in the valve trim. Neles metal seated ball valves are available with application-based coatings on ball and seat. However, coatings are not applied to protect the base material from corrosion. When corrosion is an issue, the base material used in the valve trim should be capable of handling it. The coatings on the ball and seat surface are intended to reduce friction and minimise the particle impact on the sealing surface. It is important to select an appropriate coating material for a given process.
Ball valves with the appropriate coating also help in maintaining the required valve tightness in both directions, compared to other valve types that only offer unidirectional tightness.
Neles ball valves provide flexibility when it comes to mounting positions. Rotary valves offer several mounting position options compared to other valve designs which allow one orientation. This is crucial in areas where space is a constraint.
The use of butterfly valves has also been considered by some customers in need of larger valve sizes. Metal seated butterfly valves can also be suitable based on the specific process conditions.
Valve actuators are also an important part of the valve assembly. It is important to note that, since these are cycling valves, they also need to have reliable actuators that are capable of handling the cycling needs. Neles B1 series actuators are field-proven, reliable and safe actuators that are suitable for high cycling applications.
Reduced emissions and full life cycle support
Today, valve emissions are a hot topic. While the industry is working towards more sustainable solutions, emissions control is an essential step in meeting forward-thinking targets. The Neles rotary ball valve design complies with the ISO 15848 emission standard.

As these valves are in critical cycling services, it is also important to monitor them for reliable operation and predictive maintenance. Neles SwitchGuard is an intelligent controller that provides diagnostic information to help with planned maintenance and to improve overall operation, as well as provide programmable speed control for fine tuning valve performance.
Conclusion
It is clear that the valve selection process for this application requires careful evaluation, and there are a number of different valve designs that are available, from various suppliers. As such, the selection should be carried out based on various parameters rather than simply focusing on one particular valve design.
Valves for dryer sequencing applications need to be selected based on parameters such as valve vendor application know-how and supply experience; design features that help to tackle various challenges; reliability; use of digital devices that can help to avoid unplanned maintenance; and the overall total cost of ownership. This ensures that the process unit functions efficiently without any disruptions due to valves, and that the end user gets the best value from their investments.
analysis, comment and events Visit our website today www.energyglobal.com ENERGY GL BAL
Eric Sallee and Laura Ball, OsecoElfab, USA, explain how to minimise over-pressure risks and maximise performance with rupture discs in a refining or chemical processing facility.
Safety incidents, injury, or significant costs due to damage to equipment and downtime at a facility: regardless of the type of injury or damage caused, any uncontrolled release of pressurised fluid presents a significant risk. Process equipment in particular experiences some of the most aggressive pressure conditions seen in refining and chemical processing facilities. Operators take extreme care to mitigate over-pressure risks and protect both personnel and equipment. Examples of the strategies used to do this

include using primary and secondary pressure relief piping systems, and installing safety devices such as pressure safety valves (PSVs), pressure relief valves (PRVs), and rupture discs.
Tried and true: the humble rupture disc
Rupture discs can be found in numerous applications within a refinery or chemical plant. They are frequently used on reactors, dehydrators, separators, heat exchangers
April 2023 45 HYDROCARBON ENGINEERING
and distillation columns, as well as in storage applications and on many other types of process vessel and equipment.
Developed from humble origins in the upstream oil and gas industry, these devices quickly became the standard for protection. Their mode of operation is simple, and has remained largely unchanged since those early days in the oil patch. Essentially, they maintain a leak-tight seal until the pressure inside the vessel or piping builds and reaches a certain level above the
pressure outside the system. As soon as this pressure level is reached, the rupture disc automatically opens to rapidly discharge the fluids and safely relieve the excess pressure.
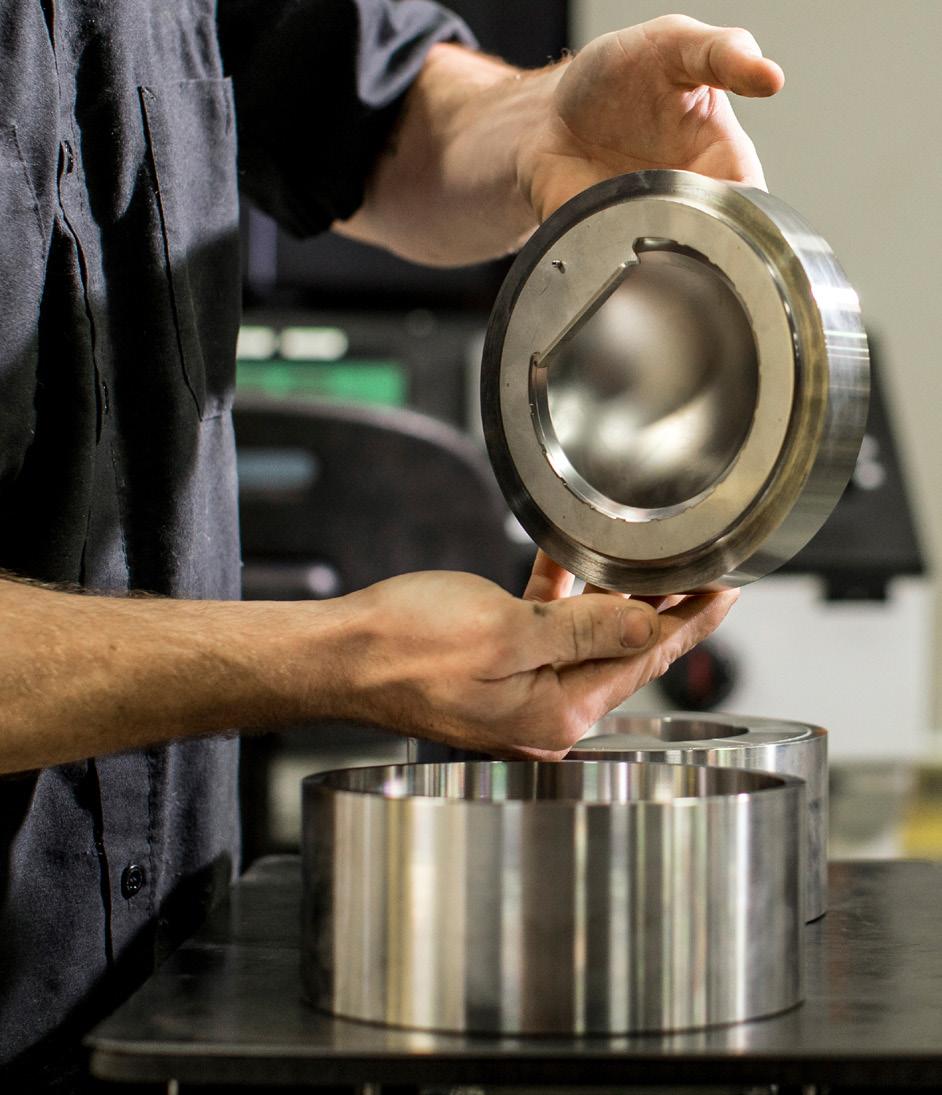
A rupture disc’s leak-tight nature makes it particularly effective when combined with a PSV/PRV. Pressure safety valves offer an excellent means of safely venting excess pressure to the atmosphere. They offer adjustable opening pressures and are re-closing, allowing plant operations to continue without a shutdown following an over-pressure event. However, the valve’s moving parts and seals can degrade over time and may begin to leak. They can be damaged by corrosive media or may seize up and fail to activate when needed.
An efficient way of protecting valves is to install a rupture disc upstream of them. The rupture disc’s leak-tight seal prevents the process media from reaching the valve, protecting it from corrosion or damage. The disc stops viscous media from clogging the valve and impeding accurate operation. It also removes any chance of valve chatter or slow leakage, and so helps to minimise fugitive emissions from the plant. Overall, installing a disc and valve in combination offers the best of both worlds: a leak-tight seal combined with re-closing pressure relief. This provides a reliable pressure safety system that minimises loss of product and downtime following an over-pressure event.
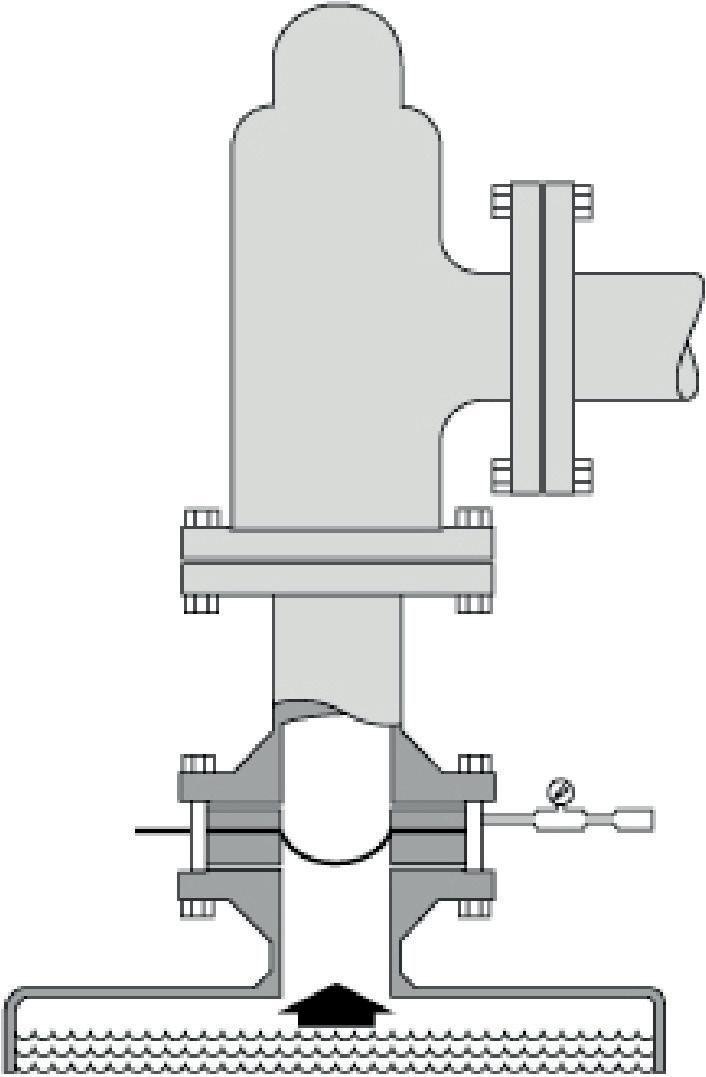
Selecting the right disc for the job
Choosing the correct rupture disc for valve protection can further extend the useful life of the plant assets. It is essential to choose a rupture disc with a non-fragmenting design, as small fragments of metal in the valve can be as damaging as the media itself. High-cycling discs protect valves from pressure fluctuations, and will last through multiple batches or shutdown cycles.
When selecting a rupture disc for an application there are many process and device parameters to consider. As they all affect how a rupture disc will perform during a relief event, it is important to define them accurately. The key parameters to consider include:
n Maximum Allowable Working Pressure (MAWP) of the vessel.
n Fluid state.
n Operating pressure.
n Operating temperature.
n Frequency and magnitude of any pressure fluctuations.
n Required relief capacity.
n Process media corrosiveness.
n Any vacuum and back pressure conditions.
n Any upstream, downstream and parallel equipment, including any valves or other rupture discs.
Bright and new: innovations in rupture disc technology
As with most types of process equipment and safety devices, there have been significant innovations in rupture disc technology. Welded solutions, discs with ever lower KR values, and innovations in burst detection are being offered by all suppliers. Knowing what types of rupture
April 2023 HYDROCARBON ENGINEERING 46
Figure 1. Rupture disc being manufactured.
Figure 2. Rupture disc installed in series with a valve.
disc technology are now available is key to maximising a facility’s performance.

More than ever before, emissions reduction has become a highly scrutinised topic at refining and chemical processing facilities. Plants are under increasing pressure to reduce emissions as regulations become more numerous and stringent. In the US, air quality regulations such as 40 CFR are now being enforced by the Environmental Protection Agency (EPA), and the scope has increased to include an expanded set of sources and facilities. A key consideration for selecting the right rupture disc technology is the elimination of the potential for leakage, and the reduction of fugitive emissions.
For the most part, the traditional rupture disc design alone is very effective at minimising leaks. However, when there are leakage issues, the consequences can be enormous – not only from a safety standpoint but from an environmental one as well. One innovation in rupture disc technology, which has been shown to be highly effective in combating fugitive emissions, is the welded assembly or ‘cartridge type’ of rupture disc. This style of disc combines the three parts of a traditional disc design – comprising an inlet and an outlet with the disc clamped between them – into a single, hermetically-sealed component. The welded unit is completely leak-tight as all potential leak paths between the disc and inlet/outlet are eliminated.
In one example, a manufacturer of synthetic rubber needed to reduce its emissions of butadiene to meet the
stringent levels imposed by new, local regulations. After receiving advice on the different types of rupture disc available, the manufacturer chose to use a welded rupture disc cartridge. Once installed, it began monitoring emissions. The manufacturer noted that previous bursting disc leakage was eliminated. As a result, plant-wide fugitive emissions of butadiene were reduced by almost 50% in two years, bringing them to below the minimum levels specified in the regulations.
While operators will typically see a higher purchase price associated with this type of disc, they will also see several benefits – from an increase in disc performance and associated process productivity, through to reduced downtime and the ability to operate at higher pressures. In addition to this, the welded cartridges are not torque-sensitive and are much quicker and easier to install, especially when the inlet and outlet pipes are not perfectly aligned. They have the potential to halve the downtime required to replace rupture discs, making them a popular choice for plant managers operating on tight schedules.

Increase plant efficiency with a lower KR value

Another factor to consider when specifying rupture discs is the flow rate of the rupture disc on burst, and the impact this has on relief capacity. Essentially, a rupture disc with a lower flow resistance has a lower pressure drop, which allows more of the process media through within a
Advanced rupture disc and explosion protection solutions
LoKr Rupture Disc
The Next Generation of Design and Engineering in Pressure Relief Technology
– Best-in-class KR value
– Superior reliability
– Improved process performance
– Flexibility when choosing piping sizes
Oseco Safety Cartridge Single-piece Solution for Chemical Processes – Leak-free
Easy to install
Reduce emissions
Contain hazardous chemicals
–
–
–
osecoelfab.com For more information: email: sales@osecoelfab.com call: 0044 191 293 1234 | 001 (918) 258-5626 20667 OE Hydrocarbon Eng. Magazine Ad (210x146mm).qxp_Layout 1 15/03/2023 10:00 Page 1
set time period. A rupture disc’s flow rate is described with the loss coefficient designation ‘KR’. A lower KR value indicates a lower resistance to flow and therefore a higher flow rate for the same nominal bore size.
A rupture disc with a lower KR value offers three key advantages to refinery and chemical plant operators. First, the lower KR signifies faster pressure relief and therefore greater safety. Second, when the disc is installed below a PRV, a lower KR value will help keep pressure drops across the relief line to below 3%, which will also help to prevent valve chatter. Third, a low KR value offers greater flexibility in the piping sizes that can be used. If, for example, new piping is being designed or an existing system is being upgraded, installing a disc with a lower KR value may enable operators to reduce the line sizes while maintaining the same flow rate as before. This offers more design options, as well as opportunities for reducing material costs.
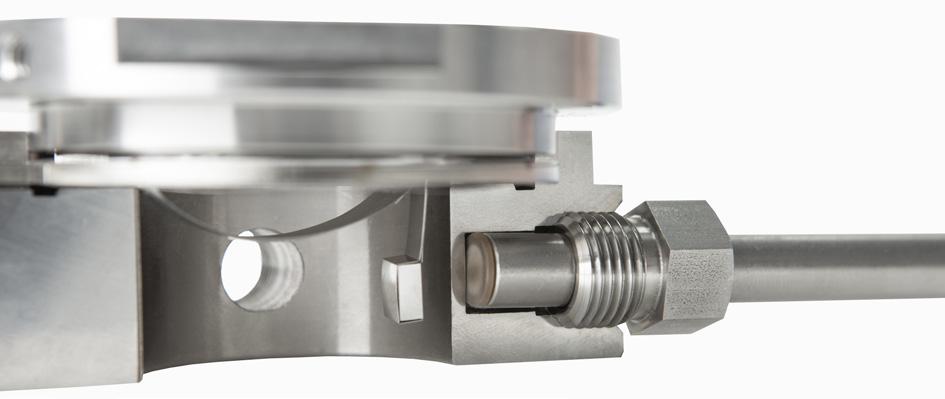
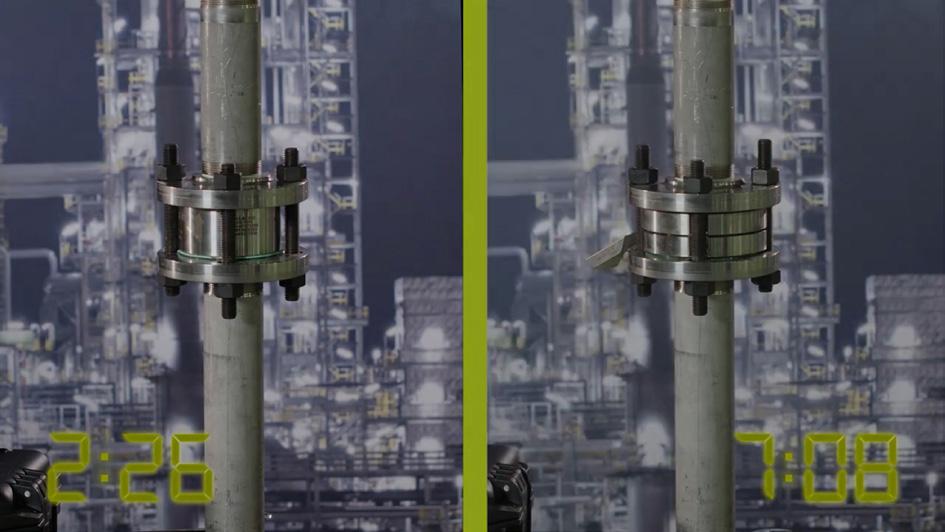
Instant notification of burst with rupture disc burst detection
Another capability available to maximise the use of rupture discs is detecting where and when an over-pressure event has occurred. A burst indicator detects when an over-pressure or vacuum condition causes a disc to rupture. There are two types of burst detector: the traditional membrane-style detector, and the newer non-invasive magnetic detector.
Membrane detectors are installed on the vent side of the rupture disc assembly. Should the disc rupture, the flowing media opens the circuit, sending an electronic signal to the control centre. The detector can be connected to a variety of alarms or computer-controlled systems for fast recognition of failures. This is a critical safety feature for hazardous and environmentally-sensitive processes.
The non-invasive, magnetic detectors are screwed into a tap in the disc holder and never come into contact with process media. A magnet on the disc completes the circuit. When the disc ruptures, the magnet arcs away from the detector, breaking the circuit and sending a signal to the control room. This immediately lets operators know where a pressure event has occurred, enabling swift action to be taken to replace the disc and minimise product loss and process downtime. Unlike membrane sensors, the magnetic sensor does not need to be replaced, and remains in-situ. This eliminates the need for re-wiring and reduces costs, as the sensor can be used multiple times.

Maximising your pressure safety investment
Rupture disc technology has evolved significantly since the early days on the oilfields. An example of this is the current use of non-invasive burst detection for immediate notification of a burst to minimise downtime. Taking advantage of the newer technology and selecting the right rupture disc for applications offers additional opportunities for improving process efficiency and meeting environmental regulations.
Equally, proper installation and maintenance of rupture discs, especially when in combination with a pressure relief valve, will ensure reliable performance in the long-term to minimise downtime and product loss following an over-pressure event. It is always worth seeking advice from a rupture disc supplier on which discs will best meet process needs. In addition, working with a partner that can survey the facility to inspect and inventory the number and type of rupture discs in use across a site offers tremendous value as well. For example, these surveys often result in recommendations for cost-savings through consolidating stock and overhauling or upgrading rupture disc solutions.
Protecting people and equipment from the risks of an over-pressure incident is key to the safe operation of a refining or chemical processing facility. Rupture discs play a vital role in this, and getting the most out of a pressure safety investment will help ensure that the risks associated with over-pressure events are minimised while maximising the disc’s overall performance and reliability.
April 2023 HYDROCARBON ENGINEERING 48
Figure 3. Welded rupture disc cartridge.
Figure 4. Low KR reverse buckling rupture disc.
Figure 5. Non-invasive burst detection sensor and rupture disc installed in a holder.
One of the basic procedures behind petroleum processing is distillation, which is performed as atmospheric distillation and often as vacuum distillation, in a second step. During the atmospheric distillation process, crude oil is split into its various components (fractions). Its residue is then usually further distilled in a vacuum at approximately 30 – 50 mbar (see Figure 1).
In addition to the steam jet pumps, several other powerful machines are available for vacuum generation –mostly mechanically-operated compressors. Vacuum systems with steam jet pumps are often preferred within petroleum processing from a technological point of view, as

they cover a wider range of process conditions, allow for continuous production times (one to three years), and offer the possibility of covering larger mass flows throughout their long life cycle (15 – 20 years). Moreover, they are low-maintenance and therefore more economically attractive.
Another important aspect from a production manager’s point of view is energy consumption. A well-designed and process-adapted steam jet pump vacuum system ensures a reliable and sustainable operating result in the long-term, whereas an oversized or incorrectly-designed system results in higher energy costs due to the overuse of motive steam.
April 2023 49 HYDROCARBON ENGINEERING
Peter Trefzer, Dr. Laurent Solliec and Norbert Strieder, GEA Wiegand, explore how to reduce a refinery’s operating costs by way of optimising vacuum systems.
This article will present some key technical and financial information to evaluate the financial and sustainability benefits of optimised steam ejector vacuum systems.
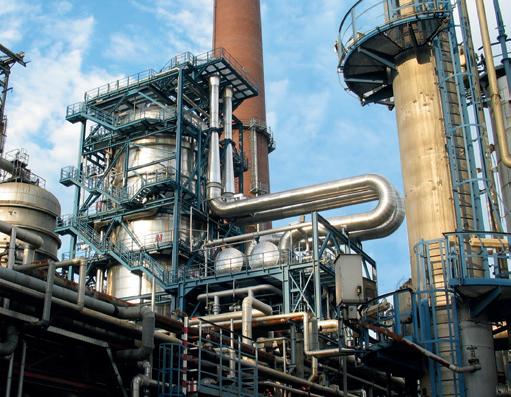
Technical basics
Steam jet pumps are thermal systems. They use the high kinetic steam energy of a Laval nozzle from a motive fluid stream to mix it with a second fluid stream. The mixture is discharged into a region at a higher pressure than that of the second fluid stream (see Figure 2).
A high-pressure steam with low velocity is then accelerated to a low-pressure steam (vacuum) with a high velocity jet (supersonic) through a converging/diverging nozzle (Laval nozzle). The low static pressure at the nozzle outlet induces a secondary flow from the suction part.
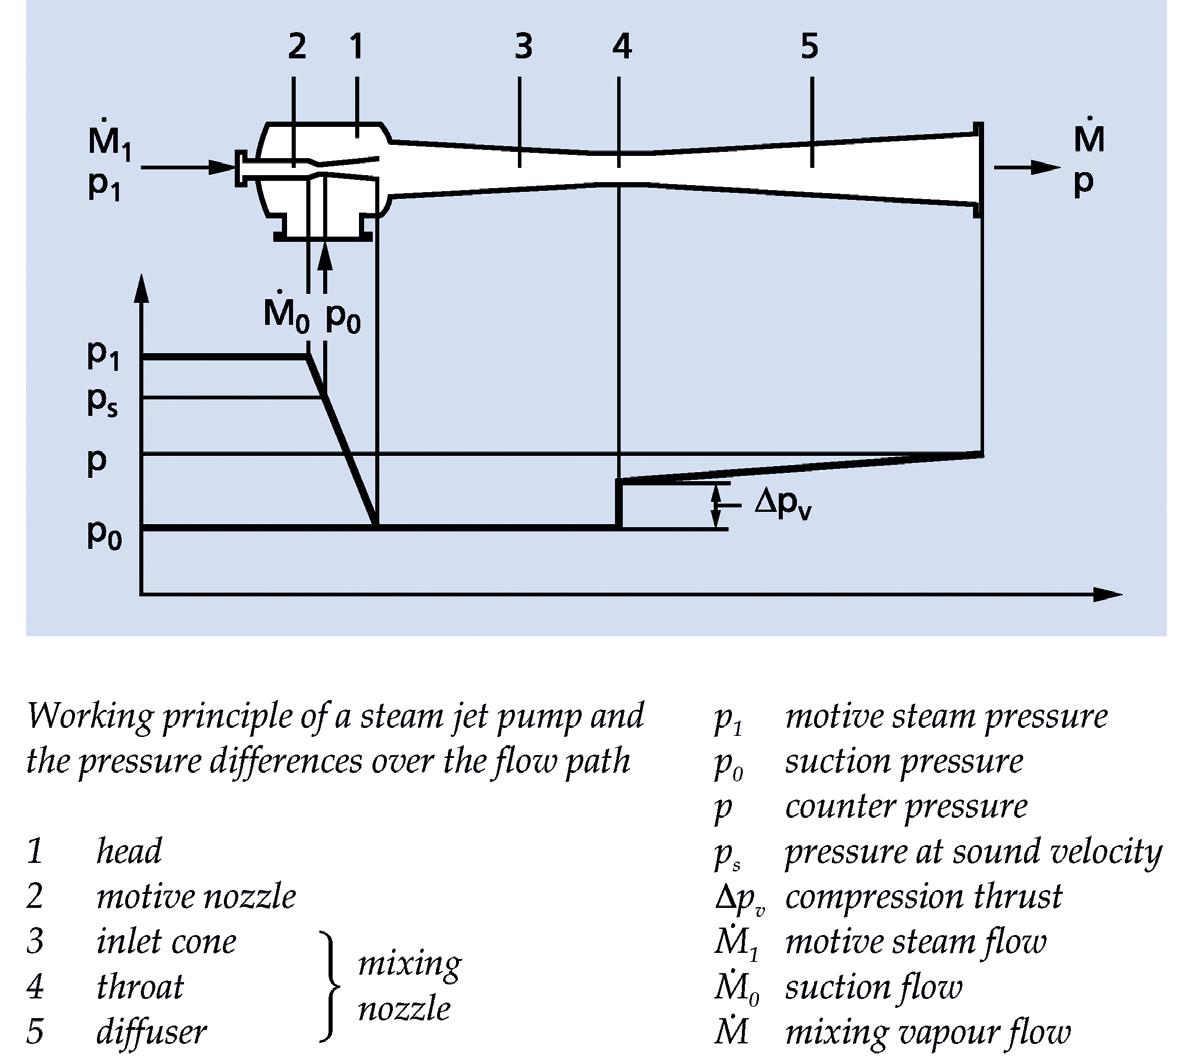
The mixture from the primary and secondary streams undergoes a rise at the inlet cone of the mixing nozzle as a result of one or more shock waves, decelerating the flow to subsonic speed and inducing a pressure drop (typically at the throat or diffuser). The flow is further reduced in the
outlet diffuser, and an additional pressure increase is generated.
At the outlet of the jet pump, the steam/gas mixture enters a condenser, where the vapours largely condense. Most vacuum system have a multiple-stage system. These stages are either a pure steam jet pump system, as seen in Figure 2 (in combination with condensers), or a hybrid system combined with mechanical compressors.
Steam jet pumps have been successfully used in the industry for many decades. Although they have a lower overall coefficient of performance than mechanical pumps, they are used in processing engineering because of their robustness, minimal maintenance, and long life cycle (no moving parts). Moreover, if waste or low-grade steam is available, the steam jet becomes very interesting from an energy point of view.1
Many improvements of the GEA Wiegand jet pumps have been developed over decades, within the company’s own research centre, achieving higher performance coefficients. Indeed, the use of more than 12 000 tested jet pumps, combined with diverse modelling ejectors (fixed mixing nozzle throat and various combinations), as seen in Figure 3, offers the possibility to analyse the jet pump’s behaviour and to optimise its performance coefficient. A comparison of the internal test reports from 1960/1970 vs the latest shows that steam consumption could be reduced by 35%.
From a holistic point of view, ejector testing is an essential aspect of the decision process, leading towards the commissioning and application of the vacuum system.2 Onsite testing is quite a complex process, and only certain conditions can be tested.3 Factory tests (see Figure 4) have the advantage of being carried out under controlled conditions where variations in secondary or suction flows, as well as motive or primary pressure, can be simulated. A factory test can be performed under standard processing specifications.2, 4 It is obvious that the testing in petroleum processing is an essential step to ensure the correct operation of the vacuum system, and to minimise production losses.3
Processing and energy saving
Due to the limited natural resources and the current scarcity of energy, a continuous increase in oil price is to be expected. As such, technological alternatives to reduce energy consumption while improving process effectiveness are already in demand.
The annual operative energy costs for vacuum generation in a distillation plant with steam jet pumps are about two to four times higher than the investment costs for the entire vacuum plant. As such, an efficient vacuum system – regardless of the investment costs – already ensures process optimisation and lower consumption costs. The return on investment (ROI) point is
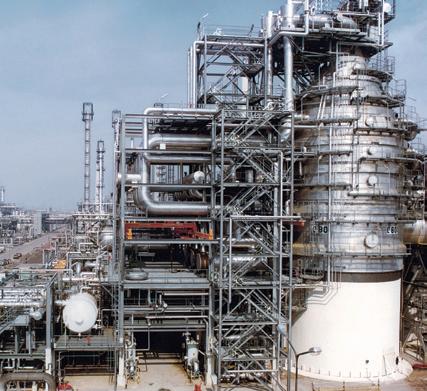
April 2023 HYDROCARBON ENGINEERING 50
Figure 1. The basic process for petroleum processing is distillation. For vacuum generation, vacuum systems with steam jet pumps are more technologically appropriate.
Figure 2. Steam jet pump principle.


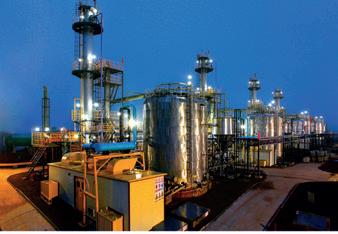
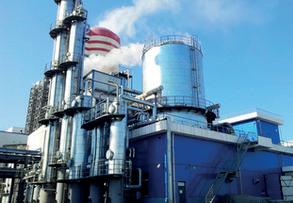
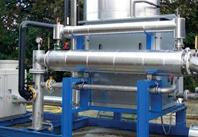


How to reach lowest Opex and highest value when treating natural gas streams for sulphur? THIOPAQ O&G puts you in control of sulphur removal and sulphur recovery. Perform well on safety, sustainability, reliability, cost and operability. Oil & Gas companies worldwide rely on THIOPAQ O&G. See why on paqell.com/thiopaq. Paqell’s THIOPAQ O&G - exceptional achievements in H2S removal. paqell.com The proven gas desulphurisation technology. Thiopaq O&G and Thiopaq O&G Ultra stable by nature
quickly reached in this case, and even quicker if the carbon dioxide (CO2) footprint is considered. In general, high consumption at the first stage can be due to a non-adapted or wrong design. In the first case, the process suction pressure at designed mass flow is significantly lower than the designed one. To maintain the operating pressure, additional mass flow is recirculated from the mixture via a control valve. Typically, such a configuration is controlled by splitting the first stage into several (two or three) jet pumps with different proportions (50%/50%; 33%/67%, etc), as seen in Figure 5. Sometimes, these splits are not adapted to the processing conditions, leading to high consumption. The use of more jet pumps with adapted proportions results in lower consumption costs. In the second case, the specified design point is different from the operating range (lower designed pressure than the processing value), which generates higher consumption costs.
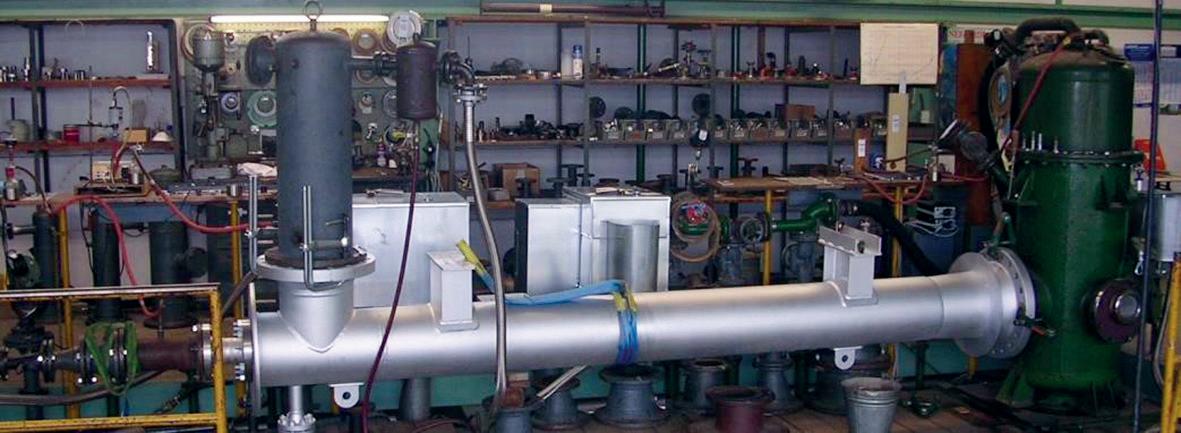
Another processing aspect relates to the first condenser, which is often designed for a suction capacity of 120%. At lower mass flows, the pressure is significantly lower than that expected at the first condenser. As a result, the overlap between the discharge pressure of the first-stage ejector and the second-stage (jet or mechanical pump) is higher than necessary. For this reason, the motive pressure can be adjusted to a lower pressure without affecting performance, resulting in lower steam consumption and a more sustainable solution. This corresponds to a real-time management example. By modelling the jet pump (see Figure 3), it is possible to simulate real conditions during processing.
Cost calculation and optimisation
The importance of an efficient system is best illustrated by the following example: in a three-stage system, each stage consists of one or more jet pumps connected in parallel, as well as a surface condenser to reduce the suction rate of the downstream stage (see Figures 5 and 6). The operating and investment costs of this process are calculated using the following hypothetical case: an oil refinery with a capacity of 16 million tpy crude oil (approximately 275 000 US bpd). A three-stage vacuum system is installed there.
An estimate of the operating costs can be assumed from motive steam costs (US$25 – optimistic in light of current energy costs), and the operating time of the plant (approximately 8500 hr/yr). This results in annual operating costs of US$6.8 million. The total investment costs for the vacuum system amount to US$5 million.
How does optimising the vacuum system affect the profitability of the entire plant? To determine the operating costs, a five-year uninterrupted operation is assumed and, for simplicity’s sake, a passive rate of 0% is assumed. The example shows that the operating costs in five years amount to US$34 million, while the investment costs are only US$5 million.
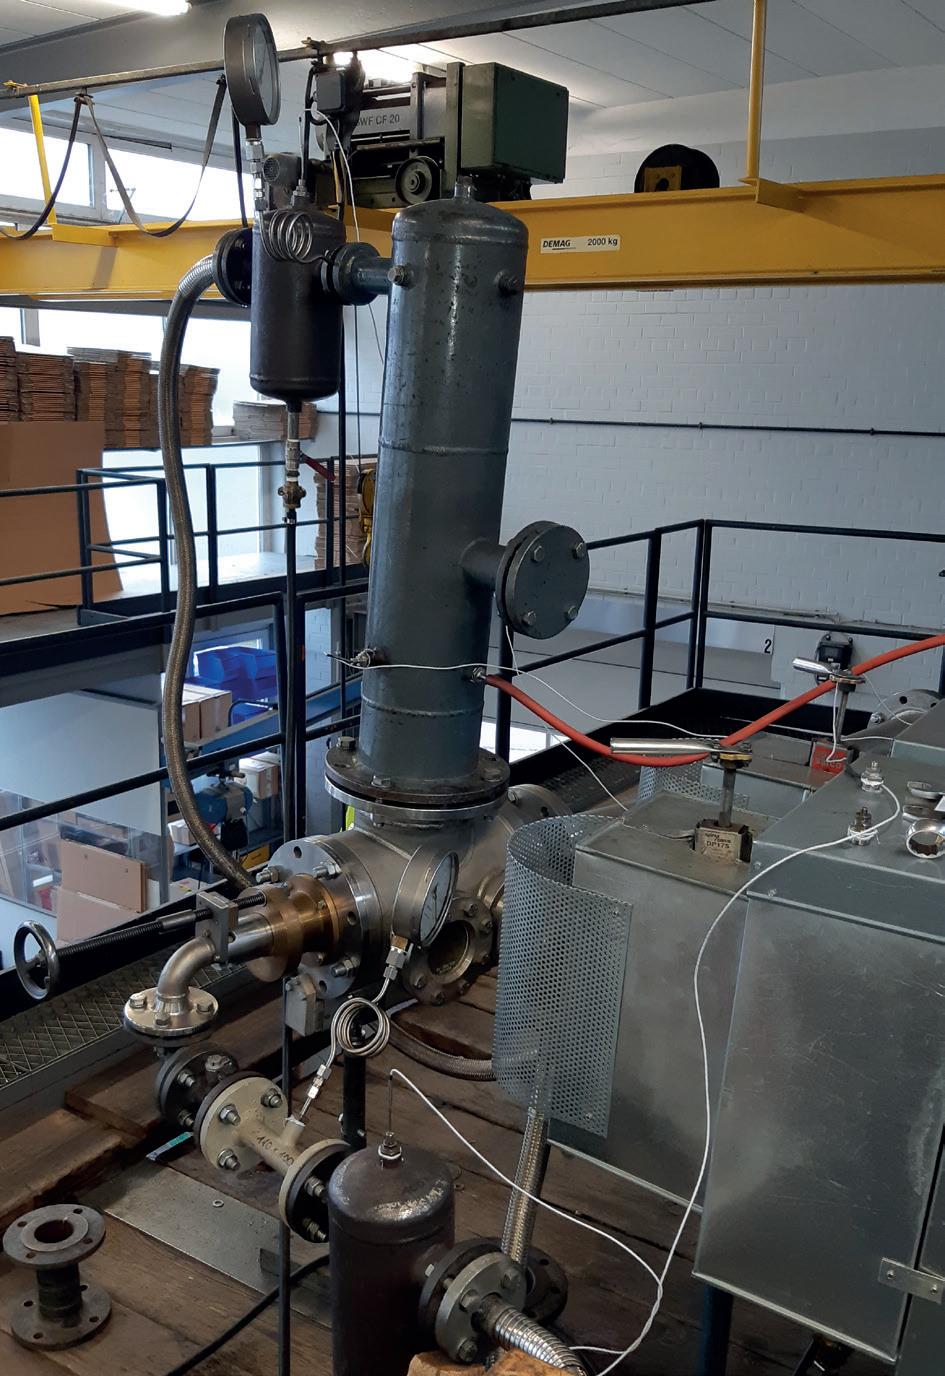
This means that the investment costs constitute approximately 15% of the operating costs. Assuming a 20-year depreciation of the machinery, the share of investment costs within the total cost of ownership is only 3.7%. This illustrates the high influence of operating costs on the profitability of a vacuum system. In comparison, even a 5% reduction in steam consumption results in savings of almost 34% (US$1.7 million) of the investment costs for the vacuum system over a period of five years.
In practice, a higher reduction in steam consumption can be expected through better process analysis and hardware adjustment. This would have an additional impact on both profitability and the CO2 footprint (savings in CO2 due to the more energy-efficient vacuum system). One of the most important approaches to climate protection according to the Kyoto Protocol is to reduce greenhouse gases (GHG) emissions, which are generated when the industry both produces and consumes energy. Increasing energy efficiency means ‘less input for a constant output’, and so this not only results in lower costs for a refinery when fractionating crude oil, but also a direct reduction of GHG emissions. This is a ‘win-win’ model.
April 2023 HYDROCARBON ENGINEERING 52
Figure 3. Modelling a jet pump at the GEA test bench.
Figure 4. GEA Wiegand test bench centre: a jet pump under factory test.

TIGRON ACTUATORS ROBUST
www.auma.com Customised valve automation
by AUMA AUMA World Discover your valve automation solutions
SAFE CERTIFIED
Made
Conclusion


A vacuum system with steam jet pumps implies relatively modest investment costs compared to the subsequent operating costs. The customer is advised to not make the decision regarding a supplier solely based on the investment costs, but to also consider the operating costs. Finally, one decisive criterion should be the supplier’s capability to test the jet pumps on a test bench in order to adapt them to the specific process since, as discussed, it is difficult to make changes to a jet pump without verifying the functionality of the parameters on a test bench.
Despite its simple design, the jet pump cannot simply be installed in a system without thoroughly testing its operation and performance beforehand. The experience of recent years shows that operators pay very close attention to steam consumption and demand warrantees – both for the proper functioning of the vacuum system, and for low operating costs. Only an optimally designed and tested steam jet vacuum system guarantees economical and maintenance-free operation for many years.
References
1. DANDACHI, J., ‘Steam air ejector performance and its dimensional parameters’, Ph.D thesis, Loughborough University of Technology, (1990), p. 268.
2. ‘Standards for steam jet vacuum systems’, HEI, 7th Edition, (2012), p. 130.
3. HARTMAN, et al., ‘Importance of testing for vacuum ejectors in refinery service’, PTQ, (2022), pp. 41 - 46.
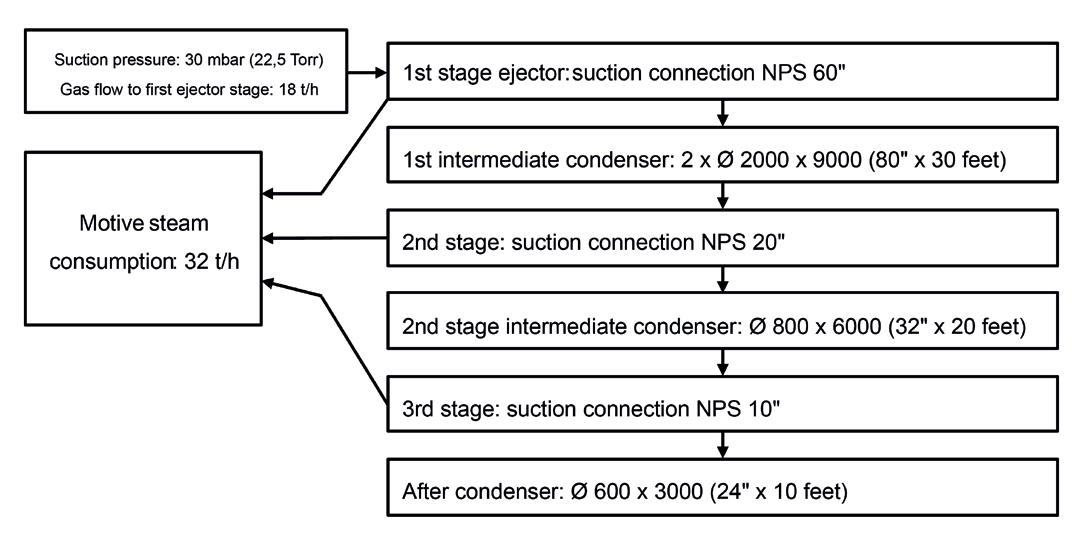
4. ‘Rules for the measurement of steam jet vacuum pumps and steam jet compressors’, DIN 28430, (2017), p. 17.
FOREFRONT INNOVATION SERIES

A new, virtual, technical series from AMPP!


Forefront Innovation Series is a new and innovative web-based series from AMPP. Filled with the latest insights and technical developments, Forefront brings together subject matter experts from a wide variety of industries and professional backgrounds to discuss hot-button materials protection and performance related technical topics. Utilizing best practices, case studies, and lessons learned, these engaging sessions will shed light on challenges faced by different industries. Top 5 reasons to attend:
• Gain insights to the New & Emerging Technologies
• Participate in Open Discussions about Future Innovations and Theories
• Engage with Subject Matter Experts to get your questions answered
• Network with peers & discuss hot-button materials protection and performance related technical topics


• Earn up to 6 Professional Development Hours per series

View our Calendar for Upcoming Events!
Visit www.ampp.org/events/forefront-innovation-series
April 2023 HYDROCARBON ENGINEERING 54
Figure 5. Flowsheet of a third-stage vacuum system with splitting capacity.
Figure 6. Example of a three-stage vacuum system in an oil refinery.
Johannes Poth, Integrated Global Services, introduces a technology for reducing fuel consumption and carbon dioxide (CO2) emissions in fired heaters.

Aglobal inventory of carbon dioxide (CO2) emissions recently published by One Earth suggests that global cumulative emissions could be reduced by up to 10% between 2020 – 2030 if refineries adopted low-carbon
measures.1 The list of measures includes refineries improving their efficiency and upgrading heavy oil processing technologies.
With various global carbon tax schemes either underway or being deliberated, refineries are under
April 2023 55 HYDROCARBON ENGINEERING
increasing pressure to reduce CO2 emissions and fuel consumption. But where should they start? A critical focus area should be on fuel combustion, as this accounts for almost 80% of refinery carbon emissions.
Fired heaters are the largest consumers of fuel in a refinery, emitting an estimated 400 – 500 million tpy of CO2, so even minor improvements in the efficiency of fired heaters can lead to significant savings. To put this into perspective, if any fired heater is 1 or 2% inefficient, it can consume an additional US$1 million in fuel over a year.
Figure 1 outlines a broader spectrum of CO2 emissions reduction strategies for fired heaters, and this article will focus on process optimisation solutions and, more specifically, ways to improve energy efficiency in the radiant and convection sections of fired heaters.
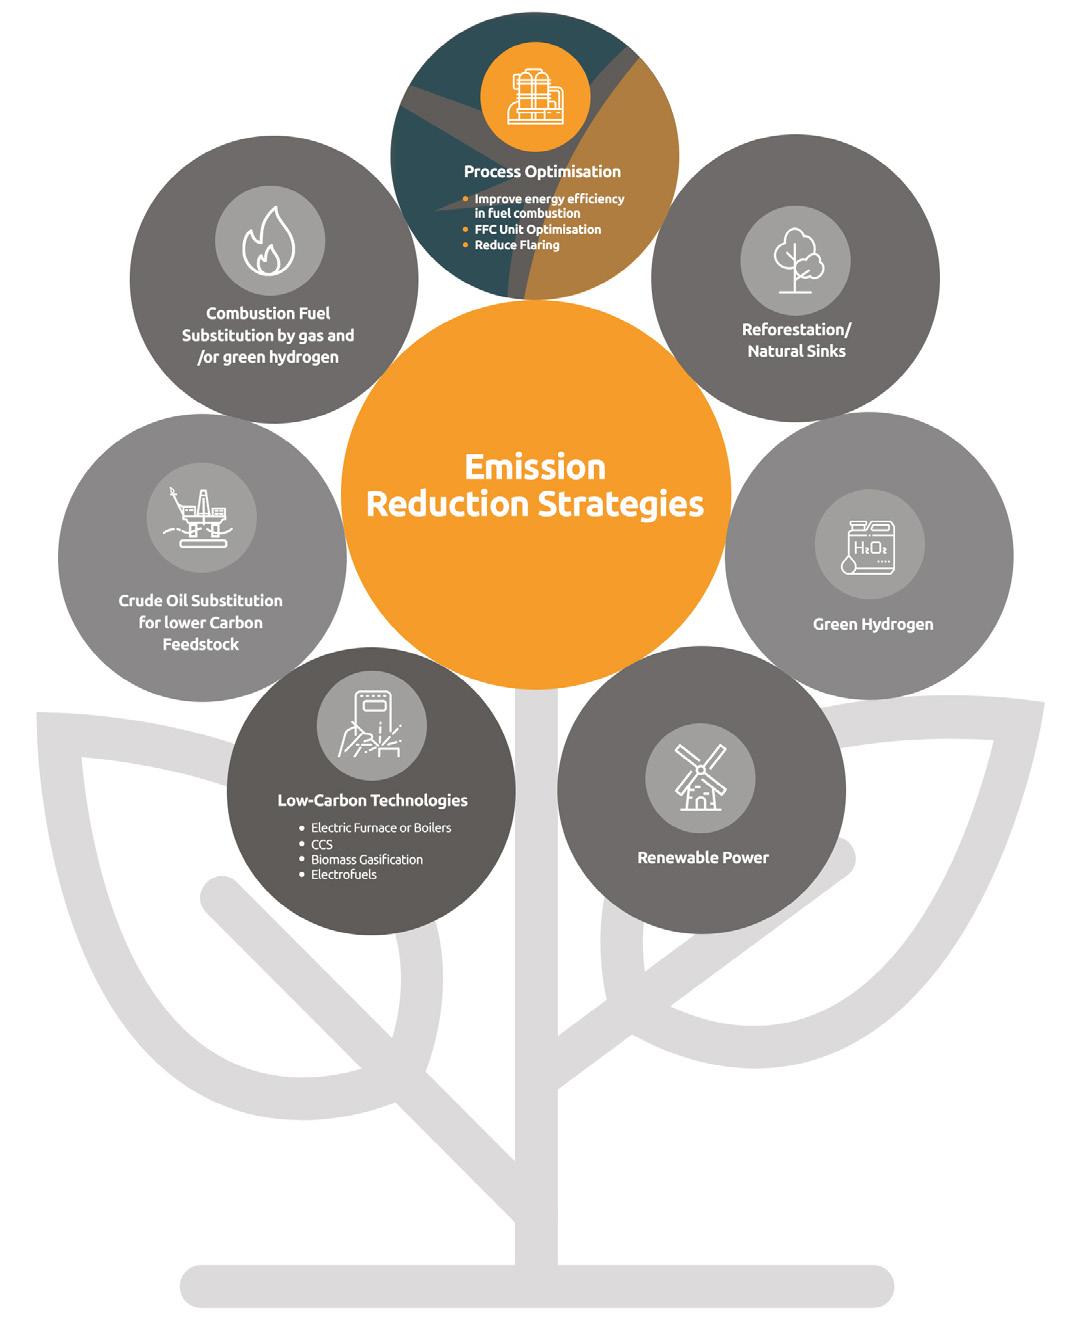
Improving radiant section efficiency
Process fluids are heated in the radiant sections of fired heaters. The fluids travel through steel alloy tubes, which
are heated principally by radiant heat generated by burners contained within the refractory lined box. The configuration and condition of the process tubes and the refractory surfaces affect the efficiency of heat transfer in the radiant section. A common problem affecting radiant section efficiency is the oxidation of radiant tubes.
How does process tube oxidation occur?
Severe scaling due to oxidation on steel alloy tubes is expected in fired heaters as a result of high operating temperatures. Above approximately 500°C, the 9Cr-1Mo materials tend to oxidise and may scale very rapidly as temperatures increase. The corrosion rate based on material and temperature can be as high as 0.25 mm/yr. Layers of oxidation scale grow continuously on the tube surfaces and create a significant insulating effect, reducing conductive heat transfer efficiency to the process.
What are the effects of process tube oxidation?
To overcome the insulating effect, extra heat is needed and firing rate is increased. This results in increased flue gas temperature (bridge wall temperature [BWT]). Consequently, CO2 and nitrogen oxide (NOx) emissions are increased. As the scale grows, further increases in firing rate are required, BWT limitations are encountered, and production rates are threatened.
Carburisation
An industry trend to operate fired heaters more efficiently, at lower excess oxygen levels, in order to save fuel and reduce CO2 emissions, has increased the potential for carburisation of external surfaces of radiant section tubes. This leads to grain boundary penetration of carbon, carbide formation, embrittlement of the surface, crack formation, and loss of metal. The result is reduced service life of the radiant tubes.
How can carburisation and oxidation be mitigated?
Online tube descaling
Online tube descaling is offered by Integrated Global Services (IGS)’ Hot-tek service. This will immediately improve the radiant section heat transfer efficiency and reduce the BWT. Whilst this is a good short-term fix, the improvement is only temporary, as oxidation and scale formation will continue.
Ceramic coatings for process tubes
Cetek ceramic coatings provide a durable, protective, thin-film layer on the outer surfaces of process tubes, which prevents oxidation, corrosion and carburisation of the metal and maintains the tube thermal conductivity coefficient close to new tube conditions. The coatings may be applied to existing tubes during a shutdown, or to new tubes at a remote facility where surface preparation, coating and curing
takes place.
April 2023 HYDROCARBON ENGINEERING 56
of the coating
Heater type Fuel saving CO2 reduction NOx reduction CDU, VDU, DCU, etc. 2 – 5% 2 – 5% 5 – 15% CRU 5 – 15% 5 – 15% 10 – 20% SMR 2 – 5% 2 – 5% 12 – 25% Ethylene 2 – 5% 2 – 5% 15 – 30%
Table 1. Average fuel savings and emissions reduction results achieved using Cetek ceramic coatings, by type of heater
Figure 1. A range of CO2 emissions reduction strategies are available to refineries.
What are the expected results?
The average benefit in catalytic reformer heaters is to increase radiant section efficiency by 6.6%, with a corresponding reduction of 6.6% in CO2 emissions and approximately 20% reduction in NOx emissions.
Refractory surface emissivity: why does it matter?
A significant portion of the radiant energy interacts with the refractory surfaces. The mechanism of this interaction has a considerable effect on the overall efficiency of radiant heat transfer. A major factor in determining radiant efficiency is the emissivity of the refractory surface.
The ultimate radiant heat transfer efficiency is achieved when the enclosure is a black body, where all the surfaces have the maximum emissivity factor of 1.0.
Refractory ceramic coating solutions
Cetek ceramic coatings with emissivity values of above 0.9 have been designed specifically to supplement the radiation characteristics of the refractory surfaces. In use, the following benefits have been realised: up to 5% in radiant section efficiency improvement, with a corresponding CO2 emission reduction of up to 5%, and NOx emission reduction of up to 30% in ethylene, catalytic reforming units (CRUs) and steam methane reformer (SMR) units. Table 1 illustrates the average expected fuel savings and CO2 and NOx reduction of various types of heaters.
Convection section efficiency
A common cause for a drop-in fired heater performance is fouling build-up on convection section tubes/fins. Symptoms of convection section fouling include high convection pressure drop due to accumulation of fouling, an increase in flue gas stack temperature, and a decrease in process crossover temperature.

How does fouling occur?
Fouling occurs when deposits accumulate on the tube or fin surfaces. The burner alone is designed to operate with 1 ppm airborne particulate. This means that a single burner can pass 2.5 tpy of debris through a heater – some of which will deposit.

Airborne debris is drawn in from the surrounding environment. In a desert location, dust will make up a large proportion of the waste. If surrounded by agriculture, waste from harvesting will accumulate, and in an industrial location, waste products from surrounding plants will also make up the debris being pulled into the fired heater.
What are the effects of fouling?
Excessive convection section fouling can result in:
n High fuel consumption and decreased heater efficiency.
n Running the burners out of oxygen.
n Unburned gas accumulating in the fire box.
n An increase in flue gas temperature, which can warp tubes and lead to failures.
Established technologies for process-limited fired heater furnaces. Achieve Fast ROI. HEAT TRANSFER EFFICIENCY SOLUTIONS info@integratedglobal.com | 888 506 2669 Contact us for a free technical evaluation! Increase Production, Octane & Efficiency Save Fuel & Reduce Emissions IGS fired heater experts will perform a comprehensive technical evaluation that will determine your efficiency improvement (%) and the payback period as well as projected (%) improvement based on your objectives (fuel/emissions reduction, capacity increase or a combination of both). Learn More Radiant Section Efficiency Convection Section Efficiency
n A reduction in heater throughput.
n Stack temperature limit being exceeded.
All of these effects negatively impact plant performance, but perhaps the most significant effect of fouling is an increase in CO2 emissions. If fouling is left to worsen and emissions become excessive, refineries may be liable to pay government fines.
Carbon tax and the effects on refineries
Currently, Asia Pacific is the largest contributor to refinery emissions globally. The region has 35% of global refinery capacity, but accounts for 43% of global refinery emissions.
Around the world, 66 different carbon tax schemes have resulted in a lack of uniform carbon policy, price, and timing of introduction. A lack of uniform policies makes it difficult for refiners to pass on the costs of carbon to customers without complex border adjustment mechanisms. This could have a significant impact on profitability for many plants, making reducing CO2 emissions even more important.
How can plants mitigate fouling and restore efficiency?
A comprehensive solution is offered by Tube Tech, an IGS Solution, which uses robotic technologies to remove more than 90% of convection section tube fouling during planned turnarounds.
Tube Tech has developed this system in-house, and it is used by major refineries and other facilities around the world. On average, clients report a 3 – 5% increase in thermal efficiency and up to 15% reduction in CO2 emissions.
The robotic system is designed to access the most difficult-to-reach convection banks. It is remotely controlled by a technician, ensuring safety standards are met, and the engineered lance penetrates deep between each tube row to remove any type or level of fouling.
Figure 2 illustrates the way in which the robotic system can access every tube row.
Case study: Tüpras, Izmir refinery
This refinery, located in Turkey, applied Cetek’s High Emissivity Coating in conjunction with Tube Tech’s convection section cleaning service in order to achieve several operational benefits, which will be discussed in this case study.
The challenge
The plant was experiencing reduced radiant heat transfer efficiency, higher fuel consumption, and an increase in flue gas temperature of its SMR. The problems arose from the adsorbents in a pressure swing absorption unit, part of the refinery’s hydrogen manufacturing unit (HMU), being changed during a turnaround.
Once started up, some of these adsorbents were transported by the tail gas stream and facilitated by misplaced screens in one of the beds. The result was an accumulation of fouling on the convection bank tubes of the SMR.
The solution – part one: increasing SMR radiant heat transfer efficiency
In the SMR, the burners are directed to the angled walls in the radiant sections, and the radiation is transferred to the process tubes. The efficiency of the radiant heat transfer is related to the emissivity of the refractory surfaces. The higher the emissivity value, the greater the radiant heat transfer efficiency.
The application of a Cetek high-emissivity coating onto the refractory surface increased the amount of heat re-radiated to the process tubes in the radiant section. As a result, more heat was absorbed by the tubes, but less heat travelled to the convection section, slightly decreasing steam production.
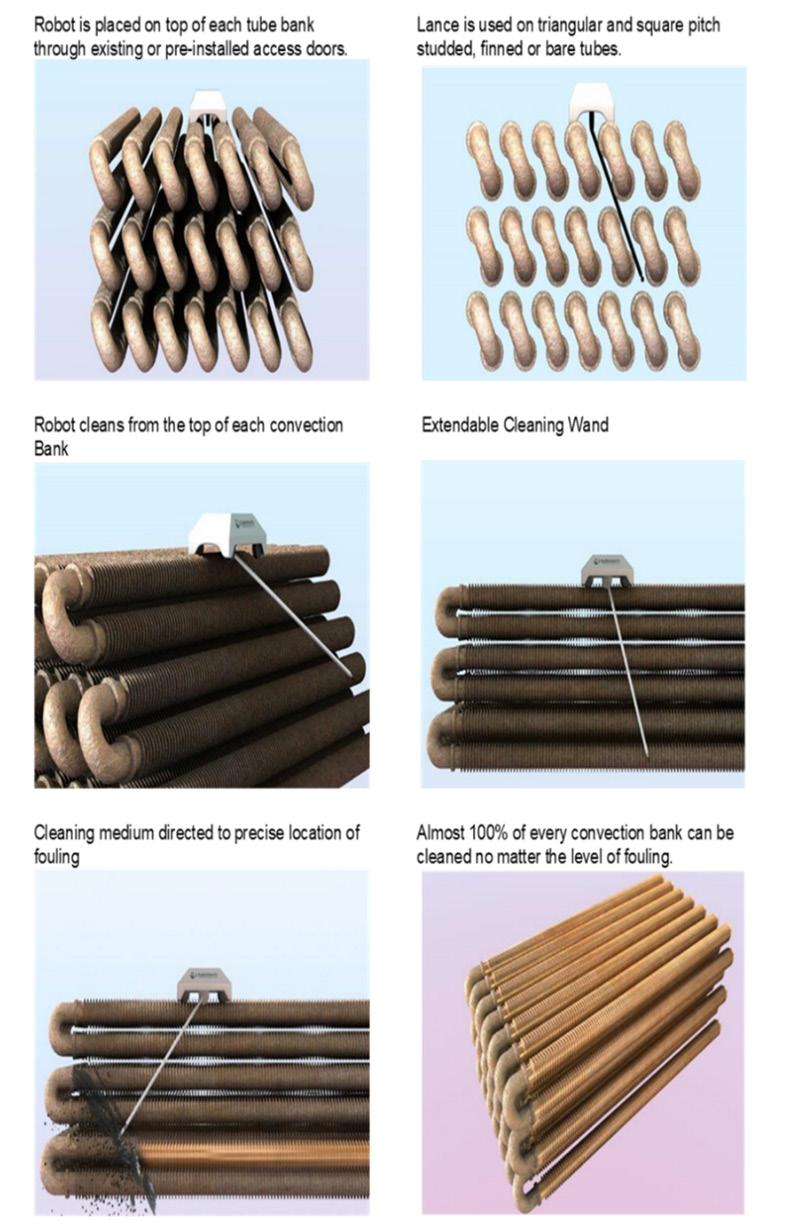
Post-coating evaluation
Tüpras reports that the BWT has decreased by 26°C – a positive indication that the high-emissivity ceramic coating is performing well. The amount of heat transferred to the radiant section has increased by 2.9%, leading to the reported decrease in energy consumption of 6.8% (released) and 8.3% (absorbed).
April 2023 HYDROCARBON ENGINEERING 58
Figure 2. Graphics illustrating the way in which the robotic technology can access every tube row.

Economic returns
The application of the Cetek high-emissivity refractory coating has helped the refinery to achieve targeted fuel savings, payout and return on investment (ROI). The coating will continue to deliver benefits for approximately two turnarounds, or eight years. After this period, it may require reapplication to continue delivering fuel savings or increased capacity benefits.

The solution – part two: restoring convection section heat transfer efficiency

To increase heat transfer and therefore save energy in the convection section of the furnace, the decision was taken to carry out mechanical cleaning. In addition to this, and as further motivation for the project, no mechanical cleaning had been carried out in the convection tubes since 1993 and the first start-up of the unit, due to their inaccessible locations.
Tüpras contacted Tube Tech to deploy its robotic convection section fouling removal robot. The technology works remotely by penetrating deep between tube rows to remove the most tenacious fouling deposits.

The results
Hydrogen production cost and ROI
The average cost of hydrogen production before and after
US$24.6/t after cleaning and the payback period for the project was less than 60 days.
Flue gas temperature
The average flue gas temperature decreased from 278°C before cleaning to 220°C after cleaning, meaning that the furnace’s overall thermal efficiency increased by approximately 3%.
Steam production
Steam production increased by approximately 20%, and the generated steam temperature increased by 10 – 15°C.
Conclusion
Fired heaters are a critical piece of equipment for refineries and facilities around the world. With rising fuel costs and stringent emissions legislation, it is becoming increasingly important to ensure that mission-critical assets, particularly fired heaters, are performing efficiently and at full capacity. Maintaining these assets regularly and thoroughly will maintain output, increase asset life, reduce the likelihood of unplanned outages, decrease stack temperatures and emissions, and deliver a significant ROI.
Reference
Reasons to attend:
Learn from 50+ technical presentation in the multi-track agenda

Agenda covers coking, cat cracking, sulfur and SDA
Network with a large audience of refiners and technical experts Develop practical solutions for optimising your coking unit with our fundamentals and advanced training courses
Discover more at: www.refcomm.com
1. ‘Adaptive CO2 emissions mitigation strategies of global oil refineries in all age groups’, OneEarth, (20 August 2021), https://www.cell.
555
EXHIBITORS *Stats from Galveston 2022 REFCOMM May 8-12, 2023 • Galveston, TX, USA 14th 2023 ® Training, Conference, & Exhibition Delayed Coking | Fluid Catalytic Cracking | Sulfur Production & Processing Gold Sponsors Bronze Sponsors ® Platinum Sponsors ®
ATTENDEES 232 COMPANIES 80
With concerns about climate change and carbon dioxide (CO2) emissions on the rise, many countries are shifting towards renewable fuels.

One source of renewable energy that is becoming more widespread is biogas, particularly from anaerobic digestion. As of January 2023, 20 000 full-scale anaerobic digestion systems are operational around the world, and it is estimated that 1000 new projects are being built per year.1 These biogas streams, as with most natural gas streams, contain hydrogen sulfide (H2S) which must be removed from the biogas in order to maintain low sulfur emissions. Anaerobic digesters also produce a liquid byproduct known as digestate that contains ammonia and H2S. This needs to be removed and processed before reuse or discharge of the water. Air stripping or steam stripping the ammonia from the water is a technique that is often used. This produces a stream with concentrations of ammonia of less than 1%, and H2S of fractions of a percent. Ammonia and H2S must be removed for discharge into waterways.
Because biogas has similar contaminates to natural gas or refinery off-gas streams, process technologies from the oil and gas industry can be explored for treating biogas. However, there are limitations due to the differences in equipment and production outputs. Traditional technologies used in refining, such as Claus units, may not be practical, considering the small H2S output of the biogas plants. The use of amine units is becoming more common for the removal of H2S and CO2 from the biogas, but the H2S remains with the CO2 and needs to be further processed. Iron sponge is common in H2S removal in the biogas industry, but still requires further
April 2023 61 HYDROCARBON ENGINEERING
Michael F. Ray and Michael J. Ray, ThioSolv, USA, discuss the use of refinery sulfur processing in anaerobic digester gas clean-up.
handling of the pyrophoric spent material before it can be disposed of or the remaining sulfur can be land applied.
Processes from the refining industry can be used to treat the anaerobic digestate. Refineries strip the ammonia from sour water streams using a sour water stripper, a technology that is very efficient at removing the ammonia and H2S in the water to very low levels. In biogas applications, the sour water stripper can provide a discharge stream of water that can be low enough in ammonia and H2S for discharge into a waterway. A sour water stripper would be a great choice for a larger digestate operation but may be not be practical for a smaller operation.
In anaerobic digesters, the biogas and digestate ratio of ammonia to H2S highly favours ammonia in almost all cases. After stripping the sour ammonia gas from the digestate and sour CO2 streams from the digester’s biogas, one option is to convert the streams into ammonium thiosulfate (ATS) – a nutrient-rich green fertilizer. Processes such as SWAATS (patented), SimpliSWAATS or BioSWAATS (patents pending) can be used in most large or small digester gas streams. To provide the stoichiometric balance in the processing of the gases to ATS, purchased sulfur will likely need to be oxidised to provide sulfur dioxide (SO2) for the process. The required ratio of sulfur to nitrogen in the ATS [(NH4)2S2O3] is 1:1, which can be achieved by using sulfur or ammonia as necessary for the balance.
SimpliSWAATS is a process that has been previously used at Transmix facilities, for processing H2S and small amounts of ammonia contained in a gas stream at process pressure, producing ATS. A Transmix facility processes various grades of diesel and kerosene that are transported through a common pipeline and no longer meet one specification. The SimpliSWAATS process selectively removes the H2S and ammonia from the gas stream and converts it to ATS. It creates the ATS by adding ammonium bisulphite (ABS) and the necessary supplemental ammonia to react with the H2S and create the ATS. Reaction 1 outlines the stoichiometry of this process:
4NH4HSO3 [ABS] + 2NH3 + 2H2S → 3(NH4)2S2O3 [ATS] + 3H2O (1)
The ABS can be purchased as a 70% aqueous solution and added directly into the process, or produced by reacting SO2, ammonia and water. Reaction 2 occurs in the latter case:
NH3 + SO2 + H2O → NH4HSO3 (2)
SO2 can be produced by combusting molten sulfur or H2S, or can be purchased as a reagent. One major advantage of purchasing the ABS directly is the removal of the capital cost requirements for a burner, and the removal of the need to purchase SO2 gas. The ABS solution typically has a pH range of 4.8 – 5.2 in the commercial grade. However, ABS can be made in situ if there is a source of excess ammonia or the operator is willing to purchase the ammonia. To produce ABS, SO2 is added in a 1:1 molar ratio to the excess NH3; or NH3 is added in a 1:1 molar ratio to the excess SO2. It is important to keep the circulating solution operating between 4.5 – 5.1 pH.
The sourcing of the ammonia will be different depending on the size of the digester. For larger digesters, adding a sour water stripper to remove the ammonia and H2S may be necessary. For smaller digesters where a sour water stripper or an air stripper may not be practical, the digestate can be filtered to separate the ammonia and H2S into a liquid stream and remove the solids and other substances.
The SimpliSWAATS process starts by taking the gas, which can be at its current pressure and temperature. Near-atmospheric pressures will work for the process, but a higher pressure will allow for smaller sized equipment than a lower pressure gas. The licensee of the process will have to determine the cost benefit analysis of raising the design pressure if necessary.
The biogas to be processed passes through a circulating solution containing ABS and ammonium sulfite. A portion of the circulating solution is sent to be mixed with a solution containing a higher ABS concentration and lower pH. The ABS in circulation lowers the pH of the circulating solution. The solution that mixes into this circulation will have a higher pH, creating a high sulfite to bisulfite ratio. Additionally, the gas exiting the first contactor will contain a small amount of ammonia. These sources of ammonia raise the pH of the circulating solution. The ABS added has a pH of approximately 5.0 from production and most commercially-available sources. A 6.1 – 6.3 pH at the top of the circulation is the target to control the process and minimise emissions; operating below 5.5 pH could cause the ATS to decompose within the solution; a pH below 5.9 means that there is a potential for increased SO2 emissions; a pH of above 6.3 means that there is a potential for increased ammonia emissions.
Between the two is the best operating pH to minimise overall plant emissions. Using these pH guidelines as an indication, the ATS is formed in the solution as the H2S is reacted from the gas. This ATS solution will eventually reach a salt concentration of around 60% by weight, and it can then be sold and marketed as ATS fertilizer. The ATS product is usually a clear or slightly yellow liquid and may have a slight smell of ammonia or SO2. The final liquid product will typically have a specific gravity of around 1.34, and a pH of 7.0 – 7.5. The circulating solution is usually around 50 – 100 times more volume than the product draw.

April 2023 HYDROCARBON ENGINEERING 62
Figure 1. A block flow diagram of the SimpliSWAATS process.
At the top of the reactor column, a circulating water solution is used to scrub out any of the remaining ammonia and SO2 from the gas stream. From there, the gas can be reinserted into the process with on-spec H2S and SO2 concentrations.
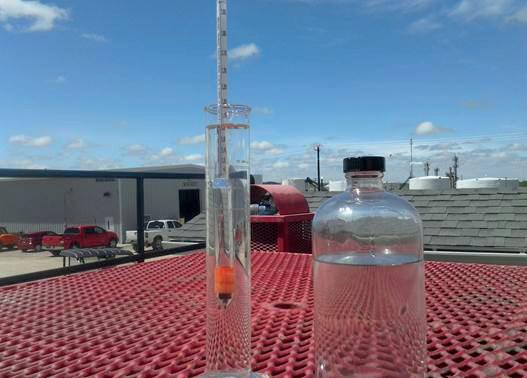
The SimpliSWAATS process, along with other processes in the SWAATS family, has a number of advantages. There are no side streams or waste streams produced in the process. The only streams that exit the process are the fertilizer and the sweetened gas stream. The stripped water from upstream is available for reuse or discharge. There are no catalysts in the system, or other materials that are consumed and disposed of in the reactions. The process can be conducted at relatively low pressures and temperatures, which allows for the equipment to have lower design pressures and temperature and reduces the potential for hazards. Another major advantage of the SimpliSWAATS process is the production of a marketable fertilizer. This enhances the return, as the fertilizer can be sold on the market to help offset the cost of operation.

BioSWAATS operates in a similar manner, the primary difference is that biogas is used as a feed instead of a gas stream from a fossil fuel-based source, and the ammonia in the reaction is stripped from the digestate. It allows for the creation of organic ATS, which can be used to grow organic crops, with any excess ammonia being used to either enhance the nitrogen level of the fertilizer, or further processed to produce additional ABS.
In the case of a small biogas application, BioSWAATS has other advantages over typical sulfur removal processes in the industry. The process can use the liquid from the anaerobic digester to treat the H2S, and using ammonia entrained in the digestate. In filtered digestate from small digesters, SO2 can be added to the system to create ABS and ATS.


For larger digesters, the entrained ammonia and H2S may need to be air stripped or may require a sour water stripper. SO2 can be added to the air stripper gas or sour water stripper gas. For either system, the ABS can in turn be used to treat the biogas. Another major advantage of producing ATS using this method is that it is possible to produce ATS without the use of fossil fuels. This could lead to the ability to produce and market organic fertilizer, which could then potentially create a higher market value for the fertilizer as the demand for organic produce continues to increase there.


Conclusion
As the biogas market emerges, a quality process for removing the H2S from the final product is necessary in order to keep emissions low. While processes that have been used in the traditional oil and gas industry are a great place to start in the design process, the relatively smaller size of the equipment and output capacity may make some processes impractical. Processes that have worked historically in the refinery process, and work in both large-scale and small-scale digesters, are the sour water stripper, amine unit and the SimpliSWAATS process. BioSWAATS can treat ammonia and H2S emissions from biogas and digestate while producing a quality ATS fertilizer –ultimately achieving a greener product. Reference 1.
• Claus is too large and expensive for the amount of H2S produced?


• Liquid oxidation too costly and does not deal with ammonia?


• Refineries
• Gas plants
• Amine plants


• Anaerobic digesters
• And more
SIMET, A.
FLETCHER, K.,
Advances in the US’, Biomass
January
and
‘Biogas
Magazine, (27
2017).
your ammonia and H2S into an environmentally-friendly fertilizer with our line of SWAATS processes Ammonia Problems taking your Claus Capacity? Thiosolv, LLC. 832-443-0952 Michael.Ray@thiosolv.com www.ThioSolv.com
Turn
VIRTUAL


An interactive Virtual Conference showcasing the innovative technology and solutions that are advancing the hydrogen industry worldwide. Register for free here: https://bit.ly/3jtoh4h
participation from:
HYDROGEN CONFERENCE 23
With
CONFERENCE
2023
Ramp up production of sustainable aviation fuel. Together we can transform the aviation industry’s carbon intensity for the better. Keep planes in the air, and still be on track to zero. SAF reduces CO2 emissions by at least 85% when compared to conventional fuel. And we have the proven technologies to make it all happen. Now. Turn your sustainable ambitions into a sustainable business. Join Flight Plan Green. Find out how: topsoe.com/saf
20 APRIL
TAKE-OFF. FROM AMBITION TO ACTION. FLIGHT PLAN GREEN
AMETEK Process Instruments
In sulfur recovery units (SRUs), tail gas or air demand analysers have been providing post-Claus analysis of sulfur compounds for over 40 years. These measurements give insight into sulfur recovery efficiency and have been implemented in control systems as a means of adjusting the trim levels of air or oxygen at the thermal reactor (reaction furnace). This ‘feed-back’ control system is present in most SRUs, but, increasingly, users concerned with optimal efficiency, reduced downtime and lower regulated emissions have also been measuring H2S, CO2, NH3 and total hydrocarbons (THCs) in the acid gas feed to the SRU.
Although leveraging this analysis as part of a ‘feed-forward’ air control system reduces the reaction time to changes in feedstocks that may cause SRU plant upsets of increased emissions, these additional measurements were often just provided to operators, engineers and technicians to explain why SRU process upsets were occurring or offer an element of direct human control. Typically, they have not been driving immediate operational changes.
AMETEK Process Instruments has partnered with Comprimo, part of Worley, to provide SRU stakeholders with all the critical measurements and air control system design and software logic, to finally ‘close the loop’ on

April 2023 65 HYDROCARBON ENGINEERING
In this year’s annual Sulfur Review, Hydrocarbon Engineering presents a selection of sulfur services and technologies that are available and in use within the downstream oil and gas sector.
feed-forward Analyzer Air Control Technology. Drawing on the two companies’ combined 100+ years of SRU design and analytical solutions experience, the 2ACT Solution fully automates the process, resulting in improved SRU

BASF and ExxonMobil
To meet the rising demand for energy, natural gas processors and refiners are moving into increasingly sour gas fields and higher sulfur crude slates while adhering to tightening emissions standards. BASF’s OASE® yellow technology and ExxonMobil’s FLEXSORB TM SE Plus technology (sublicensed by BASF) enable producers to meet their sulfur emission requirements while maintaining a low carbon footprint 1 in low pressure acid gas enrichment and tail gas treating applications.
Traditional MDEA-based solvents require extensive amounts of energy to meet current World Bank SO 2 emission standards. The OASE yellow technology can meet these same standards while reducing CO 2 emissions from energy savings by 15% with FLEXSORB SE Plus allowing for further 35% reduction. 1 In addition, the FLEXSORB technology has been integrated into OASE connect, BASF’s proprietary, rate-based simulation software. These simulations deliver more tightly
Blasch Precision Ceramics Inc.
The Blasch VectorWall TM , including its precursor, the HexWall®, have been successfully deployed at hundreds of SRUs around the world in the past 20 years. The HexWall was designed to address the need of a precast refractory checkerwall that was mechanically stable over the long-term in a variety of sizes, even the highest temperatures. In contrast to conventional checkerwall designs, the HexWall consists of a series of hexagonally shaped blocks, stacked horizontally one atop the other, and locked together with a series of tabs and slots to provide a mechanical advantage.
The development of the VectorWall came from the realisation of enhancing the HexWall to also provide process benefits. It can be configured to create an almost endless series of customised flow fields within
CG Thermal LLC
CG Thermal continues to develop technologies and methods to address harsh and corrosive process streams. The company has recently made contributions to the production, processing, and dilution of sulfuric acid. The revolutionary AirBTU VPRR heat exchanger includes design features that create uniformity and symmetry of material temperatures throughout the heat exchanger. Its design addresses common failure modes resulting in excellent reliability, while maximising safety and minimising downtime.
Made possible using computational fluid dynamics (CFD) modelling, each unit is designed to the customer’s specifications, addressing the unique operational concerns associated with the application.
performance and reliability, as well as reduced operational expense. Preventing one upset that reduces gas plant/refinery throughput results in immediate return on investment.
specified results than previous designs, generating a 33% reduction in reboiler duty and over 50% savings in solvent circulation rate in certain scenarios.
In addition, these technologies can maintain low sulfur emission specifications at ambient conditions exceeding 55°C, allowing producers to forego costly solvent chiller systems. OASE yellow and FLEXOSRB SE Plus technologies allow systems to operate at higher lean solvent temperatures while maintaining treated gas H 2 S specifications as low as 5 ppmv.
More than 140 commercial applications have demonstrated the benefits of OASE yellow and FLEXSORB SE Plus technologies since the first commercial FLEXSORB SE unit began operation in 1983. BASF and ExxonMobil are partnered together to raise the bar in selective gas treatment.
reaction furnaces (RF) and thermal oxidisers. From a process standpoint, a large portion of the flow jets through the centre of a choke ring do not satisfy the minimum residence time for key reactions. The VectorWall is specifically designed to address these problems by having better ammonia and BTEX destruction from higher RF front zone temperatures due to the unique radiation blockage from the Vectortile. Along with increased path lengths and an increase in temperature in Zone 1 (before the wall), there is potential to offer lower CO 2 emissions, shorter furnace designs, and increase fuel savings in SRUs and thermal oxidisers (TOXs). These precast walls are used in high-temperature reaction furnaces located in Claus SRUs, sulfuric acid plants, TOXs, and incinerators in various services.
Using a combination of variable tube pitch, and proprietary shell baffle and pass arrangements, uniform thermal expansion can be achieved. The result avoids stress failures at the tube to tube-sheet welds, which are a concern in high temperature applications.
These VPRR features are also used to eliminate cold spots that could introduce metal temperatures below the dewpoint of constituents in the gas stream. By preventing condensation of the gas, cold-end corrosion and fouling, which are typical failure modes in sulfuric acid processing, are eliminated.
This highly engineered design results in a highly efficient custom solution that allows the end user to enjoy a reliable operating life that is typically 2 – 3 times longer than that of a more traditional shell and tube design.
April 2023 HYDROCARBON ENGINEERING 66
1. ‘Performance comparison of the amine system used in selective gas treatment app’, presented at the September 2022 Gas Processors Association, GCC Chapter.
Comprimo
Sustaining the world for generations to come through technological and environmental innovation, Comprimo, part of Worley, offers a broad gas processing and sulfur technology portfolio. The Comprimo solutions provide the lowest CAPEX and OPEX levels while meeting local sulfur recovery efficiency regulations.
Since the 1950s, the company’s technology has been featured in more than 1200 SRUs. With five execution centres and a comprehensive global expert network, Comprimo’s customers receive responsive technical support and have access to over 100 dedicated sulfur experts.

The company’s portfolio of sulfur degassing technologies covers the full range of performance guarantees and applicability. Among these is an easy-to-implement, low-cost option to reduce emissions
Delta Controls Corp.
Delta Controls Corp. is an internationally recognised expert in the design and manufacturing of process instrumentation. Delta Controls has recently developed two novel products for sulfur recovery service, ProSpectionTM Process Camera and the Model HTV Unpurged Thermocouple. The company’s instrumentation design expertise allows it to provide innovative and reliable solutions for demanding applications.
The ProSpection Process Inspection Camera provides continuous online monitoring of the SRUs thermal reactor. The camera delivers a high-resolution video feed of the vessel’s interior, allowing operators to monitor critical components of the reactor and identify emerging problems. A wide-angle lens shows the most useful view of the vessel interior while the patent-pending thermal regulation system prevents lens occlusion.
IPCO
IPCO, a world leader in sulfur processing and handling systems, provides two solidification systems to meet all throughput requirements.
For small to mid-size capacity operations, the Rotoform system offers excellent product uniformity and environmentally friendly operation. This single step, liquid-to-solid process results in premium quality pastilles of uniform shape and size, which are free-flowing for easy handling. The system also offers a predictable high bulk density, which is an advantage for storage and transportation. More than 700 Rotoform pastillation systems have been installed for sulfur processing to date,
Optimized Gas Treating Inc.
Optimized Gas Treating Inc. continues to expand and improve the capabilities of its OGT|SulphurPro® process simulator. Detailed, kinetics-based reactor models have been developed for the hydrogenation (TGU) reactor, thermal oxidiser, sulfur storage/degassing, and stack. The advanced models mean greater simulator accuracy, which
from sulfur loading stations in smaller SRUs, a technology that can be installed in both sulfur pits and sulfur collection vessels while meeting less than 10 ppmw H2S in the product sulfur, and a solution for very low emission SRUs where vent streams from the degassing unit do not require complicated controls to the Main Burner.
2ACTTM (Analyzer Air Control Technology) is a new addition to Comprimo’s portfolio. The new control system works by continuously sampling the acid gas upstream of the SRU, providing the information required for air control earlier than conventional systems. With the combustion air quantity adjusted in direct response to the acid gas entering the main burner, the SRU remains online and in stable control without any operator intervention, even in the face of changes in acid gas concentration, hydrocarbon carryover, and air-to-acid-gas-ratio. This improves emissions as well as on-stream reliability.
The Model HTX Thermocouple is a purged thermocouple for SRU temperature measurement and has a proven track record for long-term reliable service in Claus thermal reactors. The recently released Model HTV Unpurged Thermocouple utilises a carefully designed seal system and advanced ceramics to ensure temperature measurement accuracy from turnaround to turnaround. For a complete measurement solution, thermocouples are supplemented by the Delta Controls Model HIR Pyrometer which employs a dual-wavelength infrared ratiometric measurement system and is unaffected by partial nozzle obstructions or coated windows.
Delta Controls’ sulfur instrumentation products are installed in over 155 sulfur plants worldwide. The company’s products are engineered to provide reduced maintenance and improved process uptime, resulting in lower maintenance costs for SRU plant operations.
and a new sulfur solidification system using RFHS technology was commissioned in the port of Antwerp last year.
For higher capacity sulfur solidification requirements, IPCO offers rotating drum technology to deliver high productivity ‘once through’ performance.
The first industrial installation of the IPCO SG20 was successfully commissioned in Italy in 2021 and offers an environmentally friendly process that is simple and safe to operate, while producing a high-quality product. A further three IPCO SG20 granulation drums have been delivered to the Duqm Refinery in Oman and commissioning is planned for 2023.
is based on real, measurable parameters instead of rules of thumb or assumed quantities.
A distinguishing feature of the hydrogenation reactor is state-of-the-art, integrated poisoning and ageing models which account for age and composition effects on TGU reactor catalyst and ultimately plant performance. In fact, these models have been used to demonstrate a plausible
April 2023 HYDROCARBON ENGINEERING 67
explanation for chronic, low-level, and intermittent SO2 ingress into a quench column in an operating facility.
The new thermal oxidiser and stack unit operations utilise a hybrid model using kinetics for the oxidation of typical reduced sulfur species (H2, CO, and NH3) and Gibbs-free energy minimisation for all remaining reactive species. The stack unit operation model not only implements the same reaction methodology as the thermal oxidiser but also has many options to simplify detailed emissions calculations and reporting, including emitted gas composition.
Servomex
Thousands of sulfur removal facilities are located at oil and gas processing facilities throughout the world.
A conventional SRU configuration has a Claus section, a sulfur degassing section, a tail gas treatment section, and a thermal incinerator. Overall, a sulfur recovery of up to 99.9% is achievable.
Tail gas from SRUs for acid gas contains a variety of sulfur compounds, which must be destroyed by combustion before the gases are vented to the atmosphere. Oxidising temperatures can vary from 650 to 1000° C (1200 to 1800° F) with residence times of 0.6 to 1 sec.
This is a typical combustion application, but the presence of high levels of sulfur compounds makes the stream very corrosive.
Shell Catalysts & Technologies
Shell has been operating and actively developing technologies for sour gas facilities since the 1960s. Much early development was in North America, but the fastest growing area is now the Middle East. The increasing requirement to meet growing energy demand sustainably means integrating technologies for CO2 capture, sequestration and enhanced oil recovery (EOR) while minimising SO2 emissions.
Shell has supported numerous Middle East operators with innovative solutions to make sour gas production more sustainable. The company’s gas treating solutions, such as Sulfinol*-X and ADIP* ULTRA, and its sulfur recovery and tail-gas treating technologies such as Shell Claus offgas
Siirtec Nigi
Since the 1970s, Siirtec Nigi has been active worldwide in the sulfur recovery area. The company can act as a licensor, as a manufacturer of SRU critical equipment, or as an engineering and contracting company, depending on the client’s needs. Siirtec Nigi also provides consultancy services as part of its after sales activity, and can cover SRUs designed by other manufacturers.
Siirtec Nigi can provide its customers with tailored solutions, including either air-Claus or air oxygen-enriched Claus, its own sulfur degassing process (DegaSN), and tail gas treatment (High Claus Ratio [HCR]), which can increase the sulfur recovery efficiency by more than 99.9%.
The sulfur storage/degassing model predicts the natural and catalysed release of dissolved/chemically bound H2S from liquid sulfur. The model better accounts for H2S in the facility since a significant amount of H2S is evolved this way and either must be oxidised and emitted to the atmosphere or recycled to the Claus unit.
As a member of the OGT Suite family of products, SulphurPro integrates seamlessly with all the other suite applications to produce accurate and predictive models for each stage of the gas treating and sulfur recovery processes.
Recently, Servomex has had success in the Middle East region, where the existing analysers in most SRU applications are either zirconia or extractive solutions. The zirconia technology can be attacked by sulfur compounds, reducing sensor life, and sample tubes may be clogged due to the effects of sulfuric acid. This means existing devices require high levels of maintenance and frequent calibrations.
Following successful field trials, many customers have switched to Servomex’s SERVOTOUGH Laser 3 Plus, a Tunable Diode Laser (TDL) solution, for all of their SRU thermal oxidiser applications.
TDL is a non-contact, non-extractive sensing technology, so avoids the issue of corrosive samples. This leads to less maintenance. Additionally, the stability of the laser sensor means there are fewer calibration requirements.
treating (SCOT*) and SCOT ULTRA, as well as its CO2 capture technology, the CANSOLV* CO2 Capture System, have been applied in many of the region’s largest projects.
These technologies are helping those projects to, for example, meet their carbon intensity mandates and SO2 emissions limits, and ensure resilient and sustainable production.
With more than 60 years of sour gas processing experience and its continually evolving process technologies, Shell Catalysts & Technologies is uniquely positioned to ensure sour gas resource holders contribute sustainably to meeting global energy demand.
The search for the best plant solutions has led to the development of the Advanced Ammonia Claus technology (ADC), which can overcome traditional limits on NH3 content in the acid gas feedstock. SplitOxy is an improved oxygen enrichment approach to revamp an SRU, which allows an existing SRU to be debottlenecked to a higher extent when compared with traditional oxygen enrichment. SplitOxy technology was recently implemented in both the Barrancabermeja Refinery in Colombia and the API Raffineria di Ancona in Italy. Both successfully started up in 2020.
Siirtec Nigi can provide competitive solutions for any size SRU. The company has supplied some of the largest thermal reactor packages in the world (for the
April 2023 HYDROCARBON ENGINEERING 68
*ADIP, CANSOLV, SCOT and Sulfinol are Shell trademarks.


Downstream USA 2023 June 7-8 | Galveston, Texas Or visit – events.reutersevents.com/petchem/downstream-usa SCAN THE QR CODE TO FIND OUT MORE
Shah Gas Project in the UAE and the Kashagan Project in Kazakhstan), as well as very small complete SRU skids. The company can also supply its own acid gas burners, both for ambient air combustion and enriched-air combustion, to cover a refinery’s typical SRU capacity.
Presently, Siirtec Nigi is completing the early engineering activities necessary for the supply of a small skid mounted SRU (6 tpd) for Infineum at the Vado Ligure Refinery in Italy, under its own license. Across 2022 and 2023, Siirtec Nigi has undertaken work for the following refineries:
n Supplied critical items (acid gas burner, thermal reactor, waste heat boiler, sulfur condensers, thermal incinerator
Topsoe
Topsoe has launched its new technology line, ‘Smarter Sulfur Solutions’, comprising the technologies listed below. While none of the technologies are brand new, they are now assembled under one headline.
WSA (Wet gas Sulfuric Acid), known and appreciated in a multitude of industries since the 1980s, turns sulfurous off-gasses into concentrated sulfuric acid of commercial quality with unsurpassed energy efficiency, SNOXTM flue gas desulfurisation, also removing NOX and particulates, without consuming limestone and without generating gypsum. The high energy efficiency of a SNOXTM unit helps reduce specific CO2 emissions from heaters, boilers and power plants by up to 10%, TopClaus®, jointly developed with Comprimo, is a combination of two proven technologies, Claus and WSA. TopClaus delivers effective sulfur removal at lower initial cost and lower operational costs than a Claus unit with conventional tail gas treatment. The Claus unit converts sulfur compounds in the feed streams to elemental sulfur with 95 – 97% efficiency. Residual sulfur is removed in the WSA unit, bringing the total sulfur recovery up to typically
Wood
Wood sulfur recovery technology consists of licensed and open-art designs incorporating over 50 years of experience and ‘know how’ in revamps/upgrades/downgrades; process design; equipment design/supply; layout and modular supply; and safety and operations.
Wood’s sulfur technology includes amine treating and regeneration; conventional and two-stage sour water stripping; sulfur recovery; amine-based tail gas treating; SO2 scrubbing; integration of sulfur degassing; and sulfur solidification and handling.
Wood has been involved in over 500 sulfur-related projects worldwide covering a wide range of feed compositions ranging from 4 to over 650 tpd and sulfur recovery efficiencies meeting requirements up to and exceeding 99.98% recovery to meet the most stringent environmental requirements.
Wood’s sulfur technology group is currently addressing two similar but polar-opposite revamp designs.
One US refiner needs to increase the sulfur recovery capacity of its three Wood-designed SRUs to meet
package, sulfur pit and degassing box internals) to ENPPI for the Assyut Refinery in Egypt. The SRU designed and licensed by Siirtec Nigi consists of n.2 Claus trains of 130 tpd capacity, with common TGT and incinerator
n Replacement of the existing acid gas burner, thermal reactor, and waste heat boiler for an SRU in the Milazzo Refinery in Italy. The SRU was designed by another third party, and has a capacity of approximately 120 tpd.
n Supplied critical items (acid gas burner, thermal reactor, waste heat boiler, sulfur condensers) for Hellenic Petroleum’s Thessaloniki Refinery in Greece. Claus designed and licensed by Siirtec Nigi with a capacity of 40 tpd.
99.9%, but higher recovery is possible when needed. The WSA unit produces sulfuric acid that is returned to the Claus unit to be reprocessed to elemental sulfur. TopClaus is well suited for both greenfield projects and revamps.
SmartSARTM for regeneration of spent sulfuric acid from alkylation and other operations without producing sour wastewater.
SweetPlusTM for cleaning of difficult fuel gasses to allow them to easily be used as fuel or even feed for hydrogen production, for example. SweetPlus combines a hydrogenation process with the WSA process to deliver sweet fuel gas, and the sulfur is removed in the form of concentrated sulfuric acid.
Topsoe is a world leader in catalysts and technologies that help the industry control sulfur levels in fuels and emissions. The company has licensed more than 165 units for removing sulfur from various gasses and waste streams. Topsoe’s hydroprocessing technologies and catalysts are widely used to remove sulfur, nitrogen, oxygen and metals from various oil fractions. The company is a leader in the production of ultra-low sulfur diesel and processing of renewable fuels.
projected future refinery operations. Oxygen-enriched air and equipment modifications will be needed to achieve its future target operating capacity.
At another refinery, the crude slate has been considerably sweeter than originally specified when Wood designed the SRU/TGTU.
Equipment, control, processing modifications, and possible co-firing will be required to enable operation of the units at rates lower than the original design turndown rate.
Wood’s US-based sulfur technology group has been actively providing support on consulting and design work to refineries and gas plants worldwide through the extensive network of Wood offices.
Wood is an active participant in the evolving energy transition landscape and the company supports its clients’ goals to extend the life of their assets.
Wood’s high-efficiency sulfur technology can help to improve process performance and plant efficiency, reducing maintenance costs, simplifying operations and enhancing plant safety.
April 2023 HYDROCARBON ENGINEERING 70
MINIMIZE YOUR SULFUR RECOVERY COSTS
WITH A NEW TWO-IN-ONE SOLUTION
Today, Claus installations with tail gas treatment in refineries should reach a sulfur removal efficiency of 99.9+%. But conventional solutions struggle to meet this demand and are expensive to operate.
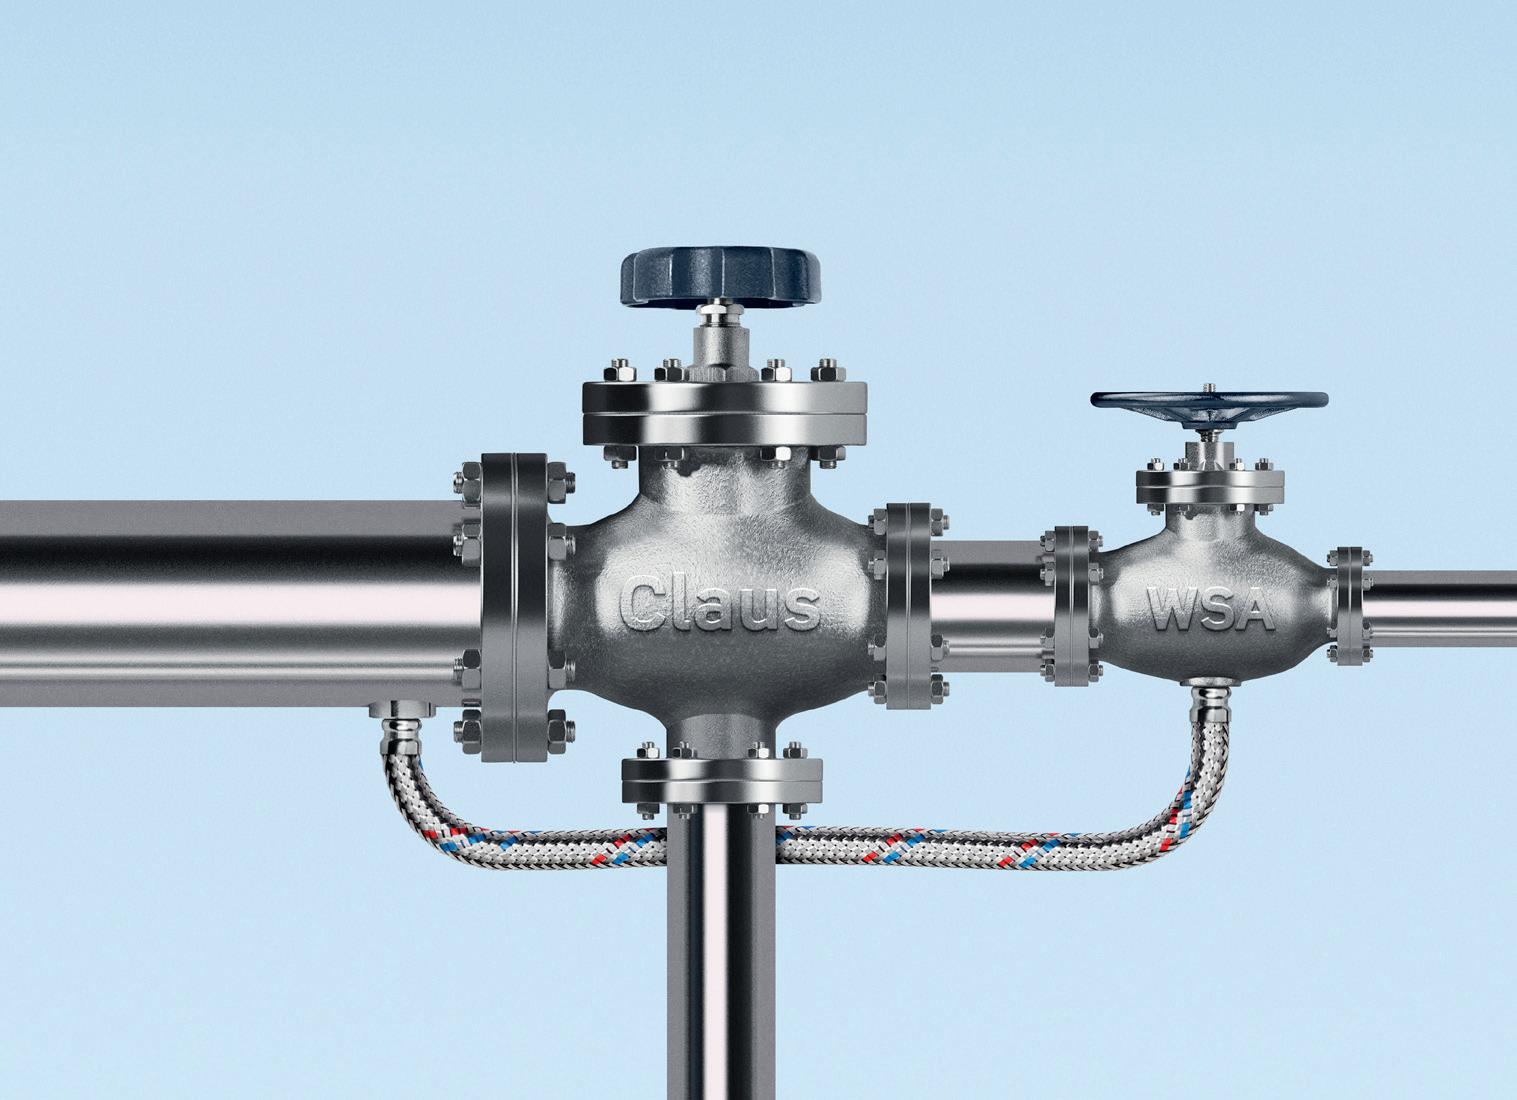
We now proudly introduce an innovative, yet well-proven solution. TopClaus® provides you with the best of two established technologies; Claus from Comprimo® and WSA from Topsoe. Optimized for a cost-effective life cycle, this combined solution significantly lowers the cost of ownership, helping you protect your profit.
Learn more at topsoe.com/topclaus
SEEING IS


BELIEVING
Take a look at our ABC Certificate. It shows our circulation has been independently verified to industry agreed standards. So our advertisers know they’re getting what they paid for. ABC. See it. Believe it. Trust it. www.abc.org.uk 2018_seeing is beliving house ad_A5 landscape.indd 2 11/12/2019 11:14:30 Page Number | Advertiser 72 | ABC 13 | Advanced Refining Technologies (ART) 25 | AMETEK Process Instruments 54 | AMPP 53 | AUMA 69 | Downstream USA 37 | Endress+Hauser 02 | Eurotecnica 57 | Integrated Global Services Inc. (IGS) 04 | IPCO OFC & 39 | MOGAS Industries Inc. OBC | Mokveld Valves BV 21 | Optimized Gas Treating, Inc. 47 | OsecoElfab IBC, 28, 40, 44, 59, 64 | Palladian Publications 51 | Paqell 60 | RefComm 2023 17 | Saint-Gobain 07 | Shell Catalysts & Technologies 11 | Sulzer Chemtech 63 | Thiosolv LLC 71 | Topsoe IFC | Union Tech Co. LLC 43 | Valmet 31 | Zwick Armaturen GmbH AD INDEX April 2023 HYDROCARBON ENGINEERING 72


Read the issue here Subscribe for free: www.globalhydrogenreview.com A new magazine focused on the global hydrogen sector The Spring issue of Global Hydrogen Review is out now
Mokveld’s ZERO emission valve.
World First! - No stem seal to atmosphere
Mokveld’s innovative Environmental Sound Technology realizes your net-zero goals:

• GHG Scope 1 reduction: ZERO emission over the full lifetime
• GHG Scope 2 reduction: Extremely low power consumption
• GHG Scope 3 reduction: Low weight and compact design
Reduce OPEX and CAPEX with accurate (servo) control, diagnostic data, reduced LDAR and potentially smaller explosionproof areas.
Step into the (Hydrogen) future with Mokveld, visit: mokveld.com/zeroemission
Achieve net-zero Scope 1 with Mokveld’s
ZERO emission
Mokveld Valves BV, experts in sustainable valve systems.
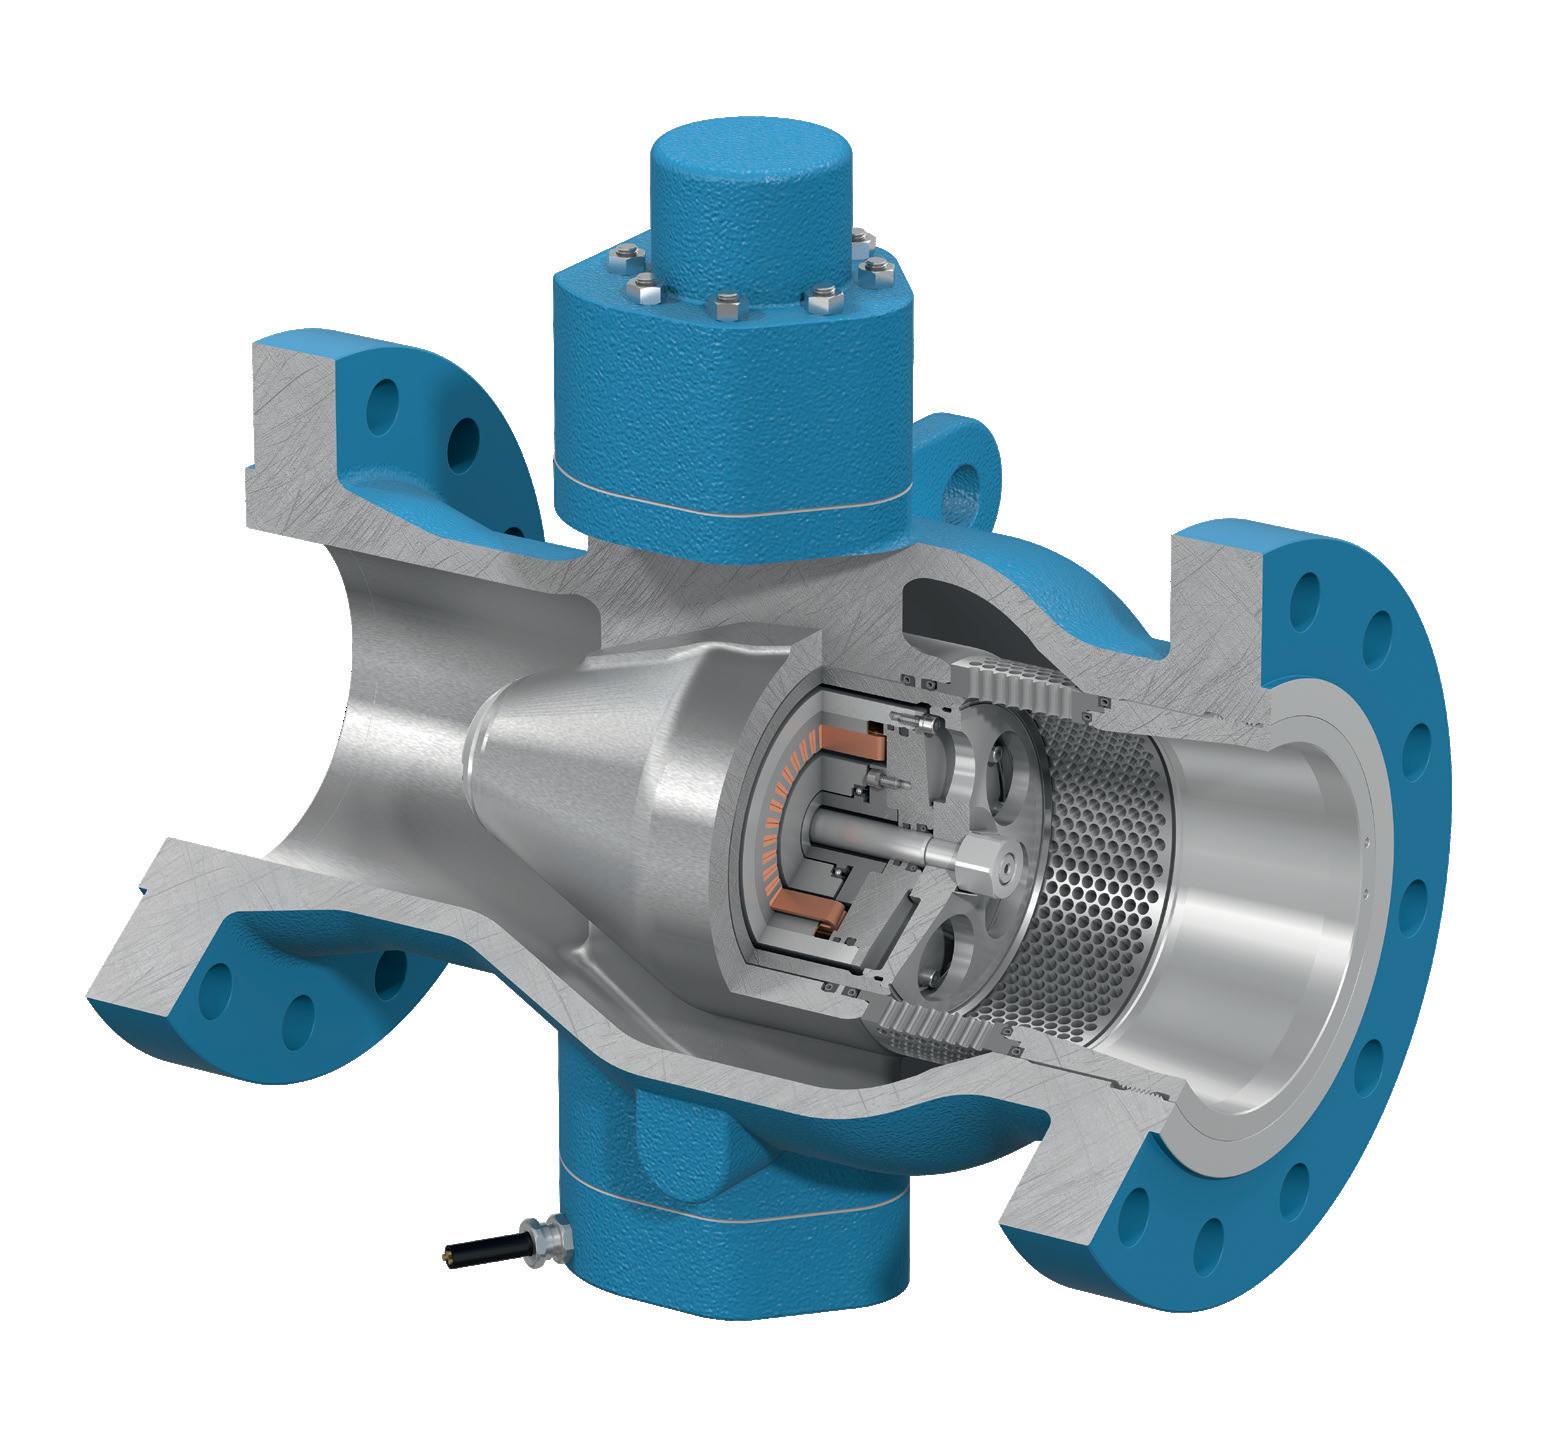
R ZEV