
May 2023
API INSPECTION TRAINING
Petroleum and petrochemical inspection personnel gain practical knowledge and earn Continuing Professional Development (CPD) hours through API live and on-demand inspection training courses.

PERFORMANCE, ENGINEERED.
Our pumps and valves are meticulously designed and field-tested, ensuring optimal reliability to maintain seamless operational efficiency.


 SARASIN-RSBD® 78 Series Pilot Operated Pressure Relief Valve
BLAKEBOROUGH® BV500 & BV501 Cage Trim Valves up to Class 600lb Rating ROTO-JET® RO-FT API 610
SARASIN-RSBD® 78 Series Pilot Operated Pressure Relief Valve
BLAKEBOROUGH® BV500 & BV501 Cage Trim Valves up to Class 600lb Rating ROTO-JET® RO-FT API 610
BV
GABBIONETA PUMPS® DH & DDH BB2 Type API 610 Centrifugal Pump BATLEY VALVE®
10000 Swingthrough
trilliumflow.com/petroleum
Termomeccanica Pompe D2 & D2D & DD2D BB1 TYPE API 610 CENTRIFUGAL PUMP
Cyndie Fredrick, Richard Stambaugh, Mark Knobloch, Kathy Young, Emma Chan and Jessica Parsa, Merichem Company, explore

prioritising the safe
37 Bridging the LNG and energy transition gap
Magnus Ulseth, Quorum Software, explains how cloud-based software can help LNG fulfil its potential as a transition fuel.
39 Expectations from simulation: part two –case studies
As a follow-up to part one of this article, Prashanth Chandran, Nathan Hatcher and Ralph Weiland, Optimized Gas Treating, Inc., USA, present a series of case studies whereby simulators have been used across a range of treating applications.
45 The importance of accurate analysis
Gadi Briskman and Tom Rosenwasser, Modcon Systems Ltd, introduce a method that enables accurate prediction of the hydrocarbon dew point using machine learning (ML).

Artem
process behind selecting
Dr Roland Emmrich and Olga Alhaj-Hohenstein, MAN Energy Solutions, Germany, reflect on the most recent developments in axial compressors, and provide an overview of new solutions available to aid decarbonisation efforts. 29
Enhanced design to enhance operations
Prof. Dr. Klaus Hoff and Jens Wulff, NEUMAN & ESSER, Germany, detail how a compressor design program can be used to reduce a plant’s CAPEX, OPEX and greenhouse gas emissions.
33
Taking control of a system
Nabil Abu-Khader, Compressor Controls Corp. (CCC), UAE, presents a number of operation scenarios for power recovery trains (PRTs).
49 Efficient detection capabilities
Julian Yeo, United Electric Controls, USA, discusses how wireless gas leak detection can improve monitoring efficiency and regulatory compliance.
52 The time for digitalisation is now

Ross Boyd, TRU, USA, explains how digitalisation can be implemented at the operational level to assist turnarounds, inspections and maintenance at refineries.
57 Tracking changes
Ashfaq Anwer, UAE, discusses the development and management of written inspection schemes, and explores how they can help to ensure equipment reliability in process plants.

61 Advanced mapping solutions
Frederic Reverdy, Eddyfi Technologies, France, explains how best to perform corrosion mapping with ultrasonic techniques.
THIS MONTH'S FRONT COVER
API Training builds a more knowledgeable and skilled natural gas and oil industry workforce through educational programmes designed to help ensure improved productivity, safety and sustainability in industry operations. Inspection personnel can continue their professional development on their own schedule through on-demand eLearning training or instructor-led courses offered in-person and virtually.
CONTENTS Hydrocarbon Engineering Like Join Hydrocarbon Engineering @HydrocarbonEng Follow CONVERSATION JOIN THE 2023 Member of ABC Audit Bureau of Circulations Copyright© Palladian Publications Ltd 2023. All rights reserved. No part of this publication may be reproduced, stored in a retrieval system, or transmitted in any form or by any means, electronic, mechanical, photocopying, recording or otherwise, without the prior permission of the copyright owner. All views expressed in this journal are those of the respective contributors and are not necessarily the opinions of the publisher, neither do the publishers endorse any of the claims made in the articles or the advertisements. Printed in the UK. CBP006075 May 2023 Volume 28 Number 05 ISSN 1468-9340 03 Comment 05 World news 08 Navigating Asia’s energy sector Ng Weng Hoong, Contributing Editor, discusses the ways in which geopolitics are set to rule Asia’s oil markets in 2023. 14 Spent caustic management: treatment options and
reuse
beneficial
how the oil and
is
treatment and/or reuse of its waste materials. 21 Making the right choice
gas industry
Vityuk,
Corp.,
Consulting,
the
adsorbents for heat-regenerated
air
25 Keeping up with new developments
BASF
USA, and Arno Goertz, Air
Germany, explain
compressed
dryers.

CONTACT INFO
MANAGING EDITOR James Little james.little@palladianpublications.com
SENIOR EDITOR Callum O'Reilly callum.oreilly@palladianpublications.com
ASSISTANT EDITOR Bella Weetch bella.weetch@palladianpublications.com
SALES DIRECTOR Rod Hardy rod.hardy@palladianpublications.com
SALES MANAGER Chris Atkin chris.atkin@palladianpublications.com

SALES EXECUTIVE Sophie Birss sophie.birss@palladianpublications.com
PRODUCTION MANAGER Calli Fabian calli.fabian@palladianpublications.com
EVENTS MANAGER Louise Cameron louise.cameron@palladianpublications.com
EVENTS COORDINATOR Stirling Viljoen stirling.viljoen@palladianpublications.com
DIGITAL CONTENT ASSISTANT Merili Jurivete merili.jurivete@palladianpublications.com
DIGITAL ADMINISTRATOR Leah Jones leah.jones@palladianpublications.com
ADMIN MANAGER Laura White laura.white@palladianpublications.com
CONTRIBUTING EDITOR
Nancy Yamaguchi Gordon Cope
SUBSCRIPTION RATES
Annual subscription £110 UK including postage /£125 overseas (postage airmail).
Two year discounted rate £176 UK including postage/£200 overseas (postage airmail).
SUBSCRIPTION CLAIMS
Claims for non receipt of issues must be made within 3 months of publication of the issue or they will not be honoured without charge.
APPLICABLE ONLY TO USA & CANADA
Hydrocarbon Engineering (ISSN No: 1468-9340, USPS No: 020-998) is published monthly by Palladian Publications Ltd GBR and distributed in the USA by Asendia USA, 17B S Middlesex Ave, Monroe NJ 08831. Periodicals postage paid New Brunswick, NJ and additional mailing offices. POSTMASTER: send address changes to HYDROCARBON ENGINEERING, 701C Ashland Ave, Folcroft PA 19032.
15 South Street, Farnham, Surrey
GU9 7QU, UK
Tel: +44 (0) 1252 718 999
COM MENT
CALLUM O'REILLY SENIOR EDITOR
In recent weeks, artificial intelligence (AI) has been hitting the headlines following a string of controversies. A song that used AI to clone the voices of musicians Drake and The Weeknd was recently removed from streaming services after it went viral and drew strong criticism from publishers Universal Music Group, which claimed that the song violated copyright law. German artist Boris Eldagsen refused his prize for winning the creative open category at the Sony World Photography Awards, revealing that his work was created using AI. And the family of Michael Schumacher announced that they are planning legal action against a German magazine which published an AI-generated ‘interview’ with the former Formula 1 world champion, who suffered severe head injuries following a skiing accident in 2013.
There is growing concern about the power that AI has to change the way we live. Key figures in the sector, including Elon Musk, recently signed an open letter warning of the potential risks of the technology, and urging that training of powerful AI systems should be suspended amid fears of a threat to humanity.
Of course, there are two sides to the coin, and AI has enormous capacity to make a positive impact on society and revolutionise industries such as ours. For example, Yokogawa Electric Corp. recently announced that its reinforcement learning-based AI algorithm will be officially adopted for use at an ENEOS Materials chemical plant, following a successful field test in which the autonomous control AI demonstrated a high level of performance while controlling a distillation column at the plant for almost a year. During the field test, the AI is reported to have shown year-round stability, reduced environmental impacts, lightened workloads, and improved safety, all while achieving stable performance and optimising operations. This is the first example in the world of reinforcement learning AI being adopted for direct control of a plant.
The integration of AI in the downstream oil and gas sector holds great promise for increased efficiency, cost savings, and improved safety. AI can optimise production, streamline supply chains, and enable predictive maintenance, reducing downtime and increasing overall performance.

However, the adoption of AI in the downstream oil and gas sector is not without risks. One major concern is cybersecurity, as AI systems depend on vast amounts of data that need to be kept secure. Another risk is the need for a skilled workforce to operate and maintain the system, and the possibility of unexpected outcomes that could have serious consequences for human safety and the environment.
It is important for industry players to work together to mitigate these risks and ensure responsible use of AI in the downstream oil and gas sector. This includes carefully considering the ethical implications of AI implementation, engaging with regulatory bodies and industry partners, and investing in education and training programmes to build a skilled workforce that can operate and maintain these systems safely and effectively. Used carefully, AI has enormous potential to change the way that we live our lives for the better. And it can also make a number of our everyday tasks that little bit easier. Take writing an ‘Editor’s Comment’ for a magazine dedicated to the downstream oil and gas industry, as an example. Did any of you suspect that the previous three paragraphs above were created (in approximately 10 seconds) using Chat GPT, an AI language model developed by OpenAI?
Just don’t tell my boss…


WORLD NEWS
USA | Beaumont refinery expansion boosts US Gulf Coast capacity


ExxonMobil has announced the beginning of operations at its Beaumont refinery expansion, adding 250 000 bpd of capacity and making the refinery one of the largest in the US (measured by crude oil distillation capacity). According to ExxonMobil, the total capacity of the Beaumont facility is now 630 000 bpd.
This is the first major refinery capacity expansion to come online since the COVID-19 pandemic, which led to several refinery capacity closures over the course of 2020 and
2021. Total US refinery distillation capacity decreased from 19 million bpd at the start of 2020 to 17.9 million bpd at the start of 2022. Increased US Gulf Coast refinery capacity should grow gross refinery inputs and production of refined products such as gasoline and distillate fuel oil (usually sold as diesel). Since mid-March 2023, total crude oil inputs at refineries on the US Gulf Coast have increased, reflecting the growing capacity of the Beaumont refinery.
Japan & South Korea | JERA signs LNG MoU with KOGAS
JERA Co. Inc. has announced that it has entered into a Memorandum of Understanding (MoU) with Korea Gas Corp. (KOGAS) regarding cooperation in the LNG sector.
Under this MoU, JERA and KOGAS have agreed to discuss opportunities for mutual collaboration in the LNG industry including LNG swaps, trading, ship optimisation, and market view exchange.
JERA and KOGAS will strengthen their strategic relationship and consider developing schemes of cooperation regarding their LNG supply and demand in order to enhance stable energy supply in Japan and South Korea.
In a statement, JERA said that it will continue to work together with LNG buyers and other companies to enhance procurement capabilities.
USA | AFPM honours facilities with outstanding safety practices
The American Fuel & Petrochemical Manufacturers (AFPM) has announced the winners of the 2022 Annual Safety Awards. The awards are part of a comprehensive programme developed by the AFPM Safety and Health Committee to promote safe operations in the refining and petrochemical industries. They also recognise facilities that have outstanding occupational and process safety performance.
The industries’ commitment to safety is reflected in their records, where they have consistently ranked as one of the safest of more than 500 manufacturing industries tracked by the US government over the last decade.
The highest honour, the ‘Distinguished Safety Award’, is awarded to the top sites with outstanding safety performance, programme innovation and safety leadership. This honour was awarded to three facilities this year for achieving a sustained, exemplary level of safety performance: ExxonMobil Chemical Co.’s Beaumont Chemical Plant, LyondellBasell Industries’ Bayport Complex, and Phillips 66’s Sweeny Refinery.
China | Technip Energies awarded contract for Juhua’s chemical complex
Technip Energies has been awarded a contract by Ningbo Juhua Chemical & Science Co. Ltd (Juhua) for a 1,3-propanediol (PDO) plant with a capacity of 72 000 tpy, as well as a 150 000 tpy polytrimethylene terephthalate (PTT) plant, in Ningbo, China.
These two products are based on Technip Energies’ proprietary Zimmer® PDO and PTT technologies, which will
strengthen and expand Juhua’s petrochemical new materials business, while improving its competitiveness. Technip Energies will provide the licenses, basic design packages, and proprietary equipment for both technologies, as well as detail design services. The PDO technology was originally developed by Shell, and Shell Catalysts & Technologies will be the catalyst supplier for the PDO plant.
Bhaskar Patel, SVP Sustainable Fuels, Chemicals and Circularity, Technip Energies, stated: “We are very pleased that Juhua has selected two of our polymer technologies for the expansion of their facility in Ningbo. This is the first commercial-scale application of our PDO technology, which produces a high-quality monomer with excellent raw material utilisation as feedstock for our PTT technology.”
May 2023 HYDROCARBON ENGINEERING 5
DIARY DATES
08 - 12 May 2023
RefComm
Galveston, Texas, USA events.crugroup.com/refcomm
22 - 24 May 2023
ILTA 2023 International Operating Conference and Trade Show
Houston, Texas, USA ilta2023.ilta.org
07 - 08 June 2023
Downstream USA 2023
Galveston, Texas, USA events.reutersevents.com/petchem/downstream-usa
07 - 08 June 2023
Valve World Americas Expo & Conference Houston, Texas, USA valveworldexpoamericas.com
13 - 15 June 2023
Global Energy Show Calgary, Alberta, Canada www.globalenergyshow.com
10 - 13 July 2023
LNG2023
Vancouver, British Columbia, Canada www.lng2023.org
05 - 08 September 2023
Gastech Singapore www.gastechevent.com
26 - 28 September 2023
Turbomachinery & Pump Symposia Houston, Texas, USA tps.tamu.edu
02 - 05 October 2023
ADIPEC
Abu Dhabi, UAE www.adipec.com
03 - 05 October 2023
AFPM Summit
Grapevine, Texas, USA summit.afpm.org
13 - 16 November 2023
ERTC
Lake Maggiore, Italy worldrefiningassociation.com/event-events/ertc
USA | Chart expands MoU with Wolf Carbon Solutions
Chart Industries Inc. has announced the expansion of its existing Memorandum of Understanding (MoU) with Wolf Carbon Solutions U.S. LLC. Wolf is an affiliate of Wolf Midstream, a US$4 billion multi-asset energy infrastructure organisation based in Calgary, Alberta, Canada.
Through the cooperation agreement, both companies will jointly identify, develop, pursue and execute projects using Chart’s Sustainable Energy Solutions (SES) Cryogenic Carbon
Capture (CCC) technology at mutually agreed upon host sites located along Wolf’s recently announced Mt. Simon Hub carbon pipeline system. The proposed Mt. Simon Hub will run from Cedar Rapids, Iowa, to central Illinois, US. Carbon that would otherwise be emitted into the atmosphere will be captured via Chart CCCTM technology and transported, stored, and permanently sequestered in the proposed Mt. Simon Hub carbon capture, transport, and sequestration system.
China | Lummus announces start-up of world’s largest double reslurry paraxylene crystallisation unit
Lummus Technology has announced the start-up of Shenghong Refining & Chemical (Lianyungang) Co. Ltd’s paraxylene unit.
The grassroots unit, which is the world’s largest double reslurry paraxylene crystallisation unit, is part of Shenghong’s refining and petrochemical integrated project in Lianyungang, Jiangsu Province, China.
In 2017, Lummus executed an agreement with Lianyungang Co. to provide the paraxylene technology license, process design services and operator training and start-up services. In addition, Chevron Lummus Global (CLG) has provided multiple hydrocracking technologies, as well as hydrotreating and delayed coking technologies for Shenghong at the same complex.
France | Axens acquires shares in the BioTJet project
Axens has acquired stakes in the BioTJet project, the aim of which is to build and operate the largest European sustainable aviation fuel (SAF) production unit using the Fischer-Tropsch process, relying on the BioTfueL® technology. This unit will be built in France, and started up by 2027. BioTfueL is an advanced biofuel production technology, developed and proven within the framework of the eponymous project from
2010 to 2021. The process includes Gasel® – a technology suite licensed by Axens used to produce high-quality renewable fuels by the Fischer-Tropsch process.
Within the framework of the BioTJet project, Axens is surrounded by its partners, and is part of the European energy transition strategy in line with the ambitious decarbonisation objectives of the aviation sector.
May 2023 HYDROCARBON ENGINEERING 6
WORLD NEWS
EXPECT THE ABSOLUTE BEST.
Servicing your facility's burners has never been easier. Zeeco offers on-site and off-site burner services designed to optimize burner performance and reduce downtime. Whether you need a simple cleaning, repair work, or a complete burner retrofit, Zeeco can get the job done right, on time, and on budget. Don' t have ZEECO Burners? No problem. Don' t waste money waiting for burner service.


Call the experts redefining what it means to be the world's foremost fired equipment authority. Zeeco - Redefining Combustion.

Ng Weng Hoong, Contributing Editor, discusses the ways in which geopolitics are set to rule Asia’s oil markets in 2023.

May 2023 HYDROCARBON ENGINEERING 8
Asia’s energy planners will have to consult political scientists as much as traders in order to navigate an increasingly conflict-driven global oil market in 2023. The markets appear to have adjusted to the unprecedented amount of international trade sanctions imposed on Russia over the course of 2022. Crude oil initially surged to US$140/bbl as a result of panic buying, but has since fallen by half to the US$70/bbl range. However, Asia is not taking the current lull for granted, with China and India leading the region’s rush to build oil stockpiles.
In 2023, China’s oil consumption will rise by 4.8% to reach another record high of 15.85 million bpd, according to the US Energy Information Administration (EIA)’s latest forecast. Asia’s other developing economies, led by India, will boost their combined consumption by nearly 2.6% to 14.06 million bpd. By comparison, the EIA predicts that the world’s oil appetite will edge up by a mere 1.1% this year.
These forecasts are made on the key assumptions that the global economy will not slump into recession, and that the war in Ukraine will not escalate. Both assumptions could prove optimistic. For Asia, energy disruption is a huge worry, as the energy-deficit region would be directly impacted if a shooting war broke out between China and the US.
Will Saudi Arabia buy Xi Jinping’s petroyuan pitch?
Emerging from three years of a self-imposed COVID-19 lockdown, China was widely expected to lead the surge in the world’s oil consumption growth in 2023. Instead, the markets responded with a collective yawn. In the weeks that

followed Beijing’s lifting of anti-pandemic restrictions on 8 January 2023, the benchmark Brent crude price held within a range of US$75 – 85/bbl. For now, Brent looks unlikely to reclaim the US$100/bbl level last seen in mid-August 2022.
China’s projected oil demand may not be the energy markets’ biggest concern this year. Last December, President Xi Jinping travelled to Saudi Arabia to personally push for a weakening of the US’s grip on the world’s financial system. He wants Saudi Arabia and other Middle Eastern countries to price their oil exports to China in the Chinese currency, the yuan.
At the inaugural China-Gulf Cooperation Council (GCC) Summit, Xi personally appealed to the Arab world to use the yuan at the expense of the dollar to price oil exports. This is emerging as one of the most intriguing ideas in financial circles. Following the first oil shock in 1974, Saudi Arabia acceded to the US demand that oil revenues be used to purchase US Treasuries and assets. Oil was to be priced and traded exclusively in the dollar, where previously it could also be pegged to the British pound. In return, the US would guarantee the security of the ruling Saudi family and the Kingdom. Saudi Arabia and OPEC members complied by recycling their enormous oil windfall into the US assets and debts. This provided the US with a constant long-term infusion of funds to cover its mounting budget deficit caused mostly by the Vietnam War, and costly domestic welfare programmes.
The deal worked so well that other countries joined in, thus entrenching the petrodollar’s status as the world’s first truly global currency. OPEC’s revenues helped finance US
May 2023 HYDROCARBON ENGINEERING 9
debt spending, which became free to grow virtually without limits. The dollar’s position as the world’s reserve currency became key to the global infrastructure of payments to support world trade, further enhancing the US as a superpower.
In recent years, the system has been challenged by China, Russia, India and other developing countries wary of the US’s ability to impose unilateral trade sanctions on others.
In pitching the petroyuan, China has taken the boldest gamble by any country so far to undermine the dollar’s position. At the China-GCC Summit, Xi officially presented the idea to de facto Saudi Arabian ruler, Crown Prince Mohamed Bin Salman, and the other GCC leaders from Kuwait, the UAE, Qatar, Bahrain and Oman. Xi tabled five proposals, starting with the petroyuan. In exchange, China promised to increase the import of Middle East energy, and expand investment in the region. While the petroyuan idea has been around for years, this was the first time that China had formally proposed it at an international event.
Why the urgency?
Beijing has identified the petrodollar as a pillar of US global power that it believes it can weaken. If Saudi Arabia were to price even a portion of its oil sales in yuan, it could set an example for other countries that would kickstart a chain reaction. By using its own currency, China, the world’s largest oil importer, could reduce global demand for the dollar. It would weaken the future sting of US financial and trade sanctions, which were unleashed on the Russian economy in response to the war on Ukraine.
For its part, Saudi Arabia could be tempted given its growing self-confidence and increasing alienation from the US, as Prince Salman has a testy relationship with the US government under President Joe Biden. The Saudi government also worries about the possibility of facing US financial and economic sanctions in the future.
Saudi Arabia is also eager to protect its long-term share in the Chinese market against the growing competition of cheaper oil supplies from Russia and Iran. Furthermore, Prince Salman sees China as an important bulwark against Iran, the biggest rival to his kingdom in the Middle East.
Salman is clearly betting on China, especially after it emerged that Xi had facilitated the resumption of diplomatic ties between Saudi Arabia and Iran. On 10 March 2023, the three countries issued a joint statement in Beijing that Saudi Arabia and Iran would restore ties after a seven-year break.
Hong Kong courts Saudi Aramco’s listing on stock exchange
Building on Xi’s December 2022 visit, Hong Kong has made it a top priority to secure the listing of Saudi Arabia’s largest company, Aramco, on its stock exchange. Aramco’s listing would greatly boost Hong Kong’s recently flagging fortune, and support Beijing’s plans to expand China’s business and energy ties with the Middle East.
In February 2023, Hong Kong’s Chief Executive, John Lee, pitched Aramco, now trading on the Saudi Stock Exchange, or
Tadawul, to take up a secondary listing on the Hong Kong Stock Exchange. Lee led a delegation of more than 30 senior business people on an unprecedented campaign to drum up business and technology deals with the Kingdom and neighbouring UAE.
State-owned Aramco opted against listing a portion of its equity on an international bourse when it went public in 2019. Although there was strong interest from global exchanges in New York, London, Singapore and Hong Kong, the company was concerned that international investors would not pay for its lofty targeted valuation of US$2 trillion.
Demands by foreign stock exchanges for full disclosure of the company’s tightly-guarded financial and oil reserves data may also have contributed to Aramco’s decision to restrict its public offering to the Tadawul in Riyadh, Saudi Arabia. The Saudi government accepted the scaled-back plan, including the company’s reduced valuation of US$1.7 trillion when its stock began trading on 11 December 2019.
This time around, Hong Kong stands a better chance to snare the coveted secondary listing. In recent years, China’s government under Xi has moved to impose full political, legal and administrative control over the former British colony which reverted to Chinese rule in 1997. Beijing is unlikely to object to Aramco’s demand for absolute secrecy over its oil and gas reserves and production data as a condition for the secondary listing. As the sole guardian of Saudi Arabia’s energy industry, Aramco is entrusted to protect the Kingdom’s enormous oil and gas wealth, which includes its data.
Saudi Arabia’s growing importance to China
Saudi Arabia’s growing importance to China’s geopolitical strategy was underlined by President Xi’s meeting with GCC leaders last December. The China-GCC summit marked a high point in Saudi-China relations, highlighted by Aramco signing multi-billion-dollar deals with Chinese state-owned energy firms in 2022. The Saudi firm announced two agreements with Sinopec and Shandong Energy Group, worth a total of at least US$30 billion.
Aramco and Sinopec announced that they will be expanding their joint refining and petrochemical complex in China’s southeastern Fujian province. The partners will be adding a 16 million tpy (320 000 bpd) refinery linked to a 1.5 million tpy ethylene unit to start up in late 2025.
With Shandong Energy, Aramco has said that it is looking to develop a downstream presence in China’s northeastern province of Shandong. The Saudi firm will supply the crude feedstock and purchase the processed chemical products that will “expand its liquids-to-chemicals capacity (in China) to up to 4 million bpd by 2030.”1
Earlier last year, Aramco formed a joint venture (JV) with North Huajin Chemical Industries Group Corp. and Panjin Xincheng Industrial Group, to develop a liquids-to-chemicals complex in Panjin City in Liaoning province, China.
Huajin Aramco Petrochemical Co. (HAPCO) will build an integrated refinery-petrochemical complex worth more than US$10 billion. The 300 000 bpd refinery and ethylene-based steam cracker are expected to start operations in 2024.
May 2023 HYDROCARBON ENGINEERING 10
Hydrogen Compression
Turn to Elliott Group for operational flexibility in hydrogen applications.


Elliott’s Flex-Op® Hydrogen Compressor features flexible, configurable, and economical compression options for hydrogen applications. Designed with proven Elliott compressor technology, the Flex-Op’s compact arrangement of four compressors on a single gearbox maximizes compression capability with enough flexibility to run in series, in parallel, or both. Who will you turn to?
n Learn more at www.elliott-turbo.com
The World Turns to Elliott COMPRESSORS | TURBINES |
|
GLOBAL
CRYODYNAMICS®
SERVICE
Asia: refiners gain from cheap Russian crude and renewed Chinese demand
Asia’s oil refiners and traders are expecting another bumper year on the back of heavily discounted Russian crude supply and renewed Chinese demand.
The oil industry had a blockbuster 2022, led by the western majors ExxonMobil, Shell, Chevron and BP reporting record profits. Crude prices surged to a 13-year high, with Brent nearly touching US$140/bbl shortly after the Russian army began attacking Ukraine on 24 February 2022.
World markets plunged into chaos when international sanctions, organised by the US, stopped most countries from buying Russian commodities. The disruptions created opportunities for nimble traders who realigned global oil supply chains with China, India and other Asian countries playing key roles.
While the sanctions targeted Russia’s crude oil, refined products proved much harder to monitor. By 2H22, the US was forced to accept that Asia was openly importing Russian crude for refining into finished products for export to the rest of the world, including the West. A complete ban on Russian crude sales would have devastated the world economy still struggling to recover from recession, inflation, and over two years of COVID-19 lockdowns.
Asia’s expanded refining capacity
China and India led the purchase of up to 1 million bpd of Russian crude for supply to refiners in Asia and the Middle East. Russia’s fire-sale of its crude at hefty discounts of between 30 – 40% proved too good to pass up.
India was particularly defiant with External Affairs Minister, S. Jaishankar, fiercely rebuking the West for trying to shame his country into joining the sanctions.
Speaking at various public forums last year, he accused the West of hypocrisy for allowing Europe to continue buying Russian oil, gas and coal while demanding developing countries forego the offer of cheap energy. “Our purchases for the month would be less than what Europe does in an afternoon,” he told an influential US audience at the US-India ministerial dialogue in Washington D.C., US, last April.
On the issue of Russian oil sales, Jaishankar told his audience, including US Secretary of State, Anthony Blinken, and Defense Secretary, Lloyd J. Austin: “Your attention should be focused on Europe.”
There is another reason for China and India to lap up cheap Russian crude. When COVID-19 broke in 2020, both countries were faced with surplus refining capacities and slowing oil demand growth. In 2020, Asia’s oil consumption fell 5.6%, according to BP2, dragged down by the region’s deep economic slump. Although consumption partly rebounded by nearly 5% in 2021, the refining industry remained under pressure as product prices were still weak compared with crude.
Adding to the industry’s misery, the growth in refining capacities in both China and India did not slow down the legacy of past decisions by the two countries to expand their downstream oil sectors. Over the past decade, China’s refining capacity has expanded by an annual average of 2.7% to a new high of 17 million bpd, while India’s recently reached a record of well over 5 million bpd. The deluge of discounted Russian crude feedstock, along with record high product prices, have
delivered a much-needed windfall for the two countries’ refiners. They will be hoping for this scenario to continue in the coming years.
According to consultant GlobalData, Asia will add 10.2 million bpd of crude distillation capacity by 2027.3 This includes 7.3 million bpd of new construction and 2.9 million bpd from the expansion of existing refineries. According to BP, Asia had 36.5 million bpd of refining capacity at the end of 2021, implying the region will be boosting capacity by 28% by the end of 2027.2
Bhargavi Gandham, GlobalData’s Oil and Gas Analyst, said: “The refinery capacity additions in Asia will be primarily driven by China and India. Economic growth, the ever-growing demand for petroleum products, especially from the transportation sector, and expanding petrochemicals sector are driving capacity additions in these countries.”
GlobalData expects Sri Lanka to build Asia’s biggest standalone refinery over the next five years. It expects the proposed Hambantota III refinery to start up in 2027 with a total capacity of 420 000 bpd.
The US Energy Information Administration (EIA) reported a significant increase in China’s refinery capacity in 2022. The 320 000 bpd Shenghong petrochemical plant in Lianyungang in Jiangsu province began trial processing in May 2022, while PetroChina started up its 400 000 bpd Jieyang refinery in Guangdong province in late 2022. Zhejiang Petrochemical Corp. (ZPC) completed a 400 000 bpd expansion of its Rongsheng plant earlier in the year.
In Malaysia, the 300 000 bpd RAPID Pengerang refinery in Johor state is fully operational after a prolonged shutdown caused by a fire in March 2020.
In India, the EIA has reported that Hindustan Petroleum is currently expanding its 170 000 bpd Visakhapatnam refinery to over 300 000 bpd by 2023.
China targeted by new US laws to ‘protect’ oil reserves
With China in mind, the US House of Representatives passed two new laws in January 2023 to limit the president’s ability to release stockpiles from the nation’s Strategic Petroleum Reserves (SPR).
The Republican Party, which controls the House, passed the Strategic Production Response Act (SPRA) on 27 January 2023, and the ‘Protecting America’s Strategic Petroleum Reserve from China’ act on 12 January 2023.
Led by senior members, the Republican Party has been protesting for months that President Joe Biden’s recent releases of SPR stocks have benefitted Chinese rather than American consumers.
The SPRA will “help ensure the Strategic Petroleum Reserve is available during a true energy emergency and not abused for non-emergency, political purposes,” said Cathy McMorris Rodgers, who chairs the House’s energy and commerce committee.4
In a statement, she described the SPR as “vital and central [...] to provide the oil supplies Americans need during true emergencies, not drain them away for non-emergency, political purposes.”
Earlier, the House had passed a law specifically designed to stop the sale of SPR stocks to China. Rodgers said that the
May 2023 HYDROCARBON ENGINEERING 12
‘Protecting America’s Strategic Petroleum Reserve from China’ act was needed to stop the president from “draining our strategic reserves” and “selling it to China”.
“Millions more barrels went to overseas traders who eventually sent it to China. We also know that China is ramping up its purchases of crude oil from Russia and the US to boost its own reserves,” she said.
“China now likely controls the world’s largest government-controlled stockpile of oil, with almost a billion barrels, at the expense of American taxpayers and our energy security.”
Rodgers described the sales to China as “a significant threat to our national and energy security.”
In 2022, Republican Party leaders called for the president to be impeached for selling 950 000 bbl of crude oil from the SPR to a subsidiary of China’s state-owned Sinopec.
Unipec America was among 12 companies that won bids to buy SPR crude at market prices, said the US Department of Energy (DOE). The sale from the nation’s reserves was part of the Biden administration’s efforts to combat rising oil prices that it has blamed on Russia’s invasion of Ukraine.
References


1. ‘Aramco and Shandong Energy collaborate on downstream projects in China’, Aramco, (9 December 2022), https://www.aramco.com/en/newsmedia/news/2022/aramco-andshandong-energy-collaborate-ondownstream-projects-in-china
2. ‘Statistical Review of World Energy’, BP, https://www.bp.com/en/global/ corporate/energy-economics/ statistical-review-of-world-energy. html
3. ‘Asia to account for over half of global refinery CDU capacity additions by 2027, says GlobalData’, GlobalData, (8 February 2023), https://www. globaldata.com/media/oil-gas/ asia-account-half-global-refinerycdu-capacity-additions-2027-saysglobaldata/

4. ‘Chair Rodgers Applauds Passage of H.R. 21 to Protect the SPR’, Energy & Commerce Committee, (27 January 2023), https:// energycommerce.house.gov/posts/ chair-rodgers-applauds-passage-of-hr-21-to-protect-the-spr
Bibliography
• ‘President Xi Jinping Attends First China-GCC Summit and Delivers Keynote Speech’, Ministry of Foreign Affairs, the People’s Republic of China, (10 December 2022), https://www.fmprc.gov.cn/ mfa_eng/zxxx_662805/202212/ t20221210_10988406.html
• ‘The Rise of the Petroyuan and the Slow Erosion of Dollar Hegemony’, The World Financial Review, (28 July 2014),
https://worldfinancialreview.com/the-rise-of-the-petroyuan-and-theslow-erosion-of-dollar-hegemony/
• ‘Exxon smashes Western oil majors’ earnings record with $56 billion profit for 2022’, CNBC, (31 January 2023), https://www.cnbc. com/2023/01/31/exxon-smashes-western-oil-majors-earnings-recordwith-56-billion-profit-for-2022.html

• ‘Oil giant Shell posts highest-ever annual profit of $40 billion’, CNBC, (2 February 2023), https://www.cnbc.com/2023/02/02/shell-earningsoil-giant-reports-record-annual-profits.html
• ‘Chevron annual profit doubles to record $36.5 billion, but fourth-quarter miss hits shares’, Markets Insider, (27 January 2023), https://markets.businessinsider.com/news/stocks/chevron-annualprofit-doubles-to-record-$36-5-billion--but-fourth-quarter-miss-hitsshares-12108651
• ‘BP posts record 2022 earnings to join Big Oil profit bonanza’, CNBC, (7 February 2023), https://www.cnbc.com/2023/02/07/bp-earnings-q4and-fy-2022.html
• ‘Price Cap on Russian Oil: Running to Stand Still’, CSIS, (28 November 2022), https://www.csis.org/analysis/price-cap-russianoil-running-stand-still
Your operations prosper
Process Industry solutions expertise


Sustainable ideas for energy efficiency Improving energy efficiency reduces your environmental footprint and energy costs while raising output and profits. With our expertise and innovative ideas, we can implement resource-efficient, low-impact technologies and services for large industrial plants and small, single-site operations. www.man-es.com

May 2023 HYDROCARBON ENGINEERING 14
Spent caustic liquors are considered some of the most foul forms of wastewater produced by industry. They are malodorous and may contain other constituents such as sodium sulfides, sodium mercaptides, sodium naphthenates, phenolic salts, amines, and potentially emulsified hydrocarbons. Whether a result of ethylene production from scrubbing cracked gas with aqueous sodium hydroxide, or hydrocarbon refining where the liquors emanate from caustic washing to remove contaminants, the caustic liquors do not easily respond to conventional biological processes. They may be harmful to human health and the environment, and challenging to treat.
Traditionally, spent caustic has been disposed of by deep well injection or incineration, or transported to offsite industrial sites for treatment and disposal. Health, safety and environmental (HSE) concerns have prompted regulatory guidelines and requirements for handling spent caustics, which often vary by city, state, country or geographic region.
The US Environmental Protection Agency (EPA) categorises spent caustic as hazardous and deleterious waste, and its safe removal and disposal has been a requirement since 1997. The Occupational Safety and Health Administration (OSHA), a department of the US Department of Labor, requires chemical manufacturers,
distributors or importers to provide applicable Safety Data Sheets to communicate information and risks on hazardous materials. Refineries and petrochemical complexes were mandated to treat spent caustic to prevent adverse environmental impacts and meet environmental regulations.

The EU developed a chemicals policy in the late 1960s that was regulated at the organisational level rather than within its 27 individual countries. The policy was overhauled in 2007 with the launch of the Registration, Evaluation, and Authorization of Chemicals (REACH), which united chemicals regulation in Europe into a single system.
Canadian provincial governments play a role in the country’s environmental regulation, with the province of Ontario leading in toxics reduction legislation. Its Toxics Reduction Strategy helps protect the health and environment by reducing toxic substances in air, land, water, and consumer products. In 2009, the Ontario Legislature passed the Toxics Reduction Act, the cornerstone of the Toxics Reduction Strategy, which requires regulated facilities to track and quantify toxic substances that they produce, and develop plans to reduce the use and creation of them.
Although less advanced than the US, EU and Canada, several other nations, including Australia, China, Japan, New Zealand and
May 2023 HYDROCARBON ENGINEERING 15
Cyndie Fredrick, Richard Stambaugh, Mark Knobloch, Kathy Young, Emma Chan and Jessica Parsa, Merichem Company, explore how the oil and gas industry is prioritising the safe treatment and/or reuse of its waste materials.
Singapore, are instituting programmes and processes that ensure proper compliance with safety and environmental policies.
There is also an extensive history of international collaboration on chemicals assessment and management, resulting in binding conventions, such as the Stockholm Convention, mandatory classification and labelling standards, and global chemicals institutions. Most notable is the Inter-Organization Programme for the Sound Management of Chemicals (IOMC), an international coordinating group that promotes sound chemical management worldwide following the recommendations of the 1992 UN Conference on Environment and Development (UNCED).
It is recognised across the globe that the treatment and removal of spent caustic is not a nicety; it is a necessity. Spent caustic must be handled for its final disposition in a thoughtful and careful manner to ensure the safety of workers, society and the environment, and to guarantee a refinery’s final wastewater product quality.
Spent caustic treatment
Spent caustic treatment is deployed onsite, eliminating the need to haul the spent caustic offsite as waste to a treatment or disposal or recycling facility. It utilises items that are readily available at most sites, including sulfuric acid, atmospheric oxygen, nitrogen, fuel gas, electricity, steam, and cooling water. Rather than relying on hazardous and expensive liquid oxidisers, it produces a safe, saltwater effluent that is not harmful once it is neutralised. And because there are no foul odours and no health and safety issues, it is simple for wastewater treatment plants to manage.
The goal of onsite treatment is to ensure that the caustic is neutralised, impurities are removed, and chemical oxygen demand (COD) and biochemical oxygen demand (BOD) are greatly reduced so that the treated brine can be sent to a wastewater treatment facility for final polishing before release to the environment. The most frequently used technologies include simple neutralisation, deep neutralisation, wet air oxidation (WAO), and incineration.
Caustic neutralisation and oxidation systems have been in use for many decades. Although seemingly simple processes, there are surprising complexities to consider. There are a variety of temperatures and pressures to think about, as well as a range of impurities that may need to be handled – some requiring additional treatment steps. Proper mixing and residence times are needed for the reaction and separation steps. Selection of the proper metallurgy is also extremely important, as corrosion can quickly disable a unit, requiring expensive repairs.
Simple neutralisation
Where brine product specifications are lenient, and a small volume of spent caustic will be diluted into a large wastewater stream, simple neutralisation offers the simplest and least expensive treating option. A simple, low-cost acid, such as sulfuric or hydrochloric acid, is added to the spent caustic to neutralise any free sodium hydroxide (NaOH) remaining, and drops the pH to an acceptable discharge range, usually 6 – 8. The acids are readily available and add no COD to the treated brine.
May 2023 HYDROCARBON ENGINEERING 16
Figure 1. Spent caustic treatment system employing WAO.
Figure 2. WAO – an onsite neutralisation and/or oxidation of sulfidic and organic spent caustics to produce a neutral brine effluent stream.

© 2023 – American Petroleum Institute, all rights reserved. API and the API logo are trademarks or registered trademarks of API in the United States and/or other countries. API Marketing & Communications: 2023-064 | PDF To learn more and to register visit: www.API.org/ Training ADVANCE YOUR CAREER WITH API TRAINING
petroleum
petrochemical inspection
API’s online, on-demand and live instructor-led inspection training courses provide inspectors, engineers and other downstream personnel with practical knowledge relevant to
and
professions.
If sulfate or chloride levels are deemed too high with the acids, simple organic acids, such as formic or acetic acid, can also be used.
This option is best used for treating sulfidic or regenerated sulfidic caustic streams coming from light hydrocarbon streams such as LPG, where most of the toxicity and COD result from easy-to-remove sulfide and mercaptide salts.
The process operates simply. Spent caustic and the acid of choice are injected continuously, mixed, and then enter a three-phase separator. The acid flow is regulated via pH sensing of the released brine. If acid gases or oils are generated by the reaction, they are allowed to separate. If needed, nitrogen or fuel gas can be added to strip away dissolved acid gases further, lowering the odour and COD.
Deep neutralisation
When the spent caustic contains high concentrations of organic compounds, or the brine product specifications are more demanding, deep neutralisation offers enhanced removal of impurities for most spent caustic types – sulfidic, phenolic and naphthenic. ‘Deep’ refers to acidification of the spent caustic to a low pH, followed by reneutralisation with caustic. This allows organic compounds such as phenolics, cresylics and naphthenics to be reconstituted as an oil phase that then separates from the brine. The oil phase can be decanted for recovery if valuable, or reblended with another hydrocarbon stream. Low temperature and pressure operation coupled with recovery of the organics gives deep neutralisation distinct advantages when treating spent caustics containing high concentrations of impurities – especially sulfides and organics.
The deep neutralisation treating system typically consists of a low pH reactor, a three-phase separator, acid gas stripping, and reneutralisation. As with simple neutralisation, sulfuric acid is typically used in excess to drive the pH to a low value for liberation of the original impurities. Any acid gases or oils generated by the acidification are then allowed to separate in a three-phase separation drum. Nitrogen or fuel is used if needed to strip away any remaining dissolved acid gases to very low ppm levels. The acidic brine is then reneutralised back to a neutral pH with fresh caustic.
The typical effluent streams are neutralised brine, a phenolic or naphthenic oil phase, and an acid gas stream containing hydrogen sulfide (H2S) and mercaptans. When there is a significant acid gas stream, proximity to an amine treater or Claus unit is advantageous to process the H2S.
WAO
WAO is now a widely used technology to treat all spent caustic types – especially for high flow rate sulfidic caustic streams from ethylene production plants. As opposed to neutralisation, which separates the impurities intact from the spent caustic, WAO destroys the impurities via oxidation, converting sulfides to sulfate, and organic compounds to carbonate and low-molecular weight carboxylic acids. Oxidation also means that no acid gas is released, so the off gas stream only contains traces of VOCs. Highly coloured, odorous liquors treated with WAO become water-clear and can be managed efficiently by a biological wastewater treatment system.
WAO brings hot caustic containing suspended or dissolved pollutants into contact with air in a reactor at elevated temperatures and pressures. The molecular oxygen dissolved in the caustic becomes an oxidising agent that causes a chain reaction of radicals formed from organic and inorganic compounds in the reaction mixture. The organic pollutants are mineralised or converted into biodegradable substances, and the inorganic compounds are degraded.
The degree of oxidation depends on the compound, the reactor residence time, and the selected temperature and pressure. After exiting the reactor, the off gas is separated from the oxidised caustic and typically exits to a downstream incinerator. The oxidised caustic then flows to a neutralisation system where sulfuric acid is added on pH control to meet the desired final pH. The only effluent streams are an oxidised, neutralised brine, and off gas.
A very small number of providers offer WAO with varying techniques and efficacy, with temperature being the most critical variable in WAO system design. As temperatures are increased, there is a higher degree of oxidation. WAO reactor temperatures range from as low as 100°C to as high as 320°C, with pressures ranging from 5 barg up to 120 barg. The temperature and pressure selected depends on the feed type and the product specifications required. Most sulfidic systems operate in the middle of the range at 200°C and 30 barg, where all sulfides are fully oxidised to sulfate. High-temperature systems (260 – 320°C) are applied where organics such as phenolics, naphthenic acids and amines are prevalent. Although amines are difficult to oxidise, at 290°C and higher they may be partially destroyed –depending on the amine type.
May 2023 HYDROCARBON ENGINEERING 18
Figure 3. Spent caustic neutralisation system.
Pop-A-Plug ® Tube Plugs


ASME PCC-2 Compliant Heat Exchanger Tube Plugging System


Trusted by plants around the world as their go-to tube leak solution, Pop-A-Plug Tube Plugs from Curtiss-Wright are engineered for optimal performance throughout the life cycle of heat exchanger equipment. Controlled hydraulic installation eliminates welding and time-consuming pre-/post-weld heat treatments that can cause damage to tubes, tube sheet ligaments, and joints.


• No Welding Required
• Pressure Ratings Up to 7,000 PsiG (483 BarG)


• Simple Hydraulic Installation
• Helium Leak Tight Seal to 1x10 -10 cc/sec


• 100% Lot Tested to Ensure Unmatched Quality


• Wide Range of Sizes& ASME/ASTM Certified Materials Available


877.383.1029 l est-sales@curtisswright.com l cw-estgroup.com/he-23

Incineration
When complete destruction of all impurities is needed, including the most difficult elements such as amines and heat-resistant hydrocarbons, direct incineration is usually required. In such situations, only a flame temperature can catalyse the oxidation of the most resistant compounds. Incineration comes with a very high operating cost, as fuel gas or natural gas are typically used to maintain the flame as atomised caustic is injected. Because of the high consumption of fuel gas, incineration is usually reserved for small streams, or where fuel gas is available at low cost.
Beneficial reuse
Treatment is but one option for managing spent caustic resulting from the production of petroleum products. As an alternative to treatment, beneficial reuse of spent caustic is also an environmentally-friendly and sustainable option, and replaces the need for disposal. Under the EPA’s beneficial reuse regulations, spent caustics may be reused as feedstock for new products or as substitutes for commercially-available products, if certain regulatory requirements are met. When such conditions are satisfied, beneficially reused spent caustic is excluded from the EPA’s solid waste definition, thereby reducing the producer’s waste generation statistics or reporting. Beneficial reuse has long been a priority method of handling spent caustic by some producers, and is gaining recognition as more refinery, petrochemical, and other manufacturers integrate ESG into their decision making.
Beneficial reuse extends the life cycle of the caustic and creates an asset from what may otherwise be perceived as a liability. It prevents pollution by reducing the need to harvest new feedstock, which saves money and reduces carbon dioxide (CO2) emissions and carbon footprints, for some, by more than 50% relative to the complete product life cycle.
Conclusion
In response to scientific evidence and mounting public concerns about the harmful effects of spent caustic, the oil and gas industry is instituting more vigorous efforts to prioritise the safe treatment and/or reuse of its waste materials. It is moving chemical management away from being a compulsion that is followed because of regulatory pressures and fear of fines and reputational damage, and towards oil and gas companies considering it their duty to protect the planet and its resources from short- and long-term harmful chemical effects. As more companies measure their environmental criteria, including resource usage and waste-related practices, they can respond to global concerns about how they handle waste products and their impact on the environment, society and economies. The result is a reduction in operational footprints, which spans the entirety of an organisation’s value chain and increases societal trust in the industry overall.
The intricacies of processes and interactions of spent caustic make partnering with a company that understands the complexities and challenges associated with treatments and beneficial reuse crucial to success.
COMPACT SIZE BIG PERFORMANCE
Laser 3 Plus Series

Delivering all the benefits of Servomex’s Tunable Diode Laser (TDL) technology in a light, compact unit, the Laser 3 Plus provides fast, accurate and responsive gas measurements for combustion and process control, making it a must for safety applications.


Learn more at servomex.com/l3plus SERVOTOUGH OPTIMIZED FOR CO OPTIMIZED FOR O2 Process OPTIMIZED FOR CO OPTIMIZED FOR O2 OPTIMIZED FOR CO+CH4 Combustion
Artem
Compressed air is an important utility in the refining and chemical industries, widely used to drive pneumatic equipment and machinery. Air is also utilised as an oxygen/nitrogen source in manufacturing processes.
Drying of compressed air upstream of process equipment is crucial to avoid moisture condensation in downstream piping and to satisfy moisture specifications if air is used as the process gas. Among the available technologies, desiccant drying has been recognised as one of the most cost-efficient and versatile options, permitting water dew points of as low as -70°C.
The desiccants that are conventionally offered into this service include activated alumina, molecular sieves, and silica gels. Although these materials have been well established in industry over the years, there are often misconceptions about

some of the benefits that they offer in compressed air plants. This is especially pronounced for silica gels, as there are a variety of grades offered in a market, with substantial variability in properties and performance characteristics in compressed air applications. This article will briefly review the relevant benefits and challenges associated with using the most common desiccants, and discuss the use of Sorbead® Air – an adsorbent for high energy efficiency air dehydration.
Adsorbents
Activated alumina is one of the most established adsorbents used in the compressed air industry. It offers high surface area and a high porosity matrix with good affinity towards polar compounds – especially water. The highly hydrophilic nature of the alumina surface makes it a sound choice for
May 2023 HYDROCARBON ENGINEERING 21
Vityuk, BASF Corp., USA, and Arno Goertz, Air Consulting, Germany, explain the process behind selecting adsorbents for heat-regenerated compressed air dryers.
adsorbing moisture. Dew points of down to -50°C are achievable with activated alumina, and regeneration temperatures are normally within the 200 – 250°C range. Advantages of activated alumina include fairly high ‘in service’ robustness and high stability towards alkaline components, such as ammonia, amines or alkali hydroxides. Combined with wide availability and comparably low cost, this makes activated alumina a suitable adsorbent for heatless dryers, and a good conventional choice for heat-regenerated dryers.
Molecular sieves are crystalline aluminosilicates with frameworks stabilised by monovalent or multivalent cations from the alkali or alkaline earth group, as well as water in its as-synthesised form. This crystal water is removed by thermal treatment without damaging the crystalline structure to create the conditions for a reversible water adsorption/desorption. The microporous and highly ordered structure of molecular sieves ensures very high surface areas in such materials, often in a 700 – 900 m2/g range. Molecular sieves are normally used for applications where very low dew points down to -100°C are required, or the compressed air needs to be dried at higher temperatures. The steep shape of the isotherm allows for low moisture content in the product gas to be reached. However, the downside of such high affinity to moisture is the need to heat up molecular sieve beds to high temperatures to drive the water off. Regeneration temperatures in the 240 – 290°C range are often used for efficient reactivation.
Silica gel is an amorphous and highly porous form of silicon dioxide (SiO2), exhibiting high surface areas and favourable water adsorption properties. Silica gel is commercially available as a granular and spherical bead material of various size ranges, and has been widely used in the compressed air industry for more than 50 years. Despite its long commercial history, users are often challenged when selecting the proper silica gel desiccant for the dehydration of compressed air. This is mostly due to the abundance of various silica gel grades and types on the market, as well as poor understanding of the difference in properties and performance between these materials. These factors often result in the unfavourable decision being made towards a lower cost but less efficient product.
Highly efficient adsorbents
Unlike standard market silica gels, Sorbead Air is an alumino-silicate gel produced using a unique proprietary manufacturing process. The patented technology is a line of highly efficient adsorbents optimised for energy efficient drying.
Some of the key factors that are normally considered when selecting the adsorbent include equilibrium and dynamic water capacities, regeneration temperature related to heat of moisture adsorption on the desiccant, and durability and hydrothermal stability of the adsorbent in service. Benefits of the technology include high dynamic water uptake combined with comparatively low moisture desorption temperatures as well as hydrothermal resistance.
Desiccant selection for a compressed air plant is of crucial importance. The proper adsorbent not only warrants steady and reliable operation of the dryer, but it also saves costs for the user. As adsorbent replacement terms are often advised by the dryer manufacturer, the changeouts are conducted in accordance with these guidelines. The desiccant selection and service periods are normally not challenged by users, and the associated costs are taken as granted. Part of this is due to the
May 2023 HYDROCARBON ENGINEERING 22
Sorbead Air R Product A Product B Activated alumina Type Alumino-silicate-gel Moisture resistant Silica gel Silica alumina gel Activated alumina Performance data Form Sphere Sphere Sphere Sphere Dynamical capacity for water vapour up to 20 % ++++ ++ ++ 12 – 14 Moisture (g/kg desiccant) up to 200 Desorption temperature (˚C) 120 – 140 ++++ 150 – 160 160 170 – 200 Lowest obtainable dew point (˚C) -60 (-70) 4 ++++ +++ ++ -40 Pressure drop adsorber per meter bed (mbar) 38 ++++ +++ +++ Attrition rate (%) 0.05 ++++ ++ ++ 0.1 Ageing rate (%) 8 – 12 ++++ ++ ++ Life span (years) 5 – 10 ++++ ++ ++ 3 – 4 Specific data Composition SiO2 97%, Al2O3 3% SiO2 99.8% SiO2 80%, Al2O3 20% Al2O3 Surface area (m2/g) 700 – 750 740 600 340 Total pore volume (cc/g) 0.41 – 0.43 0.4 0.35 – 0.45 0.5 Equilibrium capacity for water vapour (wt%) 40 38 35 30 Bulk density (kg/m3) 800 N/A 720 770 Crush strength (N/bead) 180 – 200 N/A 200 Liquid water resistant No No No Yes
Table 1. Comparison of properties of Sorbead Air R product vs competitive regular grade silica gel products. Activated alumina properties are provided for reference only
adsorbent being viewed as a commodity, and the poor differentiation between products offered on the market. It is especially relevant to silica gels, which are available in various grades, shapes, compositions and colours. The fundamental misconception is equating Sorbead Air adsorbents to conventional silica gels or alumina promoted silica gels.
The data provided in Table 1 compares the properties and performance of Sorbead Air against some of the most common silica gels offered on the market, and underlines the importance and necessity of comparing adsorbents in order to select the proper product. Performance is compared with conventional and alumina promoted silica gels that are widely offered. To make this comparison meaningful, the desiccants were divided into two types – regular grade, which is compared with Sorbead Air R in Table 1, and water stable grades, which are compared with Sorbead Air WS in Table 2.
Regular grade silica gels are normally characterised by high surface area and pore volume. The products A and B in Table 1 exhibit high surface area pore volumes, which point to similarities with Sorbead Air at first glance. However, closer inspection shows that high values of these commonly-recognised parameters are not sufficient to derive performance features. Product A is a conventional, pure SiO2-based adsorbent, and was shown to exhibit inferior mechanical properties: on average, a higher attrition rate and more pronounced ageing under thermal swing cycling. It is important to highlight that lower mechanical strength and enhanced fines generation are among the common features exhibited by pure silica gel desiccants.
Another meaningful disadvantage of SiO2 adsorbents is comparatively low hydrothermal stability. As desiccant is subject to multiple thermal regeneration cycles in commercial service, hydrothermal ageing plays a role. While equilibrium moisture uptake on ‘fresh’ Product A was measured as reasonably high, there was a pronounced decline in moisture pick-up when the sample was exposed to prolonged thermal regeneration
cycles. The precise effect is highly dependent on the specific operating conditions of the machine.
Alumina is often added to the formulation to enhance the hydrothermal stability of silica gel adsorbents and modify some of the adsorbent properties. Product B contains approximately 20 wt% aluminium oxide (Al2O3). While silica gel desiccants promoted with a certain amount of alumina could feature enhanced stability towards liquid water, the exact response is highly dependent on manufacturing process and the amount of alumina added in a composition. An important aspect to consider when selecting SiO2-Al2O3 desiccants with high Al2O3 content is the altered shape of the water adsorption isotherm as compared to pure silica gels. As alumina content increases, water adsorption isotherm deviates from the isotherm typically observed for pure SiO2, and shows features more typical for alumina. Without elaborating on the fundamental scientific nature of this phenomena, the direct consequence of this – relevant to operations of industrial dryer – is reduced water dynamic capacity of the desiccant at humidities and pressures normally used for commercial compressed air dryers. While heat of adsorption and moisture uptake properties are normally not substantially affected at alumina levels of 1 – 5 wt%, higher content often results in lower moisture pick-up as compared to pure SiO2 adsorbents.
Product B with Al2O3 content of 20 wt% reports equilibrium uptake much lower than normally observed for Sorbead Air products. As a result, more adsorbent would be required, and therefore a larger vessel size, to achieve similar
May 2023 HYDROCARBON ENGINEERING 23
Sorbead Air R Product D Product E Activated alumina Type Alumino-silicate-gel Liquid water resistant Alumina silica gel Silica alumina gel Activated alumina Performance data Form Sphere Sphere Sphere Sphere Dynamical capacity for water vapour up to 18% ++++ + ++ 12 – 14 Moisture (g/kg desiccant) up to 180 Desorption temperature (˚C) 120 – 140 ++++ 160 160 170 – 200 Lowest obtainable dew point (˚C) -60 ++++ + ++ -40 Pressure drop adsorber bed (mbar) 38 ++++ +++ +++ Attrition rate (%) 0.05 ++++ ++ ++ 0.1 Ageing rate (%) 8 – 12 ++++ +++ +++ Life span (years) 5 – 10 ++++ ++ ++ 3 – 4 Specific data Composition SiO2 97%, Al2O3 3% SiO2 99.8% SiO2 84%, Al2O3 16% Al2O3 Surface area (m2/g) 630 – 650 240 450 340 Total pore volume (cc/g) 0.43 – 0.45 0.5 0.35 – 0.50 0.5 Equilibrium capacity for water vapour (wt%) 36 21 30 30 Bulk density (kg/m3) 700 N/A 670 770 Crush strength (N/bead) 120 – 140 N/A 80 Liquid water resistant (%) 100 100 N/A Yes
Table 2. Comparison of properties of Sorbead Air WS product vs water stable grade silica gel products. Activated alumina properties are provided for reference only
performance. Another consideration not to be neglected when comparing SiO2 adsorbents promoted with alumina is water desorption temperature. Desiccants promoted with high amounts of alumina often exhibit higher heat of moisture adsorption and require somewhat higher regeneration temperatures. Since an increase in moisture heat of adsorption is almost directly proportional to alumina content, higher alumina content in silica gels often translates into an increase in nominal regeneration temperature. A temperature of approximately 140°C is sufficient for regenerating Sorbead Air R, and Product B needs approximately 160°C for reactivation, on average. Although some manufacturers do claim regeneration temperatures of as low as 160°C for high-alumina-containing SiO2-based desiccants, users and dryer OEMs always need to execute caution when using or designing dryers with these adsorbents.
Properties of some of the market-available water stable desiccants are shown in Table 2, compared against Sorbead Air WS. This type of adsorbent is resistant to liquid water and often used as protective layers on top of regular grade desiccants. Product D is 99.8 wt% SiO2 pure silica gel with a surface area of 240 m2/g. Comparably low surface area is in agreement with reduced equilibrium moisture uptake, which is almost 30% lower than what Sorbead Air WS offers. As a result, Product D would have limited contribution to the overall desiccant bed moisture removal performance, so a larger vessel size would be needed for newly designed dryers which use this adsorbent. Another related disadvantage is lower achievable
dew point temperatures for a fixed volume of adsorbent, even for configurations where water stable grade is used as the layer protecting regular grade adsorbent.
Product E is alumina promoted silica gel with reported 16 wt% Al2O3 content with a surface area of approximately 450 m2/g. It features somewhat higher equilibrium moisture uptake as compared to Product D, but still less than Sorbead Air WS, which offers approximately 20% higher loading. An important aspect to consider when selecting a high alumina promoted silica gel based desiccant as a protective layer is long-term hydrothermal stability. Activated alumina is known to undergo partial rehydration in the presence of liquid moisture at elevated temperatures upon extensive thermal swing cycling – conditions typical for the front section of the adsorbent in heat-reactivated dryers. Sorbead Air WS is designed to deliver excellent performance under severe hydrothermal conditions due to its proprietary manufacturing process, with compositional alumina of about 3 wt%.
Conclusion
Selecting an adsorbent for a compressed air dryer is important, and could be very challenging if a user or OEM is not well educated on the properties of common desiccant grades offered on the market. This is especially pronounced for silica gels, with abundant product selection across applications in dryer plants. Sorbead Air adsorbents from BASF are high-performance desiccants optimised for air drying, with a very clear value proposition.


REMBE® Your Specialist for Pressure Relief Solutions. © REMBE® | All rights reserved rembe.com hello@rembe.com 9567 Yarborough Rd. | Fort Mill, SC 29707, USA T +1 704 716 7022 hello@rembe.us
Dr Roland Emmrich and Olga Alhaj-Hohenstein, MAN Energy Solutions, Germany, reflect on the most recent developments in axial compressors, and provide an overview of new solutions available to aid decarbonisation efforts.
Large axial compressors have been deployed in various industrial applications for decades. Not only do they operate as air compressors, but they are also used with other process gases with large volume flows that need to be compressed. Typical applications are blast furnace blowers, main air blowers for fluid catalytic cracking (FCC), nitric acid (HNO3) production, air separation units, wind tunnels, propane dehydrogenation (PDH), or LNG plants. The majority of these applications use axial compressors for air compression, but also compress other gases such as natural gas or PDH gas, which is a mixture of hydrocarbons and hydrogen.
MAN Energy Solutions (MAN ES) is a supplier of industrial axial compressors, and is continuously developing
its machine and blading technology to meet the technical and operational challenges of modern industrial applications. The MAX1 axial compressor blading, whose basic technology was developed between 2007 – 2015, is an important part of this in-house R&D process.
The blading is a hybrid concept based on proven industrial design and gas turbine technology, using a multi-objective optimisation design approach across the disciplines of aerodynamics, structure mechanics, rotor dynamics and design. It is a good solution with respect to efficiency, performance range, power density and robustness, and its features make it a good match for a number of different applications and gases. For more details, see the article entitled ‘Next steps in axial

May 2023 HYDROCARBON ENGINEERING 25
compression’, which appeared in the August 2019 issue of Hydrocarbon Engineering 1

New technology and rig test verification
The latest development step, verified in 2020, was the so-called ‘Flow Cut’ technology, which enables the use of the MAX1 blading for compressing gases in large-scale production plants. Each gas differs in its properties, molecular weight, molar heat capacity and polytropic exponents. These parameters influence the pressure and temperature rise in the compressor and therefore require an individual design of the flow channel in order to keep the
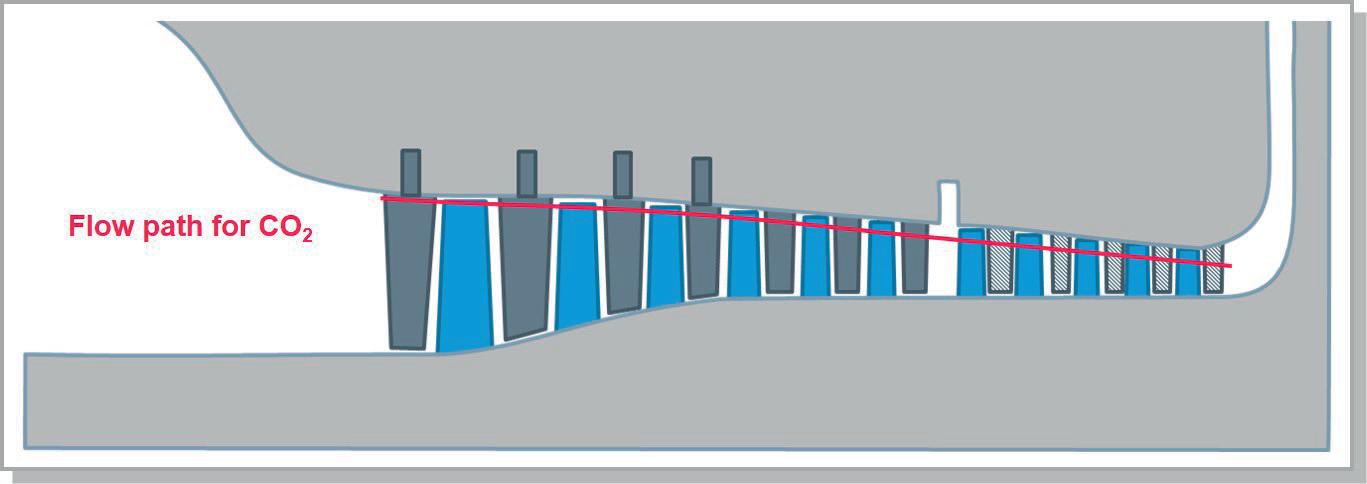
flow angles in the inlet and outlet planes of the various stages as similar as possible. The underlying Flow Cut procedure is performed with a calibrated in-house S2 streamline curvature programme. When the flow path is adapted, the blades need to be shortened or extended (see Figure 1). The basic design of the MAX1 blading supports such adaptations.
MAN ES internally tested all development steps in a rig test compressor configuration. The Flow Cut technology was therefore verified in an 11-stage test rig with a nominal volume flow of approximately 90 000 m³/hr, and a pressure ratio of 8. The design flow and the machine Mach number were changed in such a way that the resulting flow path is similar to a carbon dioxide (CO2) compressor for carbon capture and storage (CCS) applications. The test rig was heavily instrumented with thermocouples and pressure probes, strain gauges, tip-timing probes and fast pressure transducers, as well as inlet and outlet flange-to-flange instrumentation to collect performance data under a variety of operating conditions (see Figure 2).

During the design stages, special care was taken with regards to structural integrity, to ensure sufficient robustness against all possible blade excitations, which was again proven by way of Flow Cut test rig measurements. All of the neatly collected data, which verified the robustness and high performance of the blading, will function as the basis for all future machines that are customised with the Flow Cut technology.
Entering the refining sector
Following a number of customer orders in air separation, blast furnace and nitric acid applications, MAN ES’ axial compressor technology made an entrance into the fluid catalytic cracking (FCC) market in 2021. FCC main air blowers are deployed in refineries and supply compressed air at 3 – 5 bar to the regenerators in order to reactivate the catalyst by burning off the coke deposits. Volume flows in this application range from 200 000 to 780 000 m³/hr, resulting in a range of compressor frame sizes, from AG060 up to AG120. Typically, these machines consist of seven to nine stages. The driver defines the suitable flow control mechanism: either speed control for steam turbine drive, or a pure vane control for electric motor driven trains. The AG-MAX1 features four variable guide vanes for a fixed speed flow control. Figure 3 is an example of a 10-stage AG-MAX1 compressor from the modular design system.
Entering the PDH market
The AG-MAX1 axial compressor design is now also integrated in one of the biggest propylene production sites worldwide. The new production site has a yearly output of approximately 850 000 t of propylene granules. By means of PDH, the versatile feedstock polypropylene, which is used in plastics production, for example, is made from propane.
Due to the increasing demand for propylene, MAN ES decided to develop an efficient compressor solution for the PDH market based on the MAX1 technology. The basic requirements of this application were a volume flow of up
May 2023 HYDROCARBON ENGINEERING 26
Figure 1. Principle of Flow Cut technology.
Figure 2. MAX1 rig test with different instrumentation.
Figure 3. 10-stage AG115 from the modular design system.


to 1.7 million m³/hr, and a rather low pressure ratio of approximately 2. The maximum flow capacity of the AG-MAX1 modular system is limited to the frame size AG170 with a volume flow of roughly 1.6 million m³/hr. This resulted in a ‘two times 50%’ solution for the project. Each machine still delivers approximately 850 000 m³/hr in the frame size AG115.
Typically, only three or four axial stages are needed to supply the defined pressure level for this application. For this reason, the exit volume flow is much larger than that of other high pressure ratio compressors, resulting in large exit casings and thus large bearing spans. In order to maximise the performance of the compressor, the free space is used to further increase the exit pressure level behind the blading with a diagonal diffuser. This design feature gives the AG-MAX1 for PDH air applications its typical shape, shown in Figure 4.
A second customer order is currently being prepared at MAN ES’ production site in Oberhausen, Germany. This AG120 with four axial stages will be able to deliver a maximum volume flow of approximately 950 000 m³/hr, and, as a first, will be integrated into the PDH customer process as a 100% solution for the regeneration air compressor.

The first PDH air machines tested in Oberhausen achieved excellent operational results, demonstrating smooth rotordynamic behaviour and performance, which
surpassed the customer’s requirements. Further benefits are its robustness and highest machine availability amongst MAN ES’ axial compressors.
New technology on the horizon
MAN ES plans to introduce MAX1 blading to the PDH gas compressor (see Figure 5) in order to improve robustness and reduce the overall power consumption of the machine train.

Today, blading is no longer the focus of the company’s R&D investigations. MAN ES is instead working on finding the most beneficial machine train solution for individual customer projects, with a focus on reducing both OPEX and CAPEX as much as possible.
Technology solutions for decarbonisation
The switch to using renewable energy sources will greatly reduce the world’s carbon footprint. However, renewable power production usually relies on the weather, and can be very volatile. Production and demand times do not necessarily match, and so storing surplus power for later use improves both the overall efficiency and stability of these renewable energy systems.
MAN ES can provide key equipment for a wide range of storage technologies, such as liquid air energy storage (LAES) or compressed air energy storage (CAES). CAES uses geological reservoirs to store large amounts of energy for long periods of time – a very economical and effective solution for large-scale applications.
The company offers a wide range of air compressors, including combined axial and radial compressors for large units that are ideal for large-scale applications. Here, the MAX1 technology, with a history of use in combined axial and radial compressors for air separation units (ASU), offers a solution for large volume flow. In this case, the combined axial and radial compressor AR-MAX1 is built without intercooling, because the exit temperature is meant to be high in order to be stored and reused in the energy storage process.
The world’s industrial production processes need to decarbonise quickly. Avoidance, balancing and capture are the three main carbon-reduction tactics. Nevertheless, not all three approaches are viable for all industrial producers. Carbon capture, utilisation, and storage (CCUS) provides a proven and practical way of reducing emissions for large industrial plants that emit huge amounts of CO2 in flue gases. In some processes, the CO2 can be removed before combustion. Compression technology plays a key part in CCUS, as it is necessary for the various CO2 gas streams within the capture process. For large volumes of CO2, MAX1 is again a good solution, due to the economy of scales, and the company’s experts are currently in close cooperation with customers, working on machine solutions for all decarbonisation applications in the near future.
Reference
May 2023 HYDROCARBON ENGINEERING 28
1. UBBEN, S., ‘Next steps in axial compression’, Hydrocarbon Engineering, (August 2019), pp. 75 - 78.
Figure 4. AG-MAX1 design for PDH air compression.
Figure 5. AG-MAX1 design for the application of PDH gas.
As pressure and temperature are the key parameters in most hydrocarbon processes, compressors play a key role in the process design. Therefore, an accurate design program that can be used over the entire product life cycle is highly desirable. In the early sales stage, most engineering, procurement and construction (EPC) companies and licensors require basic technical information, such as the number of machines and compression stages needed, power consumption, cooling demand, and a preliminary mass force calculation. A rough commercial budget quote is then added to these datasheets. Often, clients want to weigh up the consequences of different variants, and so a quick answer is therefore advantageous.
As the project matures, an increasing number of specifications and engineering details are added, leading to a design that is ready for ordering. Here, the prediction quality of the machine behaviour and design data is of the highest importance in order to reliably design the units so that they are competitive when it comes to CAPEX and OPEX. When building the units, the design data has to flow into the compressor manufacturing process, as well as the design of the auxiliary equipment – such as pulsation dampeners, coolers, separators, piping and driver.

May 2023 HYDROCARBON ENGINEERING 29
Prof. Dr. Klaus Hoff and Jens Wulff, NEUMAN & ESSER, Germany, detail how a compressor design program can be used to reduce a plant’s CAPEX, OPEX and greenhouse gas emissions.
Being able to create an ‘as built’ design file in combination with a remote monitoring system forms the basis of coming closer to a digital twin. This allows for process optimisation, improved on demand maintenance scheduling, and faster troubleshooting. It is very helpful to be able to read measured data from a site and to compare it against the predicted data with the same process inputs, particularly when it comes to troubleshooting.
As compressor units have a lifespan of several decades, the ability to adapt them to changing process conditions is also very helpful. With the right design program, these new requirements can be added into the software, and the technical and commercial consequences can be evaluated objectively.
Most of the aforementioned tasks could be fulfilled by NEUMAN & ESSER’s reciprocating compressor design program, KO³. In the past, the program was limited to the design and recalculation of the compressor and the corresponding process data. On the plant side, only the pulsation vessels were dimensioned in the so-called damper check. Now, the entire compressor system can be both recalculated and designed. The calculations include all piping, coolers, vessels, separators, throttle valves, orifices and bypass valves.
Figure 1 shows an example of the system configuration of a 2-stage, 6-crank piston compressor. The input interface of the KO³ design program of the system configurator is shown. The compressor configuration can be viewed schematically at the bottom left of the figure. The main view shows the system configurator. With the icons in the toolbar, operators can
put together the desired system configuration. This can be done relatively quickly, by simply clicking on the icons and placing them on the configurator interface. As particular emphasis was placed on user friendliness and acceptance during the development of the new plant tool, the configurator contains automatic configuration creation. With a single click, a system with standard components is configured on the basis of the configured compressor. Figure 1 illustrates an example of an automatic configuration. It contains one suction and one discharge pulsation vessel per stage. The three cylinders of each stage are identified by the compressor symbol. An orifice is provided in front of and behind each vessel, as orifices are usually placed at these points as a result of the pulsation study. A cooler and a separator are provided behind each stage. In addition, bypasses are provided around each individual stage and around both stages. This is not provided for in every plant. However, this can be changed quickly by simply deleting the elements. In the system shown, a feed gas stream between the two stages has been inserted.
After the system has been configured, the necessary boundary conditions must be entered so that all thermodynamic quantities can be determined together. In the example used in Figure 1, the necessary boundary conditions are defined in Figure 2. With this information, the system of equations can be solved on the basis of the defined compressor (stroke, speed, cylinder diameter, damage chamber), provided that the boundary conditions allow a solution at all. If a solution does not physically exist due to boundary conditions, the program aborts with a qualified error message. Due to the fact that the compressor has already been configured before the system configuration, the mass flow is a result of the calculation and not a boundary condition.
To calculate all calculation variables, calculation models for the individual components must be introduced to the program. Figure 3 provides an overview of the required calculation models. For each component, the variables of pressure, temperature and mass flow at the inlet and outlet need to be determined. For this purpose, three equations are available per component, which link the unknown variables with each other, whereby provided quantities are contained in the equations. Further, operators must take into account that mass flow, pressure and temperature at the outlet of a component and at the inlet of the downstream component must be identical. Together with the boundary conditions, operators ultimately arrive at a system of equations in which the number of equations corresponds to the number of unknown variables. This system of equations can then be solved. Since the equations of the components are not linearly linked, an iterative Newton algorithm is used in the program. This procedure requires all unknown variables to be pre-set. This pre-allocation is based on a simplified calculation of the system, so that it does not deviate far from the final result.
May 2023 HYDROCARBON ENGINEERING 30
Figure 1. System configuration of a 2-stage, 6-crank piston compressor.
Figure 2. Necessary boundary conditions for the plant.
We’re all in.
Why gamble on your next turnaround? ActiPhase® filtration technology is a proven player in some of the world’s toughest applications. Our expert analysis sweetens the pot even more. Bet on better performance.


Optimize crystaphase.com
Under this condition, the iterative process results in a solution very quickly. Figure 4 illustrates this process.
An essential feature of the new module within KO³ is the integrated solution algorithm for determining the real gas behaviour of all conceivable gases in any composition. Three different real gas models are programmed to determine the thermodynamic properties of the gas. The main algorithm used to determine the thermal and calorific properties of the gas is in accordance with Lee-Kesler (Plöcker). To determine
the thermodynamic quantities in the vapour-liquid equilibrium, both the relationships of Redlich-Kwong-Soave and Peng-Robinson were programmed. In contrast to Lee-Kesler’s equations, these two models can also be used to determine the conditions in the two-phase region. This is necessary in order to determine the liquid fraction after recooling in the case of condensing gases, which must then be separated in the liquid separator for reciprocating compressors. This means that the gas composition can change continuously in the case of multi-stage compression, which must be done correctly and automatically by the design program.
A major thermodynamic effect is the so-called Joule-Thomson (JT) effect. In contrast to ideal gases, the temperature of the gas changes during isenthalpic expansion. In general, the temperature drops with this change of state. One of the few exceptions is hydrogen. For this gas, the temperature rises at isenthalpic expansion. The knowledge of the temperature change at isenthalpic expansion is important in the bypass operation of compressor systems. Here, part of the gas is fed back to the suction side via the bypass, where it mixes with the main gas flow. In order to calculate the correct suction temperature, the mixing temperature must be calculated from bypass and main flow. Of course, this is only possible if the gas temperature behind the bypass valve is known, due to the isenthalpic expansion. To visualise the gas properties, state diagrams of the given gas can be created in the design program. Especially in the case of condensing gases, there is an immediate overview of the pressures and temperatures at which the gas begins to condense.
Figure 5 shows a pressure-enthalpy diagram of a natural gas mixture created by KO³. In the p-h diagram, the isotherms are entered as coloured lines according to the colour legend. The area of the diagram where the coloured lines change into grey lines is the area where gaseous and liquid phases are in equilibrium. The saturation state is located at the transition from coloured to grey. It is noteworthy that in gas mixtures, those that are isobaric and isothermal do not run parallel in the two-phase region, in contrast to gases with only a single gas component. The diagram shows that in natural gas, an isobaric condensation process is associated with a drop in temperature. For a gas consisting of just one component, isobaric evaporation would not produce any temperature change.
Conclusion
It is clear that the combination of the ability to consider all components inside the compressor unit with the real gas behaviour of very complex gas mixtures leads to much increased accuracy in the design stage. When using this tool from the early project stages onwards, units can be designed with more efficiency and less overdesign, which is beneficial for reducing CAPEX, OPEX and greenhouse gas emissions.
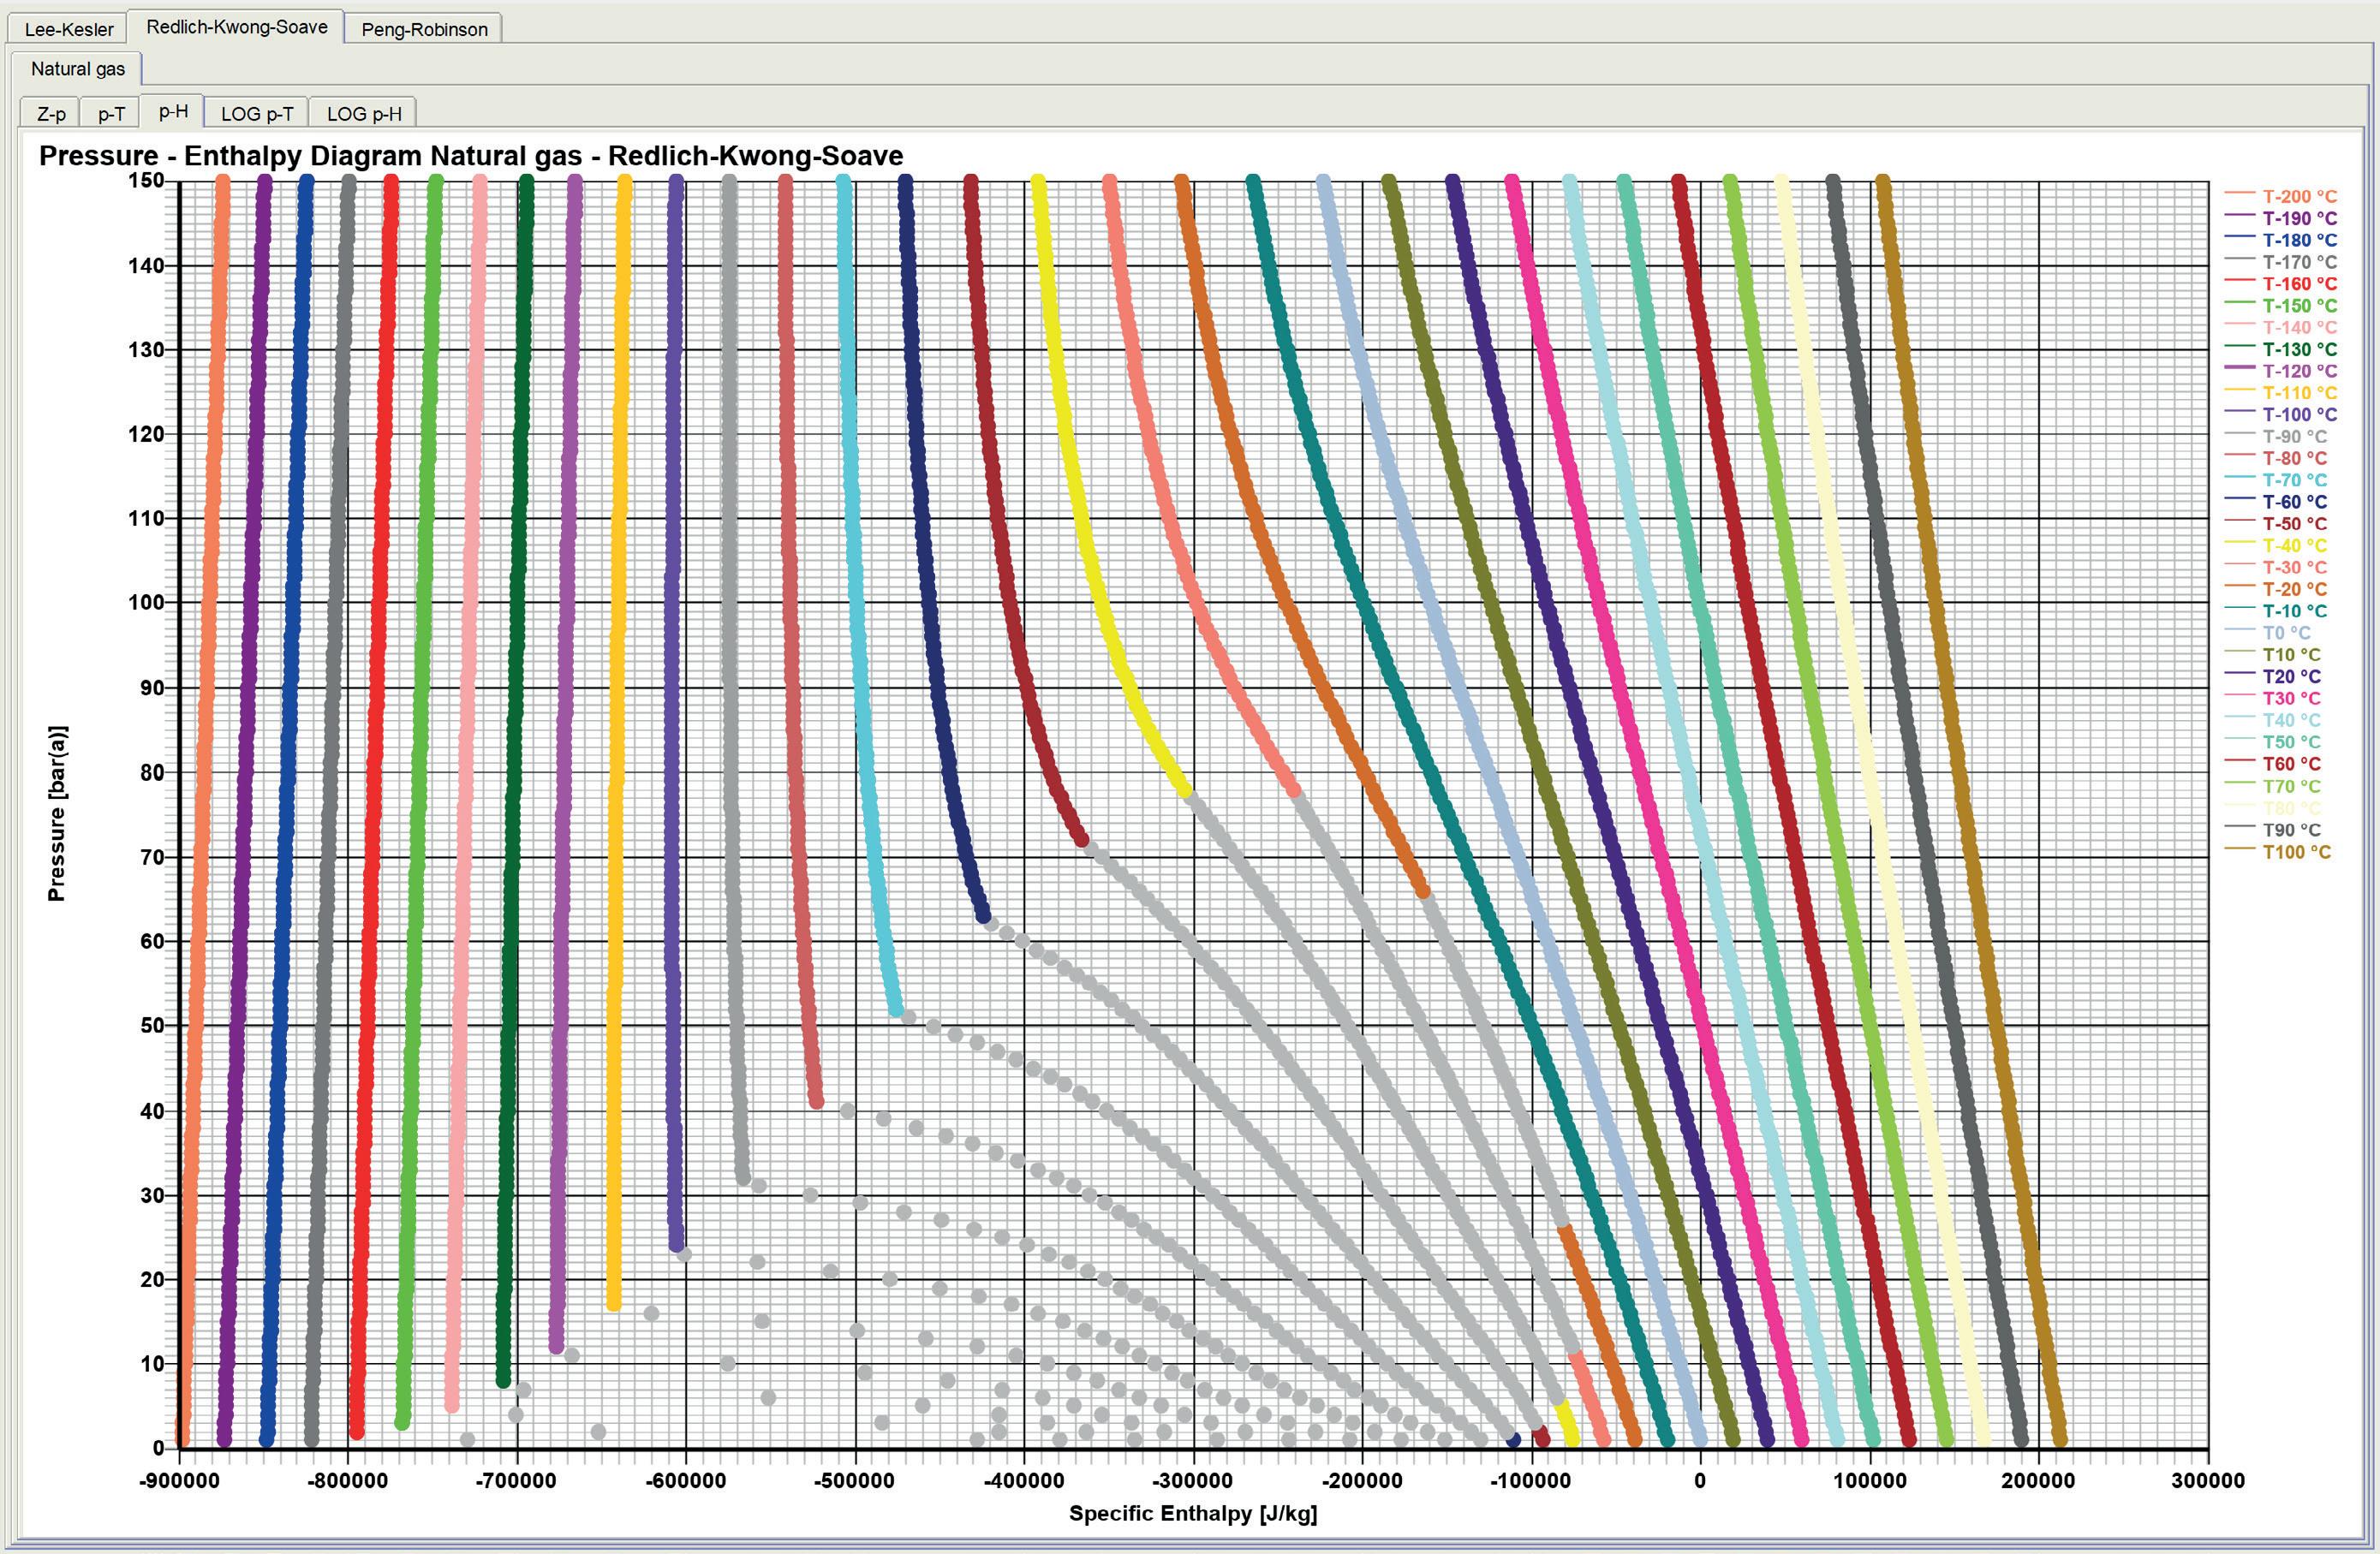
Note
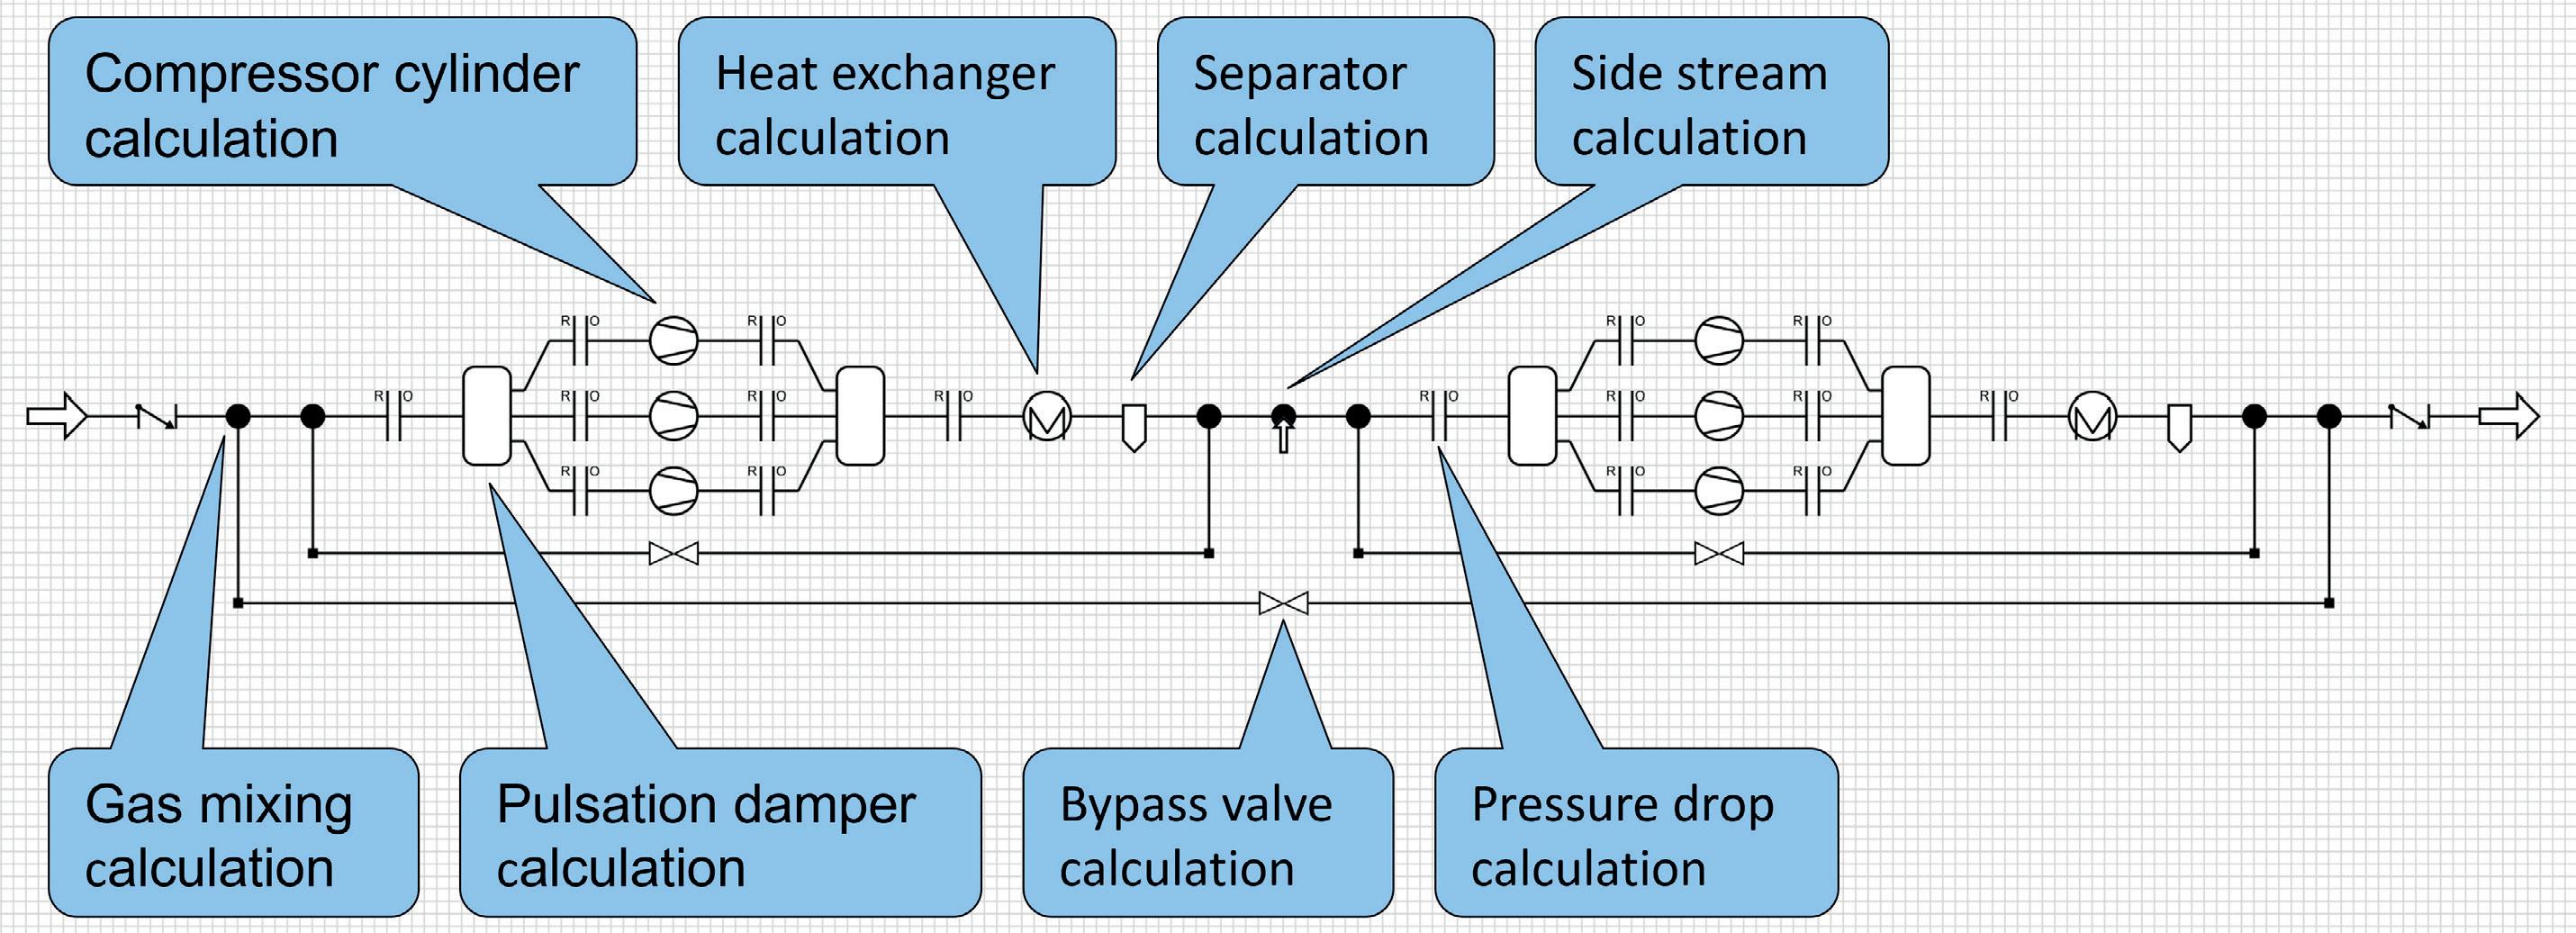
May 2023 HYDROCARBON ENGINEERING 32
• All images are NEUMAN & ESSER’s own.
Figure 3. Necessary calculation models of the respective plant components.
Figure 4. Iterative Newton solution process in the program.
Figure 5. P-h diagram of natural gas with vapour liquid area.
Application software solutions called ‘control applications’ (or just ‘controllers’) can drive, protect and sequence entire power recovery trains (PRTs).

In a PRT’s integrated control system, speed, performance, expander and antisurge control applications run continuously to coordinate the control of the expander inlet and bypass valves in order to maintain the proper flow and pressure for a catalyst regeneration process. Excess energy developed by the system is applied to an electrical grid by way of a hot gas expander and generator.
Preliminaries
The method of calculating the mass flow rate in a pipe, W1, is typically governed by the relationship in equation 1:
W1 = CW . √([∆P o . Pfe]/Tfe ) (1)
Where:
n CW is the mass flow scaling coefficient.
n ∆P o is the differential pressure from the flow measuring device (in kPa for SI units, in WC for English units).
n Pfe is the pressure at the flow element in absolute units (kPaa for SI units, psia for English units).
n Tfe is the temperature at the flow element in absolute units (°K for SI units, °R for English units).
The generated frequency of an alternating current (AC) generator is typically governed by equation 2:
f = (N . P)/120 (2)
Where:
n f is the frequency generated in Hz.
n N is the generator’s speed in rpm.
n P is the number of magnetic poles.
Components of a PRT include the following:
n A hot gas expander (TK-50).
n An axial air blower (K-50).
n A steam turbine (ST) (TK-50A).
n A two-pole synchronous generator.
n A speed controller (SC-501).
n A steam flow controller (PRT-03).
n A performance air flow controller (FC-050) for the axial air blower.
Nabil Abu-Khader, Compressor Controls Corp. (CCC), UAE, presents a number of operation scenarios for power recovery trains (PRTs).
May 2023 HYDROCARBON ENGINEERING 33
n An antisurge controller (UC-051), which positions the blow-off valve.
n A performance bypass controller (PDC-070B), which controls the bypass valve (PV-070) to assist the inlet valve controller in maintaining the proper delta-pressure between the reactor and regenerator.
Operation scenarios of a PRT for a fluidised bed catalytic cracking unit (FCCU)
Train start-up
PRT start-ups using an ST are performed using the speed control application’s automatic start-up and warm-up
sequences, avoiding critical speed ranges. This ramps up the turbine to the synchronous speed with the breaker open and no load. During this time, the expander control applications perform the following actions:
n The steam flow control application (which will control the turbine governor valve after the breaker is closed) tracks the output of the speed control application.
n The expander inlet valve control application holds the inlet valve closed, or at its configured start-up position.
n The expander bypass valve control application modulates the bypass valve to control the main process variable (delta pressure between the reactor and regenerator).
Once the ‘Reset’ command is asserted, and after meeting all start conditions, the speed controller will transfer to the ‘ready’ state. Once the ‘start’ command is asserted, the ST will start the PRT. Using the automatic turbine start-up sequence, the speed of the turbine will begin increasing to the synchronous speed of 3600 rpm. Since N = 3600 rpm and P = 2, then f = 60 Hz as per equation 2.
Closing the generator breaker and motoring mode
For the synchronisation of the generator with the electrical grid, an external auto synchronisation device is required to equalise the voltage, frequency, and phase angle prior to closing of the breaker.
When the breaker is closed to connect the generator to the electrical grid, the steam flow control application typically steps the governor valve open by a configurable amount to immediately place some load on the generator. Control of the turbine governor valve then switches from the speed to the steam flow control application, which maintains the flow of steam to the turbine blades. The air blower is also loaded to begin supplying compressed air to the reactor and regenerator. The performance control application controls the mass air flow to the air blower by modulating the inlet guide vanes (IGVs). The antisurge control application modulates the blow-off valve as necessary to protect the air blower from surge.
Once the turbine speed is within ±15 rpm of 3600 rpm, the generator breaker can be closed. As shown in Figure 1, closing the breaker will initiate the following actions:
n The steam flow controller (PRT-03) will begin controlling the turbine at 20 tph. It passes its output to the turbine governor valve through the speed controller (SC-501) using the ‘Remote Out’ functionality.

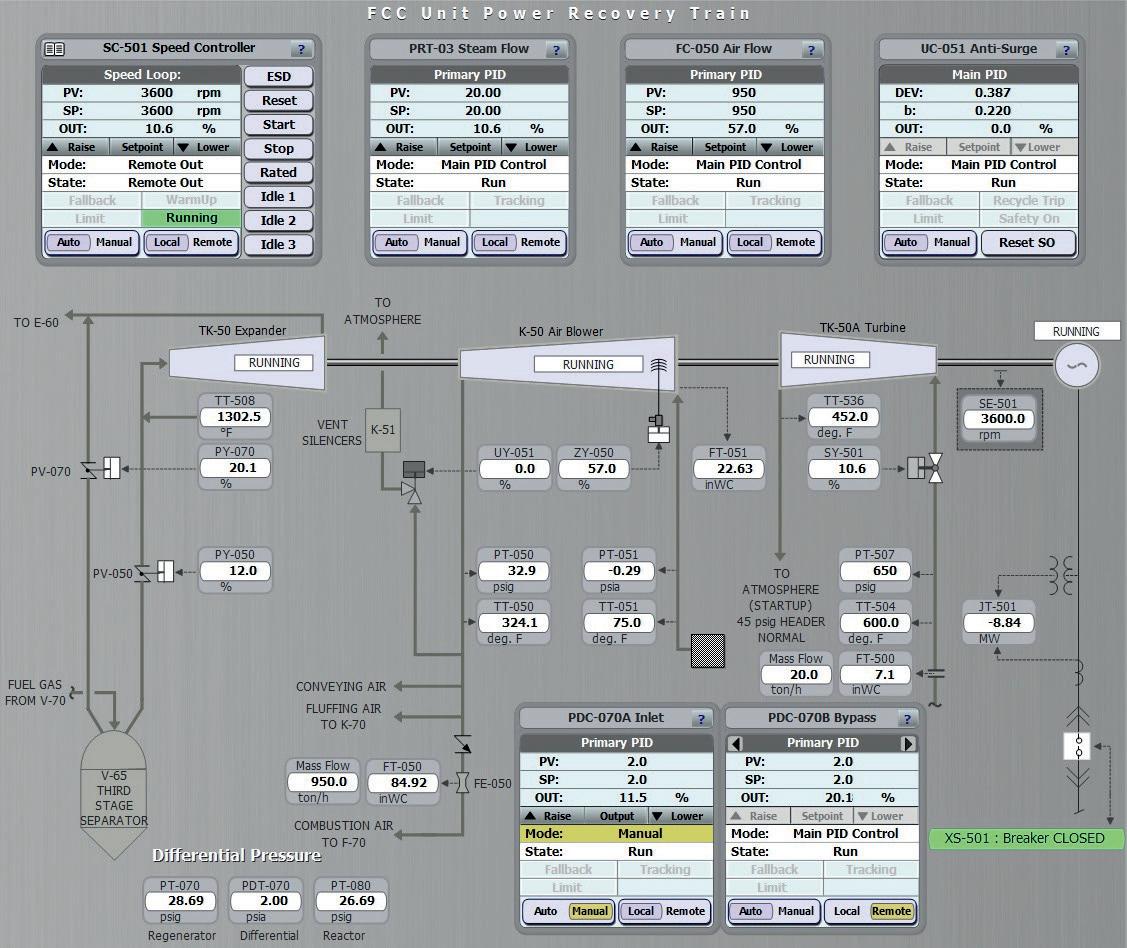
§ CW= 5.4, ∆Po = 7.1 in WC = 1.7667 Kpa, Pfe = 650 psig = 664.7 psia = 4582.9 Kpaa, and Tfe = 600 °F = 588.7 °K, then W1 = 20 tph as per equation 1.
n The speed controller (SC-501) will begin tracking the steam flow controller (PRT-03).
n The air flow controller (FC-050) will start up with a set point (SP) target of 950 tph, and its output will start ramping open the air blower IGVs.
May 2023 HYDROCARBON ENGINEERING 34
Figure 1. Motoring mode. Importing power is -8.84 MW.
Figure 2. Generating mode. Exporting power is 5.11 MW.
§ CW = 238, ∆Po = 84.92 in WC = 21.12 Kpa, P_fe = 32.9 psig = 47.6 psia = 328.48 Kpaa, and Tfe = 324.1 °F = 435.4 °K, then W1 = 950 tph as per equation 1. n The antisurge controller (UC-051) will begin ramping the blow-off valve closed.
Expander loading and generating mode

Once the air flow controller (FC-050) has reached its SP of 950 tph, the expander inlet controller (PDC-070A) can be switched to automatic with a delta-pressure SP of 2 psig between the reactor and regenerator. The expander inlet valve (PV-050) will start to open, and the bypass valve (PV-070) will start to close in order to maintain the pressure differential at 2 psig.
As shown in Figure 2, when the expander inlet controller is switched to automatic, the PRT will exit the motoring mode and begin the generating mode. At this point, ‘sufficient’ air flow is being supplied to the catalyst regenerator and the system is generating 5.11 MW of delivered power.
A forced motoring control feature prevents frequent switching between motoring and generation modes when the recovered and required powers are nearly equal.
Delivering more power
If more power is required, then the mass flow SP for the steam flow controller (PRT-03) can be increased. Frequency is maintained by the grid at 60 Hz.
This ST can produce more power than is required to drive the train. Therefore, in order to maximise power recovery, it is desirable to export power to the grid with the help of the ST.
Delivering less power
If less power is required, then closing the expander inlet valve (PV-050) will open the bypass valve (PV-070), which reduces the power to the grid. Frequency is maintained by the grid at 60 Hz.
Breaker trip while generating power with loadshedding algorithm enabled
If the electrical breaker trips during normal operation, the PRT control system will react quickly to either shed the excess power (to reduce the load on the train) if the PRT was generating power, or begin producing enough power to continue driving the train if the generator was motoring. The system will also begin controlling the speed of the train, which is no longer fixed by the grid frequency.
Let us return to the situation where the PRT was generating 5.11 MW (see the ‘expander loading and generating mode’ section of this article). As shown in Figure 3, during stable operation, if the breaker trips (red trend) then the expander inlet controller steps its valve (PV-050) down from 70% to around 21% (yellow trend), and the expander bypass controller steps its valve (PV-070) open from a nearly closed position (1%) to around 8% (green trend).
The speed of the turbine initially increases from 3600 rpm to around 3730 rpm (light blue trend), then begins to decrease. It was also noted that the expander inlet controller (PDC-070A) switched to its alternate PID loop (speed PID control) when the breaker tripped, and the speed controller started controlling the speed of the turbine by manipulating
Optimized Gas Treating, Inc 212 Cimarron Park Loop, Buda, TX 78610 www.ogtrt.com +1 512 312 9424 Contact us for a free trial SulphurPro® The ULTIMATE in Sulphur Plant Simulation
Based on Chemistry & Engineering Science
Native Sulphur
the inlet valve to the expander. Note that the turbine governor valve (SY-501) froze at 10.6% (orange trend). The coordinated step actions of the expander inlet and bypass controllers (to shred excess power) have kept the speed of the turbine below the over speed trip (OST) level of 3800 rpm, and have maintained an adequate delta pressure between the reactor and regenerator.
Re-synching
The speed of the turbine changed during the breaker trip, creating a situation where the speed of the expander and the turbine were out of sync. By initiating the ‘re-sync’ command, the steam flow controller (PRT-03) will be idle, the inlet controller (PDC-070A) will switch to manual, and the speed controller (SC-501) will begin controlling the speed of the turbine. If necessary, the speed controller SP can be manually set back to 3600 rpm to match the grid frequency of 60 Hz. Once the turbine speed is within ±5 rpm of 3600 rpm, the generator breaker can be closed again. Switching the
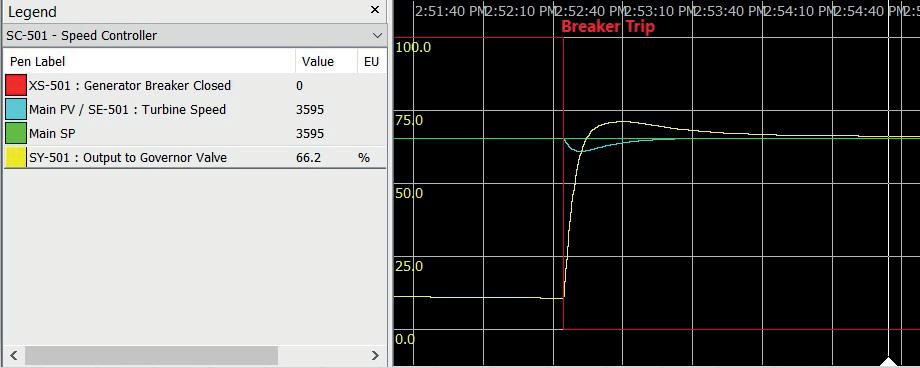
expander inlet controller back to automatic with a delta pressure SP of 2 psig between the reactor and regenerator will slowly re-establish the power generation of 5.11 MW, as was shown before.
Breaker trip while generating power with loadshedding algorithm disabled
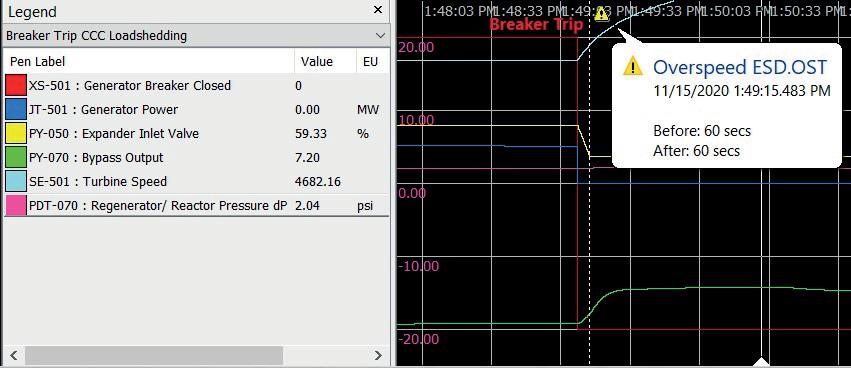
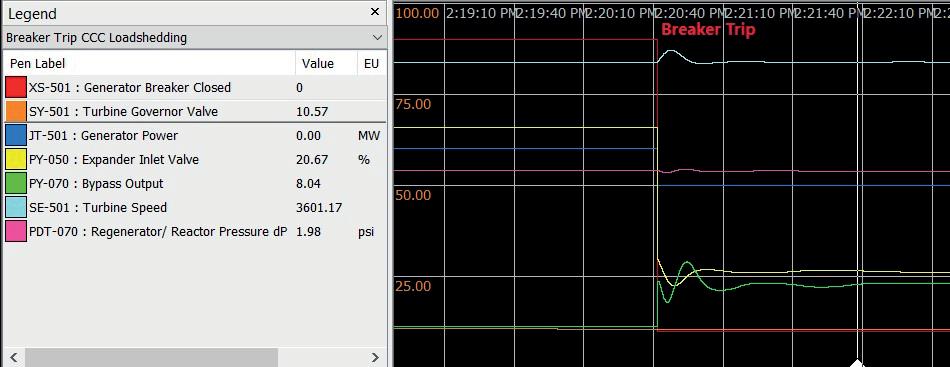
During stable operation, which is the moment in which the breaker trips with the loadshedding algorithm disabled, the speed of the turbine increases rapidly. The PID control loops within the expander inlet and bypass controllers react independently, trying to control the situation. As shown in Figure 4, the inlet controller reduces its output (yellow trend) while the bypass controller increases its output (green trend). However, the PID actions of these controllers were not enough to prevent the speed of the turbine from reaching the OST limit of 3800 rpm, triggering an emergency shutdown (ESD) for the ST.
Breaker trip while in motoring mode
Let us return to the situation where the PRT was running in motoring mode (see the ‘closing the generator breaker and motoring mode’ section). As shown in Figure 5, if the breaker trips (red trend) while the generator is motoring, the PRT control system quickly steps the turbine governor valve (SY-501) open from 10.6% to 66.2% (yellow trend) in order to produce more power and continue driving the PRT.
Train shutdown
A normal shutdown can be initiated by asserting the ‘stop’ command. The expander inlet valve (PV-050) will begin to close at a configured rate, and the expander bypass valve (PV-070) will begin controlling the process variable. The train will shut down gradually as per the configured shutdown sequence. If an ESD is triggered, the output of the speed controller (SC-501), the steam flow controller (PRT-03), the air flow controller (FC-050), the inlet controller (PDC-070A), and the bypass controller (PDC-070B) drop to zero, and the antisurge controller (UC-051) fully opens the blow-off valve.
Conclusion
This article has demonstrated that an integrated control system can safely run a PRT by utilising the loadshedding algorithm in case of a breaker trip. The control system also maintains a proper flow and pressure for a catalyst regeneration process under different conditions. Synchronising actions among different controllers is essential to maintaining grid stability. Other advanced control features, such as loop decoupling, also play a crucial role to eliminate cyclic interactions between different controller applications.
References
1. UM6413 and UM5525 Reference Manuals, Compressor Controls Corp., (March 2019).
May 2023 HYDROCARBON ENGINEERING 36
2. ABU-KHADER, N., 'Process Recovery Train Controls', Turbomachinery International Magazine, (Nov/Dec 2021).
Figure 3. System response for a breaker trip while loadshedding algorithm is enabled.
Figure 4. System response for a breaker trip while loadshedding algorithm is disabled.
Figure 5. System response for a breaker trip while in motoring mode.
The energy transition is one of the defining movements that will shape the future of the oil and gas industry. As oil and gas companies seek out alternative fuel sources to power their operations, they simultaneously need to keep in mind the impact this energy will have in the immediate term. Will they improve or hurt profitability? How viable are these fuel sources for their current customer base?
Through this lens, the appeal of LNG as a transition fuel has become abundantly clear. LNG provides a cleaner option than traditional fossil fuels in the near-term as businesses look to move their operations to renewable sources over the next several decades. However, with this interest comes additional scrutiny of LNG terminals, driving the need for efficiency and sustainability improvements in both new and existing infrastructure.
Regulatory bodies are also pushing for optimal use of LNG infrastructure, which has led to an increase in regulated or negotiated third party access (TPA). And as more participants enter the market, it is no longer sustainable to manage terminal operations, contractual obligations and commercial services with spreadsheets.
As interest in TPA has grown, so has the need for operators to have a software solution that supports flexible contract management, robust planning and scheduling and more, in order to help drive the increase in LNG for the energy transition.
LNG as a global commodity
Tales of LNG’s growing impact emerge every day – in fact, the US Department of Energy recently shared that the US vastly exceeded its 2021 export totals in 2022, despite the country’s second largest LNG exporter experiencing an unexpected six month shutdown.1 There are a number of factors driving this change, from geopolitics and energy security policies to investment in hydrocarbon production and distribution infrastructure.
LNG terminals must be able to keep up with these rapidly changing market factors and considerations –especially import terminals, as they keep searching for new revenue streams, which include commercial marine services and small-scale LNG services. But investors are wary of over-investing in the midst of an energy transition, as these terminals are expected to be ‘renewable-ready.’

May 2023 HYDROCARBON ENGINEERING 37
Magnus Ulseth, Quorum Software, explains how cloud-based software can help LNG fulfil its potential as a transition fuel.
This is why LNG software solutions must be designed and leveraged to manage the energy transition – not just on a global scale, but unique to the needs of each region.
Region-specific LNG software needs
Whilst LNG’s value is apparent on a global scale, the needs of individual regions vary greatly, and software must be agile enough to address these differences.
Take Europe, for instance. Historically, Russia has been responsible for 40 – 50% of European consumption of natural gas, according to the European Commission. As supply from Russia disappears, however, countries are scrambling to charter floating storage regasification units (FSRUs) and buy LNG on the spot market. Meanwhile, Europe is hyper-focused on accelerating the energy transition, with a spotlight on renewable electricity and hydrogen economies of scale, so countries in this region have been known to be hesitant to sign long-term LNG purchase contracts.
Given these goals, European operators would rely on software exclusively for LNG import terminals, which would need to be secure and auditable, ensure fair implementation of TPA regulations, provide integrations to transmission system operators (TSOs) for gas nomination, and be renewable-ready (to support the transition). However, in the US, it is a different story.
The US has the product and supply to meet the growing demand for LNG, and is therefore heavily export-focused. Meanwhile, the Inflation Reduction Act incentives for clean energy have caused those in the industry to prioritise the expansion of existing terminals, as new projects could take three to four years to develop.
A software solution to support LNG export terminals would need to help tolling and merchant-based LNG terminals to optimise production and cargo schedules, handle nomination and change requests, and manage carbon capture, utilisaton and storage (CCUS), as well as documentation on carbon footprints as the demand for LNG increases.
It is crucial to choose a software solution that is able to meet the specific regional needs of an operation, especially as interest in becoming carbon-neutral grows.
Carbon-neutral LNG
One crucial consideration to receive financial backing for new export terminal infrastructure projects is lowering the carbon footprint of cargoes, with carbon-neutrality as the ultimate goal. However, the term ‘carbon-neutral’ lacks a uniform definition, which can vary from well-to-tank and well-to-grid to full life cycle.
To ensure emissions transparency and reduction, a new framework was introduced by the International Group of Liquefied Natural Gas Importers (GIIGNL) in 2021 for monitoring, reporting and verification related to LNG. The framework includes collecting and calculating data points in a full life cycle approach (from Scope 1 and 2 to a reasonable estimation of Scope 3 emissions), tracking operational and logistical activities, and a new set of carbon documents that must follow each LNG cargo in the same way as traditional carbon documents.
With these additional requirements comes even more challenges that an LNG software solution must address. Software must be able to handle increased commercial complexity, factor in physical splits into smaller deliveries, and monitor emissions from upstream activities (which have a major impact on the overall carbon footprint of LNG). An LNG cargo that leaves an export terminal can also transition through various commercial transactions, further complicating the measurement process.
LNG’s value in the energy transition
At the end of the day, the single most important role for LNG to play in the energy transition is in the shift from coal and oil toward LNG and natural gas. In fact, EQT’s Toby Rice estimates that natural gas could replace one-third of the world’s coal by 2030 if unleashed properly.2
It is easy to understand why LNG is so important. It is the cleanest fossil fuel available that can be transported across the globe, and unlike electricity, it can be stored in significant quantities, making it a stronger alternative to balance cost and the environmental impact of power system balancing. However, although many LNG terminals are built to accelerate the replacement of coal and oil, the countries in which they are established typically struggle with environmental concerns, growing populations and energy poverty.
This challenge necessitates finding the ‘optimal fuel mix.’ Rather than simply importing as much LNG as possible, operators must balance energy security, fuel prices and environmental impact. And to enable this balancing act, software solutions must support commodity management and help manage the various reagents and byproducts from the combustion process.
LNG is the most realistic transition fuel to play a significant role in the energy transition, but it does not come without its challenges. The increasingly complex commercial factors and public scrutiny associated with LNG require a robust, auditable and flexible software solution to help support the fuel’s growth.
It all starts by bringing all business processes together into a single cloud-based, integrated system. This includes production management, transportation and cargo management to minimise the need for third-party cargoes, sales and revenue, pipeline management, and more. Managing the entire LNG life cycle in a single platform provides oil and gas companies with a comprehensive data set to avoid siloed decision making, which also improves auditability and security compliance as all information is in a single location.
The future of the energy transition relies heavily on LNG – and proper data management can help companies reach their full potential by ensuring facilities are operating at peak efficiency to support today’s energy security concerns, all while providing support for long-term low-emission strategies.
References
1. STEWART, R., ‘Led by Louisiana, US LNG export output soared in 2022’, The Advocate, (22 February 2023), https://www. theadvocate.com/baton_rouge/news/business/led-by-louisianaus-lng-export-output-soared-in-2022/article_5ce060f0-af0f-11ed8173-c324aedeb54c.html
2. RICE, T. Z., ‘Unleashing U.S. LNG’, EQT Corp., https://www.eqt.com/ wp-content/uploads/2022/03/LNG_Final.pdf
May 2023 HYDROCARBON ENGINEERING 38
Part one of this article, which featured in the February 2023 issue of Hydrocarbon Engineering, examined factors that make some simulators more reliable than others. It also explained how detailed a simulator should be; how to choose the right simulator for the task at hand; how simulators should be benchmarked; and what comprises benchmarking data.1
The case studies presented in this article feature a range of treating applications, namely treating gas typical of a refinery; the effect of heat stable salts (HSSs) and

May 2023 HYDROCARBON ENGINEERING 39
As a follow-up to part one of this article, Prashanth Chandran, Nathan Hatcher and Ralph Weiland, Optimized Gas Treating, Inc., USA, present a series of case studies whereby simulators have been used across a range of treating applications.
tower internals on hydrogen sulfide (H2S) removal from fuel gas using MDEA; and selective H2S removal using structured packing in a tail gas treating unit (TGTU).
Hellenic Petroleum refinery revamp
This refinery, located in Thessaloniki on the Aegean Sea in far northern Greece, was the subject of a large-scale revamp. Siirtec Nigi was engaged to investigate the impact of the revamping project on the amine system
and the downstream sulfur recovery unit (SRU). The results of the study were reported at the Vienna 2014 Brimstone Sulfur Symposium, and the information provided in this article is taken from the conference proceedings. 2
As a consequence of the upgrading project, the feedstock to the amine absorbers changed. The total amount of H 2 S produced from the crude oil increased, as well as many sour gas stream flow rates.
Siirtec Nigi proposed the replacement of the old monoethanolamine (MEA) solvent with methyldiethanolamine (MDEA) in the refinery amine system, and the implementation of an oxygen-enriched Claus process for the SRU. In 2012, the refinery completed the first part of the amine system revamp. The overall comparison between the actual plant performance and the expected plant behaviour based on the process simulation results presented in the Brimstone paper is of interest here.
To provide context, the revamp project consisted of increasing the refinery crude processing capacity from 70 000 bpsd to 100 000 bpsd. Consequently, the amine treating system and the downstream SRU capacities had to be increased, too. In addition to this, as part of the project, the crude types and blends were changed and the refining operations modified. As a result, the gas and liquid streams to be treated in the amine absorbers changed in composition (mainly the H 2 S concentration). This led to significant modification of the amine system configuration.
The feeds to the amine scrubbers after revamping are shown in Table 1, together with the solvent flows and the types of tower internals. Towers T-170 and T-1902 are both high-pressure columns; the others are low-pressure. There is also a mix of trayed and packed absorbers, with T-407 having been repacked with Pall Rings as part of the revamp. What is important here is the fact that field data is available against which to benchmark the simulator.
With the exception of T-170 for which no performance data is available, the simulator matches the field data quite well. It must be pointed out that the simulations were not adjusted to match the data; the simulations are pure out-of-the-box predictions.
Conclusion 9
Continuing the numbering of conclusions from part one of this article 1 , the mass transfer rate-based simulations predict the performance data quite well. Because this is actual measured data, one can have considerable confidence in the validation.
Treating a refinery fuel gas
This case study involves H 2 S removal in one of two fuel gas treaters in a refinery on the west coast of the US. To take advantage of the lower regeneration energy required by MDEA, the refinery had switched out the DEA solvent to 38 wt% generic MDEA. At the same time, trays were replaced with packing in both treaters. The treater of interest here was 2.5 ft dia., and its
May 2023 HYDROCARBON ENGINEERING 40
Scrubber T-407 T-170 T-410 T-1902 Internals Pall rings Trays Packing Trays Gas conditions Temperature (°C) 46 43 43 49 Pressure (kg/cm2g) 18.6 42 4.1 53 Mass flow (kg/hr) 1036 6700 3119 8458 Composition (mol%) Hydrogen 71.8 68.7 51.2 88.2 Methane 14.4 22.5 16.5 6.3 Ethane 7.6 4.8 8.3 1.4 Propane 2.5 1.7 5.8 0.6 n-butane 0.4 0 3.5 0.3 i-butane 0.1 0.5 1.0 0 n-pentane 0.2 0 2.1 0 i-pentane 0.1 0.2 1.2 0 C6+ 0.6 0.2 2.5 0.3 H2S 1.9 1.2 6.1 2.6 Water 0.5 0.2 1.8 0.3 Solvent Flow rate (m3/hr) 6 8 8 10 Treated gas Measured H2S (ppmv) 25 N/A 70 10 ProTreat H2S (ppmv) 26 8 60 8 Table
MDEA (wt%) 38 CO2 (loading) 0.00014 H2S (loading) 0.0009 Acetate (ppmw) 2580 Formate (ppmw) 14 305 Sulfate (ppmw) 230 Thiocyanate (ppmw) 3225 Chloride (ppmw) 1675
Table 1. Amine treater performance data
2. Fuel gas treater: solvent analysis
Ariel Ultra-Low Emissions
Packing with BTUU
Field-proven success has made our solid ring technology standard in all new units and upgrades. Join the thousands of compressors already operating sustainably at less than .75 scfm per throw.

Find out more at arielcorp.com/ultra-low
original 17 valve trays were replaced with 25 ft of rings. The gas to the treater was 0.2 mol% carbon dioxide (CO 2 ) and 0.5 mol% H 2 S at 200 psig, with the balance two-thirds hydrogen with 17% methane, and minor amounts of C1 – C5 hydrocarbons.
Performance after the revamp was disappointing. Despite the low, acid gas, lean loadings (0.0009 for H 2 S and 0.008 for CO 2 ), the H 2 S leak from the absorber was measured at 26 ppmv, whereas a value closer to 3 or 4 ppmv was expected. Simulation indicated that the H 2 S in the treated gas should have been less than 1 ppmv, in disagreement with actual measured data. A consultant tasked by the refiner to determine the cause for the larger-than-expected H 2 S leak suggested that the residence time on the packing was too short to achieve good treating, and he recommended the refinery return to using trays. However, after reinstalling the 17 trays, the H 2 S leak remained stubbornly at 25 – 26 ppmv. The costly shutdown and revamp back to trays produced no benefit.
As part of a new, independent investigation, Optimized Gas Treating, Inc. (OGT) ran ProTreat against the data, but this too predicted less than 1 ppmv H 2 S in the treated fuel gas. Then, OGT asked for a solvent analysis (see Table 2). When the real solvent composition was used in the simulation, the predicted H 2 S leak rose to 22 ppmv when the absorber was packed, and 26 ppmv when it was trayed. It is worth noting that the predicted H 2 S leak and the measured value from the trayed absorber are virtually identical. Incidentally, the presence of HSSs led to several percent more CO 2 slip for both trays and packing.
Without a proper solvent analysis, the wrong results are generated. Predicted treating without HSSs is very optimistic because HSSs effectively create higher acid gas vapour pressures (back pressure) in the absorber than HSS-free solvent would. Naturally, they also create higher back pressures in the regenerator and this assists solvent regeneration, hence the relatively low lean loadings, even for MDEA. But the reduced lean loadings are not enough to compensate for increased equilibrium backpressures in the absorber.
Any simulation based on ideal stages fails to reveal the existence of pinches because it treats the column as a black box – virtually an empty shell. What is inside the tower makes a huge difference to real treating
performance; 4 in. Raschig rings perform completely differently from a small or medium crimp structured packing, both perform differently from trays, and what type of tray and the physical features affect performance too. It is unrealistic to expect to be able to diagnose internals problems using ideal stage simulation (with or without efficiencies) because such simulations are blind to what is actually in the tower.
Conclusion 10
Failure to account for HSS contamination of the solvent can lead to completely erroneous simulation results and expensive but unsuccessful revamps to cure a problem whose cause lies in the solvent, not the tower internals.
Conclusion 11
A column that is lean-end pinched cannot have its performance altered by changing or modifying the internals. Pinch conditions are only revealed by mass transfer rate-based simulation which, in the present case, points unmistakably to the correct solution to poor performance – a cleaner solvent.
Conclusion 12
If a small change in a variable causes a huge change in a simulated performance parameter, a simulator may not have gone crazy, but rather it may be saying something important. Only mass transfer rate-based simulation is capable of revealing bulge pinches, for example. Such cases deserve close scrutiny.
Tail gas treating
The final case study is a Texas Gulf coast refinery’s 6 ft dia. TGTU containing 20 ft of structured packing and treating 3 million ft 3 /d of 1 psig gas containing 3.4 mol% CO 2 and 1.7 mol% H 2 S. The refinery claims that the gas to the thermal oxidiser was only 3 ppmv H 2 S until the solvent was cleaned. Treating was not successful, and the refinery’s sulfur emissions went up against the permitted limit.
The original solvent was 34 wt% MDEA (see analysis in Table 3). There were over 8000 ppmw HSSs in the solvent. After cleaning, there were virtually none.
Using the as-reported solvent analysis, ProTreat simulation predicted that the treated gas should contain 3.8 ppmv H 2 S – very close to the refinery’s claim of 3 ppmv (the H 2 S lean loading was predicted to be 0.00008). Again, this is an out-of-the-box prediction with absolutely no adjustments or fitting of any kind. This is plant performance data and is therefore a valid point of reference against which to benchmark a simulator.
Beyond stating that the treating was unsuccessful after solvent cleaning, the refinery did not provide actual data on H 2 S leakage from the TGTU. However, simulation with the HSSs removed from the solvent but with all other conditions the same predicted that there should be 80 ppmv H 2 S in the treated gas (the predicted H 2 S lean loading was now 0.009). Treating is certainly ‘unsuccessful’ compared with the
May 2023 HYDROCARBON ENGINEERING 42
Table
MDEA (wt%) 33.374 DEA (wt%) 0.338 Thiosulfate (ppmw) 5930 Oxalate (ppmw) 220 Acetate (ppmw) 1150 Formate (ppmw) 815
3. Solvent analysis: HSSs


REVOLUTIONISING SAFETY IN OIL TANK CLEANING 100% SAFETY 0% COMPROMISE SAFER • CLEANER • MORE EFFICIENT www.regenrobotics.com
HSS-contaminated solvent, and provides at least anecdotal evidence of the effect of HSSs. The HSSs can greatly reduce lean loading, which is responsible for better treating in this application. But, depending upon the specific system and operating conditions, this may not always be the case.
Conclusion 13
The performance of structured packing was very successfully simulated in a TGTU application, and the observed H 2 S leak was predicted to within better than 1 ppmv.
Conclusion 14
Modest concentrations of HSSs in an MDEA treating solvent can have quite a beneficial effect on TGTU performance.
Concluding remarks
Relevant conclusions have been scattered throughout part one and two of this article. In summary:
n Simulators cannot be validated by comparison with other simulators. Doing so assumes one of them is correct when, in fact, both may be wrong. Comparing three simulators and assuming the two closest to each other are the best ones is tantamount to taking the foolish position that correctness can be established by democratic vote.
FOREFRONT INNOVATION SERIES

n Simulators cannot be validated against ‘supplier data’. Solvent and process suppliers provide solvent and process performance guarantees. This is not data; this represents how far the supplier is willing to stick out its neck.

n Simulators can be validated only against real plant performance data measured in the field. One is not permitted to adjust or fit the simulation to the measured data and then claim an accurate prediction. Using adjustments, the best one can say is that one has achieved an accurate fit, but to call it a prediction is disingenuous.
n An achievable expectation from simulation is that one should be able to predict the performance of existing plants as measured in the field, without simulator adjustments. Experience and rules-of-thumb are valuable adjuncts to simulation, but they are not reliably predictive, especially in new circumstances. If they are needed to provide input information to the simulator then the simulation is not nearly as reliable as imagined.
References
1. CHANDRAN, P., HATCHER, N., and WEILAND, R., ‘Expectations from simulation: part one – realistic and reliable’, Hydrocarbon Engineering , (February 2023).
2. ROSSETTI, T., PEREGO, G.C., SKANDILAS, A., and LERAS, E., ‘Refinery Upgrading Project – Amine and Claus Units Revamping’, Brimstone 2 nd Vienna Sulfur Symposium, Vienna, Austria, (19 – 23 May 2014).
A new, virtual, technical series from AMPP!


Forefront Innovation Series is a new and innovative web-based series from AMPP. Filled with the latest insights and technical developments, Forefront brings together subject matter experts from a wide variety of industries and professional backgrounds to discuss hot-button materials protection and performance related technical topics. Utilizing best practices, case studies, and lessons learned, these engaging sessions will shed light on challenges faced by different industries. Top 5 reasons to attend:
• Gain insights to the New & Emerging Technologies
• Participate in Open Discussions about Future Innovations and Theories
• Engage with Subject Matter Experts to get your questions answered
• Network with peers & discuss hot-button materials protection and performance related technical topics


• Earn up to 6 Professional Development Hours per series
View our Calendar for Upcoming Events! Visit www.ampp.org/events/forefront-innovation-series

Gadi Briskman and Tom Rosenwasser, Modcon Systems Ltd, introduce a method that enables accurate prediction of the hydrocarbon dew point using machine learning (ML).

Hydrocarbon dew point (HCDP) is an essential property of natural gas. The term refers to the temperature at which the first hydrocarbons, most commonly the heaviest ones, begin to condense out of the gas phase into the liquid phase. International Standard Organisation (ISO) standards 11150: 2007 and ISO 14532: 2005 define the HCDP as the temperature above which no condensation of hydrocarbons occurs at a specified pressure. A hydrocarbon dew point curve is a graph that depicts the specific pressure and temperature at which condensation occurs.
Two main reasons lie behind the need for precise HCDP measurements. The first is safe transportation through pipelines. Hydrocarbon liquids produce the following safety risks in pipeline systems: degradation of the burner system’s performance, discharge out through the burner ports, or formation of a hydrocarbon liquid pool in the hot appliance that can reignite with an explosion. In gas serving as a fuel for gas turbines, hydrocarbon liquids can cause intense firing, with high temperatures leading to turbine blade damage.
The second reason is that if the hydrocarbon gas temperature drops below its dew point temperature, a significant loss in hydrocarbon substance may lead to the degradation of the key gas economic property: heating value. Even a small amount of liquid condensation may
May 2023 HYDROCARBON ENGINEERING 45
cause a significant decrease in heating value. For gas producers, this leads to lost revenue, as they have to supply more gas to compensate for the lost heating value.
State-of-the-art HCDP measurement methods
Several commercially-available methods adopted by the industry to obtain the desired HCDP temperature have been developed over time. Manual or automatic chilled mirror instruments are the most well-known means of obtaining the gas dew point value by taking a direct measurement. It has to be noted that instances of building a comprehensive database of dew point measurements have been quite limited. Two such projects are known to the authors, one by Aliva and the other by Statoil. The claimed uncertainty in the data reported by Aliva is ± 0.1°C. An automatic chilled mirror was used to take the measurements. Statoil R&D laboratories used a custom-built apparatus based on a chandler manual chilled mirror instrument to conduct HCDP measurements. It reported the uncertainty of HCDP of circa 0.5°C. 1
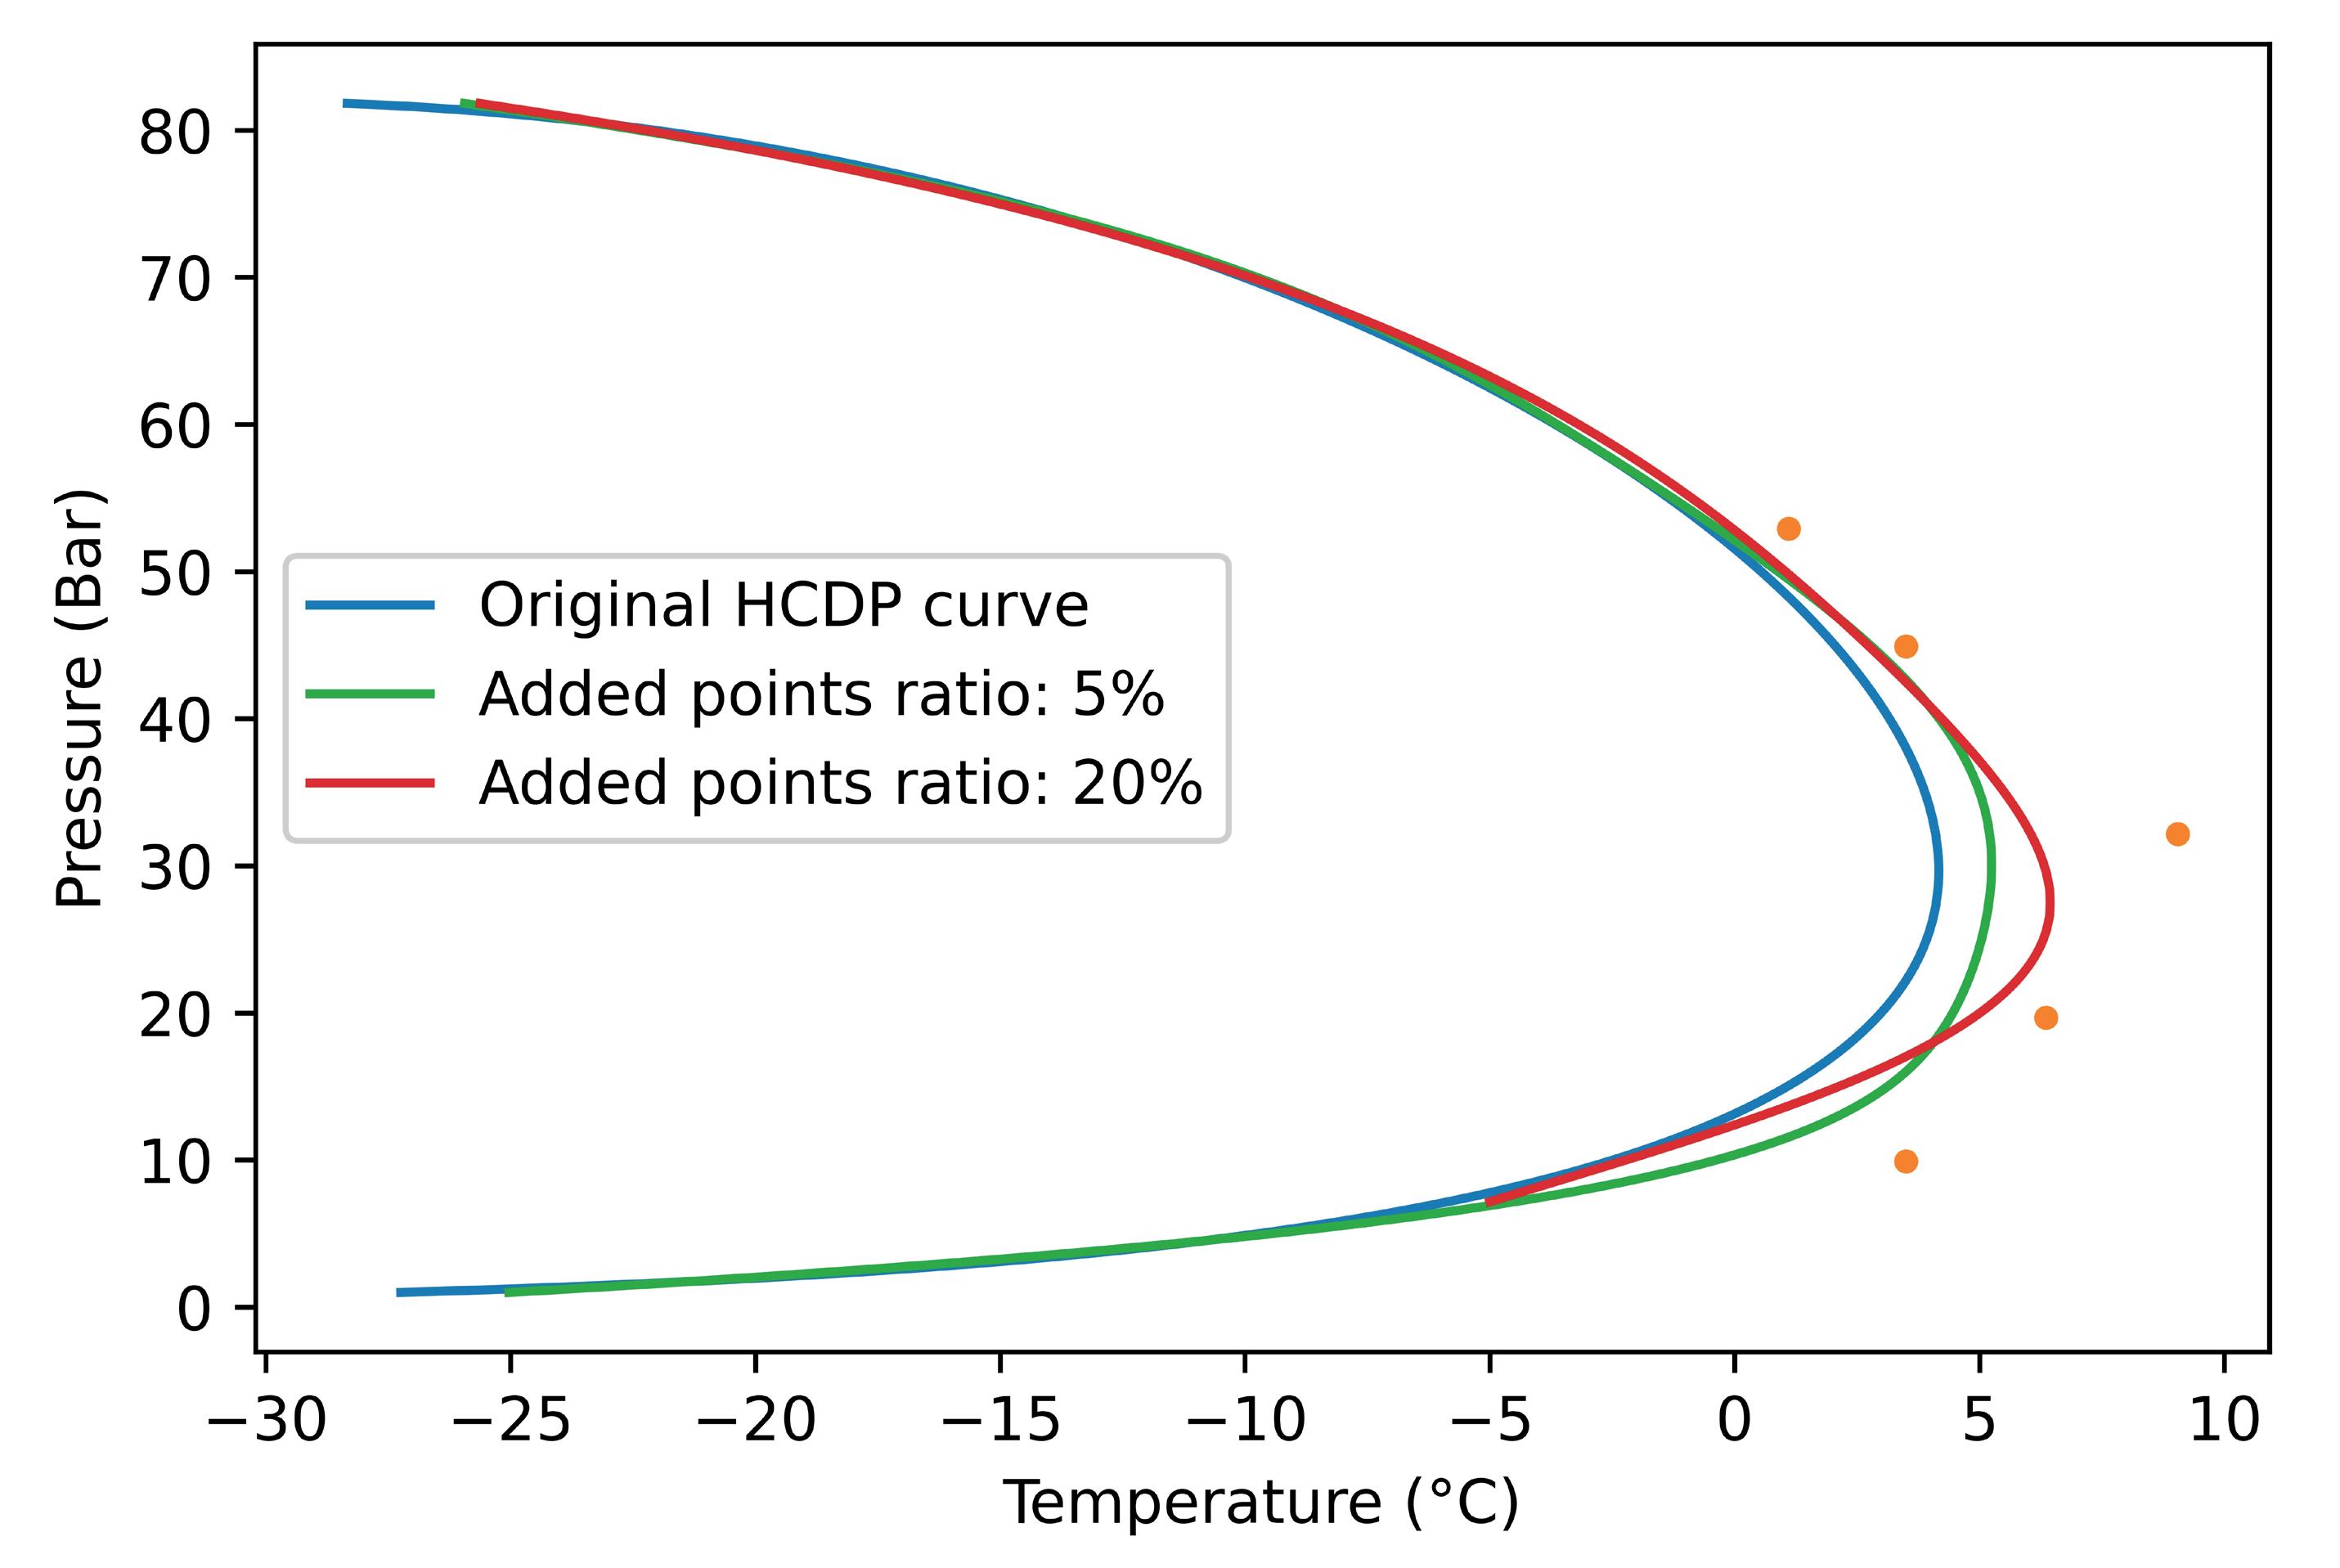
The value of using a database containing empirically measured dew point temperature for pressure and gas composition values could be viewed from two perspectives. Such a database, with a necessary interpolation between the sampled composition and pressure values, can be a precise and reliable way of dew point temperature prediction for a customer operating a facility with consistent, low variability gas compositions and a defined range of relevant pressures. This scenario applies to natural gas extracted from a particular field, for example. Another motivation to use a database is the ability to develop an improved equation of state (EoS) model, optimised for a specific range of gas compositions. Still, for most general dew point temperature measurements, relying on a directly measured set of samples may be prohibitively impractical. The reason for this is the high dimensionality of the gas composition vector, demanding many examples to allow sufficiently precise HCDP value interpolation for various compositions.
Limitations of existing HCDP calculation methods
The challenge of reconciling the dew point calculation based on an analytic EoS model with empirical data is not new. Over the years, the original cubic EoS state equation, suggested by Johannes Diderik van der Waals in 1873, was further refined. The most common recent developments of this original equation, accepted in the processing industry, are the Redlich-Kwong EoS and the Peng Robinson EoS.
These two equations are the subject of ongoing research and further refinement. Since a significant modification by Soave in 1972, more than 100 improved formulations of these EoS equations have been published. 2 This body of research is a good illustration of the industry’s continuous search for models that are capable of better describing the phase behaviour of gases in various scenarios. The general approach behind the alpha function corrections is searching for an analytical model, allowing a better fit to a set of empirical measurements.
Analytic calculation of HCDP involves searching iteratively, with respect to the EoS, for an equilibrium between the vapour pressure and the dew point pressure at the point of the infinitesimally small liquid concentration. Gas chromatography can be used to obtain the gas composition to allow for the analytic calculation. Unlike chilled mirror instruments to measure the HCDP directly, gas chromatography is an indirect method of HCDP determination. The gas composition obtained through this method, together with the sample pressure, serves as input for an analytic HCDP calculation, and presents a practical approach to HCDP calculation in a production environment.
‘ISO 23874:2006 Natural Gas - Gas chromatographic requirements for hydrocarbon dew point calculation’ prescribes the gas chromatograph (GC) performance specifications for the analysis of natural gas for the HCDP calculation using the chosen EoS. The procedure describes the measurement of hydrocarbons in the range of C5 – C12. It includes methods to infer the gas components that cannot be measured using the GC from the measured ones.
ML-based dew point calculation approach
In the author’s practical experience, this calculation may occasionally run into numeric convergence problems in marginal cases of non-typical natural gas composition, such as high carbon dioxide (CO 2 ) proportion. ML tools allow this problem to be addressed by employing a different HCDP calculation paradigm. ML uses the results of the traditional analytic calculation as a training set. A sufficiently large and diverse training set allows for the reproduction of the analytical calculation results with the desired precision. The ML approach to HCDP calculation makes it highly suitable for deployment in production environments, by replacing the iterative calculation with a pre-trained model. The ML methods allow a predictive model to be built using
May 2023 HYDROCARBON ENGINEERING 46
Figure 1. Original and improved dew point curves.

TRI-BLOCK Double Block and Bleed Valve SIL3 WWW.ZWICK-ARMATUREN.DE
the training data. The data consists of a set of pairs. The first component of the pair is a list of model parameters – gas composition in this case. The second is the desired model prediction – the dew point value for the corresponding gas composition. For HCDP ML model training, this data, known as the training set, may come from two sources: analytical solution outcomes based on an EoS equation, and the results of direct measurements.
An essential practical added value offered by the application of ML for HCDP calculation is the ability it offers a user to improve the prediction quality of the baseline model for the specific range of gas compositions and pressures of interest encountered in practice, without the burden of looking for an improved analytic model of the EoS.
By controlling the ratio between the size of the data in the training set, originating from the EoS equation, and the empirical measurements, the resulting phase curve, implemented by the ML predictive model, can be shifted closer to the analytical baseline or the direct measurements. There is no need to take more measurements to increase the ratio of the empirically measured points. Reusing the empiric measurement samples multiple times produces the same desired effect. This method is illustrated in Figure 1: by increasing the ratio of the directly measured HCDP
samples added to the training set of the ML model, the resulting dew point curve shifts closer to the group of empiric HCDP results.
Recent method implementation experience
In a project that Modcon Systems Ltd has recently implemented, the natural gas composition was measured by the GC and passed to a programmable logic controller (PLC). The corresponding sample pressure measurement was also sent to the controller. A polynomial approximation model of the dew point calculation was implemented in the PLC code. The calculated HCDP was subsequently passed from the PLC to the distributed control system (DCS). The scheme of the deployed set-up is shown in Figure 2.
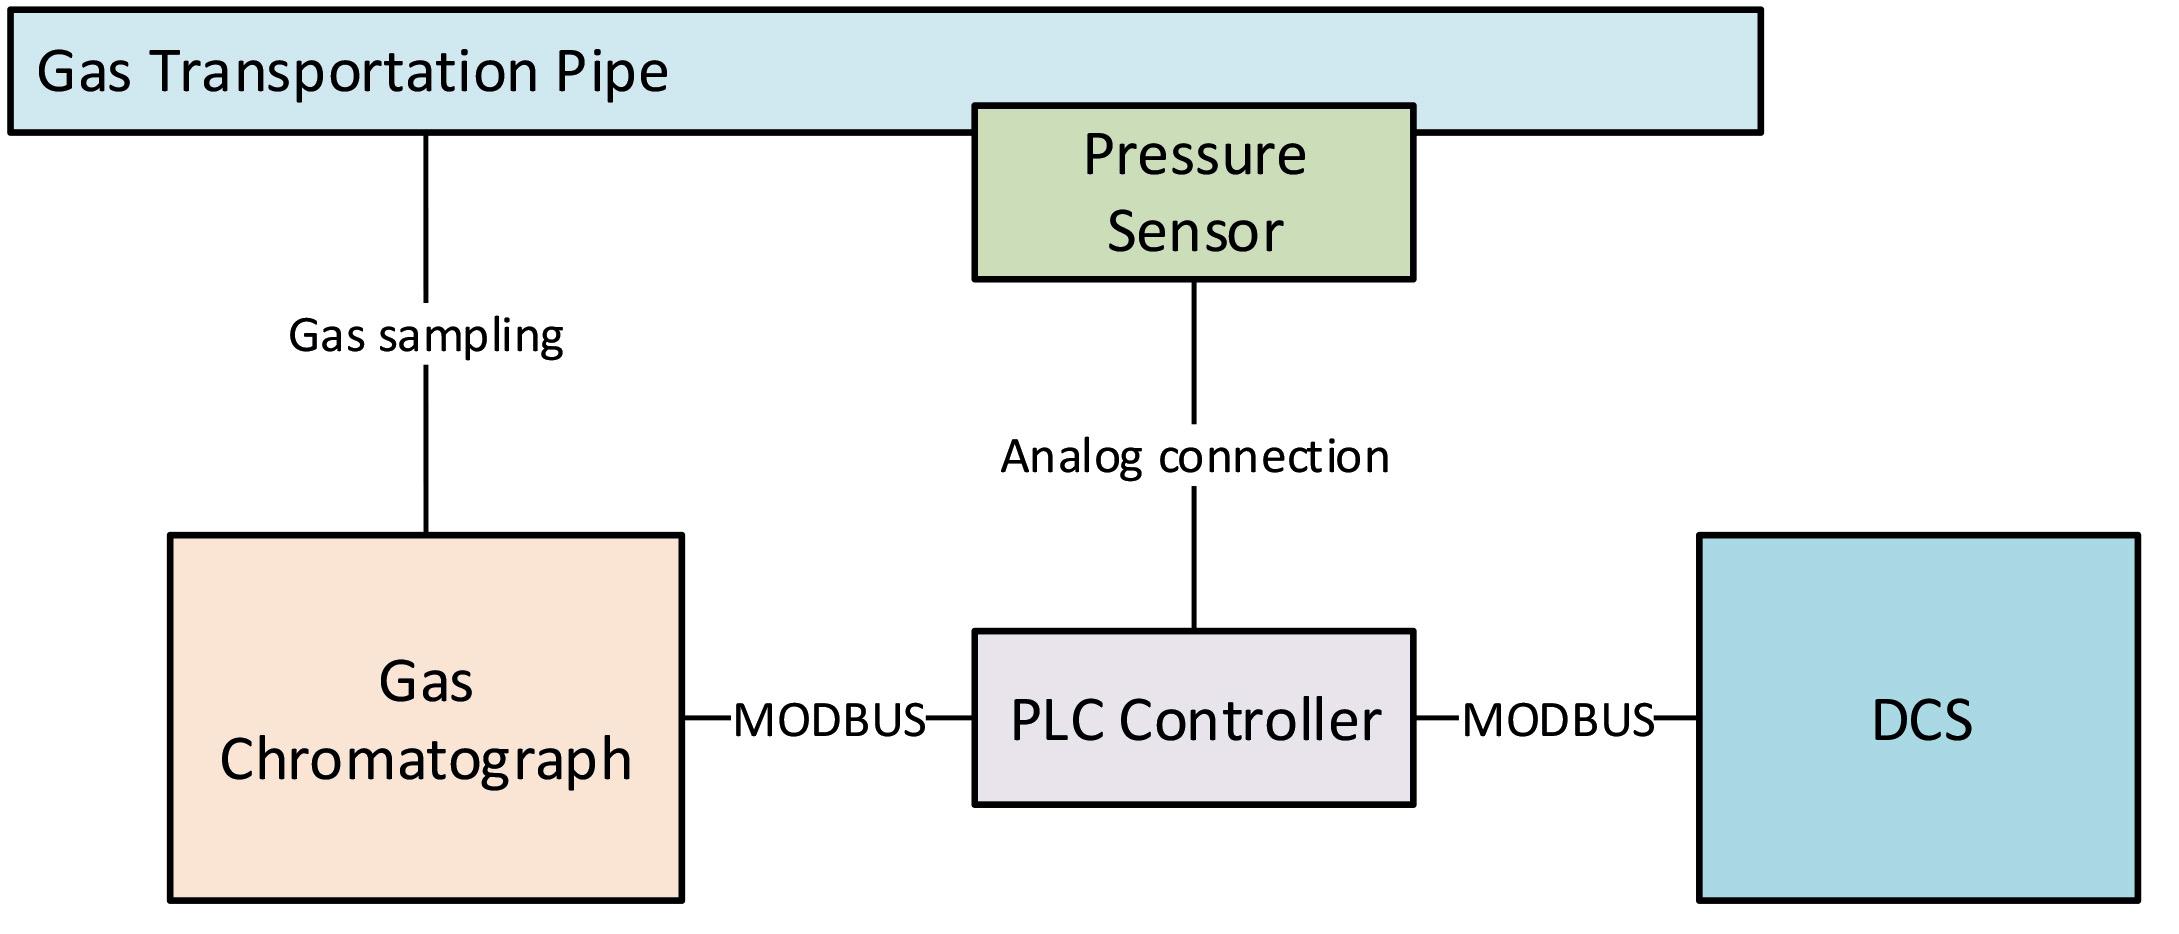
Existing GC products allow an embedded polynomial model approximation of HCDP. Its functionality, however, has limitations. The embedded model is global and normally only supports C1 – C9 components. During Modcon Systems’ research, it was discovered that limiting the approximation range of the HCDP polynomial model to the gas composition range of interest relevant to the customer improved the precision of the model by orders of magnitude in comparison to a global model. The research shows that in the HCDP calculation, even tiny ratios of various gases in the composition influence the corresponding HCDP values. While the state-of-the-art implementation supports C1 – C9, the C1 – C12 components HCDP prediction model has been successfully implemented.
Conclusion
This article has demonstrated that HCDP calculation is of significant value to the industry. One practical way to measure HCDP in production is by using a GC and subsequent analysis based on one of the standard EoS equations. By way of using an example of a recently implemented project, this article demonstrated that ML methods make the HCDP calculation more robust, by avoiding the need for iterative calculation convergence, while providing excellent precision. The polynomial approximation results for the four modelled gases are shown in Figure 3.
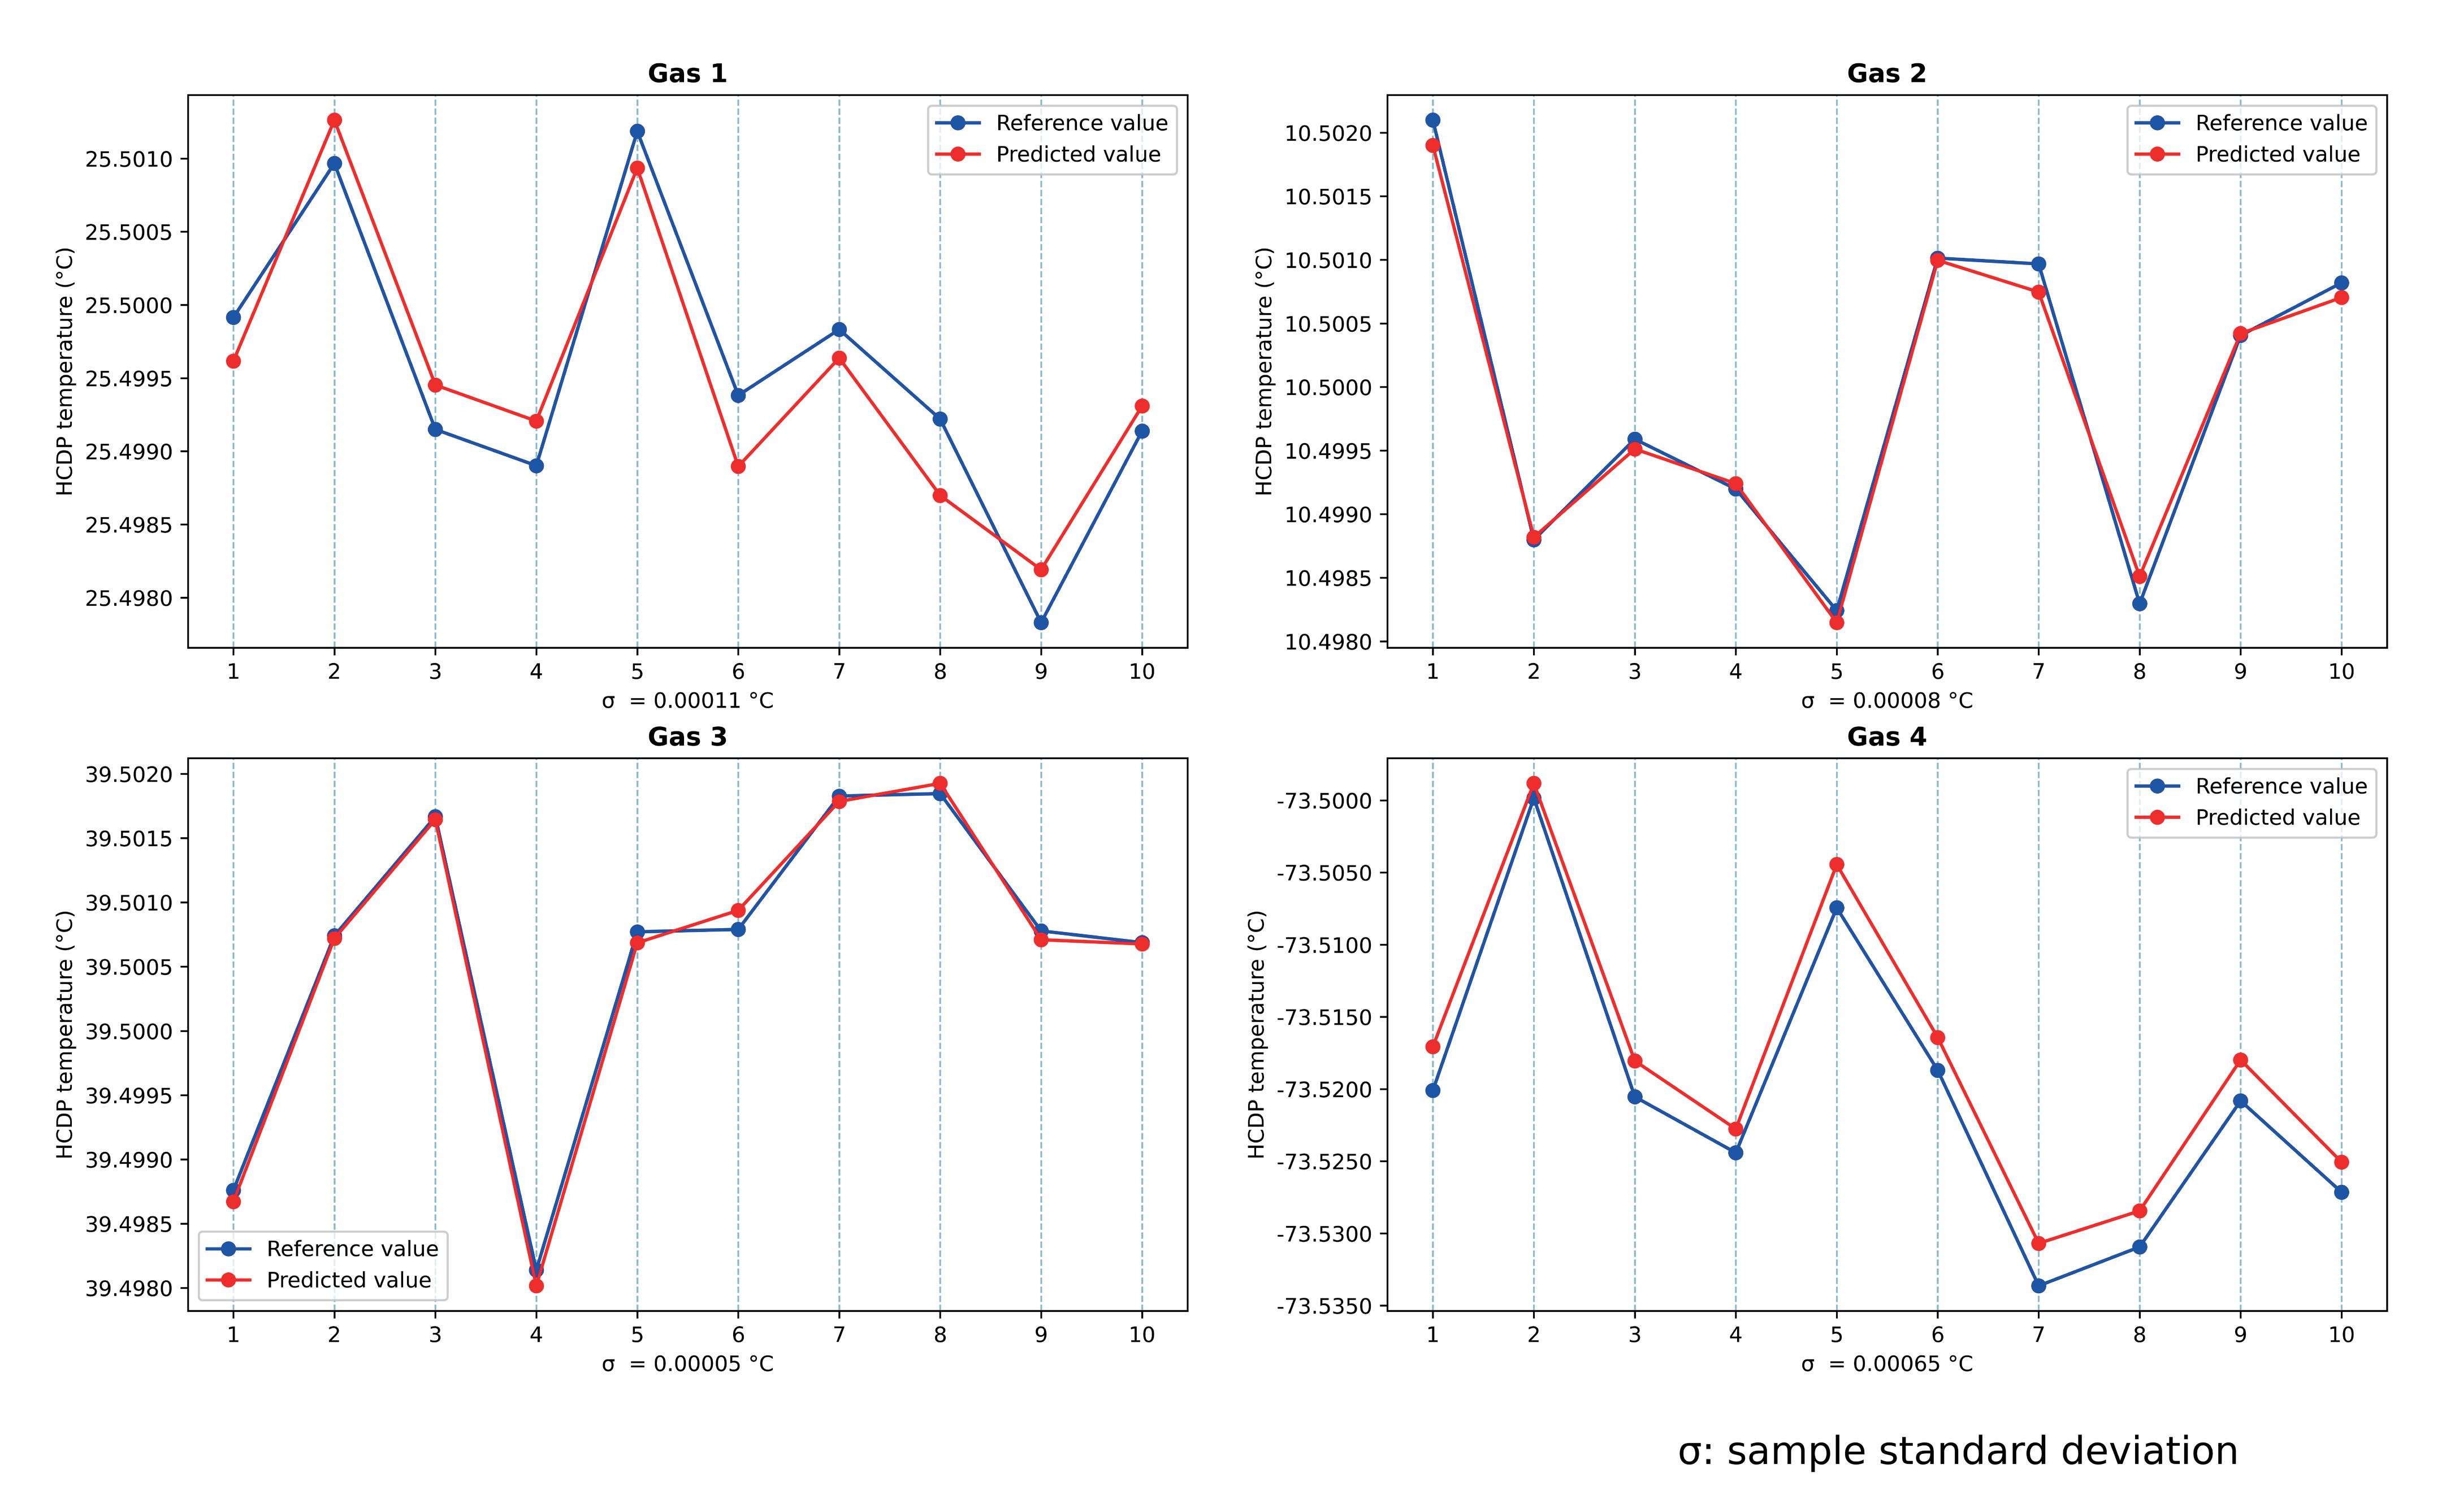
References
1. ZHANG, P., ZHOU, L., and ZENG, W., et al., ‘Hydrocarbon Dew Point Measurement and Model Evaluation of Synthetic and Real Natural Gases’, ACS Omega, 15, (5 April 2020), pp. 8463 - 8473.
2. ZHAO, W., XIA, L., CAO, X., BI, R., and XIANG, S., ‘A Modified Alpha Function for Peng-Robinson Cubic Equation of State’, Chemical Engineering Transactions, 81, (2020), pp. 547 - 552.
May 2023 HYDROCARBON ENGINEERING 48
Figure 3. DP predictions vs reference data plots.
Figure 2. Implemented solution architecture.
Reducing the emission of toxic and explosive gases is an ongoing challenge for industries that process, store or transport high volumes of potentially hazardous substances. Concerns for environmental, health and safety (EHS) compliance, as well as the prevention of production loss, drive the need for timely, reliable monitoring. Wired gas detectors provide limited coverage and limited return on leak monitoring investments. On the contrary, wireless approaches are proving to be cost-effective in extending leak detection coverage. These technologies can be applied across the various streams of the hydrocarbon value chain, e.g. at oil and gas production sites (upstream), tank storage and terminal facilities (midstream), as well as in refineries (downstream).
Improving monitoring efficiency
Only about 20% of assets produce the majority of gas leakages, but finding that 20% requires checking 100% of the assets. As few companies can afford to deploy fixed sensors on all potentially vulnerable assets, most supplement this by sending operators or third-party contractors to visit potential leak sites to check for leaks and ensure environmental compliance.

May 2023 HYDROCARBON ENGINEERING 49
Julian Yeo, United Electric Controls, USA, discusses how wireless gas leak detection can improve monitoring efficiency and regulatory compliance.
A wireless gas detection system can improve monitoring capability at 10% of the cost of a wired system. With drop-in-network mobility, wireless detectors can be positioned anywhere close to leak-prone assets (e.g. valves), without the need for trenching and wiring. Leaks can now be detected continuously and cost-effectively before manual inspection, streamlining the number of assets and locations that require inspection. At the same time, leaks can be detected quickly due to the detector’s proximity to the asset. Prompt detection enables the operator to address the leak source before it escalates with repercussions. Recent tests conducted at a natural gas storage facility in the US indicate that wireless gas detectors are capable of detecting and alerting operators to fugitive emissions of natural gas in an outdoor environment.
Case study: putting wireless gas detection to the test
A natural gas field was successfully converted into a storage reservoir for gas reinjection. The conversion process involved drilling a number of new wells to enable rapid withdrawal of gas from the reservoir storage. With
methane being a primary constituent of natural gas, these wells are a potential source of environmentally-damaging leakage – possibly violating increasingly stringent environmental laws.
According to the facility’s instrument and control (I&C) specialist, the company needed a way to detect small methane leaks around the wellhead so they could be fixed before they became bigger. The specialist was initially sceptical of gas detectors because of their limitations in coverage and high cost of installation, but changed their mind after understanding the benefits that wireless solutions would bring. The plan was to deploy multiple units around a wellhead (see Figure 1), to create a robust gas detection envelop for early detection for regulatory compliance.
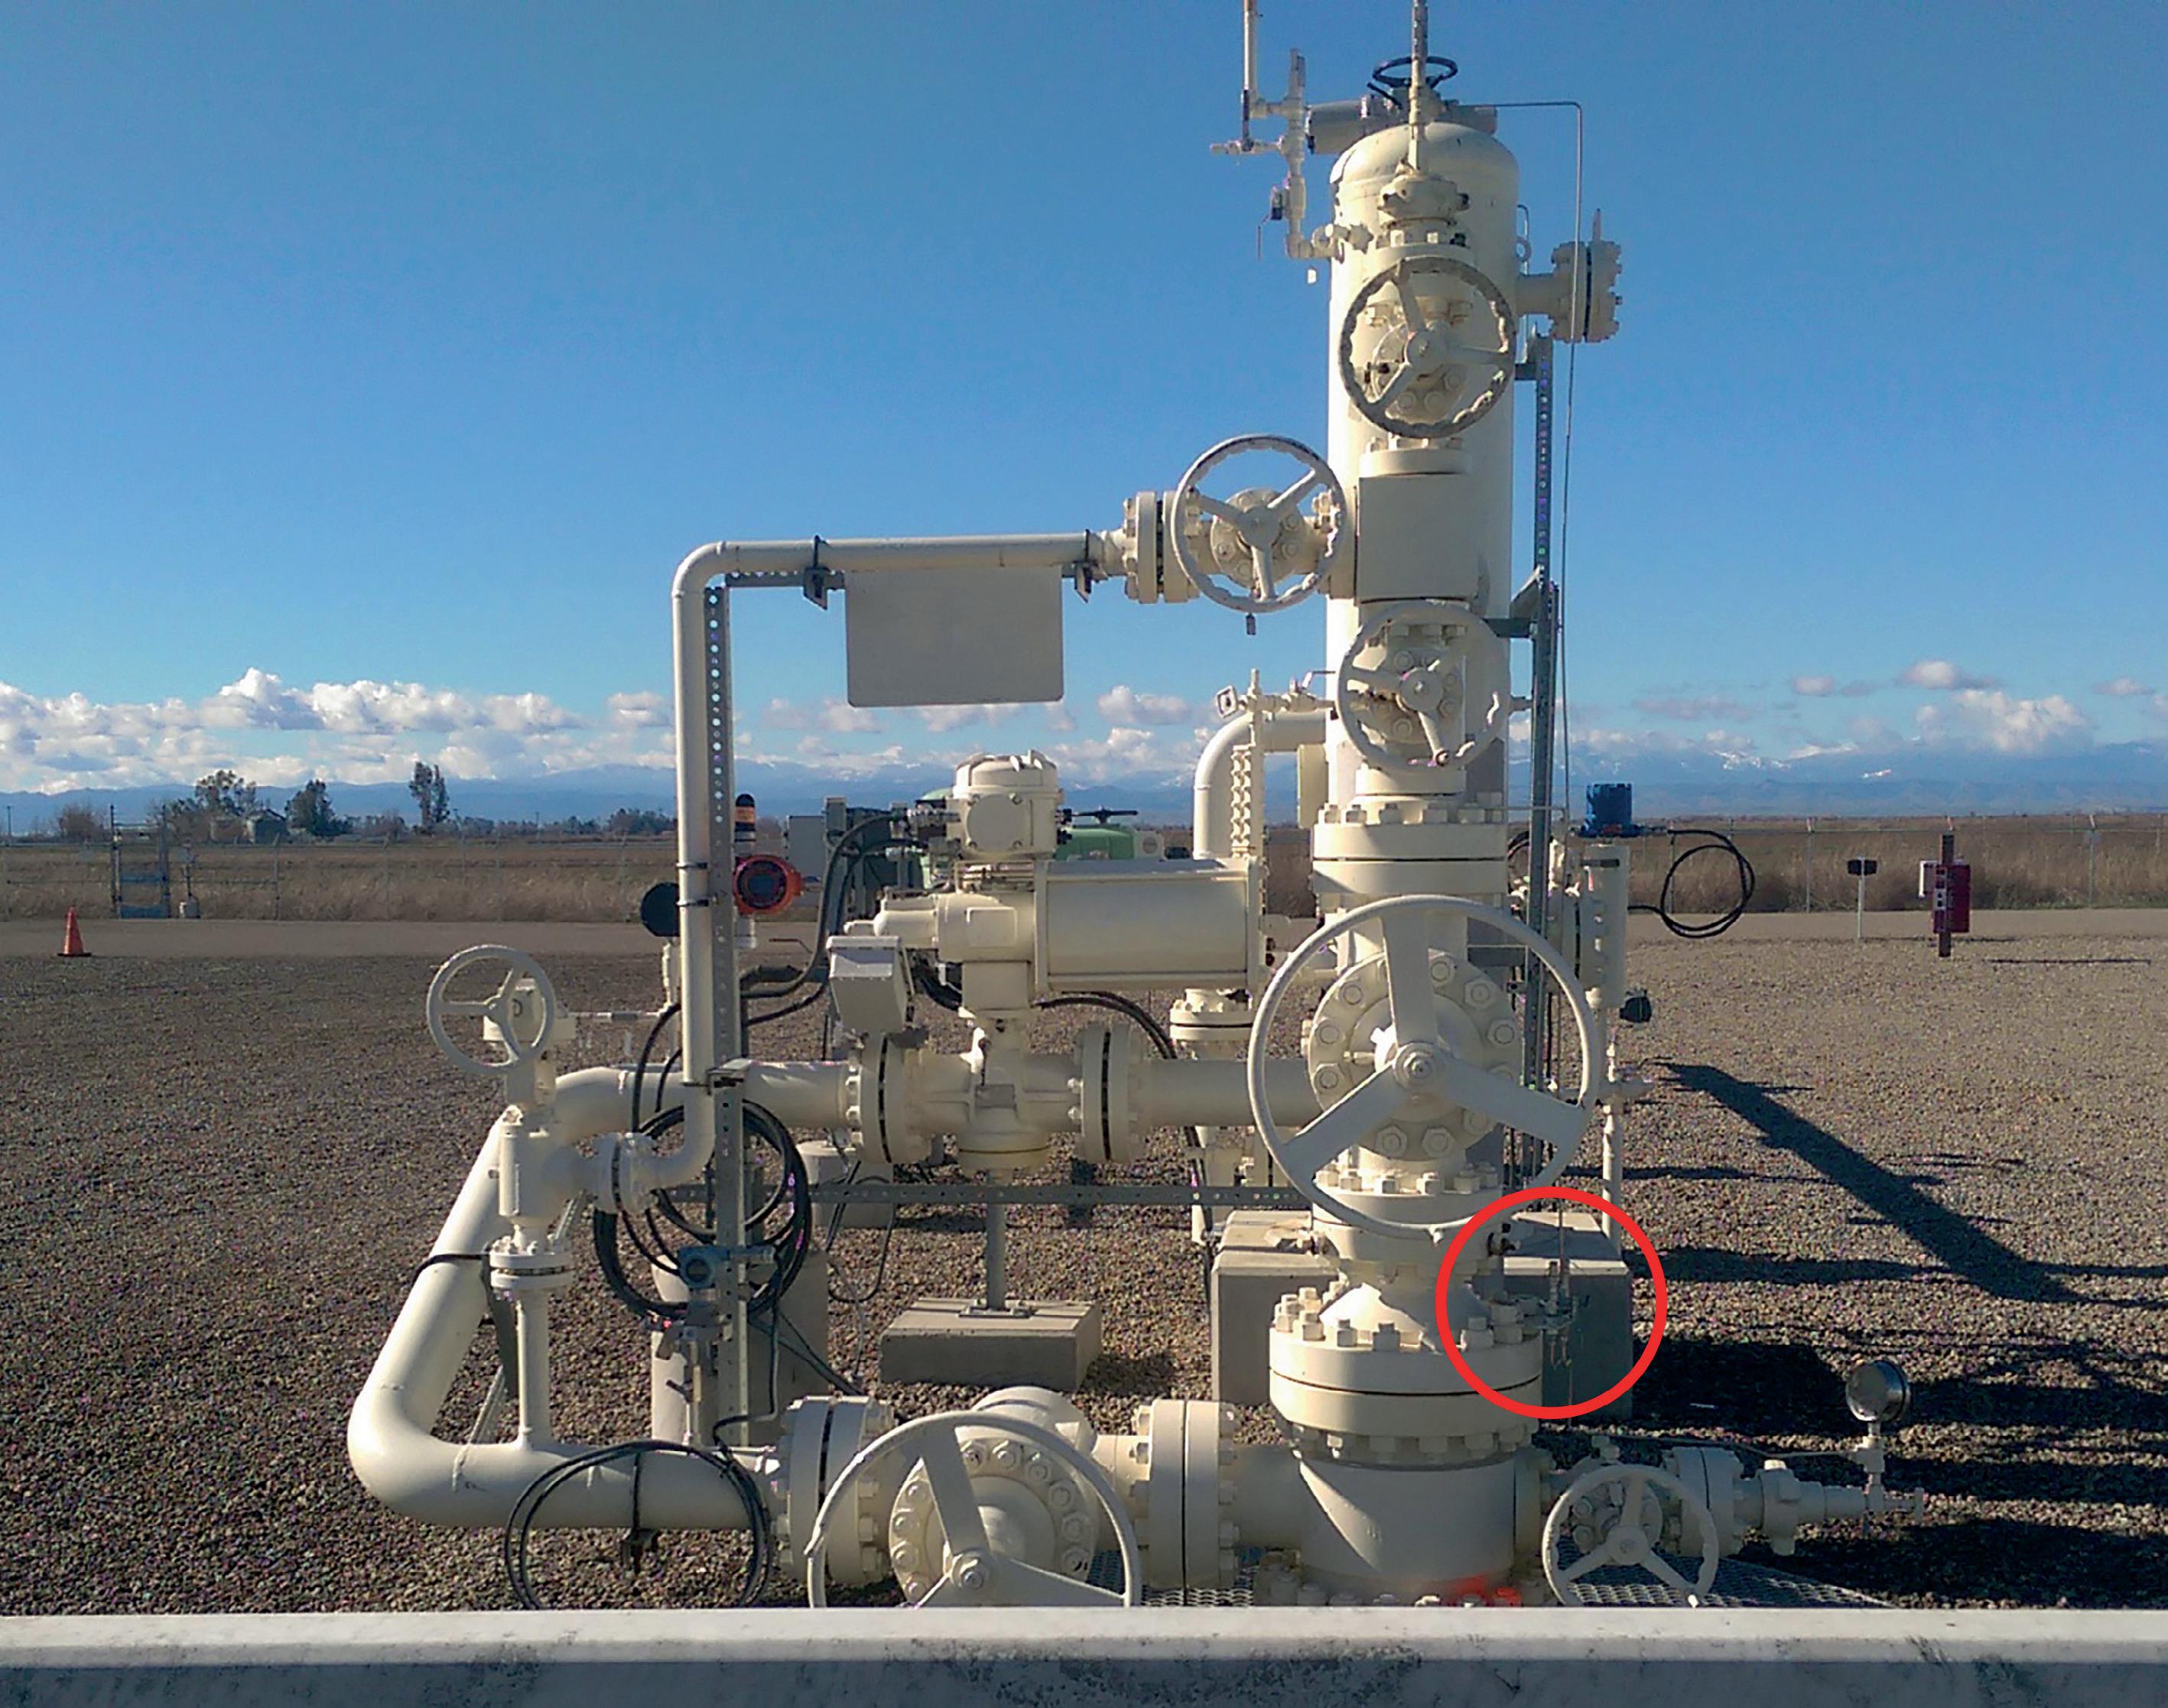
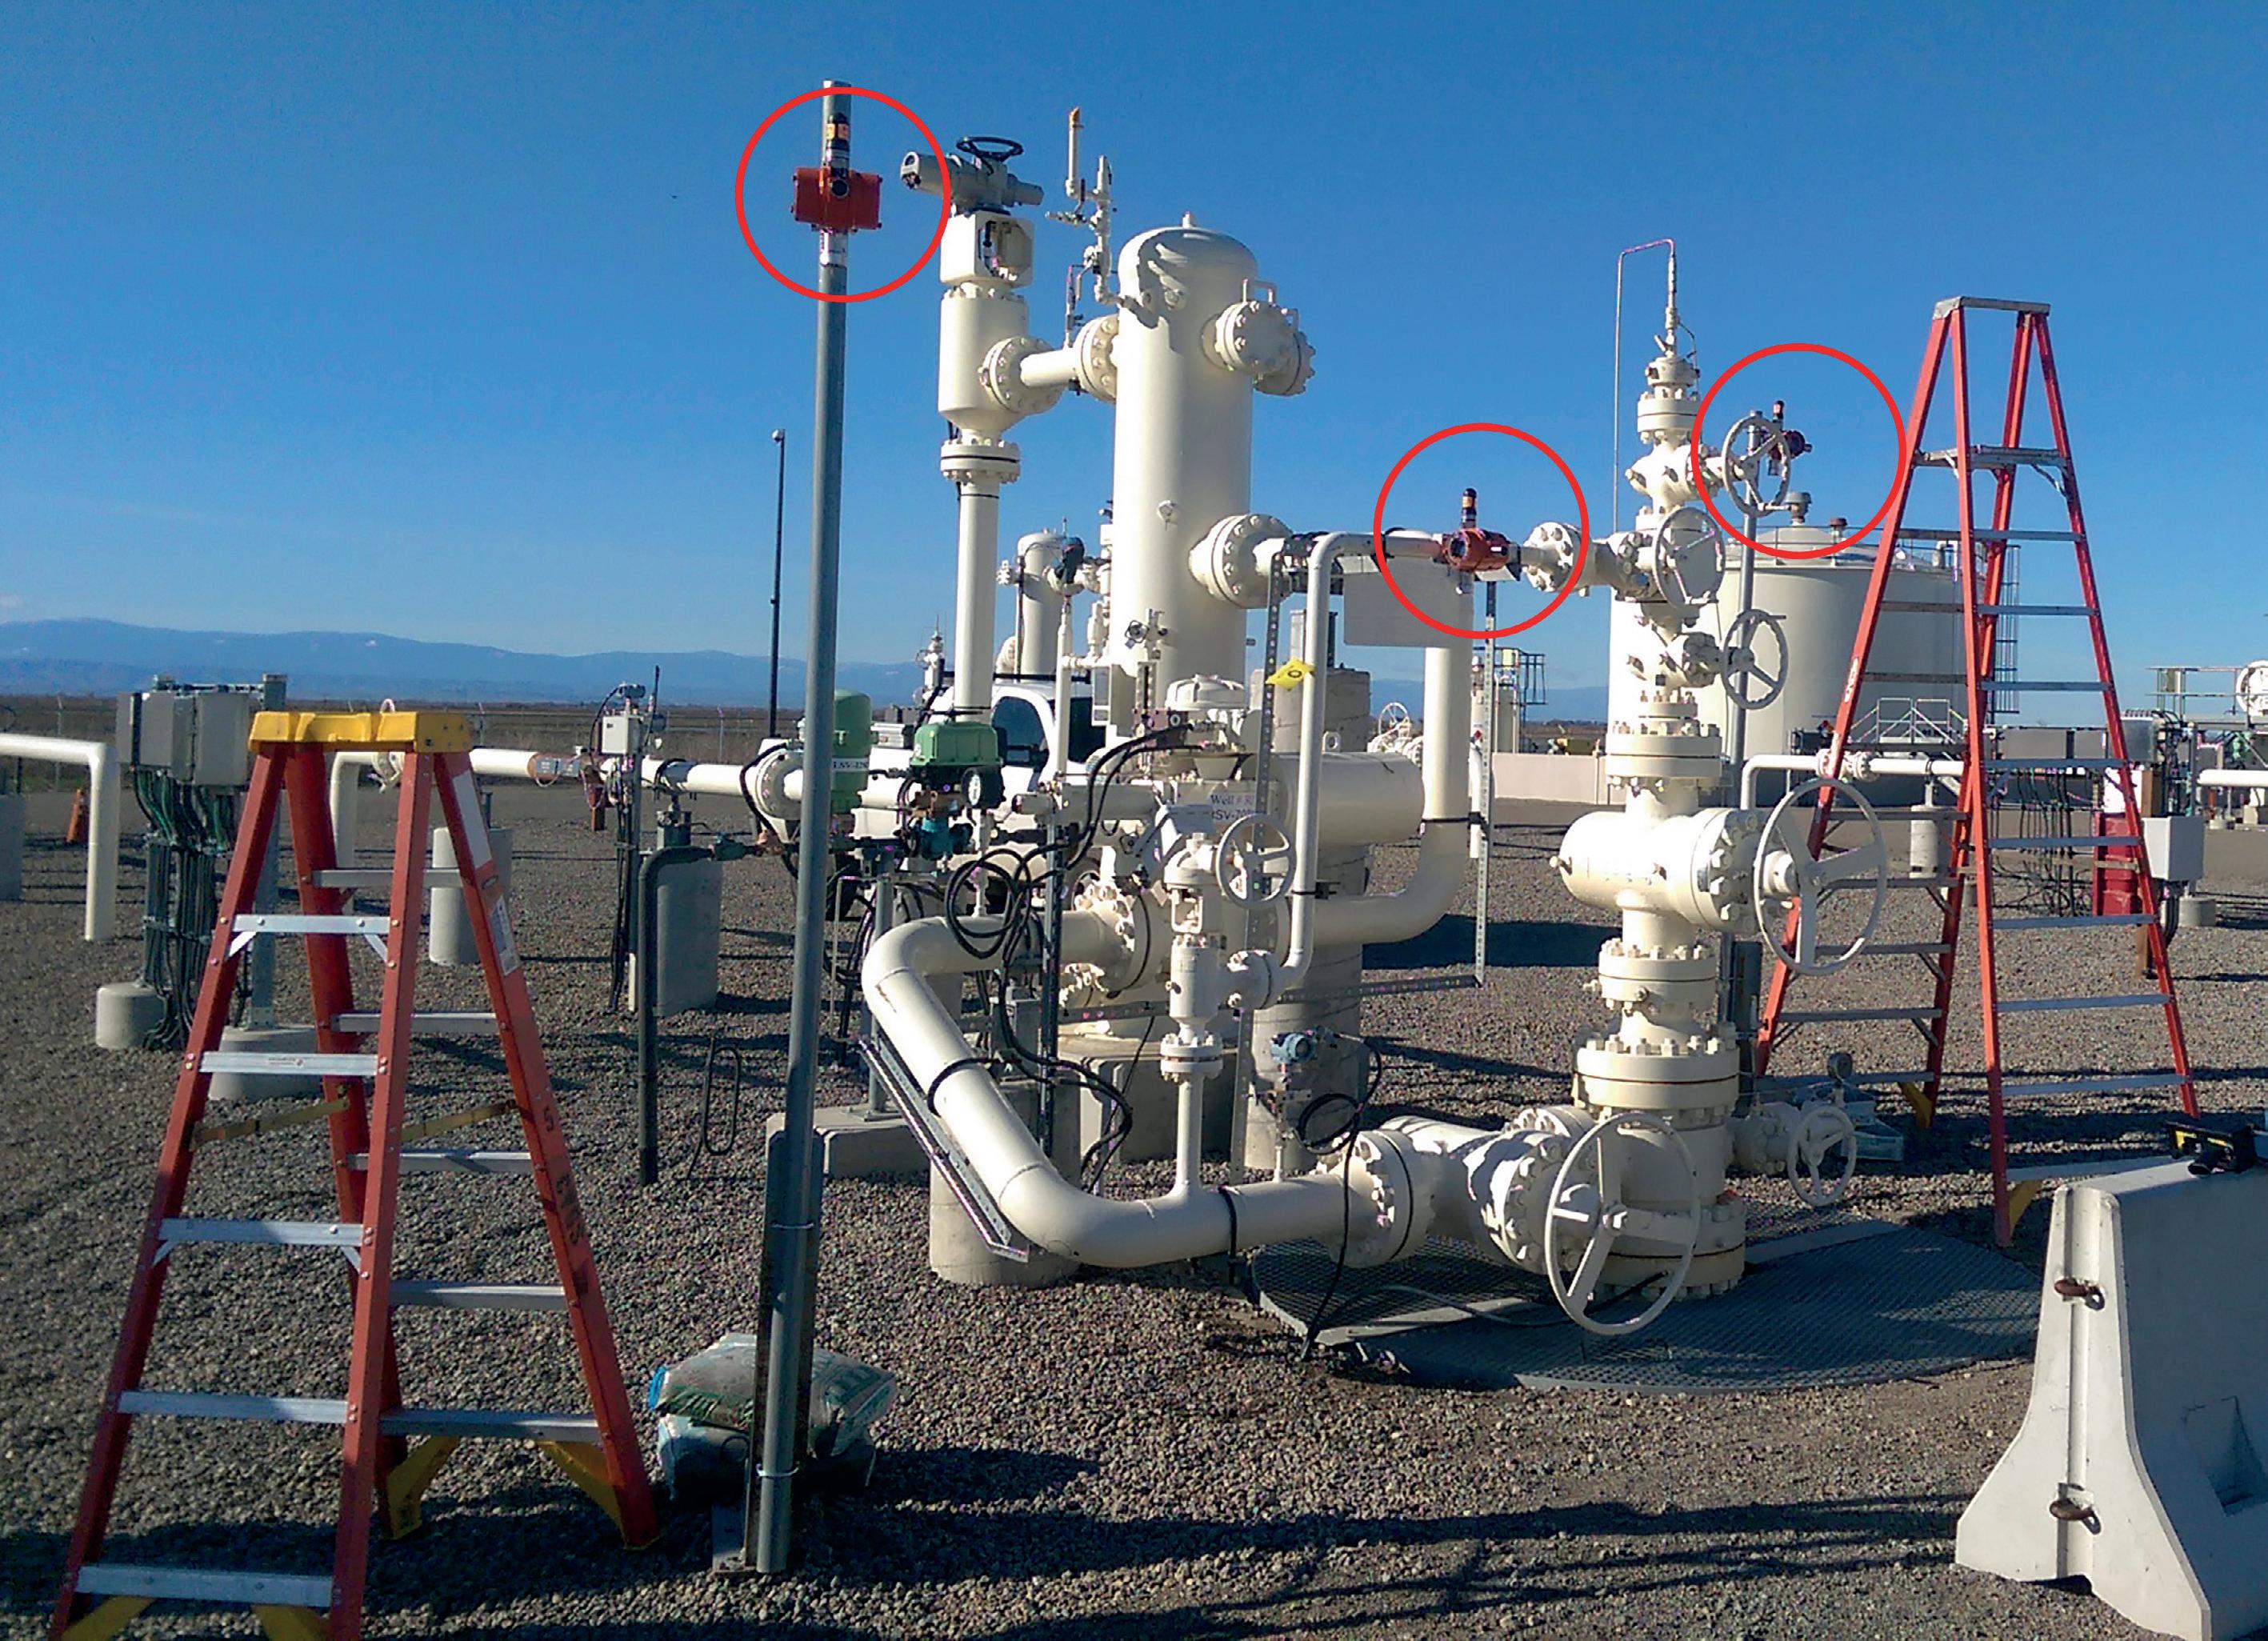
Natural gas is usually between 95 – 97% pure methane, but establishing the presence of a leak requires the detection of only a small percentage of the lower explosive limit (LEL). The system tested was the Vanguard WirelessHART gas detector from United Electric Controls. The test involved simulating a small leak by opening a 0.25 in. valve for 10 minutes, releasing 4 ft 3 of methane into the air, and repeating this process every day for 40 days (see Figure 2). The amount of gas released into the air during the test was negligible, but was nonetheless conducted in communication with the state’s natural resources division.
The team used optical gas imaging (OGI) cameras to track the path of the passing methane plume and optimise placement of the sensors. They mounted four detectors on the well chasses at heights of approximately 8 ft, northeast, northwest, southeast and southwest of a valve (see Figure 1). Deploying multiple units ensured that even if the wind blew in different directions, at least one sensor would detect the fugitive emissions when the valve was opened. Testing temperatures were cool, with wind speeds of between 5 – 10 mph.
The operator already had a WirelessHART communications network in place, so deploying the gas detectors was simply a matter of mounting and configuring them for the wireless network. The sensors exchange information with the plant control system via a WirelessHART gateway. Operators manage the system via the plant SCADA software residing on a workstation accessed via an HMI. Figure 3 shows the communications architecture.
Test results
Figure 4 shows the results from the first day of testing. The Y axis represents the parts per million (ppm) of methane; the red vertical line marks the moment of the first controlled gas release, which had a density of 5000 ppm; the X axis is the time elapsed in minutes from the discharge. Prior to the discharge, the sensors detected no methane, but within the first minute after opening the valve, the sensor in the southwest corner picked up a plume of methane measuring 3000 ppm (approximately 6% LEL). In the sixth minute, the southeast unit picked up a 3500 ppm plume of methane,
May 2023 HYDROCARBON ENGINEERING 50
Figure 1. Three of the wireless sensors tested onsite around a wellhead.
Figure 2. Location of a simulated gas leak.
followed by a report of a 500 ppm concentration in the seventh minute. The fact that only two of the sensors detected methane is likely due to a specific direction that the wind was blowing.
Similar results were achieved during the subsequent days of testing. Although there was considerable variability due to changing wind speeds and direction, the sensors picked up gas concentrations every day. On day four, for example, sensors detected concentrations in 7 out of the 10 minutes that the valve was open. Further testing conducted at various intervals over the next three weeks was also consistent with these findings. No gas release went undetected, confirming the conclusion that wireless point gas detectors can pick up leaks of as small as 500 ppm or 1% LEL within minutes, and communicate the data reliably across a wireless network to a gateway.
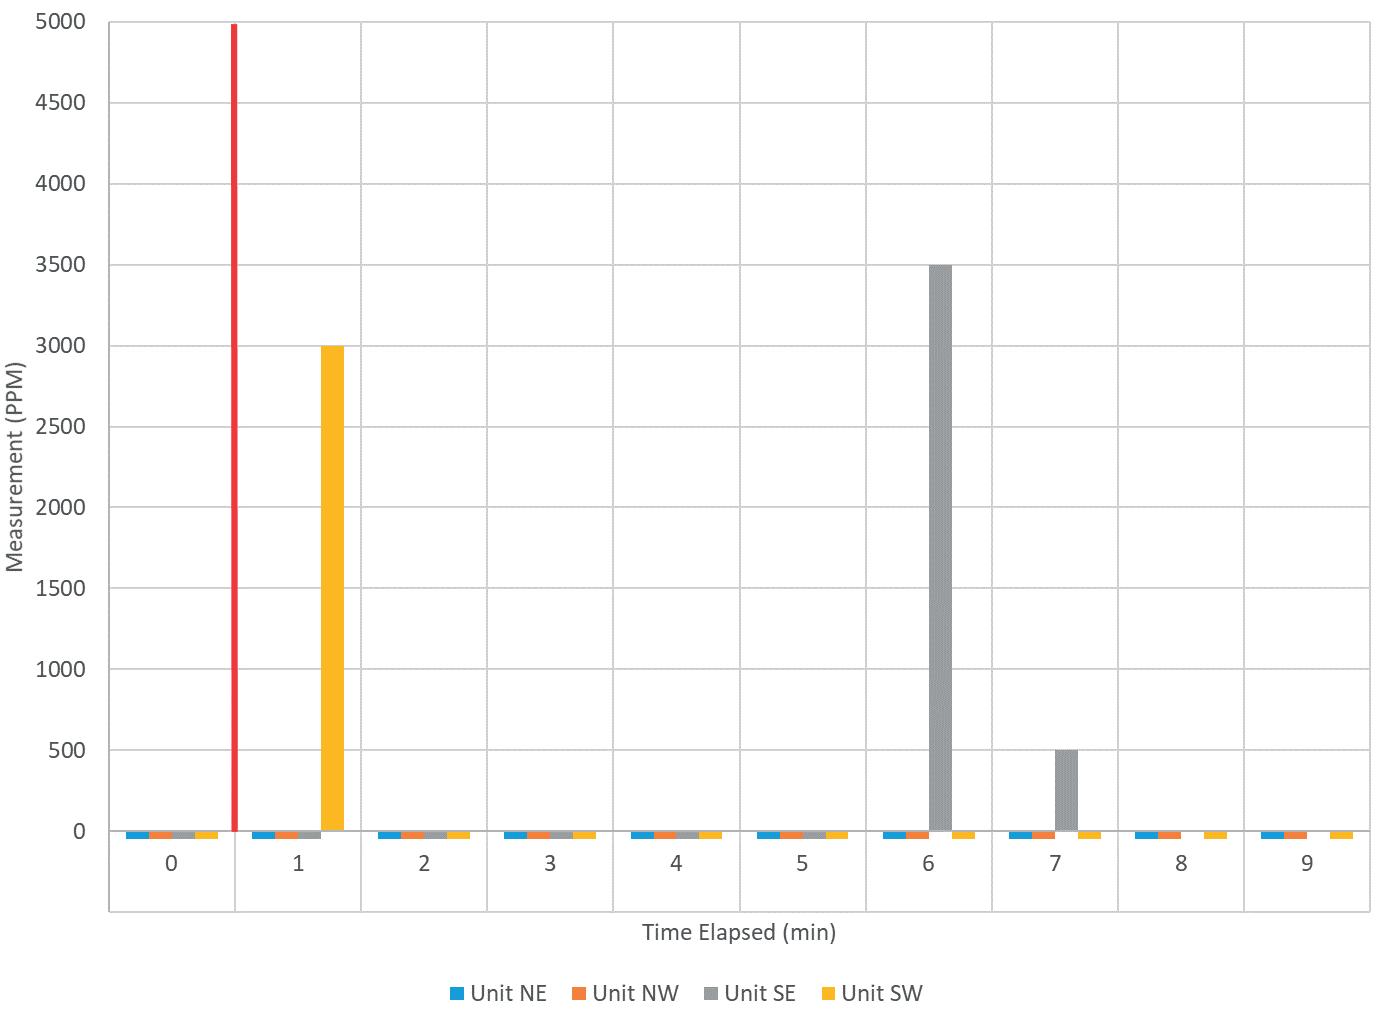
Once the presence of leaks is detected, the onus is on the facility owner to deploy teams to identify the leak’s exact location. Without the wireless sensors, repairing any leak outside the detectors limited range would likely require two visits – one to identify the leak and one to repair it.
Lessons learned
Since deployment, several opportunities and lessons for improvements have been identified. Firstly, wireless signal network coverage can be improved easily. Only one gateway was installed to serve all of the well pad areas. This meant that the data from devices located farthest away from the gateway had to perform multiple hops between other WirelessHART devices before arriving at the gateway, increasing signal latency. The wireless gas detectors were all fitted with standard 2 dBi antennas. Since the site had very few obstacles with large open spaces, changing out the standard antenna to a higher gain directional antenna helped the devices to achieve longer ranges with the gateway, and thus reduce the number of data hops. For instance, changing a 2 dBi to a 4 dBi antenna can improve range by up to 28%; changing a 2 dBi to a 6 dBi antenna could yield up to 58% longer range.

Secondly, it is important to select the appropriate instrument based on the measurement objective. In this case study, the customer was using wireless gas detectors for continuous monitoring and to provide additional input to supplement leak detection and repair (LDAR) work. The existing accuracy of the sensors was more than adequate to inform the user of whether they should ‘go/not go’ and investigate a potential leak source. However, if quantification of volatile organic compounds (VOCs) or volatile hazardous air pollutants (VHAPs) was the objective, the accuracy of these devices would not be sufficient, resulting in an increased number of false positive alarms being triggered. Deploying a detector that could measure down to the parts per billion (ppb) level would then be more appropriate.
Thirdly, proper device maintenance after installation is essential in order to optimise the gas detector’s performance. One example of this is to perform regular ‘bump testing’ or functional testing on the devices using a certified standard gas mixture of known concentration. By performing this test regularly (i.e. 3 – 6 months), the user can identify which detectors are out of calibration. Another related maintenance activity is to perform periodic calibration of the gas sensors. Calibration intervals depend on the type of sensor. For electrochemical sensors, manufacturers typically recommend a 6 – 12 month calibration frequency, or when bump testing indicates out of specification. For non-dispersive infrared (NDIR) sensors, calibration is only necessary if the bump test indicates out of specification.
Wireless gas detection is transforming the way in which companies are monitoring for leaks. Employees and neighbouring communities are better protected, and there is greater control over production loss. Regulatory compliance has become a more achievable goal – all in ways that would not likely be cost-feasible with wired gas detectors alone.
May 2023 HYDROCARBON ENGINEERING 51
Figure 3. Wireless sensors send information on concentrations of methane (natural gas) that they detect to the SCADA software.
Figure 4. The sensor detected leakage within the first minute of opening a valve.
Tapping into the promise of digitalisation and the benefits that data can provide continues to be a focus across large industries such as hydrocarbon processing. The majority of this effort has been directed by executive level groups within an organisation, utilising a centralised IT budget to identify and deploy new technologies. The acceptance of cloud-based solutions, along with more nimble deployment models, has opened up the opportunity for operational resources to deploy digitalisation tools under their operating budgets and see immediate impact.
The most effective digital solutions go beyond simple digitised forms and electronic documents; they fully integrate into existing business processes and workflows without reinventing them. Operational activities such as installation, inspection and maintenance present clear opportunities for advanced digital tools to have immediate impact. When operational field leaders experience a failed digitalisation implementation, it is for one of three reasons. These barriers can easily be identified and overcome with today’s solutions.
Barrier one: uniqueness by site
Any digitalisation solution must conform to existing business processes – not the other way around. This means that uniqueness must be respected and rapidly accounted for as a solution is proliferated. Companies are global, with sites spanning cities, states, countries and continents. Each facility has unique assets, processes and workflows. Special activities, such as turnarounds, introduce even more complexity, with third-party inspectors and contractors coming onsite for brief periods of time. A successful digitalisation platform not only has to be configured for each unique site, but also be open enough to integrate with the varying back office and business intelligence platforms used across the organisation.
Barrier two: field adoption
A common misconception is that field users are resistant to new technology. In reality, they may be jaded by previous initiatives that forced significant changes to their daily activities. Field users worry that implementing new

May 2023
HYDROCARBON ENGINEERING 52
Ross Boyd, TRU, USA, explains how digitalisation can be implemented at the operational level to assist turnarounds, inspections and maintenance at refineries.

May 2023 HYDROCARBON ENGINEERING 53
Figure 1. A third-party inspector utilises digital technology to record visual inspections.
technologies will require extra effort on their part for non-value-added steps that include redundant data entry, lengthy training, and more logins. Employees are forced to change the way in which they do their jobs – disrupting processes and workflows, and ultimately stopping digitalisation before it even begins. The key to adoption is an adaptable software framework with an intuitive user interface (UI) and role-based logic that can be rapidly updated and tailored to each user group, enabling the solution to be constantly and cost-effectively modified as business needs change, and further simplifying third-party involvement.
Barrier three: standardisation
Any new solution must make clean, standardised data available, regardless of a company’s ultimate digitalisation goals. While it starts with data collection, that data must move through an organisation’s existing workflows to ensure that the data is available when and where it is needed. Digitised reporting (moving from paper to electronic forms) is the first step, but to achieve full process digitalisation, additional challenges must be tackled, such as redundant data entry, streamlined document management, and handling of third-party participation.
Overcoming the barriers
The cloud-based digitalisation platforms available today offer many advantages compared to legacy, custom software deployed on a local server. Advanced digital solutions are configurable by location, role, task or function to satisfy individual data and workflow needs, without reinventing processes. Focus must be on an easy-to-use, intuitive interface configured for a field user’s data collection needs.
Having access to usable data is paramount, and this is the foundation required to improve a business. Once this is established, the data can then be used anywhere by anyone at the company. By utilising integrations, such as an Application Programming Interface (API), companies can feed clean, standardised data collected in the field into existing hardware and software for data analysis. When built correctly, the data collected and managed in the field is gathered without disrupting the normal work process. This improves efficiency – simplifying compliance and providing insights into operations – while satisfying the corporate request for accurate data.
Case study
Any refinery operator understands the extensive inspection and maintenance activity required on a routine basis, and the relative increase required during a turnaround. A refinery in Midwest US, with a 177 000 bpd operation, recently experienced a turnaround of its hydrofluoric (HF) alkylation unit – one of the most difficult processing unit turnarounds to manage. Due to damage that mechanisms incur from HF acid, refineries are required to inspect for corrosion of flange faces while production is halted. During this refinery’s turnaround, hundreds of flanges were inspected, repaired or replaced – a 24 hr/d effort lasting several weeks.
Operational leadership at most oil and gas processing facilities has experienced ineffective attempts to streamline and optimise turnaround processes. Everything from off-the-shelf software, paper wall charts, and giant whiteboards have been implemented, with marginal improvement to the outcome. A huge downside to these attempts was a lack of real-time updates and metrics. In the search for a solution, the refinery was also looking to monitor the entire workflow in real time, and provide quantitative data for future inspections and repair planning.
A few weeks ahead of the turnaround, the refinery engaged with TRU (formerly TruQC), a commercial process digitalisation software solution, to conduct a full review of the roles involved in the event and the data collected by and distributed to each role. Several third-party resources were to be involved in the event, and access to data had to be permissioned by resource to ensure confidentiality and quality data collection.
The effort during discovery focused on existing processes and planned roles, leveraging the experience of the refinery’s resources and their subject matter expertise. A modern digitalisation platform, with its inherent flexibility, allows for a quick assessment of a client’s needs to inform the first iteration of the solution. A modern digitalisation partner can listen for key objectives and nuances, given the flexibility of the platform available to them.

Execution and experience
The inspection supervisor at the refinery said: “Anyone considering process digitalisation: find a ‘champion’. Find someone that has a vision of what the solution can do, how it will be used, what the inefficiencies are and what the benefits can be. Have that champion be someone that will actively use the software, someone that has an interest in it being a success.”
May 2023 HYDROCARBON ENGINEERING 54
Figure 2. Engineering technician recording equipment readings on a tablet.

BORN, WHERE VALUES ARE VALUED. THE 6X ®. AVAILABLE NOW! Technology is only as good as the people who make it. That’s why the new VEGAPULS 6X is the result – made by over 1,800 valuable employees, 60 years of valued measurement experience and every value that is intrinsic to VEGA. VEGA. HOME OF VALUES. GET TO KNOW THE 6X® www.vega.com/radar
The inspection supervisor, as the champion and a leader of the upcoming turnaround, became fully engaged in the discovery activity. This included pulling in resources by role to help lay out the requirements for the turnaround and design appropriate permissions for each. As a result, field users were able to fully utilise the tool after only 3 – 4 hours of training. The vast majority of users ended up being third-party contractors, with only a few company inspectors and engineers on the project. TRU was able to design the tool with appropriate permissions based on each role. As such, the tasks within the software were tailored and straightforward. Contractors embraced the solution because it presented clarity of the refinery’s expectations and fit perfectly with the workflow and data collection asked of them.
Once the turnaround started, success was achieved quickly with a role-based workflow approach. One benefit was that the inspector noticed that the flange inspection process flowed without frequent intervention. All parties had been trained, so they knew what they needed to do – both in the field and within the software. When issues arose, they were quickly resolved and communicated thanks to an accessible real-time view of operations. This allowed everyone involved in the turnaround to focus on timely response to the most important identified tasks instead of managing the entire effort of flange inspections. Providing status updates was also streamlined via the real-time dashboard that displayed the custom metrics that refinery management was interested in viewing.
Results
Simple success for the refinery meant making the complex data consolidation process of reviewing all flange inspections and confirming repair completion – required before the scheduled turnaround completion date – more efficient. Typically, this involves time-consuming and analogue tasks, such as running fingers down wall charts, counting gaps, shuffling through stacks of paper, and trying
to decipher notes that were written in the field while wearing multiple pairs of gloves. Digitalisation provided the refinery with a trusted self-managed system that delivered real status updates and quantitative justification for flange repairs.
In the past, qualitative inspections would receive a pass/failure. This refinery’s data reporting largely focused on how many inspections had been completed and how many were still outstanding, which did not provide additional quantitative value during or after each event. Digitalising the process resulted in efficiency gains, enabling the refinery to gather more data on each flange and make data-driven decisions based on objective criteria. This data, which was unavailable with prior turnarounds, was now providing insights in real time for management, maintenance, repair and engineering. The digitalisation process also ensured that clean, standardised data was available for analysis and planning for the next event.

Conclusion
A clear indication of an effective digitalisation solution is an immediate increase in productivity and efficiency. Clean, standardised data is a natural byproduct of an efficient and productive bottoms-up solution and should generate immediate field level return on investment (ROI). Simply put, data availability does not have to come at the expense of productivity and efficiency. Digitalisation, when properly deployed, enables both.
The time to start the digitalisation journey is now. Operationally-driven digitalisation is a quick, measured approach to process automation. These targeted smaller initiatives can be deployed quickly and are less costly than most corporate-led efforts. If you know of a manual, paper-based work process at your facility that is prime for digitalisation, write down your problem statement, objectives and ideas, and reach out to a digitalisation vendor to begin project discovery and start seeing results.
May 2023 HYDROCARBON ENGINEERING 56
Figure 3. Real-time digital dashboards track flange inspection tasks, such as current state, rework, and mechanical work.
Ashfaq Anwer, UAE, discusses the development and management of written inspection schemes, and explores how they can help to ensure equipment reliability in process plants.
Written inspection schemes are documents that can ensure correct collection of inspection data, facilitate inspection reporting, and support stakeholders.
Written schemes can help inspectors to visualise equipment before making an actual inspection onsite, if they include:
n All of the required information in a graphical format, depicting the equipment in 3D with the potentially problematic areas.
n Previous inspection findings, repairs and replacements.
n Recommended inspection techniques.
Three factors are of vital importance when written schemes are developed and then managed for the rest of the asset life cycle:

n They should not be missing any required information.
n The information should be organised in a way that can be well understood by the inspectors performing the inspection.
n Everything on the written scheme should be up-to-date.
The format of a written scheme should be developed by in-house resources of the inspection
May 2023 HYDROCARBON ENGINEERING 57
organisation. Existing written schemes can be used as examples of best practice, however it is important that a written scheme suits the requirements and understanding of all of the inspectors and inspection engineers. Systems implemented as a replica of those already in use by other organisations would not contain all of the necessary information that would support the organisation in taking steps forward. The minimum required information in a written scheme of a particular piece of equipment should be the following:
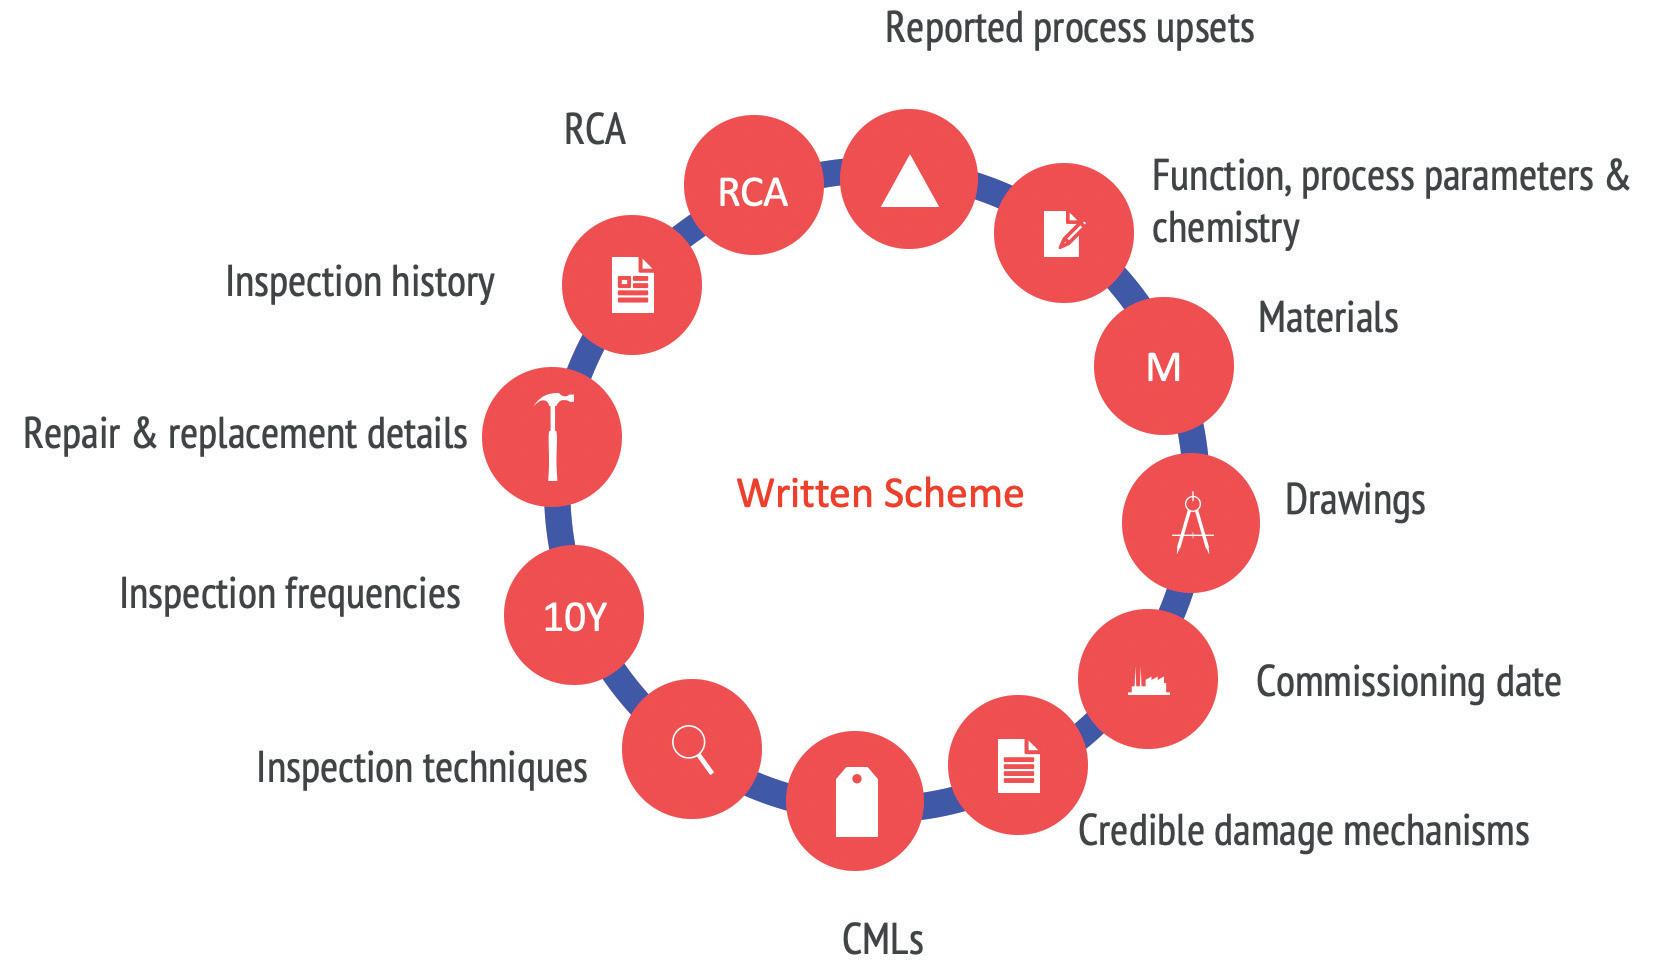
1. Function (process description).
2. Process parameters (pressure and temperature, as a minimum).
3. Chemistry (necessary process information).
4. Materials.
5. External, assembly and internals drawings.
6. Date commissioned.
7. Credible damage mechanisms.
8. Condition monitoring locations (CMLs).
9. Inspection techniques.
10. Inspection frequency.
11. Repair and replacement details with dates (along with reasons).
12. Key historical inspection findings.
13. Any root cause analysis (RCA) study conducted on this particular equipment.
14. Reported process upsets.
Information related to points 1 – 10 is normally available in all written schemes, however points 11 – 14 are not usually included, and inspectors are required to consult previous inspection reports in order to find that information. These reports are often subjective, and may or may not recommend that a particular inspection is made during the next inspection. Incorporating points 11 – 14 into written inspection schemes could potentially mandate that the inspector covers the recommended areas for inspection once the inspection commences. If written schemes are being regularly updated, point 8 (CMLs) would certainly contain all of the required
information, as a result of points 11 – 14. However, there can be cases where there is no recommendation added to point 8 during the update, and the information listed in points 11 – 14 still supports the current inspection.
It has also been noted that the actual process chemistry is only shared with the inspection team (and made part of the written scheme) in a few cases. For this reason, inspectors and inspection engineers who are not particularly well versed with the process chemistry only apply the recommended inspection techniques to the locations mentioned in the written scheme, but do not think beyond this – especially when unexpected loss of containment or other failures occurs. Understanding process chemistry helps in comprehending the integrity operating windows (IOWs) that are normally limited to pressure and temperature, and that is not enough. It is also important for inspection engineers to closely review factors such as process contents, their conductivity, pH and other such parameters if they are defined as integral to the process.
Point 14 is connected to each aspect of review. Upon receiving a report of any type of process upset, where a breach has been reported in integrity windows, a written scheme should be immediately updated with the necessary information so that during the next inspection, specific techniques can be employed in specific locations that potentially cause damage. This is then connected to the RCA studies. No integrity window breach with any unknown cause should go unnoticed and without an RCA study. Once conducted and concluded, an RCA study should implement actions, and anything particularly related to inspection should be added to the written scheme. During normal practices, an action is often agreed during an RCA, however this is not added to the report, and therefore not implemented. Inclusion in a written scheme would ensure the necessary implementation and that any findings are picked up on.
Repair and replacements are part of an asset life cycle. Any repair, minor or major, should be reflected in the written scheme in the best way possible. If displayed in graphical format with the equipment as a 3D model, with all potentially problematic areas highlighted in colours for their inspection findings, repairs and replacements, written schemes would help an inspector to understand the particular requirements before the inspection commences. Depicting equipment that has been repaired or replaced (along with the reason why and other necessary details) in the written scheme helps to separate this equipment from the rest. Such classification helps when planning and allotting the inspection resources during a time-constrained shutdown. The same process is applicable to key historical
May 2023 HYDROCARBON ENGINEERING 58
Figure 1. An example of a written scheme.

inspection findings, which carry a lot of value even when no repair or replacement is made. Again, the inspection report can be summarised for the key inspection findings. One way of ensuring that the key inspection findings are entered into the written scheme is to incorporate a ‘written scheme recommendation’ field in the inspection report. This way, the inspection engineer will be reminded to enter something into the written scheme.
A change management system is not normally connected to the management of written schemes. Similarly, process studies that are new or revalidated also generate recommendations, which impact existing inspection practices in one way or another. When generating the recommendations, and if related to inspection, both of these systems should receive an entry in the written schemes. The best way to manage this is to route the change review to inspection engineers, enabling them to study the change, review it for any impact on existing inspection being performed, and add any details following a discussion with a risk-based inspection engineer. A process studies revalidation report review should also include an inspection engineer.
Written schemes are, for the most part, developed and maintained for static equipment such as pressure vessels, heat exchangers and storage tanks. Piping and pressure safety valve inspections are excluded, and there are no such documents available to assist inspectors. This
DYNAMIC SIMULATION SERVICES FOR CENTRIFUGAL AND AXIAL FLOW COMPRESSION SYSTEMS COMPSYS™


SCENARIOS
Normal and emergency shut downs (ESD)
Machine start up sequences (series and parallel)
Process changes
Valves or other equipment failure events

BENEFITS
Faster & finer dynamics compared to other tools

Timely proper routing & sizing of control lines & valves
Finer sizing of hot by-pass valves
Broader off design process & equipment checks

Realistic analysis of controllers stability & instability
Finer pre-tuning of compressors antisurge, performance & load sharing controls
Definition & check of complex operational procedures to reach target operating points
www.sate-italy.com
Santa Croce 664/a - 30135 Venezia - Italy
info@sate-italy.com - ph. +39 041 2757634
is mainly because piping inspection and pressure safety valve inspections do not involve detailed internal inspection. However, the provision of a less detailed sheet summarised from past inspections and maintenance would support the inspectors. To facilitate the availability of such information for piping inspection, it is important to identify all of the critical piping loops and the written schemes that are developed for them. Inclusion of master process and material data, along with past inspection history, deadleg information, repairs and replacements, etc., provides the starting point before an actual inspection is performed. Problematic piping loops and pressure safety valves would be easier to pick up so that further review and analysis may then be performed on them, based upon the collected inspection data.
A written scheme document should be developed smartly, and stay relevant before any inspection is performed. A fresh round of reviews should take place when any inspection activity related to specific equipment is expected. Updates to all of the entries are to be validated. The validation of written schemes before shutdowns can greatly help, as external resources are also involved in the assistance of plant inspection and maintenance activities. Information in written schemes that is not updated and revalidated can result in missing out on inspections, associated data collection, and the correct analysis to ensure asset integrity over the asset life cycle.

EXAMPLE: simulation of ESD events to define & check hot by pass valve
Valve size optimization Consulting Simulation services & Software for process plants and machines


Qcorr (m3/s) PHcorr (kJ/kg) -6.2% 89.0 % (@ 0.3 s) Cv - 92.1% +3.2% +13.3% +28.2% +39.6% +83.5% 86.0% (@ 0.7 s) 91.3 % (@ 0 s) 92.6 % of MCS Cv 9.5% SLL Optimized value 0% Selected size +25.4%
maps
Dynamic compressor
Frederic
It is well known and documented that corrosion and erosion are universal integrity threats across many sectors. Inspecting for the reduction in wall thickness of industrial components can help asset managers to calculate corrosion rates, plan remedial maintenance and, most importantly, prevent potential loss of containment incidents that have a significant cost and environmental impact.

Ultrasonic testing (UT) is regarded as the most accurate non-destructive testing (NDT) method for locating corrosion and providing measurements for remaining wall thickness and corrosion depth. This UT information feeds into integrity management systems, and engineers can determine the fitness-for-service and remaining life of components.
Conventional UT can only provide a certain level of component coverage, and is typically used solely on spot
readings at thickness measurement locations (TML) where corrosion rates are calculated at a known and consistent location. Although this information is invaluable for engineers, there is always the concern of missing defects. Corrosion can manifest itself in many morphologies, and a number of industry trials have shown that conventional UT is not suitable for 100% coverage of the component.
Automated corrosion mapping and phased array technology
With this considered, automated UT systems have become increasingly popular for asset integrity assessment, as they can provide a map of a large part of the asset. Automated inspection crawlers were designed to scan with a single crystal transducer, at high speeds, in order to provide 100% coverage in
May 2023 61 HYDROCARBON ENGINEERING
Reverdy, Eddyfi Technologies, France, explains how best to perform corrosion mapping with ultrasonic techniques.
a band of up to 1000 mm width, significantly increasing Probability of Detection (POD) of defects and corrosion. Enhanced precision and positioning allows operators to accurately determine defect locations. Periodic inspection sets can be overlaid, and corrosion rates quickly assessed visually. Increasingly, inspection robotic systems are becoming universally recognised and accepted.
While corrosion mapping with conventional UT probes offers an easy solution, the drawback is often productivity, as the probe must be scanned in both directions across the component in order to obtain a thickness map. Using a more coarse resolution can improve the scanning speed, but to the detriment of resolution, which can lead to operators missing small indications such as pitting. Due to a larger footprint, Phased Array Ultrasonic Testing (PAUT) probes can cover a larger surface area at increased speeds, resulting in significant time reduction. When performing corrosion mapping with a PAUT probe, the PAUT flaw detector uses linear scanning delay laws that reproduce the motion of moving a single crystal probe across the width of the PAUT probe, but at extremely high speeds. This allows for the use of larger increments, i.e. the width of the PAUT probe along the index axis, and thus a tenfold improvement in productivity. The RMS PA by Eddyfi (see Figure 1) is an automated scanner used for corrosion mapping that can carry conventional or PAUT probes.
PAUT probes for corrosion mapping applications typically utilise a water-column concept which eliminates the need for a wedge, thus providing the benefits of improved signal consistency and accuracy, and limited dead zone. The R-Scan Array from Eddyfi utilises such a concept (see Figure 2). The PAUT probe is immersed in a small housing that is continuously filled with water, and ultrasounds propagate through the column of water, allowing perfect coupling with the asset under inspection. To minimise a large amount of water flow, the surface of the probe in contact with the asset is composed of a hard foam that provides sealing and enhances surface conformance.
While the water box concept offers plenty of advantages, there are slight variations in water column height due to compression of the hard foam that was used at the front of the water box. When performing corrosion mapping, operators want to measure the remaining thickness of the component and not variations in the water column. For this reason, necessary tools are required when performing corrosion mapping.
Tools required to perform corrosion mapping

When using a water box concept, whether conventional UT or PAUT, it is necessary to measure the difference between the backwall echo, which represents the remaining thickness, and the front surface of the asset. To achieve this, synchronised gates are often used. The first gate is set to capture the front surface echo, while another is set to capture the backwall echo. The latter is synchronised with the first gate, i.e. when the front surface echo moves due to variation of the hard foam, the backwall echo follows exactly the same variation and the distance between the two echoes remains constant. That distance is the remaining thickness of the asset at that location.
May 2023 HYDROCARBON ENGINEERING 62
Figure 1. An RMS PA corrosion mapping scanner on a pressure vessel.
Figure 2. An R-Scan Array manual scanner for corrosion mapping in complex regions of assets.
Figure 3. Corrosion mapping data viewed from Eddyfi Technologies’ Capture software.
Figure 3 shows the result of a corrosion map inspection performed using commercially-available equipment. The result is displayed as a 2D C-scan with a colour code indicative of the remaining thickness. The blue colour represents areas that did not suffer corrosion, while the red colour shows areas with high corrosion. Corrosion maps provide inspectors with a quick assessment of the state of the asset. Typical analysis software proposes various tools to analyse these corrosion maps, with indicators that provide all of the necessary information, such as minimum remaining thickness within an area, position, and size of those minima.
Epoxy coatings have been widely used for protecting metal structures from environmental and corrosion attacks due to their outstanding toughness, adhesion to metal substrates, and durability. When inspecting coated or painted assets, inspectors want to measure the remaining wall thickness and not the sum of the coating/paint with the remaining thickness. For these configurations, a second gate positioned along the second backwall is typically used. The difference between the first backwall echo and the second backwall echo, both synchronised with the front surface echo, removes the influence of the coating/paint in the remaining thickness measurement. Corrosion maps and remaining thickness indicators are then displayed as the second backwall minus the first backwall.
In Figure 3, it can be seen in the A-scan image (right) that three gates were defined. The blue one is the synchronised gate on the front surface echo, the red one is the first backwall echo, and the green one is the second backwall echo. The C-scan image shows the difference between the green and red gates. By doing this, operators can remove the influence of potential paint/coating.
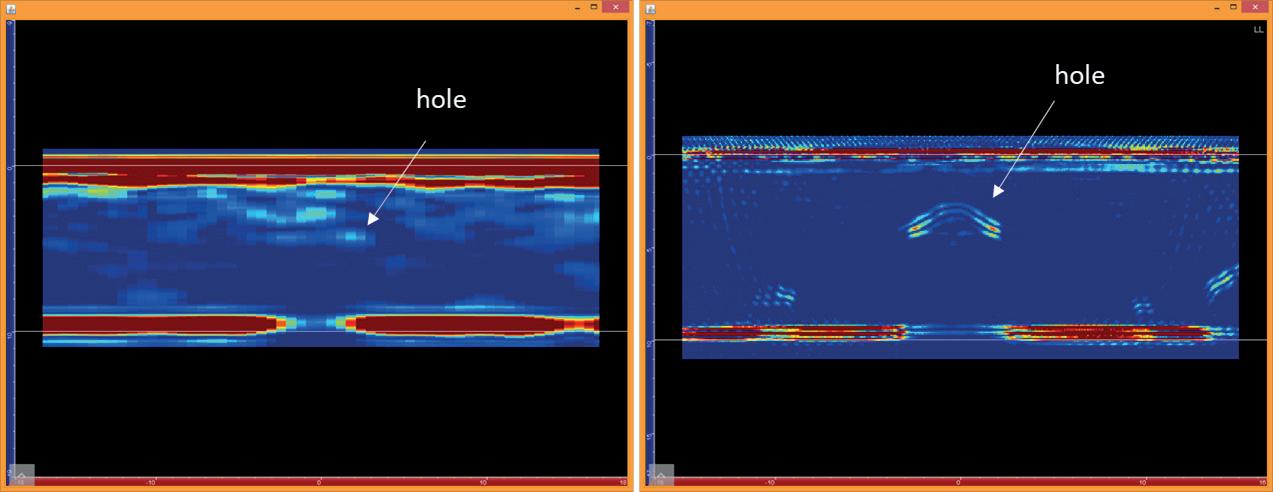
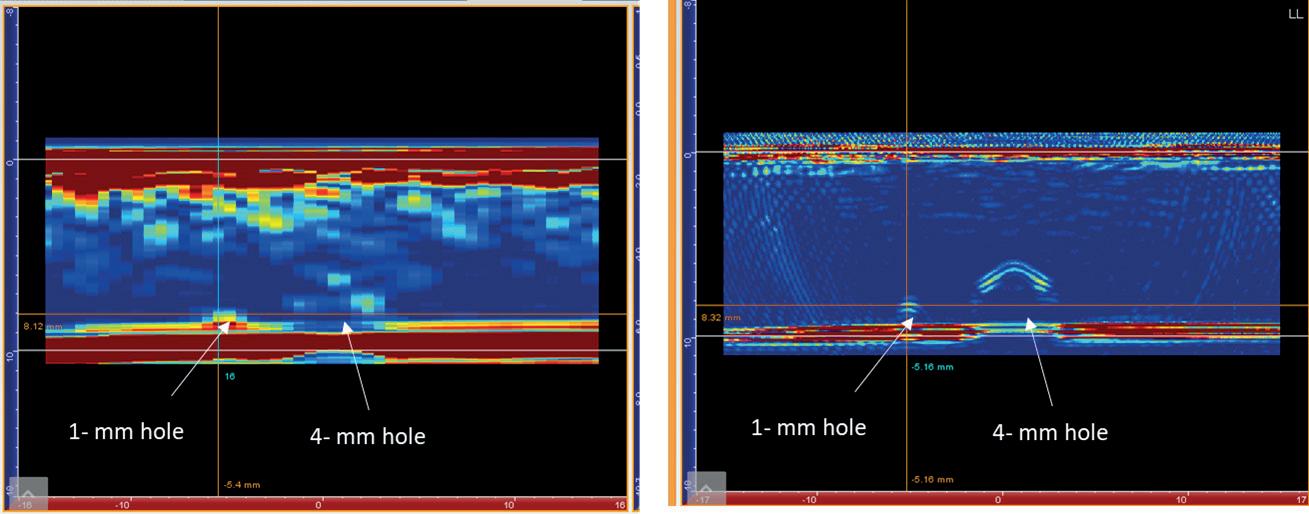

For extreme corrosion, the remaining wall thickness can be really small, which can lead to difficulties measuring it. The aforementioned tools may be difficult to apply as successive backwall echoes get really close to each other, making it difficult to position the second gate to capture the second backwall echo. Additional tools have been implemented to deal with these most severe conditions. Software by NDT industry leaders provides synchronisation capabilities between the backwall echoes and floating gates to deal with the loss of sensitivity. Figure 4 shows a corrosion map on a sample that displays severe corrosion. The image on the left is the one obtained
when simply using the aforementioned tools. It is clear that the remaining wall thickness in the corroded areas is poorly evaluated. By applying these additional tools, one can precisely measure the two corroded areas.
FMC/TFM
Another UT available for corrosion mapping is the Total Focusing Method (TFM). Full Matrix Capture (FMC)/TFM is an inspection technique that involves two steps. The first is the data acquisition process, FMC, and the second is data reconstruction, commonly referred to as TFM. FMC/TFM can be carried out in post-processing or in real time, but it is really the latter that allowed for the democratisation of the technique.
From a standards standpoint, the FMC is a matrix of data obtained by firing the elements of a PAUT probe one by one while recording data on all of the elements each time. By firing a single element, the large beam spread that is generated allows for better detection of the backwall contour, whereas a conventional UT and electronic scan would simply miss data due to the fact that they are both using straight beams.

May 2023 HYDROCARBON ENGINEERING 63
Figure 4. Software tools enable better data analysis.
Figure 5. Traditional linear scanning (left) vs total focusing method (right).
By firing a single element, the FMC also provides a small dead zone, i.e. a better capability to detect indications close to the surface.
The TFM algorithm consists of coherently summing amplitudes from the FMC data set to focus at every pixel of a region of interest (ROI). It provides improved spatial resolution everywhere within that ROI, which translates into better POD of small, corroded areas, such as pitting.
Figure 5 compares traditional linear PAUT scanning (left) to TFM (right). The sample contains conical holes of various diameters. Clearly, it is extremely difficult to detect conical holes, even the bigger ones, with standard PAUT. By sending energy in all directions, the FMC/TFM becomes sensitive to the conical holes that allow for proper detection and sizing. By focusing everywhere within the ROI, FMC/TFM also becomes sensitive to smaller holes that are representative of shallow pitting. FMC/TFM is an interesting technique when dealing with assets that are susceptible to pitting.
Automated analysis
Data analysis sometimes becomes the bottleneck for making a decision about the integrity of a component, especially when dealing with corrosion mapping, as C-scans can be extremely large. Autosizing tools can be used to speed up the process by automatically analysing a C-scan and extracting useful information about potential corroded indications.
Such algorithms have been implemented in commercially-available software. By simply defining a minimum thickness threshold, operators can quickly analyse a full corrosion map. The algorithm looks for minima in the corrosion map, and sizes corroded areas along both directions – scanning and indexing.

The NDT data acquisition and analysis software automatically detects all of the indications within the area corresponding to these criteria, and creates a table of indications. The table is fully customisable (length, width, remaining thickness, positions, etc.), and indications can be rearranged and merged. Operators can then look through the table of indications created by the software to finalise the analysis, merging and deleting indications as necessary.
Conclusion
By exploiting the synergies between different product lines, Eddyfi Technologies proposes solutions for technicians performing corrosion mapping inspections. Both the modularity of scanners and integration with software enables operators to set up inspections quickly, easily and efficiently. All of the tools are available for corrosion mapping inspections, particularly for coated/painted assets and assets with massive corrosion. TFM further enhances the capability of detection of small pitting, while autosizing allows for characterisation of a large corrosion map, quickly. All of this leads to best practices for corrosion mapping, with advanced UTs.
May 2023 HYDROCARBON ENGINEERING 64
Page Number | Advertiser OFC & 17 | American Petroleum Institute (API) 44 | AMPP 41 | Ariel Corp. 04 | BCCK 31 | Crystaphase 19 | Curtiss-Wright EST Group 11 | Elliott Group 13 | MAN Energy Solutions 27 | Merichem Company OBC | NEUMAN & ESSER 35 | Optimized Gas Treating, Inc. IBC | Palladian Publications 43 | Re-Gen Robotics 24 | REMBE® GmbH Safety + Control 60 | S.A.T.E. 20 | Servomex IFC | Trillium Flow Technologies™ 59 | Valve World Expo Americas 55 | VEGA 02 | Yokogawa 07 | Zeeco Inc. 47 | Zwick Armaturen GmbH AD INDEX


Read the issue here Subscribe for free: www.globalhydrogenreview.com A new magazine focused on the global hydrogen sector The Spring issue of Global Hydrogen Review is out now
Compressors Enabling the Energy Transition
At NEUMAN & ESSER, a century of hydrogen compression expertise meets the technologies required for a decarbonized society.


As an OEM for reciprocating compressors, electrolyzers and reformer systems including HRS, we bring in all plant components along the value chain and balance them for the optimal overall solution.

Family-owned for almost 200 years, we are a trusted partner of the industry, getting challenging projects to life – from evaluating project feasibility, through engineering, construction, and commissioning to digitally supported 360° service during operation.

NEUMAN & ESSER: Agile. Solution. Experts.


neuman-esser.com