ENERGY GL BAL
SPRING 2023


34. A digital game-changer for LCOE reduction
Miguel Ángel Torrero, VP Power & Renewables, Enverus, and Co-Founder, Rated Power.
38. Surveying for site suitability Wesii, Italy.
44. The rise of energy storage
Sonia Quiterio, Conrad Energy, UK.
48. Making the UK green Eric Adams, Hydrogen Projects Director, Carlton Power, UK.
54. Giving the green light to hydrogen
Afkenel Schipstra, First Hydrogen, the Netherlands.
58. Building the energy future
Gerhard Lohe and Dr Thorsten Becker, Doosan Lentjes, Germany.
10. Protecting the energy mix
Somaieh Salehpour, VP of Strategic Marketing and Technology, Seal for Life, USA.
14. Invest in wind
Mark Goalen, Houlder, UK.
18. Raising the voltage
Luiza Ferreira and Alex Rimmer, 2H Offshore Engineering, UK.
26. Making solar shine
Christian Hürlimann, MET Group, Switzerland.
30. Setting up software architecture for an integrated platform
Christos Georgopoulos, Power Factors, Greece.
Reader enquiries [enquiries@energyglobal.com]


62. The future of biogas energy in North America
Mariane Ferencevic, Director of Business Operations, Fitec Environmental Technologies, Canada.
66. Securing a green world


Bernard Montel, EMEA Technical Director and Security Strategist, Tenable, France.
70. Global news
With more than 60 years of experience, Seal For Life Industries offers the most diversified coating solutions in the market for superior infrastructure protection. In the rapidly growing sector of renewable energy, Seal For Life are primed to provide the vital protection the industry infrastructure needs with a wide range of brands and products.
The company's goal: To make renewable energy truly sustainable. To learn more, visit: www.sealforlife.com


rivate capital has played a critical role in financing the growth of renewable energy over the last two decades. According to the International Energy Agency, more than 80% of total power sector investment globally is focused on renewables, grid integration, and storage. Furthermore, solar makes up almost half of this new investment, split between utility scale and distributed systems. Unsurprisingly, this has resulted in an influx of private capital into the space, with S&P Global reporting over US$21.5 billion invested in the US alone during 2021.
Much of this investment has traditionally been focused on asset owners, with pension funds and long-term capital managers investing in utility scale power plants. However, Clairvest’s activity in the renewables space over the past few years has supported an important shift towards investment in companies that enable the energy transition and support assets during and after their construction and commissioning period. Understanding this shift and the role of private equity outside of asset ownership is vital for leaders in the space.
The transition towards renewables has been a long-term secular trend in response to the fundamental need for reductions in carbon emissions and domestic energy security. Traditionally, this transition was supported by government incentives but, over the past several years, the declining capital cost of renewable energy has accelerated this transition.
Government action is again set to pour more fuel on the fire with the passage of the Inflation Reduction Act, which underscores governmental support for all forms of renewable power. Similar legislation is being passed globally, with a focus on reducing carbon emissions and empowering renewable businesses.
These new policies and continued declines in the capital cost of renewable power plants will enable continued growth for businesses in the sector. As rapid demand

Pgrowth occurs, it typically drives a need for capital and expertise to support businesses as they scale. Private equity can assist companies in navigating rapid growth transitions by providing a stable balance sheet, a long-term outlook for success, and expertise in navigating the common pitfalls of a scaling business.
Private equity can provide tangible benefits, including access to equity and debt capital, strategic planning, support with mergers and acquisitions, and bolstering the team as the company grows. In addition, private equity firms typically have experience growing and scaling businesses, which allows management to better play to their strengths as industry experts.
However, there are several private equity investment styles, and it is important to choose a partner that aligns well with the business’ goals and aspirations. One of the most important factors to consider is whether or not a company is comfortable giving up control to a private equity firm, or if they would prefer a minority investment. Each has their advantages, but results in vastly different partnership structures. With minority partnerships, existing management is in control of the business and drives the business’s strategy. Conversely, majority partnerships provide private equity firms with a greater say in the day-to-day operations and business’s overall direction.
In contrast to asset ownership, which is typically long-term, private equity investment periods commonly range from 3 – 7 years, and investors are typically looking to realise a return by year five. Management should carefully analyse the average hold period of a private equity firm to ensure it is aligned with their business plan; if management has a 7 – 10 year plan to fully realise the potential of a company, but a private equity firm has a 3 – 5 year time horizon, there could be a potential misalignment of interests.
Through partnerships with NovaSource Power Services and ALSO Energy, Clairvest has witnessed the value that is created through an aligned partnership between the right investor and companies that service the renewable energy sector. Ultimately, this leads to the creation of strategically significant businesses – ones that are vital to the future of renewable energy.
he world is attempting to shift away from a fossil fuel energy system to a materials-intensive renewable energy system, but the raw material markets which are vital for mass deployment of renewables face a range of challenges. The coming decades will see vastly more competition for the materials needed for the green transition, and Asia will be at the centre of this.
Electricity systems are where the most rapid change is expected, as the technologies needed to decarbonise the grid are available; and electricity is the lynchpin of a green economy. Decarbonising other sectors often relies on the electrification of fossil fuel processes or electrolytically produced feedstocks, such as hydrogen. Mass decarbonisation, which is needed to hit Paris Agreement targets, cannot happen unless there is investment in grids and renewable generation.
Energy systems across Asia will rapidly change over the coming decades, with the transformation being at a pace not previously seen in human history. This will be led by huge growth in solar and wind capacity – by 2050, CRU expects 55% of all solar and wind installations will have taken place in Asia.
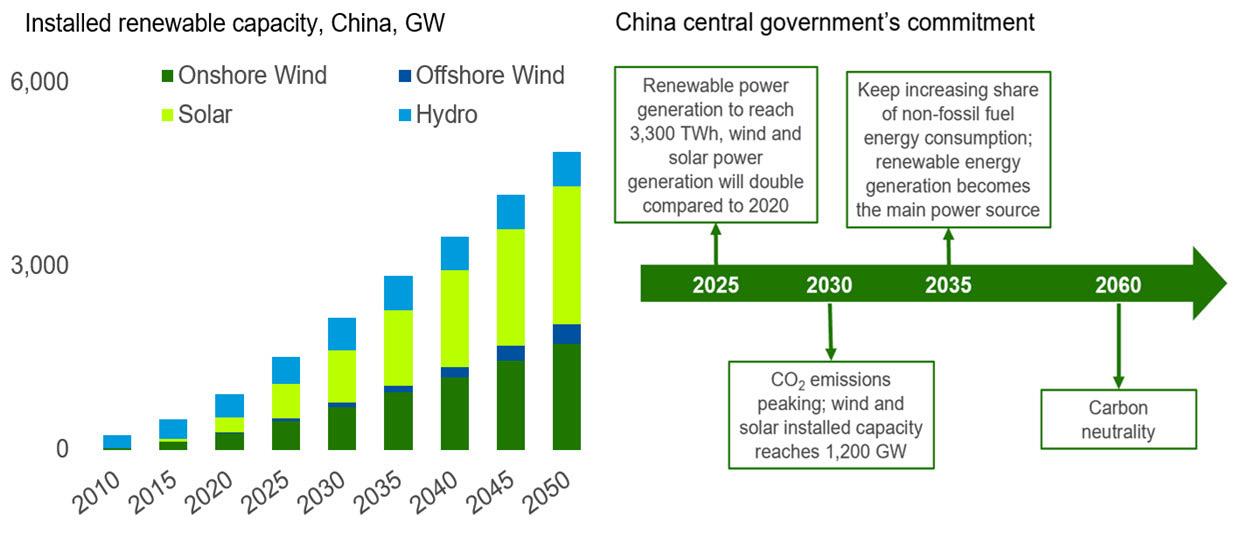
China is central to this story, both because of its huge domestic power requirement and vast manufacturing base. China has already installed approximately 750 GW of solar and wind (n.b. approximately 40% of the cumulative
global total), as well as over 400 GW of hydro capacity. Indeed, CRU forecasts Chinese renewable installations will surpass the government’s commitments and, by 2030, expects Chinese installed capacity of wind and solar will reach approximately 1650 GW – approximately one-third above the government target.
The Chinese government has committed to carbon neutrality by 2060, which will require huge additional solar and wind installations, and CRU forecasts capacity will hit over 4300 GW by 2050. This will take a monumental quantity of raw materials and will test supply chains globally. However, China’s ability to deploy at scale should no longer be a surprise.
Yet, risks remain. The Chinese central government released a raft of financial support and obligatory targets to drive renewable energy, but it also removed many subsidies in 2021. Moreover, coal has seen a recent resurgence and will remain vital in China’s energy mix for at least the next two decades.

Japan is aiming for carbon neutrality by 2050. By 2030, the Japanese government has previously pledged to increase the share of solar power to 14 – 16% from 2.7% today, and wind power to 5% from 0.8% today.

South Korea has made pledges to increase renewable generation to 20% of the power mix by 2030, with offshore wind being a focus. While these targets are modest, the country is also increasing nuclear output.
India is a market with huge potential, a vast population, and pent-up demand. The government has pledged to take non-fossil energy capacity to 500 GW,
CharlieDurant,CRU,UK,


providesinsightintosomeofthechallengesAsiawillfaceinitsenergytransitionto renewables.
and for 50% of its electricity requirements to come from renewables by 2030. However, given current rates of change, India’s pledges are challenging.
Elsewhere in Asia, the lack of carbon prices/costs will keep fossil fuels competitive with renewables. However, there will be regional variation and subsidies will play a role. For example, Vietnam has driven large solar capacity additions through feed-in tariff schemes and, across Asia, ‘Just Energy Transition Partnerships’ and financial support are building momentum. Yet, installing so much capacity, not just in Asia but globally, in such a short time will be challenging for the region and commodity markets will be tested.
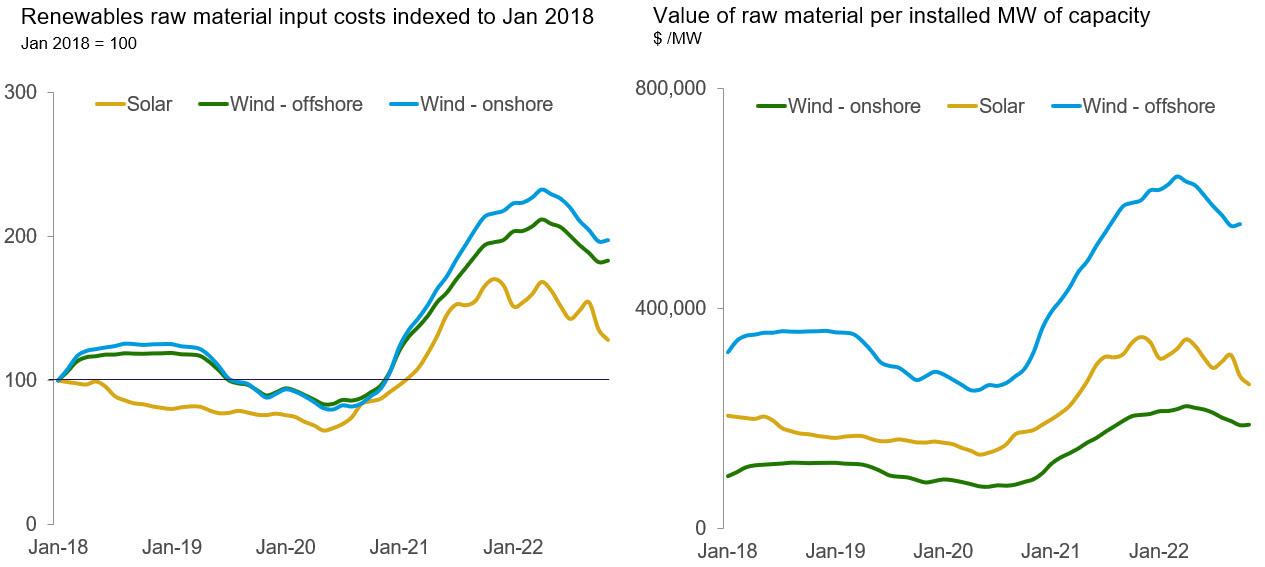
Metals demand will be shaped by the energy transition, but applications will also be shaped by materials pricing. Historically, metal costs accounted for 7 – 15% of upfront CAPEX costs, but this will be higher in the future.
Commodity prices rose to very high levels in 2022 and, even though some have seen substantial declines, they remain high. Many commodities are likely to remain elevated into the medium term due to increased
demand pressures. These will directly feed into higher costs for renewables.
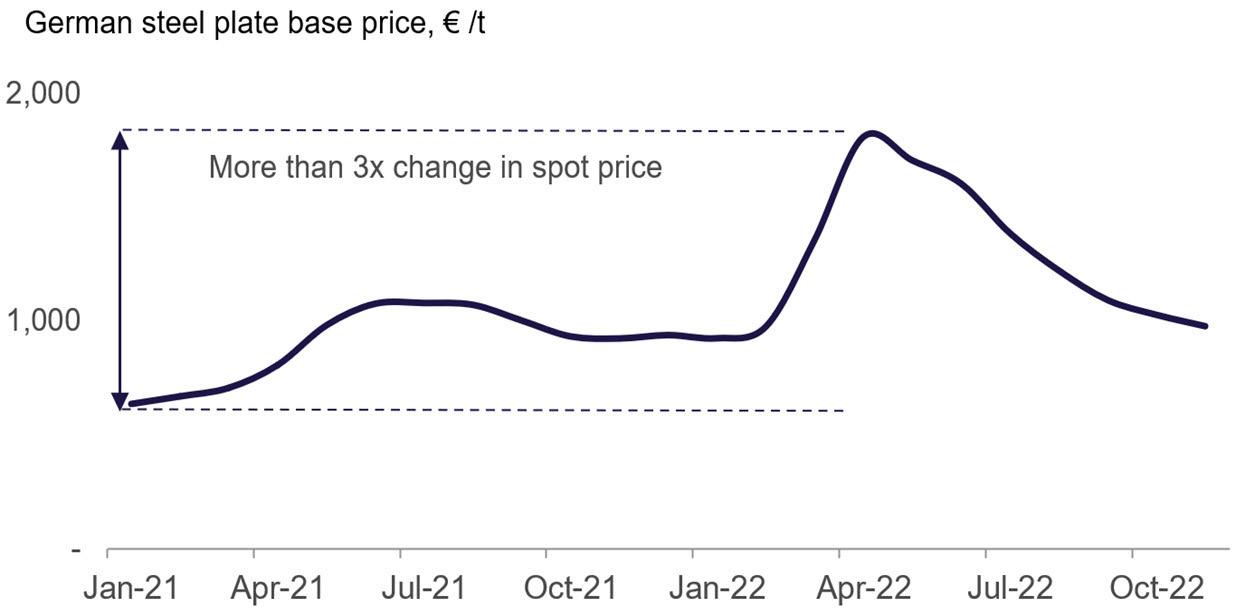
Managing price risk in volatile markets will be vital. A good example is offshore wind, which requires large volumes of steel over long build periods. Steel is used for the tower, transition piece, offshore substation and, most importantly, the foundation. A monopile foundation is essentially a large steel tube driven into the seabed. Supporting a large turbine out at sea presents a challenge for material strength and durability – and steel plates provide an excellent solution to that challenge.
Steel prices are volatile and purchasing teams in offshore wind companies face the challenge of market timing or require complex risk management. CRU discovers plate prices globally, including across Asia, but Figure 3 shows a cautionary example of the volatility European plate consumers faced between 2021 and 2022.
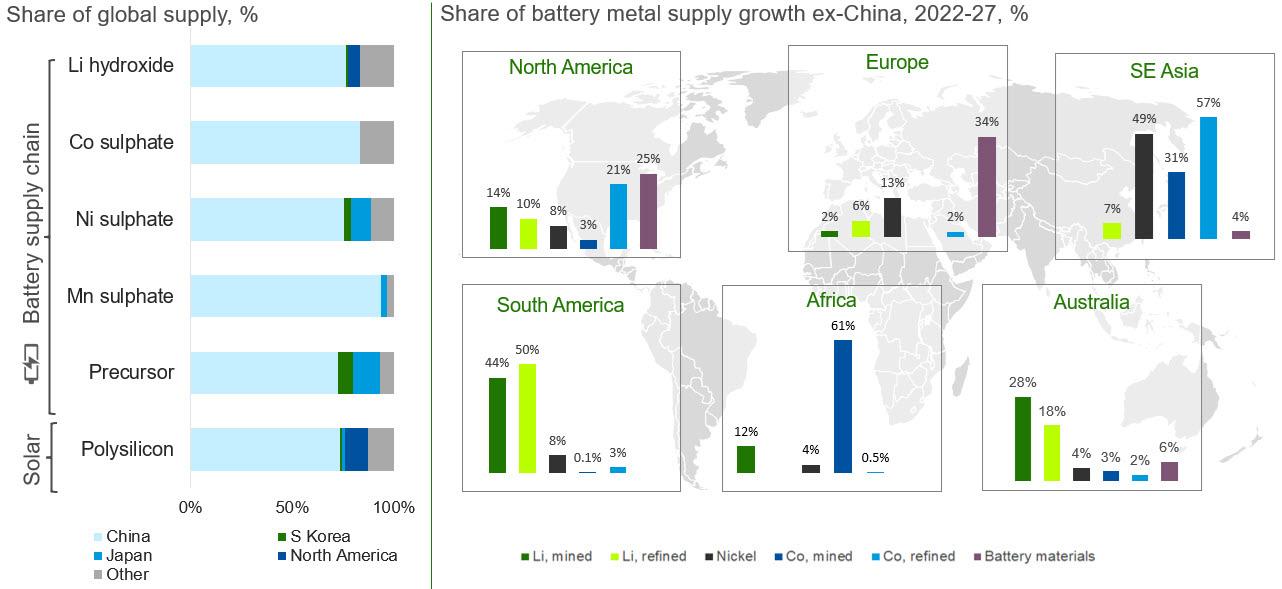
Almost all polysilicon for solar production is in China, and – along with silver-paste, glass, and frames – it is a key input cost for solar cells. Prices of polysilicon have increased hugely over the last two years, but prices are likely to come down, at least in the short term. However, this supply chain is becoming increasingly politicised, attracting the interest of policy makers globally, which will have implications for solar module costs. Affordable solar photovoltaics will be crucial if Asian countries are to achieve their decarbonisation goals.
Copper is used more intensively in renewables than in conventional generation, and so solar and wind are vital for copper demand growth – although they are a relatively small part of today’s markets. CRU forecasts global copper consumption in solar and wind installations will double from 2020 to 2030, hitting 1.5 million t. Huge grid enhancements are also needed, which will further boost copper demand. Along with demand growth from electric vehicles, growth of the global copper market is almost entirely contingent on a green transition.

The copper industry is heading for a significant structural imbalance, causing a supply gap from the middle of this decade that will impact prices. CRU forecasts over 6 million t of mine production will need to be added to the copper market to meet projected demand in 10 years. Much of this is needed to power green technologies.
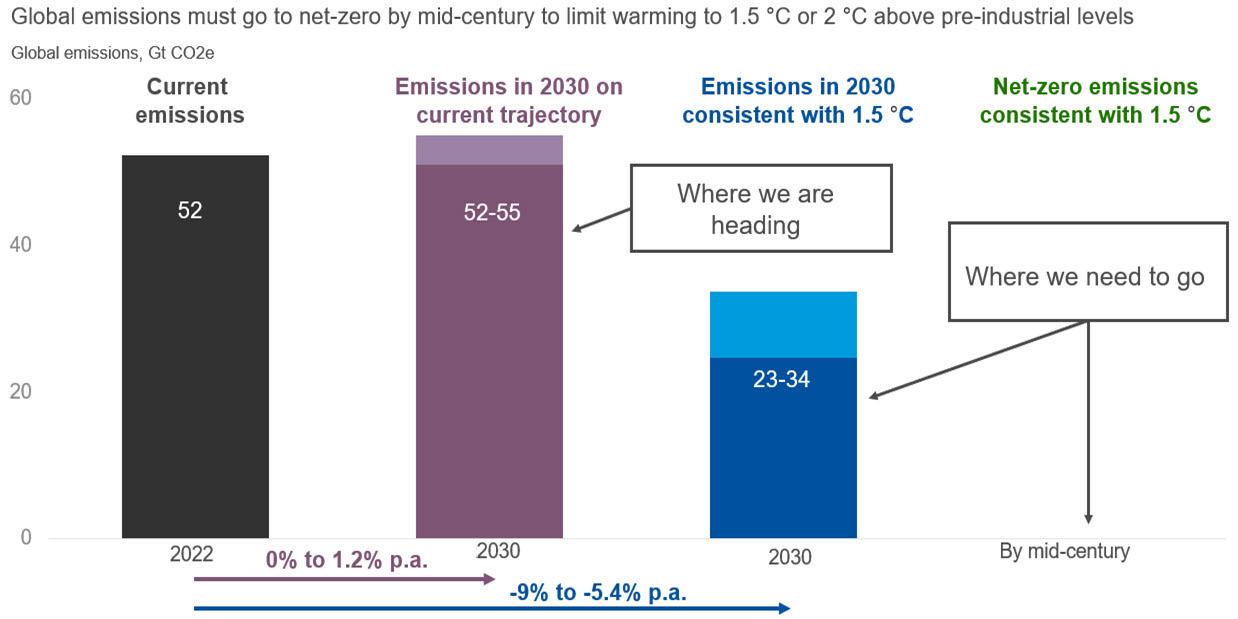
Figure 1 . The world is not on track to limit temperature increases to 1.5˚C. Source: Climate Watch.■ Many companies rely on Boehlerit‘s innovative technology to manufacture their products. The Styrian carbide specialist Boehlerit is guaranteed to be behind many everyday products.


To incentivise new production coming online, copper prices will need to lift to levels where opening a new mine can be profitable. This price will need to cover more than just the cash operating costs if sufficient supply can be found. Copper mine constructions are large and complicated investments, and higher prices may be needed if the market is to meet the needs of the energy transition.
A rising share of renewables will cause more variability in electricity supply, and grid balancing will become more complex. In addition to improved grids, power storage
systems will be needed to ensure the dispatch of electricity even when wind or solar generation is low. The true cost of renewables, therefore, needs to take account of power storage in the system.
With technological improvements, CRU believes variability can be managed and will not stop a significant roll out of new renewables capacity in the coming years. But the need for mass deployment of batteries for grid storage creates new supply chain risks.
China currently plays an outsized role in raw material markets vital to wind and solar production. Chinese companies are even more dominant in battery material supply chains.
Concentrated supply chains can exist at a corporate, as well as national, level. Out of thousands of cable factories worldwide, only around 30 sites can currently produce subsea cables due to relatively high technical and capital entry barriers. For offshore wind, when including installation costs, wire and cables can account for approximately 17% of the total project cost. This is due to the extensive usage of high-value subsea export and array cables, in addition to the sophisticated cable-laying works required by specialist vessels. Moreover, CRU foresees a clear challenge for subsea cable producers to meet such exceptional demand.
Beyond economic and market considerations, geopolitics and trade rules pose additional risks. For example, there are significant anti-dumping duties on Chinese products in the solar value chain in many global markets and countries. Moreover, the US has brought in a raft of measures to boost domestic manufacturing and could remove China from the US solar supply chain altogether. Similar legislation could follow from other markets, such as the EU.
Trade measures are also evident in Asia. India introduced import duties of 40% on solar modules and 25% on solar cells in April 2022. With approximately 80% of solar panels imported (mainly from China), this has led to higher costs and more limited availability of solar panels, with at least one large solar project having been put on hold. In addition, the new policy only allows procurement of
Figure 3 Chinese renewable power generation will expand massively. Figure 4 Managing commodity price volatility will be a challenge. Note: Carbon fibre and glass prices not included.solar panels for government-funded projects from the approved list of mainly domestic suppliers, which have limited capacity. India is forecast to start polysilicon production in 2025.
Despite these policies, by 2026, CRU forecasts that China will still account for approximately 87% of polysilicon capacity, with the rest coming from North America, Europe, North Asia, and India.
Renewable developers looking to lower Scope 3 emissions need to source low-carbon dioxide (CO 2 ) commodities. However, decarbonising many commodity markets will be a huge task, requiring massive CAPEX, process flowsheet change, and sufficient supply of energy, as well as raw materials. Understanding the nuances of emissions produced in commodity markets requires good data.
The roll out of electric vehicles, as well as wind and solar power generation capacity, will add over 10 million t of aluminium consumption by the 2040s. Solar panels often use aluminium in installation brackets, although steel is mostly used for utility installations. Moreover, nearly all bare overhead cables are aluminium. Yet, aluminium is notoriously electricity-intensive, requiring an average of 14.2 MWh/t. To add to this complexity, CRU’s models show emissions from smelters can range from 2 – 20 tCO 2 e/t on a Scope 1 and 2 basis.
Producing steel can also be CO 2 -intensive. CRU data shows that making steel plates – typically used for monopile construction – using a blast furnace emits a global median of approximately 2.4 tCO 2 /t. Polysilicon and silicon metal production can be highly emission-intensive processes.
Despite the high emissions from these inputs, the lifecycle emissions of renewable power are, even today,
still significantly lower than for fossil fuel power. But emission targets will tighten, and commodity markets will need to decarbonise also. This will be a huge challenge and consumers of commodity-intensive products will likely face higher prices as a result.
The mutual dependency between commodity and energy markets is increasing and is expected to continue as the global economy transitions to a low-carbon economy. The world is shifting from a fossil fuel- to a materials-intensive energy system, and the needed rate of change is unlike anything that has been seen before. The transition will also require a transformation across economies, which will influence transport, industry, agriculture, and building sectors, as well as societies, on a similar scale. Decarbonising the world will therefore require vast CAPEX over the coming decades.
Commodity markets are complex, ever changing, and subject to multiple forces – and a deep understanding is vital when analysing the impacts of the transition. Historically, commodity markets have adapted and many could – at least theoretically – be significantly scaled up and decarbonised. The real question is how best to do this, and having a good understanding of costs will be key to achieving this.
Hitting many of the decarbonisation and renewable installation targets across Asia will be extremely challenging. Despite large scale promises and aspirations, supply chains will be stretched and trading relationships are being tested.
Having the necessary business intelligence in this space will therefore be needed to successfully navigate these challenges.
Somaieh Salehpour, VP of Strategic Marketing and Technology, Seal for Life, USA, highlights the various ways that coating technologies are able to protect the renewable energy infrastructure.
sustainable future is ahead of us, and the wind industry is proof of that – it has been rapidly expanding over the past couple of years, with over 93 GW of wind energy installed globally in 2021. Solar energy generation also increased by a record 179 TWh (up 22%) in the same year. These are both vital parts of the future mix, but other technologies will be needed to reach the challenging goals set.

The UK has made major commitments into offshore wind with over £900 million invested in offshore wind manufacturing plants in 2021, the highest on record since the industry arrived in the UK in 2000. The UK offshore wind industry is committed to creating tens of thousands of jobs, with 26 000 already working in the sector and this set to increase to 69 000 in the next five years.
The US has conducted offshore wind lease sales off the coast of New York, fetching over US$4 billion, a major step in the US’ push to renewable energy. Plans have been announced for areas in the Gulf of Mexico and the Central Atlantic to be made available for auction, and they are in the process of analysing suitable sites off Oregon and in the Gulf of Maine. Asia-Pacific region’s wind energy sector could soon account for approximately a quarter of their power this decade, with China set to be the largest market by 2030. And India is expected to install approximately 20.2 GW of wind power capacity
between 2021 – 2025, a growth of nearly 50% compared to the 39.2 GW currently installed in the country.

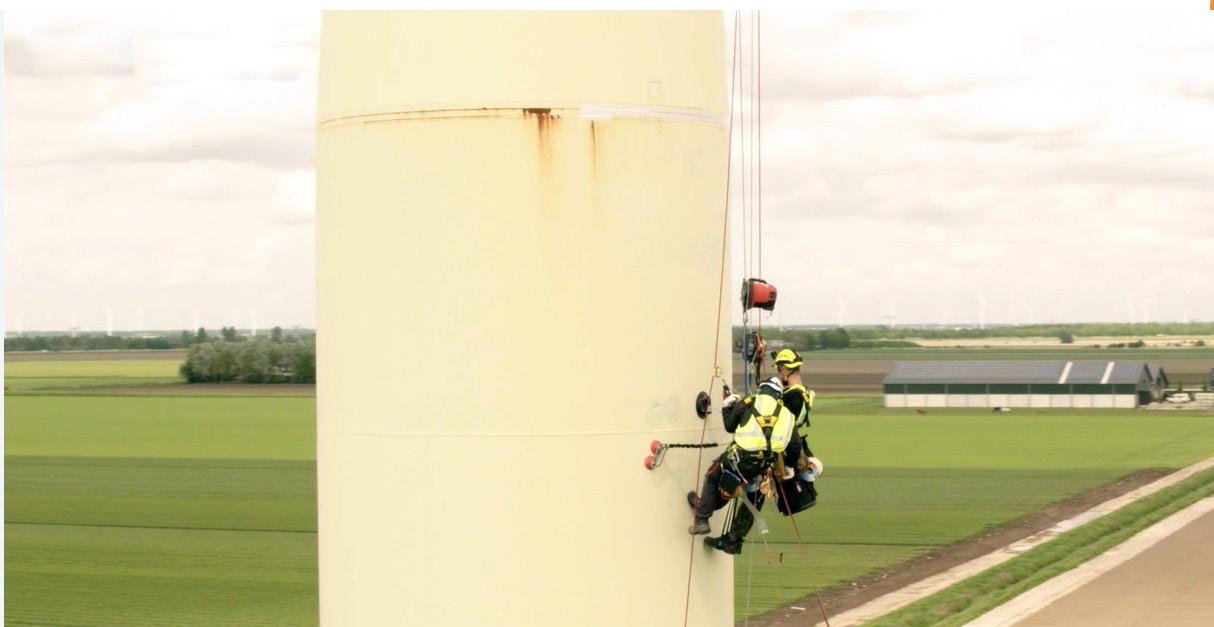
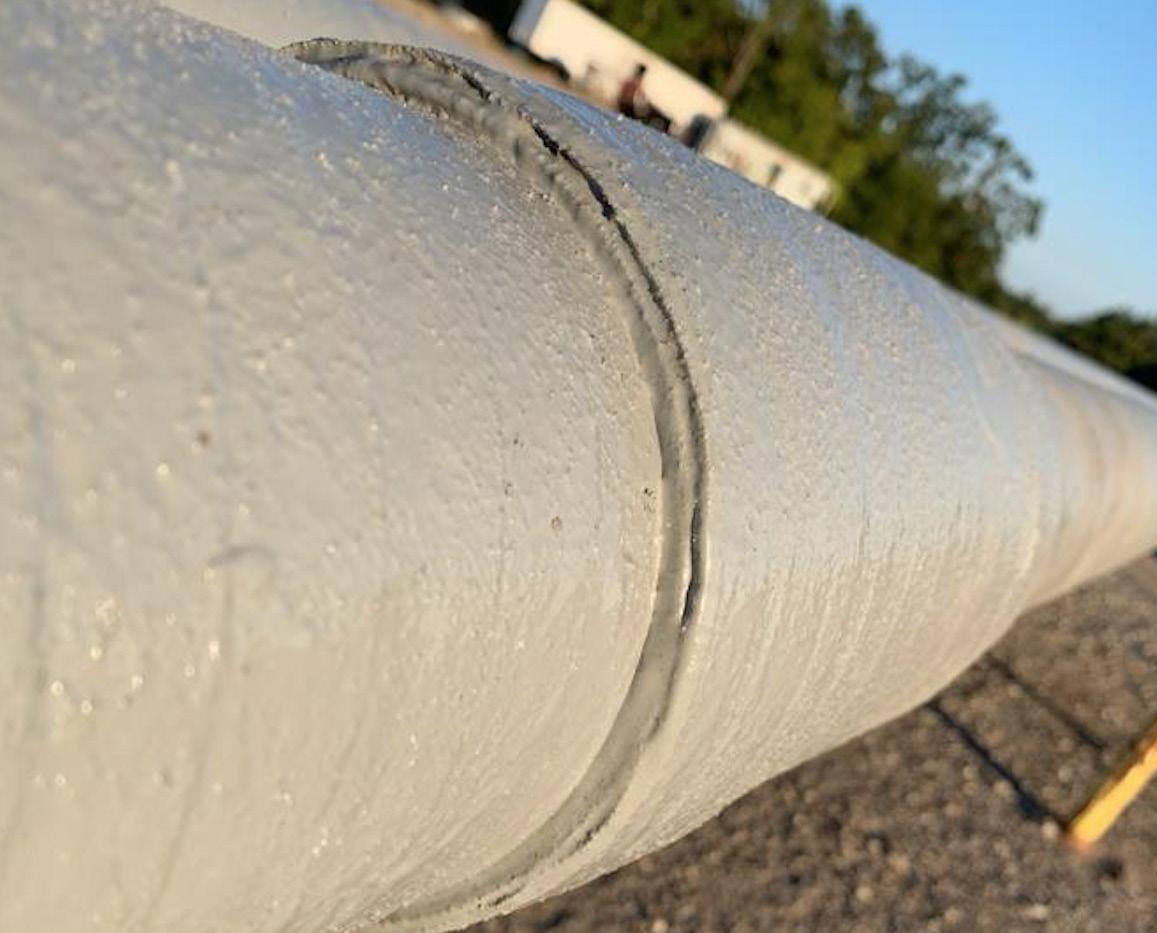
Easy-Qote has been making great strides in protecting this all-important infrastructure to the sustainable future. A brand on a mission to change the way corrosion prevention is viewed, and conducted, with it being applied simply as a patch.
In the case of Easy-Qote, one individual or small team is armed with a wire brush and a roll of patches. Simply brush loose corrosion away, apply the patch, and return to base. No blasting is required, avoiding the all-important issue of environmental contaminants. Overhead costs will be greatly reduced, with transportation and manpower costs down. Instead, protection is immediate and with a service lifetime of 25 – 30 years, the asset can now reach its full potential with long-term protection.
Geothermal energy is like an Earth-driven radiator, with no harsh chemicals, instead just using the Earth’s heat to provide energy. To do so, it is necessary to drill deep, but to drill this deep, company’s need to provide insulation protection to the drill pipe/equipment, as well as extreme temperature, abrasion, and pressure challenges to both the internal and external coatings.
Team Highland/Seal For Life have been hard at work the past two years, coming up with an exterior and interior coating solution for deep well drilling for thermal wells with Eavor and putting them into action.
Incorporating both Highland and US coating technologies and the company’s internal R&D expertise, the project has identified over 82 drill sites so far, with the first deep well tested early in 2022.
Products that went out to the first well drilled in early 2022 include Highland 74-INS-AR, Novolac Liner technology for the internal pipe joints with added abrasion resistance, and Highland 6521-INS, 100% solids Novolac technology with insulation package for the outside of the pipe joints, offering insulation and abrasion resistance (this is a combination of Highland and US coatings technologies).
At the end of 2022, the deep well depths have reached 3 miles/4 km with success, nearly three times the depth that are typically used for standard oil drilling operations and supports clean energy options. These depths also equate to higher performance requirements for heat, insulation, and abrasion resistance.
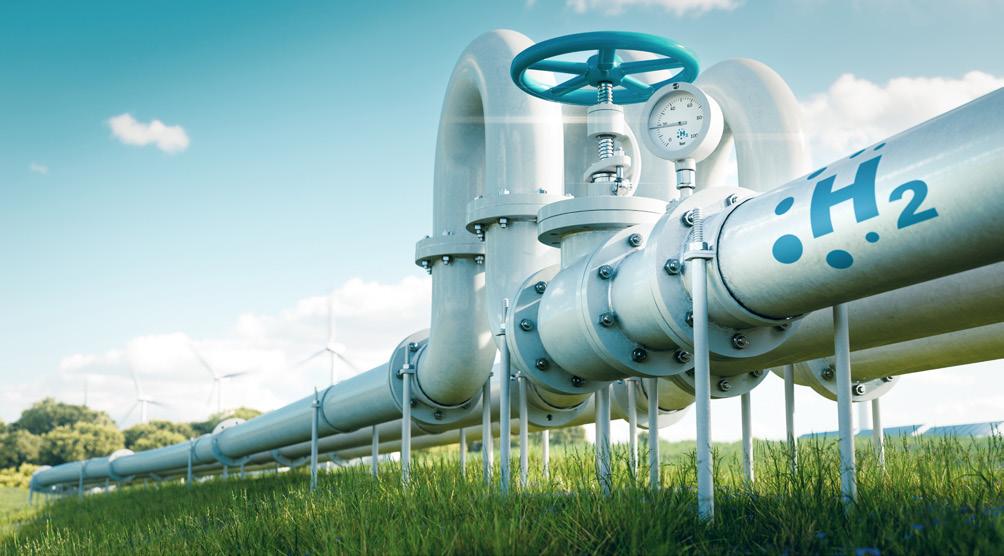
Hydrogen has the potential to be a game-changer for the future of energy, as it offers a clean, renewable, and versatile fuel source. However, widespread adoption of hydrogen will require significant investment in infrastructure and technology development. Retrofitting existing pipelines for hydrogen is crucial in order to take advantage of the potential benefits of hydrogen as a clean energy source. By repurposing existing pipelines, governments and operators can avoid the high costs and environmental impacts associated with building new infrastructure from scratch. Additionally, retrofitting can accelerate the adoption of hydrogen as a fuel source by enabling faster deployment and reducing barriers to entry for hydrogen producers and users.
At present, the development of internal coatings for retrofitting existing pipelines is a hot topic in the coating and energy industries. With the possibility for hydrogen to greatly contribute to the future energy-mix, there is significant interest and investment in developing coatings that can ensure the safe and efficient transport of hydrogen gas.
Seal for Life has been actively working on creating a coating solution for the hydrogen transport market, and also developing test methods to evaluate the solutions. The company has developed interesting prototypes that are currently being tested according to field conditions.
The coating industry is also collaborating with the energy industry to advance the development of hydrogen transport coatings. For example, the Association of Materials Protection and Performance (AMPP) has established a working group to address the challenges associated with the transportation of hydrogen through existing pipelines and requirements for internal coatings.
Seal for Life is very involved in technical committees such as this one, where working groups bring together experts from the coating, energy, and pipeline industries to share knowledge and to develop solutions for the safe and efficient transport of hydrogen gas. The company strongly believe that collaborative efforts between the coating and energy industries are essential to advance the development of these coatings and support the transition to a low-carbon future, and is proud to be an active part of the energy transition.
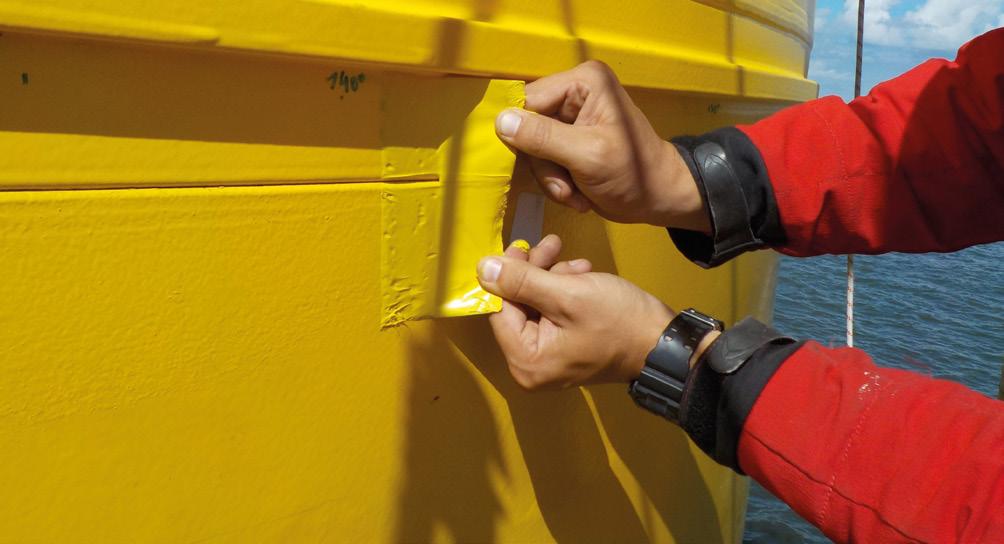 Figure 1 Easy-Qote installation requires minimal manpower.
Figure 2 EQ applied simply as a patch.
Figure 4 Hydrogen will soon be a key part of the energy mix.
Figure 1 Easy-Qote installation requires minimal manpower.
Figure 2 EQ applied simply as a patch.
Figure 4 Hydrogen will soon be a key part of the energy mix.

We have checked the operation behaviour, scheduled maintenance and installed updates. As your service partners, we keep your business running smoothly, securing availability and efficiency 24/7, around the world, on-site and digital. We’re there – so you can be away from time to time. Get support at www.man-es.com/primeserv

Mark Goalen, Houlder, UK, outlines the barriers to floating offshore wind commercialisation.

While the offshore wind market enjoyed its best year ever in 2021, with 21.1 GW of capacity commissioned, only 57 MW of that was floating wind – as reported by the Global Wind Energy Council (GWEC).1 It is clear that, as with most nascent technologies, barriers to full commercialisation exist.

One of the barriers to full floating offshore wind commercialisation is developers selecting the best floating foundation type for each offshore site and its unique conditions. There are many floating foundations to choose from, but they can typically be categorised in four main structure types: spar buoy, tension leg platform, semi-submersible platform, and barge.
One of the key technical factors that will influence the floating foundation choice is its motion response to environmental conditions. Understanding the effect of these motions is fundamental as it impacts everything from mooring design, the dynamic cable, the tower and, arguably most critically, the nacelles which have limitations that must be factored in. Each of the floating foundation types has other varying characteristics which effect how it responds to the marine environment.
To date, most projects using these foundations can be seen as demonstrators, which have been driven by the floating structure designers themselves to prove
their technology, rather than to provide developers with an objective demonstration of each technology for a given site and environmental conditions. As such, there is still a fundamental need to identify the best technical solutions for each planned floating site that will minimise costs, risk, and inefficiency for developers.
These demonstrators have also used conventional wind turbine generators, which were originally designed for onshore or fixed wind. Given the number of known challenges associated with operating and maintaining these conventional turbines in a dynamic environment, it is expected that over time, disruptive technology (such as X1 Wind’s weathervaning downwind concept, SEATWIRL’s vertical axis turbine, and SENSEWind’s self-erecting nacelle system), or other technology innovations will gain traction and direct the evolution of the industry.
Ultimately, there will not be a single definitive foundation type as there are lots of additional variables that will impact the decision, including a technologies’ operability, reliability, practicality, readiness, CAPEX, OPEX, and potential longevity, to name a few. A developer will select a foundation most suitable for the wind farm they are developing and, especially given that many developers’ portfolios are global, this will vary from site to site. Therefore, advanced floating foundation selection involves collaborating with the right partners to analyse a combination of technical and operational factors and, arguably, the latter may have a bigger impact throughout the asset’s lifecycle.
One such operational factor, and indeed one of the most significant barriers to rapid floating offshore wind commercialisation, is supply chains. Port infrastructure, site capabilities, logistics, and operations and maintenance (O&M) access are all vital supply chain considerations. It is essential that developers and other stakeholders have a holistic understanding of site selection criteria and processes, equipment, vessels, and crews involved from the very start to optimise their floating wind projects.
In November 2022, the news broke that Shell had cancelled the construction of a demonstrator floating wind farm off
the shore of France. Shell cited supply chain issues among the key reasons for abandoning the project. Just a few months before, Equinor announced delays to the roll-out of its floating Hywind Tampen project, also citing supply chain issues.
Despite floating wind successes and high ambitions, as Shell and Equinor have proven, supply chain constraints remain a key barrier and, again, collaboration will be required to realise the full potential as the industry moves forward.
Currently, there are 14 floating ScotWind projects, and these are likely to face supply chain challenges as well. ScotWind is assuming to mostly use 18 – 20 MW turbines. However, these are not actually available yet, so it is a bold assumption on the developers’ part. For a 10-year period (2029 – 2039) for manufacturing and installations, achieving ScotWind’s ambitious goals would require approximately 125 units to be made per year.
Critically, many Scottish ports do not have the required areas to deliver commercial scale floating offshore wind without significant investment and infrastructure development. Decisions on floating foundation type are yet to be made. Until that is known, the supply chain cannot form, and investment cannot be made in port infrastructure.
For ports that will support a new development: location, infrastructure, water depth, available space for fabrication, and storage are all key. Taking the UK as an example, current options are limited. Individual ports do have plans to invest, but none will be sufficient to cover all options, and there is therefore a chance that significant parts of the manufacture could go to Europe or Asia.
Up to now, this lack of port infrastructure has been driving the choice of concrete over steel foundation. It would appear easier to manufacture concrete structures because it requires a less skilled workforce. These structures only require the moulds and raw materials, not the specialised welding equipment or qualified welders. Steel can be prefabricated elsewhere and assembled, but that builds in additional fabrication risk and requires additional transport of large components, increasing costs and carbon footprint.
Interestingly, there is one possible solution being used by Copenhagen Offshore Partners on the Pentland development. The company has selected the Stiesdal TetraSub for the site. The philosophy of the Tetra concept is such that the parts can be fabricated in existing fabrication facilities. The completed parts are then delivered to site for assembly. They do not need welding and it is expected that two full units per site per week can be assembled. This kind of system looks very attractive from the supply chain perspective as it overcomes a lot of the existing barriers. All eyes will be on the performance of the units in Pentland, ahead of developers selecting floating foundations for ScotWind.
O&M is an even bigger challenge facing the industry. Floating foundations are currently towed back to port for maintenance and repairs. However, this will not remain viable or economical as wind farms are located further offshore and the distance to O&M ports increases. The ability to conduct O&M on location must be developed, because the risk and costs associated with connection and disconnection and transportation of the wind turbines will prove too high over time. A combination of modifying the turbine, as well as developing the tools and vessels required to support this O&M phase, will be crucial to the success of floating wind.
Having the right expert advice available on everything from motion response to supply chains and from port infrastructure to O&M, from the outset of the project, ensures that developers gain a holistic understanding of the processes, equipment, vessels, and operations involved throughout. Independent marine and offshore design and engineering specialists can provide consultancy on the costs, timeframes, emissions, and risks of each floating wind technology – supported by technical analysis.
With the right collaboration and investment, the supply chain challenges in Scotland, and globally, can and will be overcome to ensure the floating offshore wind industry becomes a pillar stone of the global energy transition.
1. ‘Wind industry enjoyed its second-best year but scaling-up for Net Zero requires policy breakthrough’, Global Wind Energy Counci, (4 April 2022), https://gwec.net/wind-industryenjoyed-its-second-best-year-but-scaling-up-for-net-zero-requires-policy-breakthrough/.
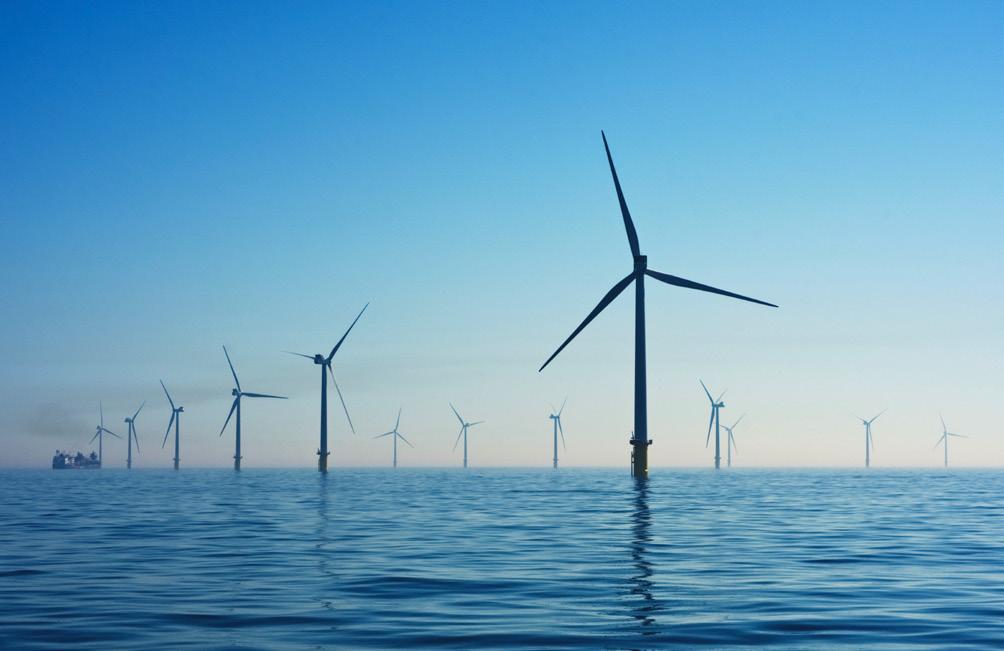
Figure 2 Rampion offshore wind farm, the UK. Source: Unsplash.Adjusting existing units to new feedstocks is challenging and uncertain. As you transform your operations to meet new market demands, Sulzer Chemtech brings expertise to help operators efficiently process pyrolysis oils from waste plastics and biofuels with innovative licensing technologies and purification systems.


Contact us for more information chemtech@sulzer.com
Sulzer Chemtech – We make chemistry happen!
Floating offshore wind is emerging as the solution for wind energy in water depths where fixed foundations become unfeasible (>60 m). Market projections indicate that up to 46 GW of floating wind will commence installation globally by 2035.1 Given that in 2022, only 60 MW of the global installed offshore wind capacity came from floating wind, this represents a massive growth in a short timeframe.
A significant part of the technology proposed for offshore floating wind projects is able to come from similar oil and gas energy technologies. For example, the main floating substructure designs (spar, semi-submersible, barge) and mooring line and anchor configurations (catenary, taut, semi-taut) are all based on oil and gas technologies that are widely used. Although the principles remain similar to oil and gas, the design will need to be
Luiza Ferreira and Alex Rimmer, 2H Offshore Engineering, UK, explain the need for, challenges associated with, qualification of dynamic high-voltage power cables for floating wind farms.

adapted to the operating conditions, specifications, scale, cost, and volume for deployment in floating offshore wind.
The inter-array dynamic high-voltage (HV) power cables are, however, an area where technology from other similar applications is not directly applicable due to the unique combination of HV and large dynamic motions under environmental loads (sea waves, wind, and subsea ocean currents). This presents a significant challenge to developing and qualifying new HV power cable technology for dynamic inter-array cables, and also to ensure that the designs can be configured and applied to each project in an efficient and cost-effective way.
This article will explain some of these challenges, and dive into some of the areas which are supporting the development of workable power cable configuration for the next offshore floating wind farms throughout the world.

It will also look at how this can be done without the need to conduct expensive qualification testing each time a new wind farm is installed.
The inter-array dynamic HV power cables (Figure 1) will be used in all floating offshore wind farms to connect the individual wind turbines to their neighbours and to the offshore substation so that the power can be transmitted to where it is needed. They are an area where technology from other similar applications is not directly applicable.
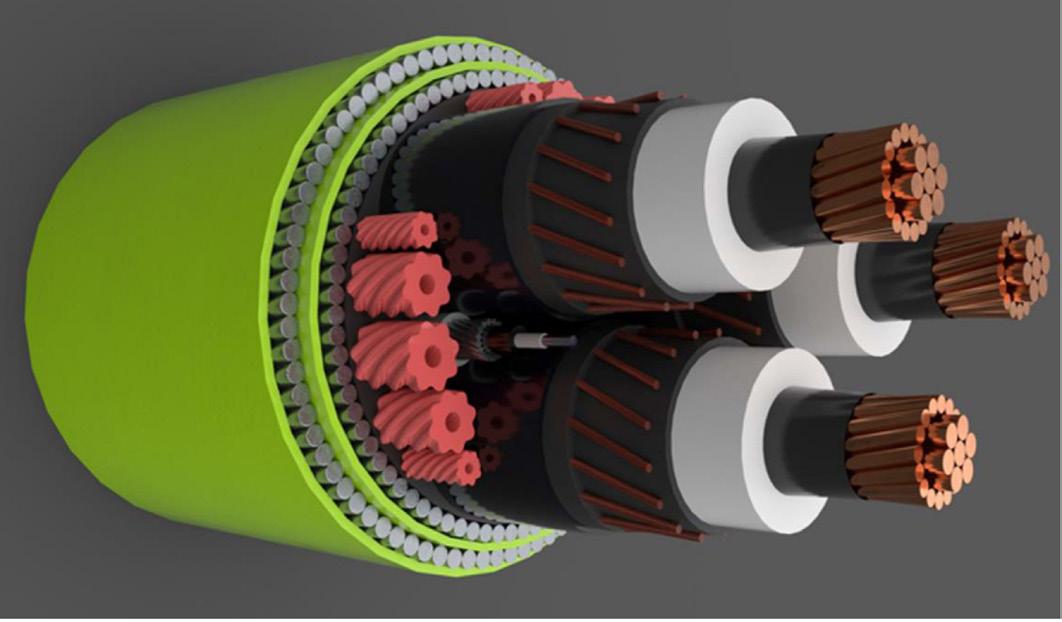
For example, low- or medium-voltage umbilicals and cables (and associated unbonded flexible pipes) already used in floating oil and gas facilities to transmit power are not fully applicable. Although they are designed to accommodate dynamic motions reliably over long periods, they are not suitable for the higher voltages required for floating offshore wind. Similarly, although static cables in fixed wind farms are specifically developed for high voltage, these are only designed for use in static applications and not to accommodate the large dynamic motions associated with floating wind. Thus, although some of the lessons learned and parts of the designs may be transferrable, overall new power cable technology is required for floating wind applications. This is technology that a range of experienced cable vendors have been developing and testing.
A key challenge is that the new inter-array dynamic HV power cable technologies will need to operate reliably over long periods without failures to minimise the costs over lifetime. Based on insurance claims from fixed wind developments, damage to power cables represent 80% of all claimed costs and inter array cable damages range from US$1.8 million – US$12 million. 2 As such, achieving this reliability is already something the offshore wind industry has found challenging when designing power cables. The floating wind industry must avoid similar significant costs to be incurred due to down time or to repair or replace damaged power cables. Therefore, qualification and testing of the inter-array dynamic HV power cable technology is going to be essential to confirm that the level of reliability
can be achieved within each design of power cable and to ensure possible failure modes are captured and designed out before power cables are installed commercially for long periods and in high numbers. However, the key question is how this qualification will be done in a consistent, standardised way that minimises the amount of qualification testing and hence cost.
The demand for qualification of inter-array dynamic HV power cables is quite recent given the technology is relatively new, and for the reasons outlined in the previous section. The qualification of these power cables is, however, complicated as it includes both electrical (e.g. HV transmission) and mechanical aspects (e.g. fatigue life), which co-exist and influence each other (e.g. thermal effects). But until recently, there has been no single industry code or guideline that describes the process to design and qualify an inter-array dynamic HV power cable from start to finish.
There are a range of industry codes from certification bodies (e.g. American Bureau of Shipping, Bureau Veritas, DNV, Lloyd’s Register, etc.), which describe the qualification process at a high level. Each of these uses similar approaches to describe the steps to achieve qualification to different technology readiness levels (TRL). However, all have differences in their approaches and definitions, only describe the general processes, and are not adapted to any specific components.
This high-level guidance must be supplemented with more specific industry codes to define the steps and processes to design and conduct qualification testing for a specific component, e.g. power cable. However, even where these codes exist, the pace of development in floating wind power cables exceeds the scope of the existing codes. For example, wind turbine generators (WTGs) have now evolved to beyond 14 MW (e.g. 20 MW is planned) and it consequently becomes more efficient to increase the size of the power cable beyond the current 66 kV commonly used so as not to limit the overall potential output of the wind farm. The current existing industry standards and guidelines (such as IEC 63026, 4 as well as Cigre TB 722 5) only cover type tests for qualification of subsea HV power cables up to 66 kV. With current technologies using 66 kV and expected to head towards 132 kV, the standards will need to be revised or new ones released to follow the industry trends for future developments.
The offshore floating wind community has therefore sought to find ways to consolidate the range of codes and guidance available into a single framework to support the qualification of dynamic HV power cables. There were two key advances in 2022:
> Firstly, CIGRE TB 862 guidance, released in January 2022, is the first code that addresses the design and qualification of HV power cables in a single document. 6 It gives a general overview of the steps required and the range of other design codes and guidance to develop
these cables. It outlines the complexity of the high voltage dynamic inter array cables and highlights how a combination of design, finite element analysis (FEA) and testing is required throughout the development, and qualification testing of these power cables.
> Secondly, ORE Catapult and 2H released a qualification framework for dynamic HV power cables to provide guidance on developing a standardised qualification programme for these dynamic cables and outline which tests have to be performed in each stage of the process, the order of the tests, as well as providing clear direction on which codes to follow, pointing out any gaps that may still exist.7 Standardisation is key to guarantee all cables, independent on the vendor, are qualified to the same level.
The most mature technology readiness level (TRL 9) is only reached once a HV power cable has been operating in the field for two years and has achieved all qualifications requirements. To reach this stage, there are a number of steps to be fulfilled, as outlined in CIGRE TB 862 and the ORE Catapult and 2H framework. 6,7 This is a long, complex process which integrates the design and qualification tests. In order to progress through each technology readiness level, there are a range of requirements that must be fulfilled to differing degrees at each stage, which are namely:
> Structural analysis.
> Thermal-electrical analysis.
> Component electrical and mechanical tests.
> Reduced scale electrical and mechanical tests.
> Full scale electrical and mechanical tests (including full scale fatigue testing).
> Project specific tests.
> Commissioning tests.
> Performance monitoring.
The floating offshore wind farms to be installed around the world can be located in shallow water depths (60 m – >200 m), such as the North Sea, or in deeper
water depths (500 m – >1000 m), such as the West Coast of the US and the Mediterranean Sea. They can also be installed in a range of environments and utilising a range of different floating substructures and mooring systems. Offshore floating wind farms will also typically have different sizes of cables, defined by the cross-section of their electrical conductor e.g. 240 mm 2 , 500 mm 2 , 800 mm 2 , and 1000 mm 2 . The biggest cables are closer to the offshore substation and the smaller cables are further from the substation, connecting a fewer number of turbines.
The process to qualify power cables therefore not only has to address the range of code requirements in the qualification process, but must allow for the qualification testing to be applicable across a wide range of scenarios, e.g. shallower and deeper water depths, high levels of dynamic motion, and for different electrical conductor sizes. In practice it will not be possible or commercially effective to develop one power cable design that is suitable for all situations, but instead a family of products that cover different ranges of applicability.
As experience within floating wind develops, the qualification of new dynamic HV power cable cross-sections will be able to use learnings from previously qualified designs, similar to what happened to flexible pipes in oil and gas. But, while the floating wind industry matures and earns this practical and technical knowledge, a large number of qualification tests will have to be performed.
The question is where to begin this journey, and will the first floating wind projects provide a suitable starting point to qualify the technology?
Contrary to what many may think, developing an inter-array dynamic HV power cable in shallower waters is more challenging than in deeper water depths.
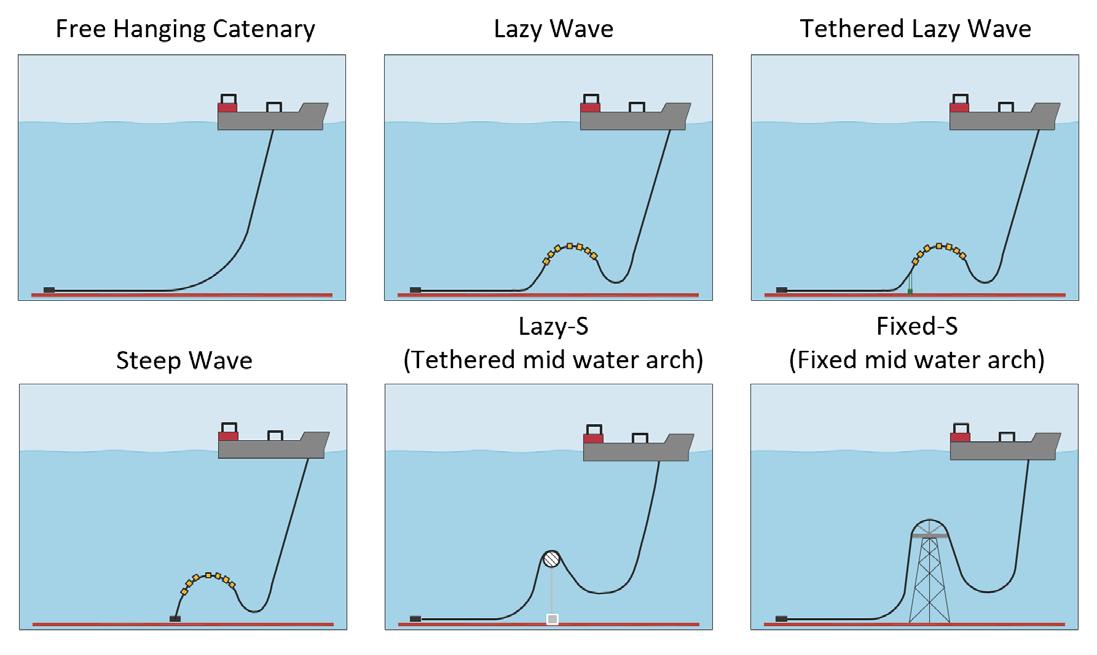
The simplest and cheapest configuration for a dynamic HV power cable connected to a floating platform is a free-hanging catenary, as shown in Figure 2. However, the combination of floater dynamic motions in medium to harsh environments and large floater excursions produce excessive loads where:
> The catenary power cable touches the seabed at the touchdown point (TDP).
> The catenary power cable interfaces to the floating hull (hang-off).
The loads are proportional in magnitude to the ratio between the length of power cable and level of motion at the top of the power cable. Therefore, the shorter a power cable is, the less capable it is of absorbing the motions occurring at the floater and the higher the loads are. In the case of a catenary, the length of the power cable is also dependent on the water depth it is installed in. Therefore, as the water depth reduces, the length of the power cable reduces, and it is subsequently less able to accommodate floater motions, resulting in higher loads.


This has typically made the catenary concept unfeasible for floating offshore wind farms in shallow waters (<150 m) and it is only exasperated where larger and stiffer power cable sizes are used.
This is where experience in similar systems in oil and gas applications (e.g., umbilicals, low voltage power cables, and non-bonded flexible pipes) is relevant. Oil and gas has had exactly the same challenges in shallow water depths and in order to address them, a range of alternative configurations have been installed to increase the length of the line so it is better at absorbing the floater motions and consequently reducing loads to manageable levels. Examples of the range of alternatives used in oil and gas are also shown in Figure 2. However, although these provide greater ability to absorb motions, they also come with a disadvantage of higher costs and complexity (e.g. installation of mid water arches). Thus, most of the popular configurations from oil and gas shallow water are not ideal for floating offshore wind.
The tethered lazy wave configuration is currently the go-to configuration for inter-array dynamic HV power cables. It has been selected for the first pilot projects including the Hywind Demo, offshore Scotland. 8 However, the clamps used to connect the tether to the power cable can be a high-risk component and therefore future commercial projects are trying to avoid the use of tethers. The WindFloat Atlantic project is an example where tethers were not installed for the three wind turbines of 8.4 MW installed.9
Although there are caveats, shallow water therefore presents one of the most challenging areas to begin the development of floating wind from the perspective of the inter-array HV power cables. This is not to say that deeper waters will not have different challenges (e.g. due to higher cable weight and/or platform excursions), but, at a general level, if inter-array dynamic HV power cables can be designed and qualified for shallow water then extending the design and qualification to deeper water depth can be readily achieved.
A key aspect will be qualifying the inter-array dynamic HV power cables (and ancillary equipment) to cover a sufficiently broad range of application, e.g., shallower and deeper water depths, with a high level of dynamic motion tolerance. There will not be one power cable design that is suitable for all situations; however, it is anticipated that shallow water development provides the opportunity to develop and qualify the technology that will underpin future deeper floating wind developments.
As discussed in the previous section, the loading on the inter-array dynamic HV power cable is highly dependent on its shape configuration, which can be dependent on the size of cable, water depth, the level of motion at the floating substructure (e.g., the influence of the substructure type and its mooring), and local environment conditions. The loading on the power cable is therefore
also very dependent on all of these parameters. Given the huge areas globally over which floating wind farms could be developed, there is in effect a never-ending number of possible combinations of these parameters to design for and to qualify a power cable for. However, it will not be cost effective or practical to test power cables separately in every single new application. It is also not practical or possible to wait for a power cable to be installed in each location to understand the loading or configuration required.
This is where structural analysis with a virtual simulation model of the system comes in, and, in particular, structural analysis to:
> Define the loading range for which the power cable must be qualified to operate.
> Confirm that the loading in the power cable remains within the level with which the power cable has previously been qualified.
The structural analysis is now sufficiently advanced that it can accurately estimate the loading on the power cables and the behaviour of the power cable cross-section to this loading. Structural analysis is therefore able to accurately determine for the given range of application that the power cable has sufficient strength and fatigue resistance for all phases of installation and operation.
This means that the structural analysis is essential in conjunction with the qualification testing to both define requirements for qualification testing, but also as a key tool to minimise the level of qualification testing required moving forward. But the next question is how is this achieved in practice?
To avoid the need to requalify a HV power cable each time, it is necessary to show that the existing qualification remains valid. This is a complex process that extends into a range of areas and one which the ORE Catapult and 2H qualification framework discusses in more detail.7 One key aspect to minimise any requalification test will be to ensure that, when applied to a different situation, the power cable design stays within the loading limits previously established for a qualified product.
One way to achieve this is through developing the configuration of the floating wind system to ensure the power cable remains within the same load limits. This could mean through the design of the floating substructure, mooring configuration, or the power cable configuration itself. This is done performing fully coupled structural analysis, including the wind turbine, floating substructure, power cable, and mooring lines to the simulation, so that the global response of the system is captured. This reduces conservatism associated with looking at components individually, but also ensures that the trade-offs between components are understood. For example, the design of the mooring system may need to be made stiffer to reduce the loading on the power cable
to stay within qualifications, but there may be a cost optimisation that says the configuration of the power cable must be improved instead.
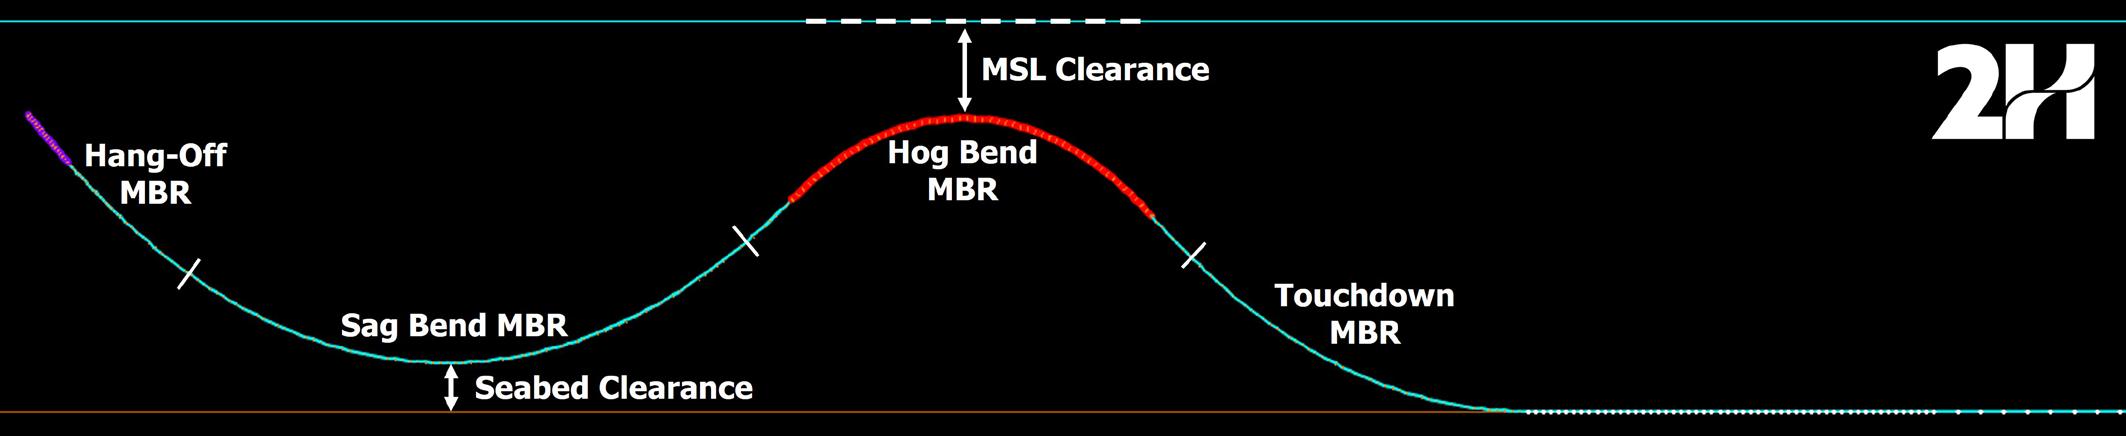
As previously discussed, a key tool is to adjust the configuration of the power cable. The shape of the lazy wave can be optimised by a range of parameters, such as top angle; buoyancy module quantity, distribution, and elevation; and use of tethers at touchdown point, as given in Figure 3. The design of power cables in shallow water depths is significantly more challenging since there is a trade-off between the parameters. For example, if the number of buoyancy modules is increased, the hog bend might touch the surface, affecting vessel access. Reduced buoyancy on the other hand may cause excessive compression at the TDP.

However, as discussed, in a typical wind farm there may be different sizes of cables based on distance of each wind turbine from the substation, and cables can be installed in a range of water depths and soil profiles. Therefore, the cross-section of each power cable and their global configuration is likely to differ across a floating wind farm. For the best performance of the cable, each scenario has to be optimised individually and collectively. Experience and engineering judgement are crucial to reduce the number of configurations and maximise standardisation across a wind farm to reduce overall costs and stay within the previously qualified limits.
Floating wind is growing worldwide to deliver clean energy and make a key contribution to the energy transition with a huge increase in capacity expected in the coming years. Inter-array dynamic HV power cables are a key part of the system to carry the power from the turbines to the offshore substation, but also an area with high risk due to new technologies. A robust and reliable design of these power cables will be essential to minimise cost and guarantee the integrity of the wind farms. Qualification testing will be needed to ensure the right level of reliability to minimise undesirable downtime or repair costs. However, equally, the qualification testing must be done in a way that supports the objective to reduce costs by ensuring power cables are developed and qualified for a wide range of applicability, but also that new wind farm developments look to ensure their cable configurations stay within these qualified limits.
There are similarities between oil and gas and renewables but also new challenges to overcome, such as the complex design of the power cable cross-sections and the impact that temperature makes on the cable’s physical characteristics. But with the right approach, as outlined in the latest qualification framework from ORE Catapult and 2H, 6 programmes can be optimised through combining the design, analysis, and qualification processes and standardising the range of tests.
1. ‘Floating Wind Progress Update: H2 2022’, 4C Offshore, (November 2022).
2. ‘Lloyd Warwick International Offshore Wind Loss Adjusters Perspective’, ORE Catapult, (28 April 2021).
3. ‘2015 Deepwater Production Riser Systems & Components’, Offshore Magazine, (April 2015).
4. ‘Submarine Power cables with extruded insulation and their accessories for rated voltages from 6 kV (Um = 7.2 kV) up to 60 kV (Um = 72.5 kV) – Test methods and requirements’, IEC 63026, (December 2019).
5. ‘Recommendations for additional testing for submarine cables’, CIGRE TB 722, Working Group B1.55, (April 2018).
6. ‘Recommendations for mechanical testing of submarine cables for dynamic applications’, CIGRE, TB 862, (January 2022).
7. ‘FOW CoE: Dynamic Cable Technoloy Qualification Framework and Case Studies’, ORE Catapult in partnership with 2H Offshore, (29 September 2022).
8. ‘D3.1 Review of the state of the art of dynamic cable system design’, Corewind, (February 2020).
9. ‘WindFloat Atlantic Project - A step change towards commercial Floating Wind’, Ocean Winds, (6 April 2021).
Figure 3 Lazy wave HV power cable optimisation in deepwater depths.Christian Hürlimann, MET Group, Switzerland, identifies the technological advancements in the solar industry which companies need to embrace in order to optimise their photovoltaic portfolio.
The relentless advance of technology presents countless opportunities for businesses to optimise efficiency and operations. At the same time, ongoing technological developments force companies to try and identify future scenarios and possibilities to make their business as future-proof as possible. MET Group pursues a strategy of incorporating the latest commercially-viable technological solutions in the development and operation of its renewables portfolio.
Long gone are the days when artificial intelligence (AI) and machine learning were a favourite of sci-fi scriptwriters in Hollywood. The business community is relying increasingly on AI-driven solutions not only to get a tech edge, but also to stay in the game. The energy industry and renewables are no exception to the rule. The sector is embracing digitalisation and technological developments to spur the energy transition.

MET Group, an integrated energy company headquartered in Switzerland, seeks to establish a pure-play renewables portfolio in Europe diversified along all key dimensions: technology, geography, revenue model, size, and lifecycle stage. With a strategic aim of reaching a capacity of 2 GW in renewable capacity by 2026, MET leverages the latest
technological solutions along the entire value chain of renewables projects (development, construction, operation and maintenance, and asset management) with a special focus on photovoltaics (PV). At its core, successfully developing and operating a power plant hinges on presenting a viable business case to investors while reaching the lowest levelized cost of energy (LCOE). The goal is to attain the lowest generation cost for injecting power into the grid, utilising the available technology in the market.
The renewable sector abounds in digitised solutions and products designed to aid companies in developing PV projects. From cloud-based software that finds suitable surfaces for solar parks by analysing a range of factors, such as the distance to the grid or substations, topography, soil depth, and solar radiation, to ultra-efficient solar cells, solar panel integration in roof tiles, facade elements, and transparent glass windows, or solar panels that collect energy at night through thermoelectric generation, the advance in solar energy development seems unstoppable. High-powered panels and new plant designs are contributing to drastically increasing capacity at PV projects as the evolution of solar modules leads to higher outputs.
To keep pace with the drive within the renewables sector of boosting project yields wherever possible based


on topographical and cost-efficiency considerations, the company has opted to install single-axis solar trackers that follow the sun’s position by adjusting the position of the panels on the axis. In addition, bifacial solar modules are applied to benefit from the reflected surface solar radiation, known also as albedo effect, using the solar panel’s backside, and increasing the yield even more.
Thanks to technological development, agriculture and solar projects are no longer mutually exclusive. Scientific research published by Germany’s Fraunhofer Institute for Solar Energy Systems proves that combining solar generation with agricultural activity is now not only viable at lower costs, but it significantly raises land use efficiency and may be particularly suitable for arid regions. While higher sunlight radiation leads to an increase in solar power production, solar irradiation under the PV panels can be significantly lower, thus certain cultivation can benefit from greater yields due to reduced dryness and reduced solar irradiation in case of shade-loving cultures and contributing to an uptick in land use efficiency.
Combining agriculture and solar energy production is the natural next step for the industry. In addition to allowing and aiding agriculture production, this technology can also protect the water supply and guard arable areas from wind erosion with solar fences. Several countries have recognised the added benefits of agrivoltaics and some national regulators have even made the model compulsory. By making the land dual-purpose, developers can also secure land for such projects more easily, removing considerable barriers to their expansion. In addition, these installations can be decommissioned after their lifetime expires without leaving any environmental impact. Having recognised the environmental and business benefits of the agro PV model, MET has partnered with agrivoltaic experts in project development and technology providers to evaluate and integrate agrivoltaic characteristics into future PV project developments.
The development phase of a PV project requires businesses to thoroughly map the landscape and identify commercially available technologies to put forward a compelling business case. Short of looking into their crystal ball, those in the PV business need to gauge the possible direction and outcome of technological developments and align their projects accordingly. Even though certain technologies may not yet be commercially viable at the time a project is in the development phase, they also need to be considered, as they may become mainstream by the time the project becomes operational. Once a project is developed and authorised, it reaches a point of no return and large scale modifications become nearly impossible to implement. The course is set for the next 25 years.
The second phase of the value chain, namely construction, also comes with its own set of considerations and requires
identifying the latest technological developments. Advancements in robotics allow novel solutions to become widespread in the construction of solar installations. Developments, such as AI-based robots developed by specialised companies, can meaningfully accelerate solar installations as a complement to existing construction programmes. Robots can now perform the ‘heavy lifting’, including the placing and attachment of solar panels, leading to more rapid, precise, and cheaper installation, as well as the ability to install larger panels, along with increased worker safety. Robots can complement members of the current solar workforce, easing the strain of labour shortages worldwide as the number of solar projects predicted to come online is set to rise steeply. Other innovations to enhance solar system construction, operations, and maintenance are also in the pipeline. Prefabricated modular systems are being developed that can be shipped to sites ready for rapid deployment with very minimal labour requirements.
Even when a PV project reaches the operational phase, there are multiple options to optimise the plant for higher efficiency. Operators can rely on digital solutions to manage operation and maintenance, and power dispatching into the grid in an increasingly cost-effective manner. Supported by machine learning and AI, these solutions make faster and more reliable decisions to help operate such assets. Ranging from maintenance scheduling to making sure that the modules are aligned or precisely predicting the expected amount of energy that can be injected into the grid, as well as intelligent diagnostics of performance degradation in solar plants, the possibilities are almost endless for optimisation. There are considerable advances in developing drone solutions for solar panel cleaning, anti-soiling solutions, and coating for solar modules which can considerably improve power yield.
MET is currently working on a software solution for energy aggregators, which will allow the commercial and operational optimisation of the group’s asset portfolio. The goal is to tackle the challenge posed by intermittent power generation via data-driven, digital tools.
Given that PV projects are highly standardised, AI-driven solutions can help operators benchmark the different projects within the portfolio with respect to operational efficiency and optimise the entire fleet of power plants. MET experts and consortium partners are working on training an algorithm to learn what the company considers to be a healthy operational state of a given power plant, and the next phase is to have the algorithm learn by itself to identify what the healthy status is and compare it to actual operations.
As technological advancement constantly reshapes the renewables industry, MET seeks to constantly optimise and even refurbish existing projects to bolster efficiency or potentially replace existing project components with more efficient ones by applying the latest technology with the aim of reaching and maintaining the lowest LCOE. Long-term cost predictability is the key to a higher level of stability and an unbeatable value proposition for commercial partners. As regulatory support becomes less substantial for renewable projects, monitoring and optimising the efficiency of assets throughout their lifetime has become indispensable.
With a growing portfolio of high performance products, Seal For Life offers innovative corrosion prevention and thermal insulation technologies for infrastructure protection.
A track record of more than 60 years, always pushing the boundaries to develop new solutions for the challenges of tomorrow.
sealforlife.com
ar too often, renewable energy asset managers, operators, and field technicians find themselves working at cross-purposes. Why? Many times, it is because asset performance management (APM) platforms are not fully integrated with the on-site plant data (SCADA, DAS, power plant controller [PPC]) acquisition systems. And this lack of integration leads to everything from miscommunication to lost production.
To scale successfully — and to take advantage of new revenue opportunities, such as ancillary services — the renewable energy industry must prioritse standardisation and the full integration of real-time monitoring and control systems with sophisticated, purpose-built APM platforms.
Consider this common scenario: An asset manager is logged into the organisation’s APM platform. The platform, which consolidates data from plants spread over a wide geographic region into one place, alerts the asset manager that inverter 5 at Plant B is out of communication. A local field technician is tasked with checking it out.
However, when the technician arrives at Plant B, there does not appear to be a problem with inverter 5. Instead, it is inverter 7 that is out of communication. But, because of a difference between naming conventions used for inverters in the SCADA system vs in the APM, the technician initially was directed to the wrong inverter, wasting precious time and money.
This is an overly simplified example, but it shows how a lack of alignment between remote and on-site systems can make asset management and operations and maintenance (O&M) much harder than they have to be. Not only that, but it also often causes costly oversights and delays.
But there is a better way. This article looks at:
> Why fully integrating SCADA and PPC systems with an APM platform is crucial to the efficient management of renewable energy assets.
> How technology has evolved in recent years to make this not just a possibility, but a necessity.
> The steps renewable energy owners, operators, and asset managers can take to work toward better integration now.

When owning, operating, or managing renewable energy plants, the chances are that one set of systems are relied upon to monitor and control local aspects of a project – e.g., SCADA and PPC systems – and a different set of centralised tools for technical and commercial asset management.
While these local and centralised systems may be linked, they are often not fully integrated. This can result in a mismatch between the day-to-day operational
Power Factors, Greece, discusses how a fully integrated asset management platform helps boost project returns.

management of projects that is carried out by technicians at the local level, and longer-term asset management work that is managed at a central level.
To enable teams to work together more effectively, the local and central systems must be integrated, offering a single source of truth when it comes to information about how assets are performing — and what can be done to ensure optimal performance in the future.
But what does a fully integrated local and centralised system look like?
A fully integrated asset management solution is more than simply pulling data from local SCADA systems into one place. Why? Because information such as fault codes and asset hierarchies often differs from plant to plant. On top of that, SCADA and OEM data likely does not align with the data frameworks and asset hierarchies in the central system.
There are four main drawbacks to just centrally replicating information from local systems into the central system:
1. Inconsistencies between asset elements, properties, and descriptions: As discussed, differences in how sites or assets are organised (from naming conventions to asset hierarchies) in the local systems vs the central system can cause confusion. Simply pulling data from local systems into the central system does not address that challenge.
2. Inconsistencies between key performance indicators (KPIs), data granularity, raw data, and alerts: Inconsistencies in how the physical assets are organised gives rise to inconsistencies in how KPIs, data, and alerts are managed between the systems. Companies will face problems if data is not consistent and clean.

3. Control via remote connection to local SCADA is completely different from full control through a unified cloud SCADA:
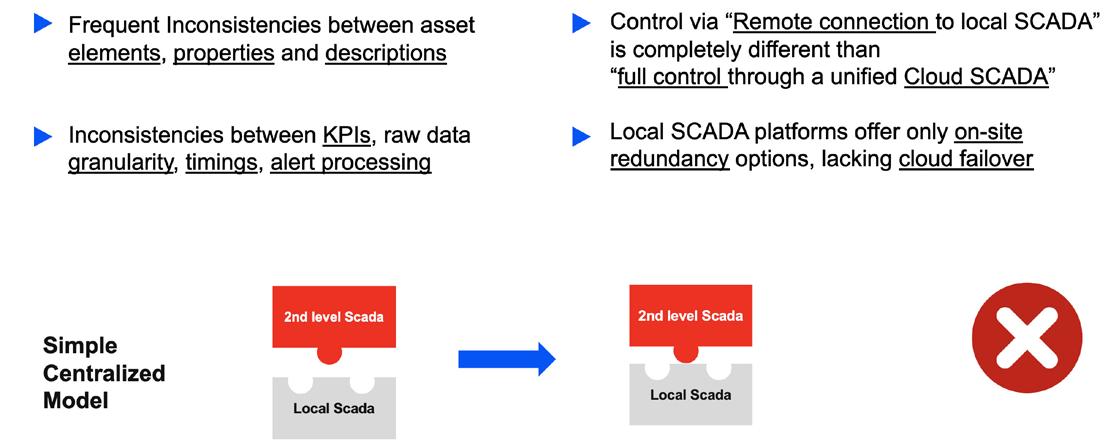
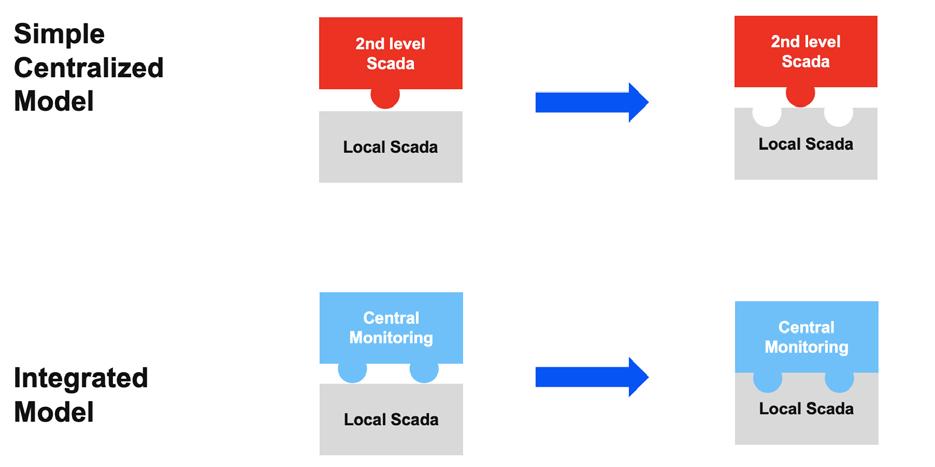
Operators need to ensure the local SCADA data is fully integrated, rather than only accessed sporadically by a remote connection. Full integration is needed in a large, diverse portfolio.
4 Local SCADA platforms offer only on-site redundancy operations but lack cloud failover: If the local SCADA systems are not integrated with a central system, it limits what operators can do to restart an asset in the case of failure. It means they have to interact with local contractors rather than acting themselves — and with this comes all the issues and potential costs of unplanned downtime.
A fully integrated system is a system where the same software is running locally on site and centrally in the cloud, so that people at all levels can refer to the same information on the same platform. The tight configuration between hardware and software in this system means that it can be configured for maximum security and redundancy options. This enables operators to work smoothly to protect their assets and restore them later.
A fully integrated system also enables remote control of assets, should an operator need, for example, to act quickly to put trackers into the stow position due to an incoming hailstorm. If operators can control their assets from local and central control rooms, it gives them greater flexibility to act efficiently and effectively in all situations.
Finally, an integrated system can involve closer links between the operational side of an asset and signals coming from the power market. The emergence of batteries in the renewable energy sector has opened up the potential for asset operators to profit by providing ancillary services to grid operators and/or participating in the balancing market. However, they can only take full advantage of this if they can see what is happening in the market in real time and respond quickly to tell their assets where to dispatch the electricity.
A fully integrated system delivers five main benefits for asset owners:
1. Solving inefficiencies: Unified software helps solve inefficiencies between asset managers and O&M contractors. This is particularly true where performance KPIs are involved.
2. Bi-directional, super-fast control and monitoring: A fully integrated system means that companies are not simply able to retrieve information from their local SCADA systems, but can address issues and control assets centrally.

3. Structured connections and processes to aid compliance: An integrated system can boost security and help an owner demonstrate compliance much more easily than if they are dealing with a host of local data systems.
4. Sub-second data granularity: This is now a viable option for on-site and central data, which is important given the growth of real-time data needed to help operators provide ancillary services from their assets.
5. Flexible fast vs low-cost storage options for real-time vs archival data: An integrated system can help companies to standardise the accessibility and storage of their performance data – which is important for operators required to keep high-frequency data for a few years to provide
Figure 1 . Centralising third-party SCADAs only do part of the job.documentation if there is a conflict with a battery vendor. Such data can also help with troubleshooting.
Companies — from asset owners and managers to O&M companies to market operators — need a centralised platform that provides relevant insights and information to their teams. It should be provided both remotely in the cloud and fully integrated into local systems, providing a single source of truth for both the plant-level and portfolio views.
For O&M companies, a central monitoring and asset management platform helps streamline and improve communication with asset managers and owners. And it supports their work of analysing the causes of problems and fixing them — using site data to solve problems in real time.
For asset managers, the focus is on analytics and reporting. An integrated platform must provide high-quality data, energy monitoring, and analysis of physical assets compared to performance KPIs. This builds on the predictive maintenance focus of historic asset monitoring systems to introduce smarter forecasts and real-time data.
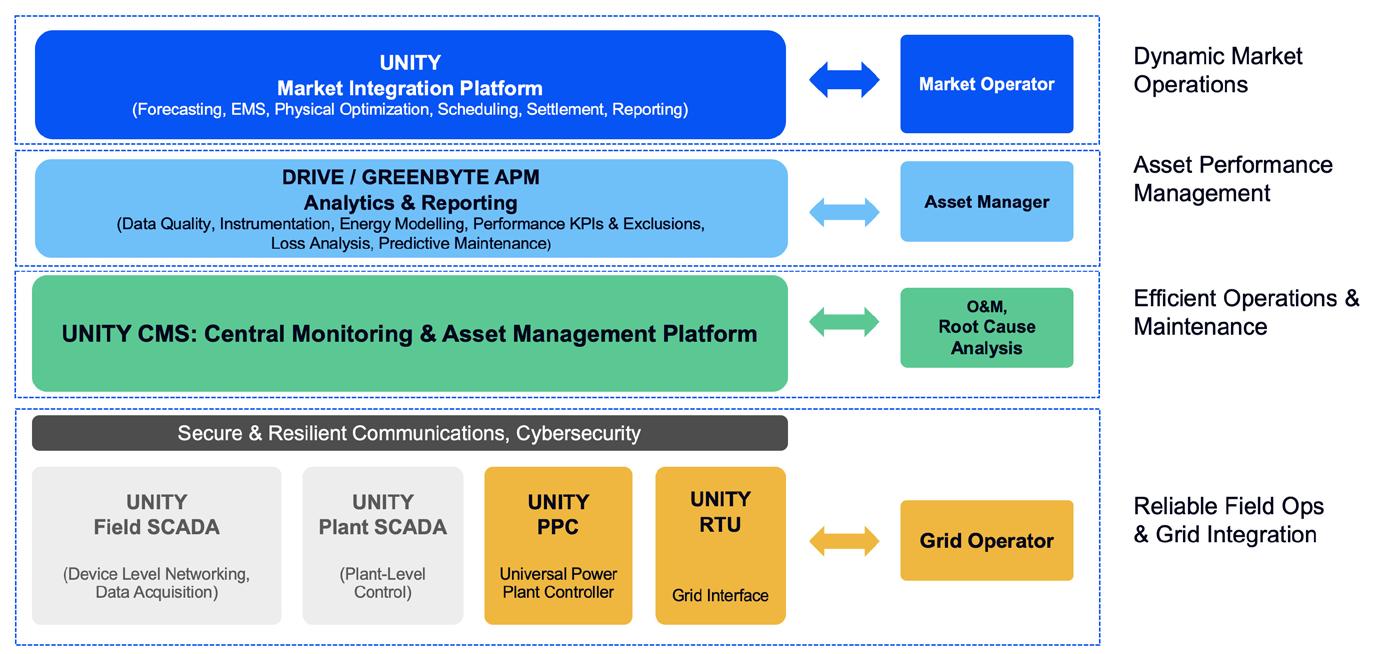
And for market operators, a fully integrated system helps provide information that allows them to operate in the power market. Capabilities such as real-time forecasting, reporting, and insights that support the physical optimisation of their assets are crucial.
Power Factors is providing SCADA and PPC for the 150 MWdc Aurora project in Minnesota, the US. The project belongs to a renowned global utility and consists of 16 solar plants with single axis trackers, expected to be delivering over 210 million kWh/y to Xcel Energy.
Following the owner’s requirements, each solar plant has its own control room, hosting a local plant server. In addition to the automated control functionality provided through the PPC, full inverter and tracker control is granted locally or remotely to the operators through the integrated plant schematics HMI.
The benefits of a centralised and integrated system have been discussed, but why is it the right time for asset owners to put one in place? To put it simply, it makes good business sense and it is now technically viable. There are seven main reasons to do this now:
1. The world has moved on: Asset monitoring and control technology are now powerful enough that cloud-based SCADA systems are no longer regarded as second-class citizens compared to their local cousins. Systems exist that can operate central monitoring in tandem with local controllers, so it makes sense for asset owners to take advantage of these to operate growing portfolios.
2. Standardisation is mandatory: Owners and operators are more focused on the standardisation of their data systems because
they want to unify the way that they manage hybrid portfolios in different nations and markets. Standardisation of systems and harmonisation of data is seen as mandatory.
3. Pressure from the secondary market: More reliable data is important when owners are looking to sell assets on the secondary market. Investors are very educated and have a long list of demands related to projects they invest in. As a result, owners need access to the relevant data to fulfil those requests — and do not want their lives made more difficult with unwieldy data platforms.
4. More stakeholders to keep happy: A wide range of stakeholders are asking for access to data, both inside and outside the owner’s team. These include asset managers, O&M specialists, owners, analysts, investors, and vendors. These stakeholders need access to information based on the same data set.
5. Growth of merchant solar: Owners are increasingly interested in selling the power from their renewable energy plants on the open market, rather than longer-term and more passive structures such as feed-in tariffs. This means there is increased pressure to analyse assets and power markets quickly so owners can benefit from new opportunities and respond quickly to address issues at their plants. The need to be flexible day in and day out requires up-to-date systems.
6. Opportunities for grid balancing: This increased flexibility is also needed in the energy storage market, where owners of storage assets such as batteries need to dispatch power almost instantly. As more owners add storage to their portfolios, they need the right software if they are to provide the ancillary services needed in the grid balancing markets. It is essential if companies are going to successfully stack asset income streams.
7. Hybrid plants are becoming more common: As well as standalone assets, more owners are embracing the opportunity to attach storage capacity to their generation assets. Centralised and integrated solutions help to manage them.
Taking steps towards an integrated monitoring and control systems is crucial for renewable energy stakeholders looking to stay competitive – and it starts with putting in place a software architecture that supports the entire portfolio and project pipeline, both now and in the future.
he world’s energy mix is still heavily dependent on fossil fuels, which account for 81% of global energy consumption. Energy production and consumption are responsible for two-thirds of greenhouse gas emissions. Transitioning to a clean, sustainable, and affordable energy system is essential for combating climate change and ensuring global security.
The levelized costs of energy (LCOE) for green technologies are falling well below the costs of fossil fuel generation, making low-carbon energy generation cost competitive. A similar trend is expected for lithium-ion battery technology. However, as these technologies become more prominent, additional measures will be needed to lower soft costs, such as systemic efficiency and digitalisation across the transport, building, industrial, and large scale power generation sectors. These measures will be essential

for reducing LCOE and achieving a cost-effective transition to net zero emissions.
In the early 2010s, less than 0.8% of power generation in the US was from renewable sources, with solar accounting for just 0.1%. In Europe, renewable energy accounted for only 1.4% of total energy supply.
In 2011, the U.S. Department of Energy (DOE) launched the Sunshot Initiative with the goal of reducing the cost of utility scale solar-sourced electricity to US$0.06/kWh by 2020. To achieve this goal, the DOE identified six key areas for improvement: reducing module prices, improving module efficiency, improving reliability and lifetime, reducing operation
Miguel Ángel Torrero, VP Power & Renewables, Enverus, and Co-Founder, RatedPower, describes how digitalisation can help reduce levelized costs of energy, especially for utility scale solar power.

and maintenance (O&M) costs, reducing hardware and labour costs, and securing lower finance rates.
The good news is that the US achieved this goal in 2017, and the Sunshot Initiative was updated to set new goals for 2030. The Solar Energy Technologies Office aims to reduce the cost of utility scale solar to US$00.02/kWh through four main drivers:
lowering sustainable module prices, lowering hardware and soft costs for the balance of system, improving lifetime and lowering the degradation rate, and reducing O&M costs.
The recent rise in commodity prices has had a negative impact on the manufacturing costs of solar photovoltaics (PV), largely due to the impact of the COVID-19 pandemic and global supply chain disruptions. However, the overall trend for hard costs is still downward. The next challenge in achieving US$00.02/kWh will be reducing soft costs, which make up more than one-third of the total cost of a utility scale PV project, and as much as two-thirds of the cost of a residential project, according to the U.S. Office of Energy Efficiency and Renewable Energy.
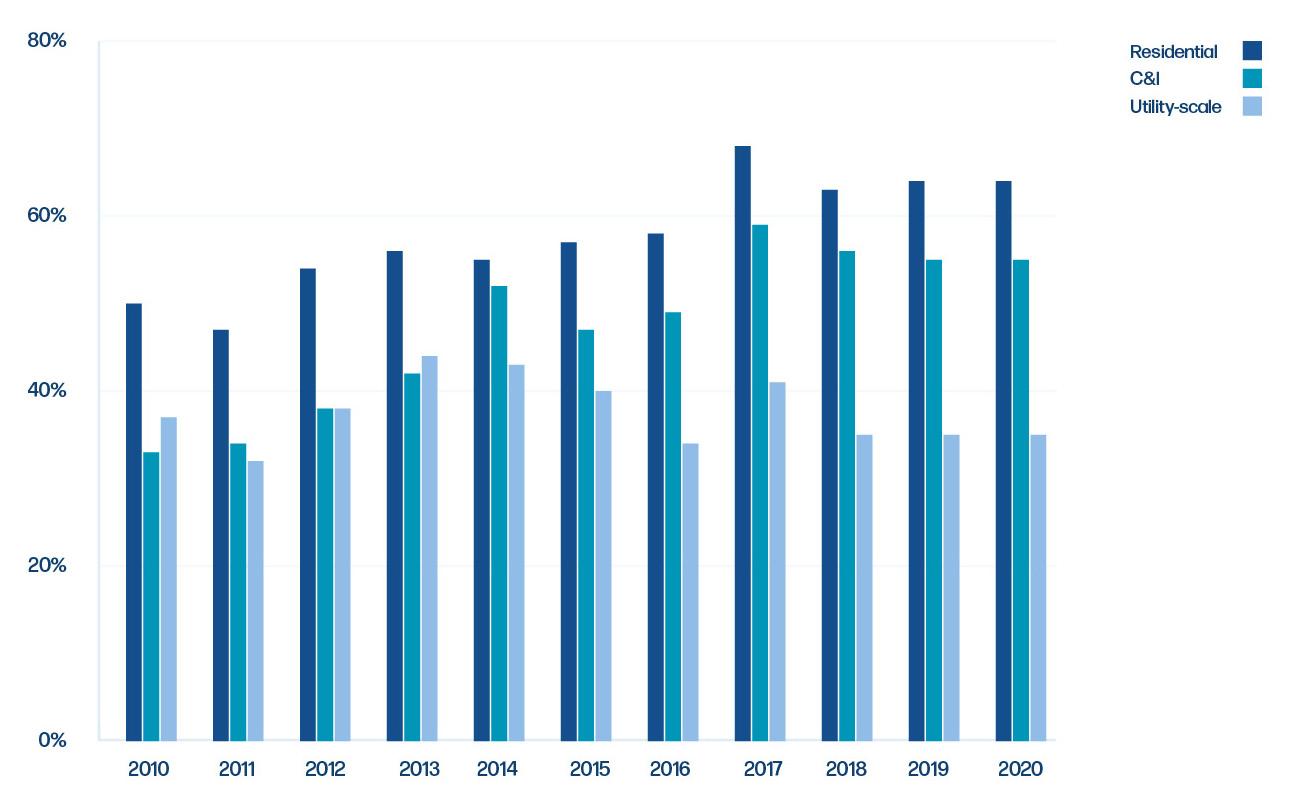
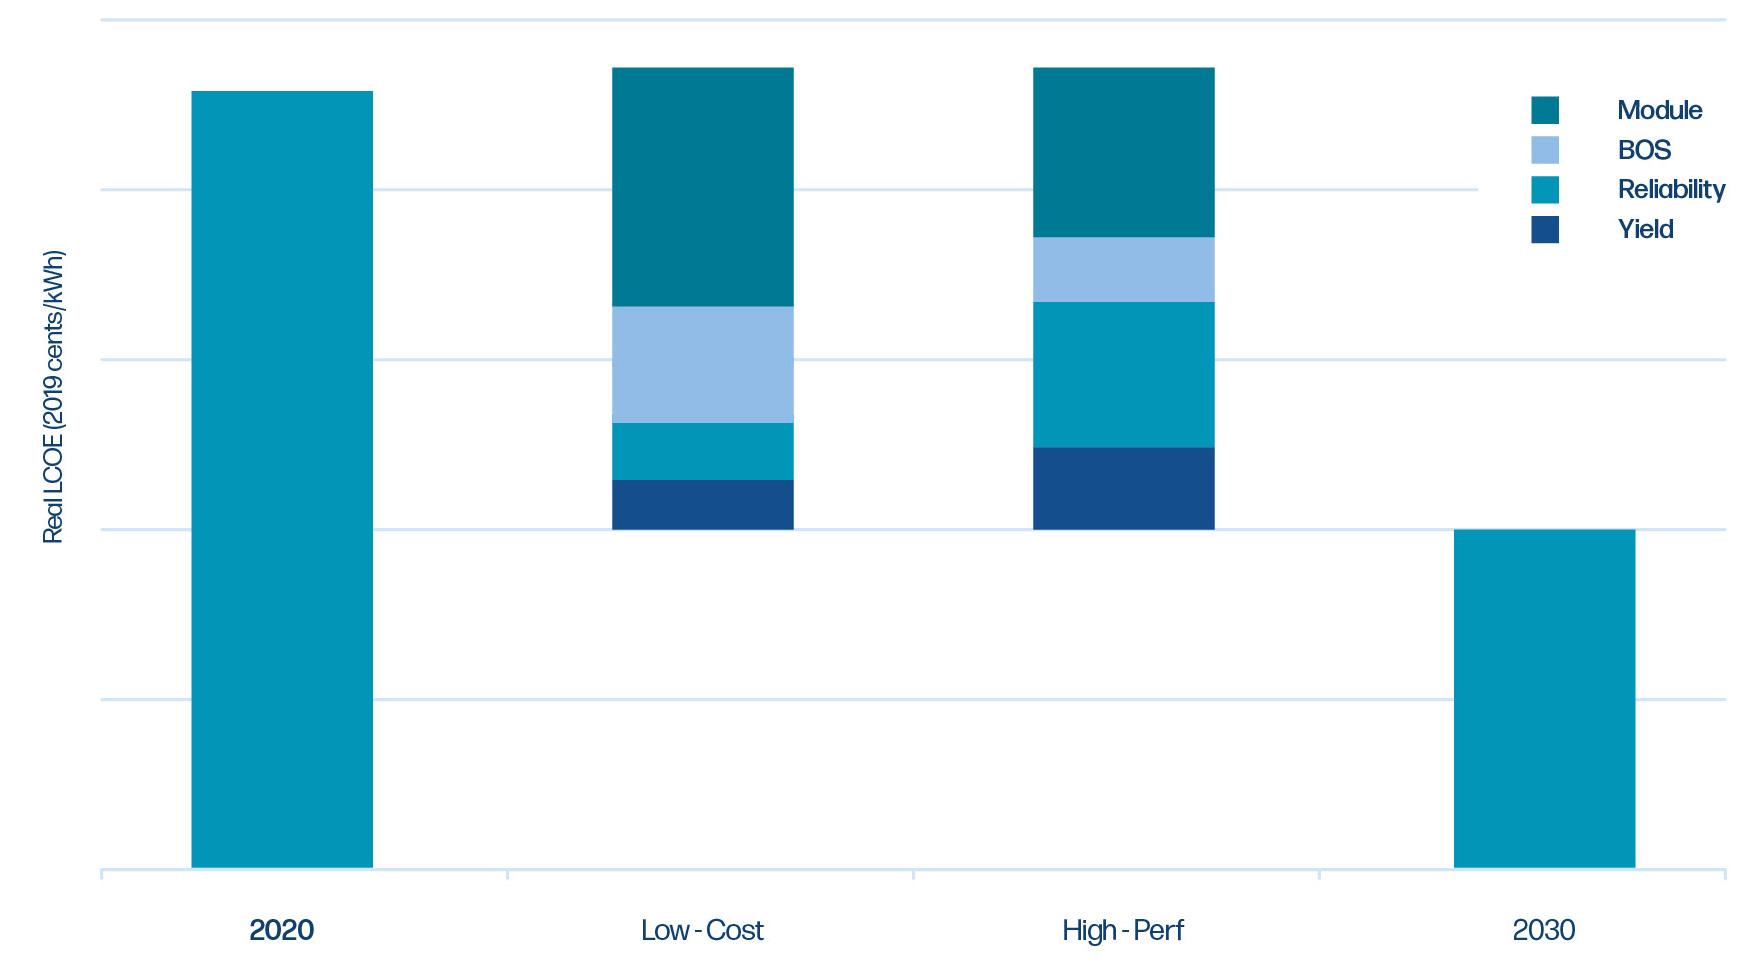
To reduce overhead costs and increase the profitability of solar projects, there are several strategies to follow. Currently, two of the most common are to add battery energy storage systems that help improve profitability, and to digitise and optimise processes at all stages of the project.
Hybridising PV systems with batteries at the same location helps reduce costs by leveraging the synergies of both projects in site preparation, land acquisition, installation labour, permitting, interconnection, and EPC/developer overhead and profit.
On the one hand, digitalisation and the creation of data-driven machine learning frameworks can improve early-stage project optimisation and, on the other hand, final cost prediction. Currently, there is software that helps significantly to improve the design of PV systems in the early stages, providing results very close to reality, helping to choose the best sites and helping in all the processes that finally end up reducing indirect costs.
Digitalisation is a key trend throughout the industrial and construction PV project stages, as automation and Internet of Things devices introduce new functionalities and efficiencies known as the fourth industrial revolution, or Industry 4.0.
In renewables, digitalisation encompasses smart home energy systems, digital tools for plant-level forecasting, accessing real-time power data for effective prospecting, the use of drones in equipment maintenance, or smart grid management during O&M stages.
Digitalisation is also expanding the deployment of digital grid infrastructure and data collection. It enables a much more responsive network management of output of wind or solar power plants, facilitating fast and cost-effective interconnecting generators and demand.
For solar PV, development is the stage at the part of the supply chain where technology
Figure 1 . Real levelized cost of energy SunShot 2030 targets. Source: Solar Energy Technologies Office.1solutions are most needed, according to the RatedPower Solar Research Report.3 Digitalisation can help by reducing the considerable soft costs of a project.
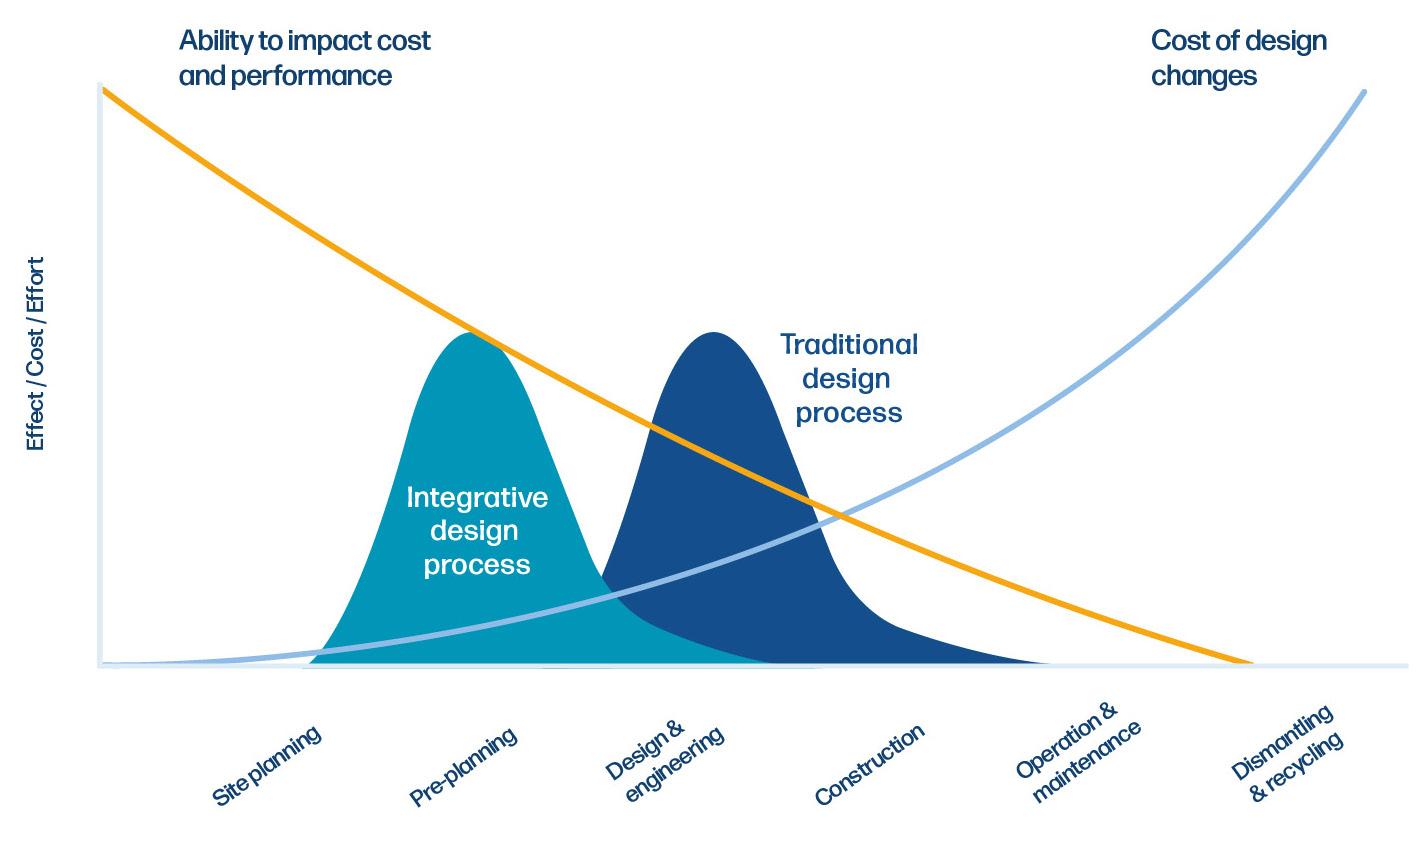
The power and renewables sectors are becoming increasingly digitised, as computation and control technologies are embedded in systems around the world.
Scaling utility scale solar projects is a tough task. They are complex by nature, risky, and heavily dependent on capital. Also, they require huge amounts of collaboration among diverse teams – internal and external – to deliver timely in each project lifecycle stage at the lowest cost possible.
Focusing on early project stages presents a strong opportunity for solar developers to reduce the LCOE. The further a project team is through the design process, the greater the cost of making design changes. This makes a strong case for an integrative design process that allows for changes to be made early on.
Enabling renewable energy developers to cut through the fog of data and make fact-based decisions is crucial for their success. Even if they follow best practices, as those proposed by NREL4 or the European Commission,5 there is still a gap in the tools they use. To thrive in the current energy market, businesses need to act quickly and know how and when to adapt. This requires the right technology stack. Renewable energy developers play a crucial role in the shared goal of achieving net-zero emissions.
Accurate and reliable data is essential for making informed decisions in the renewable energy industry. However, unconnected and complex data sources can make it difficult for professionals to access the information they need.
Activities such as finding suitable plots for large scale projects, finding the nearest connection points, calculating the energy a project can generate, or financing and estimating the IRR are key to the success of a renewable project. Having access to comprehensive and connected data can help renewable energy professionals make data-driven decisions and improve the efficiency and effectiveness of their projects.
Computer-aided design tools have traditionally taken a one-size-fits-all approach, ignoring the unique needs of solar developers. However, today’s renewable energy markets are more demanding than ever. Providing PV developers with design and engineering tools that reduce friction and promote collaboration is crucial for lowering the soft costs of development.
The digitalisation of solar energy systems is essential for the scalability of utility scale projects and the effective management of resources. Solar PV-specific software with advanced data and analysis capabilities enables project developers and operators to take advantage of economies of scale and maximise their return on investment.
To maximise the potential of solar energy, it is necessary to have the ability to filter, transform, and connect data streams and make them useable in design and engineering tools. Solar development professionals can then generate results on projects at the speed the market demands. This is essential in order to continue improving the efficiency and profitability of solar energy and to be able to compete with other sources of energy in an increasingly competitive market.
1. Solar Energy Technologies Office, ‘SunShot 2030 goals: 3¢ per Kilowatt Hour for PV and 5¢ per Killowatt Hour for Dispatchable CSP’, U.S. Department of Energy, (2020), www.energy.gov/sites/prod/files/2020/09/f79/SunShot%202030%20White%20Paper.pdf
2. FELDMAN, D., RAMASAMY, V. FU, R., RAMDAS, A., DESAI, J., and MARGOLIS, R., ‘U.S. Solar Photovoltaic System and Energy Storage Cost Benchmark Q1 2020’, National Renewable Energy Laboratory, (January 2021), www.nrel.gov/docs/fy21osti/77324.pdf
3. ‘Renewable Energy and Solar Research Report: What’s in store for 2022’, RatedPower (16 Februray 2022), https://go.ratedpower.com/reports/solar-research-report-2022
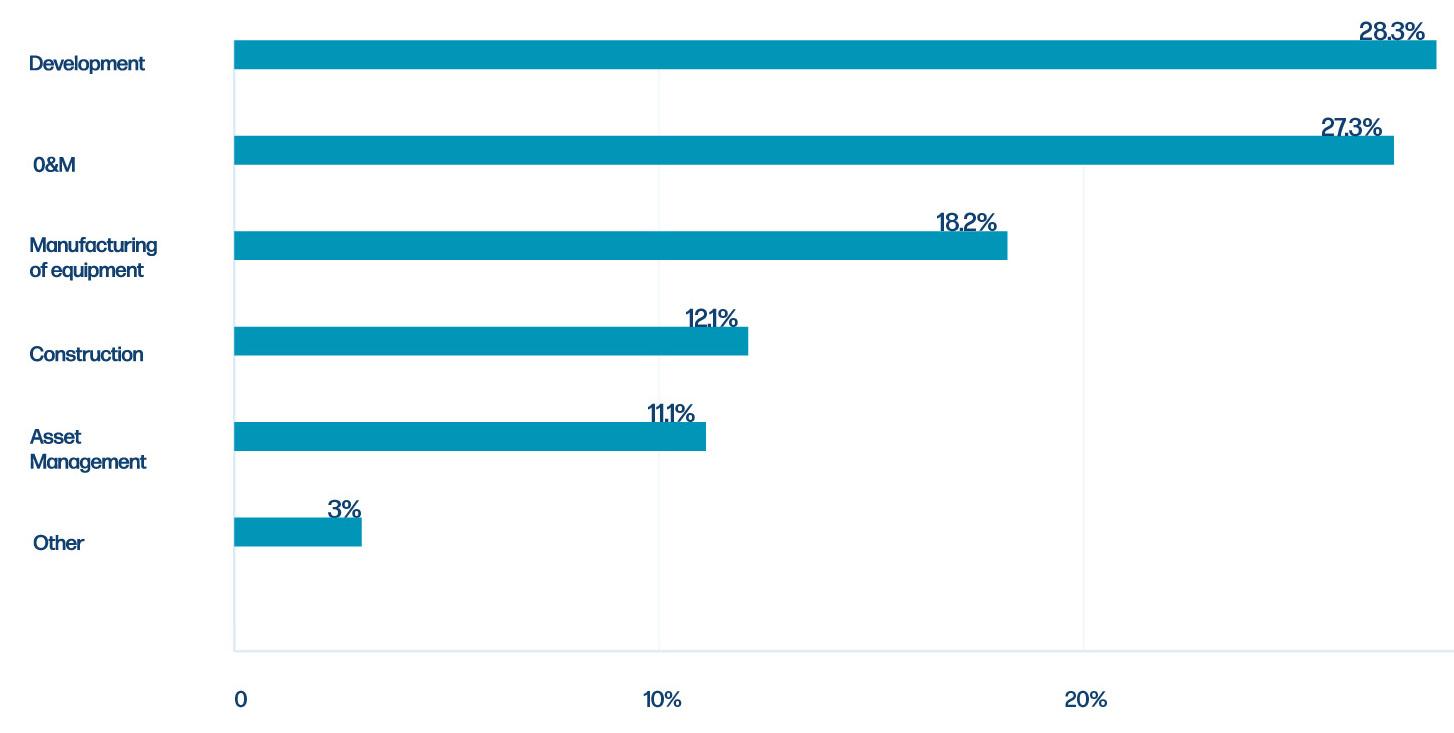
4. SPRINGER, R., ‘A Framework for Project Development in the Renewable Energy Sector’, National Renewable Energy Laboratory, (February 2013), www.nrel.gov/docs/fy13osti/57963.pdf
5. ‘Technical support for RES policy development and implementation: Delivering on an increased ambition through energy system integration’, Publications Office of the European Union, (September 2021), https://op.europa.eu/en/ publication-detail/-/publication/6fcc38cb-1440-11ec-b4fe-01aa75ed71a1/language-en
6. ‘Collaboration, Integrated Information, and the Project Lifecycle in Building Design and Construction and Operation (WP-1202)’, Construction Users
Roundtable Figure 3 . RatedPower’s Solar Research Report showed that most think implementing technology solutions are most important in the development stages of the supply chain.3Wesii, Italy, details how photogrammetry and remote sensing can be utilised to detect the ideal locations for photovoltaic plants.

hotogrammetry is the family of processes and procedures that extract geometrical, 3D information out of bi-dimensional images, while remote sensing is the family of processes and procedures that deduce physical characteristics of what has been captured by images from different spectra than the visible light (RGB) – in fact, these images are taken with special sensors during multispectral inspections.
Photogrammetry and remote sensing are solutions offered by Wesii to collect and analyse geospatial data, providing useful information about morphology and terrain cover. The service has been set to be fast and flexible due to a combination of using manned and unmanned aircraft to acquire frames of the area of interest from above, and the software apparatus to be able to generate a considerable range of different deliverables depending on the client’s needs.

So, what are these needs? There are many cases where having a complete overview of the terrain is useful, if not mandatory: any construction project must consider if and where exactly it is possible to build or to install structures, something that strongly depends on slopes, presence of obstructions, groundwater surfacing, and other features related to the profile of the area. Traditionally these inputs come from on-site, manual surveying, which is either time-consuming and expensive, or neglected.
Wesii makes use of high-resolution RGB and multispectral cameras during aerial inspections to overcome these flaws, being able to cover wide areas with small operational costs and still producing any output that technicians and engineers may want.
The inspections are performed by using either airplanes or drones.
While the single drone flight is obviously less expensive and easier to plan compared to the airplane, it covers far less surface per working day, and it may face some regulatory constraints depending on the location.
On the other hand, the airplane requires higher costs per flight but can survey huge areas of interest or a lot of clustered areas of interest during a single inspection, up to 700 ha., without loss in quality nor in the resolution of the images. Therefore, the vehicle choice is based on the peculiarities of the area and on the aim of the work, but what the client gets in their hand is ultimately the same.
Speaking of resolution, both the airplane and the drone can mount an RGB camera and a multispectral camera able to capture near infrared (NIR) images in the range of 0.7 – 1 microns. While drones cannot withstand cameras with higher than 13 mm focal length, airplanes have much better load capacity, hence the 50 mm focal length of their cameras and thus the higher altitude of their flights.
In both cases, the setup has been studied to reach up to 1 cm/px ground resolution, which is usually far more than needed to get useful results.
It is the first photogrammetric restitution out of the collected images. Since they are taken with enough overlap and side-lap, a lot of tie-points between different images are expected and detected, their location computed, and eventually, they are represented in a 3D space (see Figure 1). Thus, the name of the product: each point of the cloud is associated with its own X, Y, and Z co-ordinates and its own RGB colour (based on the RGB images capturing the point itself).
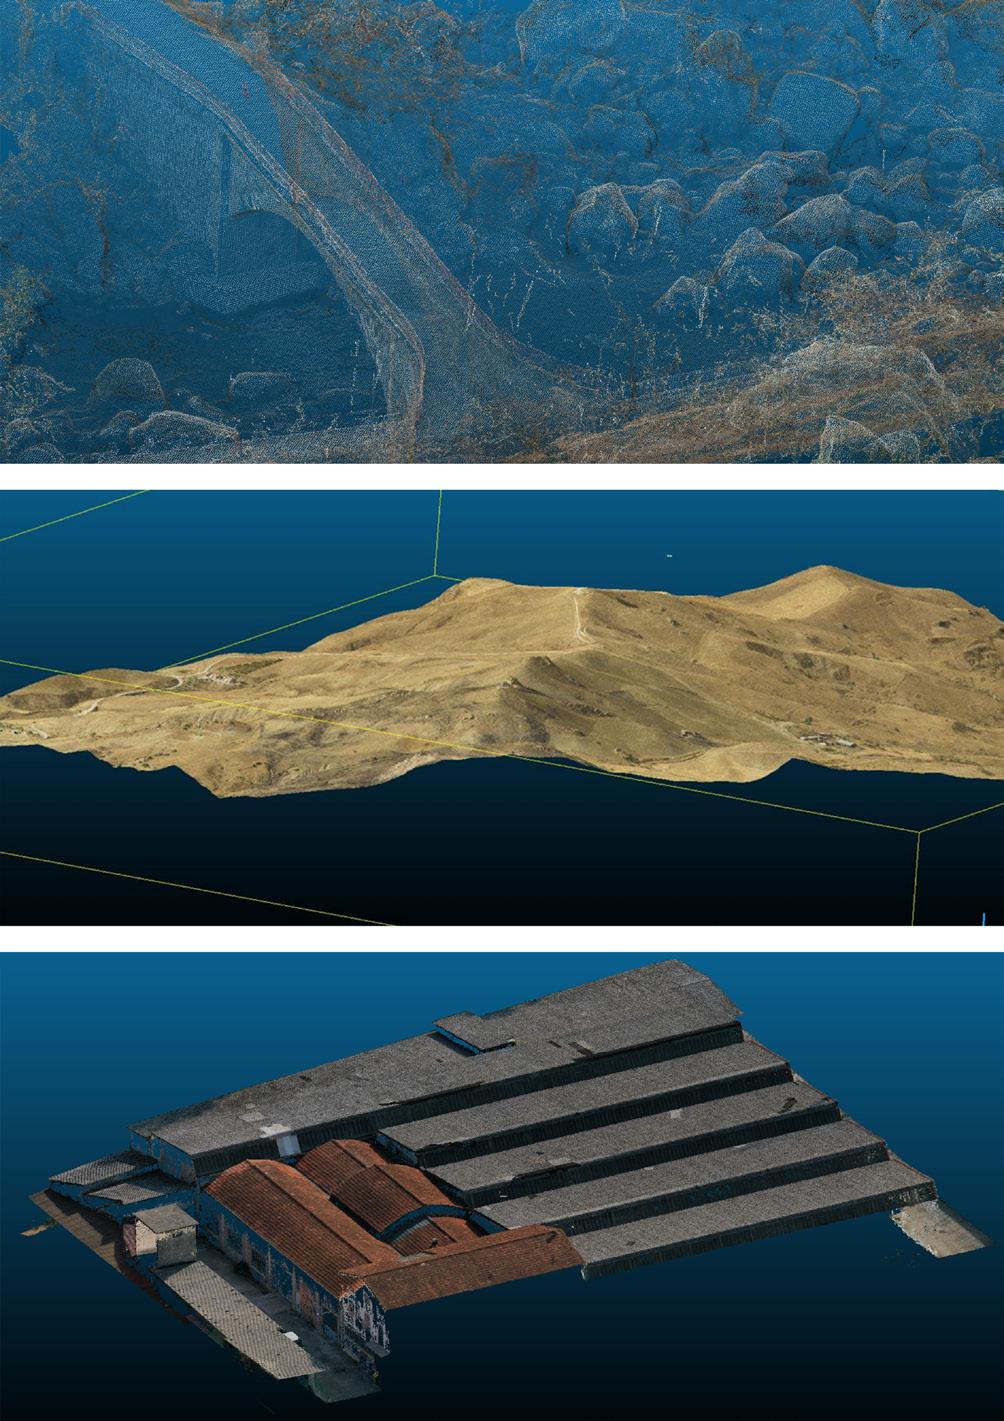
The quality of a dense point cloud can be quantified by the density of its points.
By the interpolation of the dense point cloud, a bi-dimensional map of the area of interest, seen from above, can be produced. The pixels in this digital elevation model (DEM) have preserved the elevation information from the original data so that the map can be coloured depending on the altitude values of each of its pixels, as shown in Figure 2. Wesii can offer the pure representation of the surface, which is called the digital surface model (DSM), otherwise it can rely on software processing to filter any element on the ground: buildings, vegetation, and obstructions of any sort. The ground profile is then generated in a so-called digital terrain model (DTM).
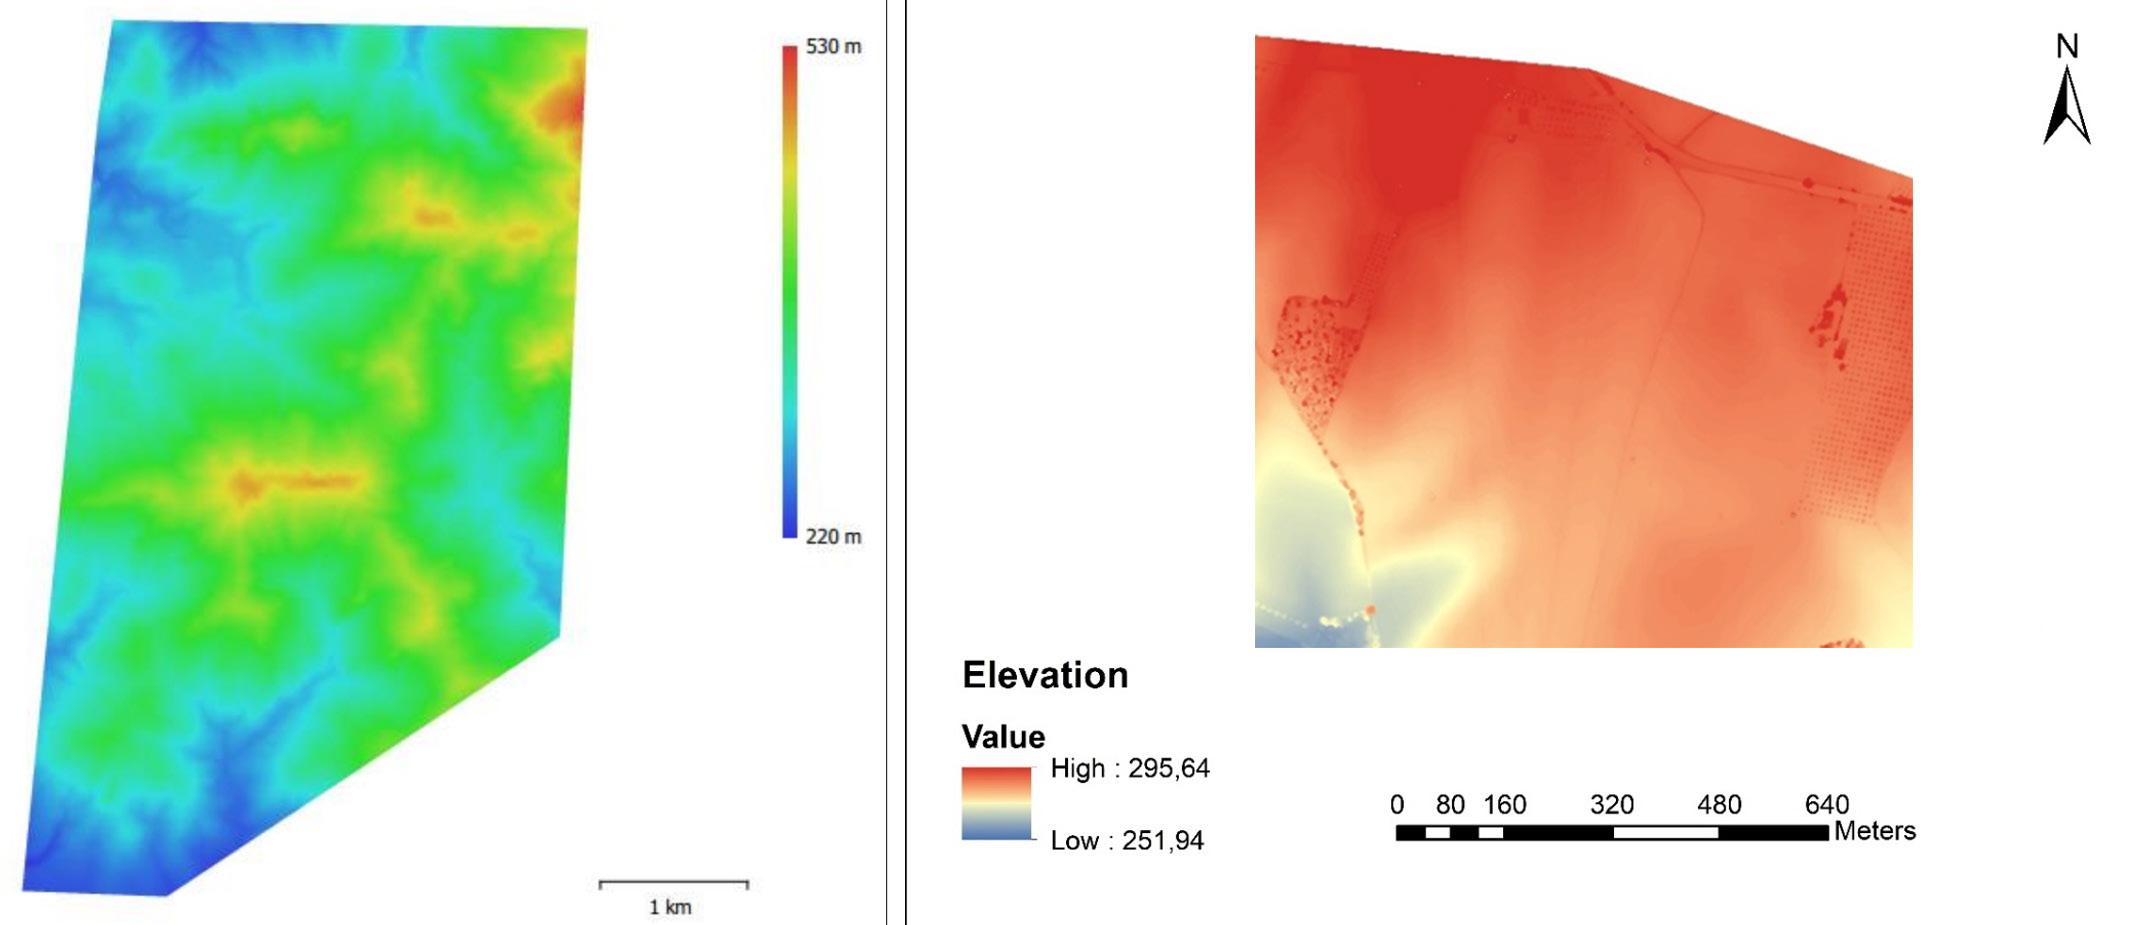
Both versions of the resulting map enhance the shape and the morphology of the area, ending up being a visually impactful overview.
Orthomosaics are the product of two different processes: mosaicking, meaning the union and the integration of all the images of the aerial survey into one single representation; the orthorectification, meaning the polishing of this representation from all the distortions due to perspective and camera lens. The results of the two processes are demonstrated in Figure 3.
Figure 1 A few examples of dense point clouds.#RUKGOW23
The largest dedicated offshore wind event in the UK is returning to London. Don’t miss 6 streams of content, 250+ expert speakers, 180+ exhibitors and so much more!

Ultimately, an orthomosaic is then a geometrically accurate bi-dimensional map, traditionally made out of a visual RGB image but not necessarily. Consistent measurements of distances, angles, and areas can be made, making it a strong tool for engineering purposes.
The quality of an orthomosaic can be quantified by the ground sampling distance (GSD), i.e., the portion of terrain each pixel of the orthomosaic is covering. It is possible to reach up to 1 cm/px, which is great considering that commercial satellites, for example, do not go further than 30 cm for the visual RGB restitution and further than 1 m for the multispectral restitution.
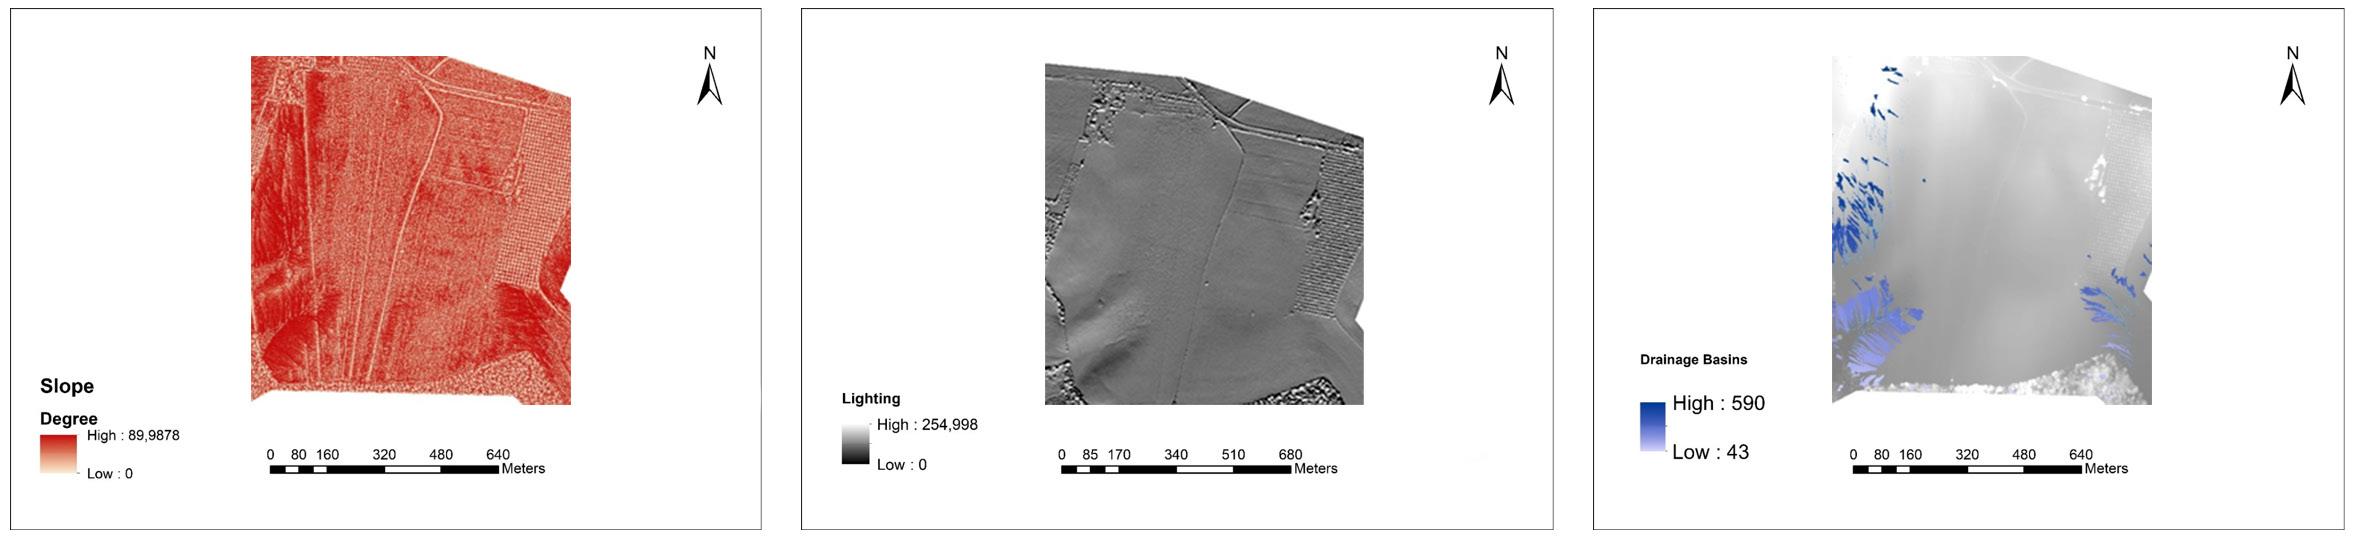
The RGB information stored in the pixels of a traditional visual RGB orthomosaic can be substituted by indexes and values out of photogrammetry and remote sensing elaborations. The possibilities are virtually infinite, but here’s a list of the most frequent outputs that clients requested to support their construction projects:
> Slope maps are assigned a colour scale depending on the slope values of the terrain in each pixel, calculated by the DEM. Those regions that have too steep of values could prevent structures installation or additional work may be needed.
> Water flow and drainage basin maps simulate the behaviour of the water during precipitation events so that it can be taken into consideration to correctly estimate erosion, usage, and oxidation phenomena.
> Hillshade maps simulate the direction and the orientation of the sun rays to assess how shades are
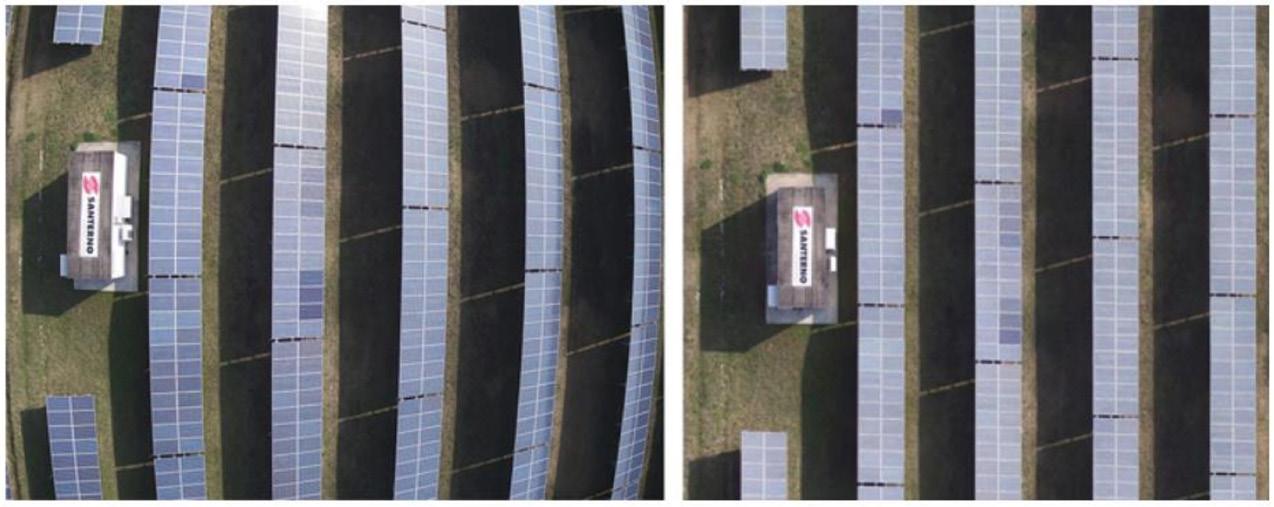
formed and distributed across the area at different times of the day.
> Terrain cover maps store information collected from multispectral aerial inspections to better recognise, locate, and quantify any particular type of element covering the ground: human fabricates, minerals, substances in the water flows, and, most commonly, vegetation.
By crossing images from different light spectra, it is also possible to build any index map. One of the best examples is the vegetation index maps, where each pixel is assigned an index value that can tell which plants are present over the area of interest, what is their health status and chlorophyll activity, or if they suffer from water stress.
Any feature that can be recognised and isolated thanks to visual or multispectral outputs can also be digitised into vectors. Streets, vegetation, and buildings planimetry can all be drawn and translated into fundamental elements of a geospatial database so that the client can locate them and enrich them with any relevant information. Slopes and shapes can be digitised as well, by defining contour lines with the desired step.
The company can produce the above-mentioned outputs in any format among the most commonly used, either for geospatial information systems (GIS) or for CAD applications. Everything that was requested and generated by Wesii’s procedures is made available to download in a dedicated section of the company’s website so that clients can open them in their own applications to go further with the analyses.
That said, a custom report can also be requested. The company’s internal technicians will then translate the collected data into meaningful information and write it down in a document that can also be downloaded from the web platform. It will contain a detailed description of the adopted acquisition methodology, but also considerations on the peculiarities of the area,
Figure 4 A few examples of thematic maps produced out of the same dataset. From left to right: slope map; hillshade map; drainage basin map.critical instabilities, and other characteristics that are not negligible for the purposes of the work. This is particularly true for construction projects that revolve around new photovoltaic plants since Wesii’s main business is aerial thermography to monitor their performances. Thus, the company has the experience and the knowledge to focus on those aspects that the company knows are especially relevant. On top of that, the client may take advantage of Wesii’s monitoring services in the following years to have the entire lifecycle history of the plant in one place.
If the client needs a web application to actually view and manage the photogrammetric and remote sensing outputs, an entire section of the company’s website is performing as a 3D viewer: dense point cloud, any vector, documents, photos, and videos can be uploaded and viewed in the same 3D space. Basic tools are also available to measure elevation, distances, angles, and volumes, as well as extract sections and profiles of the terrain.
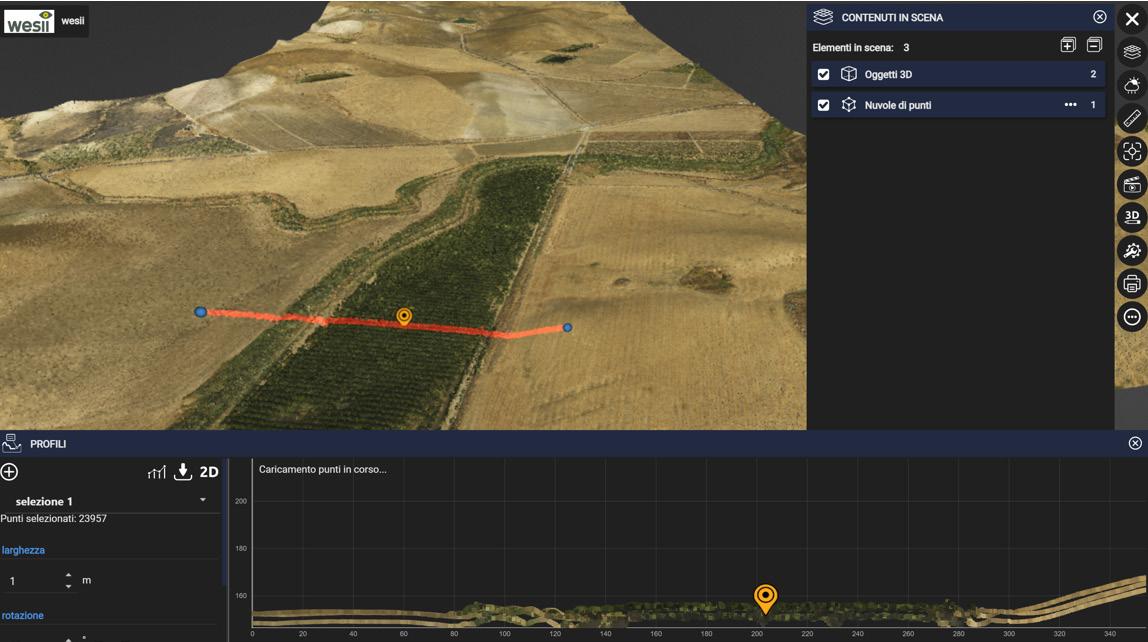
A complete aerial survey with both photogrammetric and remote sensing purposes was performed on a site in Viterbo, Italy, with an airplane, over an area of approximately 1000 ha., in 2021.
Sistema Rinnovabili was interested in the construction project of a new agrivoltaic plant using trackers. The aim of the work was therefore to estimate the dimension and the location of the asset, depending on the morphology and the characterisation of the terrain; additionally, since the area of interest was located across the countryside and the plant is an agrivoltaic, the client wanted to assess the health status of the several olive trees present in the land plot.
Visual RGB and multispectral images were taken and then processed according to what was described in the previous paragraphs. To meet the needs requested by the client, Wesii produced:
> A complete photogrammetric restitution, including dense point cloud, DSM, contour lines, and RGB orthomosaic.
> Slope map and drainage basin map among the thematic ones.
> Vegetation cover map, and the two index maps: one to detect the health of the vegetation, and another one to quantify its chlorophyll activity.
The area was subdivided into different zones according to their morphology characterisation, allowing the identification of the most suitable areas for tracker installation using a slope map.
In general, for all sites where the company performs photogrammetry, it is possible to detect shared areas.
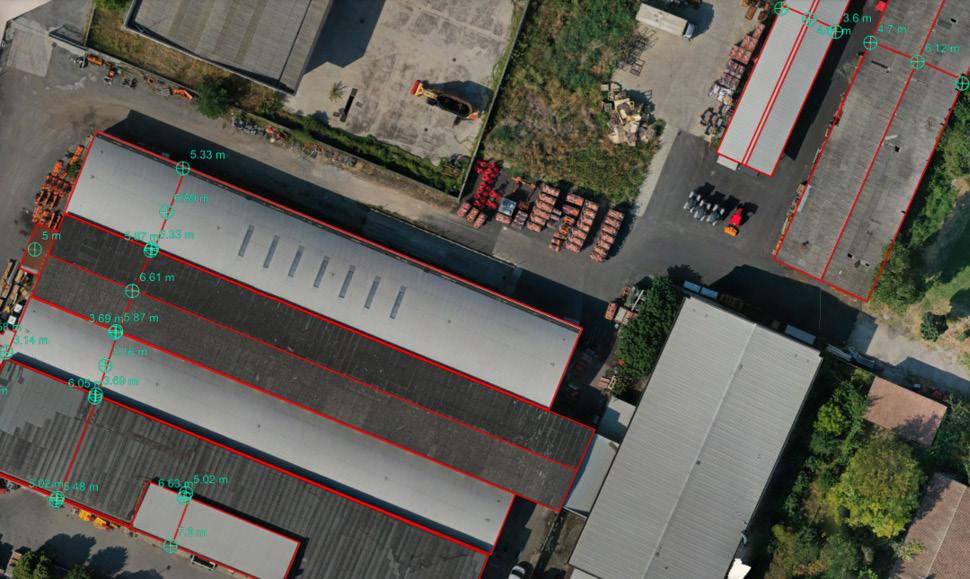
Such inspections are very helpful because they can identify potential issues or extra costs to account for in the early stages of development.
The slope map can help to understand if the area is suitable for the installation of a tracker or if excavation work is required. On the other hand, the hillside map can help to assess potential energy production risks due to shadows from trees or the morphology of the land. Ultimately, those allow the project owner to proceed with activities reducing future risks of extra costs.
On top of that, it is possible to study the vegetation by the vegetation cover and simulate the water stagnation.
This analysis helps the developer to assess the potential risks of structural damage or areas that are more likely to have enhanced grass growth compared to others with less grass growth.
In a part of the area, olive trees were studied through the extracted index maps. One of them in particular, the red chlorophyll vegetation index map, showed some trees with noticeably low photosynthesis activity, giving useful insights for the agronomists about where to focus their attention.
Figure 6 . The main dashboard of the 3D viewer while a Wesii operator is segmenting the profile of a dense point cloud.
nergy storage is fast becoming a vital component of the UK’s power grid. The UK electricity system has seen an increasing volatility due to growing levels of intermittent renewable energy, scarcity, variable demand and supply, larger demand/supply losses, gas pricing volatility, and the recent invasion in Ukraine. With the demands of the UK’s net zero binding commitment and the need to constantly update its energy system, energy storage is an instrumental tool to manage and balance the UK electricity system. Currently, the UK has 1.8 GW of operational battery storage that has helped the system to keep frequency at statutory levels and to balance the system through the balancing mechanism and other liquid markets.
By 2050, it is projected that approximately 74% of generation may come from wind, solar, and biomass, contributing to a lower carbon intensity over time. The transition to renewables is accelerating and storage will be a key enabler for this to materialise, given the criticality of grid stability. The ability to store renewable energy for use during peak demands solves the problem of matching intermittent energy supply with varying grid demand.

Batteries, with their short/immediate ramp-up times, play an increasingly important role in balancing mechanisms amidst greater volatility. These quick ramp-up times are key in providing
short duration power to National Grid at an attractive short-run marginal cost to the generator.
Thus, the importance of battery energy storage system (BESS) assets cannot be underestimated when it comes to the UK’s commitment to achieving net zero targets. BESS’ play an imperative part in this as they allow for greater flexibility and using available energy sources more efficiently. The efficient use of BESS’ can boost the utilisation of renewable energy sources, leading to a reduction in fossil fuel demands while supporting a secure and reliable energy system.
Batteries provide an optimum solution due to their fast response times (close to 100 msecs.) and ability to store energy for extended periods of time if a long duration market is created. Over the past few years, the technology behind energy storage using batteries has advanced significantly, paving the way for investors to make attractive investments.
There are several markets available for BESS in the UK and globally. The current main markets include ancillary services,
Sonia Quiterio, Conrad Energy, UK, evaluates the role of battery energy storage in a system dominated by scarcity.
wholesale arbitrage and balancing mechanisms, embedded benefits, and capacity markets. Inside the ancillary service categories are frequency services and reserve. There are other markets available, such as reactive power and black start. In the near future, the National Grid will create real-time markets to provide inertia and short circuit level that batteries can access too.
Due to current volatility and system scarcity, batteries could benefit from the growing economics of peer-to-peer energy trading and forward markets, which is one of the most important strategies that Conrad Energy focuses on.
Overall, the UK is increasingly becoming a hub for energy storage and technology. With the pressures of keeping up with a changing grid and balancing the system, energy storage in larger volumes and durations is an ideal enabler in helping to manage the electricity system. Investors can benefit from the range of markets that enable them to make attractive returns, while playing their part in achieving net zero targets. With the help of digital technologies, BESS assets can be optimised to provide effective, secure, and efficient storage to the power grid,
allowing the UK to move forwards to becoming a fairer, greener, and more sustainable country.
The UK energy system is experiencing lower levels of inertia compared with 5 – 10 years ago, and these levels will continue to fall. There are increasing levels of both largest loss size and high rate of change of frequency. These elements, together with an unpredictable supply and demand, create a high volatile electricity environment that is challenging to manage and stabilise. In response to that challenge, the UK system operator created different products that can help the system to be more stable. These products and their requirements are set out in Table 1. Batteries have had, and will continue to have, a crucial role to help the National Grid balance the system and provide key frequency, reserve, and stability services.
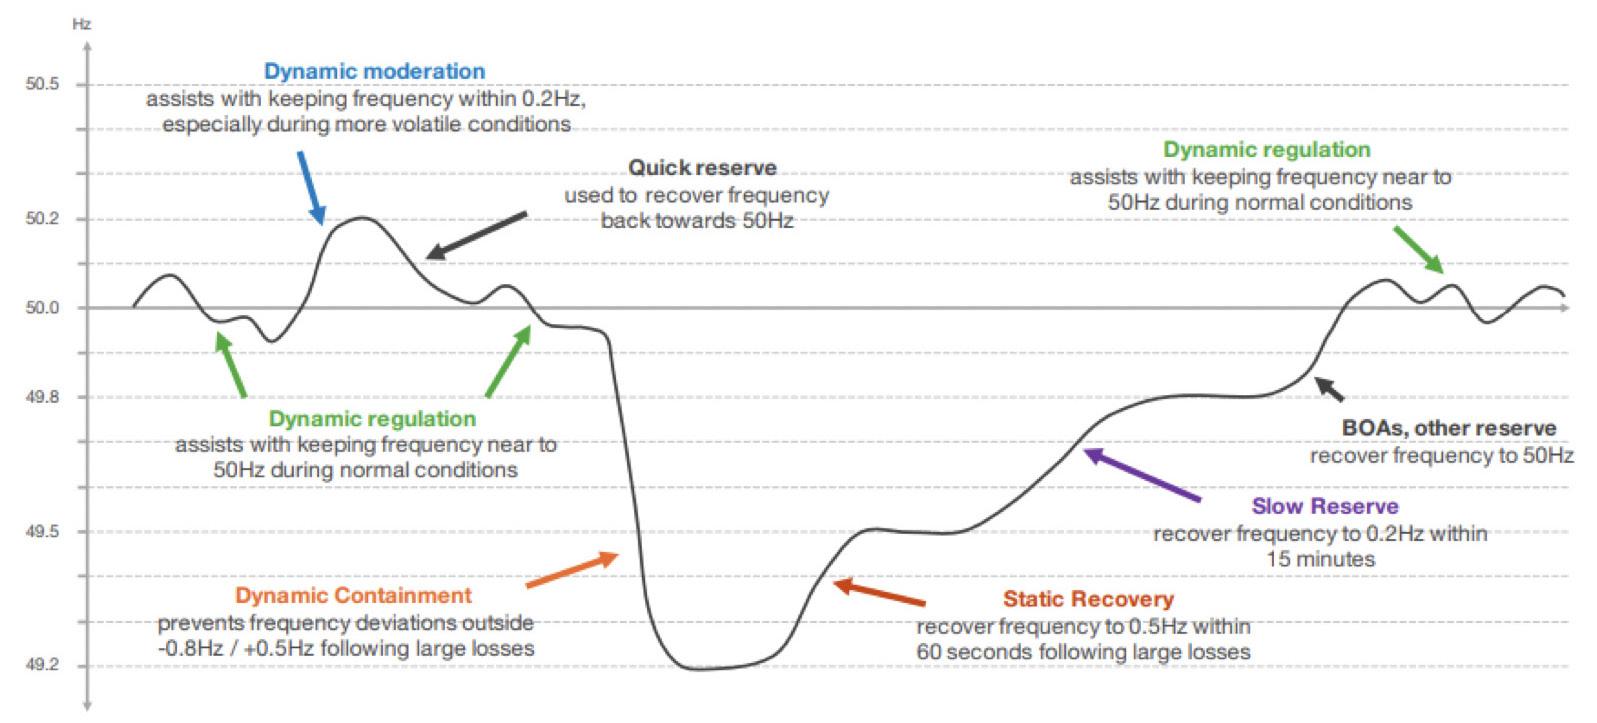
The size of National Grid frequency requirements is driven by the inertia levels on the UK electricity system and the size of both generation and demand losses. These requirements may change based on the evolution of the system in the short, medium, and long term.
FES shows that by 2030, the system is expected to have 25 – 45 GW of within-day flexibility, mainly from smart charging of electric vehicles, vehicle-to-grid, smart electric heat, smart domestic appliances, and battery storage with duration of a few hours.
Conrad Energy is an example of a company that is digital and technology focused, and believes that by using high-tech strategies, such as machine learning, both gross margins and profits can be maximised by monetising its own and other people’s assets. The company has used machine learning to create a platform that accurately predicts pricing and takes decisions to participate in liquid and ancillary markets in the UK.
Machine learning (ML) is a branch of artificial intelligence (AI) that lets computers learn from data without being explicitly programmed. ML algorithms use statistical techniques to find patterns and insights in data, using them to make predictions and decisions.
By using historical data on energy consumption, cost, and rates across different regions, these ML algorithms, such as regression and time series analysis, can be used to determine patterns in energy consumption and price fluctuations, and
thus provide accurate predictions on future pricing modifications. Additionally, automated data gathering by scraping public sources and further analysis can be used to identify future risks and opportunities. In this way, ML can help businesses plan ahead and make accurate decisions with regards to energy pricing strategies. ML is used in a variety of applications, but it is crucial for managing energy assets and maximising their value by optimising revenues and profits.
In the energy sector the company is involved in, ML has the potential to revolutionise the way energy prices are predicted in the UK energy markets. By leveraging the power of advanced algorithms and large datasets, machine learning can make highly accurate predictions about future energy prices. Through analysis of current and past energy price trends and usage patterns, ML models are able to accurately predict future prices and identify opportunities for savings. Features such as seasonality, weather effects, geographic location, and market conditions can also be taken into account. Predictions generated by ML models enable energy companies to better analyse and manage energy demand, helping them to make more informed decisions when setting prices. Furthermore, ML can be used to optimise energy efficiency by predicting future energy needs and identifying energy-saving opportunities.
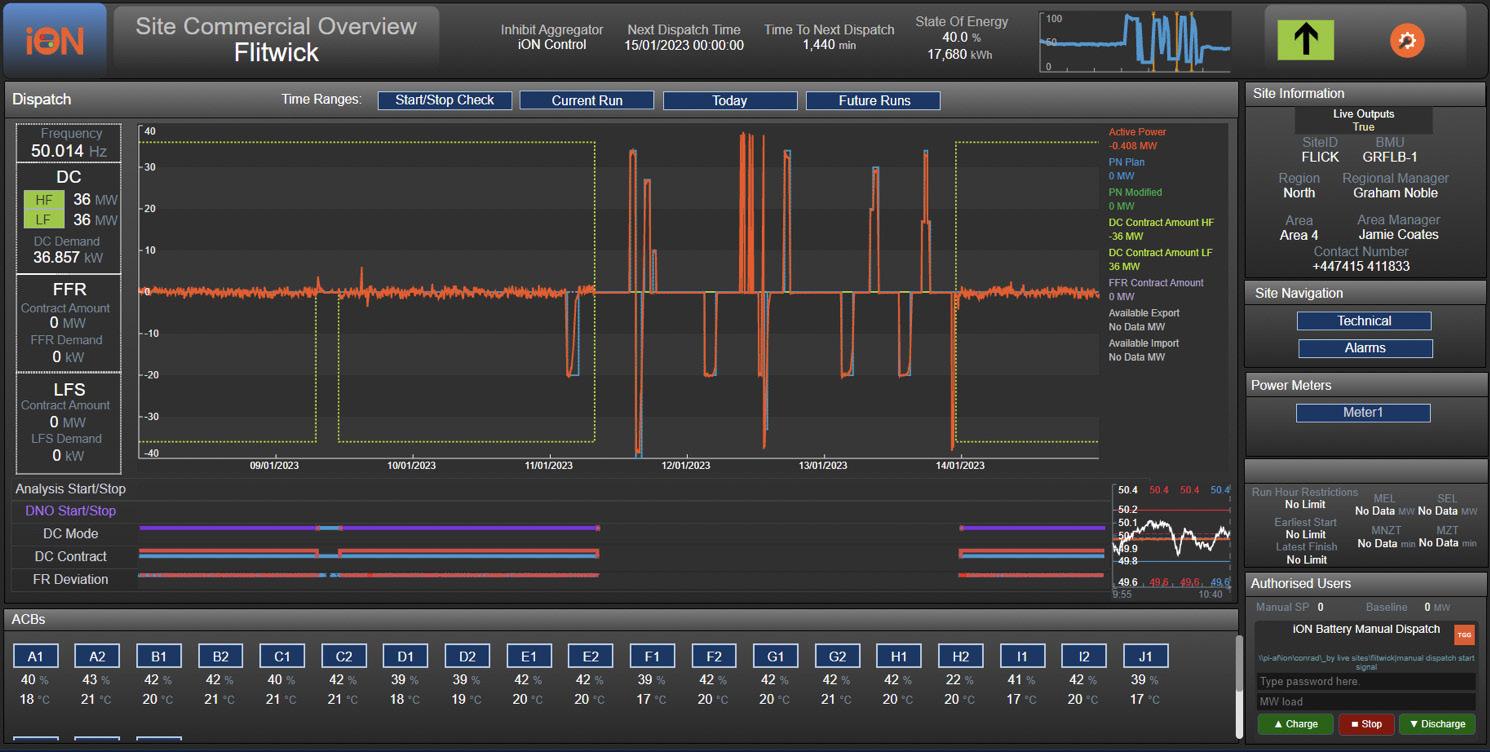
Conrad Energy has a portfolio of 160 MW operational or under construction in the UK, with a pipeline of 1.3 GW to be built in the following years.
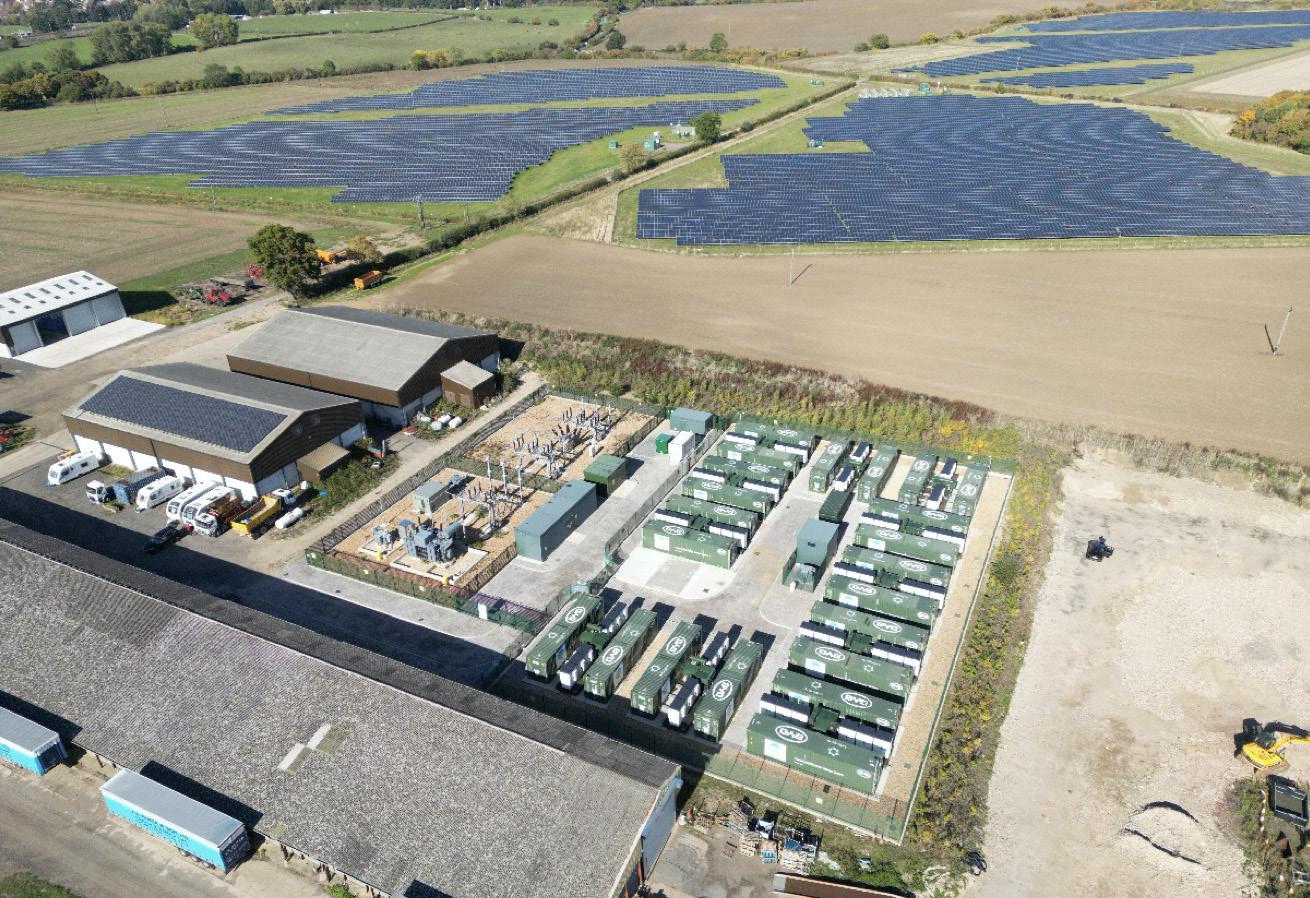
Its portfolio uses LFP batteries, which are integrated in a BESS by Tier 1 global integrators. The systems are procured with a futureproofing element that will allow them to participate in current and future markets, such as liquid markets, frequency services, reserve, and stability products.
The company’s portfolio is managed by its IoN platform, built in-house, which uses a ML system that
takes decisions automatically and accurately forecasts market pricing.
Its batteries have performed at a rate 1.7 times to what has initially been set as a baseline value. The use of advanced digital systems and a very competent team have allowed the company’s assets to reach and maximise its investment.
Digital technology plays a key factor when it comes to BESS’. It has an important role in optimising BESS assets by taking decisions automatically. In addition to that, modern digital processes and techniques, such as asset-lifecycle management, remote monitoring, analytics, and autonomous control systems, allows for more efficient cost-based approaches to managing the power grid.
Figure 2 Conrad Energy’s IoN platform.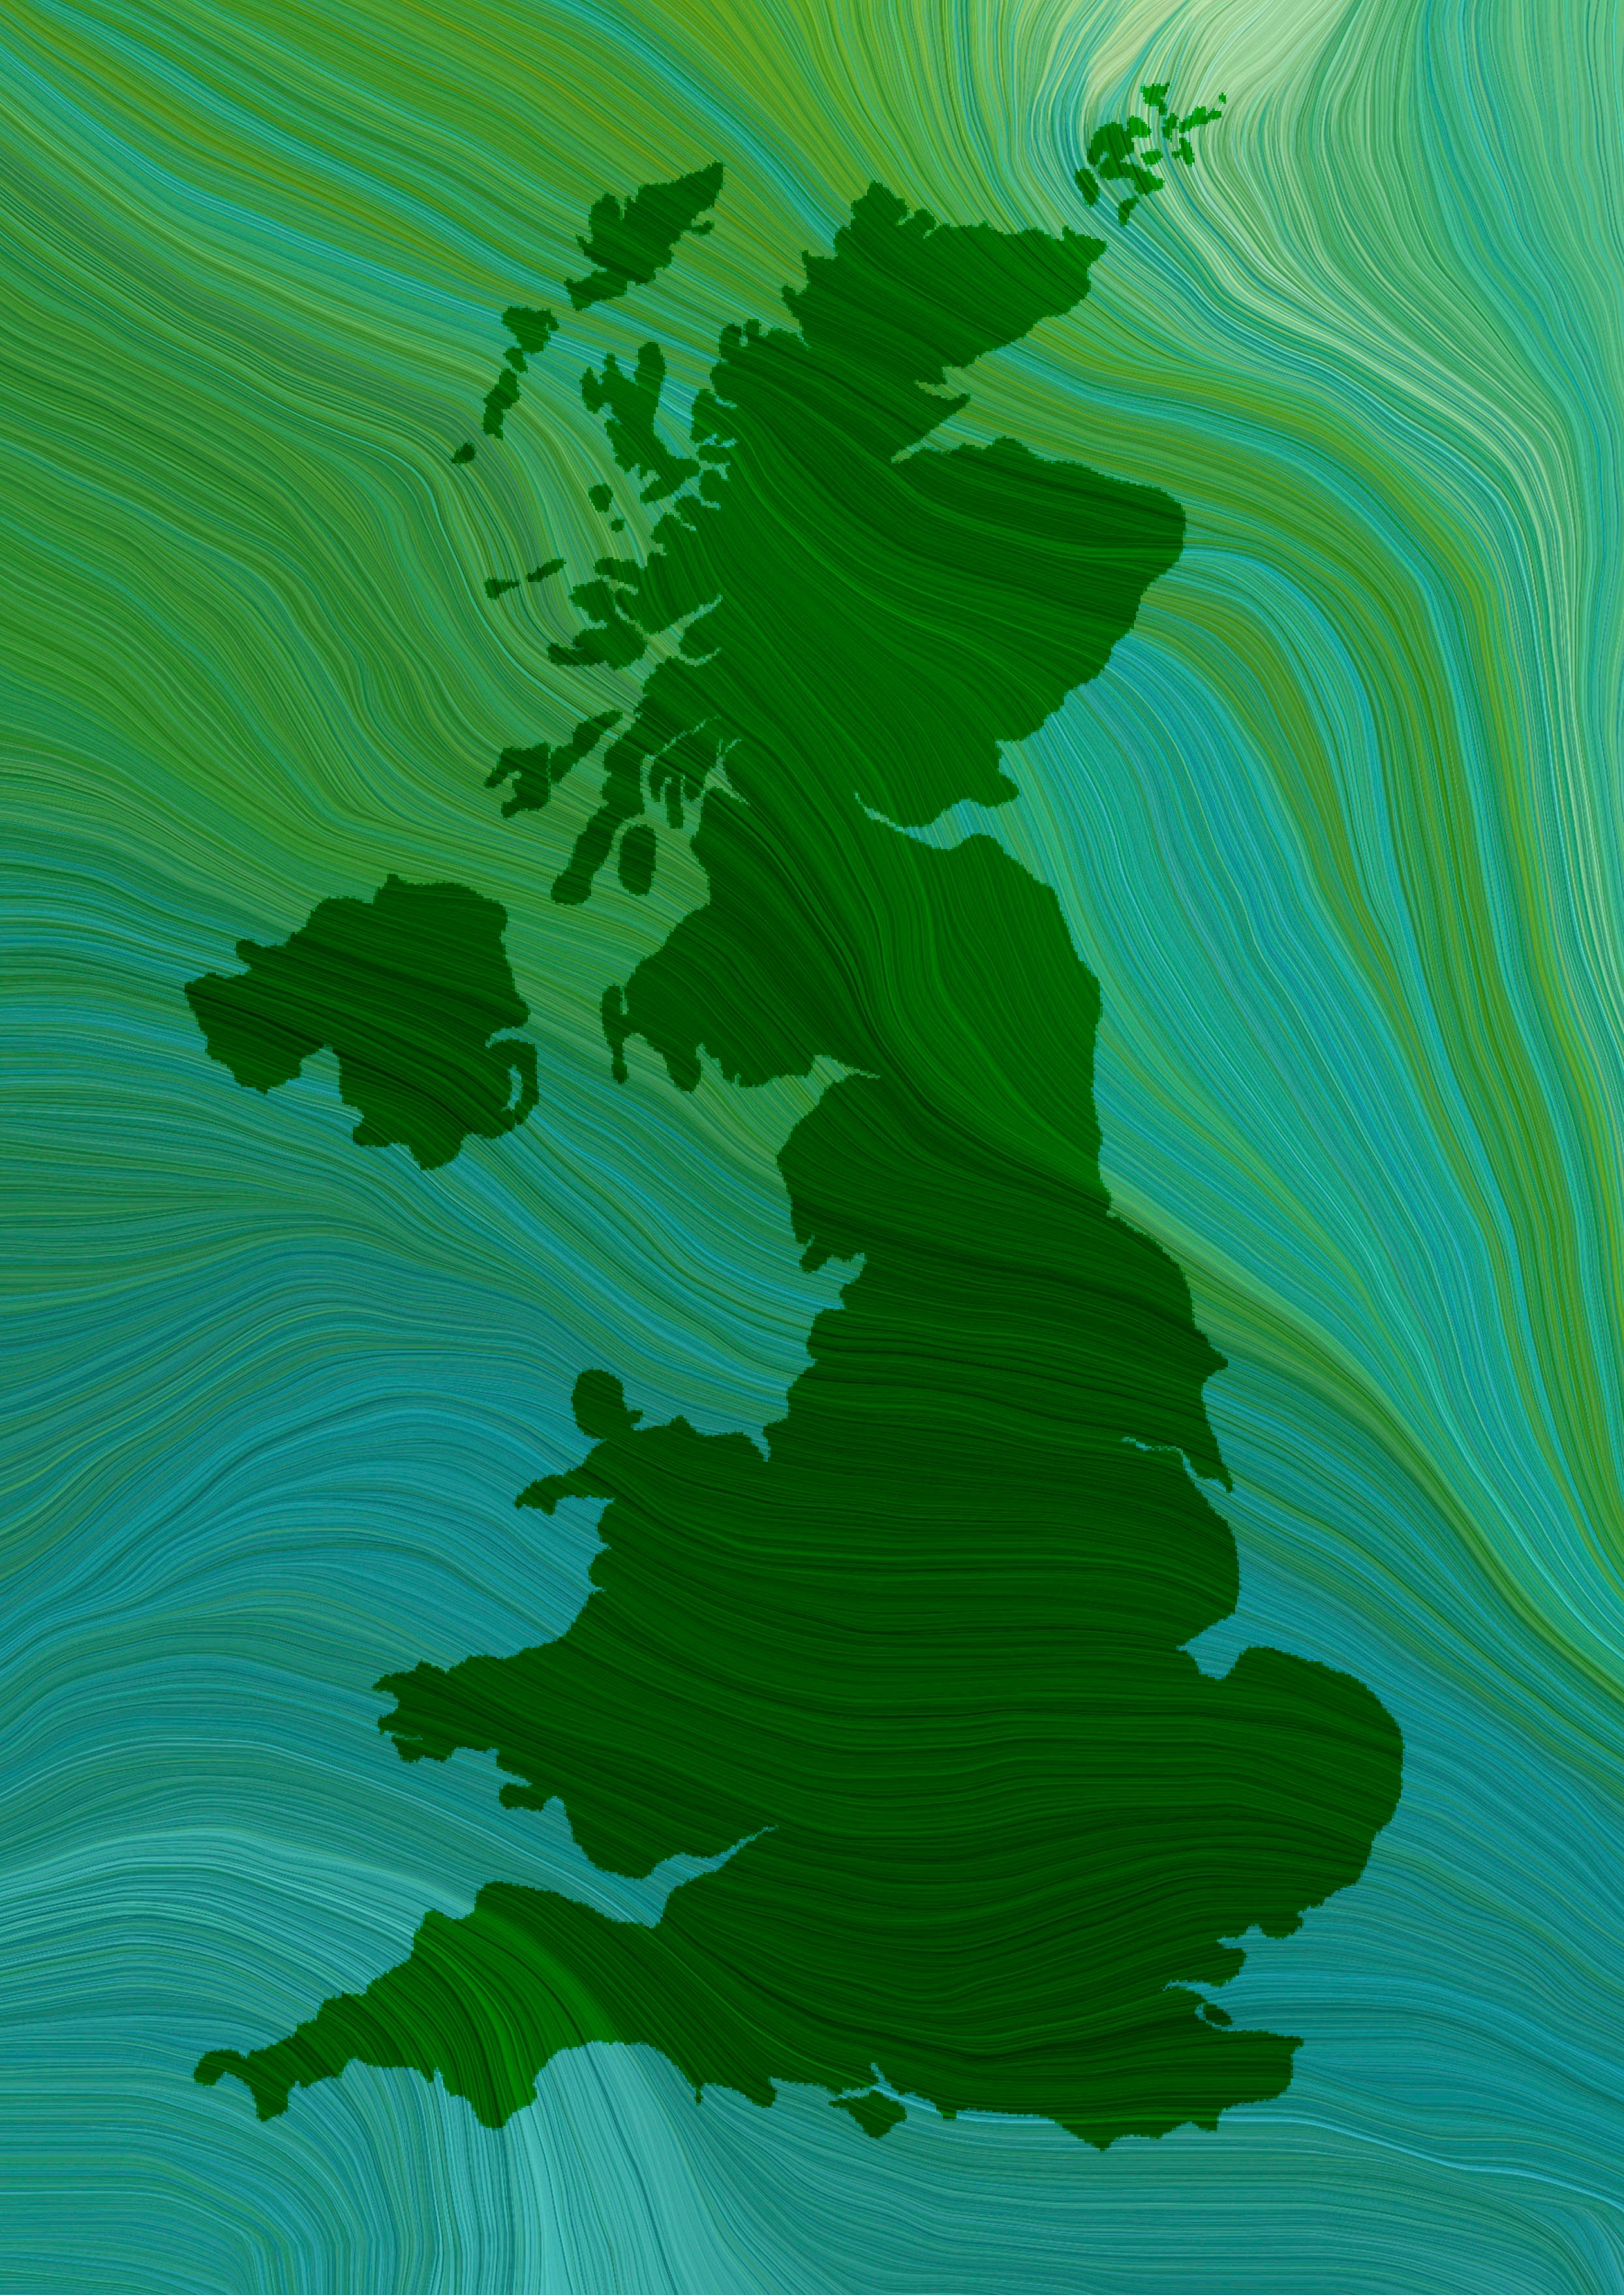
reen hydrogen is experiencing unprecedented political and commercial momentum across the world, with the number of policies and projects expanding rapidly over the last 18 months. In the UK, the government sees developing the green hydrogen sector as vital for meeting its legally binding commitment to achieve net zero by 2050 and to support the deep decarbonisation of the economy, particularly in ‘hard to electrify’ industrial sectors.
The government recognises the role of clean hydrogen in driving economic growth, developing sustainable supply chains, and creating high-quality green jobs to promote levelling up across the UK.
At the moment, the UK’s hydrogen production and use is heavily concentrated in chemicals and refineries. Most of this hydrogen comes from fossil fuels with no carbon capture; only a small fraction is low carbon.
The UK government’s Hydrogen Strategy, published in August 2021, outlined a comprehensive roadmap for the development of a thriving UK hydrogen economy over the coming decade and beyond. In its UK Energy Security Strategy, published in April 2022, the government doubled its ambition for UK production of low-carbon

Eric Adams, Hydrogen Projects Director, Carlton Power, UK, explores the accelerating growth of the green hydrogen economy in the UK.
hydrogen to up to 10 GW by 2030, subject to affordability and value for money. As part of this ambition, the government wants to see up to 1 GW of electrolytic hydrogen in operation or in construction by 2025.
Private sector investment combined with government support is critical if these targets are to be achieved. In 2022, the government introduced its ‘Hydrogen Investment Package’, including the £240 million Net Zero Hydrogen Fund providing development and capital support and the £100 million Hydrogen Business Model, which will provide revenue support to facilitate investment in new hydrogen production.
Amidst a range of hydrogen initiatives – in power, heat, and transport, the UK government has chosen to prioritise the development of the HyNet carbon capture, utilisation, and storage/hydrogen industrial cluster in the North West, and the East Coast Cluster. It is also funding a series of feasibility studies and demonstration projects under its Net Zero Innovation Portfolio (NZIP) Low Carbon Hydrogen Supply 2 programme and Hydrogen BECCS Innovation Programme. Since Autumn 2022, the government has been considering private sector bids to the Hydrogen Business Model.
It is important that in developing the hydrogen economy, the support mechanism delivers a combination of large, centralised multi-MW schemes in addition to smaller, distributed hydrogen production. The latter projects will,
by their very nature, be smaller, as they will be sized to meet current demands, but also be scalable to meet future hydrogen demands. In doing so, this will facilitate decarbonisation outside of the heavy industrial areas and trigger the infrastructure investment to ensure that all parts of the economy can benefit from low-carbon energy whether in the form of hydrogen or electricity.
These smaller projects will also in turn stimulate investment in the manufacturing and supply chain that is required to deliver the hydrogen economy; for example, in electrolyser production, hydrogen vehicle manufacture, hydrogen-capable industrial plants, in addition to the wider hydrogen infrastructure. As has been demonstrated in the renewable industry, projects at an appropriate scale are required to incentivise the supply chain to scale their manufacturing operations and invest in research and development to deliver cheaper and more efficient equipment.
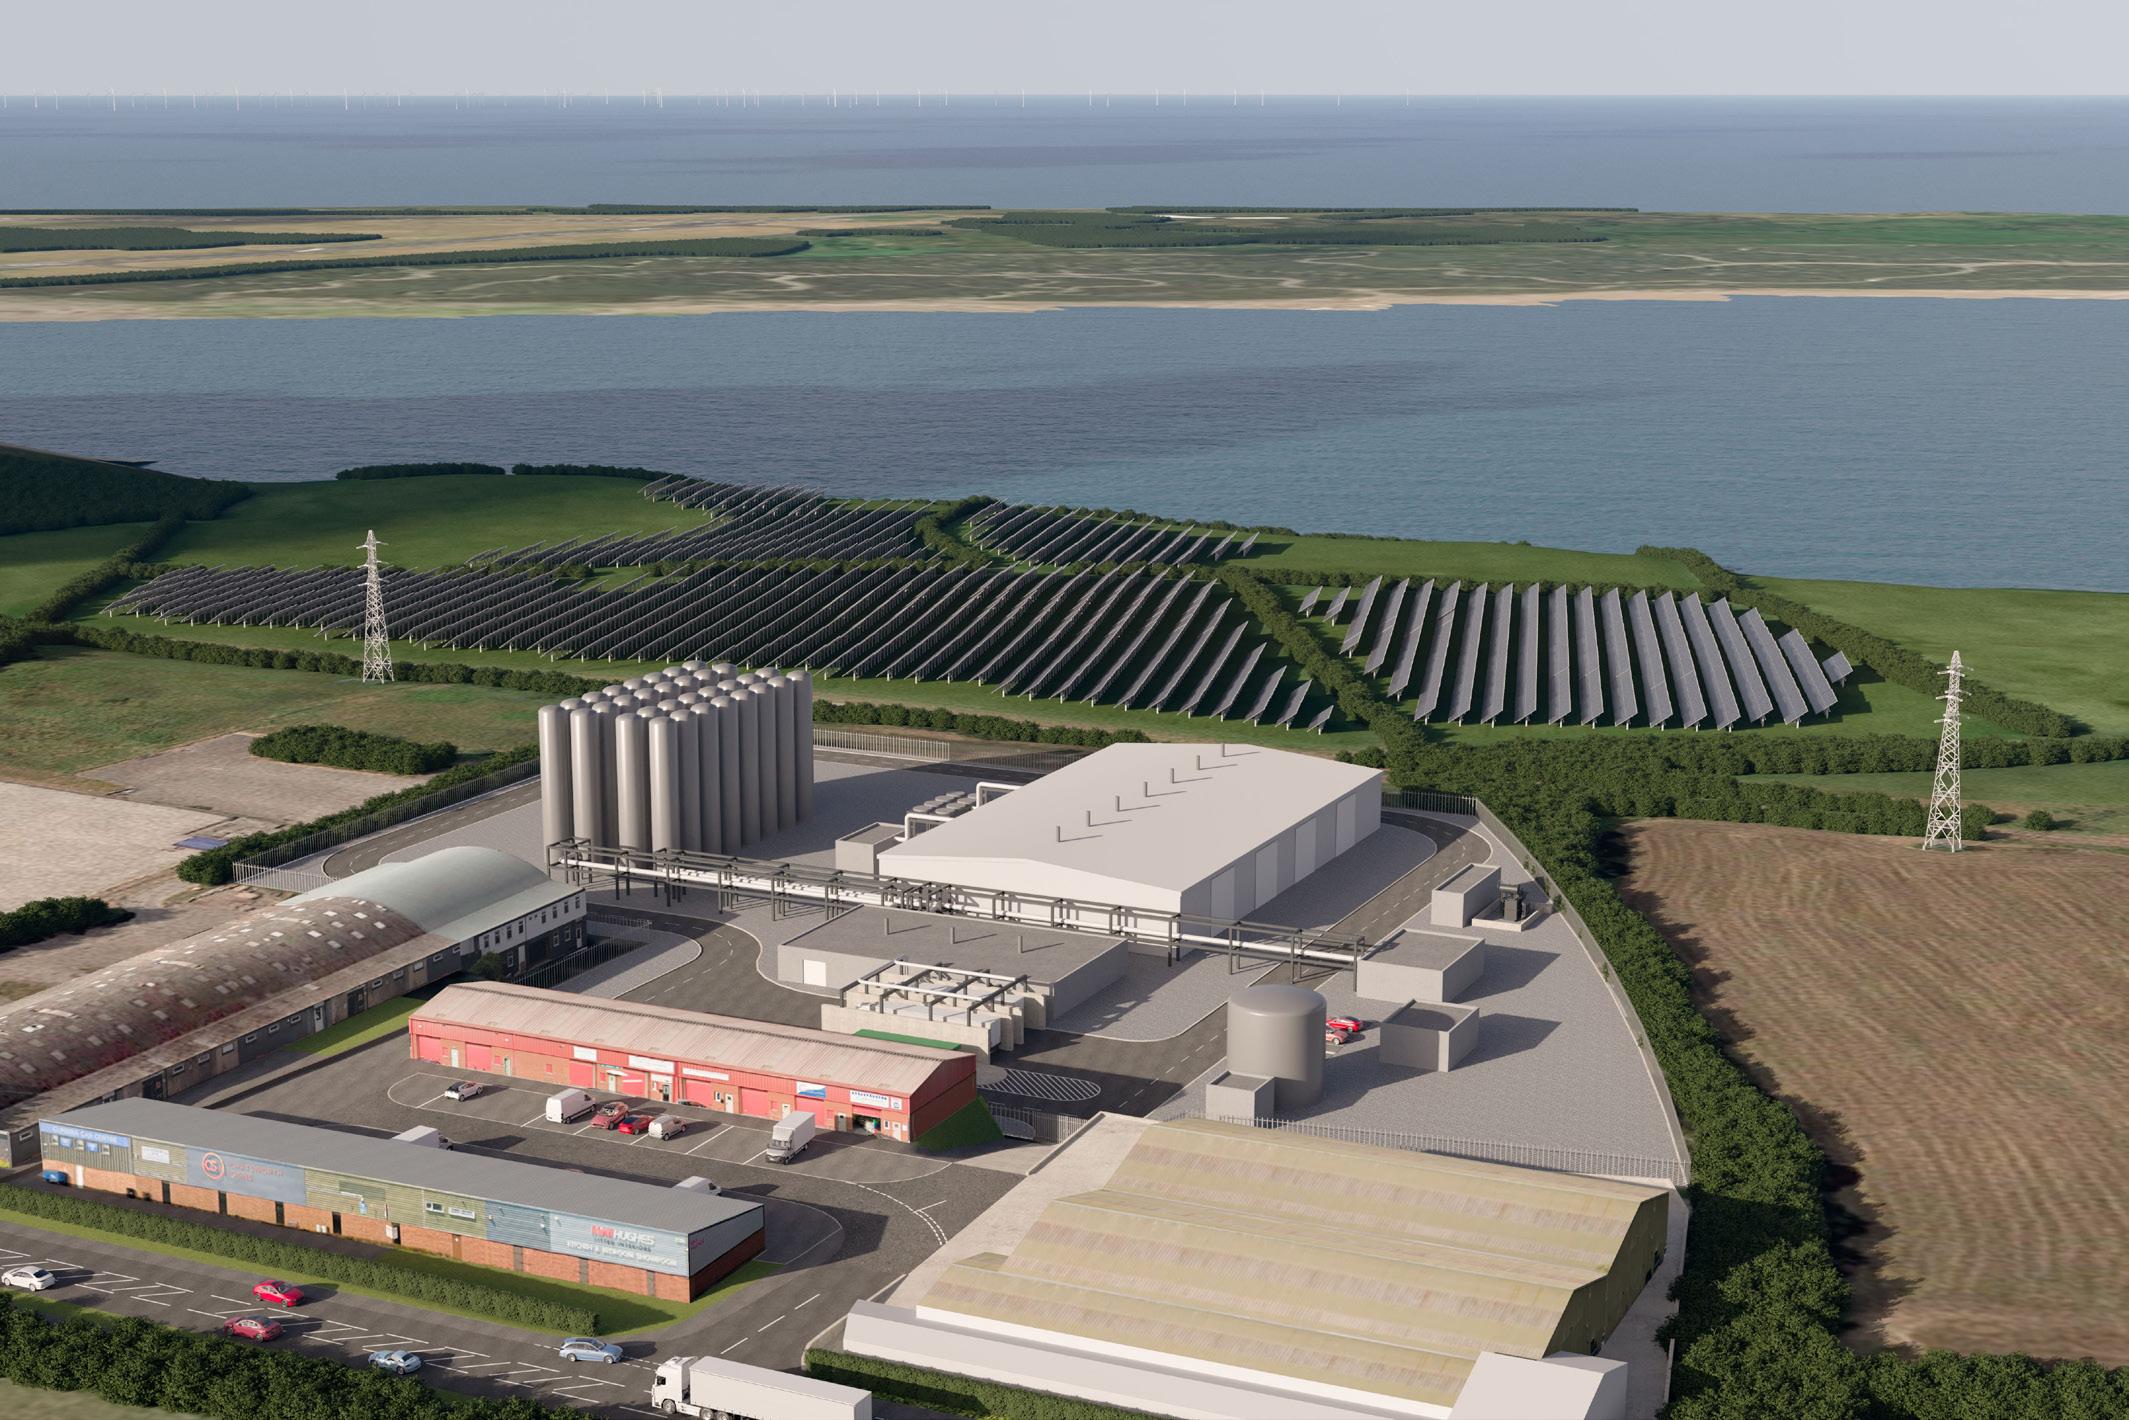
Drawing on the company’s development experience in gas generation and energy storage, Carlton Power has entered three hydrogen hubs into the government’s Hydrogen Business Model competition – in Cumbria, Devon, and Greater Manchester. All three projects can enter commercial operation in 2025 – a key target date for the UK government. Carlton Power wants to help build the hydrogen economy across all parts of the UK; it is critical that projects

outside of the country’s heavy industrial areas are supported so as to provide early and meaningful progress towards net zero for energy intensive industries which underpin economic activity in these areas.

Each Carlton Power project will use renewable electricity – principally wind and solar – to produce green hydrogen fuel for companies that operate energy-intensive processes and those with transport fleets – HGVs and public transport. These schemes can act as catalysts for multi-million-pound inward investments, be distributed around the country, and therefore help to achieve the government’s ambitions to level up prosperity and opportunity in all parts of the UK.
The company’s £300 million Trafford Green Hydrogen scheme in Greater Manchester is the UK’s largest consented green hydrogen project. Strategically, it will be a catalyst for more low-carbon generation and greater energy security in the North West and will boost investment in new energy infrastructure and the creation of new green jobs in the area. The first phase of the project (at 15 – 20 MW) is likely to create approximately 200 construction jobs over a two-year period and create up to 10 full-time operational jobs – with future phases to be constructed in response to the demand for hydrogen in the region.
Carlton Power’s Langage project, the first of its kind in Devon and Cornwall, will initially feature a 10 MW electrolyser – capable of producing approximately 1200 tpy of hydrogen. At full output, a 10 MW electrolyser produces enough hydrogen to heat 14 000 homes per year. The development could have an ultimate capacity of 30 – 40 MW, with the potential to decarbonise 28 million road miles each year.
The company’s Cumbria project – at Barrow-in-Furness – will supply hydrogen to Kimberly-Clark, the international manufacturer of consumer products including Andrex® , Kleenex®, and Huggies®. Barrow Green Hydrogen will reduce the company’s reliance on natural gas as part of its global decarbonisation strategy. The project will also supply hydrogen to other energy-intensive users in the area. The scheme will initially feature a 35 MW electrolyser to produce approximately 3500 tpy of hydrogen – reducing 25 000 t of greenhouse gas (GHG) emissions, which is equivalent to taking 580 trucks off UK roads every year.
On every one of these projects, Carlton Power are working in partnership with local councils and local economic partnerships to maximise the economic benefits to each area. The company also has ambitions to develop similar projects across the UK over the next decade.
In developing these projects, Carlton Power are playing their part in supporting the transition to net zero and bringing the three main benefits of green hydrogen to the UK.
> Using low carbon electricity: The electrolysis process uses renewable electricity and produces no GHG emissions, providing an alternative to carbon-intensive fuels and helping to achieve the UK’s ambitious net zero targets. The production of green hydrogen will stimulate further investment in renewable energy projects, thereby helping to green the electricity grid.
> Decarbonising industry: Green hydrogen can provide an alternative to natural gas in industrial processes, helping to reduce the UK’s GHG emissions and increasing the country’s energy security. To reduce reliance on natural gas, an alternative energy supply is required and this can sometimes be delivered by electrification. However, many industrial processes require reliable, high-temperature heat to operate. These processes cannot always be decarbonised by electrification without expensive modifications to their equipment and associated prohibitive operational costs. Green hydrogen can be used in most existing equipment with minimal modifications, enabling industrial off-takers to move away from fossil fuels. In the medium term, as hydrogen-powered vehicles become more widely available, green hydrogen will be a transportation fuel for large payload vehicles. It will also be possible to use hydrogen for heating homes and other buildings.
> Providing a more flexible electricity system: Increased electrification of power, heat, and transport will require more renewable energy to be produced. As the amount of electricity produced from renewable sources increases, production will, at times, exceed demand. This mismatch can result in the curtailment of renewable energy. Traditional renewable power supply, such as solar and wind, is intermittent and therefore cannot be relied upon as a sole, continuous source of energy. Green hydrogen enables electricity generated from renewable sources to be stored and distributed when required during such curtailment periods. Electrolysers can be used to balance the grid and provide a demand-side response, which can save energy, reduce the need for fossil fuel power plants, and help integrate renewable energy onto the electricity grid.
With its geography, infrastructure, and expertise, the UK is well placed to become a global leader in clean hydrogen. If the UK government and the private sector work together in partnership, with the active involvement of the devolved administrations, as well as regional and local government, it will be possible to create a hydrogen economy in the UK and secure environmental and economic benefits for the whole country.


Afkenel Schipstra, First Hydrogen, the Netherlands, delves into the value of green hydrogen in the renewable space, and the current and prospective progress of its scalable production in the UK and beyond.
ydrogen is a versatile energy carrier, which can help to tackle critical energy challenges. Hydrogen can be produced from almost any energy resource. However, today’s industrial deployment of hydrogen in oil refining and chemical production predominantly uses hydrogen derived from fossil fuels, which results in significant carbon dioxide (CO2) emissions. Hydrogen production via electrolysis involves splitting water molecules into hydrogen and oxygen with an electrical current. When the electrical energy used in the process is generated from renewable sources, the hydrogen produced is considered green hydrogen and production is a clean and emissions-free process.
Improving the supply of green hydrogen at prices that compete with fossil fuel alternatives requires large scale production. This entails using greater volumes of more easily accessible wind and solar power,
more advanced electrolysis and fuel cell technologies, and importantly, the infrastructure needed to substitute fossil fuels for large quantities of green hydrogen. Large scale hydrogen deployment to heavy industry and across various modes of transport is key to unlocking cost-effective green hydrogen production.

The green price gap has been the challenge facing the sector. However, the Russian invasion of Ukraine and increasing concern for climate change has increased focus on energy security amongst governments. Furthermore, increasing availability of large scale renewable energy and the need to improve air quality in many cities is accelerating green hydrogen investment.
A product of renewables, green hydrogen can help to decarbonise a range of sectors, including chemical manufacturing, mining, and iron and steel production.

Global hydrogen demand was approximately 90 million t of hydrogen (H2) in 2020, having grown 50% since the turn of the millennium. Almost all of this demand comes from refining and industrial uses.1
It also has applications across various forms of transport, a sector responsible for more than 27% of global greenhouse gas (GHG) emissions.2 Hydrogen can help to reduce emissions for sectors such as mobility, where it has proved difficult to
reduce emissions. As a result, this sector is quickly gaining attention when it comes to H2 adoption.
Attempts to reduce vehicle emissions has largely driven the adoption of battery technology and electric vehicles (EVs). First Hydrogen anticipates the continued growth of EVs and a zero-emission future in which both battery and fuel cell electric vehicles play a role in reducing CO2 emissions. As with increased experience of operating battery electric vehicles (BEV), many commercial fleet operators have come to the conclusion that, when it comes to range, refuelling time, and payload capability, BEVs may not be the entire solution to their needs.
Port, terminal, and depot-based modes of transport (including shipping, aviation, rail, and commercial vehicle operations) are particularly suited to hydrogen. This is because of the relative ease and speed of refuelling, and the better range and payload of these heavier forms of transport vs equivalent battery electric solutions.
Producing green hydrogen locally enhances energy security and will also help to improve air quality in many of the largest cities. As one of the very few economically viable options for storing electricity over days, weeks, or months, hydrogen can also help reduce the intermittency of renewables in the electricity grid, improving reliability and reducing the risk of outages.
Following a series of site evaluations, the city of Shawinigan in Canada has been selected as the location for First Hydrogen’s first hydrogen eco-system. Home to one of Canada’s most established institutions for innovative hydrogen research, the Hydrogen Research Institute of the Université du Québec à Trois-Rivières, the city is a front-runner for accelerating the green energy transition through future generations. Shawinigan also has an emerging green economy and is known for its joint energy and industry forces.
First Hydrogen are planning for up to 50 MW green hydrogen production, which will be distributed within the Montreal-Quebec City corridor. The city’s positioning is optimal for the company to access nearby renewable resources and industrial communities that will create demand for green hydrogen. The region also has capacity for First Hydrogen to both assemble and distribute 25 000 of its zero-emission vehicles per year throughout North America.
The Province of Quebec’s economic and energy policies provide a stable environment to allow First Hydrogen to scale its production as the demand for light commercial vehicles and supporting green infrastructure progresses.
Production site location is an important piece of the puzzle and will enable hydrogen fuelled transport to become a reality. There are several factors that are important in selecting a site for green hydrogen production, including:
> Access to renewable energy sources: Positioning sites close to areas that are rich in wind, solar, or hydroelectric power will provide enough cheap and plentiful energy to generate competitively priced green hydrogen.
> Proximity to hydrogen demand centres: Given the relative inefficiency of transporting a gas with such a low atomic weight, production must be located close to hydrogen demand centres and end-users. This will minimise transportation costs and decrease the environmental impact of its distribution.
> Access to existing or future infrastructure: Vicinity to pipelines and transportation networks will optimise the benefits of hydrogen as a motive fuel and mitigate the challenges of distributing it.

> Regulation and incentives: Government direction at a national and regional level is crucial to bring all these factors together. Furthermore, governments can encourage public and private investment to combine and ultimately work together to grow the economy and benefit the environment.
In addition to energy, hydrogen production requires access to water supply. Hydrogen electrolysis has a relatively small ‘water footprint’, using approximately 9 kg H2O/kg H2 produced. Production from natural gas with carbon capture,
utilisation, and storage pushes water use to 13 – 18 kg H2O/kg H2, while coal gasification jumps to 40 – 85 kg H2O/kg H2, depending on water consumption for coal mining.
Seawater could provide a suitable alternative in coastal areas. Reverse osmosis for desalination requires 3 – 4 kWh of electricity per m3 of water, which costs approximately US$00.70 – US$2.50/m3. This only has a minor impact on the total cost of water electrolysis, increasing total hydrogen production costs by just US$00.01 – US$00.02/kg H2. However, the direct use of seawater in electrolysis corrodes equipment quicker and produces chlorine as a by-product. Nonetheless, various research projects are investigating ways to make it easier to use seawater in hydrogen electrolysis in the future.
The recent US Inflation Reduction Act, Canada’s 40% hydrogen tax credit, and EU incentives and policy which target a shift to green hydrogen production and its deployment in European markets, are examples of proactive government policy that are attracting investment. They are also attracting the attention of governments in other jurisdictions who are concerned that resources and expertise will be lost to their markets without similar policy co-ordination and incentive schemes.
For example, First Hydrogen’s hydrogen fuel cell light commercial vehicles (LCV) have the potential to reduce CO2 emissions by 5.7 tpy, or approximately 70 t over the life of each vehicle, and provide a valuable means of decarbonising last mile delivery. To realise this potential in the UK will require a more proactive policy lead and incentives specifically targeted at hydrogen as a source of mobility, to support vehicle refuelling, manufacture, and use, as is the case in Europe.
Efficient production requires access to cheap renewable power and water along with a creative, can-do way of thinking. Therefore, countries such as Great Britain, an island surrounded by sea and buffeted by winds, should be global green hydrogen leaders.
However, there are regulatory factors that make access to low-cost green energy in the UK more difficult than it should be. Government rules determining land use, planning regulations that allow producers to easily establish wind turbines, and the challenge of reconciling the interests of National Grid – who controls the distribution of electricity –with those of hydrogen producers create a complex landscape.
The UK government has yet to provide a truly clear end-to-end regulatory framework to support the development of the green hydrogen industry. Although the funding mechanisms are being developed, they remain a work-in-progress. Instead of developing a centralised plan for adoption, pockets of local development are being sought after instead. Areas such as the Tees Valley, the UK, are positioning themselves as hydrogen hubs or eco-systems and exploring
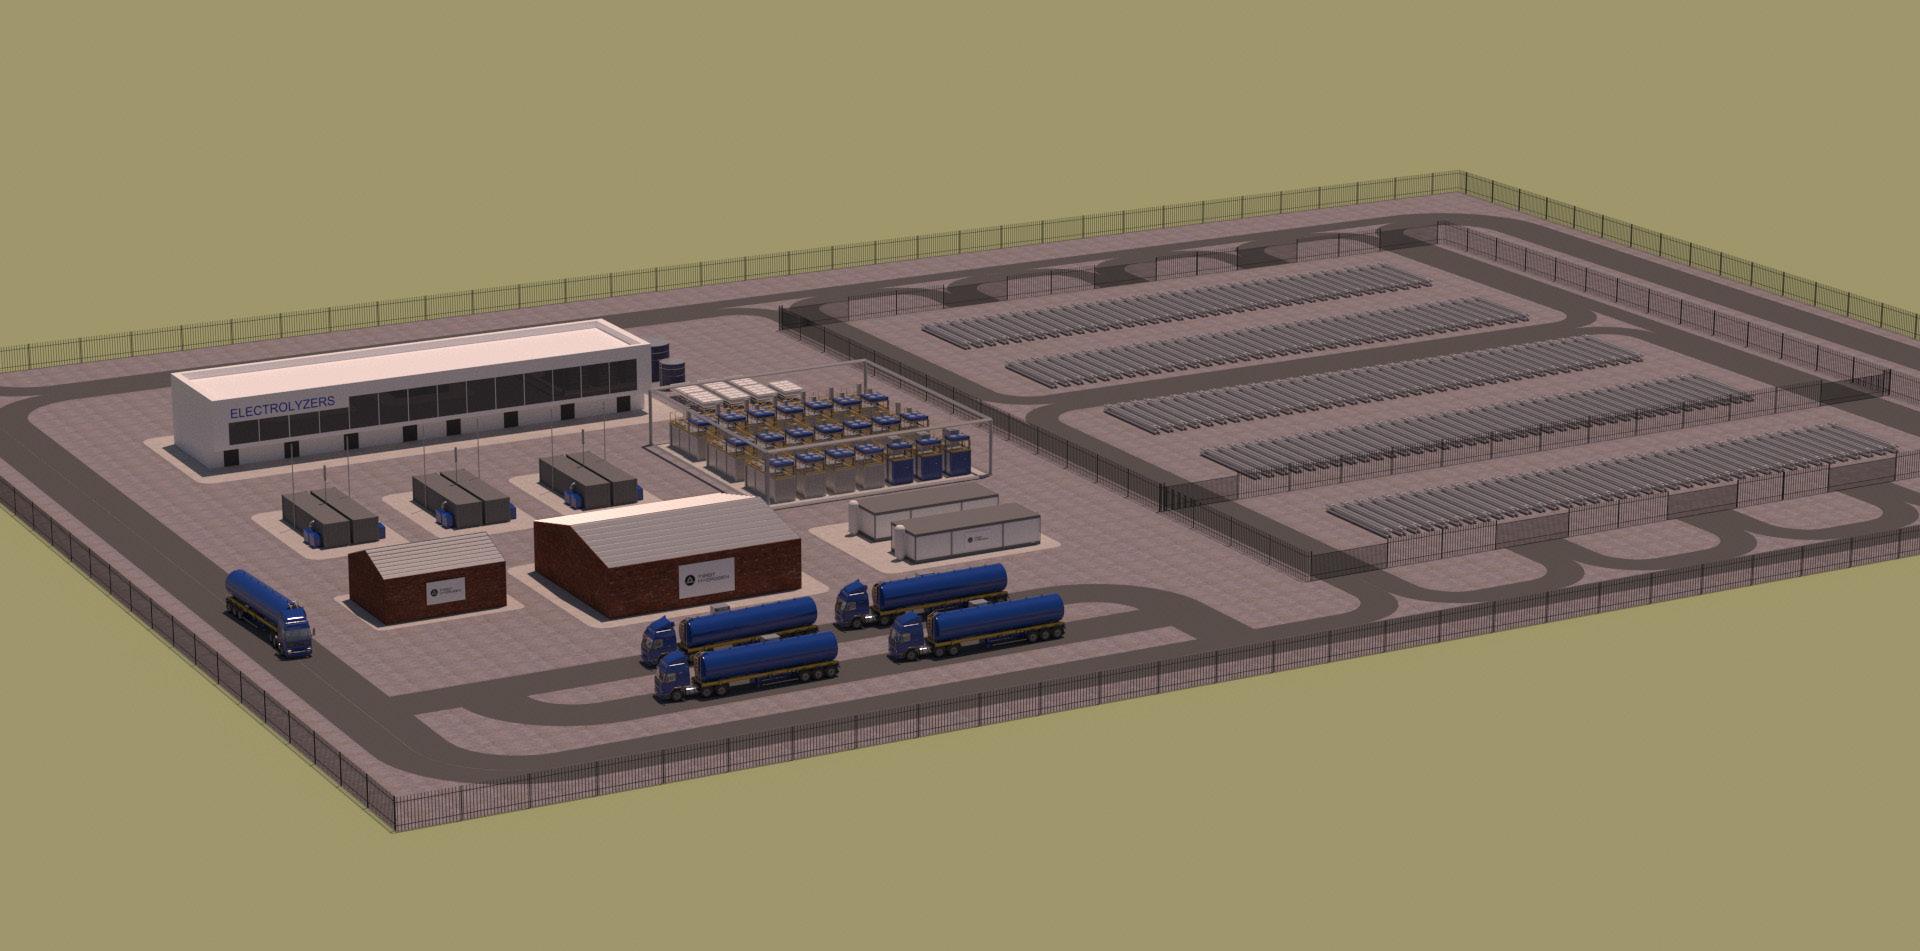
opportunities with local businesses, utilities, and transport providers focusing on service development in their patch. Likewise, HGV-centric vehicle and refuelling infrastructure, local authority zero-emission bus fleet deployment, and ultra-low emission zone roll-out are all happening simultaneously but separately.
Without a greater sense of intention from the government, the evolutionary pace of hydrogen deployment as a source of motive power will not match that of Europe or the US and is likely to take place in a more unplanned cocktail of private initiatives. The net result is likely to be a British combination of chance and innovation. This wastes the opportunity of the country’s location and initial advantage in a technology with the potential to solve long-standing, hard-to-fix emission challenges. As a result, the UK is arguably falling behind mainland Europe and the US when it should be at the forefront of green hydrogen production and deployment.
Green hydrogen’s storage potential and ability to decarbonise major industries, including transport, means renewable suppliers see it as an asset.
There has been both technological and regulatory advances being made in the past year, which will undoubtedly advance the efforts of entrepreneurial companies. With emissions and carbon targets weighing heavy on the mind of government and industry, it is only expected that interest and investment will speed up. The use of green hydrogen for mobility has faced a gap with the level of supply, the demand from the end user, and refuelling infrastructure. However, government ambitions such as the EU’s goal to place hydrogen refuelling stations every 100 km along the continent’s transport corridors and the Canadian government’s co-investment in BEV infrastructure and hydrogen refuelling stations, will drive adoption and therefore green hydrogen production. Expect rapid progress and a much-advanced landscape by the end of the decade.
1. ‘World Energy Outlook 2021’, International Enery Agency, (October 2021), www.iea.org/reports/world-energy-outlook-2021.
2. RITCHIE, H., ROSER, M., and ROSADO, P., ‘CO2 and Greenhouse Gas Emissions’, Our World in Data, (August 2020), https://ourworldindata.org/co2-andgreenhouse-gas-emissions.While the traditional focus markets in Western Europe for new thermal waste treatment plants are approaching saturation point, the situation in Poland is different. In recent years, grate-based waste-to-energy plants have started operating, more are currently under construction. All these facilities important contribution to improving Polish waste management, well as implementing legal requirements for sustainable Thermal waste treatment is an essential component sustainable resource-oriented circular economy greater emphasis on the protection of natural recycling raw materials for as long as possible, the products and waste produced on the be minimised.
Thermal waste treatment not only economy from toxic or non-recyclable recovers the energy contained electricity and heat. Since contained in municipal in most EU countries, climate-damaging saves carbon dioxide by burning fossil for private, In addition, incineration processes, Valuable

treatment years, eight operating, and four will make an management, as sustainable treatment. component of a economy that places natural resources. By possible, the impact of the environment should
only frees the circular non-recyclable materials, but also contained in the waste to generate approximately half of the energy solid waste is of biogenic origin its use reduces dependence on fossil fuels. In addition, the process dioxide emissions that would be produced fossil fuels. The recovered energy can be used industrial, or commercial applications. addition, the bottom ash produced during incineration is increasingly fed into recycling processes, e.g., as road construction material. Valuable metals can also be recovered from the bottom ash. The possibilities of energetic and material recycling make it possible to use fewer primary raw materials and new fuels.
According to the European Waste Hierarchy, thermal waste treatment is the method of choice for the safe and environmentally sound disposal of non-recyclable or contaminated waste. Since 2015, the legal framework for waste management in the EU has been the so-called circular economy package, including an action plan entitled ‘Closing the loop - An EU action plan for the Circular Economy’.1

The circular economy is an essential core component of the ‘European Green Deal’, which was announced by the EU in 2019 and represents the strategy of the community of states to achieve climate neutrality by 2050.
From 2035 onwards, the landfill quota will be set at a maximum of 10% by the adopted targets in the EU waste package, so that this option will no longer be available and thermal waste treatment will become unavoidable.

As a member of the EU, Poland has committed itself to meeting the targets laid down in the EU Waste Pact. In order to implement the thermal waste treatment infrastructure nationwide, the country launched and implemented a whole series of projects in recent years.
In Poland, it can be observed that waste volumes have increased since 2010 from approximately 12.1 million tpy to approximately 13.1 million tpy by 2020. 2,3 Total waste generated is expected to stabilise at approximately 15 million tpy.
Since 2007, the year in which planning for the establishment of a thermal waste management infrastructure in Poland began, eight grate-based plants have gone into operation in the country (as of 2022). These have a total thermal treatment capacity of approximately 1.3 million tpy. Another four plants with a capacity of more than 600 000 tpy are currently under construction. Based on the targets of the EU waste package, however, a disposal gap of more than 2 million tpy is expected by 2034.
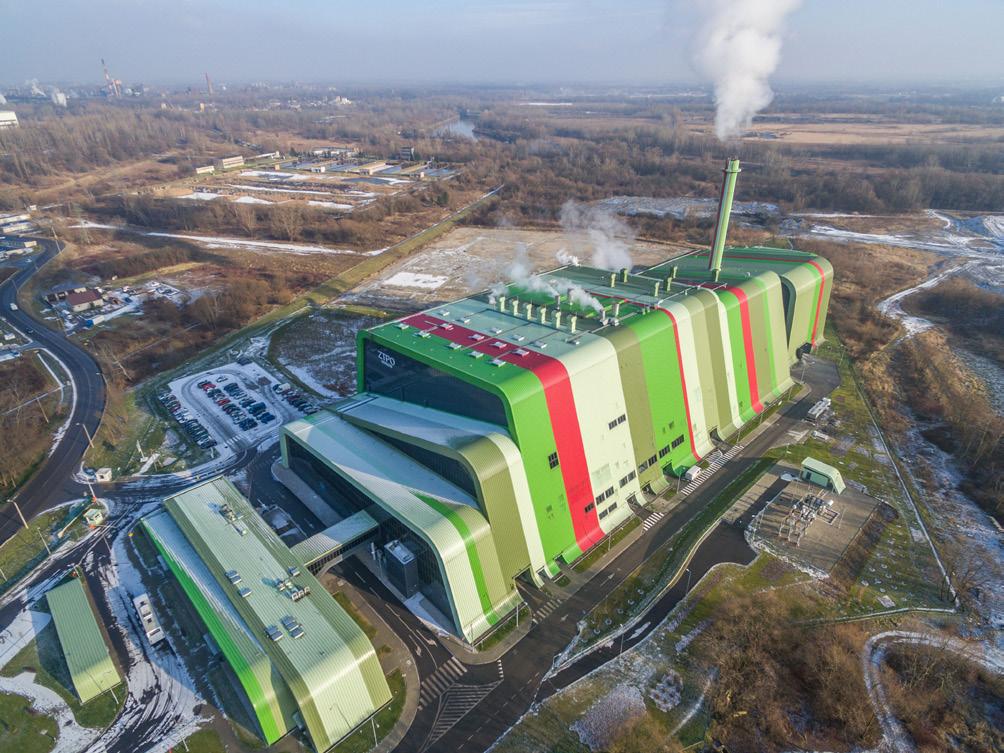
As examples, two of the plants currently under construction – Warsaw and Olsztyn, Poland – as well as the Krakow plant, Poland, which has been in operation for many years, are examined in more detail.
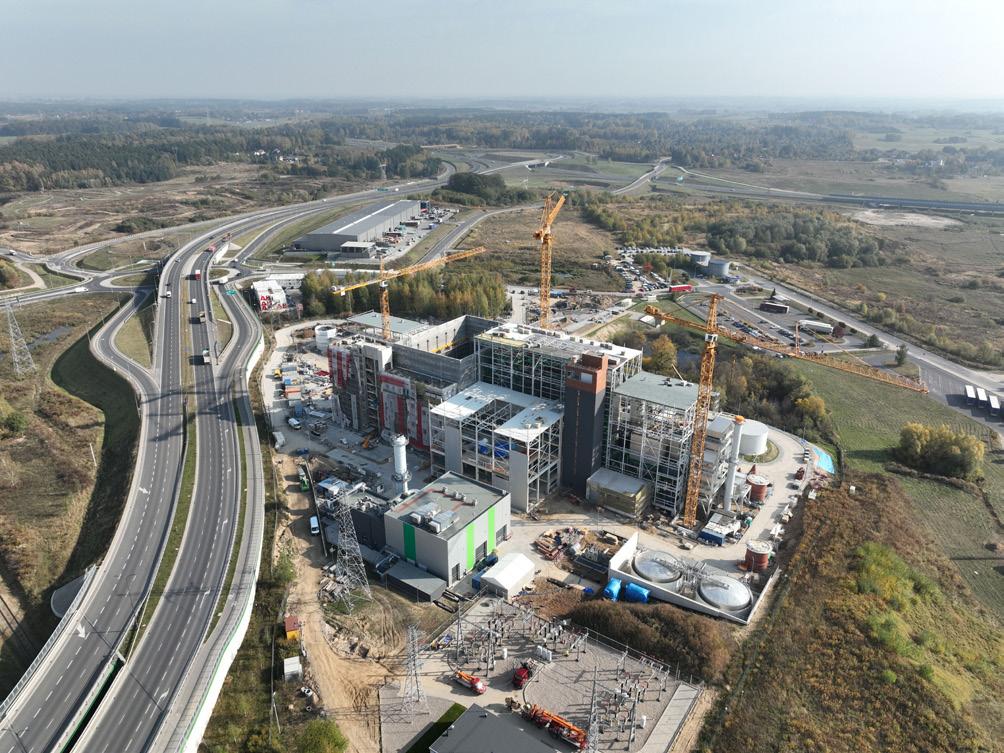 Figure 3 Visualisation of the new waste-to-energy plant in Warsaw, Poland. Source: MPO Sp. z o. o. w m.st. Warszawie.
Figure 2 Construction of the new waste-to-energy plant in Olsztyn, Poland.
Figure 3 Visualisation of the new waste-to-energy plant in Warsaw, Poland. Source: MPO Sp. z o. o. w m.st. Warszawie.
Figure 2 Construction of the new waste-to-energy plant in Olsztyn, Poland.
In October 2012, the contract for the construction of the Krakow plant was signed by both Krakowski Holding Komunalny AG (KHK SA) – a wholly owned subsidiary of the city of Krakow – and the Korean general contractor, Posco E&C. The German technology provider, Doosan Lentjes, was responsible for supplying the combustion grate system, boiler, and selective non-catalytic reduction (SNCR).
The two-line plant is designed for thermally treating 225 600 tpy of municipal waste and pre-treated waste, which corresponds to a large part of the waste produced by the approximately 760 000 inhabitants.
A proven two-stage air-cooled reciprocating grate system was chosen as the combustion system. The two five-pass boilers generate approximately 80 tph of steam, which is converted into both electricity and district heat in the downstream water-steam-cycle. An SNCR process is used to reduce nitrogen oxides.
Due to its high availability and performance, the current largest waste-to-energy plant has taken on a role model function for the planning of future plants in Poland.
The Olsztyn project in north-eastern Poland was developed by Miejskie Prze-dsiebiorstwo Energetyki Cieplnej Spółka z o.o. w Olsztynie (MPEC). MPEC is a municipal company owned by the city of Olsztyn. The public-private partnership (PPP) contract for the implementation of the project was finally signed with the project company Dobra Energia dla Olsztyn in November 2019.
The PPP contract is structured as an operator model with a term of 25 years following a construction period of 36 months from financial closing. The legally valid building permit was granted in 2018, while the financing process was completed in August 2020.
Once completed, the single-line plant will thermally process 110 000 tpy of refuse-derived fuel from the greater Olsztyn area.
The new plant will meet approximately 30% of the district heating demand in the region and help to compensate for the heat loss associated with the closure of the local coal-fired Michelin power plant. This will ensure a continuously reliable and safe district heating supply for the population.
Doosan Lentjes, in a consortium with Korea’s Doosan Enerbility, is the general contractor for the construction of the plant and is responsible for the design, supply, installation, and commissioning of the entire electromechanical equipment of the project.
The turnkey plant will be delivered including civil works and two gas/oil fired peak load boilers for additional district heating supply. The capacity of the incineration line, which is based on the proven water-cooled reciprocating grate system, is 48 MWth. The generated
steam produces electrical energy by means of a turbine and corresponding heat in a district heating station. By using the proven dry Circoclean® flue gas cleaning technology, including a downstream selective catalytic reduction (SCR), the plant will fully comply with the emission limits according to the revised EU best available techniques reference (BREF) documents.
Warsaw waste-to-energy plant – largest of its kind in Poland
In 2021, the contract for an extensive project in the Polish capital, Warsaw, was signed. The investor is the waste disposal company, Miejskie Przedsiebiorstwo Oczyszczania w m.st. Warszawie Sp. Z o.o. (MPO), which belongs to the city of Warsaw, and which awarded the general contractor contract to the Korean POSCO E&C. The project, called ‘Expansion and modernisation of the municipal solid waste disposal plant’, includes the construction of:
> Two thermal waste treatment lines for municipal waste.
> A bottom ash processing facility with recovery of ferrous and non-ferrous metals.
> A modern automated waste sorting plant.
Doosan Lentjes was contracted to supply the two incineration process lines, including grate and boiler systems, as well as the SNCR process to reduce nitrogen oxides. Designed for waste with a calorific value of 10 MJ/kg, the throughput of each line is approximately 17 tph, resulting in a capacity of approximately 265 000 tpy. As in the Krakow waste-to-energy plant, the tried and tested air-cooled two-stage reciprocating grate was selected as the incineration system. Steam is generated in the downstream five-pass boilers, which is converted into both electricity and district heat in the subsequent steam cycle.
The project will be implemented according to the applicable European BREF standards. Once completed, which is planned for 2024 after a construction period of 36 months, the plant will be the largest of its kind in Poland.
The plants already in operation and those currently under construction are elementary in order to implement the requirements for legally secure treatment of non-recyclable or contaminated waste, considering applicable EU regulations in Poland. However, the goal of further efforts in the country must be to cover the still open capacity demand for thermal waste treatment by 2034 and thus to comply with the EU waste package’s landfill target of a maximum of 10%.
1. “Closing the loop - An EU Action Plan for the Circular Economy”, European Commission: Communication from the Commission to the European Parliament, the Council, the European Economic and Social Committee and the Committee of the Regions, Brussels, COM(2015), 614 final, (2 December 2015).
2. ‘Ochrona srodowiska Environment 2013’, Główny Urzad Statystyczny Central Statistical Office, Warszawa, (2013).
3. ‘Ochrona srodowiska 2021’, Główny Urzad Statystyczny, Warszawa, (30 November 2021).
Mariane Ferencevic, Director of Business Operations, Fitec Environmental Technologies, Canada, identifies how biogas can be utilised, specifically in North America, to help in the renewable energy transition.
The pollution of soil, air, and water are some of the biggest concerns facing the planet today. The large amount of waste the world produces and the ill-considered disposal of that waste affects all environmental and human systems, from food production to climate change. But there is a technology that can address a number of these problems. Separating organic wastes and allowing them to decompose in a closed vessel will enable the greenhouse gases (GHG) they produce to be captured, the creation of renewable energy from that gas, and organic matter to be returned to the land. If organic matter decomposes in an anaerobic environment, it releases something called ‘biogas’. This biogas is composed of 60% biomethane. By using a variety
of methods, biogas can be separated from other gases to make renewable natural gas fit for the natural gas pipeline or use in natural gas-powered vehicles. Alternatively, the gas can be passed through a combined heat and power generator (CHP) to make electricity. Harnessing renewable energy in this way has the potential to innovate energy production in North America, making it more sustainable and efficient across industries.
Though there are many existing issues relating to environmental protection, the biogas industry has the potential to address three major aspects: reducing waste,


GHG capture, and reducing chemical fertilizer use/returning nutrients to the land.
Europeans and North Americans produce between 95 – 115 kg/y of food waste per person.1 The quantity of food waste on the planet is a definite cause for concern,
and solutions are especially needed to prevent waste. But even if people and industries become much more efficient, there will always be some waste (e.g., processed food by-products, food that becomes contaminated, agricultural waste, etc). Using that waste in an anaerobic digester is one way to ensure to make use of that potential and create clean and renewable energy from it.
When food waste decomposes in open landfills or compost facilities, the biogas that is produced is released into the atmosphere and affects the health of the ozone layer. In certain regions, landfills are required to capture this gas. However, due to the large quantity of other volatile organics in this gas, separating the methane is much more expensive than capturing it in an anaerobic digester. And when food decomposes in a landfill, the organic matter is mixed in with other wastes and cannot be returned to the soil.
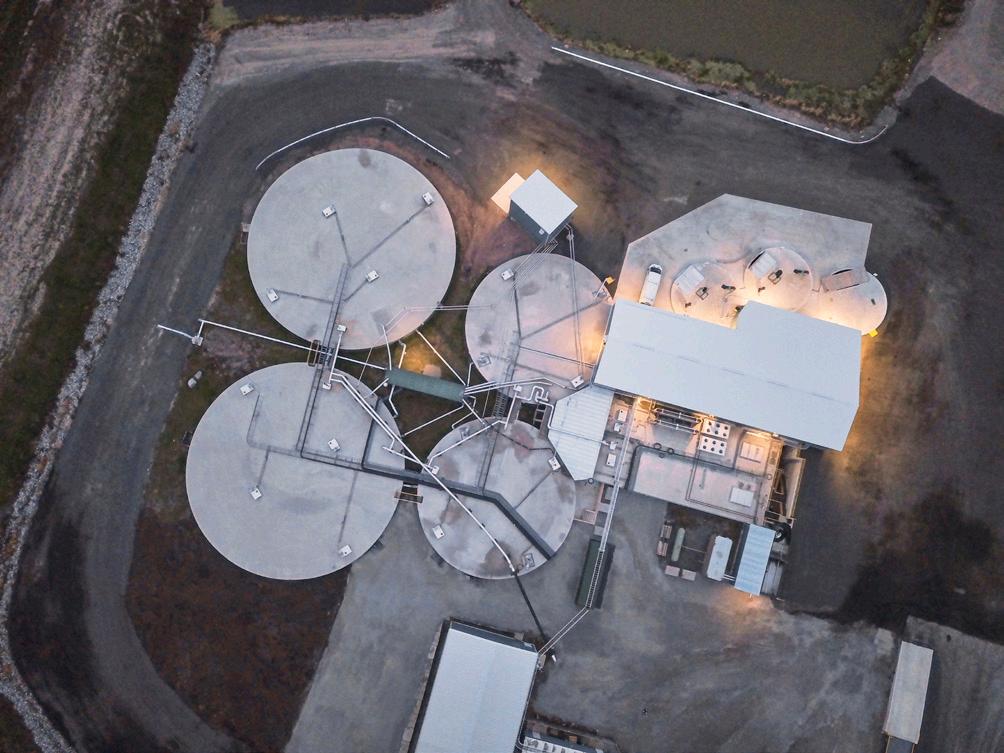
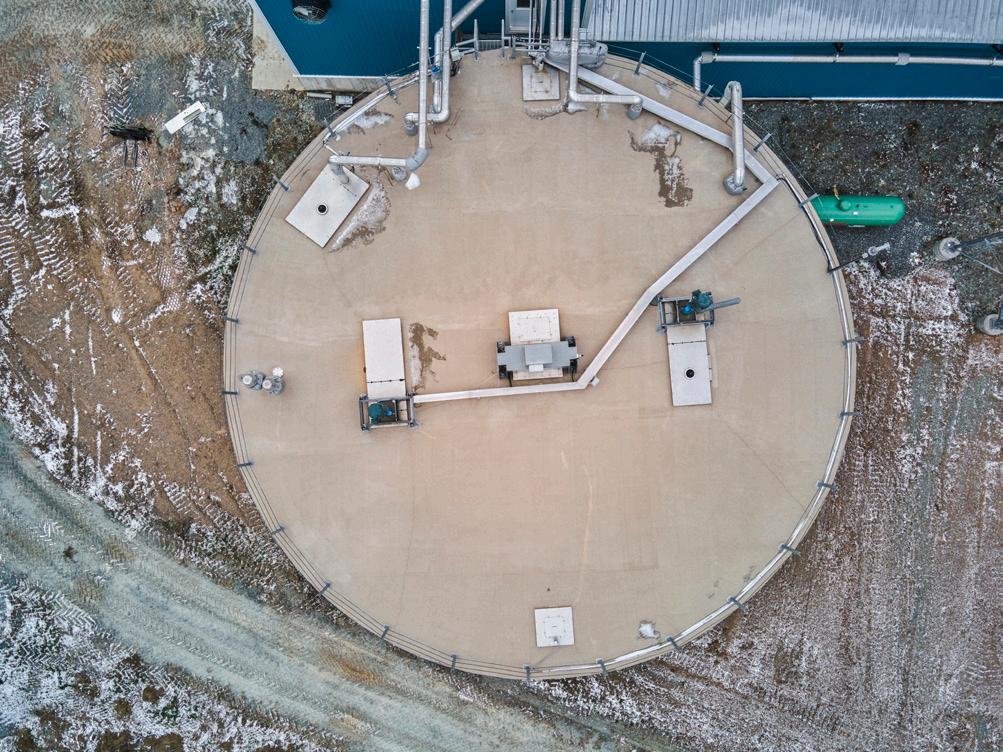
Anaerobic digesters are an excellent way to handle food waste since they can clean the waste, trap methane, and return the organic matter to the soil after digestion. 2 Digestate is what organic waste is called after it has passed through an anaerobic digester. Though the anaerobic bacteria has extracted some nutrients to produce methane, there is still enough organic matter left to be beneficial to the soil. This digestate can be either land applied or used in fertilizer manufacturing.
Courtney Blois, Agrologist and family member of Courthouse Hill Farm in Nova Scotia which uses a Fitec Self-Cleaning Digester System, 3 says that since beginning to apply digestate on their land, they have been able to decrease their recommended amounts of chemical fertilizer by 20%. They are able to apply the digestate after a cut without any other fertilizers and still come out with a lusher, deeper green crop than if they had applied chemical fertilizer. Land-applying digestate is important in order to return nutrients to the soil. Effectively closing this loop helps to make the economy more resilient.
Biogas has been well-established in Europe for over 20 years, with Germany, Austria, France, Sweden, and Denmark leading the charge. Both the high population density and a cultural propensity for avoiding waste makes Europe an ideal market. Paired with their commitment to fighting climate change, this has led to the establishment of over 10 000 biogas plants across the EU. 3
With this market approaching saturation, biogas systems and equipment providers have been trying to establish a presence in other countries around the globe. Adoption in North America has been slow, largely due to a lack of interest at the federal government level. Climate change is a contested problem in the political sphere at this time. 4 And as a result, government funding only indirectly supports the adoption of clean technology and is at risk of being retracted with leadership changes.
Certain industries are better positioned to gain immediate benefits from biogas. For example, waste management companies are in a unique
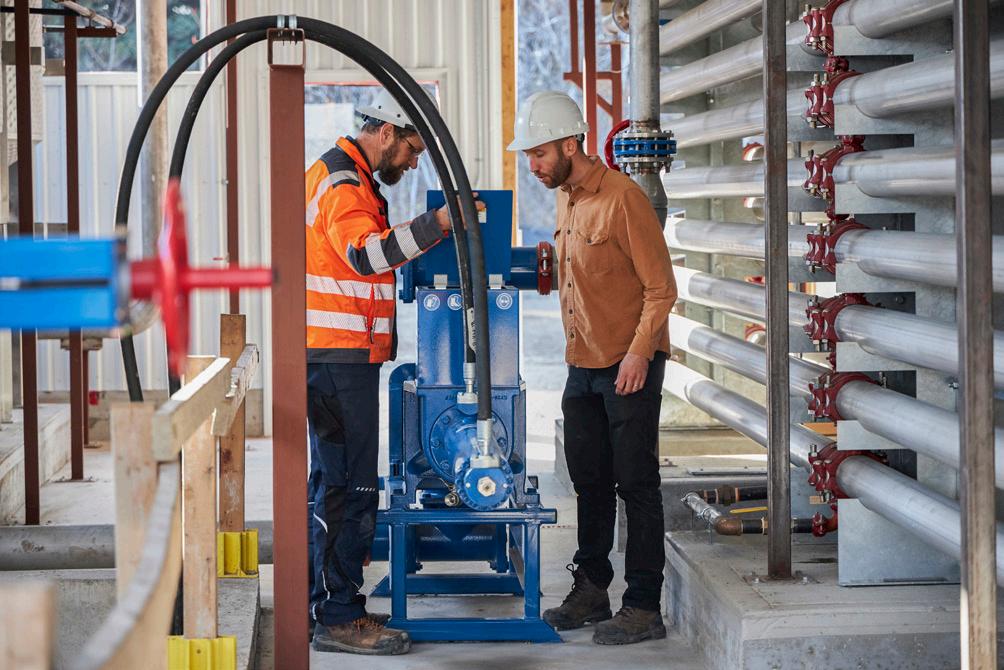 Figure 1 CEO and Environmental Scientist, Tom Ferencevic, working on depackaging and separation with the BioSqueeze200.
Figure 2 . Courthouse Hill plant at Fitec.
Figure 1 CEO and Environmental Scientist, Tom Ferencevic, working on depackaging and separation with the BioSqueeze200.
Figure 2 . Courthouse Hill plant at Fitec.
position to extract more profit from the waste they are already collecting. In addition, depending on the local government, it is often easier for farms to get permits for biogas installations than it is for other sites. This allows farmers to manage their own waste products better while diversifying their income through accepting additional organic waste and producing energy. And in the case of greenhouse operations, a biogas plant reduces operating costs by making use of the heat that is a by-product of the electricity conversion process.
To have a sustainable economy, different industries must learn to work together to benefit from everyone’s strengths. If the packaging industry does one thing over here, and the composting industry is doing something else over there, and the municipalities or other governing bodies go in a completely different direction, the industry is going to be unable to make progress. Biogas projects require many different industries to work together. Consumers, producers, waste haulers, municipalities, and energy utilities all have a part to play in the success of an operation. Hopefully, as the number of successful projects increases, the amount of communication and co-operation between groups will increase too.
Many projects are built based on ephemeral political incentives. As government leadership changes and the focus shifts, the tax credits or energy rates promised to project owners can disappear. Thankfully, quality-built biogas projects are flexible enough to weather these storms. These systems can be adapted to take a variety of feedstocks, depending on what is perceived to be a greater societal problem at any given time. The fuel produced by a biogas operation can be used right away or stored as renewable natural gas or electricity. This built-in resilience is a very good reason why the number of biogas projects will soar in North America in the coming years.
The other aspect to consider is plant design. The simplest digesters consist of very basic heating and mixing systems. Over time, there is a build-up of non-digestible contaminants inside the tanks. No matter the source of the feedstock, there is always a substantial quantity of sand and grit that must be accounted for. Some plant designs use oversized tanks to delay the problem of reduced digestion capacity. Alternatively, technologies, such as the Fitec Self-Cleaning Digester system, have built-in automated contaminant removal. This system reduces required tank size costs, eliminates downtime due to cleanouts, and increases returns by maximising energy production over the facility’s lifetime.
Though incentives in the US are already in place, it takes time to design a facility. The number of on-site facilities will not start to increase for a few years. 10 years from now,
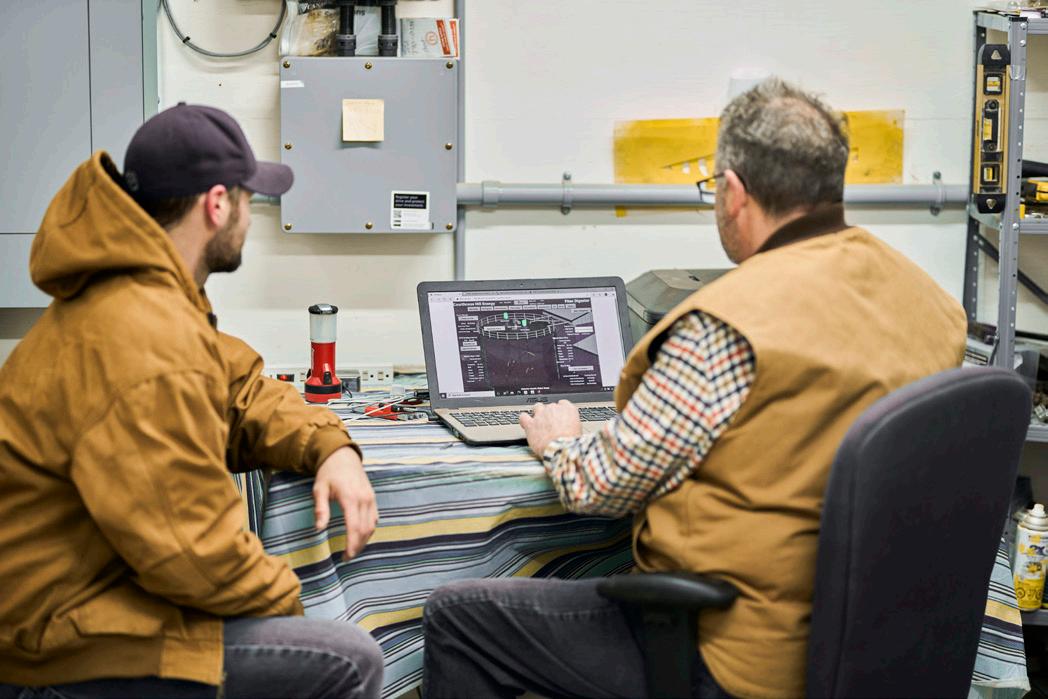
the renewable energy landscape should be significantly different. The actual usage of that energy, whether it be in the form of electricity in the grid, natural gas in the pipeline, or automobiles powered by natural gas, will be reliant on political circumstances at the moment. However, the shift to a clean energy source should have visible effects at that point, including the number of choices in energy sources available to consumers, a decrease in fossil fuel industry activities, and active pollution reduction initiatives. Ultimately, the prospective market for biogas in North America is truly enormous. It can potentially change the face of biogas and environmental technologies over the next few years with the continued collaboration of different industry and governmental partners.
1. ROBINSON, D., ’25 Shocking Facts About Food Waste’, Earth.org (2 December 2022), https://earth.org/facts-about-food-waste/
2. ‘How Does Anaerobic Digestion Work?’, United Stated Environmental Protection Agency, www.epa.gov/agstar/how-does-anaerobic-digestion-work
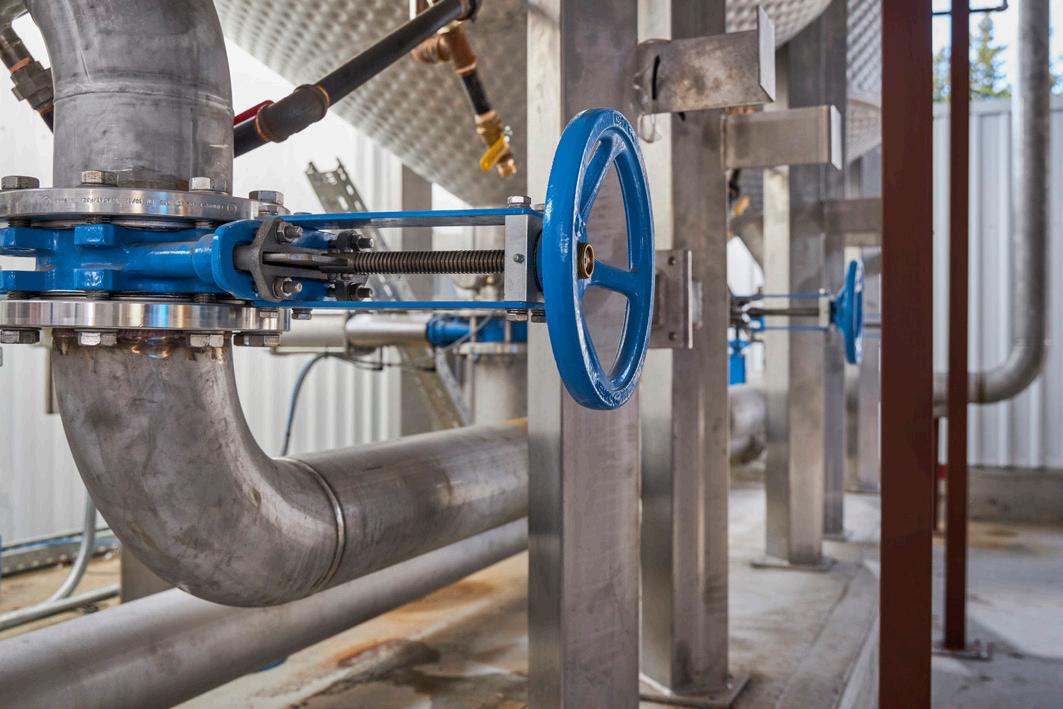
3. ‘Biogas simply the best’, European Biogas Association www.europeanbiogas.eu/biogas-simply-the-best/
4. KAMARCK, E., ‘The challenging politics of climate change’, Brookings, (23 September 2019), www.brookings.edu/research/the-challenging-politicsof-climate-change/
Figure 4 . The pasteurising system at the Zooshare plant at Fitec.The world is changing, but one thing remains the same — as fast as organisations adopt new technology to facilitate new ways of working, threat actors are waiting in the wings to take advantage.

2022 saw a number of successful cyberattacks targeted at the renewable energy industry. For example, in Germany, three wind-energy firms –Deutsche Windtechnik AG, Nordex SE, and Enercon GmbH – saw their operations disrupted by cyberattacks and, in the case of Nordex, forced it to shut down its information technology systems. The supply chain that underpins the move to greener fuels also widens the attack surface. For example, Radiocommunications Agency Netherlands reported that a hacker had gained access to its PV systems via a monitoring tool from China’s Solarman, which raised concerns that attacks on PV inverters could pose a risk to the electricity grid.
These are just a few examples where threat actors have breached secured defences to cause serious incidents that resulted in disruption to services and impacted citizens’ lives. They are not isolated incidents, and the threat is expected to continue to escalate. In fact, World Economic Forum 2023 Global Risks Report ranks “widespread cybercrime and cyber insecurity” in its top 10 of the most severe risks over the next decade.1
Attack paths will continue to evolve as technology develops, and similarly the types of attacks utilised to breach infrastructure and the systems they power will morph. Doing nothing about security is not an option.
The infrastructure that underpins organisations today is only vaguely recognisable from three years ago; cloud adoption has soared to facilitate ‘work from home’ mandates. But it is not just office workflows or data processing that have been overhauled. The same connectivity that underpins this modernisation has also revolutionised the operational side of the house as engineering and manufacturing applications have been moved to the cloud.
Physical devices and systems of all types – from corporate conference systems to power grids – are now network connected and programmable. New digital computer platforms and development shifts, such as cloud, mobile, Software-as-a-Service, and DevOps, have made it possible to move from concept to capability on a daily basis.
This has required the convergence of two systems that were traditionally siloed from each other. On the one side are IT systems – which utilise servers, routers, PCs, and switches. On the other is operational technology (OT) – encompassing programmable logic controllers (PLCs), distributed control systems (DCSs), and human machine interfaces (HMIs) to run physical plants and factories. While OT environments previously had very limited and/or restricted connectivity (both internally with local networks, and externally to the internet, third party contractors, etc. or ‘air-gapped’), the introduction of smart technology means that internet-facing assets are not just commonplace, but essential for organisations in the modern business world,
Bernard Montel, EMEA Technical Director and Security Strategist, Tenable, France, looks at cybersecurity in the renewable energy industry, and explores how cybersecurity will be an increasingly important factor as the renewable sector grows and the world goes green.

encompassing both IT and OT. The result is that the defined perimeter no longer exists.
When thinking of traditional network security, the goal has always been to fortify the perimeter to prevent threats outside of the network from getting in.
Typically, when the subject of OT security was discussed, it was as quickly dismissed due to the perceived air-gap. The way of working today means this is no longer feasible.
The perimeter is pervious, the devices being used are evolving, and organisations are adopting hybrid infrastructure combined of on-prem with private and public cloud.
However, the merging of these two previously separated environments increases organisational risk by expanding the available attack vectors, while making cybersecurity threats harder to detect, investigate, and remediate. In addition to the threat to data, an attack against OT systems could have physical consequences on the business infrastructure, as well as causing bodily harm.
A further complication is that cyber breaches that start on one side of the converged infrastructure can laterally creep to the other — from IT to OT and vice versa.

One of the most prevalent issues, particularly to the operational technology side of the house, is the zero downtime tolerance policy, given the business criticality of the systems. Another key challenge to overcome is legacy infrastructures. OT environments are often structured around legacy technologies designed for process functionality and safety, along with static devices and a perimeter protective layer. As modern practices increasingly connect machines, devices, sensors, thermostats, and so on to the internet, this is no longer realistic – and the number of touch points that are open to vulnerabilities continues to grow by the day.
It is also important to recognise the significant difference in IT and OT life cycles. While IT infrastructure is designed to be updated regularly, OT infrastructure often persists for years, even decades. It is not uncommon for an OT infrastructure
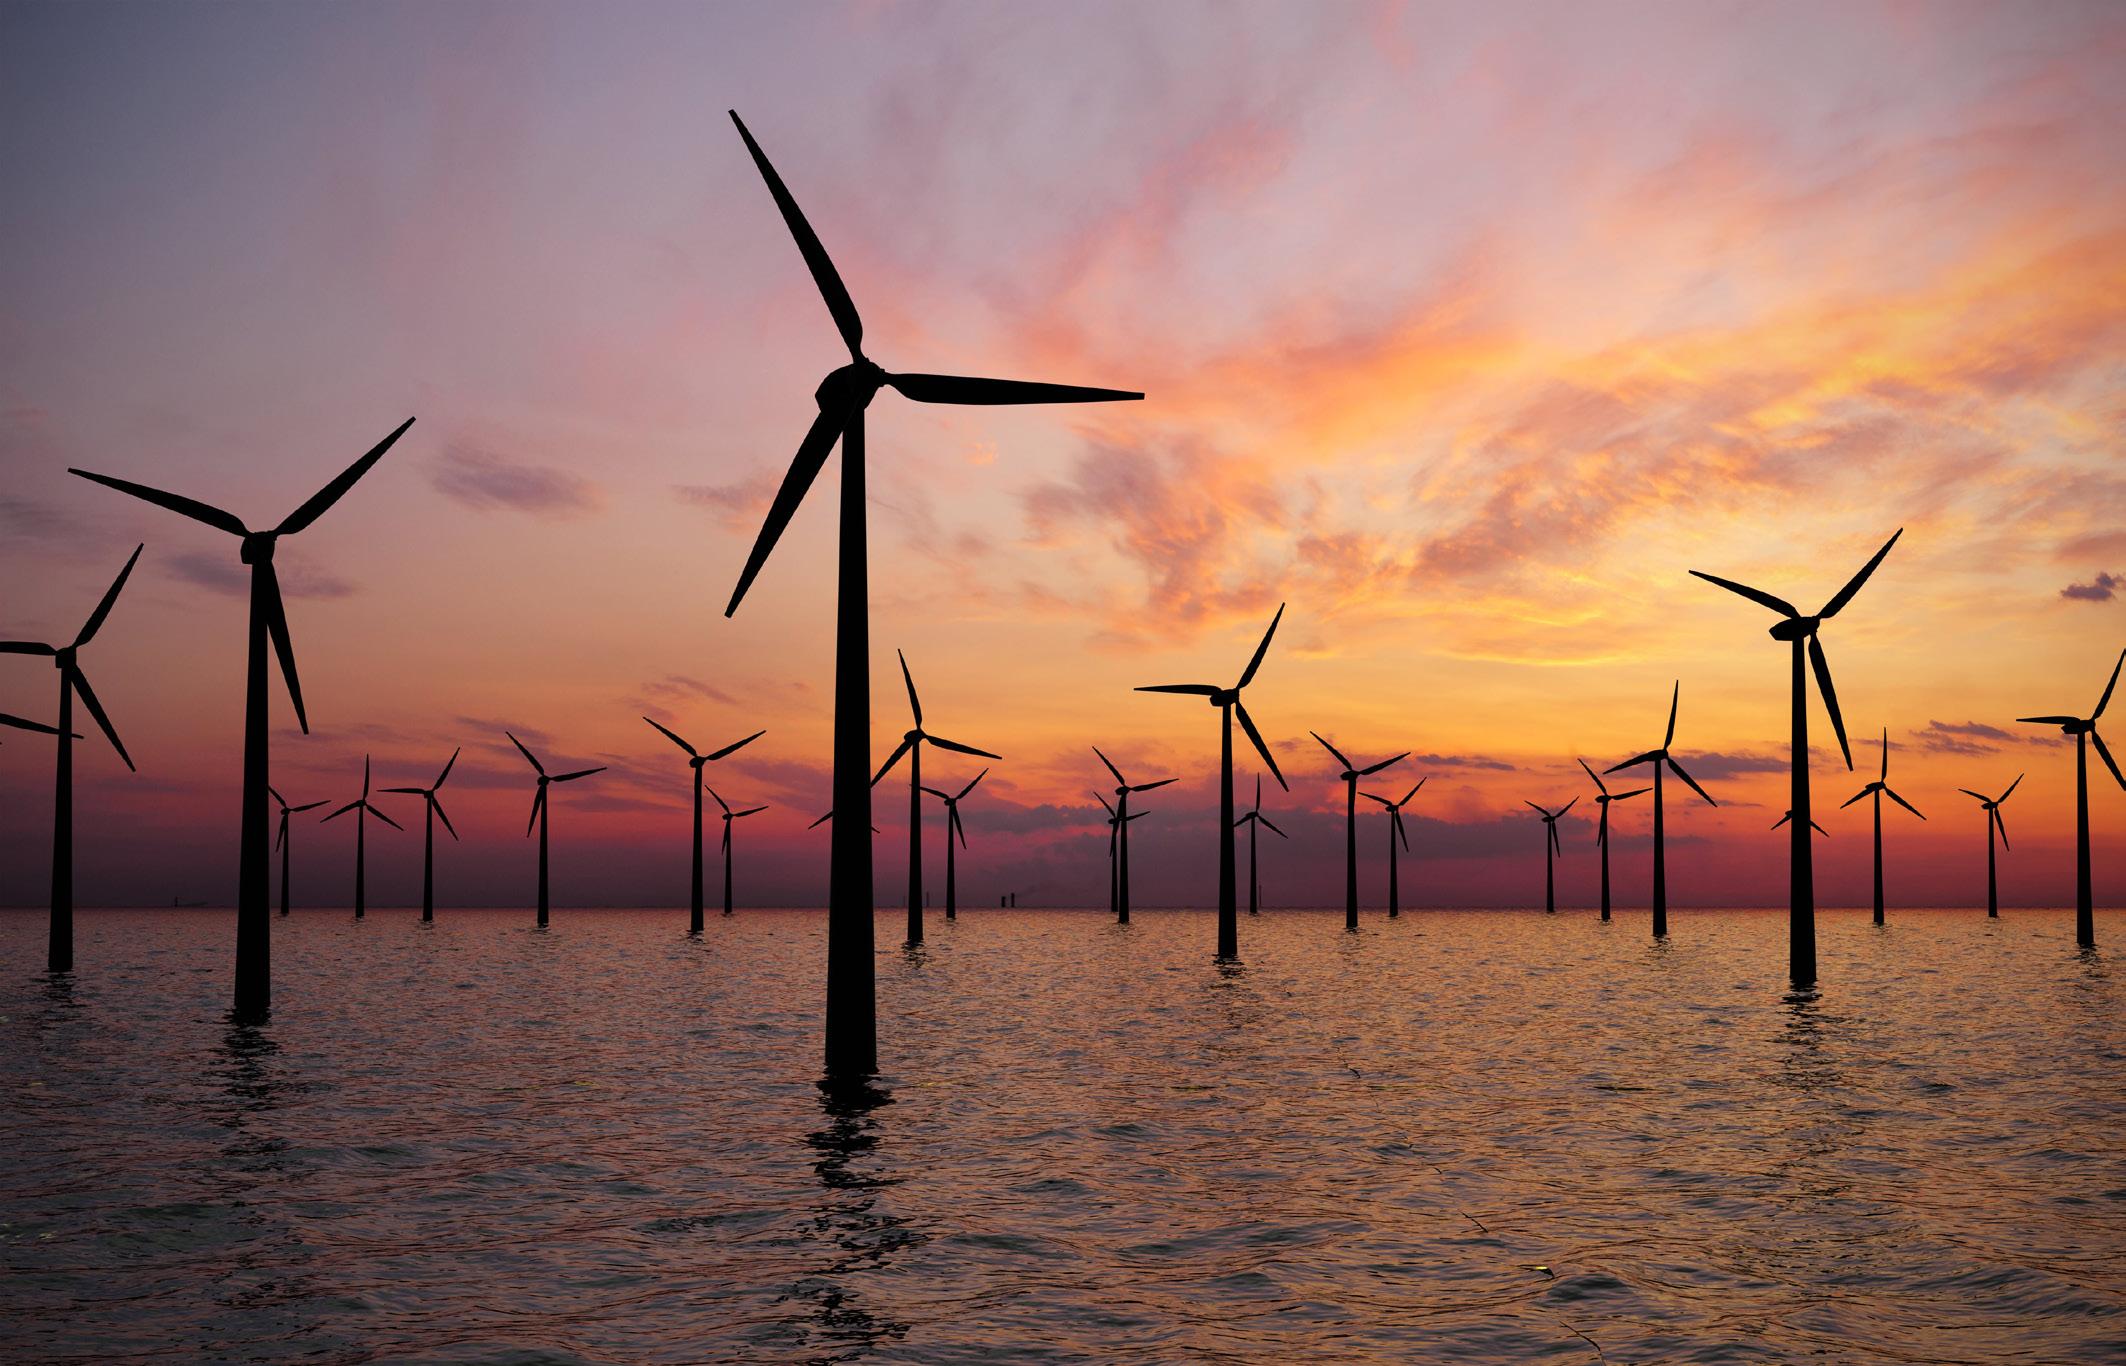 Figure 1 . It only takes the right combination of vulnerabilities for an organisation’s system to be probed.
to be as old as the plant it sits within. The result is that a full inventory of assets along with maintenance and change management records may not be current. Therefore, crucial data may be missing, including important details, such as: model number, location, firmware version, patch level, backplane detail, and more. Since it is impossible to secure assets that one may not even know exist, having a detailed inventory of OT infrastructure that can be automatically updated as conditions change is essential to protecting industrial operations.
When it comes to attacks, the damage can be substantial. For example, ransomware attacks no longer just encrypt data; information is stolen, and sometimes even wiped. The integrity of data can be affected or an industrial production chain tampered with – such as chemical dosage, temperature, or units in a manufacturing process changed, not to mention the impact of damage to the tool itself. In IT, an outage causing a system to reboot or require re-installation of a set of devices or software will take time, but in an OT environment the result could see permanent damage to the affected tool or systems with catastrophic impact.
In the last 12 months, there has been a dramatic rise in ransomware attacks, nation state-sponsored threats, and zero-day vulnerabilities weaponised as already highlighted. It is understandable that security teams have felt under siege and under-resourced to fight back, questioning how to revolutionise their working practices and balanced against improvements to their security posture, all with dwindling budgets. While the task might seem insurmountable, the reality is that basic cyber hygiene can dramatically reduce an organisation’s cyber exposure.
For attack actors, they do not face the same economic pressures at the moment and, in fact, are investing significant money and resources to develop their attack methods and malware development. Today, as defenders, people are playing right into their hands by either spending less on defences or delaying addressing the issue.
When threat actors evaluate a company’s attack surface, they are not thinking in terms of organisational silos. They are probing for the right combination of vulnerabilities, misconfigurations, and identity privileges. Historically the security industry has squarely focused on creating point solutions that focus on very specific aspects of cybersecurity. The result? A hodgepodge of technologies that all serve a bespoke function but do not allow organisations to see the full scope of their risk exposure and lack context to chart a path forward.
To try to address this, the industry has created products that focus on detection and response to active attacks, instead of strengthening defences to prevent successful incursions in the first instance. This leaves security teams trapped in an endless cycle of responding to active breach notifications and the organisation without a complete picture of their security posture and unable to proactively quantify risk. Organisations need a way to assess the efficacy of their
preventive programs in order to have a complete picture of their exposure.
Understanding the impact of cyber incidents requires business and security leaders to work in conjunction with each other. Business leaders need to ensure security understands the larger mission of the organisation and takes proactive steps to safeguard the tools and assets that enable staff to complete business critical activity, while also ensuring important data is safe-guarded.
This requires a holistic view of cloud and on-premise, IT and OT environments, and everything in between including the interdependencies that exist for critical functionality, to determine where weaknesses and vulnerabilities exist.
Once a holistic viewpoint is established, the next step is to identify what would cause theoretical versus practical damage. There is a myriad of hidden OT systems, tucked away in a closet or hidden under a desk, that were temporarily installed, promptly forgotten, and left underprotected. From this stance, steps can be taken to remediate the risks where possible, or monitor the assets related to the risk for deviations to attacks.
Traditional vulnerability management focuses on the act of enumerating flaws in software that could be exploited. Exposure management extends beyond this by providing additional context, including who is using the system, what they have access to, how it is configured, etc. There is more to proactively securing an environment than patching software. Exposure management enables cybersecurity teams to operationalise their preventive security programs, which in turn also allows organisations to clearly explain the effectiveness of their security program.
Benjamin Franklin is credited as saying ‘an ounce of prevention is worth a pound of cure’ and this would certainly hold true with cyber attacks. Protecting everything can be soul destroying given it is practically an impossible task. Instead, organisations need to reduce effort by focusing on what matters most.
The harsh truth is that the vast majority of attacks are preventable. Threat actors rely on leveraging unpatched, legacy vulnerabilities across a wide spectrum of software solutions to infiltrate organisations. They look for misconfigurations that can be abused to dig deeper into the environment or cause a program to function differently to intended. And they look for excessive or misconfigured identity privileges that allow them to take control of the environment and move around unchallenged.
Doing nothing is not an option. It is imperative that organisations step up and stop criminals from infiltrating their infrastructure. Organisations that can anticipate cyber attacks and communicate those risks for decision support will be the ones best positioned to defend against emerging threats.
1. ‘The Global Risks Report 2023’, World Economic Forum, 18th edn., (January 2023), https://www3.weforum.org/docs/WEF_Global_Risks_Report_2023.pdf
2. ‘Statistics: Countries’, The Wind Power: Wind Energy Market Intelligence, www.thewindpower.net/statistics_countries_en.php
AFRY provides lender’s technical advisory services for a flagship large scale wind farm in Laos that will provide renewable energy to Vietnam.
The Monsoon wind power project is a 600 MW onshore wind farm that will be located in the Sekong and Attapeu provinces in Southern Laos and is expected to export renewable energy to neighbouring Vietnam. With its 133 wind turbines, it will become the largest wind farm in Southeast Asia and the first ever wind energy project in Laos.
The wind farm is owned by Monsoon Wind Power Company Limited (Monsoon) and sponsored by a group of developers led by Impact Electrons Siam Company Limited.
The Monsoon project is financed by loans from a pool of financial institutions composed of some of the most renowned international banks, funds, and financial agencies in the Asian region, together with the Asian Development Bank as mandated lead arranger and bookrunner.
The Asian Development Bank earlier awarded AFRY as their lender’s technical advisor for the technical due diligence phase on the Monsoon wind farm. AFRY is now set to continue with the same role during the project construction and operation phases.

AFRY has a proven track record of supporting lenders in Asia for over 45 GW of thermal, hydro, wind, and solar power assets, making AFRY one of the leading advisors in the region for technical and environmental advisory services.

X1 Wind has announced that its X30 floating wind prototype, installed in the Canary Islands, has successfully produced its first kWh.
The milestone marks the world’s only floating wind platform currently installed with a TLP mooring system, which dramatically reduces the environmental footprint and improves compatibility with other sea uses. It further heralds Spain’s first floating wind prototype to export electricity via a subsea cable.
‘First power’ was fed into PLOCAN’s offshore platform smartgrid via a 1.4 km underwater cable. Local teams will now enter the last phase of a rigorous test and verification programme which started with the platform installation in November 2022, in preparation of technology scale up and certification for commercial scale projects currently under development.
The novel X30 platform is equipped with a specially adapted V29 Vestas turbine and ABB power converter. Another key design feature, developed through the EU-backed PivotBuoy Project, combines advantages of SPM and TLP mooring systems. The proprietary SPM design enables the floater to ‘weathervane’ passively and maximise energy yields, with an electrical swivel ensuring electricity transfer without cable twisting. The TLP mooring system also dramatically reduces the seabed footprint, compared to traditional designs proposing catenary mooring lines, minimising environmental impact while maximising compatibility with other sea uses, in addition to its suitability to move into deeper waters.
Siemens Gamesa’s RecyclableBlades have been selected by RWE for 44 SG 14-222 DD offshore wind turbines to be installed at the Sofia offshore wind power project off the east coast of the UK.
In 2022, RWE became the first commercial, large scale offshore developer to install Siemens Gamesa’s fully RecyclableBlade, with a number of blades being utilised in the Kaskasi offshore wind power project. The Sofia
project will utilise RecyclableBlades measuring 108 m long, representing the first deployment of this variant. The Kaskasi project utilises 81 m long RecyclableBlades on the selected SG 8.0-167 DD offshore wind turbines.
Utilising Siemens Gamesa’s RecyclableBlade technology enables the full reclamation of the blade’s components at the end of the product’s lifespan: the resin, fiberglass, and wood, among others, are separated using a mild acid solution.
First Solar, Inc. has announced that Lightsource bp has placed an order for 4 GWdc of advanced thin film solar modules. The modules, scheduled to be delivered between 2026 and 2028, are expected to power Lightsource bp projects in the US. This latest deal follows a prior order by Lightsource bp for up to 4.3 GWdc signed in 2021, and places the company on the path to becoming one of the world’s largest users of First Solar’s ultra-low carbon solar technology.
The deal includes orders for First Solar’s Series 6 Plus and next-generation Series 7 modules. Designed and developed at its R&D centres in California and Ohio, the US, First Solar’s advanced thin film photovoltaic (PV) modules set industry benchmarks for quality, durability, reliability, design, and environmental performance.
First Solar is expanding its US manufacturing capacity, with a third factory expected to come online in Ohio in 1H23 and a fourth factory, which is under construction in Alabama, expected to be commissioned by 2025. Both factories will produce the Series 7 modules ordered by Lightsource bp. First Solar’s new US$1.1 billion Alabama factory and US$185 million expansion of its existing manufacturing footprint in Ohio are expected to bring its total investment in American manufacturing to over US$4 billion. The company’s annual US nameplate manufacturing capacity is forecast to expand to 10.6 GWdc by 2026.
WindEurope
25 –27 April 2023
Copenhagn, Denmark
https://windeurope.org/annual2023/
Global Energy Transition
07 – 08 June 2023
New York, USA
https://events.reutersevents.com/energy-transition/ global-energy-transition-new-york
Global Energy Show
13 – 15 June 2023
Calgary, Canada
www.globalenergyshow.com/
Better Energy and Toms Group have concluded a power purchase agreement (PPA), which contributes to the construction of a new solar park in Poland. The new solar park will bring subsidy-free solar power to Poland this year and has a production capacity of approximately 20 MW.
The agreement is one of the first Polish examples of a direct corporate PPA between a company and a power producer, with most solar PPAs in Poland using energy traders or others as middlemen.
The partnership between Better Energy and Toms Group builds upon an existing Danish PPA between the parties, signed in 2022.
The 1 GWh that is earmarked for Toms Group is equivalent to 15% of power consumption in the Toms factory in Nowa Sol, Poland.
The new solar park cements the central role of solar power in the future energy mix in Europe. The new park is expected 4Q23, it is realised without government subsidies, and highlights that solar can be build-based on grid parity in Poland.
Polish electricity generation is currently dominated by fossil fuels, with more than 70% of electricity being generated from coal. The positive environmental impact of additional renewable energy resources in Poland is therefore significantly higher than in many other European countries.
Global Offshore Wind
14 – 15 June 2023
London, UK
https://events.renewableuk.com/gow23
Solar & Storage Live 2023
17 – 19 October 2023
Birmingham, UK
www.terrapinn.com/exhibition/solar-storage-live/ index.stm
Offshore Wind North East
08 – 09 November 2023
Sunderland, UK
www.nof.co.uk/events/owne-2023/

bp has launched the green hydrogen cluster of the Valencia region (HyVal) at its Castellón refinery. Led by bp, this collaborative initiative is intended to be based around the phased development of up to 2 GW of electrolysis capacity by 2030 for producing green hydrogen at bp’s refinery.
HyVal is expected to play an instrumental role in decarbonising the operations of bp’s Castellón refinery. Its transformation could see bp invest a total of up to €2 billion in Castellón by 2030.
The first, anticipated to be operational in 2027, will involve the installation of an electrolysis plant with at least 200 MW capacity at Castellón refinery. This initial stage would be expected to produce up to 31 200 tpy of green hydrogen.
In the second phase, which could be completed in 2030, the electrolysis plant would be expanded to reach a capacity of up to 2 GW of net installed power.
bp aims to produce 0.5 – 0.7 million tpy of mostly green hydrogen by 2030. It is progressing a number of green hydrogen projects, including in the UK, Australia, and Germany.

Fortescue Future Industries (FFI) has announced that it will collaborate on exploring potential green hydrogen opportunities across South Africa under a non-binding term sheet with African Rainbow Energy.
The collaboration comes at a crucial time, with the South African green hydrogen market attracting international investors.
African Rainbow Energy’s development credentials, combined with its local market knowledge and financial capabilities, align with Fortescue’s knowledge and investment in the global green hydrogen sector.
Both parties will use their expertise to identify domestic market opportunities to support the development of green hydrogen projects at strategic locations across South Africa. Upon identifying an opportune business case, African Rainbow Energy and FFI will negotiate the terms of a binding joint development agreement.
Masdar has signed a memorandum of understanding (MoU) with VERBUND to explore the production of green hydrogen for the Central European market.
The MoU was signed at Abu Dhabi Sustainability Week (ADSW) 2023 by Michael Strugl, VERBUND CEO, and Mohammad Abdelqader El Ramahi, Executive Director, Green Hydrogen, Masdar. As per the agreement, the two companies will co-operate on developing pathways to produce and export green hydrogen to Central Europe, specifically Austria and Southern Germany.
Green hydrogen is typically hydrogen produced from water electrolysis powered by renewable electricity. The resulting energy carrier can be used in many energy applications. It can be used in the form of hydrogen or converted to other derivatives for industry, power, or transportation, supporting the decarbonisation of hard-to-abate sectors such as heavy industry, long-haul freight, shipping, and aviation.
With such a wide range of prospective uses and needs, green hydrogen demand is expected to grow greatly in the coming years. According to the International Energy Agency’s Global Hydrogen Review 2022, meeting governments’ climate pledges alone will require 34 million tpy by 2030.
> Copenhagen Infrastructure Partners acquires South African renewable energy IPP
> Inland and Coastal Marina Systems installs new O&M base berthing to support Scottish offshore wind farm
> Bekevar wind farm reaches financial close
Follow our website and social media pages for more updates, industry news, and technical articles.
www.energyglobal.com
In the latest expansion of its battery storage capacity, Axpo will build a 20 MW/20 MWh facility in Sweden to deliver services to the grid in 2024. Axpo acquired the project from developers RES and Scandinavian Capacity Reserve (SCR). The lithium-ion based facility will be built in Landskrona, Sweden, and connected to the grid by local energy company Landskrona Energi.
Axpo will build a 20 MW/20 MWh lithium-ion based battery storage facility in the south of Sweden, which will become operational in 2024. The project was developed by RES and SCR and acquired by Axpo on 9 March 2023.
The new battery energy storage system will be used in the Landskrona region to provide ancillary services to help balance the grid and will be connected by local energy supplier Landskrona Energi. Following the sale, RES will support Axpo with the provision of construction management, asset management, and operation and maintenance services.
Axpo has been active in the development, construction, and commercial optimisation of large batteries for several years and will continue to grow in this area. Axpo has been active in Sweden since 2005.
X-ELIO has launched its first utility scale battery energy storage system (BESS) project in the US, with a total capacity of 60 MW.
This BESS project will be co-located with Liberty 1 Solar, the 72 MW photovoltaic (PV) solar plant that the company is building near Houston. Liberty 1 Solar is expected to be operational in early 2024 and will generate 137 GWh/y of clean energy, avoiding the emission of 52.4 t of CO2, while contributing more than US$130 million in capital investment in the state and creating up to 125 construction jobs. The energy produced by this plant will be sold to BASF through a power purchase agreement, closed last September with the company.

The project itself will provide a reliable and cost-effective means of storing renewable energy. Surplus energy, generated by Liberty 1 during times of low demand, will be stored in these batteries so that it can be fed into the grid at times of greater need. As an ancillary service, the system will also support grid voltage and frequency.
The battery system is uniquely designed in a way that allows for future expansion, increasing capacity from a 1.2 hr system to a 2 hr system (60 MW – 120 MWh), ensuring the highest value proposition under ever-changing market conditions.