MARKET REPORT
SOUTH FLORIDA | RETAIL


ONE Commercial Real Estate is driven by a commitment to be a change agent for clients and industry professionals. Founded by Daniel de la Vega, the President of ONE Sotheby’s International Realty, we offer superior results to owners, occupiers, and developers of commercial real estate by obtaining and sharing intelligence as well as applying our knowledge, experience, competence and technical skills.
Our team members have experienced several cycles that have taught valuable lessons. We have decades of on-the-ground experience and market knowledge in South Florida advising clients in all aspects of commercial real estate. We provide the insight necessary to lead informed and efficient decision making.
The commercial real estate landscape has changed. Florida is impacted by global economic and political events more than most. Capital is forming new markets, redefining old ones, and continues to shape the fabric of our ever-growing landscape. Understanding these changes allows us to continue serving our clients and communities. By embracing the data and analytics we can identify movements, address obstacles, forecast challenges, and secure a vision for the future.
This edition of the One Commercial Market Report examines retail within Miami- Dade, Broward, and Palm Beach County.

Daniel de la Vega Chief Executive Officer ONE Commercial Real Estate

MIAMI RETAIL TIGHTENS AS SPACE SCARCITY DRIVES RECORD LOW VACANCY AND RENT GROWTH.

Consumers have been hit by some of the highest inflation in the country which, along with slowing domestic immigration, have dampened real retail sales growth. That said, spending remains elevated relative to pre-pandemic levels, and although relatively muted, real consumption growth has returned in 2024. Going forward, additional spending driven by the return of international tourism should support retail sales, while a lack of available space weighs on leasing activity.
Miami retail leasing activity has slowed over the past 12 months, with over 2.1 million SF leased, down from peak levels of over 3.5 million SF in 2021. A lack of available space mainly drives this slowdown, as market participants continue to indicate tenant interest in new space from global and locally owned brands.
Over the last 12 months, total leased SF makes up around 45% of available space, up from 40% on average from 2015 through 2019, resulting in positive annual net absorption of 1.0 million SF. These demand gains have driven the availability rate to historic lows of 3.6% as of the fourth quarter of 2024, below the fiveyear average availability rate of 4.2%.
New supply has done little to improve space availability, as the two million SF of retail space delivered since 2023 is already over 85% leased. Additionally, limited supply relief is on the way as higher interest rates and elevated land values weigh on developer activity, with construction starts slowing significantly over the last year. As such, just 1,000,000 SF is currently underway across Miami, with only 313,000 SF available.
SOURCE: COSTAR
Elevated retail sales and limited space availability have helped drive strong rent gains in the area, with asking rents rising around 17% in the last three years, above national gains of around 10% over the same time period. With tenant move-outs remaining below the five-year historical average and limited supply additions, tight space availability is expected to drive healthy rent gains above the U.S. average.
Annual transaction volume has moderated after two years of above-average activity, totaling $1.0 billion in trades over the past 12 months, down to half the levels seen in 2022 and 2021. Despite tight vacancies and healthy rent gains, elevated interest rates, which are driving cap rates higher, are resulting in a drop in activity and pricing. Additionally, transaction sizes have shrunk as institutional players remain less active while owner-user buyers have become more active.
As we advance, rent growth will moderate as softer demand, driven by slowing consumption growth, meets limited inventory. Despite this, the market’s increased attractiveness and a lack of available space should drive an outperformance in values compared to the national average.

Annual transaction volume has moderated after two years of above-average activity, totaling $1.0 billion in trades over the past 12 months. This has fallen below the five-year annual average of $1.5 billion, though it remains consistent with levels seen from 2017 through 2020. So far in 2024, 22 large deals, totaling more than $10 million each, have driven volume, accounting for over 50% of YTD activity.
The largest trade of this year involves SITE Centers selling a 340,000 SF retail center, The Shops at Midtown Miami to Benderson Development Company for over $83 million or over $240/SF. The mixed-use retail/office property located in Wynwoood was built in 2007 and was 98% leased at sale. Notable tenants include Target, Ross Dress for Less, Dick’s Sporting Goods, Marshalls, Home Goods, Party City, Carter’s, and Massage Envy.
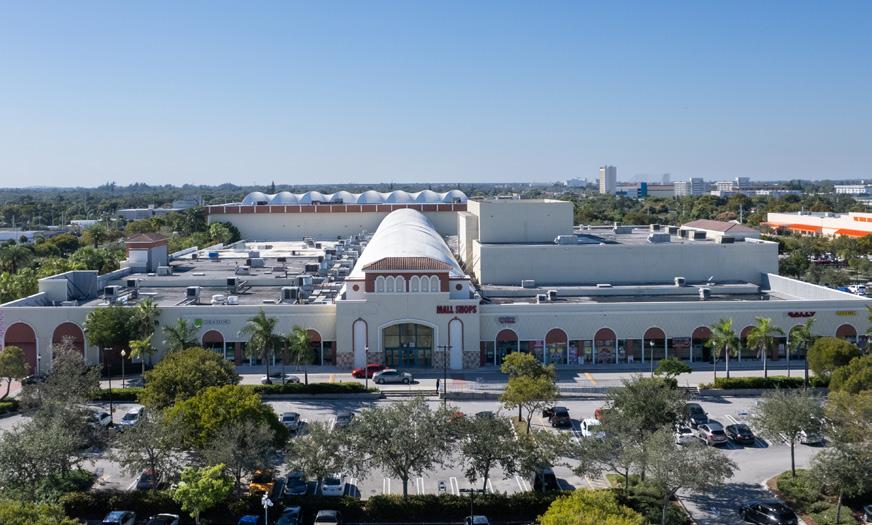
Of note this year is the rise in purchases targeting redevelopment opportunities. The largest was the March sale of a high-vacancy mall in Northeast Dade. The 311,000 SF property sold for $46 million or $147/SF while it was 76% leased. Brixmor Property Group sold the 1956-built asset to Taillard Capital, which is expected to ultimately redevelop the property, but that hasn’t been finalized yet. For now, the buyer plans to revitalize the mall through lease-up. Marketing for the three parcels, which include the enclosed mall and several out parcels, suggested a mixed-use redevelopment using Live Local, allowing for an increased residential density of around 12,000 units.
High-end locations have also seen activity this year, with two properties located on Lincoln Road trading this summer. Torose Equities purchased 910 Lincoln from Invesco for $10.4 million or over $1,200/SF in July while the property was vacant. Also, in July, a private buyer purchased 318-338 Lincoln Rd for $13.6 million or over
$582/SF from RFR Realty while it was around 50% leased. Marketing materials indicated revenue growth through lease-up of vacant space and renewal of in-place rents, which were 25% below market. 910 Lincoln likely traded at a premium due to its more attractive positioning in the walkable 900 block of Lincoln Road and its recent renovation in 2008.
The premium for walkable locations is also highlighted by the March sale of a lifestyle center at 80 NE 40th St in Wynwood. ASG Equities sold the 6,500 SF property to Dacra Realty, L Catterton, and Brookfield Properties for $18 million or over $2,700/SF. The property, part of the pedestrian Design District, is fully leased. The final sale indicates a 20% discount on the asking price, with a 3.89% cap rate.
While high-end locations continue to trade at elevated prices, properties in suburban locations trade at higher cap rates. The acquisition of a 45,000 SF Center in South Dade for over $15 million or over $340/SF at a 6% cap rate highlights these pricing differences.
SOURCE: COSTAR
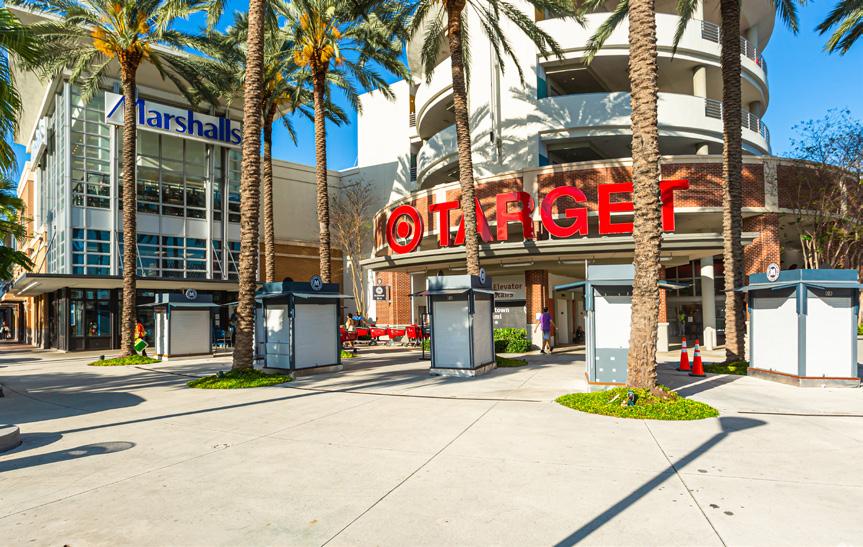
The Shops at Midtown Miami | Wynwood-Design District Submarket | Miami, FL 33127
SALE DATE
SALE PRICE
LEASED
HOLD PERIOD RBA YEAR BUILT
Sep 2024
$83.8M ($241/SF) 98%
57 Months
347,740 SF 2007
BUYER
SALE TYPE
Benderson Development... (USA)
SITE Centers (USA) JLL Investment
Mall at 163rd | Northeast Dade Submarket | North Miami Beach, FL 33162
SALE DATE
SALE PRICE
LEASED
HOLD PERIOD
RBA
YEAR BUILT
Mar 2024
$46M ($148/SF) 77%
153 Months
311,171 SF 1956 (Renov 1990)
BUYER SELLER
BROKER
SALE TYPE
SALE COND
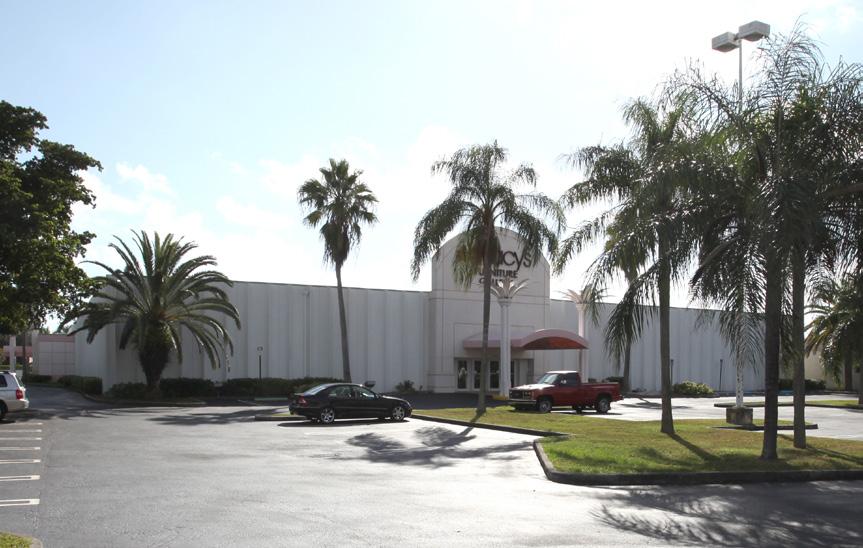
Kendall Submarket | Miami, FL 33156
SALE DATE
SALE PRICE
LEASED HOLD PERIOD RBA YEAR BUILT
Jun 2024
$40M ($707/SF) 100%
20+ Years
56,616 SF 1972
SALE TYPE
SALE COND
Taillard Capital (USA) Brixmor (USA) Avison Young Investment
High Vacancy Property
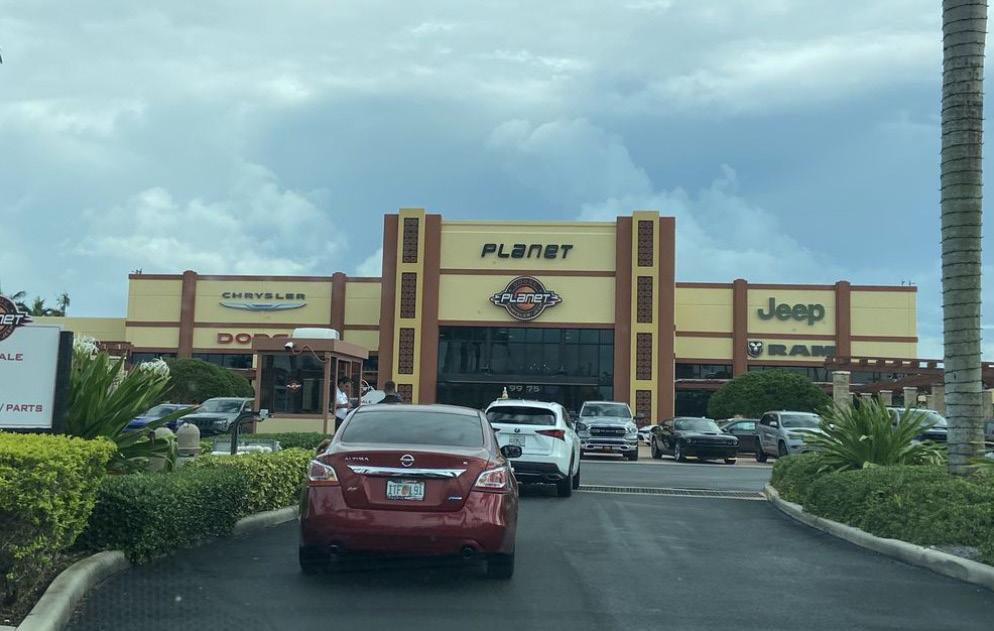
Miami Airport Submarket • Doral, FL 33172
SALE DATE
SALE PRICE
LEASED
HOLD PERIOD
RBA YEAR BUILT
Dec 2023
$32.5M ($678/SF) 100%
239 Months
47,913 SF 2004
BUYER SELLER
SALE TYPE
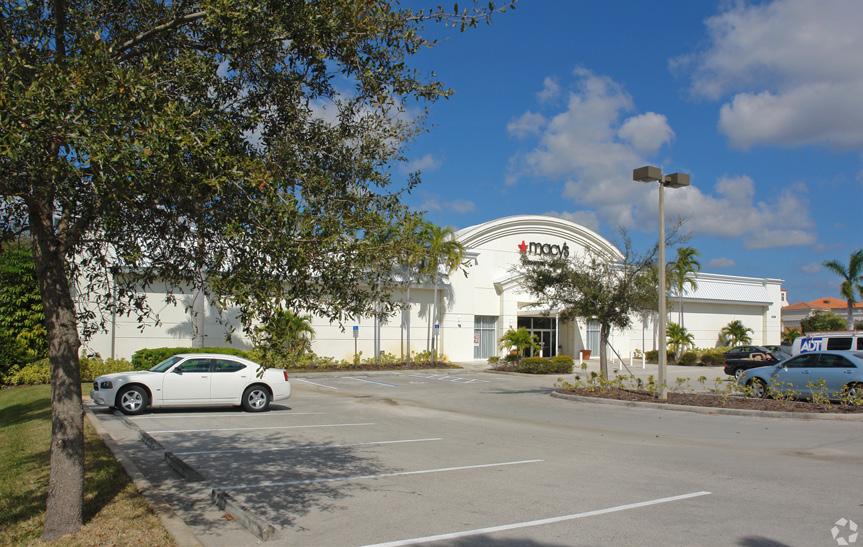
University of Miami (USA)
Macy’s, Inc. (USA)
Atlantic Capital Partners Investment Redevelopment Project
Bomnin Automotive LLC (USA) Potamkin ARM, LLC (USA) Investment
Downtown Miami Submarket | Miami, FL 33132
SALE DATE
SALE PRICE
LEASED
HOLD PERIOD
RBA
YEAR BUILT
Jan 2024
$27.5M ($122/SF)
87%
66 Months
225,000 SF 1926 (Renov 2024)
BUYER SELLER
SALE TYPE
SALE COND
Elysee Investments (USA) +1 Time Century Holdings LLC (USA) Investment Distress Sale
SOURCE: COSTAR
Miami’s retail construction pipeline remains active, although there has been a notable drop in construction starts in the past two years. That said, there is currently around 1.1 million SF of new retail space underway, and around 840,000 SF has delivered in the past 12 months. While under-construction totals have come off of elevated levels, 2023 saw the second-highest level of deliveries since 2020. 2024 is expected to see delivery of most of the underconstruction SF, though this will remain below the levels delivered in 2023. 2025 deliveries are expected to fall even further, with supply additions slowing significantly below long-term averages throughout the forecast period.
Healthy demand in 2023 was sufficient to maintain vacancy rates at historic lows of 2.8%, as the majority of new supply additions have seen healthy lease-up. In fact, only around 75,000 SF is available in properties underway, indicating the strong demand for new space. Additionally, net absorption has exceeded the pace of new deliveries since 2021, indicating there may be additional runway for new projects in growing areas.
Retail development has pushed northward and southward towards Northeast Dade and South Dade, respectively, where combined retail inventory has grown by more than 1.7 million SF in the past five years. The Coral Gables and Miami submarkets have also seen a significant amount of development, with combined inventory growth of over 1.1 million SF over the same time period. The bulk of new construction is concentrated in the Downtown Miami, Northeast Dade, Miami Gardens/Opa Locka and South Dade submarkets, representing over 70% of supply underway.
Among all projects underway, a majority are composed of properties smaller than 75,000 SF. There are three properties underway that are larger than 100,000 SF, spread out across several submarkets. These include 300,000 SF at the mixeduse Miami World Center in Downtown Miami, 250,000 SF for the expansion at the high-fashion shopping center of the Bal Harbour Shops, and 175,000 SF at the mixed-use Block 55 apartments at Sawyers Walk also in Downtown Miami. These projects have also seen healthy pre-leasing demand.

Broward retail leasing activity has slowed over the past 12 months, with over 2.5 million SF leased, down from peak levels of over 3.3 million SF leased through the second quarter of 2021. This moderation in leasing activity is mainly driven by a lack of available space, as total leased SF now makes up over 13% of available space, up from around 11% on average from 2015 through 2019. Limited space availability has resulted in a slowdown in net absorption, which has contracted by -650,000 SF over the last year. Still, the availability rate of 4.3% as of the fourth quarter of 2024 remains below the five-year average availability rate of 4.8%.
With tenant move-outs remaining below the five-year historical average and limited supply additions, space availability is expected to remain tight, well below the U.S. average for the foreseeable future. The largest leases over the past year have been signed by home goods, entertainment, clothing, and fitness tenants, including Floor & Decor, Burlington Stores, Crunch Fitness, Nordstrom, and Altitude Trampoline Park.
Demographic growth, along with the return of tourists, continues to further bolster resident and tourism spending. This has driven healthy rent gains for retail space in the area, with annual growth at 2.0%, though this has slowed from peak levels of 10.8% at the end of 2022.
Despite some deliveries from 2020 through 2023, with around 1 million SF added to the market in those years combined, 2024 presents a muted construction pipeline, with just over 190,000 SF expected to be

SOURCE: COSTAR
delivered. Higher interest rates, as well as elevated land values, continue to weigh on developer activity in the market, with construction starts slowing. This should help retail vacancies remain tight at around 4.0%, below the 10-year historical average of 4.2% going forward
Annual transaction volume has moderated from highs in 2021 and 2022. However, has transacted in the last 12 months, close to the five-year annual average volume of $1.1 billion. Despite strong fundamentals of tight vacancies and healthy rent gains, higher interest rates, which are driving cap rates higher, are resulting in a drop in pricing. Annual transaction cap rates remain flat relative to one year ago at 5.8%, though these have moved higher in recent months, with average quarterly cap rates increasing to around 6%. Additionally, transaction sizes have shrunk as institutional players remain less active, with the average transaction since 2023 totaling $3.4 million, down from $4.3 million in 2022. Despite this, the market’s increased attractiveness, coupled with a limited availability of space, should drive an outperformance in rent gains and values compared to the national average.


Transaction volume has moderated, with $989 million in trades over the past 12 months, slightly below the five-year annual average of $1.1 billion. In comparison, over $1.5 billion traded in both 2021 and 2022. When looking at a longer horizon, Broward has been an active market in terms of retail investment sales activity, with average annual transaction volume of $1.0 billion over the past 10 years.
After pricing appreciation of around 30% since 2019, price growth has begun to slow since the second quarter of 2023. Economic headwinds impacting investment activity should further slow pricing gains in the near term as higher interest rates drive an expansion in cap rates. Average transaction cap rates expanded by 50 basis points, from the mid-5% range to the low-6% range, since 2022. Additionally, the average transaction size has fallen by 20% from elevated levels in 2021, as large institutional buyers remain on the sidelines relative to prior levels of activity.
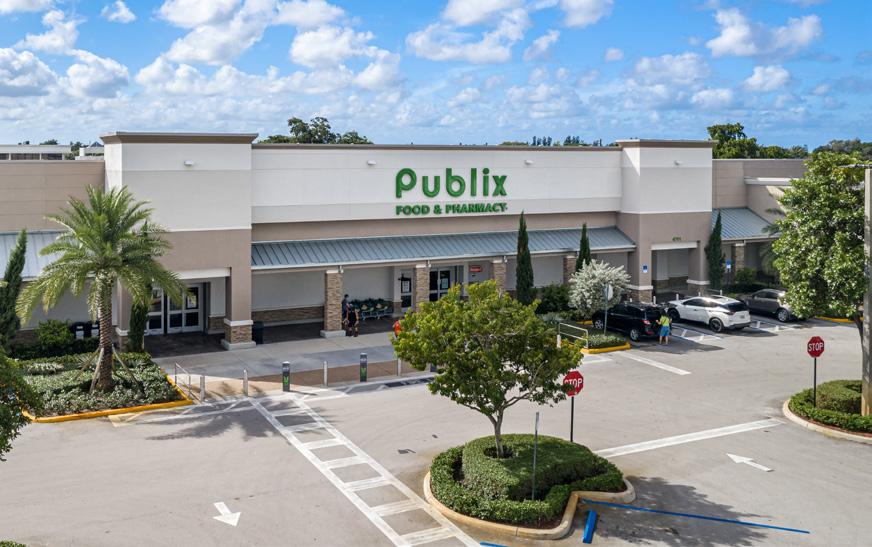
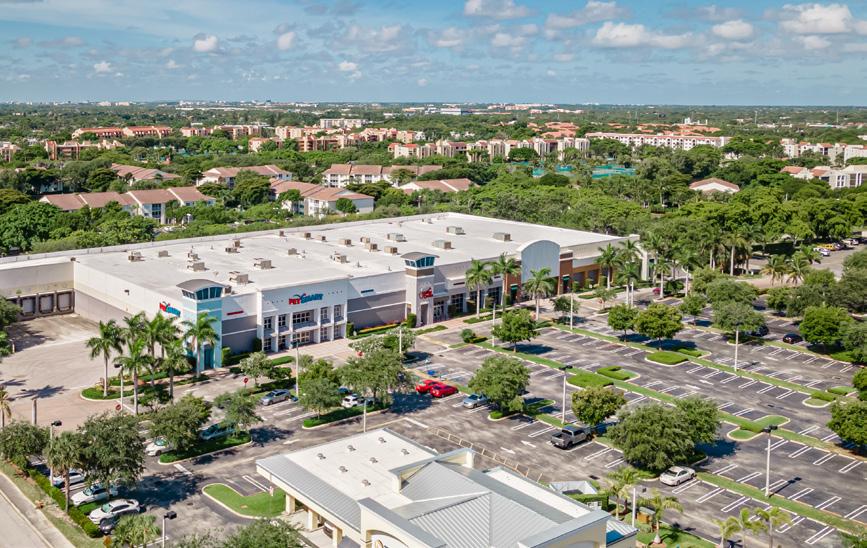
Grocery-anchored centers have remained in demand, with one of the largest transactions of the year involving the community center at 5701-5881 N University Dr. The 228,000 SF Midway Plaza sold for $36 million or $159/SF while it was 85% leased. SITE Centers sold the property to ShopOne Centers REIT, Inc. The center is anchored by Publix and features tenants such as Pet Supermarket and Ross Dress for Less.
Publix supermarkets have also been active buyers of their own grocery-anchored centers this year after purchasing Ramblewood Square Shopping Center for $58 million or $393/SF. The seller, Apollo Global Management, completed a full renovation of the retail center, with approximately 90% of the structure gutted and rebuilt. The buyer, Publix Super Markets, occupies 54,964 SF, with Ross Dress for Less as the shadow anchor occupying 22,000 SF.
Large 2024 deals have also involved properties with redevelopment potential, such as the purchase of The Quay by PEBB Enterprises, BH Group, and Related Group from Mast Capital and AEW Capital Management for $48 million or $577/SF. The property, built in 1988, has a retail center that was 93% leased at sale with tenants including the Boatyard Restaurant, USPS, and Chipotle. This is the third joint venture for the buyers who were interested in an in-fill waterfront site near downtown Fort Lauderdale. The property has an entitlement that allows for 361 residential units and 12,000 square feet of retail and restaurants.
Broward’s construction pipeline remains limited, as there has been a notable drop in construction starts since 2018. That said, there is currently 555,250 SF of new retail space underway, and 57,000 SF has delivered over the past 12 months. Limited construction activity will result in a few deliveries over the next few years, with inventory additions staying below the 10-year historical average of 450,000 SF through at least 2025.
Since 2020, retail development has significantly expanded in the Southwest Broward, Fort Lauderdale, Plantation, and
SOURCE: COSTAR
Davie Shopping Center | Southwest Broward Submarket | Davie, FL 33328
SALE DATE
SALE
Aug 2024
$45M ($440/SF) 100%
182 Months
SF 1979 (Renov 2018)
Publix Super Markets Inc. (USA)
Prudential (USA) +1 JLL
Investment
Bulk/Portfolio Sale
Midway Plaza | NW Broward/Coral Springs Submarket | Tamarac, FL 33321
SALE DATE
SALE PRICE
PERIOD
Jul 2024
$24.5M ($222/SF) 100% 154 Months 110,204 SF 1997
SALE TYPE
SALE COND
BBX Capital, Inc. (USA) +1 Map Legacy Inc (USA) Investment Redevelopment Project
Ramblewood Square Shopping Center | NW Broward/Coral Springs
Submarket | Coral Spring...
SALE DATE
SALE PRICE
PERIOD
BUILT
May 2024
$34.1M ($443/SF)
SF 2023
Regency Professional Center | Southwest Broward Submarket | Davie, FL 33330
SALE DATE
SALE PRICE
PERIOD
Aug 2024
$31.3M ($317/SF) 100% 20+ Years 98,697 SF 1990
Publix Super Markets Inc. (USA) Prudential (USA) +1 JLL
Investment
Bulk/Portfolio Sale
Shopper’s Haven Shopping Center | Pompano Beach Submarket | Pompano Beach, FL 33064
SALE DATE
SALE PRICE
SOURCE: COSTAR
Hallandale submarkets, each seeing inventory growth of over 530,000 SF, 317,000 SF, 139,000 SF, and 122,000 SF, respectively. Current construction, representing over 70% of activity in the Broward market, is concentrated in Hallandale, Southwest Broward, and Plantation submarkets with around 190,000 SF, 100,000 SF, and 85,000 SF underway, respectively.
The three largest projects underway include over 310,000 SF at 3363 N Federal Highway, more than 140,000 SF of retail space at 777 Isle of Capri Blvd. in Pompano, and 130,000 SF Seneca Town Center in the Hallandale Submarket. All three properties are expected to deliver in 2025 and have seen healthy pre-leasing.
Despite the historically tight market and strong rent growth, there is very little retail construction across South Florida. High land values and financing costs, along with elevated construction material and labor costs, are impacting construction activity.
The majority of retail space coming online is limited to small ground-floor retail in mixed-use projects or renovations of existing properties. Limited new supply will make existing space more attractive and harder to come by, further supporting the positive rent growth outlook.


Palm Beach retail leasing activity has slowed over the past 12 months, with over 1.6 million SF leased in 2024, down from recent peak levels of over 2.4 million SF leased as of the third quarter of 2021. This slowdown in leasing activity is mainly driven by a lack of available space, as total leased SF now makes up over 13% of available space, up from around 11% on average from 2015 through 2019. Still, net absorption has remained positive over most of the last three years, with the exception of the first quarter of 2024, which saw some minor move-outs.
This recent tenant churn has driven annual net absorption to negative territory, contracting by -250,000 SF. Still, this had a limited impact on the availability rate which stands at 4.5% as of the fourth quarter of 2024, in line with the five-year average availability rate of 4.9%. With tenant move-outs remaining below the five-year historical average and limited supply additions, space availability is expected to remain tight, well below the U.S. average over the next few years.
Over the past few years, the influx of high-net-worth individuals continues to further bolster Palm Beach resident spending. Elevated retail sales have helped drive strong rent gains for retail space in the area, with annual growth at 5.5%, though this has slowed from peak levels of 7.9% in the third quarter of 2023.
Construction has remained largely muted, with 2023 and 2024 deliveries totaling just over 260,000 SF and 220,000 SF respectively, falling below the 10-year average of 440,000 SF in annual additions.
SOURCE: COSTAR
Higher interest rates and elevated land values continue to weigh on developer activity in the market, with construction starts slowing continuously from 2022 levels. This should help retail vacancies remain tight at around 3.6%, below the 10year historical average of 4.2%. Looking forward, Palm Beach retail vacancies are expected to remain tight, well below the national average vacancy rate.
Transaction volume has slowed, with $516 million in trades over the past 12 months, below the five-year annual average of $918 million. Despite strong fundamentals of tight vacancies and healthy rent gains, higher interest rates, which are driving cap rates higher, are resulting in a drop in pricing. Weighted average transaction pricing over the past 12 months has contracted over 4% relative to peak pricing seen in 2023. Annual transaction cap rates remain flat relative to one year ago at 5.7%, though these have moved higher in recent months, with average quarterly cap rates increasing to over 6% since the second quarter of 2023. Additionally, the average transaction size has fallen by 30% from elevated levels in 2022, as large institutional buyers increasingly remain on the sidelines relative to prior levels of activity.


Transaction volume has slowed, with $516 million in trades over the last year, below the long-term average of $920 million over the past 10 years. When looking at a longer horizon, Palm Beach has been an active market in terms of retail investment sales activity, with 2022 volume reaching record levels of over $1.35 billion, beating the prior record of $1.3 billion in 2015
After average annual transaction pricing appreciation of around 40% since 2019, price growth has begun to slow since the second quarter of 2023. Economic headwinds impacting investment activity should further slow pricing gains in the near term as higher interest rates drive an expansion in cap rates. Average transaction cap rates have expanded by over 100 basis points from the low-5% range to the mid-6% range through 2024.
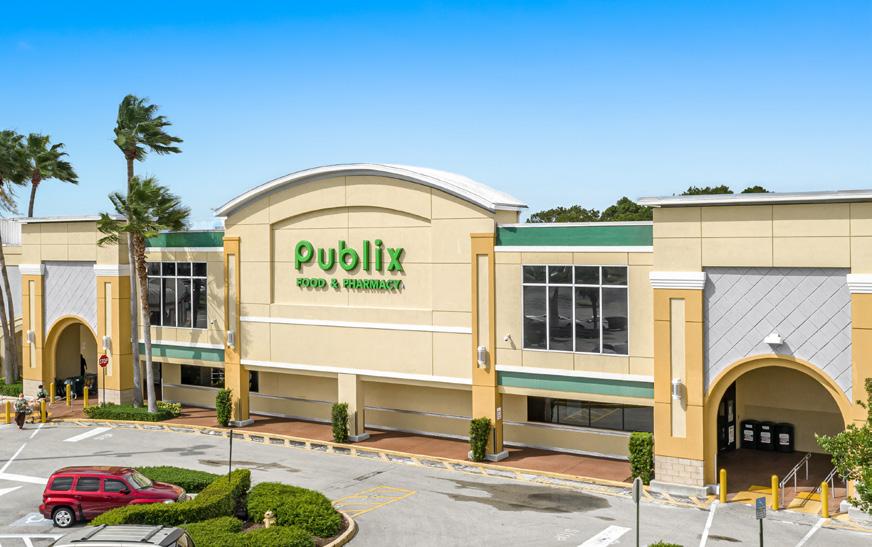
Market participants continue to note strong demand for grocery-anchored and services-oriented centers, which have composed a large share of trades since 2023. In fact, one of the largest trades of 2024 involved the sale of two grocery-anchored centers, Woods Walk Plaza and Crestwood Square in Lake Worth and Royal Palm Beach, respectively. The Publix-anchored centers traded as part of a 16-property portfolio trade totaling over $223 million. PGIM sold seven Florida grocery anchored retail centers to Publix Super Markets as part of the portfolio,
with the Palm Beach Centers trading for over $57 million or over $368/SF This follows a trend in which tenants have stepped up this year, buying some of their stores to hedge against future rent hikes.
Neighborhood centers have also been in demand with the 75,000 SF Village Square of Tequesta trading for over $20 million or $269/SF at a 7% cap rate, a slight premium to
the asking cap rate of 7.1%. A private player acquired the asset which is anchored by West Marine. The property has an in-place average rent of over $21/SF NNN with a WALT of three years and an average tenant tenure of 10 years.
High-end retail is also in demand with Greenstone Realty Advisors selling a multi-tenant retail property to CS Ventures for over $30 million. The property, located on the affluent Worth Avenue, was fully leased to several luxury retailers including Versace, 55 Croisette, Poupette St Barth and fine jewelry shop Maison Maurice at sale. The property totals just over 9,500 SF, resulting in a price per SF of over $3,100. The buyer secured a $14 million loan with Vista Bank for the acquisition.
Going forward, a slowing economy and higher interest rates, resulting in a near-term pricing correction, will likely continue to drive slower transaction activity relative to the boom in 2021 and 2022. Higher cap rates, coupled with softening fundamentals, will likely remain a drag on market activity at least until an eventual loosening of financial conditions occurs.
Woods Walk Offices | Royal Palm Bch/Wellington Submarket | Lake Worth, FL 33467
SALE DATE
SALE PRICE LEASED
Aug 2024
$36.2M ($480/SF)
HOLD PERIOD RBA YEAR BUILT BUYER
20+ Years
SF 1992 (Renov 2004)
SALE TYPE
SALE COND
Publix Super Markets Inc. (USA)
Prudential (USA) +1 JLL
Investment
Bulk/Portfolio Sale
Palm Beach Submarket | Palm Beach, FL 33480
SALE DATE
SALE PRICE
HOLD PERIOD RBA
Sep 2024
$30.3M ($3.2K/SF) 100% 20+ Years
9,536 SF 1925
SALE TYPE
CS Ventures (USA) Greenstone Realty Advisors (USA) Cushman & Wakefield Investment
Boca Raton West Submarket | Boca Raton, FL 33434
SALE DATE
SALE PRICE
CAP RATE LEASED
Mar 2024
$20.3M ($269/SF)
7.0% (Actual) 100% 80 Months
SF
SALE TYPE
HOLD PERIOD RBA YEAR BUILT
1957
Shannon Waltchack (USA) MNR Investments, Inc (USA) +1 LACONIC CAPITAL ADVISORS Investment
Linton Commons | Delray Beach Submarket | Delray Beach, FL 33444
SALE DATE
SALE PRICE LEASED
PERIOD
Nov 2023
$22M ($279/SF) 100% 89 Months
SF 1990 (Renov 2008)
Benderson Development... (USA)
Menin Development, Inc. (USA) Investment
Crestwood Square | Palm Bch Cty Outlying Submarket | Royal Palm Beach, FL 33411
SALE DATE
SALE PRICE
LEASED
Aug 2024
$21M ($263/SF)
HOLD PERIOD RBA YEAR BUILT BUYER
Years
SF 1997
SALE COND
Publix Super Markets Inc. (USA)
Prudential (USA) +1 JLL
Investment
Bulk/Portfolio Sale
Palm Beach’s retail supply pipeline remains limited, as construction starts have remained at or below the 10-year average of 600,000 SF since 2016. That said, there is currently around 240,000 SF of new retail space under construction, and around 170,000 SF has delivered in the past 12 months. Limited construction activity will result in minimal deliveries over the next few years, with 2024 forecast supply additions remaining below the 10-year historical average of 440,000 SF.
Healthy demand through the near-term forecast should help keep vacancies in check, well below the U.S. average. That said, net absorption is expected to moderate in 2024, largely due to the lack of available space for lease-up.
Since 2020, retail development has been concentrated in the Delray Beach, Boynton/Lantana, and North Palm Beach Submarkets, seeing supply growth of over 400,000 SF, 300,000 SF, and 280,000 SF, respectively. Over 60% of current construction is concentrated in the Palm Beach, Boynton/Lantana, and West Palm Beach submarkets, with around 200,000 SF, more than 110,000 SF, and more than 100,000 SF underway, respectively.
Three large-scale retail developments have delivered since 2019, with one currently underway. The largest delivery since 2019 has been a 220,000-SF auto dealership in the Delray Beach Submarket, followed by a 119,000-SF community center that houses a Home Depot in the Palm Beach Submarket, and a 116,000-SF lifestyle center that houses a Life Time Fitness also in the Palm Beach Submarket. All of these properties are fully leased.
The largest project currently underway includes 60,000 SF at The District at Northwood in the Palm Beach CBD. The mixed-use property includes a multifamily component, with 10% of units composed of workforce housing.