MARKET REPORT
SOUTH FLORIDA | OFFICE


ONE Commercial Real Estate is driven by a commitment to be a change agent for clients and industry professionals. Founded by Daniel de la Vega, the President of ONE Sotheby’s International Realty, we offer superior results to owners, occupiers, and developers of commercial real estate by obtaining and sharing intelligence as well as applying our knowledge, experience, competence and technical skills.
Our team members have experienced several cycles that have taught valuable lessons. We have decades of on-the-ground experience and market knowledge in South Florida advising clients in all aspects of commercial real estate. We provide the insight necessary to lead informed and efficient decision making.
The commercial real estate landscape has changed. Florida is impacted by global economic and political events more than most. Capital is forming new markets, redefining old ones, and continues to shape the fabric of our ever-growing landscape. Understanding these changes allows us to continue serving our clients and communities. By embracing the data and analytics we can identify movements, address obstacles, forecast challenges, and secure a vision for the future.
This edition of the One Commercial Market Report examines the office sector in Miami- Dade, Broward, and Palm Beach County.

Daniel de la Vega
Chief Executive Officer ONE Commercial Real Estate

MIAMI’S OFFICE MARKET RESILIENT AMID SHIFTS: PRO-BUSINESS CLIMATE AND DEMAND FOR PREMIUM SPACES SUSTAIN GROWTH
Miami’s leasing activity has moderated from recent highs as office-using employment growth has slowed. However, over the last few years, South Florida’s pro-business atmosphere has attracted over 13,000 more office jobs than would be expected based on pre-pandemic job growth trends, fueling one of the strongest expansions in office demand in the country since 2019.
That said, Miami is not immune to macro headwinds impacting office demand, with net absorption slowing substantially to 220,000 SF through the twelve month period ending in the third quarter of 2024. A hiring environment which is returning to pre-pandemic norm remains the overarching trend, driving a slowdown in demand. Additionally, tenants rightsizing footprints and a strong preference for high-quality space is also impacting leasing. Going forward, older suburban office inventory remains at risk as 60% of leasing is concentrated in 4 & 5 star space and in submarkets like the Miami Airport as well as urban areas like Brickell, Coral Gables and Downtown Miami.
Still, office asking rents in Miami are rising at 4.2% annually during the fourth quarter of 2024, above national gains of 0.9%. The metro’s impressive demand formation since 2019 has benefitted downtown. New developments in the corridor offer tenants the amenitized, high-quality space sought-after in the post-pandemic working world. Diversification of the metro’s economic base has
SOURCE: COSTAR
also been an important demand driver, with growth in the professional and business services and healthcare sectors, particularly.
On the supply side, 2.9 million SF are underway, some of the highest activity seen in a decade, with around 70% located within a 3.5-mile radius of Downtown. Deliveries will remain elevated over the next two years, averaging 1.2 million SF annually, above the 10-year annual average of around 500,000 SF. Despite rising supply, 60% of incoming inventory is concentrated in ten towers, which are over 60% pre-leased. Therefore, new space availability remains limited.
As we advance, rent growth should moderate as weaker demand, driven by softer office-using job gains, meets rising inventory. Despite this, the market’s attractiveness and the limited availability of quality space should drive an outperformance in rent gains compared to the national average. This is likely to buoy office values, with Miami among a handful of the nation’s largest markets with average office values forecasted to end 2024 above 2019 levels.
Trailing 12-month volume has moderated to $1.7 billion through the fourth quarter of 2024, though this remains above the five-year average of $1.4 billion due to two large transactions in the second half of the year. Despite volume falling from peak levels in 2021, Miami remains attractive on a relative basis, as healthy demand and limited supply drive a low vacancy rate, suggesting that the market is insulated from future economic uncertainty relative to its high-growth peers.
This outperformance has allowed institutional players, who are looking to shore up balance sheets or raise capital to return to investors, to sell assets. Institutional players now make up 37% of seller volume over the last year, up from a five-year average of 23%, with market participants indicating that it is relatively easier for these companies to find buyers in South Florida.
Around a quarter of transaction volume so far in 2024 has been driven by the sale of 701 Brickell Avenue. Nuveen sold the over 685,000 SF office building to Morning Calm Management for $443 million or over $646/SF. The property, delivered in 1986 located in the Brickell Submarket underwent a $30 million capital renovation prior to the sale, which was an all-cash transaction. Notable tenants include Holland & Knight LLP, Bank of America, Merrill Lynch Wealth Management and AON. 701 Brickell is viewed as a top performing trophy office building that was 89% leased at sale. Space marketed for lease at the property has asking rents ranging from $140/SF to $170/SF full service.
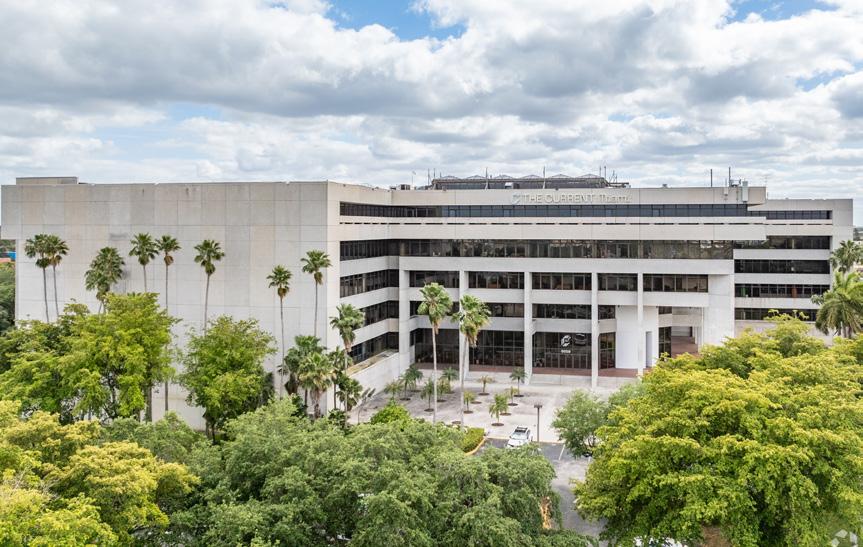
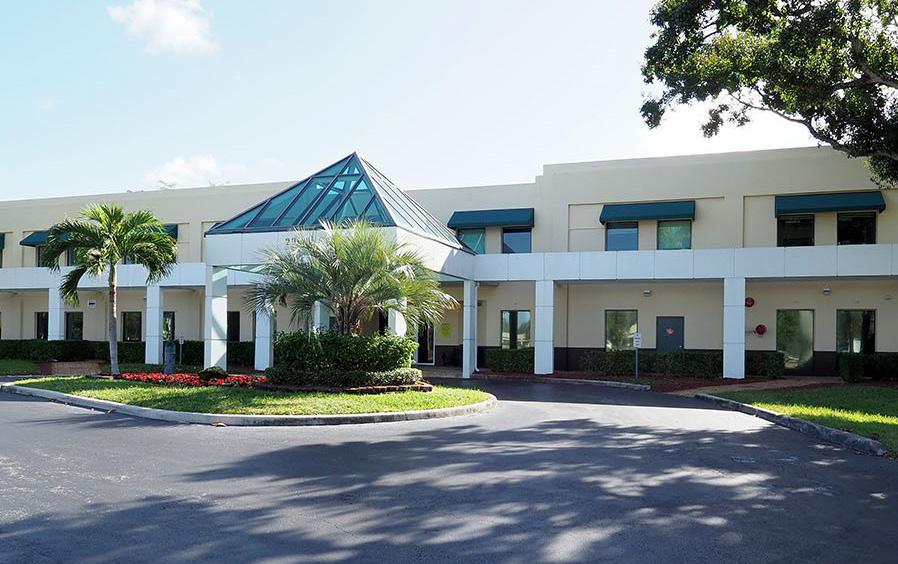
Another major transaction involved Bushburg Properties selling The Current to Miami-Dade County for $182 million or over $291/SF. The 1974-built property, which was renovated in 2024 and is located in the Miami Airport Submarket, was originally offered at $205 million. Miami-Dade County now plans to occupy the property as their Western Dade Government Center.
Medical office trades have also remained active with One Park Square at Doral exchanging hands for $71 million or over $235/SF in September. The Los Angeles County Employees Retirement Association and TA Realty sold the 2009-built property to Island Capital Group. The property, a 4-Star medical office building located in the Miami Airport Submarket was over 91% leased at sale. The buyer assumed a loan at sale with a remaining balance of over $47 million.
Despite a rebound in volume since the second half of 2023, high-volume deals will likely continue to slow. Additionally, higher interest rates have resulted in higher cap rates, with these expanding to around 6%, up from around 5% in 2022. Going forward, national cap rates will expand faster relative to Miami as office fundamentals deteriorate in other markets. In fact, Miami is one of a handful of major U.S. markets with expected office value gains through the end of 2024 versus 2019.
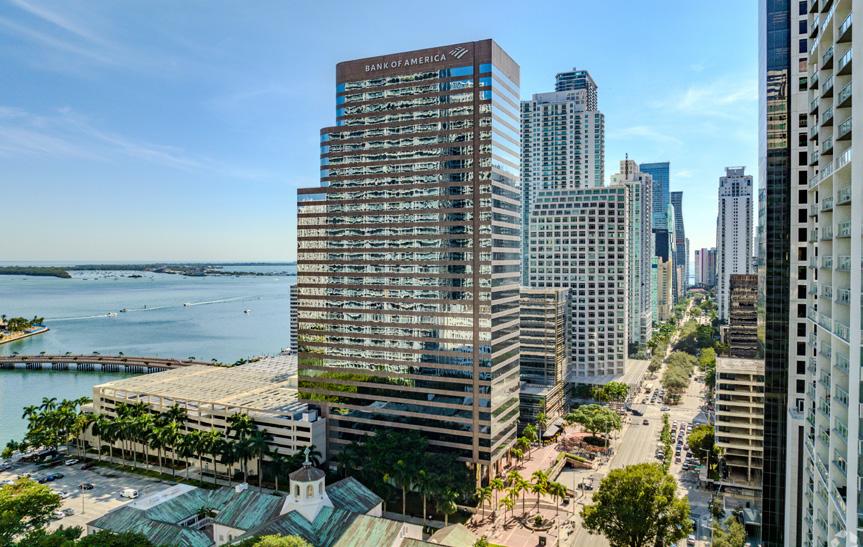
Brickell Submarket | Miami, FL 33131
SALE DATE
SALE PRICE
LEASED
HOLD PERIOD
RBA YEAR BUILT
Oct 2024
$443M ($646/SF)
89%
224 Months
685,279 SF 1986 (Renov 2021)
BUYER
SELLER
BROKER
SALE TYPE
Miami Airport Submarket | Miami, FL 33174
SALE DATE
SALE PRICE
LEASED
HOLD PERIOD RBA YEAR BUILT
Aug 2024
$182M ($291/SF) 43%
118 Months
625,000 SF 1974 (Renov 2024)
BUYER
SELLER
SALE TYPE
SALE COND
Morning Calm Management (USA)
Nuveen (USA)
JLL
Investment
Miami-Dade County (USA)
Bushburg Properties, Inc. (USA)
Owner User
High Vacancy Property
Park Square at Doral | Miami Airport Submarket | Doral, FL 33122
SALE DATE
SALE PRICE
LEASED
HOLD PERIOD
RBA
YEAR BUILT
Sep 2024
$71M ($252/SF)
84%
84 Months
281,785 SF 2009
BUYER
SELLER
SALE TYPE
SALE COND
Island Capital Group LLC (USA)
Los Angeles County Empl... (USA) +1
Investment
Debt Assumption
Waterford Business District | Miami Airport Submarket | Miami, FL 33126
SALE DATE
SALE PRICE
LEASED
HOLD PERIOD
RBA
YEAR BUILT
Dec 2023
$68M ($319/SF) 100%
20+ Years
213,182 SF 2002 (Renov 2021)
BUYER
SELLER
BROKER
SALE TYPE
SALE COND
Lennar (USA)
Franklin Street Properties... (USA) CBRE
Owner User
Purchase By Tenant
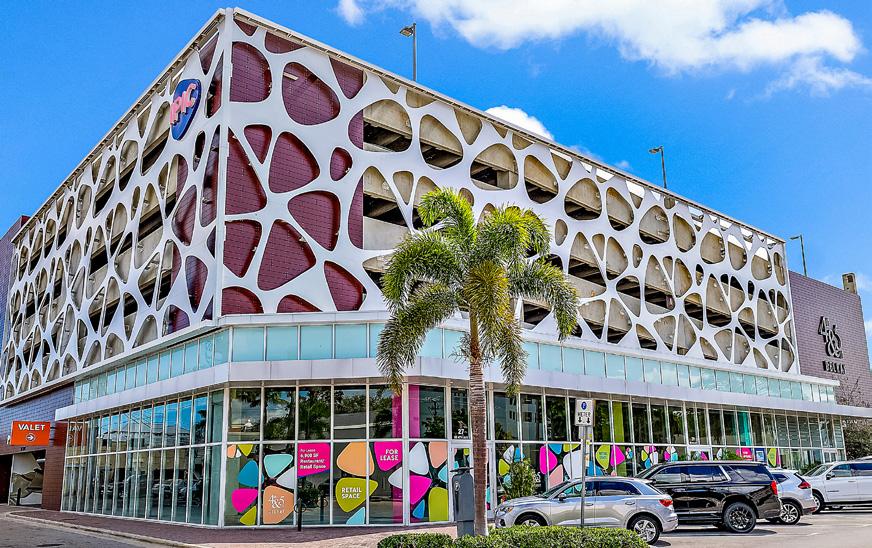
Downtown Miami Submarket | Miami, FL 33101
SALE DATE
SALE PRICE LEASED
HOLD PERIOD RBA YEAR BUILT
Jun 2024
$67M ($511/SF) 100%
5 Months
131,129 SF 2024
BUYER BROKER SELLER
BROKER
SALE TYPE
SALE COND
Mediterranean Shipping C... (USA)
Cushman & Wakefield
Swerdlow Real Estate Gr... (USA)
Cushman & Wakefield
Owner User
Building in Shell Condition
SOURCE: COSTAR
Office construction activity in Miami has been on the rise, with projects underway representing 2.4% of existing supply, up from the 2010-20 average of over 1.6% of supply. Virtually all of the 2.9 million SF underway in the market is concentrated in 4 & 5 Star properties. Deliveries totaled over 230,000 SF in 2023, with a historically elevated 1.3 million SF of product expected to be completed in 2024.
Around 75% of 4 & 5 Star development is located within a 4-mile radius of Downtown Miami, spread out across Downtown, Wynwood, Brickell and Miami Beach. The largest projects underway, of over 250,000 SF, include the Miami Riverside Center, the Royal Caribbean HQ and Wynwood Plaza. These office towers offer tenants the latest finishes and amenities. 830 Brickell, the latest delivery, includes a sky lobby, fitness center, rooftop restaurant and bar, covered parking, and EV charging stations.
With an average year built of 1977 for office properties with more than 10,000 SF, new supply, which can unlock potential corporate relocations, is warranted. Still, oversupply remains a risk, with a rise in sublet availability and 1.2 million SF available in existing assets built in the past 10 years, with an occupancy rate of 85%. Inventory set to deliver in the next few years and the proposed pipeline face rising headwinds due to the near-term slowdown in office-using job growth and the growing popularity of hybrid working strategies.
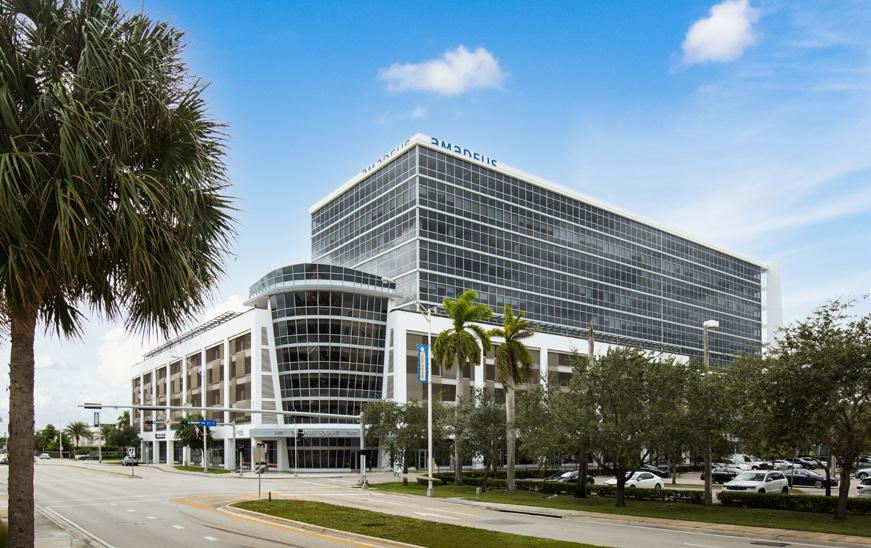
That said, despite cooling economic activity, companies continue to announce relocation and expansion plans in Miami. The latest relocation involves Anaplan, a software company, that announced its move from San Francisco in early 2024. Additionally, Apple, Microsoft and JP Morgan are expanding their footprints in the area. These expansions highlight a growing need for high-quality space in urban areas as all three involve 4 & 5 Star space located in Brickell and Coral Gables.
With limited space availability in properties underway, tenants seeking the latest finishes in their space are left with few options. In fact, availability of large 4 & 5 Star spaces of over 30,000 SF and built since 2010 is limited to 15 existing and eight under-construction properties. Available spaces in these properties have an average asking rent of around $80/SF, 25% higher than the average 4 & 5 Star asking rent in Miami. Going forward, higher financing costs, slower construction employment growth, and elevated pricing for land will weigh on construction, with supply unlikely to significantly wean pressure off the market for high-quality space anytime soon.
Available office space in Fort Lauderdale has expanded marginally, with the availability rate rising to 12.9% from 12% pre-pandemic. Still, this remains below the national availability rate of 16.3%. This uptick in availability has been mainly the result of tenant move-outs from 1 & 2 Star space over the last year. With over 70% of the 430,000 SF of net absorption in the last 12 months concentrated in 4 & 5 Star space.
Space demand has remained strongest in Downtown Fort Lauderdale, Fort Lauderdale, Plantation, and Hallandale, as tenant demand continues to concentrate in newer 4 & 5 Star assets. In fact, over the last year, around 50% of net absorption in these submarkets has been concentrated in properties built since 2010.
Although 4 & 5 Star demand remains healthy, supply additions have driven availabilities higher for this market segment to 21.5% from 17% in 2019. As over 20%, or over 500,000 SF, of Fort Lauderdale’s new 4 & 5 star supply has been concentrated in Downtown Fort Lauderdale since 2019, the submarket’s 4 & 5 Star availability rate has also risen around seven percentage points over the same time period. Some supply pressure will linger throughout 2024 across the broader market, though net absorption is expected to surpass new deliveries for the year.
Fort Lauderdale has historically benefitted from limited office availability relative to the national

SOURCE: COSTAR
average since 2017, and despite softer leasing and new deliveries driving availability higher, tenant demand has remained healthy, resulting in an outperformance in rent gains. In fact, Fort Lauderdale has the ninth-highest office rent gains in the nation, among markets with more than 50 million SF in inventory, rising 2.3% annually during the fourth quarter of 2024 and outpacing national average gains of 0.9%. Still, this remains below the average annual gain of 5.5% over the past three years, as rent gains have moderated.
Going forward, rent growth is expected to continue to slow as softer demand, driven by weaker office-using job gains, impacts leasing activity.
Despite this near-term softening, healthy rent gains and limited occupancy declines in the coming years will drive office value outperformance relative to the rest of the nation. However, higher interest rates have resulted in a pricing contraction from peaks in 2022. Transaction activity has also cooled, with volume totaling $555 million over the past 12 months, down from $1.2 billion transacted through the first quarter of 2022. Despite this slowdown, private player and owner-user purchase activity remains above the five-year average trend.


Fort Lauderdale office transaction volume has moderated over the last 12 months, totaling $555 million, below the five-year average of $759 million. Despite this near-term slowdown, the market remains attractive on a relative basis, as vacancy rates that remain well below the national average suggest that Fort Lauderdale may be insulated from future economic uncertainty when compared to its high-growth peer markets.
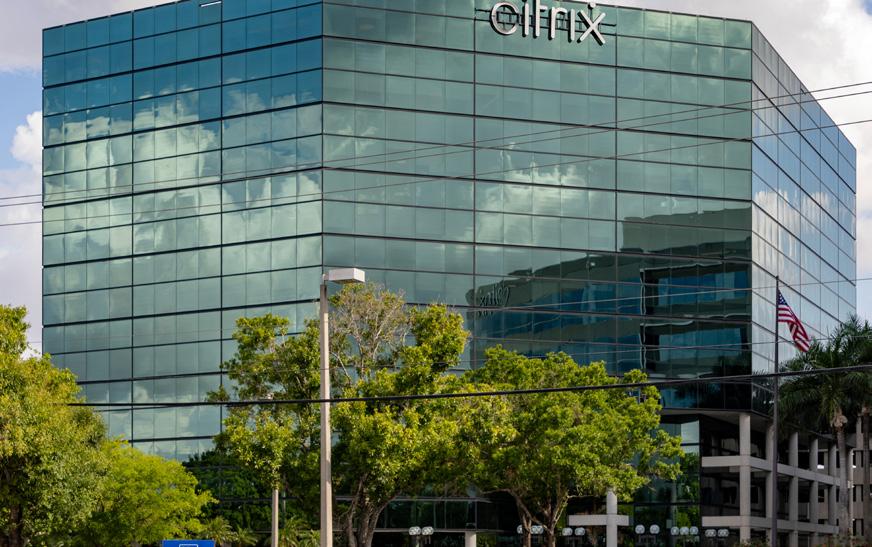
The sale leaseback of the Corporate Park of Cypress Creek drives the majority of volume this year. The 2 buildings totaling over 276,000 SF sold for $37 million or $134/SF.
Imperial Fund purchased the property from its current tenant, Citrix. The seller has recently been acquired and has been shedding space in the corporate park, which has high vacancy and was 50% leased at sale. The sale represents a 40 percent discount from the portfolio’s last known sale in 2008, when Citrix acquired it. The buyer was able to secure an 80% LTV loan from First Horizon Bank for the purchase.
Other major sales have involved purchases of recently built properties and owner-user transactions. For example, Jewish Culture High School purchased the 2019-built, 36,000 SF, property at 105 N Federal Hwy from the developer Link Real Estate for $19 million or over $524/ SF. The buyer was able to secure a 68% LTV loan from FirstBank Puerto Rico for the purchase.
The largest owner-user purchase involved the 133,000 SF City College at 2000 W Commercial Blvd. Broward County acquired the property from Allied Health Education and intends to redevelop it into a 230,000 SF Forensic Science Center with a budgeted investment of $262 million. The 1971-built property in Cypress Creek sold for $18.5 million or over $138/SF. The building had last traded for $15.7 million or $117/SF in 2021, indicating a 17% increase in value in three years.
Activity in Hallandale, NW Broward/Coral Springs Fort Lauderdale, and Cypress Creek has remained the healthiest relative to the historical average from 2015 through 2019, annual volume across the majority of submarkets remains at around 50% of pre-pandemic levels. Economic headwinds and elevated interest rates will continue to impact pricing, driving cap rates higher from the low 6% range in 2022 to over 6.5% today.
Office construction activity in Fort Lauderdale has remained limited over the last five years, with only around 180,000 SF breaking ground in 2024. 290,000 SF of net new product was delivered in 2023, with supply additions expected to remain at similar levels in 2024. Despite some new supply, net deliveries remain well below the long-term historical average of 750,000 SF annually.
Supply additions since 2010 have been mostly composed of 4 & 5 Star assets, with over 70% concentrated in the Southwest Broward, Hallandale, Sawgrass Park, and Downtown Fort Lauderdale submarkets. The Hallandale area has seen a significant rise in new office inventory along US1 in the last few years. The largest developments include the 285,000 SF Onyx Tower, built in 2022 and is around 60% leased, and the
SOURCE: COSTAR
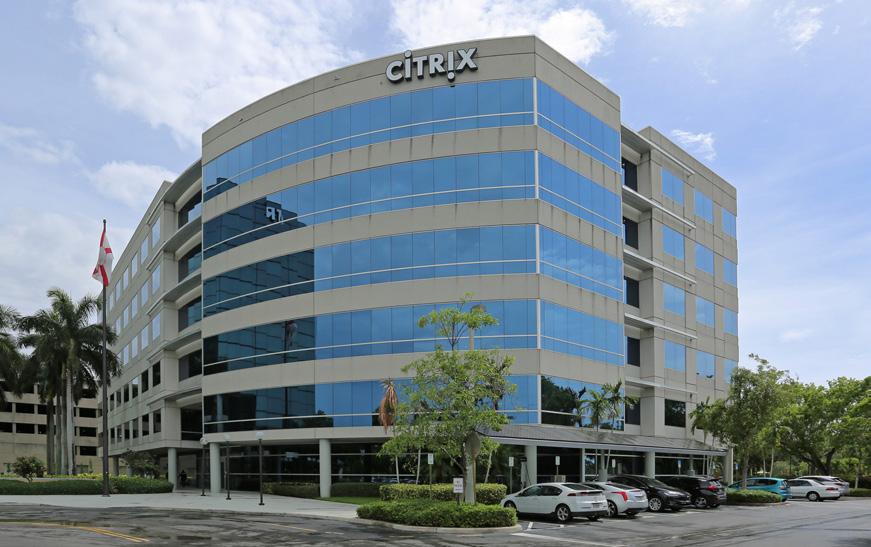
Corporate Park of Cypress Creek | Cypress Creek Submarket | Fort Lauderdale, FL 33309
SALE DATE
SALE PRICE
LEASED
HOLD PERIOD
RBA
YEAR BUILT
Aug 2024
$19.6M ($140/SF) 68%
126 Months 139,547 SF 1987
BUYER BROKE SELLER
BROKER
SALE TYPE
SALE COND
Imperial Fund (USA)
Rise Realty
Citrix (USA)
Colliers
Investment
Sale Leaseback,High Vacancy Property
Downtown Fort Lauderdale Submarket | Fort Lauderdale, FL 33301
SALE DATE SALE PRICE
PERIOD
BUILT
Oct 2024
$19M ($525/SF)
SF
Jewish Culture High School (USA) Link Real Estate (USA)
Owner User
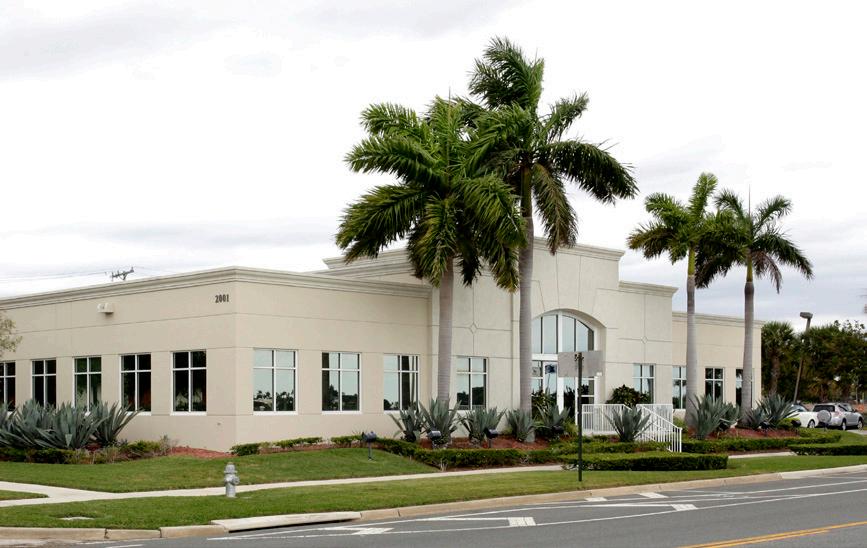
Cypress Creek Submarket | Fort Lauderdale, FL 33309
SALE DATE
SALE PRICE
LEASED
HOLD PERIOD
Jan
$18.5M
RBA YEAR BUILT BUYER
Broward County Governm... (USA)
Allied Health Education (USA) Investment
17th Street Quay | Downtown Fort Lauderdale Submarket Fort Lauderdale, FL 33316
SALE DATE
SALE PRICE
LEASED
HOLD PERIOD
RBA
YEAR BUILT
May 2024
$17.6M ($536/SF) 93%
61 Months
32,850 SF 1988
BUYER
BROKER SELLER
BROKER
SALE TYPE
BH Group (USA) +2
Darrow Everett LLP
AEW Capital Management (USA) +1
JLL Investment
Corporate Park of Cypress Creek | Cypress Creek Submarket | Fort Lauderdale, FL 33309
SALE DATE
SALE PRICE
LEASED
HOLD PERIOD RBA YEAR BUILT
Aug 2024
$17.4M ($128/SF)
BUYER
Imperial Fund (USA)
Rise Realty
Citrix (USA)
SALE TYPE
SALE COND
Colliers Investment
Sale Leaseback,High Vacancy Property
150,000 SF Atlantic Village Corporate Center, a medical office property built in 2023 and 76% leased.
The market continues to see healthy demand for newer properties, with existing assets built since 2010 and properties underway being more than 90% leased, with more than 70% of available space concentrated in assets built since 2020 or currently underway. Over 60% of the space available in these properties is concentrated in four properties, with three located in the Hallandale area. These properties include over 179,000 SF available at T3 Fat Village, 145,000 SF available at The Onyx Tower, 60,000 SF at the Atlantic Village Professional Center, and more than 45,000 SF at HCA Florida University Medical Office and Hallandale City Center.
The latest development underway is the T3 FAT Village in Downtown Fort Lauderdale. The property, which totals over 380,000 SF of office space, is part of a development by Hines in partnership with Urban Street Development, Cresset Real Estate, and Las Americas. The site will include an additional 455,000 SF of retail and residential mixed-use in Flagler Village.
The modest supply pipeline should help buoy office fundamentals in the market. However, a continued flight to quality will likely result in weaker performance for 1 to 3 Star product in the next few years. Additionally, a rise in sublet space availability presents a near-term drag as this additional supply at lower asking rents is added to the market. Market participants have indicated rising interest in renovating existing office assets as landlords and investors are increasingly aware of tenant preferences for high-quality space. This could bring additional competitive supply over the coming years. That said, Fort Lauderdale’s vacancy and rent growth trends are expected to outperform the U.S. average as the supply/demand balance remains healthier than in many markets nationwide.


Available office space in Palm Beach has risen since the third quarter of 2022, with net absorption turning negative in 2023 and again in 2024. Despite the recent softening, longer-term trends in the market continue to indicate a preference for high-quality 4 & 5 Star office space located in the market’s CBD. In fact, over 50% of demand in Palm Beach has been concentrated in 4 & 5 Star assets since 2019, and over 60% of 4 & 5 Star demand has been concentrated within the CBD over the same time period.
Additionally, developers have been active in the 4 & 5 Star segment, adding over 1.7 million SF, or over 12% of existing inventory, since 2010, with over 80% having delivered since 2015. Still, this newer inventory is over 95% occupied. Currently, there is 590,000 SF of 4 & 5 Star office space under construction across four properties, with over 80% of the rentable area located in the West Palm Beach CBD. This is above the average SF in deliveries over the prior three years, though properties underway have an availability rate below 30%.
Office rents in Palm Beach are growing at a 3.0% annual rate during the fourth quarter of 2024, though gains have moderated, falling below the three-year average annual rent growth of 6.8%.
Gains have been driven by limited deliveries and healthy tenant demand in 2021 and 2022, which resulted in significant vacancy contraction in those years. Although vacancies have expanded recently to 8.4%, these remain below the 10-year average of 9.4% as of the fourth quarter of 2024.
SOURCE: COSTAR
Despite healthy occupancy, softer office-using job gains are slowing tenant demand. Still, the area’s lower cost of business and warm climate, coupled with an increasingly diversifying employment base, should help buoy long-term demand growth for 4 and 5-star properties, even with the structurallyweakened correlation between office-using labor growth and office leasing.
Transaction volume has moderated since 2023, with $471 million trading in the last twelve months, below the $1.0 billion traded on average in the last five years. Despite this near-term slowdown, the Palm Beach market remains attractive on a relative basis as vacancy rates, which remain well below the national average of 13.9% and positive rent gains, suggest the market may be somewhat insulated from future economic uncertainty when compared to its high-growth peer markets. Still, a near-term pullback in institutional buyer activity will likely continue through 2024 as rising vacancies, softer rent gains, and still-elevated interest rates impact value creation and investment decisions.


Office transaction volume in Palm Beach has slowed over the last 12 months, totaling $471 million, below the fiveyear average of $1.0 billion.
Since 2023, transaction activity has moderated, remaining below pre-pandemic levels. Despite this near-term slowdown, the market remains attractive on a relative basis, as vacancy rates that remain well below the national average suggest that Palm Beach may be insulated from future economic uncertainty when compared to its high-growth peer markets. This outperformance has allowed institutional players looking to shore up balance sheets or raise capital to return to investors to sell assets.
Still, like many other markets, the type of buyer has recently shifted. Private buyers have made up over 74% of trades in the last 12 months, up from 67% over the prior five years, as institutional and private equity players sit on the sidelines. Additionally, owner-user purchases have become more common, making up 16% of buyer activity, up from 5% in the prior five years. Despite fewer institutional players resulting in smaller transaction sizes, two large deals for more than $30 million each have occurred in the last 12 months.
The largest deal this year involves the purchase of 1 Town Center Rd by Gatsby Enterprises from Prime US REIT for $82 million or over $428/SF at an 8% cap rate in July.
The ten-story, 191,000 SF property, built in 1990, was over 98% leased at sale. The seller was motivated to sell the asset as part of its deleveraging strategy, allowing the REIT to access liquidity to pare down existing debt, manage interest costs, and provide for capital expenditures.
Despite some value gains and lower cap rates in certain deals, higher rates generally drive an expansion in the
market’s office cap rates. Well-leased office buildings, with more than 80% of space occupied, have seen cap rates rise from the mid-5% to mid-6% range in 2021/2022 to above 7% in the last year. Apart from higher cap rates, slower volume will continue over the coming quarters.
Although a slowing economy and elevated interest rates are resulting in a near-term pricing correction and lower transaction activity, the Palm Beach office is expected to outperform nationally. Palm Beach is one of a handful of U.S. markets with expected office value gains through 2024 relative to 2019 values, largely driven by an expectation of moderating yet still positive rental gains.
Office construction activity in Palm Beach remains elevated, totaling 760,000 SF relative to the 10-year historical average of 750,000 SF. Despite the elevated construction pipeline, starts have begun to slow, totaling over 96,000 SF in 2023 and 113,000 SF in 2024, down from
One Town Center | Boca Raton West Submarket | Boca Raton, FL 33486
SALE DATE
SALE PRICE
CAP RATE
LEASED
HOLD PERIOD
RBA
YEAR BUILT
Jul 2024
$82M ($319/SF)
8.0% (Actual) 99%
36 Months
257,030 SF 1990
BUYER SELLER BROKER
SALE TYPE
Gatsby Enterprises (USA)
Prime US REIT (SGP)
Prime US REIT Investment
Delray Beach Submarket | Delray Beach, FL 33483
SALE DATE
SALE PRICE
LEASED
HOLD PERIOD
RBA YEAR BUILT
Jul 2024
$37.5M ($381/SF) 93%
78 Months
98,404 SF 2018
BUYER
SELLER
BROKER
SALE TYPE
SALE COND
Samuels & Associates Ma... (USA)
Samuels & Associates Ma... (USA) JLL Investment Recapitalization
West Palm Beach CBD Submarket | West Palm Beach, FL 33407
SALE DATE
SALE PRICE
LEASED
HOLD PERIOD
RBA
YEAR BUILT
Dec 2023
$25M ($250/SF) 75%
61 Months
100,000 SF 1986 (Renov 2007)
BUYER SELLER SALE TYPE
Accesso Partners (USA) +1 Alchemy ABR Investment... (USA) +1 Investment
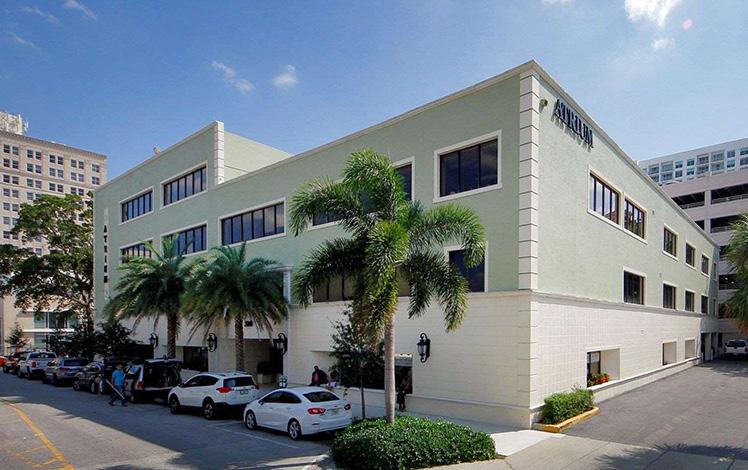
West Palm Beach CBD Submarket | West Palm Beach, FL 33401
SALE DATE
SALE PRICE
LEASED
HOLD PERIOD
RBA
YEAR BUILT
Jan 2024
$33M ($480/SF)
100%
29 Months
68,811 SF 1950 (Renov 2016)
BUYER
SELLER
SALE TYPE
SALE COND
New York University (USA) Morning Calm Management (USA) Investment Redevelopment Project
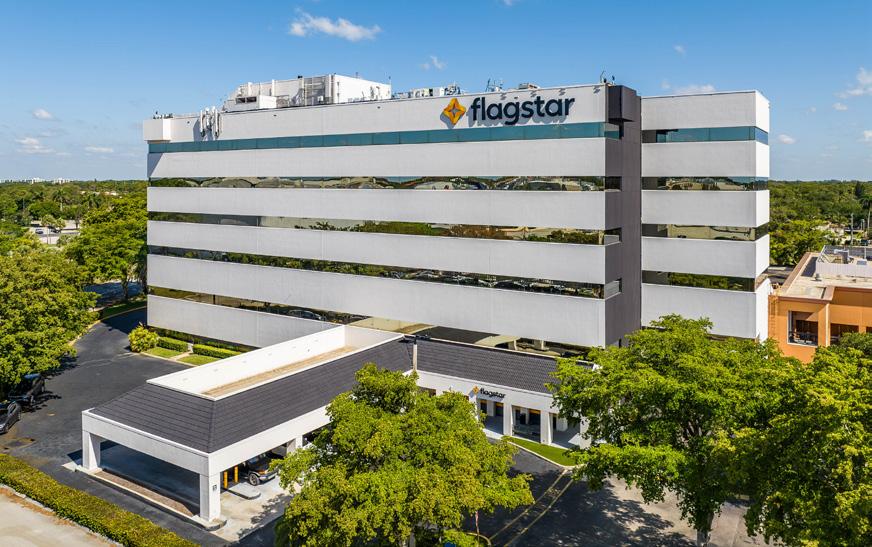
Boca Raton West Submarket | Boca Raton, FL 33431
SALE DATE
SALE PRICE
LEASED
HOLD PERIOD
RBA
YEAR BUILT
Sep 2024
$32M ($387/SF)
88%
20+ Years
82,742 SF 1980 (Renov 1996)
BUYER BROKER SELLER
BROKER
SALE TYPE
Schmier Property Group (USA) Flagship Partners Karl Corporation (USA) Flagship Partners Investment
the over 539,000 SF that broke ground in 2022. Delivery of new supply is expected to remain elevated through 2025, but should then begin to wind down by 2026 as elevated interest rates and softening fundamentals impact developer activity.
Still, inventory additions are expected to peak in 2024 and 2025, totaling over 344,000 SF in each year. Since 2021, net delivery of new supply has remained well above the 10-year historical average of around 77,000 SF annually, with the exception of 2023 which saw no new net deliveries.
Virtually all supply additions since 2010 have been composed of 4 & 5 Star properties, with 77% concentrated in the North Palm Beach, West Palm Beach, Delray Beach, and Boca Raton submarkets. Existing assets built since 2010 and properties underway are over 95% leased, with more than 80% of available space concentrated in assets built since 2020 or currently underway. The bulk of available space in these newer properties is concentrated in two properties under construction, with over 40,000 SF available at One Flagler and over 20,000 SF at One West Palm. Both 4-star properties are expected to deliver by 2024 in the West Palm Beach Submarket.
Near-term supply additions will expand 4 & 5 Star vacancies as these projects lease up over the next few years, while the continued flight to quality results in weaker performance for 1 to 3 Star product. Additionally, a rise in sublet space availability presents a near-term drag as this additional supply at lower asking rents is added to the market. Also, market participants have indicated rising interest in renovating existing office assets as landlords and investors are increasingly aware of tenant preferences for high-quality space. This could bring additional competitive supply over the coming years. That said, Palm Beach vacancy and rent growth trends are expected to outperform the U.S. average, as the supply/demand balance remains healthier here than in many markets across the country.