MARKET REPORT
SOUTH FLORIDA | INDUSTRIAL


ONE Commercial Real Estate is driven by a commitment to be a change agent for clients and industry professionals. Founded by Daniel de la Vega, the President of ONE Sotheby’s International Realty, we offer superior results to owners, occupiers, and developers of commercial real estate by obtaining and sharing intelligence as well as applying our knowledge, experience, competence and technical skills.
Our team members have experienced several cycles that have taught valuable lessons. We have decades of on-the-ground experience and market knowledge in South Florida advising clients in all aspects of commercial real estate. We provide the insight necessary to lead informed and efficient decision making.
The commercial real estate landscape has changed. Florida is impacted by global economic and political events more than most. Capital is forming new markets, redefining old ones, and continues to shape the fabric of our ever-growing landscape. Understanding these changes allows us to continue serving our clients and communities. By embracing the data and analytics we can identify movements, address obstacles, forecast challenges, and secure a vision for the future
This edition of the ONE Commercial Market Report examines the industrial market in Miami- Dade, Broward, and Palm Beach counties.

Daniel de la Vega Chief Executive Officer ONE Commercial Real Estate

& HIGH DEMAND FOR LOGISTICS SPACE CONTINUES TO OUTPACE SUPPLY
Miami’s trailing 12-month industrial net absorption has slowed significantly to 690,000 SF, well below the pre-pandemic five-year average of 3.1 million SF. Construction, warehousing and storage, transportation and facilities maintenance tenants, including UFP Industries, Essendant, Kuehne+Nagel, USPS and Imperial Dade all vacated spaces of over 100,000 SF in the last few quarters, driving up the market-wide vacancy rate from a 2022 low of 2.0% in 2022 to 5.1% as of the fourth quarter of 2024. Even amid a slower economic environment weighing on lease volume, there is still limited availability of existing space, with vacancies remaining below the U.S. average of 6.8%.
Despite 4.1 million SF underway, modern logistics space is still scarce in Miami. Properties built from 2015 through 2023 are around 96% leased locally compared to 91% at the national level. Miami’s tight market conditions have given landlords enough bargaining power to increase rents by 33.5% over the last three years, compared to national increases of 21.7% in the same period. That said, annual rent gains have begun to moderate, slowing to 2.5% over the past 12 months, below U.S. average growth of 2.7%. Slowing tenant demand and rising vacancies since 2023 have resulted in moderating rent growth from peak levels of 17% year-over-year recorded in the second quarter of 2022. Further deceleration is likely in 2025 as higher interest rates weigh on economic growth.
South Florida is the ninth-largest U.S. MSA in terms of population, and Miami’s industrial market remains a critical logistics hub for tenants serving the region’s

SOURCE: COSTAR
6.1 million residents. Miami International Airport also has the highest amount of international shipping in the U.S. and ranks fourth overall in cargo traffic. The port of Miami is the 11th-largest containerized port in the U.S. and is dredged to allow the new Super Post Panamax mega-ships to enter. These international ties also attract importers and exporters to the market, contributing additional demand aside from local players.
The Everglades provides a clear barrier to new development. As a result, Miami’s industrial stock has grown slower than the U.S. average and at around half the pace of similar-sized markets since 2015. These supply constraints have kept vacancies well below the U.S. average for decades. Miami’s vacancy rate should remain relatively low in the years ahead, helping rent growth to reaccelerate in 2026 when fewer new developments are on track to complete construction.
Rising interest rates have abruptly driven sales volume back in line with pre-pandemic levels since 2023. However, unlike in most major U.S. markets, sales activity accelerated here late last year as major buyers, including Ares Industrial Realty, Corebridge Financial, TA Realty, and Longpoint Realty Partners have all closed acquisitions larger than $25 million since.


Miami remains favored among investors, although rising interest rates have driven sales volume back in line with pre-pandemic levels, totaling $1.6 billion over the past 12 months, in-line with the five-year average of $1.8 billion. 2024 has only seen four major deals of over $40 million each, down from an annual average of eight of these deals in the prior three years.
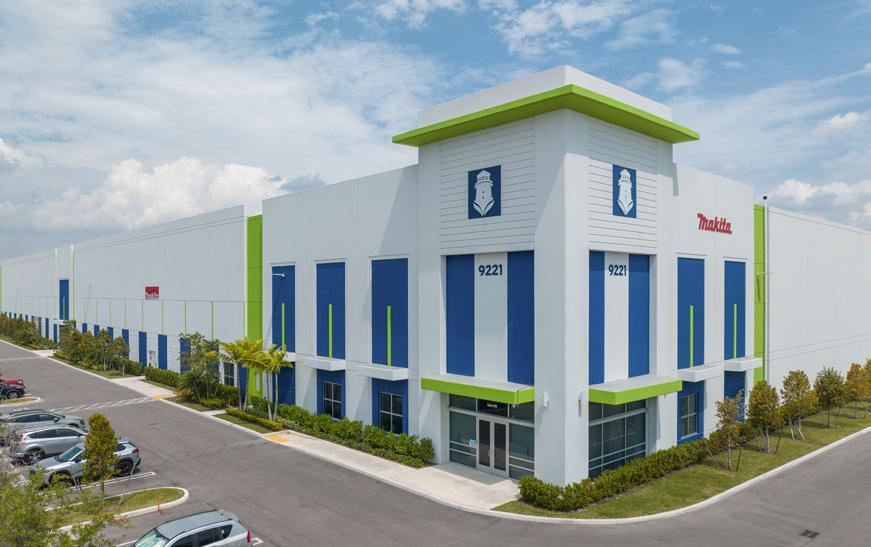
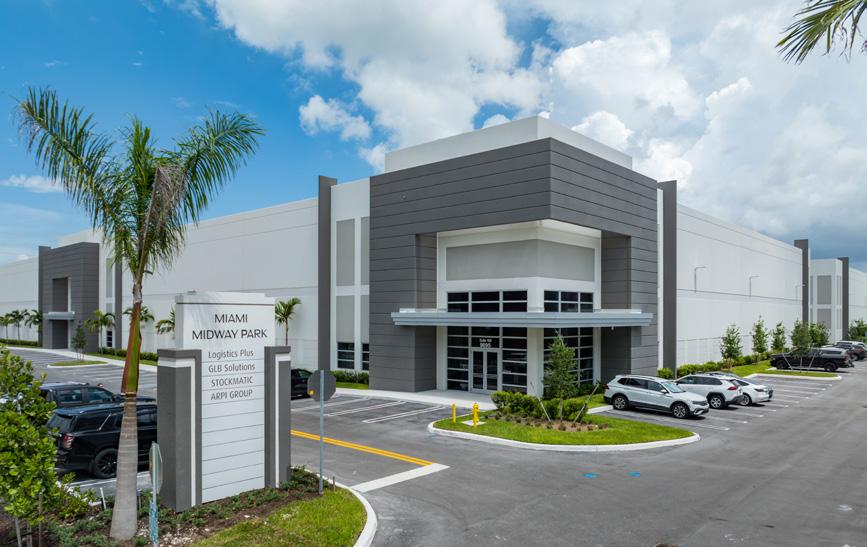
A major portfolio trade transacted in October with Ares Industrial Real Estate Income Trust purchasing four properties at Miami Midway Park for $147 million or over $290/SF. The properties, located in Hialeah, total over 500,000 SF and were built between 2023 and 2024. They are over 70% leased. The developer, Butters Realty and Greystar Real Estate Partners sold the portfolio, indicating continued institutional investor demand for newer/larger assets in the market that have seen healthy lease-up.
The largest individual deal involved Property Reserve purchasing the 232,000 SF Building C at Beacon Logistics Park for over $55 million or $240/SF from Codina Partners. Despite the 2024-built property remaining vacant, most of Property Reserve’s recent activity has centered on fully leased properties with stable cash flows, having purchased four fully leased buildings at the same Logistics Park in December of 2023 for $174 million, or over $277/SF. The buyer typically makes long-term investments and despite this latest sale indicating a 14% discount for the vacant property, Property Reserve’s
continued activity here is indicative of Miami’s long-term potential despite near-term lease-up risks.
Additionally, Miami-Dade County has purchased property to prepare for future airport expansions. The fully leased 198,000 SF warehouse property at 2800 NW 39th Ave was purchased from a private owner for $45 million or $226/ SF. The county remains active around airport development,
recently approving $400 million for a cargo facility that will increase the airport’s cargo capacity by 50%.
A rise in owner-user transactions is also apparent, composing over 40% of trades, up from 25% on average over the last five years. Of note is Parker Davis HVAC International’s purchase of a 143,000 SF warehouse in the Miami Airport. The 2024-built property was purchased from Grandview Partners for $42 million or $295/SF and will be used by the buyer for business purposes.
Cap rates have risen in the last year, mainly due to rising interest rates. Properties larger than 20,000 SF have seen cap rates rise from the mid-4% range in 2022 to over 6% today. Two recent trades highlight this rise, including the December purchase of the Palmetto Industrial Park by East Capital Partners for $196/SF, at a 6.5% cap rate. The property last traded in 2017 for $79/SF, indicating strong long-term pricing appreciation despite the recent softening in cap rates. The second large trade involved the Lakes Edge Innovation Center in Doral. The flex property, with 80,000 SF, traded for $218/SF at a 6% cap rate in December.
Outlying Miami-Dade Submarket | Hialeah, FL 33018
SALE DATE
SALE PRICE
LEASED
HOLD PERIOD RBA YEAR BUILT
Dec 2023
$113M ($362/SF) 100% 11 Month
312,103 SF 2023
BUYER SELLER SALE TYPE
Ponte Gadea USA, Inc. (USA) Bridge Industrial (USA) +1 Investment
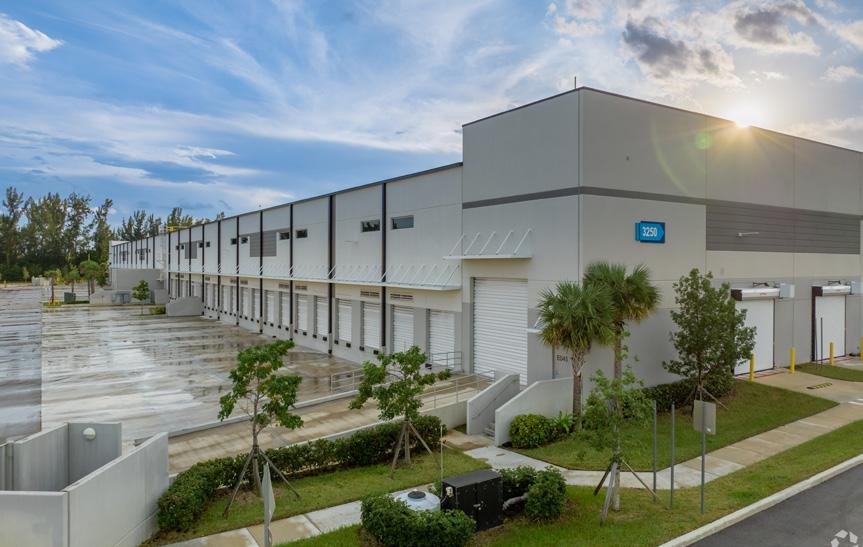
Beacon Logistics Park | Outlying Miami-Dade Submarket | Hialeah, FL 33018
SALE DATE
SALE PRICE LEASED HOLD PERIOD RBA YEAR BUILT
Dec 2023
$59.2M ($288/SF)
Months
205,250 SF 2023
TYPE Property Reserve, Inc. (USA) Affinius Capital LLC (USA) +1 Investment
Beacon Logistics Park | Outlying Miami-Dade Submarket | Hialeah, FL 33018
SALE DATE
SALE PRICE LEASED HOLD PERIOD RBA YEAR
$55.9M ($240/SF
Months 232,620 SF 2024
Outlying Miami-Dade Submarket | Hialeah, FL 33018
SALE DATE
SALE PRICE LEASED HOLD PERIOD RBA
$50.7M ($280/SF)
SF 2024
Miami Midway Park | Outlying Miami-Dade Submarket | Hialeah, FL 33018
SALE DATE
SALE PRICE LEASED HOLD PERIOD RBA
Oct 2024
$48.7M ($269/SF) 100%
21 Months
181,051 SF 2023
SOURCE: COSTAR
Construction has moderated after elevated levels in 2022; still, over 4.1 million SF are underway as of the fourth quarter of 2024, coming below the 10-year average of 5.2 million SF. As starts slow, new deliveries are expected to peak in 2024, pulling back significantly by 2025 and allowing vacancies to remain tight thereafter
Near-term supply risks remain concentrated in certain geographies and within the larger size segments. Around 90% of new construction is concentrated in the northwest part of Miami and between the Palmetto Expressway and the Everglades, as these areas provide some of the lowest-cost developable land parcels available. Submarkets with the bulk of construction include Outlying MiamiDade, Miami Airport, Medley, and North Miami Beach.
Over 70% of buildings underway are larger than 100,000 SF, with four properties larger than 300,000 SF. These larger properties have not seen any pre-leasing, a shift from the pandemic-era trend during which several larger properties leased up quickly before reaching delivery. Only two out of the 20 properties under construction, with more than 100,000 SF, have secured tenants so far.
Properties in the 150K to 300K SF size range are of particular concern, as these represent the bulk of new construction and are taking longer to lease. Of note is Northwest Dade Logistics Center II, which has two properties within this size range that were delivered in 2023 and have remained vacant for two years.
Although large product has around two to three years of supply availability, market participants have indicated that the institutional background of most of South Florida’s large-block developers means they can afford to wait for the right tenant. Rather than dropping rent, landlords are offering a couple months of free rent and tenant improvement allowances.
In contrast to larger spaces, properties demised into smaller tenant spaces, have seen faster lease-ups, taking less than 10 months to lease on average, relative to single-tenant properties, which take a year or more. Additionally, multi-tenant properties with less than 100,000 SF continue to see tighter availability rates as most tenants, around 90%, typically look for blocks of space of less than 50,000 SF
Going forward, the growing inventory of newer and larger industrial space will continue to result in a more pronounced supply/demand imbalance for this market segment. On the flip side, newer small bay space is expected to see more muted growth, limiting supply risks for smaller properties. That said, the South Florida logistics market remains relatively healthy, with tight vacancies and some of the highest average rent gains across the country.

BROWARD INDUSTRIAL SHOWS STRENGTH:
LIMITED SUPPLY AND STRATEGIC LOCATION
SUPPORT RESILIENCE
Fort Lauderdale’s trailing 12-month industrial net absorption has slowed to -280,000 SF, down from elevated levels of 4.7 million SF reached during mid2022. A rise in sublease space at Miramar Centre Business Park and 2750 Bridge Way along with direct space at 800-900 International Pky, driven by tenant move-outs from transportation and warehousing companies, have resulted in rising vacancies from a low of 3.2% in 2022 to 4.8% as of the fourth quarter of 2024. Despite a slower economic environment weighing on lease volume, there is still limited availability of existing space, with vacancies remaining well below the U.S. average of 6.8%.
Due to access to the large population pool of South Florida, the ninth-largest U.S. MSA in terms of population, the Fort Lauderdale industrial market remains a critical logistics hub. South Florida is also a gateway market to the rest of the world; as a result, Port Everglades is the third-largest containerized port in Florida based on total import and export TEUs as of 2022. Healthy tenant demand from 3PLs and small businesses serving the local population, coupled with the limited availability of new industrial space, is expected to keep market vacancies below 5% in the near term.
Modern logistics space is scarce in Fort Lauderdale, and with only 410,000 SF underway, the area continues to see limited new supply, as this figure remains below the five-year average for under-construction space of 1.5 million SF. Supply additions have done little to impact vacancies, with available space in properties

SOURCE: COSTAR
built since 2015 dropping to half of the levels seen in 2020 and standing at around 1.9 million SF.
Fort Lauderdale’s tight market conditions have provided landlords with enough bargaining power to increase rents by 3.0% over the past 12 months. Although gains have slowed, the market has seen the fifth-highest increase in asking rents in the nation since 2019, providing for significant lease renewal upside for existing properties, specifically within smaller space-size segments.
Annual sales volume totals $802 million, below five-year average volume and long-term average annual volume of $933 million over the past 10 years. Pricing has also begun to adjust, with fully leased distribution centers built since 2010 and larger than 50,000 SF trading at average pricing of $188/SF since the second half of 2023, compared to $248/ SF when interest rates were near record lows in 2021/2022. However, unlike in most major U.S. markets, sales activity accelerated here in the last two quarters as major buyers, including Tishman Speyer, Longpoint Realty Partners, and Sterling Investors, have closed acquisitions larger than $20 million recently.


Last year’s sales volume abruptly came back down in line with pre-pandemic levels after a historic boom in 2021-22. Sales volume over the last twelve months totals $802 million, below five-year average volume and long-term average annual volume of $933 million over the past 10 years.
While large trades have slowed, some institutional players have entered the market since late 2023. In June, IDI Logistics sold Rock Lake Business Center, which includes two industrial buildings totaling 256,000 SF, and two additional parcels with proposed industrial buildings totaling up to 243,000 SF to Tishman Speyer for over $100 million. The existing properties were delivered in 2019 with 32’ clear heights and can reach over 80% of South Florida’s population within a 60-minute drive. Tishman is a recent entrant to the industrial market, purchasing assets in some of the most sought-after markets in the U.S., including Orange County, Boston, and San Francisco. Its South Florida acquisition points to the long-term strength of the area.
Large portfolio trades continue to highlight institutional investor demand for South Florida industrial properties. These include Longpoint Partners’ December acquisition of a 25-building industrial portfolio totaling around 1.4 million SF across Miami-Dade and Broward Counties. The portfolio comprised 2 and 3-star properties of between 11,000 SF and 213,000 SF and traded for $188/SF. It was 97% leased at sale.
Additionally, owner-user sales have also driven volume this year, with Cabot Properties selling a 201,000 SF industrial building to Chick-fil-A for over $50 million or over $250/ SF in an owner-user acquisition in February. The property, which was vacant, was delivered in 1995 and offers 22 docks, a 24,000 SF two-story office space, 38,000 SF of freezer/ cooler space, a 30’ clear height, and 139,840 SF of dry warehouse space.
One of the largest individual trades of 2023, which provides some pricing insight, involved the sale of The Pompano Distribution Center II at 4000 N Dixie Hwy. The property, built in 2015, totals over 128,000 SF and traded for over $24 million, or over $188/SF. Sterling Investors purchased the property in August from Zurich Alternative Asset
Management and was 100% leased to the Spice Lab, a manufacturing tenant, at the time of sale.
Although low cap rates were still recorded in 2023, including the 3.6% cap rate on Link Logistics’ purchase of a sevenproperty portfolio, a general rise in cap rates has driven a moderation in pricing. Rising cap rates are more apparent among individual sales of properties smaller than 30,000 SF, as many deals in this category have closed with reported cap rates in the range of 5-8% since the second half of 2023.
Construction activity has slowed in the past few years, with only around 410,000 SF underway as of the fourth quarter of 2024. This is down from a peak in construction activity seen in the first half of 2020, when there was more than 3.4 million SF underway. Construction starts pulled back significantly in 2023, with around 385,000 SF breaking ground for the year, well below levels of over 1 million SF seen in each of the prior six years. A slower economic environment, coupled with elevated financing costs, will likely keep construction activity muted in the near future. Fewer groundbreakings will result in a slowdown in deliveries, which are set to remain at or below 800,000 SF over the next several years, allowing vacancies to remain tight for the foreseeable future.
Close to 80% of industrial properties with more than 100,000 SF are located in the Southwest Broward, Pompano Beach,
SOURCE: COSTAR
Rock Lake Business Center | Pompano Beach Submarket
Pompano Beach, FL 33069
SALE DATE
SALE PRICE LEASED
Jun 2024
$62.9M ($462/SF) 100%
HOLD PERIOD RBA YEAR BUILT BUYER
SALE TYPE
43 Months
136,032 SF 2019
Tishman Speyer (USA) IDI Logistics (USA) Investment
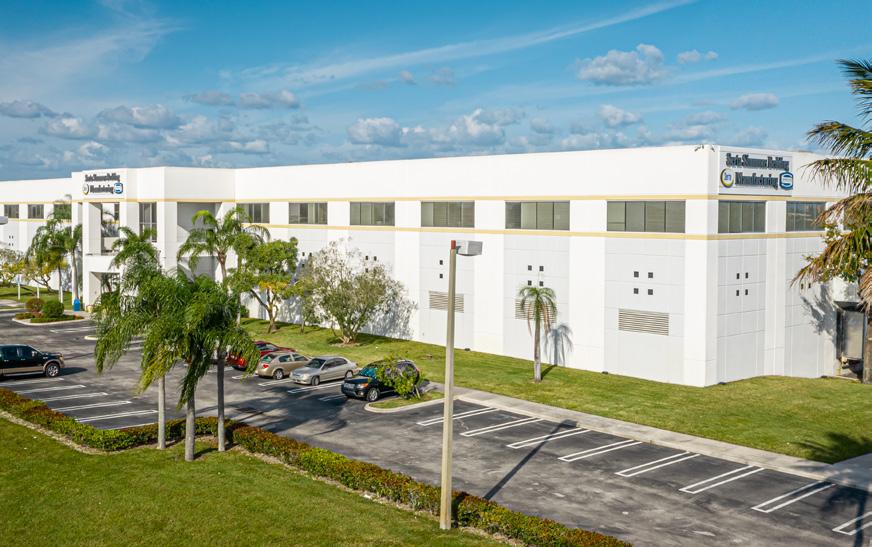
Meridian Business Campus | Southw.. Broward Submarket | Weston, FL 33331
SALE DATE
SALE PRICE LEASED HOLD PERIOD RBA YEAR BUILT
Feb 2024
$50.5M ($250/SF) 0%
59 Months
201,845 SF 1995
SALE TYPE
Chick-Fil-A, Inc. (USA)
CBRE
Cabot Properties Inc (USA)
CBRE Owner User
Parkway Commerce Center | Central Broward Submarket | Fort L..., FL 33311
SALE DATE
SALE PRICE
LEASED
HOLD PERIOD RBA
YEAR BUILT
Dec 2023
$47.1M ($3.2K/SF) 100%
20+ Years 14,628 SF 1988
BUYER SELLER BROKER
SALE TYPE
SALE COND
Longpoint Realty Partners (USA)
Seagis Property Group LP (USA)
CBRE
Investment
Bulk/Portfolio Sale
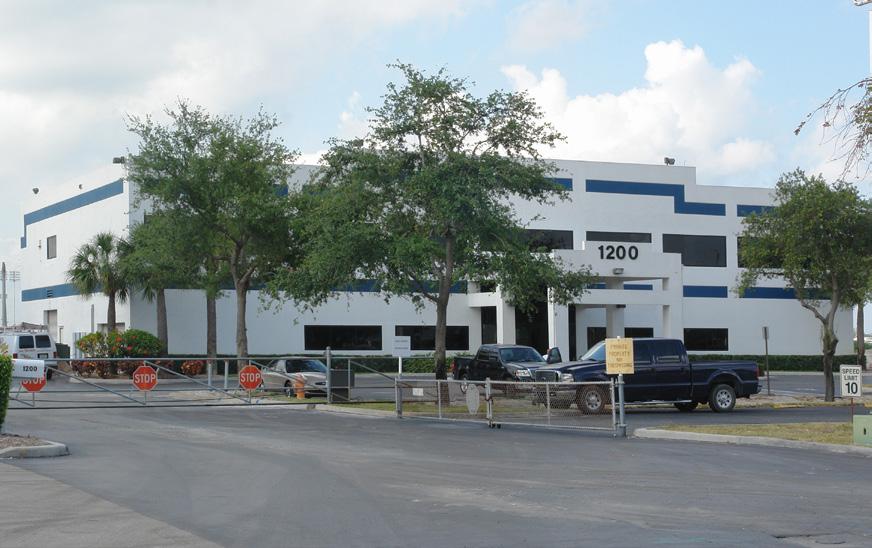
Rock Lake Business Center | Pompano Beach Submarket
Pompano Beach, FL 33069
SALE DATE
SALE PRICE
LEASED
HOLD PERIOD RBA
YEAR BUILT
1200-1400
Jul 2024
$37.3M ($311/SF) 100%
43 Months
119,968 SF 2019
Fort Lauderdale, FL 33309
SALE DATE SALE PRICE
Sep 2024
$25.2M ($472/SF) 100% 20+ Years
53,402 SF 1994 (Renov 2022)
BUYER SELLER
SALE TYPE
Tishman Speyer (USA)
IDI Logistics (USA) Investment
Valuetainment (USA)
Tom & Kimberly Gonzales (USA)
Avison Young Investment Bankruptcy Sale
Southeast, and Northeast Broward submarkets. The majority of these properties are located in the Southwest Broward Submarket, which runs from the Turnpike to the east to U.S. Highway 27 in the west, bordering the Everglades. New supply remains attractive in the market, as around 70% of these assets were built before 2010, resulting in a weighted average year built of around 2000.
Construction activity is concentrated in three buildings located in Pompano Beach and Southeast Broward. The largest property underway is located in Southeast Broward and totals over 226,000 SF at the Davie Industrial Center which remains vacant and is set to deliver in 2025.
The availability rate for new construction has fallen in the past few quarters as the largest and most recent deliveries at Osprey Logistics Park and 5601 N Hiatus Road attracted sizable tenants. Still, recently delivered properties and those underway with more than 100,000 SF have an availability rate of over 20%, representing over 1.4 million SF of available space. These new larger spaces will take longer to lease, as large tenant demand has slowed, though muted supply additions, coupled with tight vacancy rates of around 5% for existing assets larger than 100,000 SF, point to limited competitive supply, which should help leasing prospects going forward.


Palm Beach’s trailing 12-month industrial net absorption has slowed to 370,000 SF, down from elevated levels of 2.2 million SF during early 2022. Small tenant move-outs, 70% occupying spaces of less than 20,000 SF, drove the slowdown since the second half of 2023, resulting in rising vacancies from a low of 2.5% in 2022 to 6.3% as of the fourth quarter of 2024. Despite a slower economic environment weighing on lease volume, there is still limited availability of existing space, with vacancies remaining below the U.S. average of 6.8%.
Palm Beach’s tight market conditions have provided landlords with enough bargaining power to increase rents by 4.5% over the past year, above U.S. average gains of 2.7%. Despite recent gains, slowing demand and rising vacancies since 2023 have resulted in a moderation in rent gains from peak levels of around 12% year-over-year recorded in 2022. Further deceleration is likely in 2024 as higher interest rates weigh on economic growth.
Modern logistics space is scarce in Palm Beach, with 10% of inventory being built since 2010 versus 23% on average across the U.S. However, with 960,000 SF underway, the area continues to see some supply, though this is down from the average annual underconstruction square footage of 1.4 million over the last five years. Recent supply additions have also impacted vacancies, with over 2.2 million SF of space available in properties built since 2020. Further deliveries through 2024 will drag on vacancy, as 80% of space remains available in properties underway. Despite this recent
SOURCE: COSTAR
rise, vacancies are expected to remain at or below 6% and below the U.S. average over the near-term forecast.
The Palm Beach industrial market remains a critical logistics hub as it provides access to the large population pool in South Florida, the ninth-largest U.S. metropolitan statistical area in terms of population. Despite ranking fourth after Jaxport, PortMiami, and Port Everglades in containerized cargo, the port of Palm Beach provides significant infrastructure for businesses. The rise of buying power in Palm Beach and a lack of available space in Fort Lauderdale and Miami should continue to help drive businesses northward into the market.
Rising interest rates have driven sales volume abruptly back down in line with pre-pandemic levels after a historic boom in 2021-22. Annual sales volume totals $457 million, above longterm average annual volume of $425 million over the past 10 years. Additionally, despite an interest rate-driven cap rate expansion, a limited supply of space and healthy demand should continue to result in rent growth and value outperformance relative to other U.S. markets with more significant imbalances between demand and supply. This relative outperformance and eventual loosening of financial conditions should help attract continued investment going forward.

Rising interest rates have driven sales volume abruptly back down in line with pre-pandemic levels after a historic boom in 2021-22. Annual sales volume totals $457 million, above long-term average annual volume of $425 million over the past 10 years. Fewer institutional buyers have been active over the past year, with private players making up over 70% of transaction activity, up from 50% on average over the prior five years, resulting in smaller transactions.
Still, some large transactions have occurred since 2023. In April of this year, Dallas-based Hillwood Development Corporation purchased a one-millionsquare-foot distribution center leased by Amazon for over $106 million or more than $106/SF from Truist Securities. The property, located in Jupiter, was built in 2021 and continues to highlight investor interest in modern distribution space.
A portfolio deal transacted in June is also driving volume in 2024 with Dalfen Industrial selling three industrial buildings to LBA Realty. One of the buildings in Riviera Beach totals 225,000 SF and sold for $55 million or over $244/SF. The other two buildings sold for an undisclosed price in Mesquite, TX. All three buildings were occupied by single tenants.
Another institutional deal also drove sales volume in the second half of 2023, with Arden Group, a private REIT, purchasing the Landmark Commerce Center for $43 million or $219/SF in October of 2023. The three properties in the center total over 195,000 SF and were 98% leased at sale to over 40 tenants, indicating additional investor interest in fully leased incomeproducing properties over the last year. Arden stated that the acquisition continues the ALP strategy of buying well-located assets with strong occupancy rates.
Rising cap rates are the overarching trend, with average annual transaction cap rates rising from the mid-4%
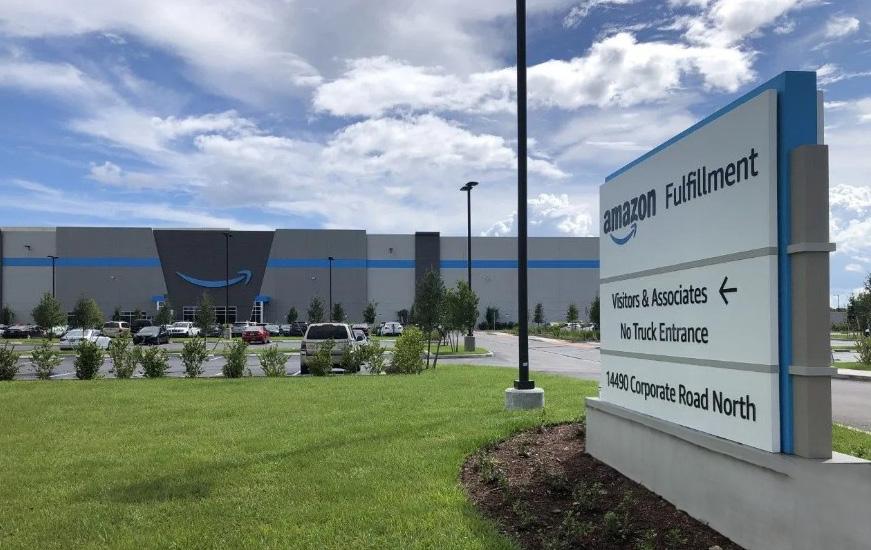
Palm Bch Cty Outlying Submarket | Jupiter, FL 33478
SALE DATE
SALE PRICE
PERIOD
BUILT
Apr 2024
$106.5M ($106/SF)
BUYER
Hillwood Investment Prop... (USA)
Truist Securities, Inc. (USA)
Eastdil Secured, LLC
SALE TYPE
Investment
Central Palm Bch Area Submarket | Riviera Beach, FL 33404
SALE DATE
SALE PRICE
PERIOD
Jun 2024
$55M ($244/SF)
LBA Realty (USA)
Dalfen Industrial (USA)
Eastdil Secured, LLC
Investment
Bulk/Portfolio Sale
701 PARK OF COMMERCE BLVD • 701 PARK OF COMMERCE
The Park at Broken Sound • Boca Raton, FL 33487
SALE DATE
SALE PRICE
PERIOD
BUILT
Jul 2024
$18.7M ($240/SF)
Fit Ventures (USA)
LRM Commercial Real Estate
Advisors Darielle Singerman (USA)
Douglas Elliman
Owner User
Sale Leaseback
Boynton Logistics Center | Boynton Beach Submarket | Boynton Beach, FL 33426
SALE DATE
SALE PRICE LEASED
PERIOD
Investment Apr 2024
$15.4M ($170/SF) 90% 51 Months 90,643 SF 2000 (Renov 2017)
Kovitz Investment Group (USA) +1
Elion Partners (USA)
Cushman & Wakefield
SALE TYPE
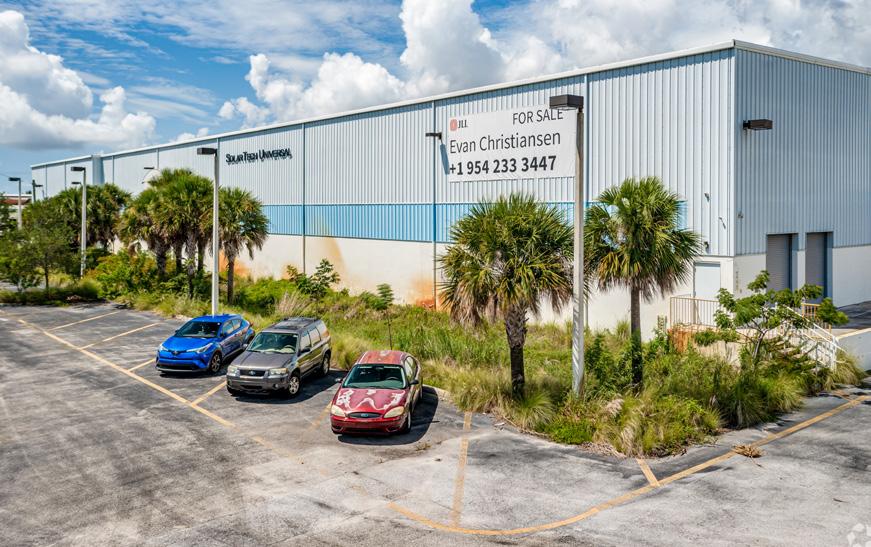
Lewis Terminals | Lewis Terminals Submarket | Riviera Beach, FL 33404
SALE DATE
IPX 1031 (USA)
$12.4M ($167/SF)
1031 Exchange,High Vacancy Property Apr 2024
SALE TYPE
SALE COND
Douglas Elliman
Solar Tech Realty of Rivie... (USA)
Marcus & Millichap
Investment
SOURCE: COSTAR
range in early 2022 to the mid-5% to 6% since the second half of 2023.
Despite the market’s recent outperformance, a slowing economy and elevated interest rates have resulted in a nearterm pricing correction relative to the boom in 2021 and 2022. Going forward, higher cap rates, coupled with softening fundamentals, will drag on market activity, at least until an eventual loosening of financial conditions occurs.
Construction activity has increased since 2021, though it has recently tempered, with around 960,000 SF underway as of the fourth quarter of 2024. Construction starts jumped in the first quarter of 2023, with over 1.3 million SF breaking ground in the quarter, in comparison to the prior peak in construction starts totaling just over 1 million SF in the fourth quarter of 2020. Starts have remained elevated, with an additional 1.2 million SF breaking ground since the second quarter of 2023.
As starts have remained elevated, deliveries are expected to peak over the next year, with around 2 million SF expected to be delivered in 2024 and a further 600,000 SF in 2025, after 1.5 million SF in deliveries in 2023. This will result in a near-term expansion in vacancies, which are expected to peak at over 7% but should remain below the U.S. average. Still, supply pressures will likely remain in the market, with the vacancy rate unlikely to reach recent historic lows for some time.
More than 80% of space remains available in properties underway, as more than 90% of the rentable building area under construction is concentrated in larger assets with more than 100,000 SF. This presents some near-term supply risk, as the vast majority of leases typically fall within 30,000 SF or less. That said, existing properties with more than 100,000 SF are over 85% occupied in Palm Beach, and those built since 2020 are over 65% occupied.