MARKET REPORT


ONE Commercial Real Estate was born from a commitment to be a change agent for clients and industry professionals. Founded by Daniel de la Vega, the President of ONE Sotheby’s International Realty, we offer superior results to owners, occupiers, and developers of commercial real estate by obtaining and sharing intelligence as well as applying our knowledge, experience, competence and technical skills.
Our team members have experienced several cycles that have taught valuable lessons. We have decades of on-the-ground experience and market knowledge in South Florida advising clients in all aspects of commercial real estate. We provide the insight necessary to lead informed and efficient decision making.
The commercial real estate landscape has changed. Florida is impacted by global economic and political events more than most. Capital is forming new markets, redefining old ones, and continues to shape the fabric of our ever-growing landscape. Understanding these changes allows us to continue serving our clients and communities. By embracing the data and analytics we can identify movements, address obstacles, forecast challenges, and secure a vision for the future.
This edition of the ONE Commercial Market Report examines the office market in Miami- Dade, Broward, and Palm Beach counties.

Daniel de la Vega
Chief Executive Officer ONE Commercial Real Estate

DESPITE CHALLENGES, MIAMI OFFICE MARKET THRIVES WITH STRONG DEMAND AND LIMITED SUPPLY, DRIVING RENT GROWTH ABOVE NATIONAL AVERAGE
With a pro-business atmosphere, an increasingly skilled workforce, and strong employment growth, Miami has been one of the few office markets in the country with healthy post-pandemic demand through 2024. In fact, since 2019, Miami has had the second-highest expansion in office demand out of the largest 54 markets in the country. That said, the market is not immune to macro headwinds, with slowing office-using job gains dampening leasing activity in the last few quarters. Going forward, while newer and higherquality space remains in vogue, older suburban office inventory remains at risk as tenants continue to downsize with insufficient demand to back-fill vacated space.
Despite national trends of tenants rightsizing footprints to match peak attendance, net absorption in Miami has remained positive over the past 12 months. However, it has slowed substantially, totaling 250,000 SF, well below the average between 2015 and 2019 of over one million SF. A slowing hiring environment is driving a slowdown in demand, resulting in slowing rent gains. Still, office asking rents in Miami are rising at 5.6% annually during the third quarter of 2024, above national gains of 1.1%.
The metro’s impressive demand formation has benefitted downtown. New developments in the corridor offer tenants the amenitized, high-quality space sought-after in the post-pandemic working world. Diversification of the metro’s economic base has also been an important demand driver,

SOURCE: COSTAR
with growth in the professional and business services and healthcare sectors, particularly. Additionally, Miami’s proximity to Latin America makes it a hub for international trade and finance, further fueling office demand.
On the supply side, 3.4 million SF are underway, the most in a decade, with 70% concentrated within a 3.5-mile radius of Downtown. Deliveries will remain elevated over the next two years, averaging 1.2 million SF annually, above the 10-year annual average of 603,000 SF. Despite rising supply, 60% of incoming inventory is concentrated in eight towers, which are over 60% pre-leased. Therefore, new space availability remains limited.
As we advance, rent growth should moderate as weaker demand, driven by softer office-using job gains, meets rising inventory. Despite this, the market’s attractiveness and the limited availability of quality space should drive an outperformance in rent gains compared to the national average. This is likely to buoy office values, with Miami among a handful of the nation’s largest markets with average office values forecasted to end 2024 above 2019 levels.

Although office values should outperform, higher interest rates have expanded average annual transaction cap rates from 2022 lows in the 5% range to the mid-6% range since 2023. This is resulting in a near-term pricing correction relative to peak pricing levels in 2022. Transaction activity has also cooled, with annual volume 50% below the 2022 peak.
Trailing 12-month volume has slowed to $1.1 billion through the third quarter of 2024, below the five-year average of $1.4 billion, as dry powder remains on the sidelines, awaiting lower prices. Despite this slowdown, Miami remains attractive on a relative basis, as healthy demand and limited supply drive a low vacancy rate, suggesting that the market is insulated from future economic uncertainty relative to its high-growth peers.
This outperformance has allowed institutional players who are looking to shore up balance sheets or raise capital to return to investors to sell assets. Institutional players now make up 46% of sales volume over the last year, up from a five-year average of 26%, with market participants indicating that it is relatively easier for these companies to find office buyers in South Florida.
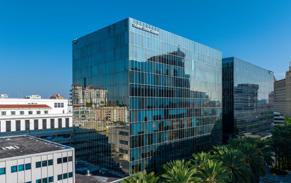
The second half of 2023 saw rising volume, driven by two major transactions. The largest of these involves the October sale of the 4 Star 801 Brickell Ave. for $250 million, or $602/ SF. Monarch Alternative Capital and Tourmaline Capital Partners acquired the property from Nuveen at a 6.75% cap rate. The buyer indicated that they viewed the asset
as a well-positioned, top-quality building in a growing market despite a negative office outlook. The property now has asking rents between $100/SF and $120/SF, above prior asking rents of between $70/SF and $90/SF from 2021 to 2022, indicating tenant rollover upside.
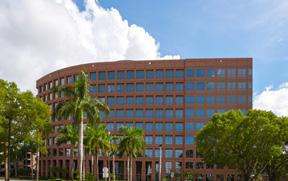
Another driver of volume involved the September sale of 355 Alhambra Circle in a 1031 exchange. Princeton International Properties purchased the 4 Star property located in Coral Gables from PGIM Real Estate for $90 million, or $404/ SF, when it was 84% leased. The new owner will begin a comprehensive renovation and improvement plan, ensuring it remains at the forefront of Class A office spaces in the area. The property had last traded in 2015 for $83 million, or $372/ SF, when it was 69% leased. The higher sales price for this property in its recent sale indicates the relative health of Miami office values compared to markets like San Francisco and New York, which have seen significant pricing declines.
Despite a rebound in volume since the second half of 2023, high-volume deals will likely continue to slow. Additionally, higher interest rates have resulted in higher cap rates, with cap rates expanding to the mid-6% to 7% range, up from the mid-5% range in 2022. Going forward, national cap rates will expand faster relative to Miami as office fundamentals deteriorate in other markets. In fact, Miami is one of seven major U.S. markets with expected office value gains through 2024 versus 2019.
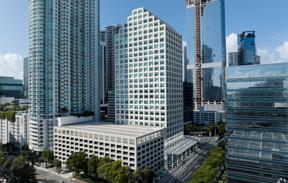
Brickell Submarket | Miami, FL 33131
SALE DATE
SALE PRICE
CAP RATE
LEASED
HOLD PERIOD
RBA
Oct 2023
$250M ($602/SF) 6.8% (Actual) 92%
20+ Years 415,150 SF
YEAR BUILT
BUYER
SELLER
BROKER
SALE TYPE
1985
Monarch Alternative Capit... (USA) +1 Nuveen (USA)
Colliers
Investment
Coral Gables Submarket | Coral Gables, FL 33134
SALE DATE
SALE PRICE
LEASED
HOLD PERIOD RBA YEAR BUILT
Sep 2023
$90M ($404/SF) 84%
93 Months
222,884 SF 2001 (Renov 2017)
BUYER
SELLER
BROKER
SALE TYPE
SALE COND
Princeton International Pr... (USA)
PGIM, Inc. (USA)
Cushman & Wakefield
Investment 1031 Exchange
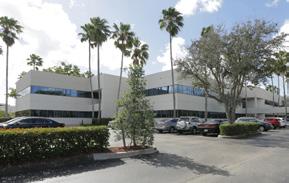
Waterford Business District | Miami Airport Submarket | Miami, FL 33126
SALE DATE
SALE PRICE
LEASED
HOLD PERIOD
RBA YEAR BUILT
Dec 2023
$68M ($319/SF) 100%
20+ Years
213,182 SF 2002 (Renov 2021)
BUYER
SELLER
BROKER
SALE TYPE
SALE COND
Lennar (USA)
Franklin Street Properties... (USA)
CBRE
Owner User
Purchase By Tenant
Downtown Miami Submarket | Miami, FL 33101
SALE DATE
SALE PRICE
LEASED
HOLD PERIOD RBA YEAR BUILT
Jun 2024
$67M ($511/SF) 100% 5 Months
131,129 SF 2024
BUYER
Mediterranean Shipping C... (USA)
Cushman & Wakefield
Swerdlow Real Estate Gr... (USA)
Cushman & Wakefield
SALE TYPE
SALE COND
Owner User
Building in Shell Condition
Coral Gables Submarket | Coral Gables, FL 33134
SALE DATE
SALE PRICE
LEASED
HOLD PERIOD RBA YEAR BUILT
Aug 2023
$54.4M ($246/SF) 85%
205 Months
221,335 SF 1974 (Renov 1993)
BUYER
SELLER
BROKER
SALE TYPE
LNDMRK Development (USA) +2 DWS Group (DEU)
JLL
Investment
Office construction activity in Miami has been on the rise, with projects underway representing of existing supply, up from the 2010-20 average of over 1.6% of supply. Virtually all of the 3.4 million SF underway in the market is concentrated in 4 & 5 Star properties. Deliveries totaled 211,000 SF in 2023, with a historically elevated 1.6 million SF of product expected to be completed in 2024.
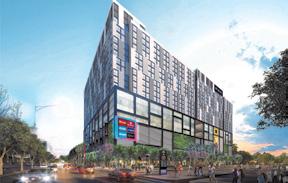
Around 80% of 4 & 5 Star development is located within a 4-mile radius of Downtown Miami, spread out across Downtown, Wynwood, and Brickell. The largest projects underway, of over 500,000 SF, include 830 Brickell, the Miami Courthouse, and Miami Riverside Center. These high-rise office towers offer tenants the latest finishes and amenities. 830 Brickell, for example, is set to include a sky lobby, fitness center, rooftop restaurant and bar, covered parking, and EV charging stations.
With an average year built of 1977 for office properties with more than 10,000 SF, new supply is warranted. Still, oversupply remains a risk, with a rise in sublet availability and 1.2 million SF available in existing assets built in the past 10 years, with an occupancy rate of 87%. Inventory set to deliver in the next few years and the proposed pipeline face rising headwinds due to the near-term slowdown in office-using job growth and the growing popularity of hybrid working strategies.
Despite cooling economic activity, companies continue to announce relocation plans to Miami. The latest is Anaplan, a software company, that is planning to relocate from San Francisco in early 2024. Additionally, companies like Ryder System, which will be moving into its new HQ at BAC Colonnade, highlight a growing need for high-quality space in urban areas. Additionally of note is the over 40,000 SF lease signed by Microsoft at 830 Brickell, as the company also renewed over 30,000 SF of space at its Fort Lauderdale, indicating a general expansion in space needs for now.
With limited space availability in properties underway, tenants seeking the latest finishes in their space are left with few options. In fact, availability of large spaces of over 100,000 SF is limited to six existing and three under-construction properties. Of those, one newer existing property, built in 2009, has space availability with asking rents of over $57/SF. Other large space availabilities in newer downtown properties are limited to those under construction. Going forward, higher financing costs, slower construction employment growth, and elevated pricing for land will weigh on construction, with supply unlikely to significantly wean pressure off the market for high-quality space anytime soon.

Available office space in Fort Lauderdale has expanded marginally, with the availability rate rising to 13.2% from 12% pre-pandemic. Still, this remains below the national availability rate of 16.4%. This uptick in availability has been mainly the result of tenant move-outs from 1 & 2 Star space over the last year. With around 90% of the 530,000 SF of net absorption in the last 12 months concentrated in 4 & 5 Star space.
Space demand has remained strongest in Downtown Fort Lauderdale, Plantation, and Hallandale, as tenant demand continues to concentrate in newer 4 & 5 Star assets. In fact, over the last year, around 50% of net absorption in these submarkets has been concentrated in properties built since 2010.
Although 4 & 5 Star demand remains healthy, supply additions have driven availabilities higher for this market segment to 19.9% from 17% in 2019. As 30%, or over 500,000 SF, of Fort Lauderdale’s new 4 & 5 Stafive-yearr supply has been concentrated in Downtown Fort Lauderdale since 2019, the submarket’s 4 & 5 Star availability rate has also risen five percentage points over the same time period. Some supply pressure will linger throughout 2024, though net absorption is expected to surpass new deliveries for the year.
Fort Lauderdale has historically benefitted from limited office availability relative to the national average since 2017, and despite softer leasing and new deliveries driving availability higher, tenant demand has remained healthy, resulting in an

SOURCE: COSTAR
outperformance in rent gains. In fact, Fort Lauderdale has the fifth-highest office rent gains in the nation, rising 3.1% annually during the third quarter of 2024, outpacing national average gains of 1.1%. Still, this remains below the average annual gain of 5.9% over the past three years, as rent gains have moderated.
Going forward, rent growth is expected to continue to slow as softer demand, driven by weaker office-using job gains which are impacting leasing activity.
Despite this near-term softening, healthy rent gains and limited occupancy declines in the coming years will drive office value outperformance relative to the rest of the nation, though higher interest rates have resulted in a pricing contraction from peaks in 2022. Transaction activity has also cooled, with volume totaling $462 million over the past 12 months, down from $1.2 billion transacted through the first quarter of 2022. Despite this slowdown, institutional and private equity investor activity remains above the five year average trend.


Fort Lauderdale office transaction volume has slowed over the last 12 months, totaling $462 million, below the fiveyear average of $786 million. Although 2023 started off with strong activity, with over $313 million traded in the first half, volume has slowed since the second half of last year and into 2024. Despite this near-term slowdown, the market remains attractive on a relative basis, as vacancy rates that remain well below the national average suggest that Fort Lauderdale may be somewhat insulated from future economic uncertainty when compared to its high-growth peer markets.
80% of activity in 2023 was concentrated in the Plantation, Downtown Fort Lauderdale, Fort Lauderdale, Southwest Broward, and Pompano Beach submarkets. Activity in Cypress Creek and Sawgrass Park has been slower over the past few years, although over a longer time horizon, these submarkets have also seen a significant share of transactions. These submarkets tend to see the bulk of activity, representing a combined 80% of the total office inventory in the Fort Lauderdale market.
The largest deal in 2023 involved Pebb Capital, Intalex Capital, and CDS International Holdings Inc., which acquired 100 and 110 E Broward Blvd. in Downtown Fort Lauderdale for $43 million, or over $125/SF, from Stockbridge Capital in May. Stockbridge had bought the asset back in 2018 for just over $41 million, or over $119/SF, indicating the continued pricing appreciation of properties throughout 2023.
High-volume deals, which drove investment activity in the past couple of years, are likely to remain muted as economic headwinds, coupled with elevated interest rates, impact pricing. In fact, although average transaction pricing for Fort Lauderdale office remains 20% above 2019 levels, the average transaction price/SF over the past 12 months has fallen around 18% from year-ago levels. Going forward, elevated interest rates will continue to weigh on transaction activity, while cap rates continue to trend higher from lows in the mid5% range in 2022 to over 6.5% today.
Office construction activity in Fort Lauderdale has mostly remained muted since 2019, with muted starts since 2023. 250,000 SF of net new product delivered in 2023, with supply additions expected to rise to 340,000 SF in 2024. Despite this slight rise in new supply, since 2018, net delivery of new supply has remained below the long-term historical average of 750,000 SF annually.
78% of supply additions since 2010 have been composed of 4 & 5 Star assets, with 78% concentrated in the Southwest Broward, Plantation, Sawgrass Park, Downtown Fort Lauderdale, and Pompano Beach submarkets. Existing assets built since 2010 and properties underway are more than 90% leased, with more than 70% of available space concentrated in assets built since 2020 or currently underway. Over 70% of space available in these properties is concentrated in four properties, with around 50% in the T3 Fat Village East and West, which total over 380,000 SF. Fat Village is part of a development by Hines, in partnership with Urban Street Development, Cresset Real Estate, and Las Americas, totaling 835,000 SF of office, retail, and residential mixed-use in Flagler Village.
SOURCE: COSTAR
Lyons Technology Center | Pompano Beach Submarket | Coconut Creek, FL
33073
SALE DATE
SALE PRICE CAPE RATE LEASED
PERIOD
Sep 2023
$21.7M ($956/SF)
(Actual)
Stockbridge Capital Grou... (USA)
Principal Real Estate Inve... (USA) JLL Investment
Cypress Creek Submarket | Fort Lauderdale, FL 33309
SALE DATE
SALE PRICE LEASED HOLD PERIOD
Jan 2024
$18.5M ($139/SF)
Broward County Governm... (USA) Allied Health Education (USA) Investment
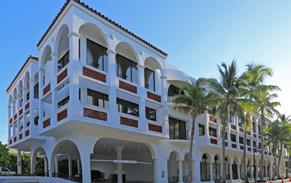
17th Street Quay | Downtown Fort Lauderdale Submarket Fort Lauderdale, FL 33316
SALE DATE
SALE PRICE LEASED
HOLD PERIOD RBA
BUILT
$17.6M ($536/SF)
BH Group (USA) +2
Darrow Everett LLP AEW Capital Management (USA) +1 JLL Investment May 2024
NW Broward/Coral Springs Submarket \ Coral Springs, FL 33065
SALE DATE
SALE
Dec 2023
$15.4M ($292/SF)
Hammes Partners (USA) Gary V. Caplan (USA) Investment
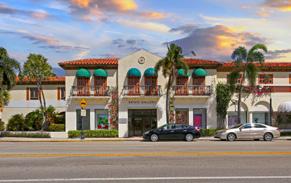
Fort Lauderdale Submarket | Pompano Beach, FL 33062
SALE DATE
SALE PRICE
CAP RATE
Jan 2024
$12.8M ($186/SF) 5.0% (Actual)
20+ Years
LEASED HOLD PERIOD RBA YEAR BUILT
1976 (Renov 1998)
Vera Realty (USA)
Blue Leasing, Inc. (USA)
SALE TYPE
Berger Commercial Realty Corp CORF.. Investment
The muted supply pipeline should help buoy office fundamentals in the market. However, a continued flight to quality will likely result in weaker performance for 1 to 3 Star product in the next few years. Additionally, a rise in sublet space availability presents a near-term drag as this additional supply at lower asking rents is added to the market. Also, market participants have indicated rising interest in renovating existing office assets as landlords and investors are increasingly aware of tenant preferences for high-quality space. This could bring additional competitive supply over the coming years. That said, Fort Lauderdale vacancy and rent growth trends are expected to outperform the U.S. average as the supply/demand balance remains healthier than in many markets nationwide.

PALM BEACH OFFICE MARKET SEES SHIFT IN DEMAND
DYNAMICS AMID RISING AVAILABILITY, YET HIGHQUALITY CBD SPACE REMAINS IN FAVOR
Available office space in Palm Beach has risen since the third quarter of 2022, with net absorption turning negative since 2023. Despite the recent softening, longer-term trends in the market continue to indicate a preference for high-quality 4 & 5 Star office space located in the market’s CBD. In fact, 70% of demand in Palm Beach has been concentrated in 4 & 5 Star assets since 2019, and 39% of 4 & 5 Star demand has been concentrated within the CBD over the same time period.
Additionally, developers have been active in the 4 & 5 Star segment, adding over 1.9 million SF, or over 13% of existing inventory, since 2010, with over 80% having delivered since 2015. Still, this newer inventory is over 95% occupied. Currently, there is 740,000 SF of 4 & 5 Star office space under construction across six properties, with half located in the West Palm Beach CBD. This is well above the total SF in cumulative deliveries over the prior three years, though properties underway have an availability rate below 30%.
Office rents in Palm Beach were growing at a 3.2% annual rate during the third quarter of 2024, though gains have moderated, falling below the three-year average annual rent growth of 7.0%.
Gains have been driven by limited deliveries and healthy tenant demand in 2021 and 2022, which resulted in significant vacancy contraction in those years. Although vacancies have expanded recently to 8.2%, these remain below the 10-year average of 9.6% as of the third quarter of 2024.

PRICE/SF $307 $310
MARKET
SOURCE: COSTAR
Despite healthy occupancy, softer office-using job gains are slowing tenant demand. Still, the area’s lower cost of business and warm climate, coupled with an increasingly diversifying employment base, should help buoy long-term demand growth for 4 and 5-star properties, even with the structurally weakened correlation between office-using labor growth and office leasing.
Transaction volume has moderated since 2023, with $442 million trading in the last twelve months, below the $1.0 billion traded on average in the last five years. Despite this near-term slowdown, the Palm Beach market remains attractive on a relative basis as vacancy rates, which remain well below the national average of 13.8% and positive rent gains, suggest that Palm Beach may be somewhat insulated from future economic uncertainty when compared to its high-growth peer markets. Still, a near-term pullback in institutional buyer activity will likely continue through 2024 as rising vacancies, softer rent gains, and still-elevated interest rates continue to impact value creation and investment decisions.


Investor interest in Palm Beach office has remained elevated, with annual transaction volume surpassing the five-year average of around $1.0 billion in both 2021 and 2022. Transaction volume has moderated since 2023, with $442 million trading in the last twelve months.
Over 80% of 2023 transaction activity was concentrated in the Boca Raton, West Palm Beach, North Palm Beach, and Palm Beach submarkets. These same submarkets have made up over 85% of transaction activity since 2020. Despite some of the same submarkets seeing a high share of activity, the type of buyer has shifted recently in the market. Private buyers have made up over 77% of trades in the last 12 months, up from 66% over the prior five years, as institutional and private equity players sit on the sidelines. Despite fewer institutional players resulting in smaller transaction sizes, two large deals for more than $80 million each have occurred in the last 12 months.
The second half of 2023 saw slower activity, though one large transaction in December boosted fourth-quarter volume. This involved the purchase of The Atrium at Broken Sound, a 100,000 SF 4 Star property that was built in 1986 and renovated in 2018. Meyers Group, a developer of mixed-use and residential properties, purchased the property for $25 million or $250/SF while it was 75% occupied. Despite recent upgrades, the new owner plans further improvements to the building to
increase its competitiveness in the market. The property last traded in 2018 for $214/SF at a 7.2% cap rate, indicative of office values, which continued their rise through the end of last year relative to pre-pandemic pricing.
Despite some value gains and lower cap rates in certain deals, higher rates are generally driving an expansion in office cap rates in the market. Well-leased office buildings,
with more than 80% of space occupied, have seen cap rates rise from the mid-5% to mid-6% range in 2021/2022 to above 7% in the last year. Apart from higher cap rates, slower volume is expected to continue over the coming quarters.
Although a slowing economy and higher interest rates resulting in near-term pricing correction and lower transaction activity, Palm Beach office is expected to outperform nationally. Palm Beach is one of nine major U.S. markets with expected office value gains through 2024 relative to 2019 values. This is largely driven by an expectation of slower yet still positive rental gains as the market continues to see some of the highest office rent gains in the country.
Office construction activity in Palm Beach remains elevated, totaling 820,000 SF relative to the 10-year historical average of 710,000 SF. Despite the elevated
Palm Beach Submarket | Palm Beach, FL 33480
SALE DATE
SALE PRICE
CAP RATE
LEASED
HOLD PERIOD RBA
Jul 2023
$83M ($1.7K/SF)
3.0% (Actual)
86%
69 Months
50,000 SF
YEAR BUILT BUYER SELLER
SALE TYPE
1974 (Renov 2017)
Citadel (USA) Dreyfuss Management (USA) +1 Investment
One Town Center • Boca Raton West Submarket • Boca Raton, FL 33486
SALE DATE
SALE PRICE
LEASED HOLD PERIOD
RBA YEAR BUILT
Jul 2024
$82M ($429/SF) 100%
36 Months 1 91,294 SF 1990
BUYER SELLER
BROKER
SALE TYPE
Miles Capital, LLC (USA)
Prime US REIT (SGP)
Prime US REIT I nvestment
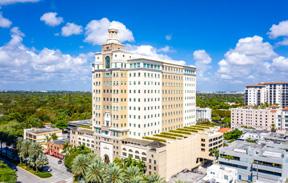
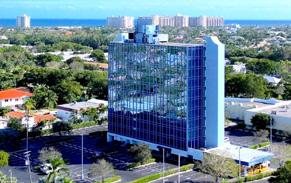
West Palm Beach CBD Submarket | West Palm Beach, FL 33401
SALE DATE
SALE PRICE
LEASED
HOLD PERIOD
RBA
YEAR BUILT
Jan 2024
$33M ($480/SF) 100%
29 Months
68,811 SF 1950 (Renov 2016)
BUYER SELLER
SALE TYPE
SALE COND
New York University (USA) Morning Calm Management (USA) Investment Redevelopment Project
The Park at Broken Sound | Boca Raton North Submarket | Boca Raton, FL 33487
SALE DATE
SALE PRICE
LEASED
HOLD PERIOD RBA
YEAR BUILT
Dec 2023
$25M ($250/SF)
61 Months 100,000 SF 1986 (Renov 2007)
BUYER SELLER SALE TYPE
Accesso Partners (USA) +1
Alchemy ABR Investment... (USA) +1 Investment
Royal Palm Bch/Wellington Submarket | Wellington, FL 33414
SALE DATE
SALE PRICE
LEASED
HOLD PERIOD
RBA
YEAR BUILT
Dec 2023
$18.3M ($380/SF) 91% 17 Months 48,000 SF 2006
BUYER SELLER
SALE TYPE
SALE COND
Artemis Real Estate Partn... (USA) +1
Healthcare Realty Trust In... (USA) Investment
Ground Lease (Leasehold)
SOURCE: COSTAR
construction pipeline, starts have begun to slow, totaling over 96,000 SF in 2023 and 49,000 SF so far in 2024, down from the over 528,000 SF that broke ground in 2022. Delivery of new supply is expected to remain elevated through 2024, but should then begin to wind down by 2025 as elevated interest rates and softening fundamentals impact developer activity.
Still, inventory additions are expected to peak in 2024, totaling over 819,000 SF. Since 2021, net delivery of new supply has remained well above the 10-year historical average of around 71,000 SF annually, with the exception of 2023 which saw no new net deliveries.
Virtually all supply additions since 2010 have been composed of 4 & 5 Star properties, with 77% concentrated in the North Palm Beach, West Palm Beach, Delray Beach, and Boca Raton submarkets. Existing assets built since 2010 and properties underway are over 95% leased, with more than 80% of available space concentrated in assets built since 2020 or currently underway. The bulk of available space in these newer properties is concentrated in two properties under construction, with over 100,000 SF available at both One Flagler and 300 Banyan Blvd. Both 4-star properties are expected to deliver by 2024 in the West Palm Beach Submarket.
Near-term supply additions will expand 4 & 5 Star vacancies as these projects lease-up over the next few years, while the continued flight to quality results in weaker performance for 1 to 3 Star product. Additionally, a rise in sublet space availability presents a near-term drag as this additional supply at lower asking rents is added to the market. Also, market participants have indicated rising interest in renovating existing office assets as landlords and investors are increasingly aware of tenant preferences for high-quality space. This could bring additional competitive supply over the coming years. That said, Palm Beach vacancy and rent growth trends are expected to outperform the U.S. average, as the supply/demand balance remains healthier here than in many markets across the country.