MARKET REPORT
SOUTH FLORIDA | INDUSTRIAL


ONE Commercial Real Estate was born from a commitment to be a change agent for clients and industry professionals. Founded by Daniel de la Vega, the President of ONE Sotheby’s International Realty, we offer superior results to owners, occupiers, and developers of commercial real estate by obtaining and sharing intelligence as well as applying our knowledge, experience, competence and technical skills.
Our team members have experienced several cycles that have taught valuable lessons. We have decades of on-the-ground experience and market knowledge in South Florida advising clients in all aspects of commercial real estate. We provide the insight necessary to lead informed and efficient decision making.
The commercial real estate landscape has changed. Florida is impacted by global economic and political events more than most. Capital is forming new markets, redefining old ones, and continues to shape the fabric of our ever-growing landscape. Understanding these changes allows us to continue serving our clients and communities. By embracing the data and analytics we can identify movements, address obstacles, forecast challenges, and secure a vision for the future.
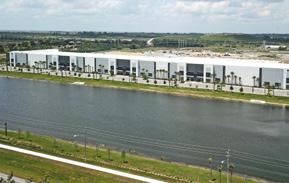
This edition of the ONE Commercial Market Report examines the industrial market in Miami-Dade, Broward, and Palm Beach counties.

Daniel de la Vega Chief Executive Officer ONE Commercial Real Estate

Miami’s trailing 12-month industrial net absorption has slowed significantly to 1.8 million SF, well below the pre-pandemic five-year average of 3.1 million SF. Transportation tenants, including Jas Forwarding USA, Triton Logistics, and Pilot Freight Services, all vacated spaces between 119,000 and 150,000 SF during late 2023, driving up the market-wide vacancy rate from a 2022 low of 2.0% in 2022 to 4.2% as of the third quarter of 2024. Even amid a slower economic environment weighing on lease volume, there is still limited availability of existing space, with vacancies well below the U.S. average of 6.6%.
Despite 5.1 million SF underway, modern logistics space is still scarce in Miami. Existing properties built since 2020 are over 90% leased locally compared to 80% at the national level. Miami’s tight market conditions have given landlords enough bargaining power to increase rents by 5.3% over the past 12 months, above U.S. average growth of 4.0%. Despite recent gains, slowing tenant demand and rising vacancies since 2023 have resulted in moderating rent growth from peak levels of 18% year-over-year recorded in the second quarter of 2022. Further deceleration is likely in 2024 as higher interest rates weigh on economic growth.
South Florida is the ninth-largest U.S. MSA in terms of population, and Miami’s industrial market remains a critical logistics hub for tenants serving the region’s 6.1 million residents. Miami International Airport also has the highest amount of international shipping in the U.S. and ranks fourth overall in cargo traffic. The port of Miami is the 11th-largest containerized port in the U.S. and is dredged to allow the new Super Post

SOURCE: COSTAR
Panamax mega-ships to enter. These international ties also attract importers and exporters to the market, contributing additional demand aside from local players.
The Everglades provides a clear barrier to new development. As a result, Miami’s industrial stock has grown slower than the U.S. average and at around half the pace of similarsized markets since 2015. These supply constraints have kept vacancies well below the U.S. average for decades. Miami’s vacancy rate should remain relatively low in the years ahead, helping rent growth to reaccelerate during 2025-2026 when fewer new developments are on track to complete construction.
Rising interest rates have abruptly driven sales volume back in line with pre-pandemic levels since 2023, after a historic boom in 2021-22. Over the past 12 months, sales volume totals $1.5 billion, just below the five-year average of $1.8 billion. However, unlike in most major U.S. markets, property sales activity accelerated here late last year as major buyers, including TA Realty, Longpoint Realty Partners, Ponte Gadea, and Property Reserve, have all closed acquisitions larger than $25 million here since the beginning of December.

Rising interest rates have abruptly driven sales volume back in line with pre-pandemic levels since 2023, after a historic boom in 2021-22. Sales volume over the past 12 months totals $1.5 billion, just below the five-year average of $1.8 billion. 2024 has so far only seen two major deals totaling over $40 million each, down from five such trades in 2023. Both deals involved warehouses with more than 100,000 SF located in proximity to Miami Airport and exchanging hands in January.
Despite this moderation in volume, healthy rent gains and tight vacancies continue to attract investors to the market, with recent activity centered on fully leased properties with stable cash flows. In fact, the largest transaction of 2023 involved the sale of four fully leased buildings in Beacon Logistics Park in December. The property was purchased by Property Reserve from Codina Partners for $174 million, or over $277/SF. Property Reserve already owns Building C in the park, which is slated to deliver in 2024 and has over 232,000 SF available for lease at a $15.50/SF NNN asking rent.
Portfolio trades returned at the end of 2023, with Longpoint Partners acquiring a 25-building industrial portfolio totaling over 1.3 million SF across Miami-Dade and Broward counties. The portfolio was 97% leased by 77 tenants at the time of sale and traded for over $262 million, or just over $188/SF. The acquisition follows Longpoint’s strategy of acquiring high-quality industrial
assets in critical logistics hubs. The buyer also stated the opportunity for further capital improvements and operational upgrades to the portfolio.
Cap rates have begun to rise over the past 12 months, mainly due to the rise in interest rates. Properties larger than 20,000 SF have seen cap rates rise from lows in the mid-4% range in 2022 to over 6% today. Despite this interest rate-driven cap rate expansion, a limited supply of space and healthy demand should continue to result in
rent growth and value outperformance relative to other U.S. markets with more significant imbalances between demand and supply. This relative outperformance and eventual loosening of financial conditions should help attract continued investment going forward.
Construction has ramped up in the past few years, with over 5.1 million SF underway as of the third quarter of 2024, well-above the 10-year average of 4.8 million SF. Starts have receded somewhat, totaling over 4.1 million SF in 2023, below the two-year historical average of over 5.4 million SF and in-line with the 10-year historical average of 4.1 million SF. As starts slow, deliveries are expected to peak in 2024, pulling back by 2025 and allowing vacancies to remain tight thereafter.
The bulk of construction activity is concentrated West of the Turnpike, where land is still available. Over 90% of rentable building area, is concentrated in the northern part of Miami and between the Palmetto Expressway and the Everglades, as these areas provide some of the lowest cost developable land parcels still available. Over 70% of
Outlying Miami-Dade Submarket | Hialeah, FL 33018
SALE DATE
SALE PRICE LEASED HOLD PERIOD RBA
BUILT
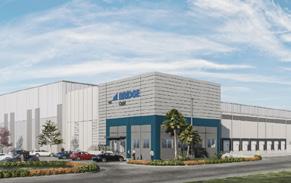
Dec 2023
$113M ($362/SF) 100% 11 Month
312,103 SF 2023
BUYER SELLER
SALE TYPE
Ponte Gadea USA, Inc. (USA) Bridge Industrial (USA) +1 Investment
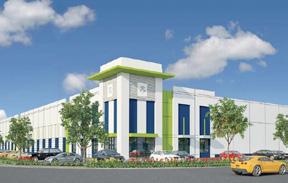
Beacon Logistics Park | Outlying Miami-Dade Submarket | Hialeah, FL 33018
SALE DATE
SALE PRICE
PERIOD
Dec 2023
$58.5M ($285/SF)
100%
11 Months
205,250 SF 2023
4141 W 91ST PL | BEACON LOGISTICS PARK- BUILDING C
Property Reserve, Inc. (USA) Codina Partners (USA) +1 Investment
Beacon Logistics Park | Outlying Miami-Dade Submarket | Hialeah, FL 33018
SALE DATE
SALE PRICE
LEASED
HOLD PERIOD
RBA
YEAR BUILT
Jun 2024
$55.9M ($240/SF 100%
6 Months
232,620 SF 2024
BUYER SELLER
SALE TYPE
Property Reserve (USA) Codina Partners (USA) Investment
South Central Miami Submarket | Miami, FL 33142
SALE DATE
SALE PRICE
LEASED
HOLD PERIOD
RBA
YEAR BUILT
Jan 2024
$45M ($227/SF) 100%
156 Months
198,500 SF 1973
BUYER BROKER
SELLER
BROKER
SALE TYPE
Medley Submarket | Medley, FL 33166
SALE DATE
SALE PRICE
LEASED
HOLD PERIOD
RBA
YEAR BUILT
Nov 2023
$45M ($168/SF) 100%
20+ Years
268,232 SF 1999
BUYER SELLER
SALE TYPE
Miami-Dade County (USA) KW Commercial - Keller Williams Capit... Simkins Prop Inc. (USA David Kreps Investment
Pella (USA)
Lawson Industries, Inc. (USA)V Investment
SOURCE: COSTAR
properties underway in this area are located within the northeast portion of the Outlying Miami-Dade, Miami Airport West, and North Miami Beach submarkets. These submarkets, with access to I-75, the Florida Turnpike and Palmetto Expressway, are only a 20- to 30-minute drive from the PortMiami, Miami International Airport, and Port Everglades. Despite the elevated construction pipeline in the area, vacancies for these three submarkets remain below 7% as they generally offer below-average rents, proximity to a sizable blue-collar workforce and transport corridors, all attractive drivers of tenant demand.
Over 60% of buildings underway are larger than 100,000 SF, with five properties larger than 300,000 SF. The largest properties are two warehouses with more than 700,000 SF each. The properties are part of Phase II of the Bridge Point Commerce Center in the North Miami Beach Submarket. The five-building development is set to deliver around 2.7 million SF once completed, with three buildings delivered in Phase I already being fully leased to tenants such as City Furniture and Novo Health Services.
Due to the limited availability of modern space in the market, new construction tends to lease fast, with most properties underway expected to be fully occupied by the second half of 2025. So far, properties underway are less than 20% preleased, leaving over 5 million SF still available.
Fort Lauderdale’s trailing 12-month industrial net absorption has slowed to -540,000 SF, down from elevated levels of 4.8 million SF reached during mid2022. Tenant move-outs, including ProCare RX and Williams-Sonoma closing 81,000 SF and 54,000 SF warehouses in Southwest Broward and Pompano Park, respectively, during 23Q3, have resulted in rising vacancies from a low of 3.1% in 2022 to 4.2% as of the third quarter of 2024. Despite a slower economic environment weighing on lease volume, there is still limited availability of existing space, with vacancies remaining well below the U.S. average of 6.6%.
Due to access to the large population pool of South Florida, the ninth-largest U.S. MSA in terms of population, the Fort Lauderdale industrial market remains a critical logistics hub. South Florida is also a gateway market to the rest of the world; as a result, Port Everglades is the third-largest containerized port in Florida based on total import and export TEUs as of 2022. Healthy tenant demand from 3PLs and small businesses serving the local population, coupled with the limited availability of new industrial space, is expected to keep market vacancies below 5% in the near term.
Modern logistics space is scarce in Fort Lauderdale, and with only 490,000 SF underway, the area continues to see limited new supply, as this figure remains below the five-year average for under-construction space of 1.7 million SF. Supply additions have done little to impact vacancies, with available space in properties built since 2015 dropping to half of levels seen in 2021 and standing at around 1.8 million SF.

SOURCE: COSTAR
Fort Lauderdale’s tight market conditions have provided landlords with enough bargaining power to increase rents by 5.0% over the past 12 months, which ranks as the sixth strongest year-over-year rent growth among U.S. markets. Despite recent gains, slowing tenant demand and rising vacancies since 2023 have resulted in a moderation in rent gains from peak levels of 18% year-over-year recorded in the third quarter of 2022. Further deceleration is likely in 2024 as higher interest rates continue to weigh on economic growth.
Annual sales volume totals $1.1 billion, below five-year average volume but still above long-term average annual volume of $932 million over the past 10 years. Pricing has also begun to adjust, with fully leased distribution centers built since 2010 and larger than 50,000 SF trading at average pricing of $188/SF since the second half of 2023, compared to $248/SF when interest rates were near record lows in 2021/2022. However, unlike in most major U.S. markets, property sales activity accelerated here in the second half of last year as major buyers including Longpoint Realty Partners and Sterling Investors have closed acquisitions larger than $20 million here since August.

Last year’s sales volume abruptly came back down in line with pre-pandemic levels after a historic boom in 202122. Sales volume over the last twelve months totals $1.1 billion, below five-year average volume but still above long-term average annual volume of $932 million over the past 10 years.
Still, major trades continued to occur since the second half of 2023. In February 2024, Cabot Properties sold a 201,000 SF industrial building to Chick-fil-A for over $50 million or over $250/SF in an owner-user acquisition. The property, which was vacant, was delivered in 1995 and offers 22 docks, a 24,000 SF two-story office space, 38,000 SF of freezer/cooler space, a 30’ clear height, and 139,840 SF of dry warehouse space.
Additionally, large portfolio trades continue to highlight institutional investor demand for South Florida industrial properties. These include Longpoint Partners’ December acquisition of a 25-building industrial portfolio totaling around 1.4 million SF across Miami-Dade and Broward Counties. 14 of those properties were located in Fort Lauderdale and drove an estimated $157 million in activity for the fourth quarter, or over 50% of volume. The portfolio comprised 2 and 3-star properties of between 11,000 SF and 213,000 SF and traded for $188/ SF. It was 97% leased by 77 tenants at the time of sale. Longpoint stated that this infill portfolio offers significant upside opportunity through capital improvements and operational upgrades.
One of the largest individual trades of 2023, which provides some pricing insight, involved the sale of The Pompano Distribution Center II at 4000 N Dixie Hwy. The property, built in 2015, totals over 128,000 SF and traded for over $24 million, or over $188/SF. Sterling Investors purchased the property in August from Zurich Alternative Asset Management and was 100% leased to the Spice Lab, a manufacturing tenant, at the time of sale. The most recent comparable sale in the market occurred in December 2022, involving the 133,000-SF Pompano Business Center II, located at 30001 W Copans Road. The property, built in 2019 and 100% leased at sale, traded for over $25 million, or over $190/SF, indicating minimal pricing improvement in the market since 2022 despite healthy rent gains since then.
Strong investor demand in recent years has driven strong pricing appreciation of over 50% since 2019, though gains have slowed somewhat after peak pricing growth seen in the second half of 2021. This pricing outperformance has expanded the premium for Fort Lauderdale industrial properties from 1.4 times the U.S. average back in 2019 to over 1.6 times higher today. Despite the market’s recent outperformance, a slowing economy and higher interest rates will likely remain a drag on market activity, at least until an eventual loosening of financial conditions occurs.
Construction activity has slowed in the past few years, with only around 490,000 SF underway as of the third quarter of 2024. This is down from a peak in construction activity seen in the first half of 2020 when there was more than 3.4 million SF underway. Construction starts pulled back significantly in 2023, with around 370,000 SF breaking ground for the year, well below levels of over 1 million SF seen in each of the prior six years. A slower economic environment, coupled with elevated financing costs, will likely keep construction activity largely muted in the near future. Fewer groundbreakings will result in a slowdown in deliveries, which are set to remain at or below 1 million SF over the next several years, allowing vacancies to remain tight for the foreseeable future.
Close to 80% of industrial properties with more than 100,000 SF are located in the Southwest Broward, Pompano Beach,
SOURCE: COSTAR
Rock Lake Business Center | Pompano Beach Submarket
Pompano Beach, FL 33069
SALE DATE
SALE PRICE LEASED
HOLD PERIOD RBA YEAR BUILT
Jun 2024
$62.9M ($462/SF)
43 Months 136,032 SF 2019
SALE TYPE
Tishman Speyer (USA) IDI Logistics (USA) Investment
Meridian Business Campus | Southw.. Broward Submarket | Weston, FL 33331
SALE DATE
SALE PRICE LEASED HOLD PERIOD RBA YEAR BUILT
Feb 2024
$50.5M ($250/SF)
SALE TYPE
Chick-Fil-A, Inc. (USA)
CBRE
Cabot Properties Inc (USA)
CBRE
Owner User
Parkway Commerce Center | Central Broward Submarket | Fort L..., FL 33311
SALE DATE
SALE PRICE
LEASED
HOLD PERIOD RBA
YEAR BUILT
Dec 2023
$47.1M ($3.2K/SF) 100% 20+ Years 14,628 SF 1988
BUYER SELLER BROKER
SALE TYPE
SALE COND
Longpoint Realty Partners (USA)
Seagis Property Group LP (USA)
CBRE
Investment
Bulk/Portfolio Sale
South Florida Distribution Center | Southwest Broward Submarket Fort Lauderdale, FL 33332
SALE DATE
SALE PRICE CAP RATE
Jul 2023
$39.8M ($177/SF) 4.7% (Actual) 0% 53 Months 224,572 SF
2018
Summit Real Estate Group (USA)
Vital Pharmaceuticals, Inc. (USA)
Cushman & Wakefield Investment
Excess Land
Rock Lake Business Center | Pompano Beach Submarket Pompano Beach, FL 33069
SALE DATE
SALE PRICE
LEASED
HOLD PERIOD RBA YEAR BUILT
Jul 2024
$37.3M ($311/SF)
43 Months 119,968 SF 2019
SALE TYPE
Tishman Speyer (USA)
IDI Logistics (USA) Investment
Southeast, and Northeast Broward submarkets. The majority of these properties are located in the Southwest Broward Submarket, which runs from the Turnpike to the east to U.S. Highway 27 in the west, bordering the Everglades. New supply remains attractive in the market, as around 70% of these assets were built before 2010, resulting in a weighted average year built of around 2000.
Construction activity is concentrated in three buildings each at or over 170,000 SF located in the Coral Springs, West Sunrise, and Southeast Broward submarkets. The largest property underway is located in the Coral Springs Submarket and totals over 216,000 SF at Foundry
Commercial’s Osprey Logistics Park which is already fully pre-leased.
The availability rate for new construction has fallen in the past few quarters as the largest two properties underway, Ospray Logistics Park and 5601 N Hiatus Road, attracted sizable tenants. Still, recently delivered properties and those underway with more than 100,000 SF have an availability rate of around 20%, representing over 1.4 million SF of available space. These new larger spaces may take longer to lease, as large tenant demand has slowed, though muted supply additions, coupled with tight vacancy rates of around 7% for existing assets larger than 100,000 SF, point to limited competitive supply, which should help leasing prospects going forward.
Palm Beach’s trailing 12-month industrial net absorption has slowed to 12,000 SF, down from elevated levels of 2.2 million SF during early 2022. Small tenant move-outs, 70% occupying spaces of less than 20,000 SF, drove the slowdown since the second half of 2023, resulting in rising vacancies from a low of 2.5% in 2022 to 6.3% as of the third quarter of 2024. Despite a slower economic environment weighing on lease volume, there is still a limited availability of existing space, with vacancies remaining well below the U.S. average of 6.6%.
Palm Beach’s tight market conditions have provided landlords with enough bargaining power to increase rents by 6.2% over the past year, above U.S. average gains of 4.0%. Despite recent gains, slowing demand and rising vacancies since 2023 have resulted in a moderation in rent gains from peak levels of around 12% year-over-year recorded in 2022. Further deceleration is likely in 2024 as higher interest rates weigh on economic growth.
Modern logistics space is scarce in Palm Beach, with 10% of inventory being built since 2010, versus 23% on average across the U.S. Though with 820,000 SF underway, the area is seeing elevated supply, as this figure remains above the five-year average of 1.4 million SF under construction. Recent supply additions have also impacted vacancies, with over 1.2 million SF of space available in properties built since 2020. Further deliveries through 2024 will be a drag on vacancy, as 80% of space remains available in properties underway. Despite this recent rise,
SOURCE: COSTAR
vacancies are expected to remain at or below 6% and below the U.S. average over the near-term forecast.
The Palm Beach industrial market remains a critical logistics hub as it provides access to the large population pool in South Florida, the ninth-largest U.S. metropolitan statistical area in terms of population. Despite ranking fourth after Jaxport, PortMiami, and Port Everglades in containerized cargo, the port of Palm Beach provides significant infrastructure for businesses. The rise of buying power in Palm Beach, coupled with a lack of available space in Fort Lauderdale and Miami, should continue to help drive businesses northward into the market.
Rising interest rates have driven sales volume abruptly back down in line with pre-pandemic levels after a historic boom in 2021-22. Annual sales volume totals $494 million, in line with long-term average annual volume of $419 million over the past 10 years. Additionally, despite an interest rate-driven cap rate expansion, a limited supply of space and healthy demand should continue to result in rent growth and value outperformance relative to other U.S. markets with more significant imbalances between demand and supply. This relative outperformance and eventual loosening of financial conditions should help attract continued investment going forward.
Rising interest rates have driven sales volume abruptly back down in line with pre-pandemic levels after a historic boom in 2021-22. Annual sales volume totals $494 million, in line with long-term average annual volume of $419 million over the past 10 years. Fewer institutional buyers have been active over the past year, with private players making up over 70% of transaction activity, up from 50% on average over the prior five years. This has resulted in smaller transactions, with the average sales price falling from around $7 million in 2022 to $3.5 million in 2023. Additionally, the average size of properties traded has also dropped from over 27,000 SF in 2022 to 15,000 SF in 2023.
Strong investor demand in recent years has driven Palm Beach industrial pricing to new heights, with the average annual transaction price standing at $188/ SF, up from $134/SF three years ago. This pricing outperformance has allowed Palm Beach industrial properties to retain their pricing premium over the U.S. average, at over 1.2 times higher today.
Still, rising interest rates and a slowing economy have slowed pricing gains and overall activity in recent quarters. Industrial properties larger than 10,000 SF traded at average pricing of $229/SF in
2023, compared to $284/SF when interest rates were near record lows in 2021. One of the lowest cap rates recorded this year was 3.9% on Alliance Partners’ purchase of two fully occupied multitenant buildings at the Lantana Industrial Park, totaling over 50,000 SF. However, rising cap rates are the overarching trend, with average annual transaction cap rates rising from the mid-4% range in early 2022 to the mid-5% to 6% since the second half of 2023.
Despite the market’s recent outperformance, a slowing economy and higher interest rates, resulting in a nearterm pricing correction, will likely continue to drive
Palm Bch Cty Outlying Submarket | Jupiter, FL 33478
SALE DATE SALE PRICE
Apr 2024
$106.5M ($106/SF)
BUYER SELLER SALE TYPE
1500 N FLORIDA MANGO RD | LANDMARK
Hillwood Investment Prop... (USA) Truist Securities, Inc. (USA) Investment
Airport Industrial Park | Palm Beach Airport Submarket | West Palm Beach, FL 33409
SALE
Oct 2023
$18.5M ($208/SF)
Arden Logistics Parks (USA Alliance Partners HSP, LLC (USA Investment
701 PARK OF COMMERCE BLVD • 701 PARK OF COMMERCE
The Park at Broken Sound • Boca Raton, FL 33487
SALE
Jul 2024
$18.7M ($240/SF) 38%
COND A AND B INVESTMENTS... (USA) LRM Commercial Real Estate Advisors Darielle Singerman (USA) Douglas Elliman Owner User 1031 Exchange
1300 N FLORIDA MANGO RD • LANDMARK COMMERCIAL CENT...
Airport Industrial Park • Palm Beach Airport Submarket • West Palm Beach, FL
SALE DATE
SALE PRICE
Oct 2023
$18.7M ($221/SF)
Months
Arden Logistics Parks (USA) Alliance Partners HSP, LLC (USA) Investment
Boynton Logistics Center | Boynton Beach Submarket | Boynton Beach, FL 33426
SALE DATE
SALE PRICE LEASED HOLD PERIOD RBA
BUILT
Apr 2024
$14M ($154/SF) 90% 51 Months
SF 2000 (Renov 2017)
BUYER
Kovitz Investment Group (USA) +1
Elion Partners (USA) Cushman & Wakefield Investment
SOURCE: COSTAR
slower transaction activity relative to the boom in 2021 and 2022. Going forward, higher cap rates, coupled with softening fundamentals, will likely remain a drag on market activity, at least until an eventual loosening of financial conditions occurs.
Construction activity has increased since 2021, with around 820,000 SF underway as of the third quarter of 2024. As starts remain elevated, deliveries are expected to peak over the next year, with over 1.8 million SF expected to be delivered in 2024 after 1.5 million SF in deliveries in 2023. This will result in a near-term expansion in vacancies, which are expected to peak at just over 6% in mid-2024 but should remain below the U.S. average. Still, supply pressures will likely remain in the market for some time, with deliveries expected to remain elevated throughout the year.
More than 80% of space remains available in properties underway, as more than 90% of the rentable building area under construction is concentrated in larger assets with more than 100,000 SF. This presents some near-term supply risk, as the vast majority of leases typically fall within 30,000 SF or less. That said, existing properties with more than 100,000 SF are over 90% occupied in Palm Beach, and those built since 2020 are over 70% occupied.
Over 50% of industrial properties with more than 100,000 SF are located in the Park at Broken Sound, Palm Beach County Outlying, Palm Beach Airport, Southern Boulevard, and West of Turnpike submarkets. The Palm Beach County Outlying, Southern Boulevard, and West of Turnpike submarkets all have access to Route 98, which runs east to west through the heart of Palm Beach. These submarkets also have the bulk of available land for development and, therefore, house most of the under-construction properties that are larger than 100,000 SF. The Park at Broken Sound and Palm Beach Airport submarkets are farther east, providing greater proximity to I-95, which runs north to south in Palm Beach.