MARKET REPORT
SOUTH FLORIDA | RETAIL


ONE Commercial Real Estate was born from a commitment to be a change agent for clients and industry professionals. Founded by Daniel de la Vega, the President of ONE Sotheby’s International Realty, we offer superior results to owners, occupiers, and developers of commercial real estate by obtaining and sharing intelligence as well as applying our knowledge, experience, competence and technical skills.
Our team members have experienced several cycles that have taught valuable lessons. We have decades of on-the-ground experience and market knowledge in South Florida advising clients in all aspects of commercial real estate. We provide the insight necessary to lead informed and efficient decision making.
The commercial real estate landscape has changed. Florida is impacted by global economic and political events more than most. Capital is forming new markets, redefining old ones, and continues to shape the fabric of our ever-growing landscape. Understanding these changes allows us to continue serving our clients and communities. By embracing the data and analytics we can identify movements, address obstacles, forecast challenges, and secure a vision for the future.
This edition of the ONE Commercial Market Report examines the retail market in Miami- Dade, Broward, and Palm Beach counties.

Daniel de la Vega Chief Executive Officer ONE Commercial Real Estate

SURGING MIAMI RETAIL DEMAND FACES SPACE SHORTAGE, DRIVING RECORD-LOW AVAILABILITY AND RENT GAINS
An influx of high-net-worth individuals and a postpandemic recovery in international migration and travel are bolstering Miami resident and tourism spending. This surge in sales, which resulted in years of persistent retail demand growth, is now facing a lack of available space that is weighing on leasing activity.
Miami retail leasing activity has slowed over the past 12 months, with over 2.7 million SF leased, down from peak levels of over 3.5 million SF as of the fourth quarter of 2021. A lack of available space mainly drives this slowdown, as market participants continue to indicate tenant interest in new space from global and locally owned brands.
Total leased SF now makes up around 12% of available space, up from 10% on average from 2015 through 2019, resulting in positive annual net absorption of 1.0 million SF. These demand gains have driven the availability rate to historic lows of 3.7% as of the third quarter of 2024, well below the five-year average availability rate of 4.3%.
New supply has done little to improve space availability, as the over 1.8 million SF of retail space that delivered since 2023 is already around 95% leased. Additionally, limited supply relief is on the way as higher interest rates and elevated land values weigh on developer activity, with construction starts slowing significantly over the last year. As such, just 1.1 million SF is currently underway across Miami, of which only 75,000 SF is available for lease.

SOURCE: COSTAR
Elevated retail sales and limited space availability have helped drive strong rent gains in the area, with asking rents rising over 19% in the last three years, above national gains of around 12% over the same time period. With tenant move-outs remaining below the five-year historical average and limited supply additions, tight space availability is expected to continue to drive healthy rent gains, with these remaining above the U.S. average going forward.
Annual transaction volume has moderated after two years of above-average activity, totaling $1.2 billion in trades over the past 12 months, down to half the levels seen in 2022 and 2021 of $2.6 billion and $2.1 billion, respectively. Despite tight vacancies and healthy rent gains, higher interest rates, which are driving cap rates higher, are resulting in a drop in activity and pricing. Additionally, transaction sizes have shrunk as institutional players remain less active while owner-user buyers have become more active.
Going forward, rent growth will moderate as softer demand, driven by slowing consumption growth, meets limited inventory. Despite this, the market’s increased attractiveness and a lack of available space should drive an outperformance in values compared to the national average.


Annual transaction volume has moderated after two years of above-average activity, totaling $1.2 billion in trades over the past 12 months. This is down to half the levels seen in 2022 and 2021 and remains below the fiveyear annual average of $1.5 billion. Despite this slowdown, annual sales volume has remained consistent with levels seen from 2017 through 2020. Despite a slowdown in activity, eleven large deals, totaling more than $10 million each, have driven healthy volume in 2024. These deals account for over 50% of total volume so far.
Of note, was the March sale of a lifestyle center at 80 NE 40th St in the Wynwood Submarket. ASG Equities sold the over 6,500 SF NNN leased property to Dacra Realty, Inc, L Catterton, and Brookfield Properties for $18 million or over $2,700/SF. The property, part of the pedestrian Design District, is fully leased by high-end designer Boffi DePadvoa, an italian kitchen and furniture designer. The buyers, own additional properties in the Miami Deisgn District as they have supported the evolution of the area into a luxury shopping destination. The property had been on the market since October of 2023 with an asking price of $22 million and a reported 3.19% cap rate. The final sale indicates a 20% discount, producing an updated cap rate of 3.89%.
While high-end locations in the market continue to trade at elevated prices, properties in suburban locations typically trade at higher cap rates. The recent acquisition of a 45,000 SF Community Center in South Dade for over
$15 million or over $340/SF at a 6% cap rate highlights these pricing differences. The buyer, Lumer Real Estate, acquired the fully leased property with LA Fitness as tenant, in January.
Additionally, deals involving assumable debt have also
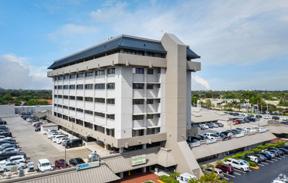
helped drive volume, with the second-largest trade of 2023 concerning a debt assumption. The deal involved a twoproperty portfolio including an 84,000-SF office tower and a 135,000-SF neighborhood center in Kendall built in the 1980s. The property was acquired by Orion Real Estate Group from Cofe Properties for a combined total of $58 million in September. The buyer assumed the existing debt with an outstanding balance of $39 million from JPMorgan Chase. The new owner plans to reinvigorate the tenant roster to add new value to the property.
Going forward, economic headwinds and higher cap rate should result in slower transaction activity and pricing gains. In fact, average transaction cap rates have expanded by over 100 basis points from the low-5% range to the mid-6% range over the past year. Transaction cap rates for larger deals of over $10 million have increased from lows in the mid-4% range in 2022 to over 6% today. That said, Miami retail continues to see healthy demand in the face of limited supply, and an eventual loosening of financial conditions should help attract investment in the future.
Coral Gables Submarket | Coral Gables, FL 33134
SALE DATE
SALE PRICE
LEASED
HOLD PERIOD
RBA YEAR BUILT
Jul 202
$55M ($383/SF) 100%
138 Months
143,716 SF 2012
BUYER
SELLER
SALE TYPE
SALE COND
Dream Motor Group (USA)
Bill Ussery Motors Inc (USA) Investment
Bulk/Portfolio Sale
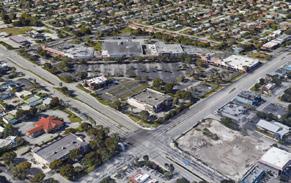
Mall at 163rd | Northeast Dade Submarket | North Miami Beach, FL 33162
SALE DATE
SALE PRICE
LEASED
HOLD PERIOD
RBA
YEAR BUILT
Mar 2024
$46M ($148/SF) 77%
153 Months
311,171 SF 1956 (Renov 1990)
BUYER
SELLER
BROKER
SALE TYPE
SALE COND
South Dade Submarket | Cutler Bay, FL 33189
SALE DATE
SALE PRICE
LEASED
HOLD PERIOD
RBA YEAR BUILT
Jul 2023
$45M ($289/SF) 100%
186 Months 155,837 SF 2008
BUYER SELLER
SALE TYPE
SALE COND
Taillard Capital (USA)
Brixmor (USA)
Avison Young Investment
High Vacancy Property
Dream Motor Group (USA)
Bill Ussery Motors Inc (USA) Investment
Bulk/Portfolio Sale
Coral Gables Submarket | Coral Gables, FL 33134
SALE DATE
SALE PRICE
LEASED
HOLD PERIOD
RBA YEAR BUILT
Jul 2023
$45M ($236/SF) 100%
18 Months
190,678 SF 2022
BUYER SELLER
SALE TYPE
SALE COND
Dream Motor Group (USA)
Bill Ussery Motors Inc (USA) Investment
Bulk/Portfolio Sale
Dadeland Square | Kendall Submarket | Miami, FL 33156
SALE DATE
SALE PRICE
LEASED
HOLD PERIOD
RBA
YEAR BUILT
Sep 2023
$38.4M ($284/SF) 90%
110 Months 135,290 SF 1983 (Renov 1989)
BUYER
BROKER
SELLER
BROKER
SALE TYPE
SALE COND
Orion Real Estate Group (USA)
Avison Young
CoFe Properties (USA)
Avison Young Investment
Debt Assumption
SOURCE: COSTAR
Miami’s retail construction pipeline remains active, although there has been a notable drop in construction starts in the past two years. That said, there is currently around 1.1 million SF of new retail space underway, and around 840,000 SF has delivered in the past 12 months. While under-construction totals have come off of elevated levels, 2023 saw the second-highest level of deliveries since 2020. 2024 is expected to see delivery of most of the underconstruction SF, though this will remain below the levels delivered in 2023. 2025 deliveries are expected to fall even further, with supply additions slowing significantly below long-term averages throughout the forecast period.
Healthy demand in 2023 was sufficient to maintain vacancy rates at historic lows of 2.8%, as the majority of new supply additions have seen healthy lease-up. In fact, only around 75,000 SF is available in properties underway, indicating the strong demand for new space. Additionally, net absorption has exceeded the pace of new deliveries since 2021, indicating there may be additional runway for new projects in growing areas.
Retail development has pushed northward and southward towards Northeast Dade and South Dade, respectively, where combined retail inventory has grown by more than 1.7 million SF in the past five years. The Coral Gables and Miami submarkets have also seen a significant amount of development, with combined inventory growth of over 1.1 million SF over the same time period. The bulk of new construction is concentrated in the Downtown Miami, Northeast Dade, Miami Gardens/Opa Locka and South Dade submarkets, representing over 70% of supply underway.
Among all projects underway, a majority are composed of properties smaller than 75,000 SF. There are three properties underway that are larger than 100,000 SF, spread out across several submarkets. These include 300,000 SF at the mixeduse Miami World Center in Downtown Miami, 250,000 SF for the expansion at the high-fashion shopping center of the Bal Harbour Shops, and 175,000 SF at the mixed-use Block 55 apartments at Sawyers Walk also in Downtown Miami. These projects have also seen healthy pre-leasing demand.

Fort Lauderdale retail leasing activity has slowed over the past 12 months, with over 2.3 million SF leased through the fourth quarter of 2023, down from peak levels of over 3.3 million SF leased as of the second quarter of 2021. This slowdown in leasing activity is mainly driven by a lack of available space, as total leased SF now makes up over 13% of available space, up from around 11% on average from 2015 through 2019. Healthy demand has resulted in positive annual net absorption of 120,000 SF, helping drive availability down to 4.3% as of the second quarter of 2024, well below the five-year average availability rate of 4.9%.
With tenant move-outs remaining below the five-year historical average and limited supply additions, space availability is expected to remain tight, well below the U.S. average for the foreseeable future. The largest leases over the past two years have been signed by entertainment, grocery, and fitness tenants including Puttshack, Crunch Fitness, and Aldi supermarket.
Demographic growth along with the return of tourists continues to further bolster Fort Lauderdale resident and tourism spending. Elevated retail sales have helped drive strong rent gains for retail space in the area, with annual growth at 4.1%, though this has slowed from peak levels of 11.2% at the end of 2022.
Despite elevated deliveries from 2021 through 2023, with around 990,000 SF added to the market in those three years combined, 2024 presents a muted construction pipeline, with just over 100,000 SF expected to be delivered. Higher interest rates as well

SOURCE: COSTAR
as elevated land values continue to weigh on developer activity in the market, with construction starts slowing. This should help retail vacancies remain tight at around 3.6%, below the 10-year historical average of 4.3%. Looking forward, Fort Lauderdale retail vacancies are expected to remain tight, below the national average vacancy rate.
Annual transaction volume has slowed, with just over $441 million in trades through the first quarter of 2024, well below the five-year annual average volume of $1.0 billion. Despite strong fundamentals of tight vacancies and healthy rent gains, higher interest rates, which are driving cap rates higher, are resulting in a drop in pricing. Annual transaction cap rates remain flat relative to one year ago at 6.0%, though these have moved higher in recent months, with average quarterly cap rates increasing to over 6% through the fourth quarter of 2023. Additionally, transaction sizes have shrunk as institutional players remain less active, with the average transaction in 2023 totaling $3.2 million, down from $4.3 million in 2022. Despite this, the market’s increased attractiveness, coupled with a limited availability of space, should drive an outperformance in rent gains and values compared to the national average.


Transaction volume has slowed, with just over $677 million in trades over the past 12 months, below the five-year annual average of $1.0 billion. In comparison, over $1.5 billion traded in both 2021 and 2022. When looking at a longer horizon, Fort Lauderdale has been an active market in terms of retail investment sales activity, with average annual transaction volume of $1.0 billion over the past 10 years.
After pricing appreciation of around 30% since 2019, price growth has begun to slow since the second quarter of 2023. Economic headwinds impacting investment activity should further slow pricing gains in the near term as higher interest rates drive an expansion in cap rates. Average transaction cap rates expanded by 100 basis points, from the mid-5% range to the mid-6% range, through 2023. Additionally, the average transaction size has fallen by 20% from elevated levels in 2021, as large institutional buyers increasingly remain on the sidelines relative to prior levels of activity.
Despite a slowdown in large transactions of more than $20 million from double digits in 2021 and 2022, 2023 had a few large trades, which are indicative of market pricing. These large transactions are composed of grocery anchored centers, which highlight a continuation of prepandemic trends favoring this retail subtype. The largest single property trade for the year totaled over $56 million for an over 106,000-SF Community Center located at 16000 Pines Blvd. in Pembroke Pines. Apollo Global Management purchased the center from Terra Group in August for over
$523/SF at a 6% cap rate. The property was 98% occupied when sold and is anchored by a Publix supermarket and Burlington. Other tenants include Crunch Fitness, Verizon Wireless, First Watch Café, Tropical Smoothie Café, Jersey Mike’s Subs, and Cheddar’s Scratch Kitchen.
Going forward, a slowing economy and higher interest rates, resulting in a near-term pricing correction, will likely continue to drive slower transaction activity relative to the boom in 2021 and 2022. Higher cap rates, coupled with softening fundamentals, will likely remain a drag to market activity at
least until an eventual loosening of financial conditions occurs.
Fort Lauderdale’s retail construction pipeline remains limited, as there has been a notable drop in construction starts since 2019. That said, there is currently 851,341 SF of new retail space underway, and 370,000 SF has delivered over the past 12 months. Limited construction activity will result in few deliveries over the next few years, with inventory additions staying below the 10-year historical average of 480,000 SF through at least 2025.
Healthy demand through the near-term forecast should help keep vacancies in check, well below the U.S. average. That said, net absorption is expected to slow through the next few years, largely due to the lack of available space for lease-up.
Since 2020, retail development has significantly expanded in the Southwest Broward, Fort Lauderdale, Plantation, and Hallandale submarkets, each seeing inventory growth of over 530,000 SF, 317,000 SF, 139,000 SF, and 122,000 SF, respectively. Current construction, representing over 70% of activity in the Fort Lauderdale market, is concentrated in Hallandale, Southwest Broward, and Plantation submarkets with around 190,000 SF, 100,000 SF, and 85,000 SF underway, respectively.
SOURCE: COSTAR
Ramblewood Square Shopping Center | NW Broward/Coral Springs
Submarket | Coral Spring...
SALE DATE
SALE PRICE
LEASED
HOLD PERIOD RBA YEAR BUILT
May 2024
$34.1M
BUYER SELLER
SALE TYPE
Plantation Submarket | Davie, FL 33317
SALE DATE
SALE PRICE
LEASED
HOLD PERIOD RBA YEAR BUILT
Jul 2024
$24.5M ($222/SF) 100%
154 Months 110,204 SF 1997
BUYER SELLER
SALE TYPE
SALE COND
Publix Super Markets Inc. (USA) Apollo Global Management (USA) Investment
BBX Capital, Inc. (USA) +1 Map Legacy Inc (USA) Investment Redevelopment Project
Shopper’s Haven Shopping Center | Pompano Beach Submarket | Pompano Beach, FL 33064
SALE DATE
SALE PRICE
CAP RATE
LEASED
HOLD PERIOD RBA
Mar 2024
$24.5M ($134/SF)
1964 (Renov 1998) FCA Partners (USA) +1
Partridge Equity Group (USA) Marcus & Millichap Investment
17th Street Quay | Downtown Fort Lauderdale Submarket Fort Lauderdale, FL 33316
SALE DATE
SALE PRICE
LEASED
HOLD PERIOD
RBA
YEAR BUILT
Apr 2024
$20.1M ($188/SF) 86% 85 Months 106,635 SF 1983
BUYER SELLER BROKER
SALE TYPE
Jamestown, L.P. (USA) Regency Centers Corpora... (USA) JLL Investment
Cypress Run Marketplace | NW Broward/Coral Springs Submarket | Coral Springs, FL 33071
SALE DATE
SALE PRICE
LEASED
HOLD PERIOD RBA YEAR BUILT
May 2024
$22M ($548/SF) 93% 61 Months 40,150 SF 1988
BUYER BROKER SELLER BROKER
SALE TYPE
BH Group (USA) +2 Darrow Everett LLP
AEW Capital Management (USA) +1 JLL Investment
SOURCE: COSTAR
Four large scale retail developments have delivered since 2019. The largest delivery has been a 210,000-SF auto dealership in the Downtown Fort Lauderdale Submarket, followed by a 157,000-SF freestanding property that houses a Costco in the NW Broward/Coral Springs Submarket, a 151,000-SF community center in the Southwest Broward Submarket, and a 110,000-SF neighborhood center in NW Broward/Coral Springs. All of these properties are fully leased, with the community center at 98% occupancy.
The three largest projects underway include more than 140,000 SF of retail space at 777 Isle of Capri Blvd. in Pompano, 130,000 SF Seneca Town Center in the Hallandale Submarket, and 78,000 SF at the Davie Promenade. All three properties are expected to deliver in 2025 and have seen healthy pre-leasing.

Palm Beach retail leasing activity has slowed over the past 12 months, with over 1.8 million SF leased through the first quarter of 2024, down from recent peak levels of over 2.4 million SF leased as of the third quarter of 2021. This slowdown in leasing activity is mainly driven by a lack of available space, as total leased SF now makes up over 13% of available space, up from around 11% on average from 2015 through 2019. Still, net absorption has remained positive over most of the last three years, with the exception of the first quarter of 2024, which saw some minor move-outs.
This recent tenant churn has driven annual net absorption to negative territory, contracting by -300,000 SF. Still, this had a limited impact on the availability rate which stands at 4.9% as of the third quarter of 2024, below the five-year average availability rate of 4.9%. With tenant move-outs remaining below the five-year historical average and limited supply additions, space availability is expected to remain tight, well below the U.S. average over the next few years.
Over the past few years, the influx of high-net-worth individuals continues to further bolster Palm Beach resident spending. Elevated retail sales have helped drive strong rent gains for retail space in the area, with annual growth at 6.1%, though this has slowed from peak levels of 8.0% in the third quarter of 2023.
Construction has remained largely muted, with 2023 deliveries totaling just over 310,000 SF, falling below the 10-year average of 430,000 SF in annual

SOURCE: COSTAR
additions. Higher interest rates and elevated land values continue to weigh on developer activity in the market, with construction starts slowing continuously from 2022 levels. This should help retail vacancies remain tight at around 3.7%, below the 10-year historical average of 4.2%. Looking forward, Palm Beach retail vacancies are expected to remain tight, well below the national average vacancy rate.
Transaction volume has slowed, with $545 million in trades over the past 12 months, below the five-year annual average of $948 million. Despite strong fundamentals of tight vacancies and healthy rent gains, higher interest rates, which are driving cap rates higher, are resulting in a drop in pricing. Weighted average transaction pricing over the past 12 months has contracted over 3% relative to peak pricing seen in the first quarter of 2023. Annual transaction cap rates remain flat relative to one year ago at 5.8%, though these have moved higher in recent months, with average quarterly cap rates increasing to over 6% since the second quarter of 2023. Additionally, the average transaction size has fallen by 20% from elevated levels in 2022, as large institutional buyers increasingly remain on the sidelines relative to prior levels of activity.


Transaction volume has slowed, with $545 million in trades over the last year, below the long-term average of $925 million over the past 10 years. When looking at a longer horizon, Palm Beach has been an active market in terms of retail investment sales activity, with 2022 volume reaching record levels of over $1.37 billion, beating the prior record of $1.3 billion in 2015.
After average annual transaction pricing appreciation of around 40% since 2019, price growth has begun to slow since the second quarter of 2023. Economic headwinds impacting investment activity should further slow pricing gains in the near term as higher interest rates drive an expansion in cap rates. Average transaction cap rates have expanded by over 100 basis points from the low-5% range to the mid-6% range through 2023.
Market participants continue to note strong demand for grocery-anchored and services-oriented centers, which have composed a large share of trades since 2023. In fact, one of the largest trades of 2024 involved the sale of a fully leased neighborhood center that traded at a 7% cap rate, a slight premium to the asking cap rate of 7.1%. The 75,000 SF Village Square of Tequesta for over $20 million or $269/SF. The property, anchored by West Marine, has an in-place average rent of over $21/SF NNN with a WALT of three years and an average tenant tenure of 10 years.
Another large transaction, also for a grocery-anchored center, involved the sale of two retail properties totaling over 120,000 SF located at 4050 and 4302 S U.S. Highway 1 in Jupiter. The shopping center called Bluffs Square Shoppes sold for over $39 million, or over $315/SF. These Class B retail buildings, delivered in 1986, are 98% leased to Publix, Walgreens, and national and local tenants,
including Uncle Eddie’s, Anthony’s Women Apparel, Goodwill, UPS, Toojay’s Deli, and Café Sole. The buyer BPS Partners LLC is a regional developer/owner headquartered in Palm Beach. Despite being well anchored, also by a Publix, the property traded at a discount to the sale located in Boynton/Lantana, as this shopping center is older and traded in the latter half of the year when yields had already risen significantly.
Additionally, a major portfolio of 12 retail properties located in Boca Raton traded in August of 2023. Terranova Corporation sold the Shadowwood Square shopping center to Edens for over $88 million, or $372/SF. The shopping center, built in 1982 and renovated in 1996, totals over 237,000 SF and is located on the Eastern edge of the Mission Bay neighborhood, which houses high medianincome households. The center is anchored by Sprouts Farmers Market, along with Walgreens and Old Navy. There are two vacant anchor spaces formerly occupied by Regal Cinema and Bed Bath & Beyond.
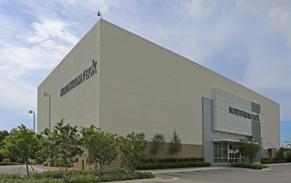
Boca Raton West Submarket | Boca Raton, FL 33434
SALE DATE
SALE PRICE LEASED HOLD PERIOD RBA YEAR BUILT
Jan 2024
$23.5M ($468/SF) 100%
20+ Years 50,267 SF 1999
BUYER SELLER BROKER
SALE TYPE
Christ Fellowship Church,... (USA) Macy’s, Inc. (USA)
Atlantic Retail Owner User
Linton Commons | Delray Beach Submarket | Delray Beach, FL 33444
SALE DATE
SALE PRICE
Nov 2023
$22M ($279/SF) 100%
89 Months 78,902 SF 1990 (Renov 2008)
BUYER SELLER SALE TYPE
Benderson Development... (USA Menin Development, Inc. (USA) Investment
Village Square of Tequesta | Jupiter Submarket | Tequesta, FL 33469
SALE DATE
SALE PRICE
CAP RATE LEASED
HOLD PERIOD RBA
Mar 2024
$20.3M ($269/SF) 7.0% (Actual) 100%
80 Months 75,419 SF
YEAR BUILT BUYER SELLER
BROKER
SALE TYPE
1957
Shannon Waltchack (USA) MNR Investments, Inc (USA) +1 LACONIC CAPITAL ADVISORS Investment
Shadowood Square | Boca Raton West Submarket | Boca Raton, FL 33434
SALE DATE
SALE PRICE
LEASED
HOLD PERIOD RBA
YEAR BUILT
Aug 2023
$14.6M ($257/SF) 89%
20+ Years
56,657 SF 1982 (Renov 1996)
BUYER
SELLER
BROKER
SALE TYPE
SALE COND
EDENS (USA)
Terranova Corporation (USA) Cushman & Wakefield Investment
Bulk/Portfolio Sale
Plaza La Mer Shopping Center | Jupiter Submarket | Juno Beach, FL 33408
SALE DATE
SALE PRICE
LEASED
HOLD PERIOD RBA YEAR BUILT
Sep 2023
$13.2M ($237/SF)
Bucksbaum Properties, LLC (USA) I nanc Kirgiz (USA) CBRE Investment
SOURCE: COSTAR
Palm Beach’s retail supply pipeline remains limited, as construction starts have remained at or below the 10-year average of 600,000 SF since 2016. That said, there is currently around 330,000 SF of new retail space under construction, and around 160,000 SF has delivered in the past 12 months. Limited construction activity will result in minimal deliveries over the next few years, with 2024 forecast supply additions remaining below the 10-year historical average of 430,000 SF.
Healthy demand through the near-term forecast should help keep vacancies in check, well below the U.S. average. That said, net absorption is expected to moderate in 2024, largely due to the lack of available space for lease-up.
Since 2020, retail development has been concentrated in the Delray Beach, Boynton/Lantana, and North Palm Beach Submarkets, seeing supply growth of over 400,000 SF, 300,000 SF, and 280,000 SF, respectively. Over 60% of current construction is concentrated in the Palm Beach, Boynton/Lantana, and West Palm Beach submarkets, with around 200,000 SF, more than 110,000 SF, and more than 100,000 SF underway, respectively.
Three large-scale retail developments have delivered since 2019, with one currently underway. The largest delivery since 2019 has been a 220,000-SF auto dealership in the Delray Beach Submarket, followed by a 119,000-SF community center that houses a Home Depot in the Palm Beach Submarket, and a 116,000-SF lifestyle center that houses a Life Time Fitness also in the Palm Beach Submarket. All of these properties are fully leased.
The largest project currently underway includes 60,000 SF at The District at Northwood in the Palm Beach CBD. The mixeduse proeprty includes a multifamily component with 10% of units composed of workforce housing.