Coupling digital and green skills to deliver an inclusive twin transition
COUPLING DIGITAL AND GREEN SKILLS TO DELIVER AN INCLUSIVE TWIN TRANSITION
Iris Smiderle, Filippo Bontadini, Francesco Filippucci, Cecilia Jona-Lasinio, Giuseppe Nicoletti, Alessandro Saia
OECD-Italy’s Department of Treasury Taskforce for Multilateral Policy Support
Green and digital transitions have skill requirements that offer synergies and equity/inclusion challenges
The global economy is undergoing two transformative shifts: the digital and the green transitions
Specific skills are needed to benefit from the transitions:
• Green skills: needed for jobs most in demand for the green transition (Consolietal.,2016,Causaetal.,2023).
• Digital skills: used to embrace digital technologies (Andrewsetal.,2018;Corradoetal.,2021;OECD,2021).
Available evidence on green or digital skills does not explores the interplay between them
• Country specific studies on green skills (Vonaetal.2018;Valero,etal.,2021;Barretoetal.,2023) & emerging cross-country studies (Dechezleprêtreetal.2020;TyrosandAndrews,2023;Causaetal.,2023).
• Taxonomies of industries by digital intensive occupations (Calvinoetal.,2013,Lennonetal.,2023).
Our goal is to explore the digital and green transitions jointly
1. Present a set of novel indicators on green and digital skills by countries (and sectors).
2. Provide an overview of the synergies between green and digital intensities.
3. Evaluate potential tradeoffs with equity and inclusion.
The implications of digital and green transitions for earnings and inequalities
We use LFS survey from G7 countries over the 2011-2022 period (CA, DE, FR, IT, JP**, UK*, US). Our empirical analysis employs a dual-layered approach, combining individual-level data with occupation-level indicators of digital and green skills:
1. Exploring the implications for earnings
• Understand the role of digital and green skills in shaping earnings patterns.
• Identifying "Twin Transitions Jobs" — occupations that demand high levels of both digital and green skills – Do Twin Transitions Jobs display higher earnings?
2. Exploring the implications for inequality
• If Twin Transitions Jobs have an earning premium, what are the implications for inequality?
• Identifying the factors, particularly the role of gender and education, affecting an individual’s likelihood of being employed in twin transition roles to understand potential consequences for economic inequality.
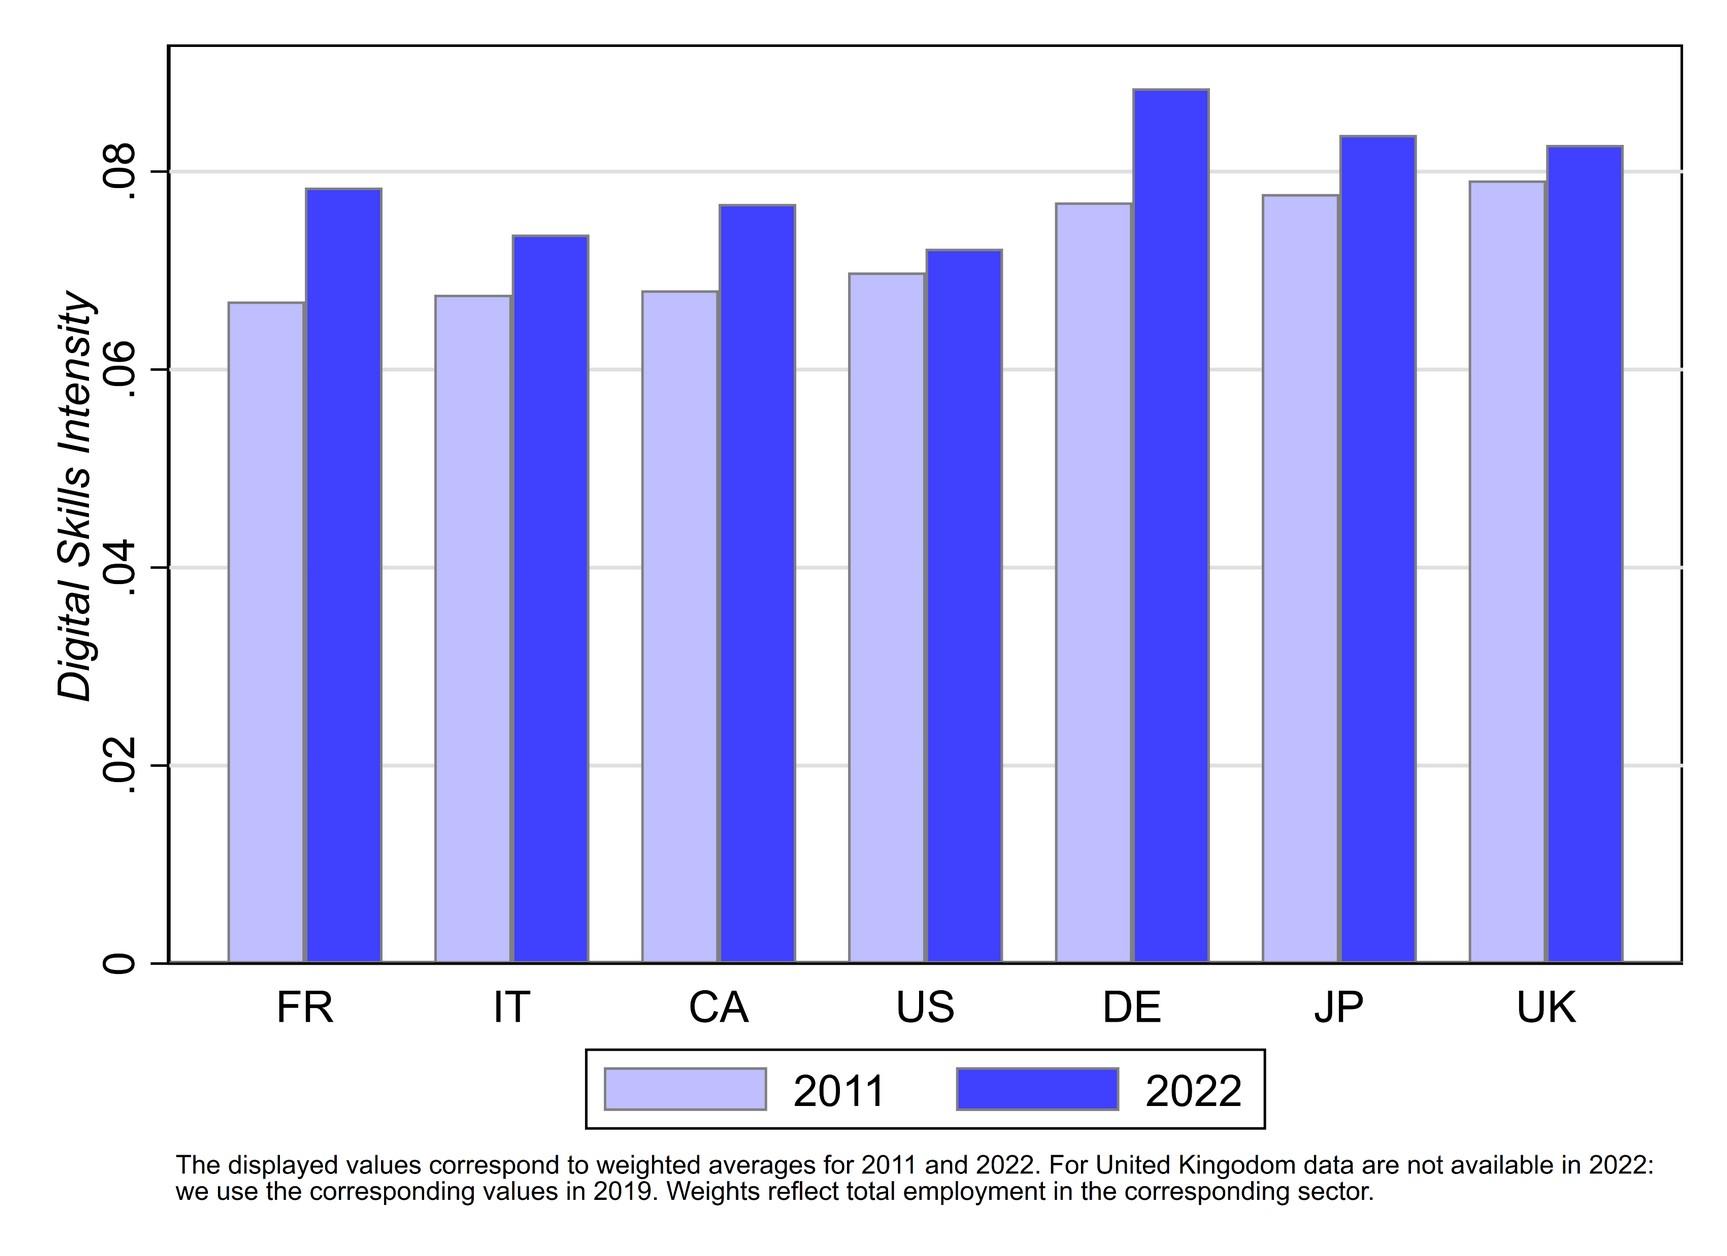
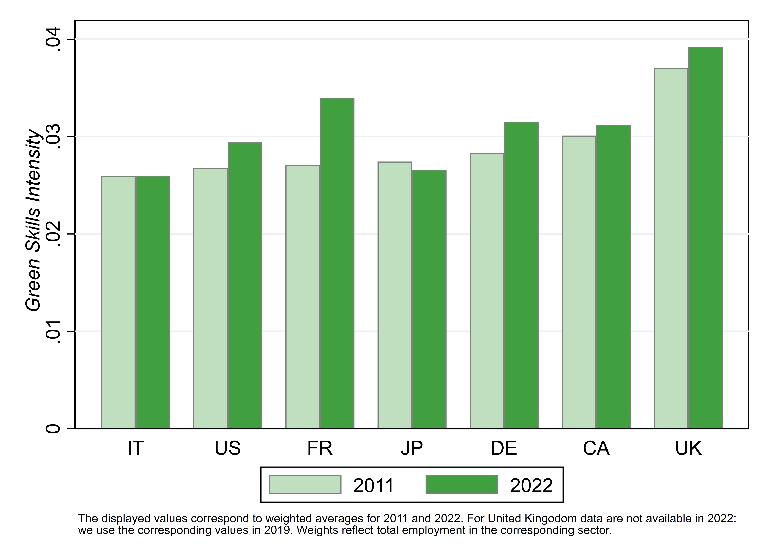
Digital skills and Green skills across countries over time
Digital skill intensity is the proportion of digital skills among all skills used across the whole workforce.
Green skill intensity is the proportion of specific green skills among all skills used across the whole workforce.
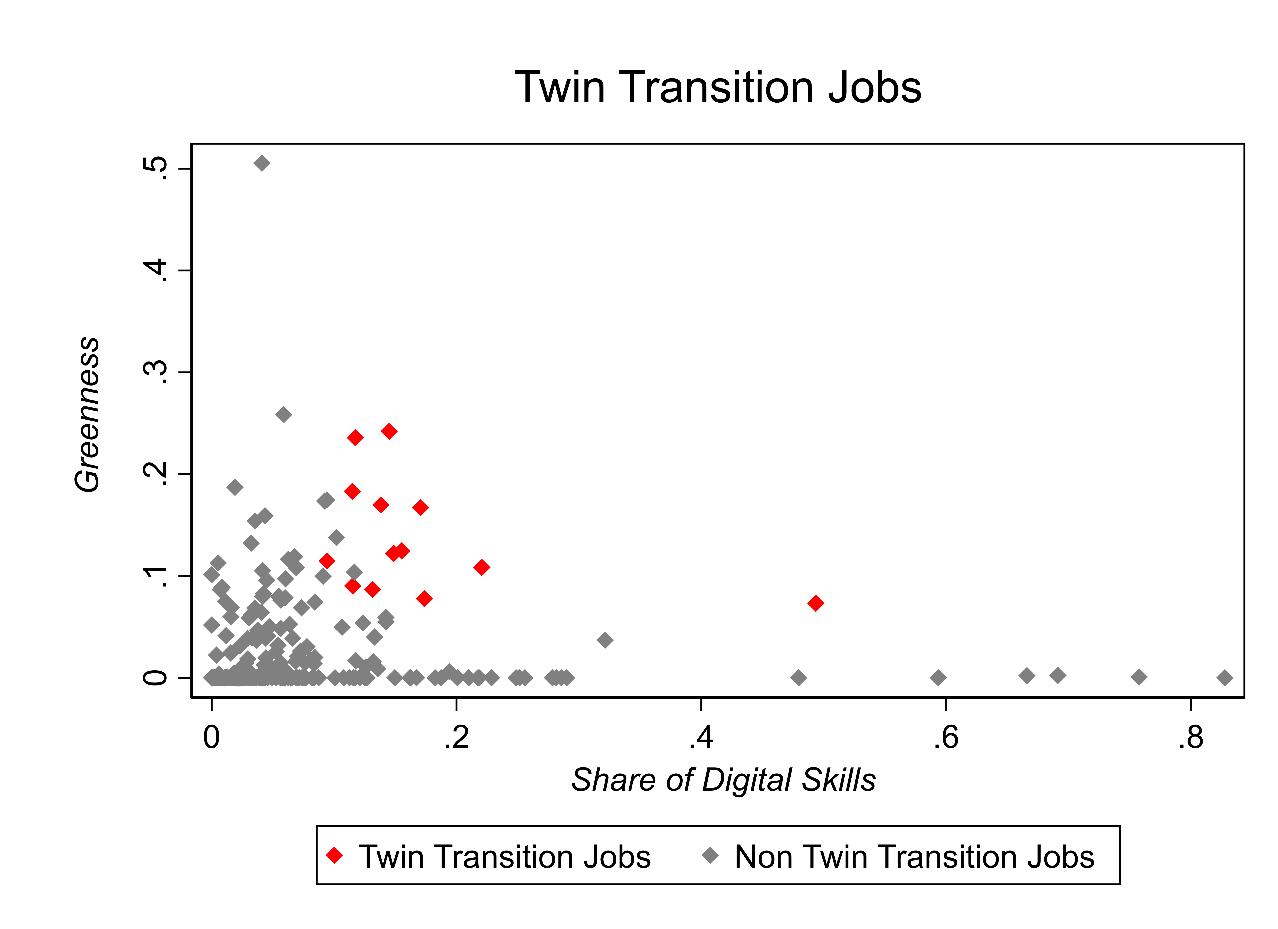
Twin Transition Jobs
as occupations that have high digital AND green skills
Twin Transitions Jobs= (Top 20% digital intensity) & (Top 20% green intensity)
Twin Transition Jobs - Implications for
earnings
Goal: synergies of digital and green skills by checking their relationship with earnings
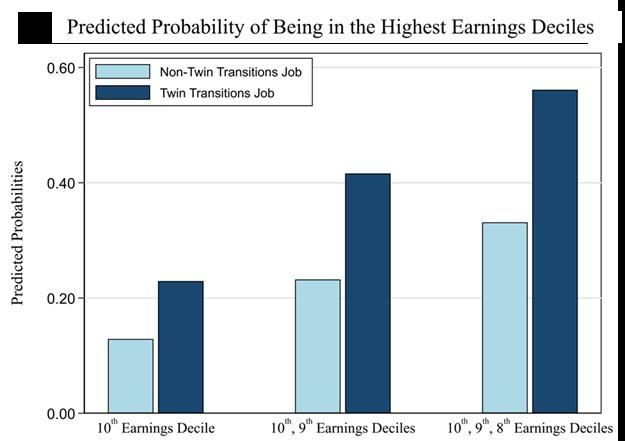
Twin Transition jobs have higher probability of being in highest earning deciles
Twin Transition Jobs -
Implications for inequality
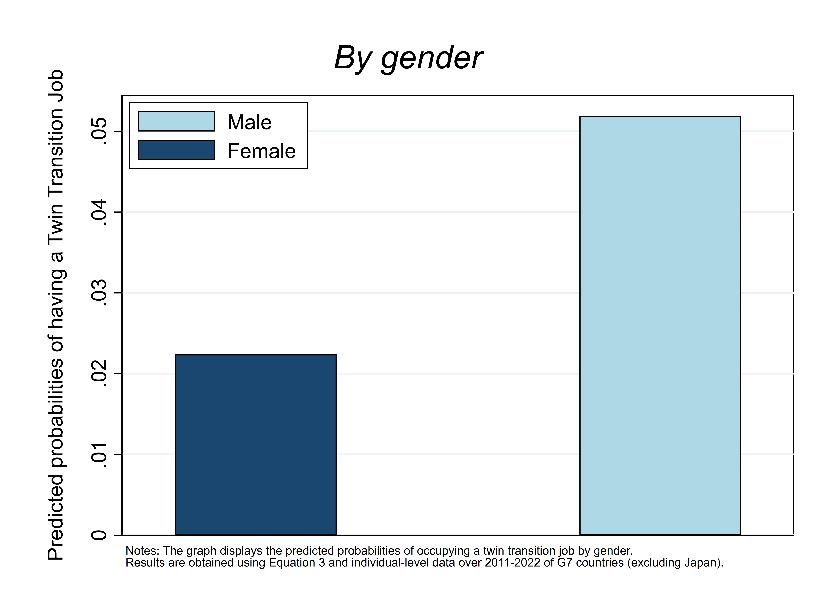
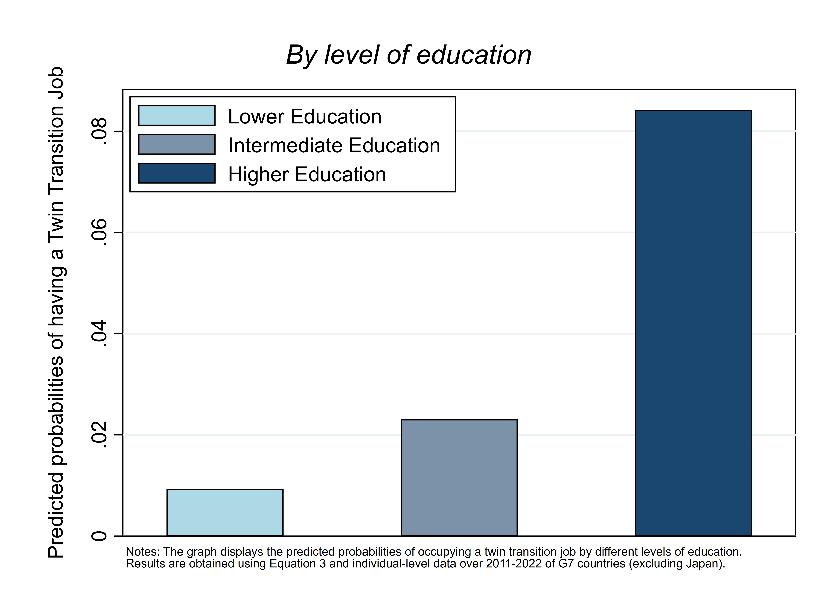
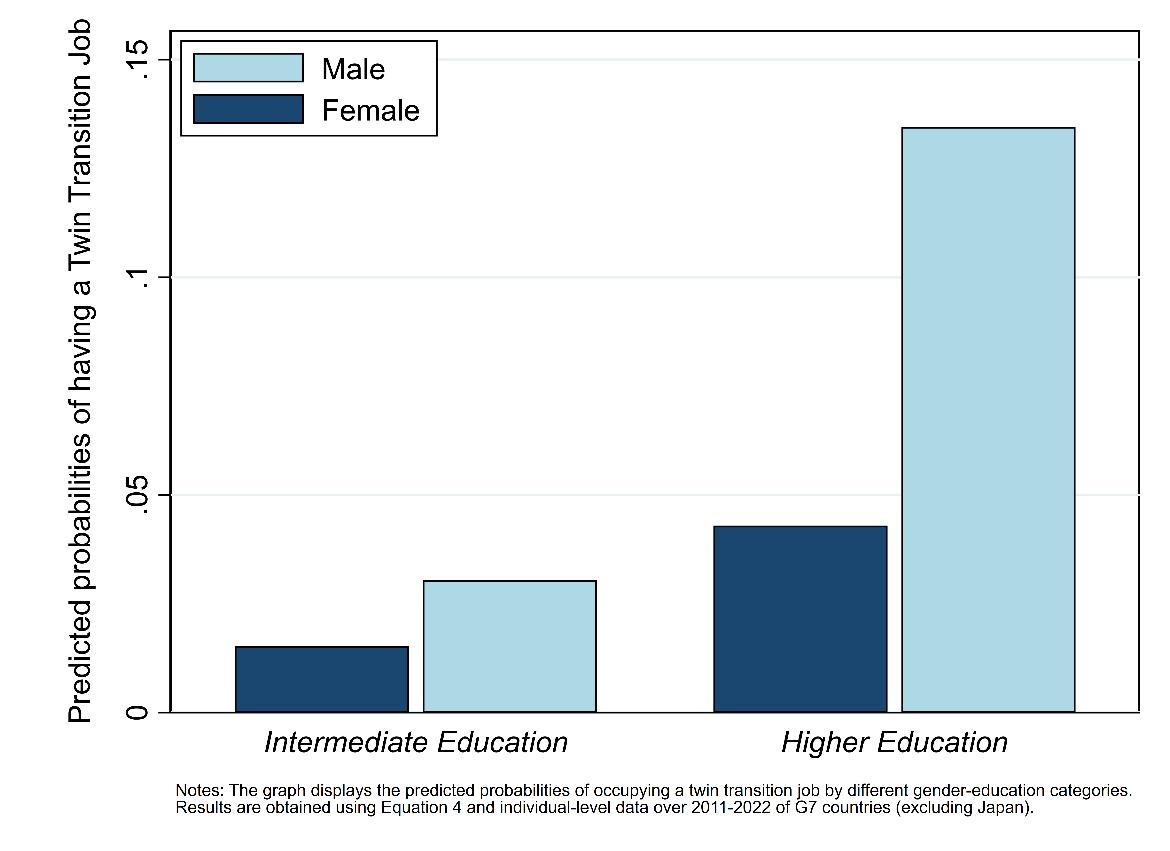
Estimated probabilities of holding a Twin Transition Jobs by gender and educational attainment
Gender Education
Twin Transition Jobs are more likely for male workers and workers with higher education
Conclusions
Green and digital skills are key factors for benefitting from the transitions
Mapping green and digital skills across countries and sectors shows rising intensity everywhere—a trend set to persist as transformative shifts advance.
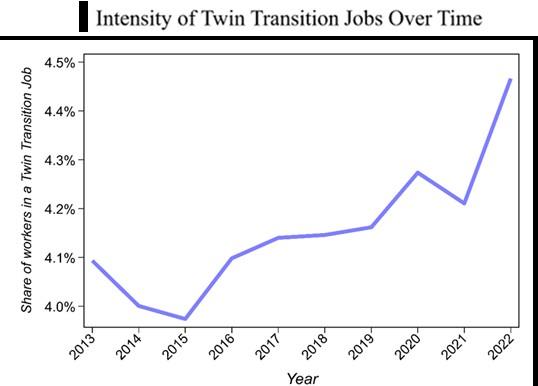
We analyze whether digital and green skills have relevant impact on earnings looking at the role of Twin Transition Jobs (both green and digital), which are on the rise:
• These occupations are positively associated with higher earnings
• This suggests that there may be potential benefits for some workers from the transitions
• If there are (observable) factors that are associated to an individual’s likelihood of being employed in Twin Transition roles, this could potentially reshape the landscape of economic inequality.
Conclusions
We explore implications for inequality
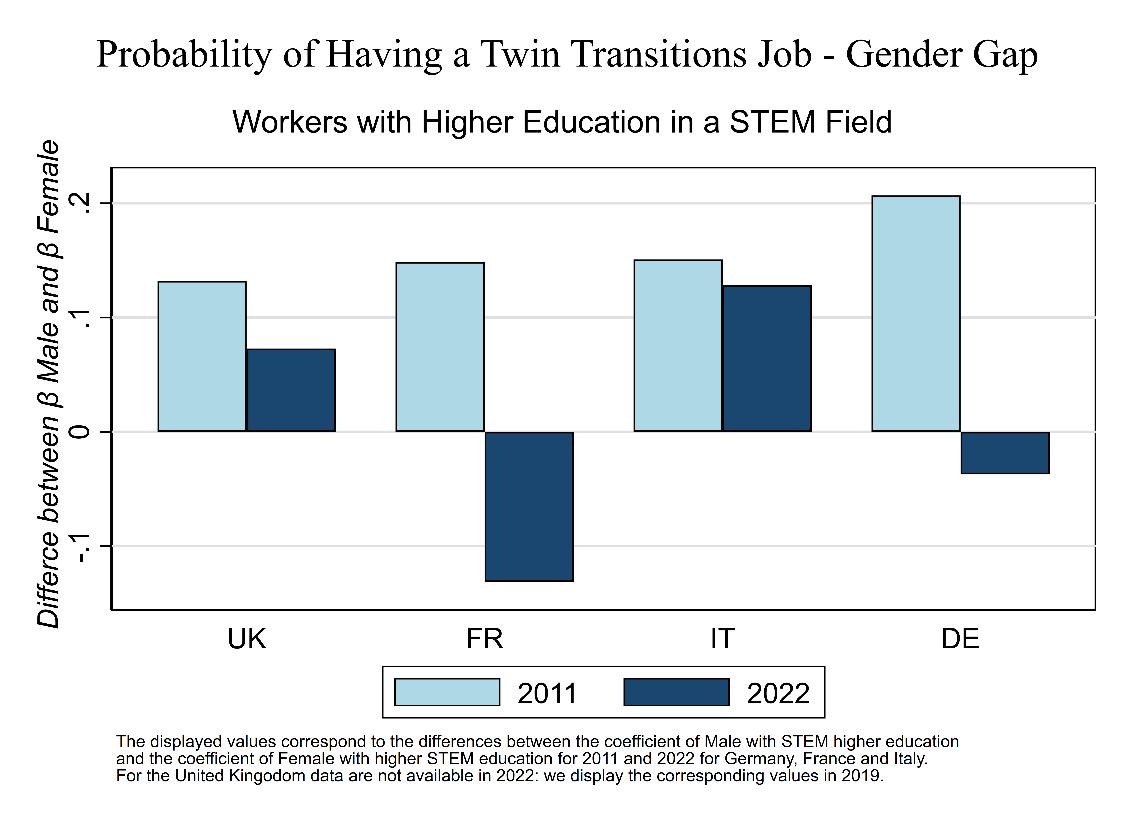
• Males with higher education, particularly in STEM fields, are more likely to hold Twin Transition Jobs
• Despite having STEM degrees, females are less likely to hold these positions
• However, this gender gap is gradually closing over time.
This suggests that the twin transitions may impose potential costs in terms of equity and inclusion.
Empirical analysis shows unequal distribution of both types of skills thus policies should focus:
• on skill measures targeting upskilling or reskilling of low-wage workers, in particular women
• and on those facilitating reallocation of (mainly female) workers towards industries that are intensive in both skills.
G7 countries can play an important role in promoting an inclusive and growth-oriented twin transitions.
ANNEX
Data source
#1: Green skills from O*NET following Vona et al. (2018)
Source: O*NET (Occupational Information Network) provides a database with occupationspecific information for each 8-digit SOC code (USA Standard Occupational Classification system).
Green skills: definition based on the tasks performed in 138 green occupations.
From the O*NET Green Task Development Project
• Green new and emerging (N&E) occupations all tasks categorized as green
• Previous N&E and green and enhanced skills occupations revision of the tasks
O*NET assigns to each SOC 8-Digits code a number of specific tasks. Specific tasks are divided in green and nongreen.
Vona et al. (2018): GREENNESS of US occupation k #green specific tasksK #total specific tasksK
O*NET
Greenandnongreen skills in each occupation
Methodology: green skills intensity by country and industry
Vona et al. (2018):
Green-skill in. occupations at 8 digits
SOCforUS
Aggregation based on CPS occupational composition
Green-skill in. occupations for 43 NOC forCanada
1. If multiple SOC 6 digit occupations correspond to one NOC, aggregated using SOC employment
2. If a single SOC 6 digit corresponds to multiple NOC 2 digits occupations they are distributed uniformly
Causa et al. (2023): Green-skill in. occupations at 3 digit ISCOforEU
1. If multiple SOC 6 digits occupations correspond to one 4 digit ISCO, aggregated using SOC employment, then collapsed at 3 digits
2. If a single SOC 6 digit corresponds to multiple ISCO 4 digits occupations they are distributed
a) Uniformly (Causa et al., 2023)
b) according to the relative employment weight of ISCO 4 digits, then collapsed at 3 digits
Green-skill intensity by 3 digit
NAICSsector
Green-skill intensity by 1 digitISICforUS
If multiple NAICS 3 digits correspond to one ISIC, aggregated using NAICS employment
If multiple ISIC to one NAICS 3, using NAICS 6 breakdown
Green-skillin.by12
NAICS sectors in Canada
Industry-level green skills intensity depends on occupational composition following LFS Canada
Green-skill intensity by 1digit ISICinCanada
If multiple NAICS 2 digits occupations correspond to one ISCO, aggregated using NAICS employment
Industry-level green skills intensity depends on occupational composition following LFS
Green-skill intensity by 1digit ISICforEU
Green skill intensity across occupations and industries: examples from Italy (2019)
Examples of green occupations and distributions across sectors:
Refuse workers have 51% of skills that are coded as green.
• They represent 30,7% of employment in the sector “Water supply, sewerage, waste management”
• They represent 0,8% of employment in the sector “Administrative and support service activities”
Manufacturing, mining, construction, and distribution managers have 26% of skills that are coded as green.
• They represent 4,3% of employment in the sector “Construction”
• They represent 1,7% of employment in the sector “Water supply, sewerage, waste management”
Example of green occupations and industries (Italy, 2019)
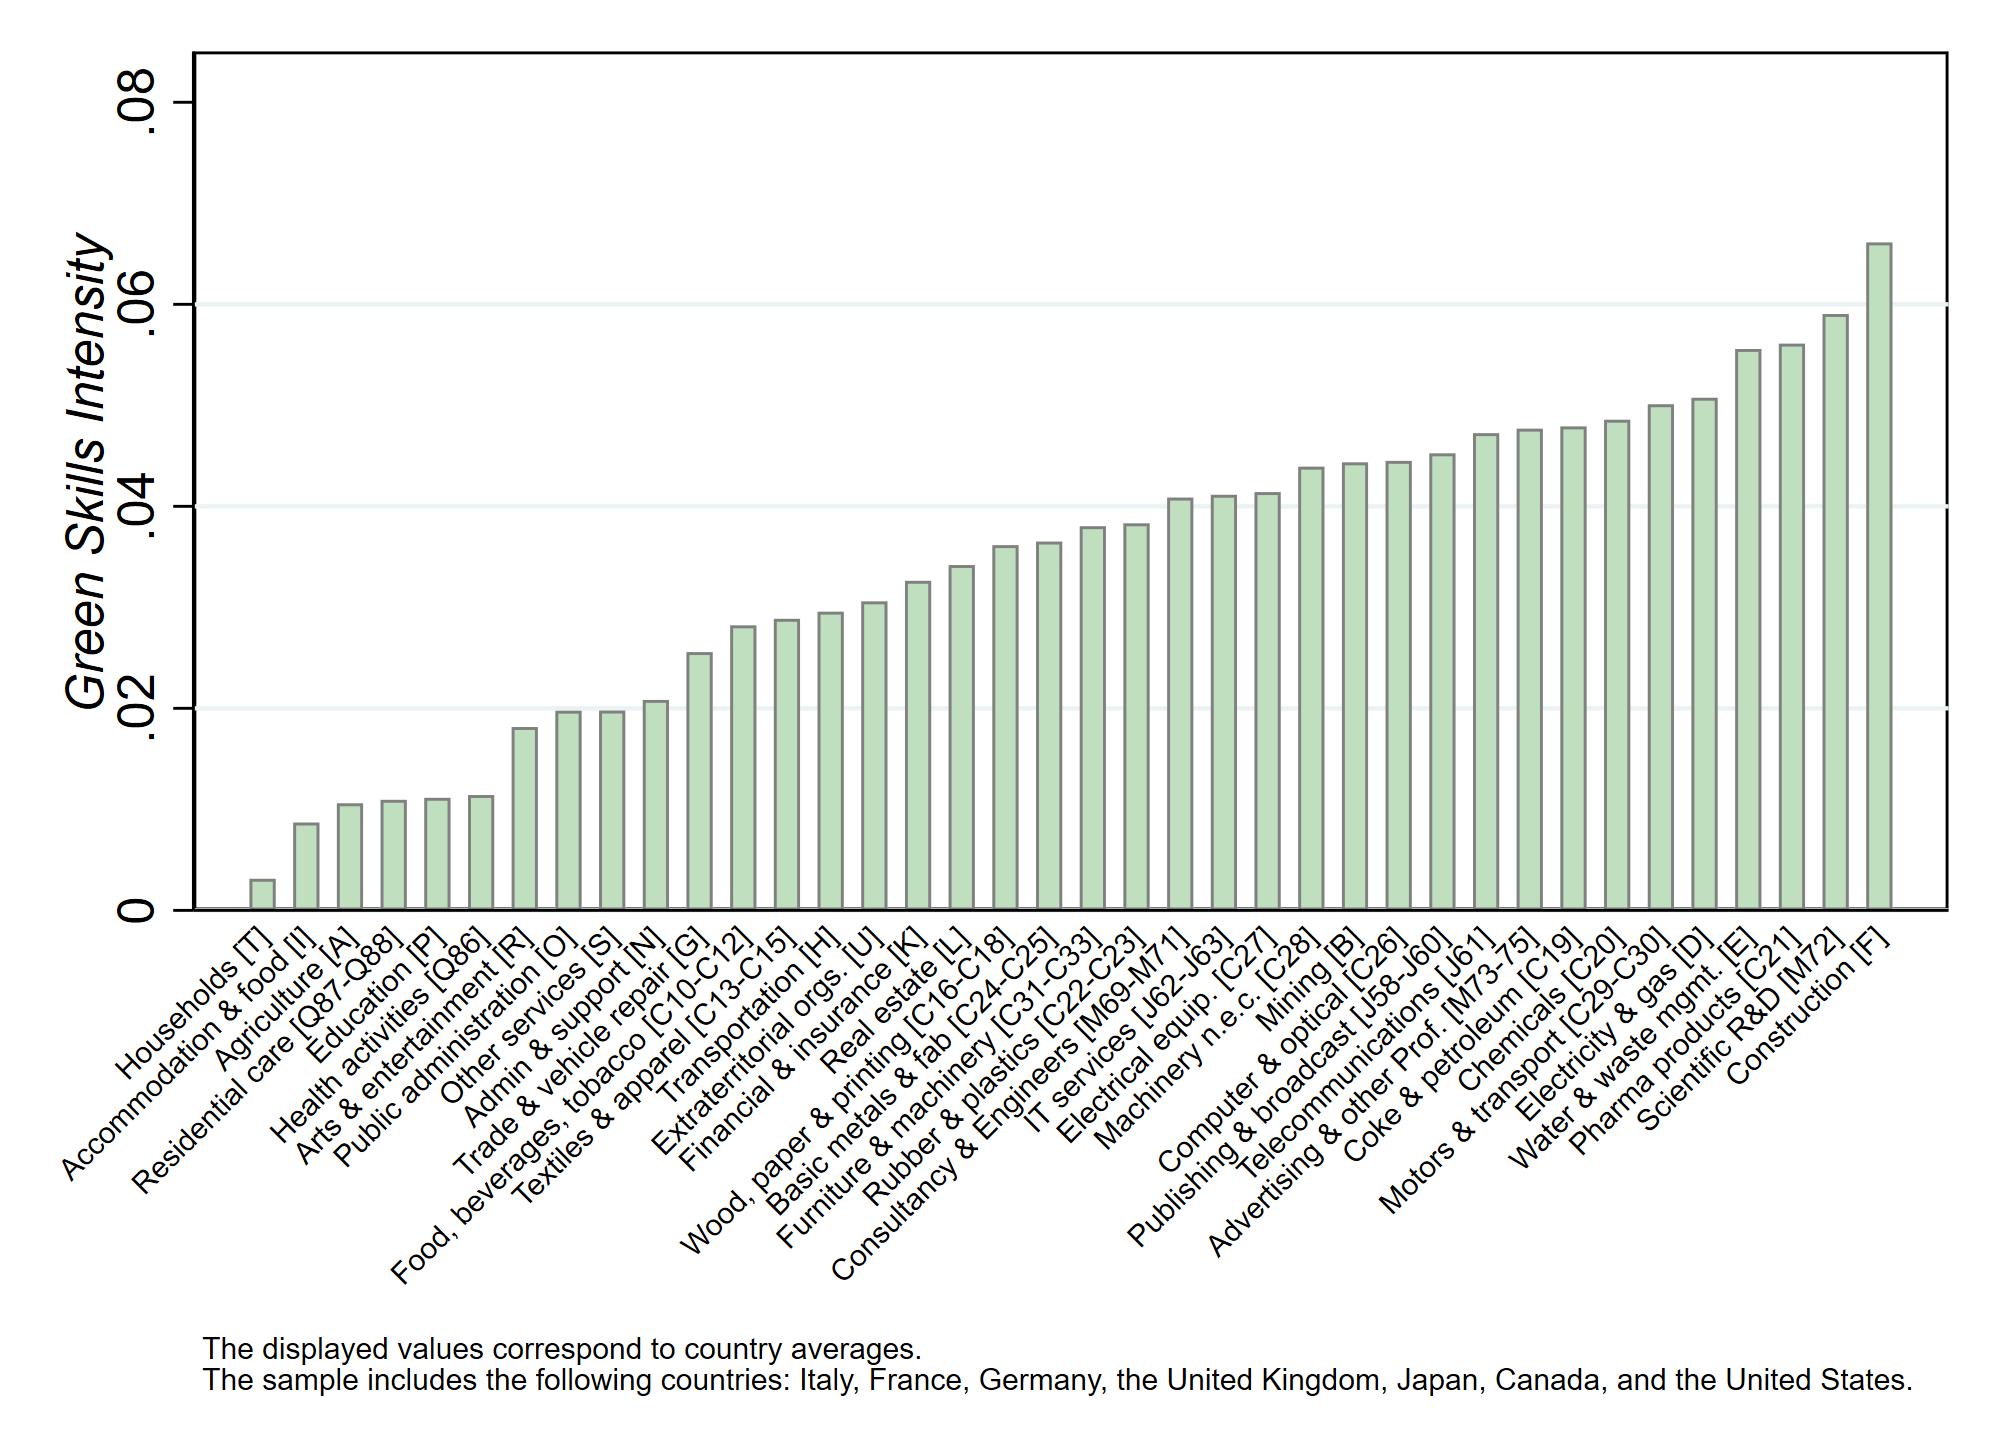
Green skills across sectors
The graph shows the intensity of green skills by sector.
• On average, among total number of skills used in sectors, 3% are green skills
• Highest intensity in construction, water and waste, services like engineering and R&D, and some manufacturing (coke, pharma, chemicals)
Data source #2: Digital skills from Lennon et al. (2023)
Source: ESCO Classification (European Skills. Competences, Qualifications and Occupations, January 2022)
Mapping of tasks, skills, knowledge requirements to each occupation.
Each occupation is mapped to exactly one ISCO-08 code.
Methodology from Lennon et al., 2023, extended to Canada and U..S.:
1. Identify ESCO skills groups that contain terms ‘computer’, ‘ict ’, ‘digital’ (4 groups).
Define any essential skill in these groups as digital (918 skills).
2. - Text analysis of labels and descriptions of all skills.
- Natural Language Processing: select the key-words more predictive of digital skills.
Additional digital skills identified matching the selected key-words to labels of skills (233 skills).
ESCO Taxonomy and hierarchy of skills
Methodology: digital skills intensity by country and industry
Lennon et al. (2023):
Digital intensity of 4 digit ISCO occupations by text analysis of skills employed
Digital-skill in. occupations at 3 digit
SOCforUS
1. If multiple ISCO 4 d. occupations correspond to one SOC, aggregated using ISCO employment
2. If a single ISCO 4 d. Matched to multiple SOC 3 digits occupations, they are distributed according to the relative employment weight of SOC 3 digits
Digital-skill in. occupations for 43 NOC forCanada
1. If multiple ISCO 4 d. occupations correspond to one NOC, aggregated using ISCO employment
2. If a single ISCO 4 d. Matched to multiple NOC occupations, they are distributed uniformly
Digital-skill intensity by 3 digit
NAICSsector
Aggregation based on CPS occupational composition
Digital-skill intensity by 1 digitISICforUS
If multiple NAICS 3 digits correspond to one ISIC, aggregated using NAICS employment
If multiple ISIC to one NAICS 3, using NAICS 6 breakdown
Digital-skillin. by12 NAICS sectors in Canada
Industry-level digital skills intensity depends on occupational composition following LFS Canada
Digital-skill intensity by 1digit ISICinCanada
If multiple NAICS occupations correspond to one ISCO, aggregated using NAICS employment
If multiple ISIC to one NAICS, we used NAICS 6 breakdown (the same used for US
Digital-skill in. occupations at 3 digit ISCOforEU
Aggregation is based on ISCO 4 digits employment
Industry-level digital skills intensity depends on occupational composition following LFS
Digital-skill intensity by 1digit ISICforEU
Digital skill intensity across occupations and industries: examples from Italy (2019)
Examples of digital occupations and distributions across sectors:
Keyboard operators have 83% of skills that are coded as digital.
• They represent 1,66% of employment in the sector “Information and communication”
• They represent 0,68% of employment in the sector “Public administration and defence, compulsory social security”
Software and applications developers and analysts have 69% of skills that are coded as digital.
• They represent 15,94% of employment in the sector “Information and communication”
• They represent 1,27% of employment in the sector “Electricity, gas, steam and air conditioning supply”
Example of digital occupations and industries (Italy, 2019)
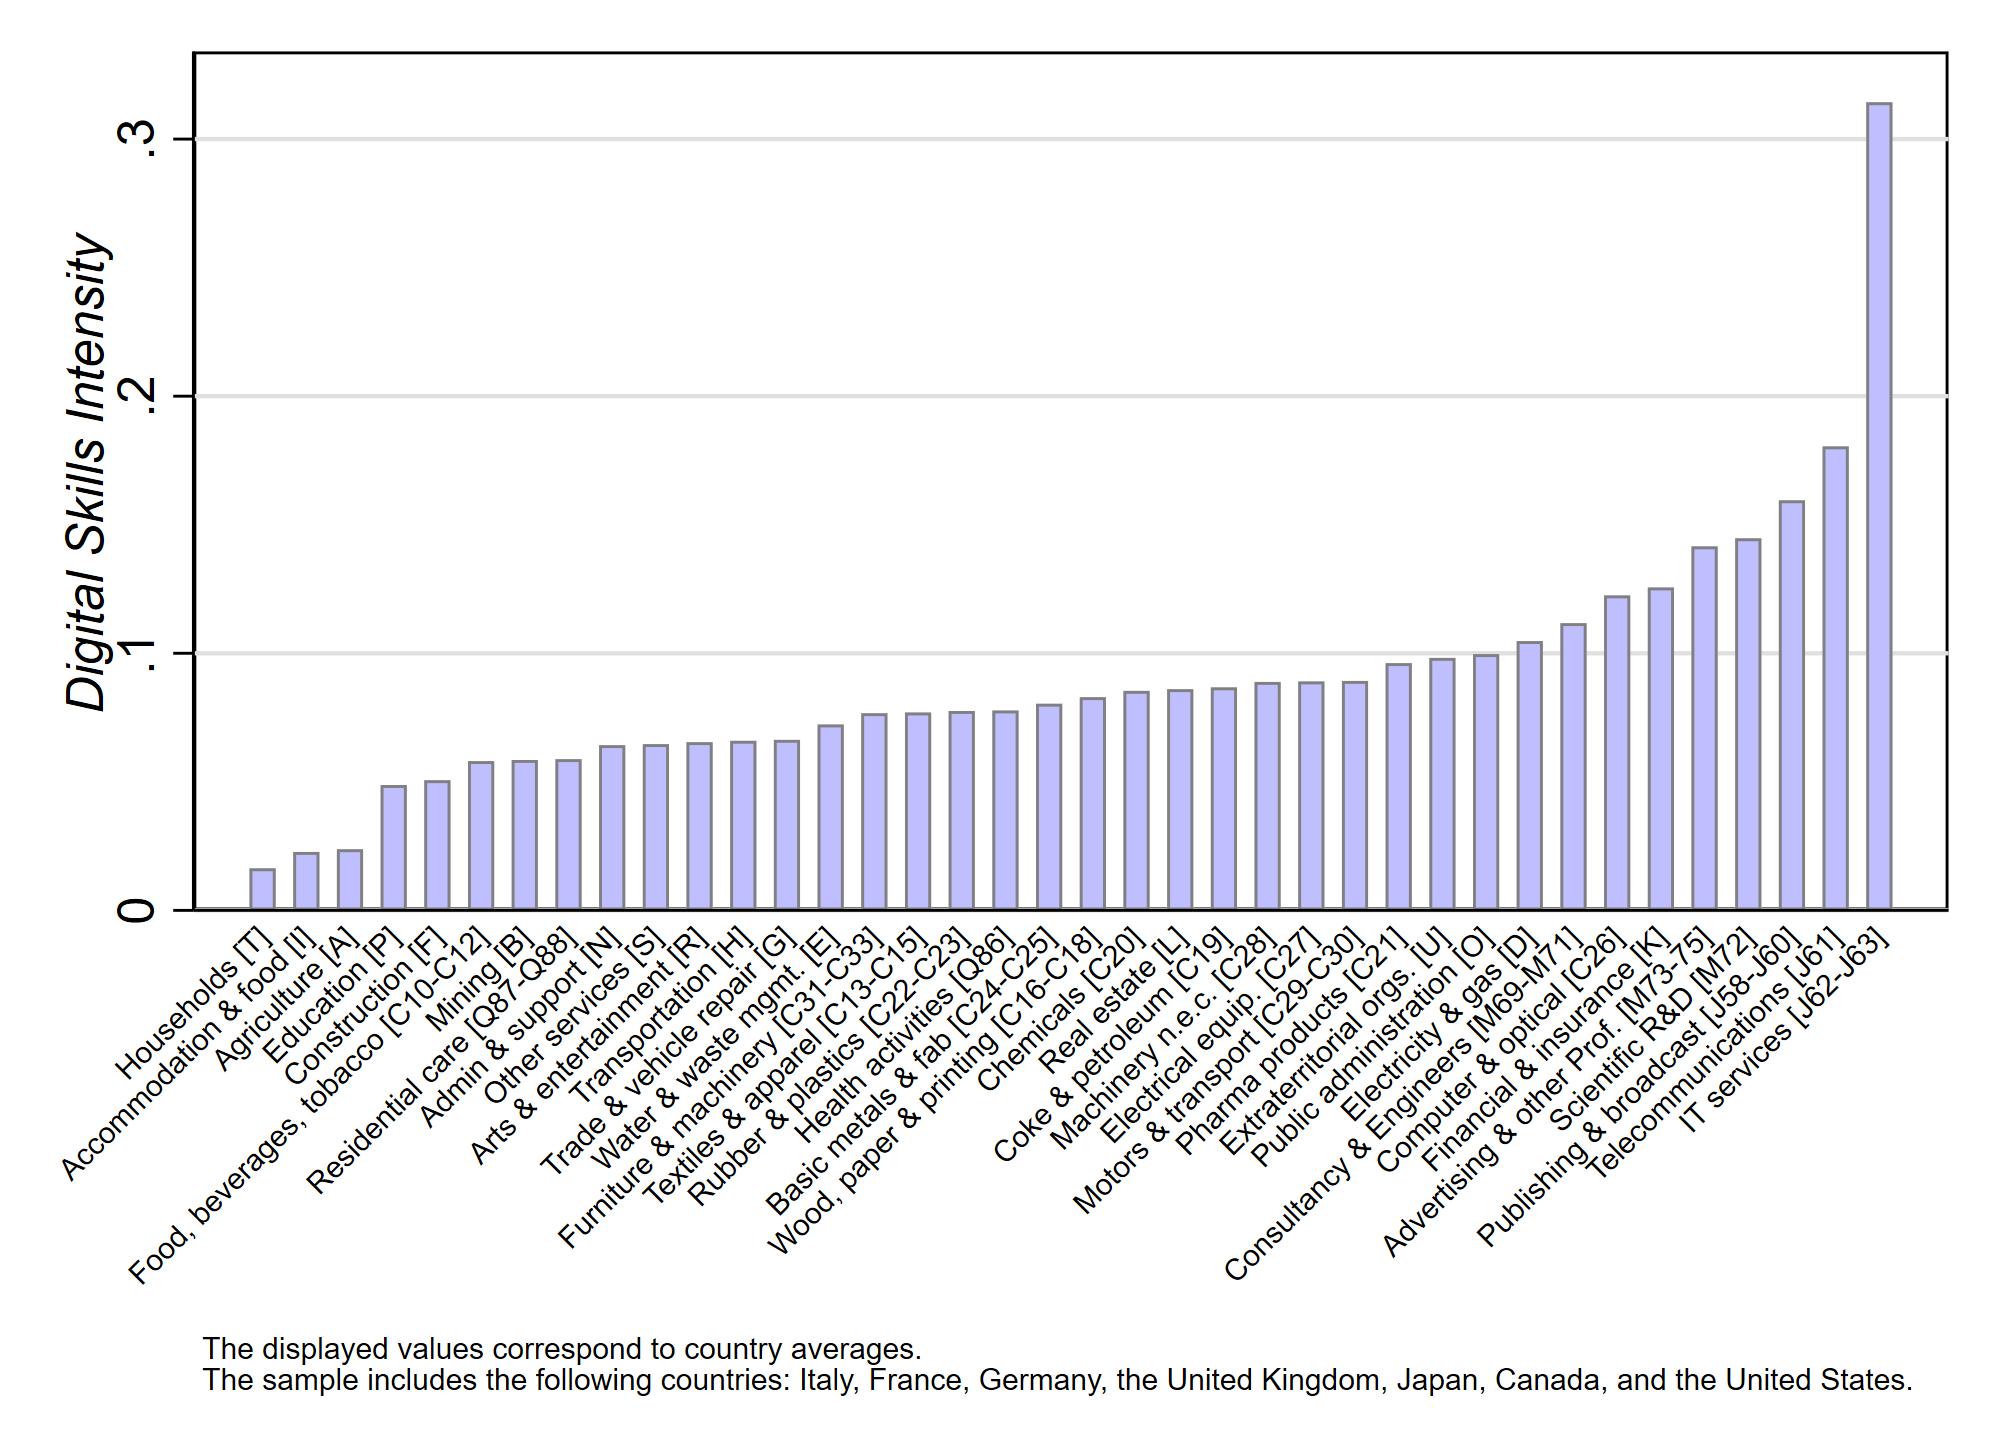
Digital skills across sectors
The graph shows the intensity of digital skills by sector.
• High concentration: 30% of the skills used in IT services [J62-J63] sector are digital skills
• Professions [M sectors] and services like Finance [K] and telecommunications are highly digital
• Also some highly digital manufacturing sectors: computers [C26], pharma [C21], electronics [C27]
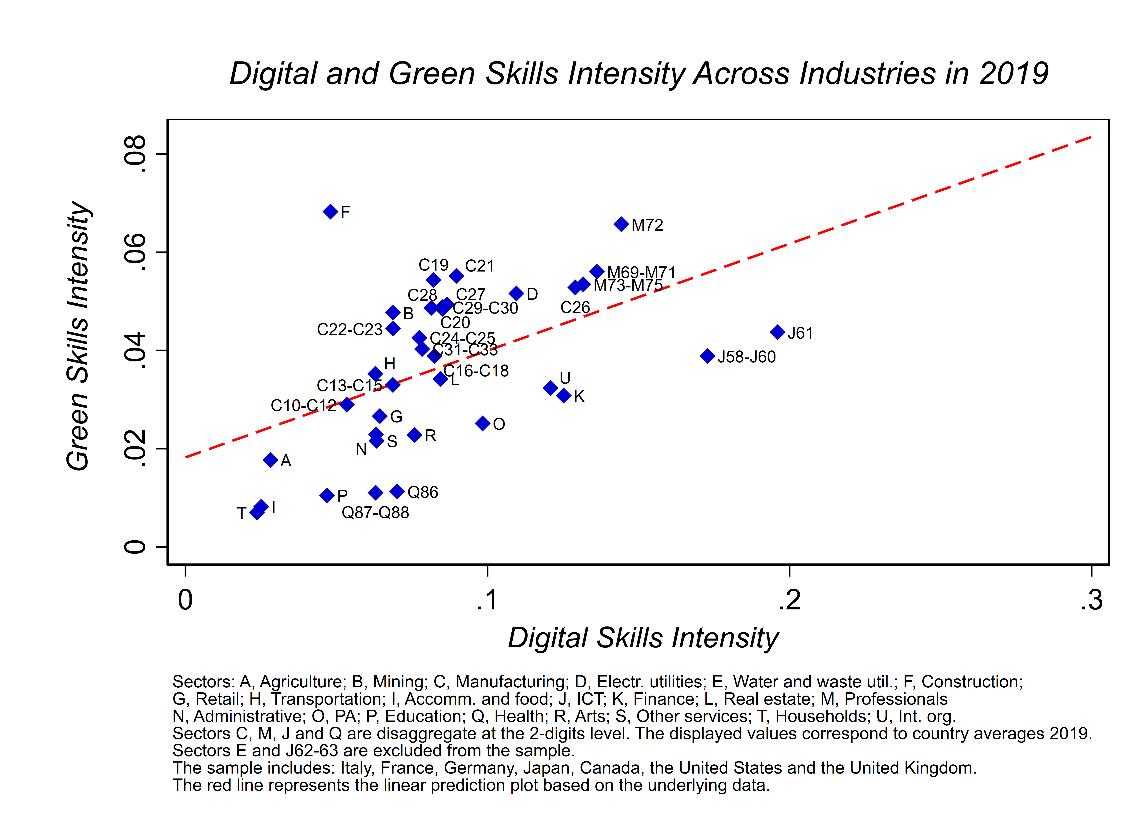
Joint distribution of digital and green intensity
Empirical framework (1): implications for earnings
Goal: synergies of digital and green skills by checking their relationship with earnings
We combine LFS data (CA, DE, FR, IT, UK*, US) with occupation-level indicators of digital and green skills to explore the influence of twin transition jobs on earning patterns using the following econometric specification:
where the unit of observation is the occupation o observed in sector-country-year sct
• is the share of workers in the highest earnings decile observed in the corresponding cell (osct)
• takes value 1 if the occupation o is a Twin Transition Job
• and are country-sector and year fixed effects
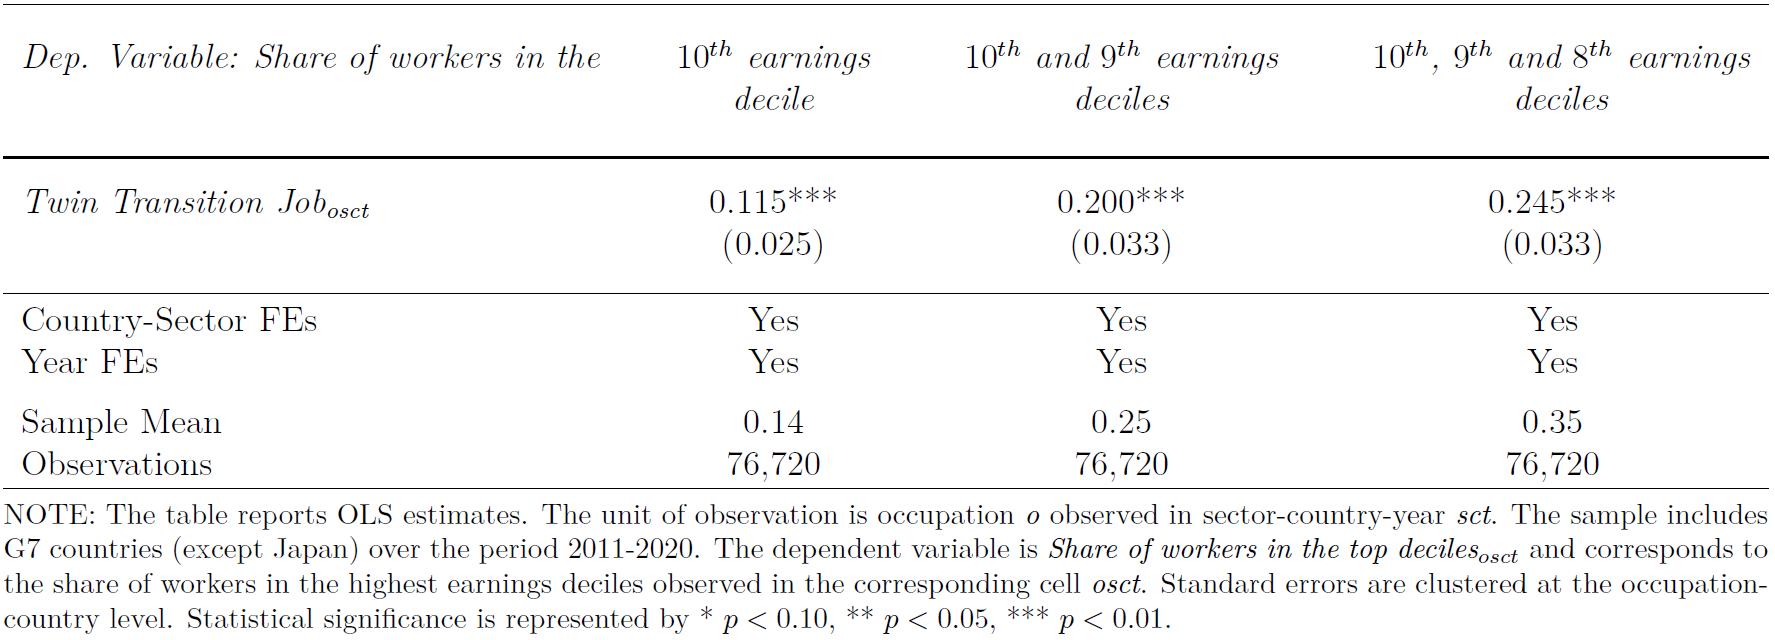
Implications for earnings – Results
Twin transition jobs have higher probability of being in highest earning deciles and lower probability of being in lowest earning deciles
Empirical framework (2): implications for inequality
Focus on the likelihood of being employed in a Twin Transition Job
Where we investigate as drivers:
• Gender: dummies for female workers.
• Education: levels, (upper secondary) and (tertiary)
• Age: dummies for being between 30 and 50 years old and older than 50, and
All specifications include fixed effects for sector and country , as well as year
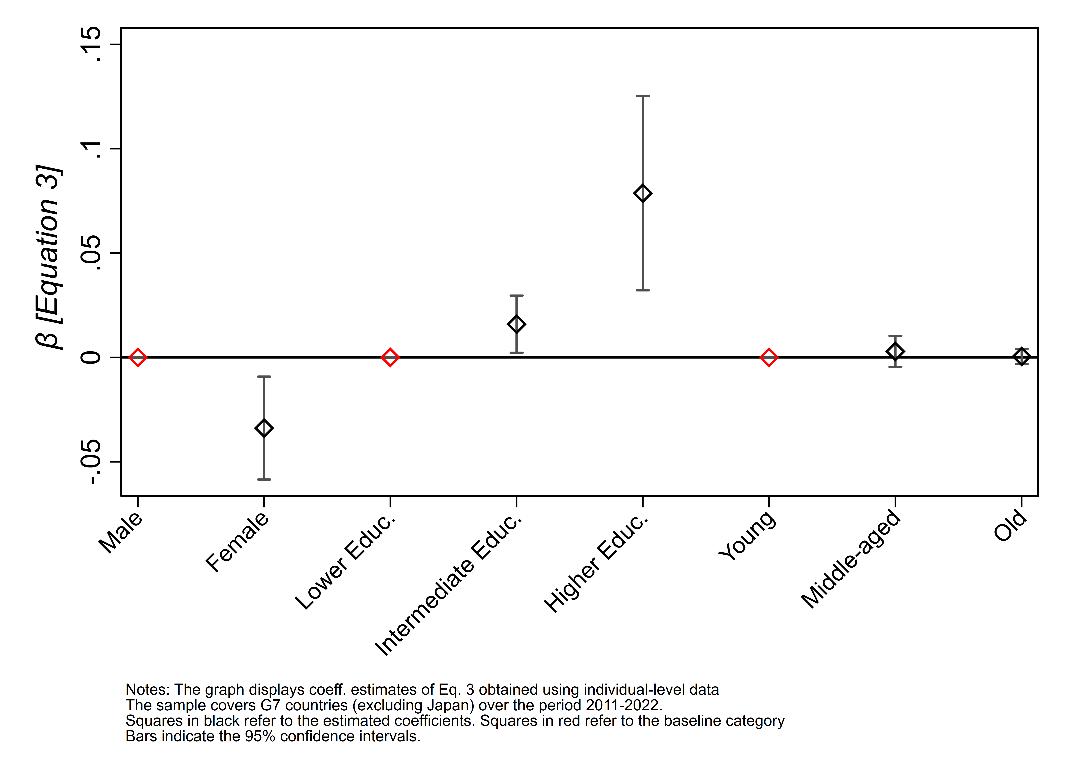
Results - Twin Transition Jobs, gender, education and age
Significant relevance of gender and education levels as predictors of Twin Transition Jobs
The role of gender and education
Gender and Education jointly
A men with higher education is almost 8 times more likely to be employed in Twin Transition Jobs than a women with lower education
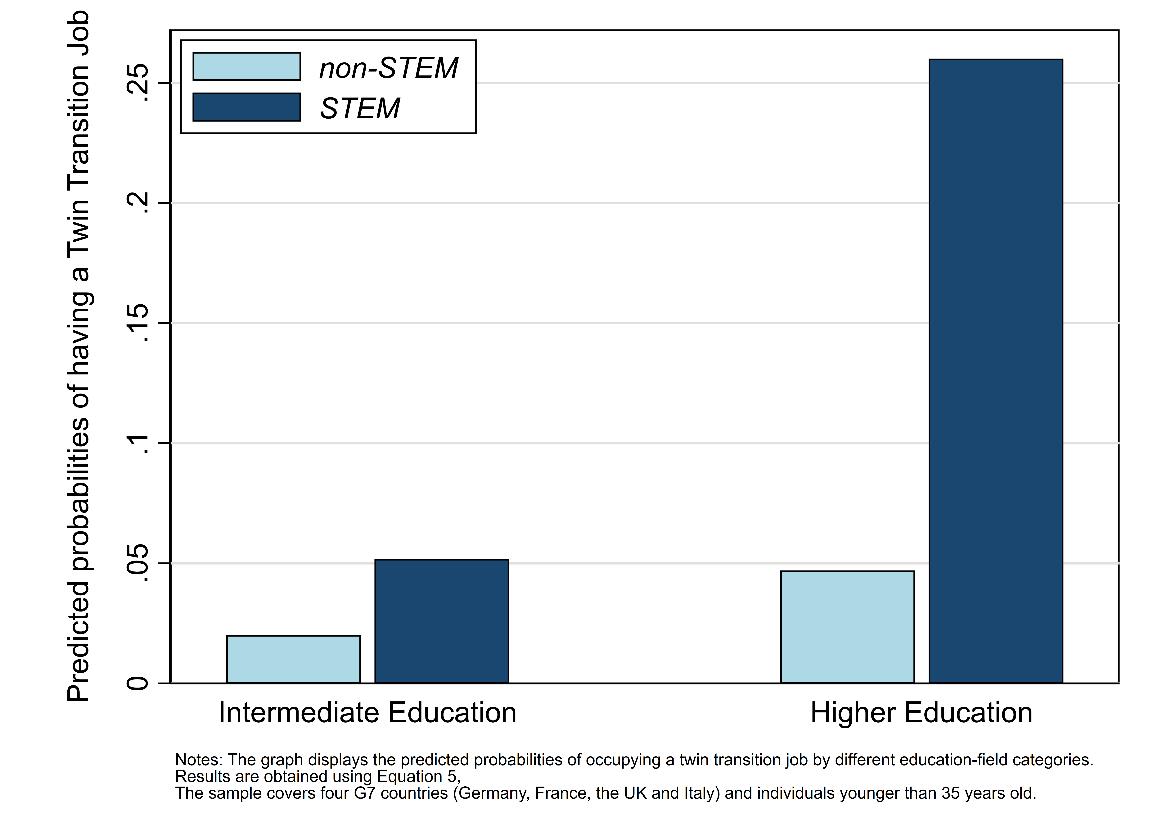
The role of STEM education
STEM vs Non STEM
The role of higher education is mainly driven by STEM
The role of STEM education and gender
STEM and Gender jointly
Even with STEM degrees, females are less likely to hold Twin Transition Jobs
Gender gap for STEM – 2011 vs 2022
The gender gap in Twin Transition jobs for STEM has been reduced over time