OECD ECONOMIC SURVEY AND ENVIRONMENTAL PERFORMANCE REVIEW OF GERMANY

Berlin, 8 May 2023


@OECD @OECDeconomy

Berlin, 8 May 2023
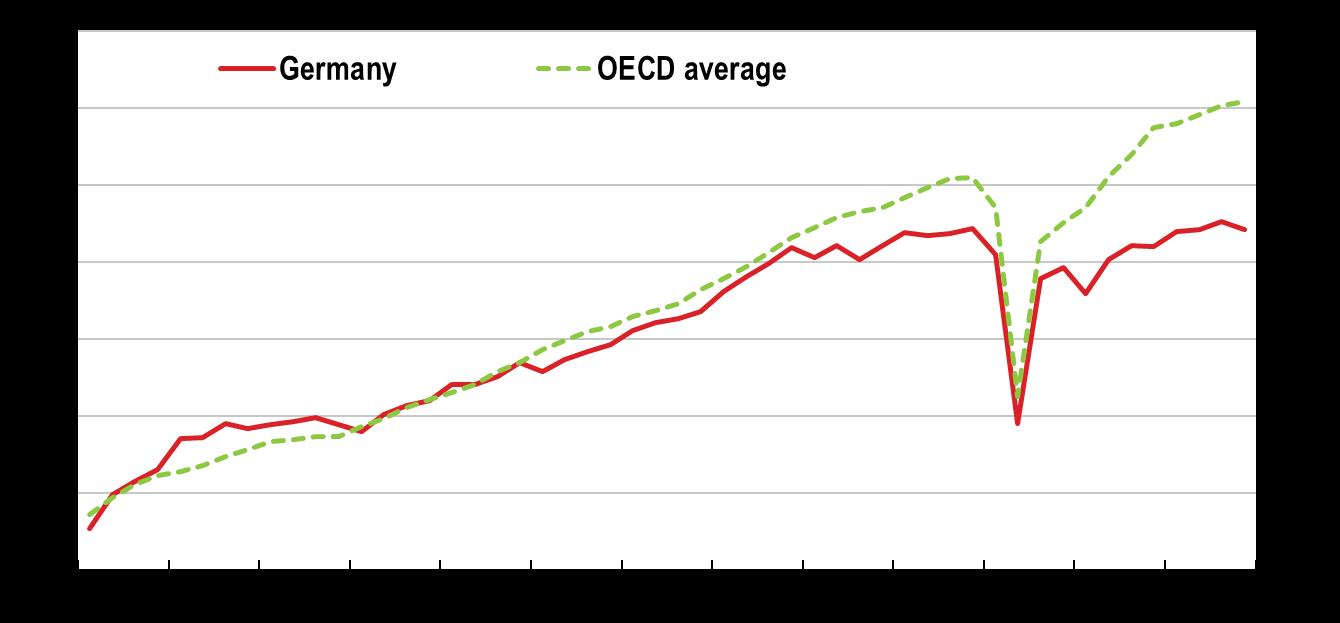
Real GDP
2010 = 100

Source: OECD Economic Outlook database.
Natural gas prices
January 2020 = 100
Electricity prices
January 2020 = 100
Note: Producer price index of natural gas when supplied to industry; producer price index of electricity when delivered to special contract customers.


Source: Federal Statistical Office.
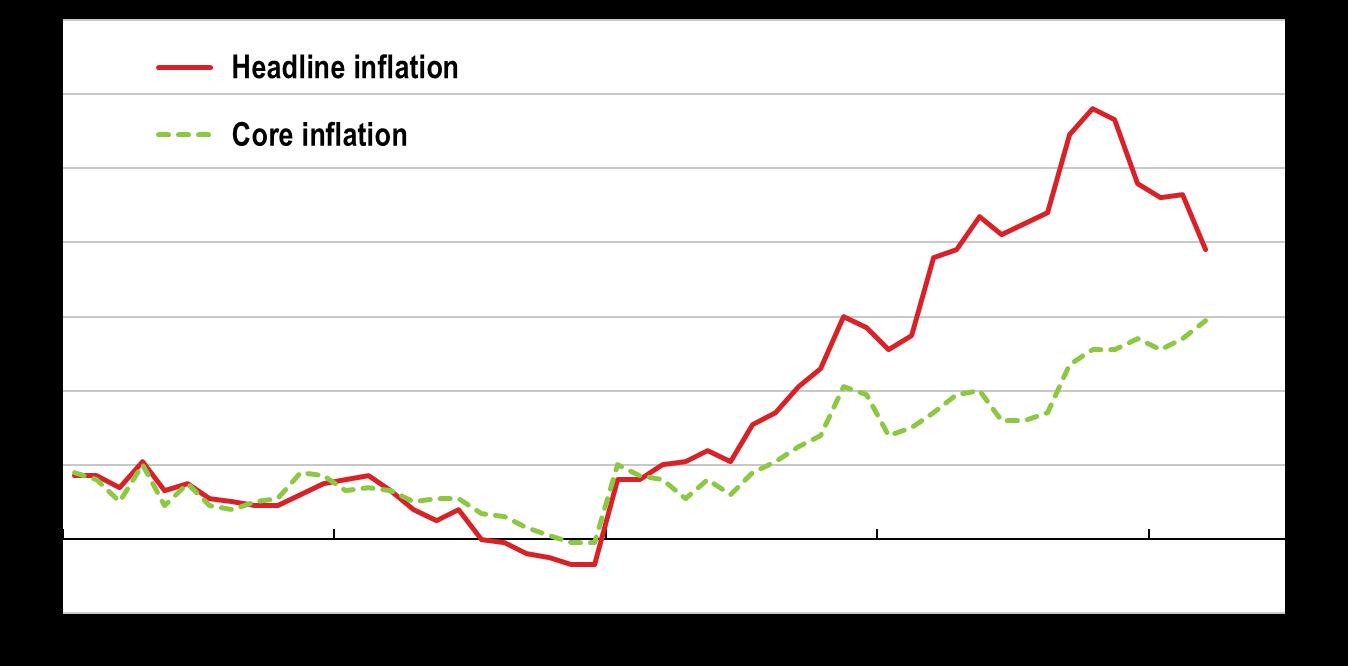
Y-o-y % changes
Source: OECD Consumer Prices database.
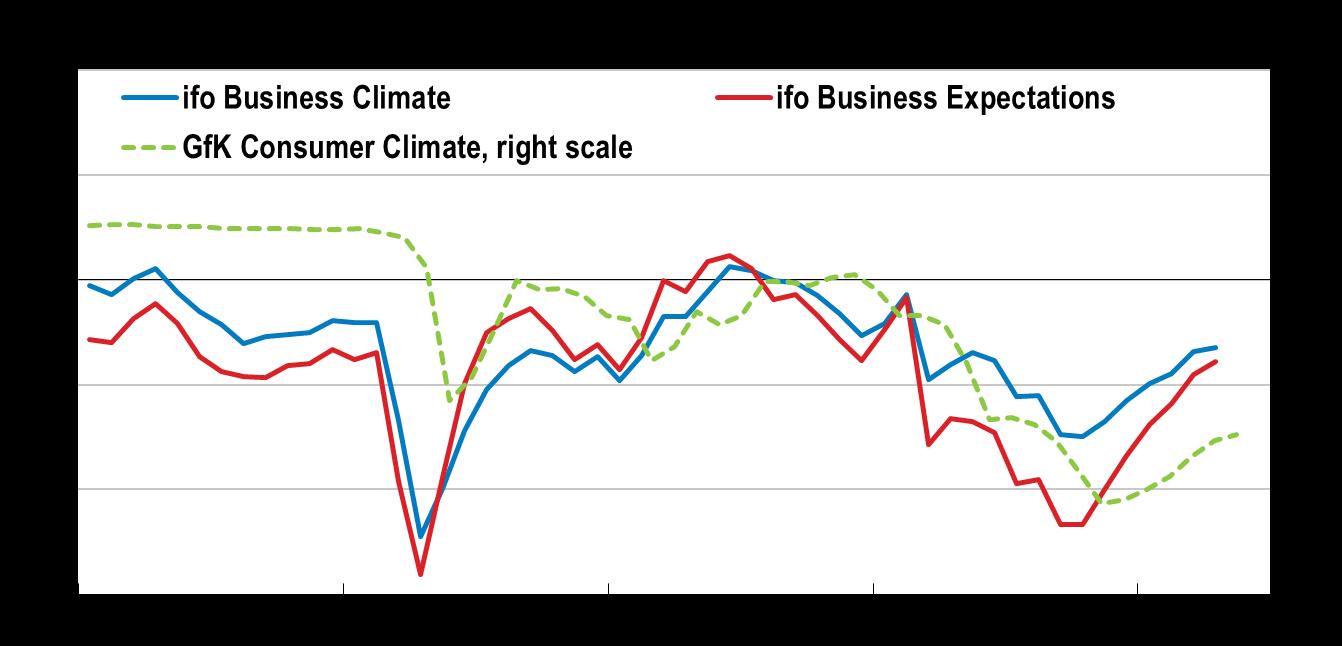
Note: The ifo Business Climate and the Business Expectations Index are early indicators of economic developments in Germany published on a monthly basis by the ifo Institute. The Business Climate Index measures how firms see their current and future business situation. The Business Expectations Index is sub-index of the Business Climate Index and measures firm’s expectations for their situation during the next 6 months. The Consumer Climate Index of the Gesellschaft für Konsumforschung (GfK) measures consumer confidence in economic activity.
Source: ifo business surveys; GfK.
Source: OECD calculations based on OECD Economic Outlook 112 database.


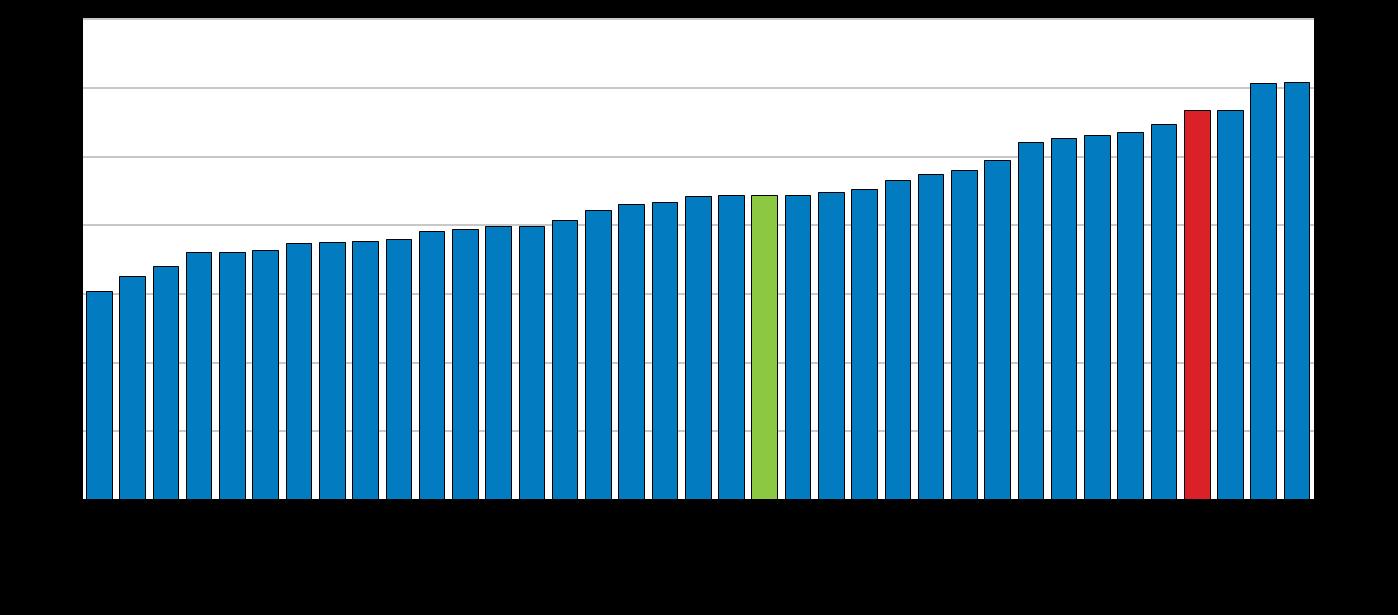
Gross fixed capital formation, % of GDP, 2021
Source: OECD Economic Outlook database.
% of GDP, 2022 or latest available year

Note: As some OECD countries do not report private business investment as separate category in their Statistics of National Accounts, an OECD average is not available.
Source: OECD Economic Outlook database
2013 Q4 = 100, 4-quarter moving average
2013 Q4 = 100, 4-quarter moving average
Note: OECD average is a simple average of OECD countries.
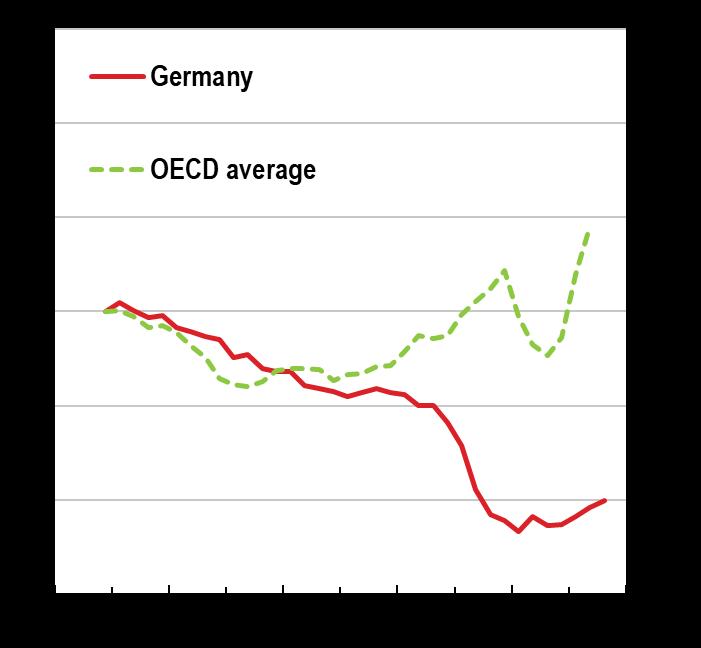
Source: OECD Timely Indicators of Entrepreneurship database.

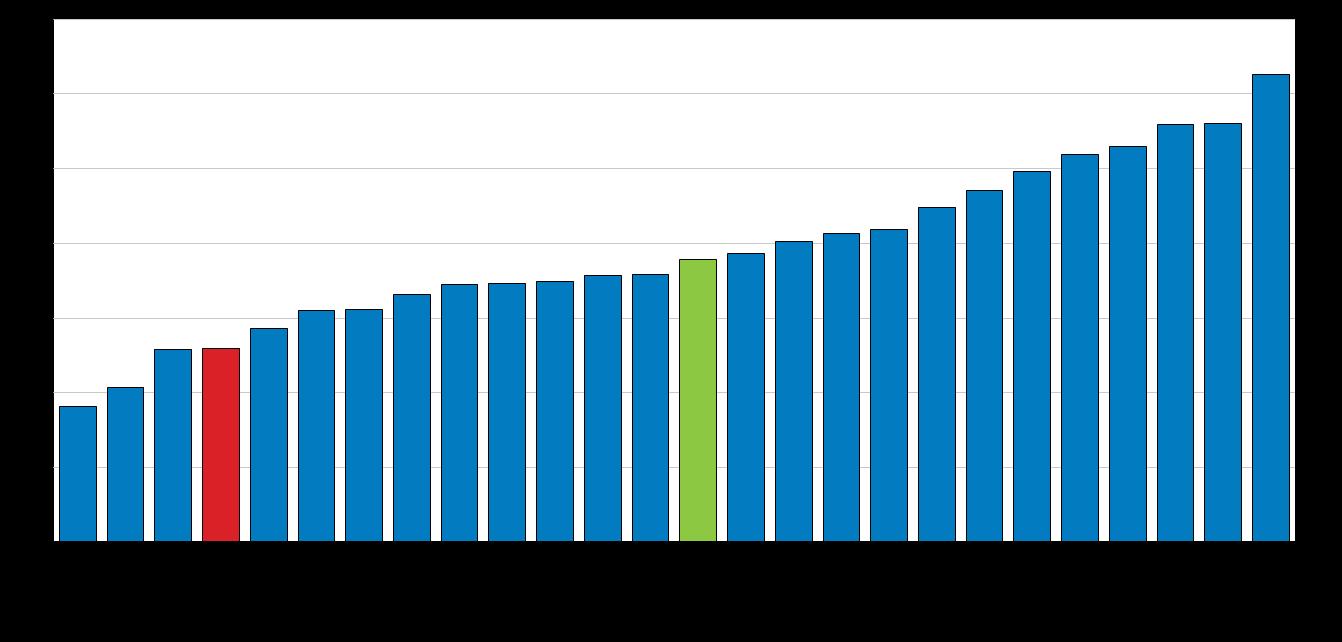
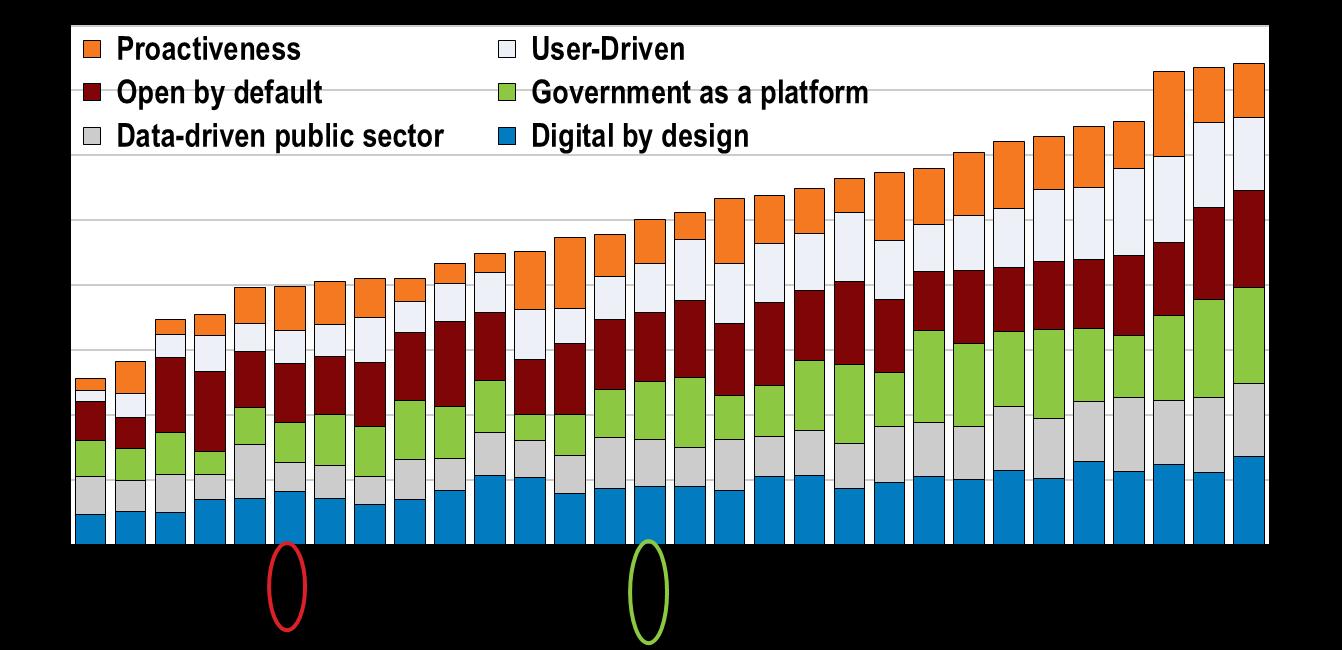
2019, score 0 to 1
Note: The OECD Digital Government Index is based on the six dimensions of the OECD Digital Government Policy Framework: digital by design, data-driven, government as a platform, open by default, user driven and proactiveness. It measures the capacity of the public sector to deliver a coherent and human-centric digital government transformation, as well as the strategic approaches, policy levers, implementation and monitoring mechanisms in place to deliver the digital government strategy.
Source: OECD Survey on Digital Government 1.0.
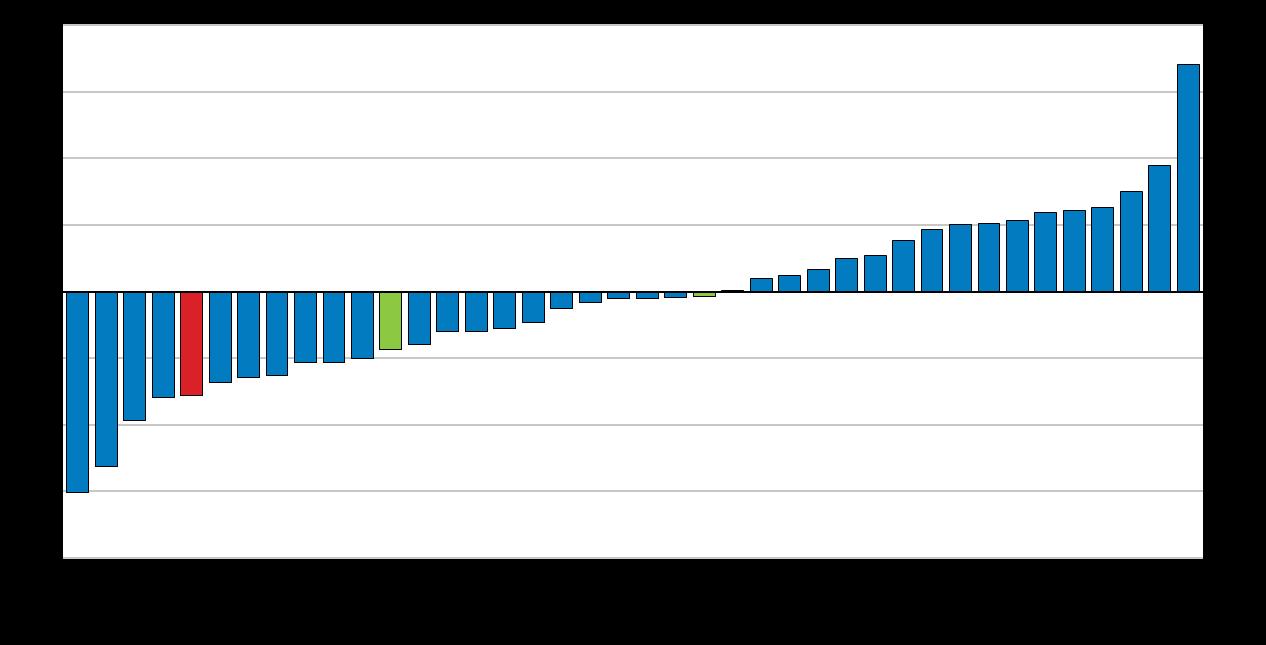
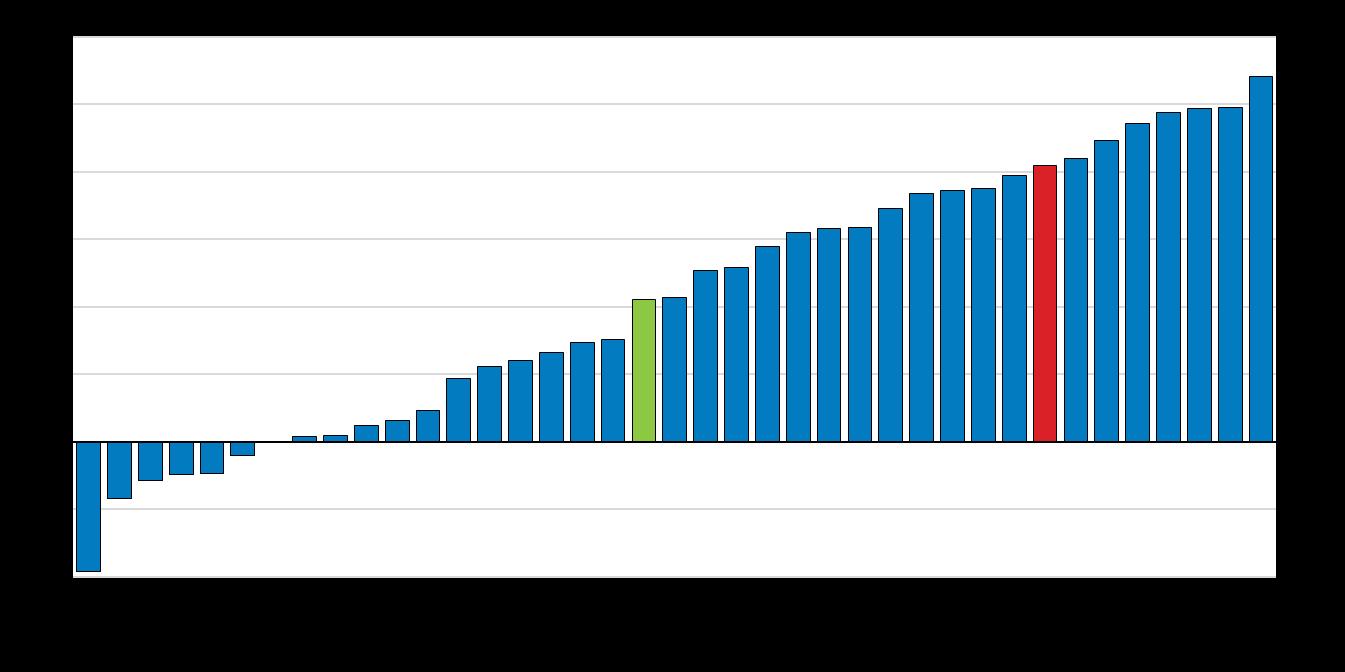
Working-age population (15-64), % change, 2020-30
Source: United Nations (2019), World Population Prospects: The 2019 Revision, Online Edition.
Note: Children are considered socio-economically advantaged if they are among the 25% of students with the highest values in the ESCS index (PISA index of economic, social and cultural status) in their country or economy; children are classified as socio-economically disadvantaged if their values in the index are among the bottom 25% in their country or economy.
Source: OECD (2019), PISA 2018 Results (Volume II): Where All Students Can Succeed, PISA, OECD Publishing, Paris.
Note: The main earner earns the average earnings and the secondary earner earns 67% of the average earnings in a family of a married couple with two children.
Source: OECD Taxing Wages database.
Tax revenues by tax type, % of total tax revenues, 2021 or latest available year
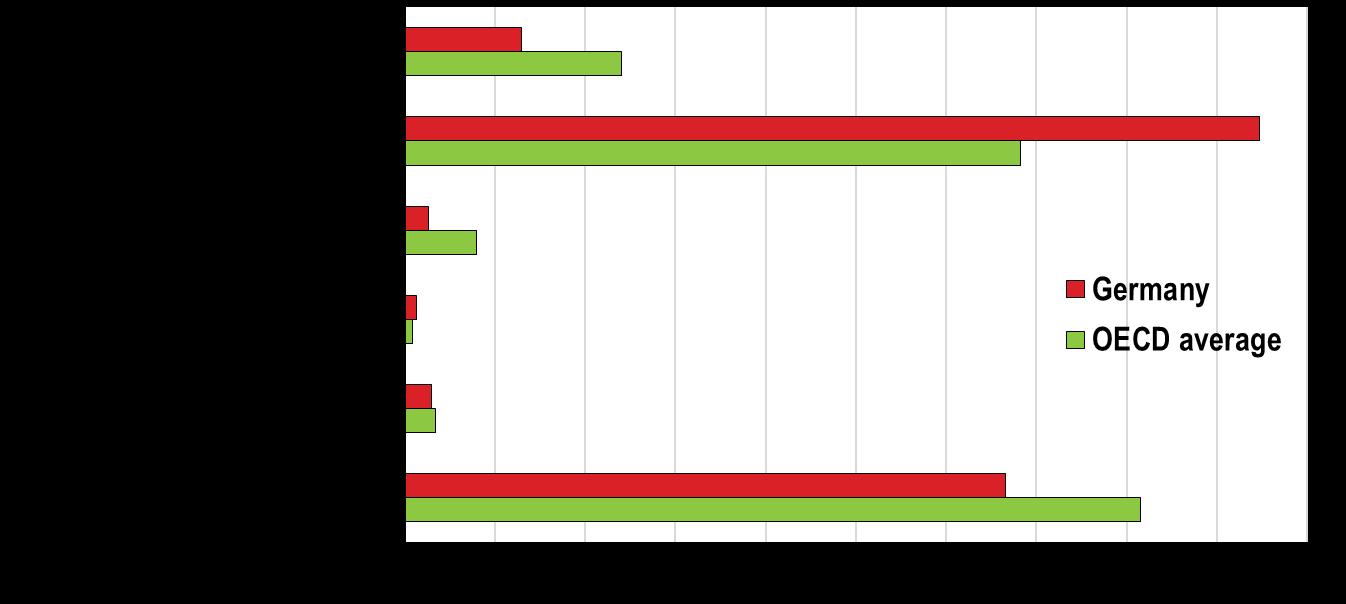
Source: OECD Revenue Statistics database.
% of VAT total tax liability, 2019

Note: The VAT gap is the overall difference between the expected VAT revenue and the amount actually collected.
Source: European Commission, Directorate-General for Taxation and Customs Union, VAT gap in the EU: Report 2021.
• Foster a culture of impact evaluation by developing the necessary data sharing infrastructure, strengthening spending reviews in budgeting procedures and encouraging peer learning across levels of government.
• Set mandatory common IT standards and encourage the harmonization of administrative procedures and joint software development across levels of government.
• Further expand access to early-childhood education by centralising application procedures within municipalities.
• Raise the quality of basic education by using performance evaluations to better target support to children with weaker learning outcomes.
• Reduce incentives for early retirement, while cooperating with employers to improve adult learning opportunities and working conditions for older workers.
• Raise labour supply incentives for second and low-wage earners by reforming the joint taxation rules for couples, while reducing the income threshold at which social security contributions progressively increase.
• Lower personal income taxes by raising tax-free allowances and decreasing tax rates.
• Reduce allowance thresholds for gift and inheritance taxes and exemptions for business assets, while extending instalments for tax payments.
• Improve tax collection and reduce distortions by abolishing tax expenditures for income from selling or renting real estate and VAT exemptions.
• Set binding guidelines on tax enforcement capacities and performance for the Laender, using Laender-specific tax gap estimates, and regularly publish guidelines and performance outcomes.
• Implement plans to establish a Federal Financial Police and improve cooperation and data analysis across levels of government as well as the enforcement of reporting requirements.


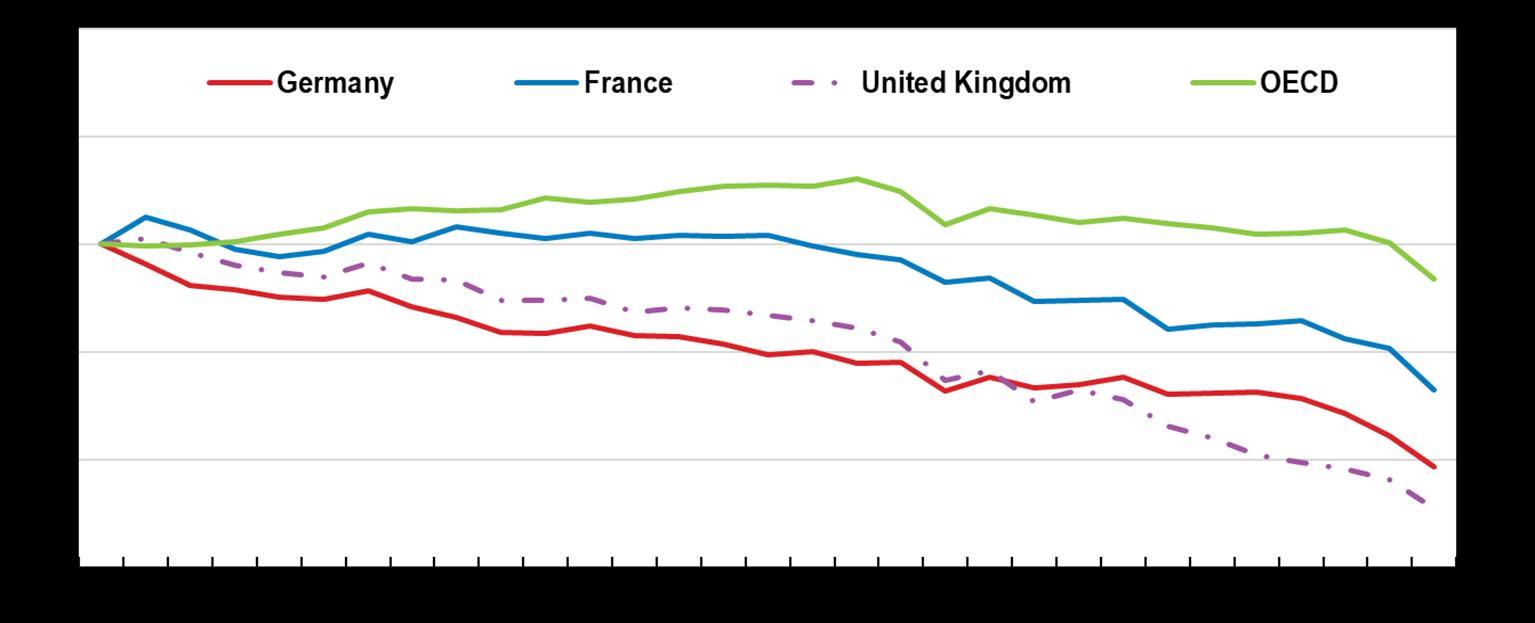
1990 = 100
Source: Our World in Data based on the Global Carbon Project; OECD (2022), Green Growth Indicators, OECD Environment Statistics (database).
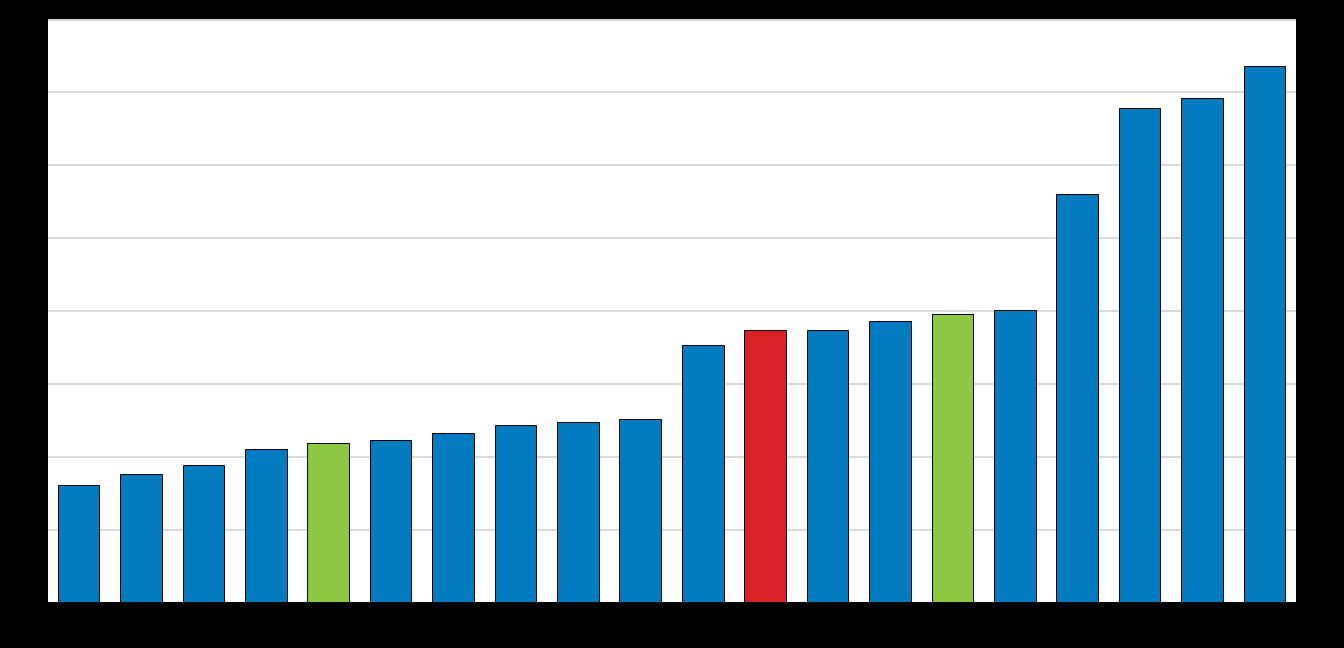
CO2 fuel combustion emissions (tCO2eq) per capita, 2021
(excluding land use, land use change and forestry), tonnes of CO2 equivalent, millions
Source: OECD calculations based on OECD Environment Statistics and Umweltbundesamt.
Extrapolation based on the speed of the reduction since 1990 2030 target
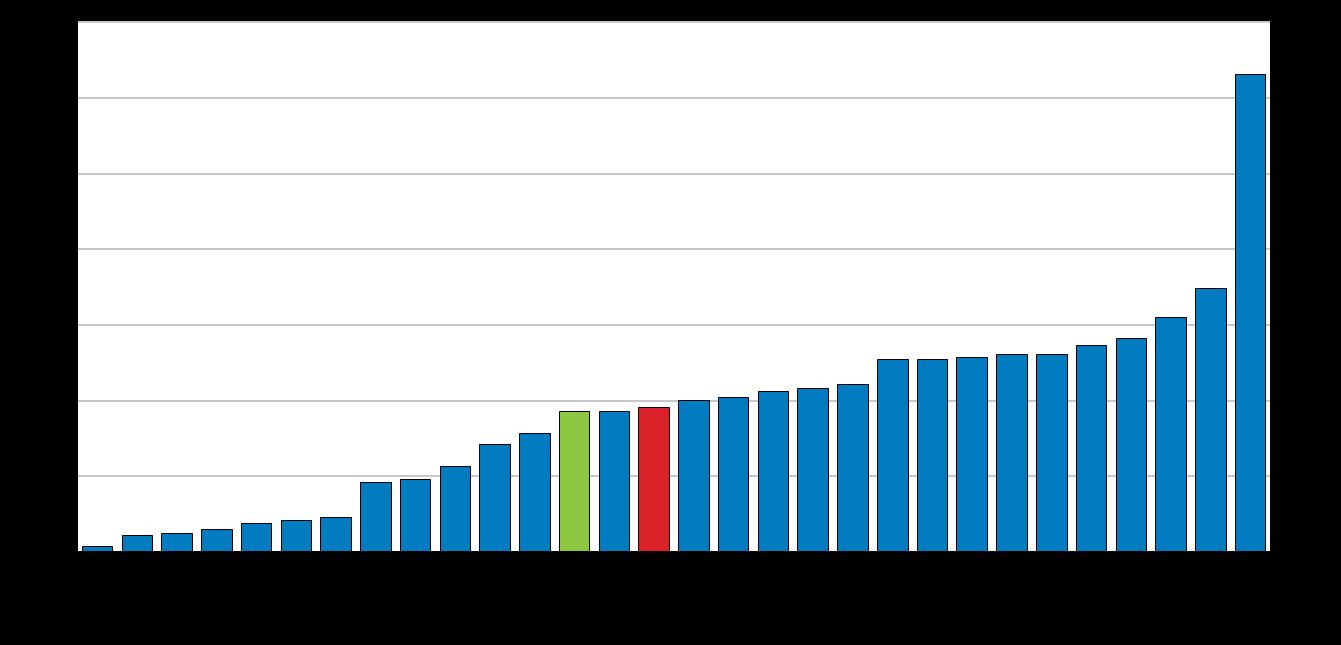
Per thousand unit of GDP, 2021
Source: IEA, Energy RD&D Budget/Expenditure Statistics.
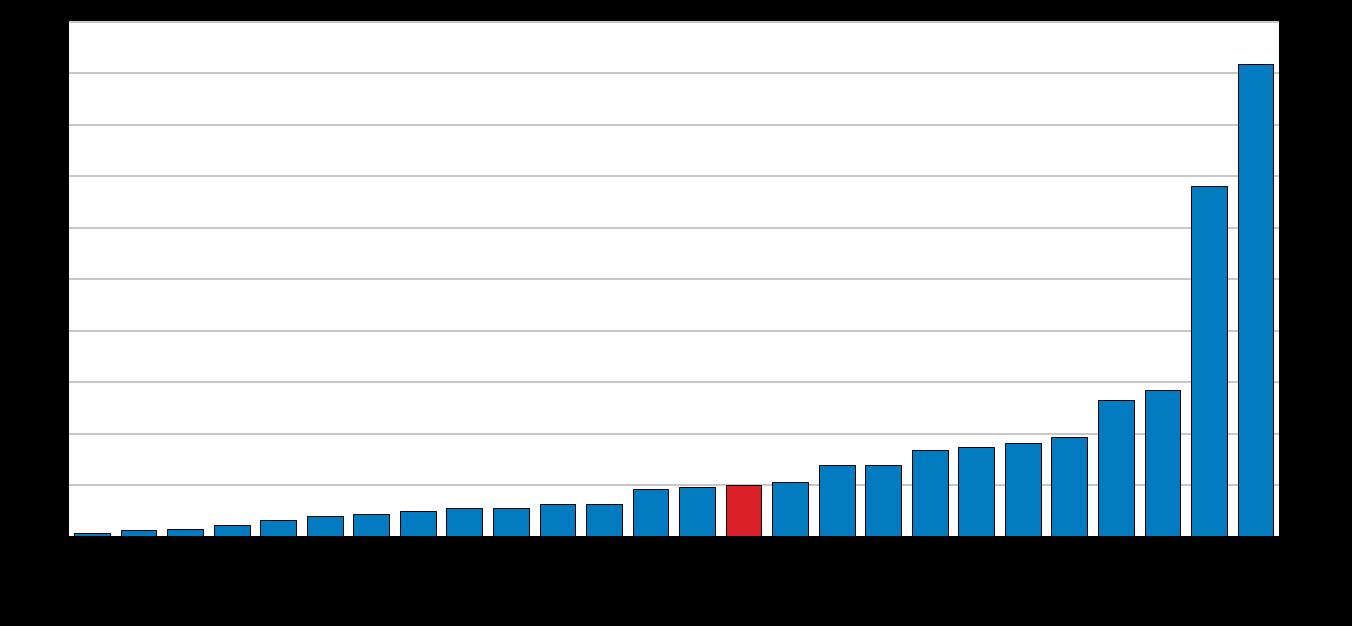
Number of charging points
Per thousand cars, 2021
Source: German Association of the Automotive Industry.
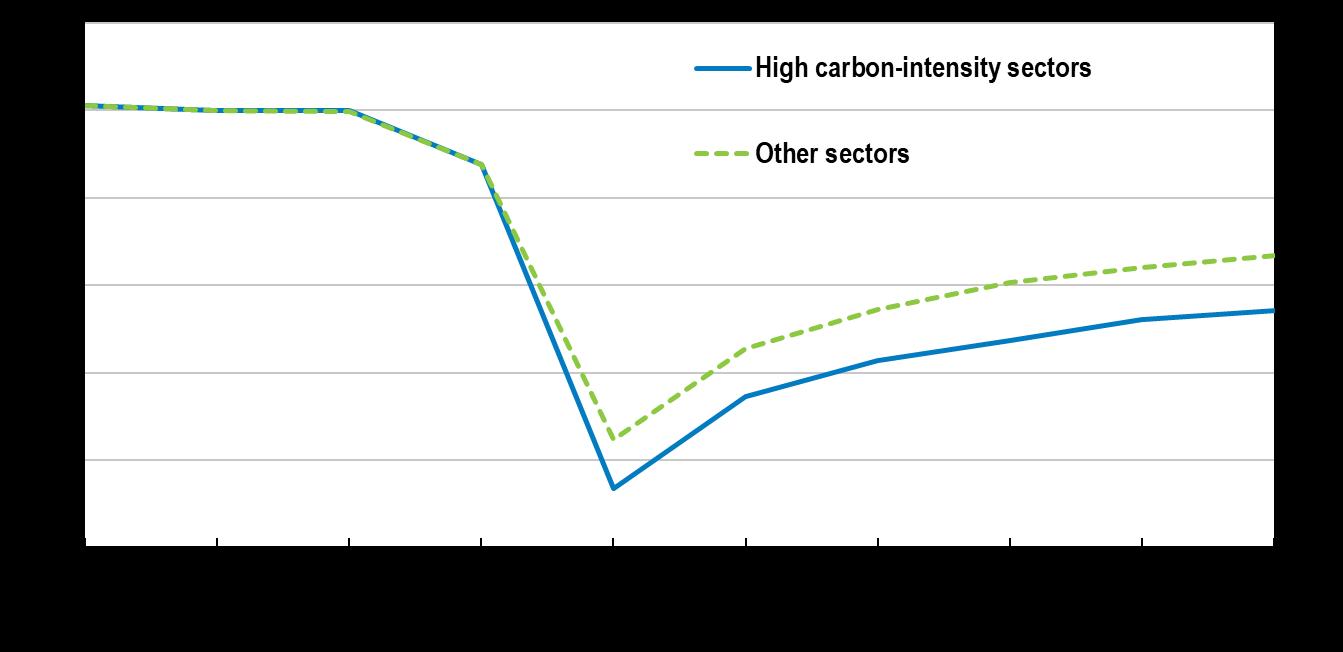
Earnings relative to pre-displacement average
Source: Barreto, Grundke and Krill (forthcoming).
(% of GDP)
Note: OECD average is a simple average of available OECD member countries.
Source: OECD Labour Force Statistics.
• Set an emissions cap for all sectors not covered by the EU ETS, which is in line with the national targets, until the European trading system for road transport and heating starts operating.
• Gradually phase out fossil fuel subsidies and tax expenditures, replacing them with abatement subsidies or direct transfers to households if needed.
• Gradually shift support from renewable energy subsidies towards more targeted subsidies for green R&D and the deployment of near-zero emission industrial technologies to reduce future abatement costs.
• Increase public investment in rail, subject to cost-benefit analysis, and accelerate the digitalisation of the control and signaling systems.
• Expand the deployment of charging capacity, while enhancing competition in and access to the market by targeting support at small players, standardizing pricing, and setting performance requirements.
• Increase minimum efficiency standards and apply energy performance certification to all existing buildings.


Note: TES = total energy supply. Gross Domestic Product (GDP) is expressed at 2015 prices and purchasing power parities.
IEA (2023), IEA World Energy Statistics and Balances (database); IEA (2023), IEA World Greenhouse Gas Emissions from Energy (database).
Note: values for OECD aggregates are estimates based on linear interpolations. The OECD aggregate excludes Canada.Top right panel: ER = energy recovery
Source: OECD (2023), Municipal waste - generation and treatment, OECD Environment Statistics (database) and Generation of waste by sector, OECD Environment Statistics (database)
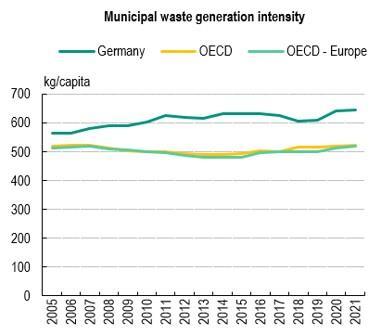

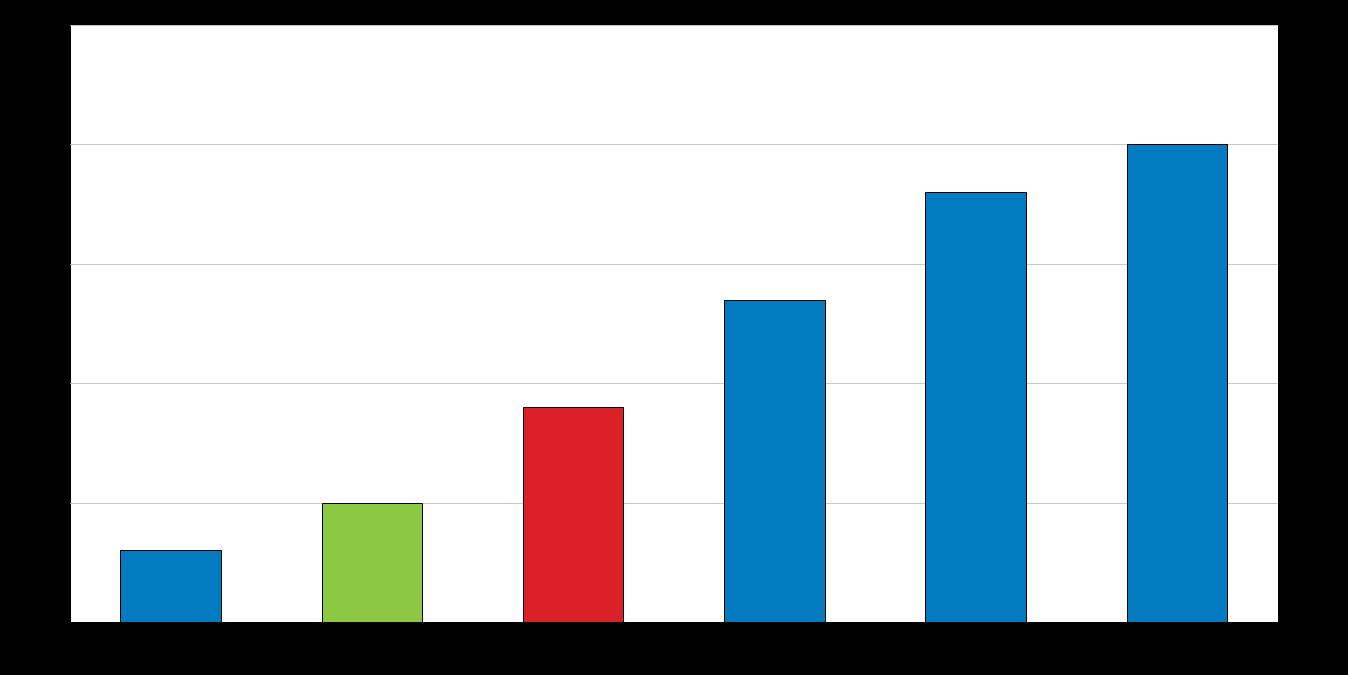
Municipal waste management has greatly improved, but waste levels need to be reduced
Note: The threatened category refers to critically endangered, endangered and vulnerable species, that is those plants and animals that are in danger of extinction or likely soon to be (for further information, see the IUCN Red List Categories and Criteria: Version 3.1, Second edition). Iceland, Luxembourg and Portugal: partial data; Norway: 2021 data.
Source: OECD (2023), "Biodiversity: Threatened species", OECD Environmental Indicators (database).
Percentage of surface area in 2020 exposed to river flooding with a 100-year return period
Total land area Cropland area Built-up area
Source: OECD (2023), "Air and climate: River flooding", OECD Environment Statistics (database)”
Adaptation investment is needed to prevent future loss and damage
Note: Ireland, Luxembourg, Norway and Slovakia did not record any or only minimally climate-related hazards. The 2015 constant USD GDP has been converted to 2021 constant USD GDP using a cumulative price increase of 14.33% (average inflation rate of 2.26% per year). The EM-DAT database does not consider indirect damages, which is why total recorded damages differ between sources.
Source: Centre for Research on the Epidemiology of Disasters, 2022.
Insurance covers less than half of economic loss related to extreme weather and
Source: EEA (2022), Economic losses and fatalities from weather- and climate-related events in Europe.
• Better align taxes with the polluter pays principle; explore opportunities to use market-based instruments to protect biodiversity; and implement swiftly additional measures to contribute to meeting the targets of the Kunming-Montreal Global Biodiversity Framework.
• Conduct regular climate risk exposure and vulnerability assessments in all 16 Länder. Consider encouraging Länder to make municipal climate risk assessment mandatory, harmonise standards and encourage the use of comparable data and methods across governance levels.
• Develop and enforce measurable adaptation targets that hold sectoral agencies and subnational governments to account for their adaptation actions.
• Strengthen proactively the climate resilience of highly vulnerable communities; consider stronger federal and Länder government support to advance implementation at the local level.
• Reform adaptation finance and place stronger emphasis on prevention; identify ways that reward adaptation investments by all stakeholders; consider the introduction of compulsory climate disaster risk insurance schemes for individual property owners
OECD

oe.cd/3LD
oe.cd/epr-germany


Disclaimers: The statistical data for Israel are supplied by and under the responsibility of the relevant Israeli authorities The use of such data by the OECD is without prejudice to the status of the Golan Heights, East Jerusalem and Israeli settlements in the West Bank under the terms of international law. This document and any map included herein are without prejudice to the status of or sovereignty over any territory, to the delimitation of international frontiers and boundaries and to the name of any territory, city or area