OECD work in support of a sustainable ocean
Ocean pollution
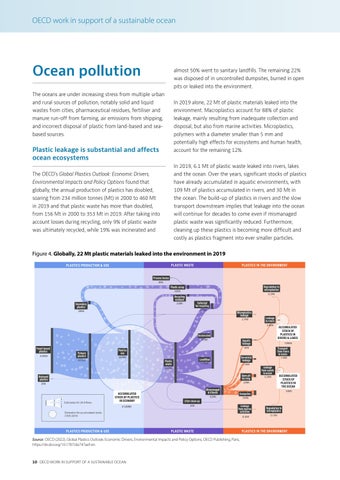
almost 50% went to sanitary landfills. The remaining 22% was disposed of in uncontrolled dumpsites, burned in open pits or leaked into the environment.
The oceans are under increasing stress from multiple urban and rural sources of pollution, notably solid and liquid
In 2019 alone, 22 Mt of plastic materials leaked into the
wastes from cities, pharmaceutical residues, fertiliser and
environment. Macroplastics account for 88% of plastic
manure run-off from farming, air emissions from shipping,
leakage, mainly resulting from inadequate collection and
and incorrect disposal of plastic from land-based and sea-
disposal, but also from marine activities. Microplastics,
based sources.
polymers with a diameter smaller than 5 mm and potentially high effects for ecosystems and human health,
Plastic leakage is substantial and affects ocean ecosystems
account for the remaining 12%. In 2019, 6.1 Mt of plastic waste leaked into rivers, lakes
The OECD’s Global Plastics Outlook: Economic Drivers,
and the ocean. Over the years, significant stocks of plastics
Environmental Impacts and Policy Options found that
have already accumulated in aquatic environments, with
globally, the annual production of plastics has doubled,
109 Mt of plastics accumulated in rivers, and 30 Mt in
soaring from 234 million tonnes (Mt) in 2000 to 460 Mt
the ocean. The build-up of plastics in rivers and the slow
in 2019 and that plastic waste has more than doubled,
transport downstream implies that leakage into the ocean
from 156 Mt in 2000 to 353 Mt in 2019. After taking into
will continue for decades to come even if mismanaged
account losses during recycling, only 9% of plastic waste
plastic waste was significantly reduced. Furthermore,
was ultimately recycled, while 19% was incinerated and
cleaning up these plastics is becoming more difficult and costly as plastics fragment into ever smaller particles.
Figure 4. Globally, 22 Mt plastic materials leaked into the environment in 2019
4Mt
33Mt
0.2Mt
22Mt
55Mt
29Mt
2.7Mt
5.8Mt
67Mt
429Mt
431Mt
460Mt
109Mt
6Mt
174Mt
13Mt
353Mt
1.4Mt
0.3Mt
26Mt
2Mt
Estimation for 2019 flows
3120Mt
34Mt
3Mt
0.3Mt
Source: OECD (2022), Global Plastics Outlook: Economic Drivers, Environmental Impacts and Policy Options, OECD Publishing, Paris, https://dx.doi.org/10.1787/de747aef-en.
10 . OECD WORK IN SUPPORT OF A SUSTAINABLE OCEAN
30Mt
82Mt
Estimation for accumulated stocks (1970-2019)
0.1Mt