11 minute read
Ocean pollution


The oceans are under increasing stress from multiple urban and rural sources of pollution, notably solid and liquid wastes from cities, pharmaceutical residues, fertiliser and manure run-off from farming, air emissions from shipping, and incorrect disposal of plastic from land-based and seabased sources.
Plastic leakage is substantial and affects ocean ecosystems
The OECD’s Global Plastics Outlook: Economic Drivers, Environmental Impacts and Policy Options found that globally, the annual production of plastics has doubled, soaring from 234 million tonnes (Mt) in 2000 to 460 Mt in 2019 and that plastic waste has more than doubled, from 156 Mt in 2000 to 353 Mt in 2019. After taking into account losses during recycling, only 9% of plastic waste was ultimately recycled, while 19% was incinerated and almost 50% went to sanitary landfills. The remaining 22% was disposed of in uncontrolled dumpsites, burned in open pits or leaked into the environment.
In 2019 alone, 22 Mt of plastic materials leaked into the environment. Macroplastics account for 88% of plastic leakage, mainly resulting from inadequate collection and disposal, but also from marine activities. Microplastics, polymers with a diameter smaller than 5 mm and potentially high effects for ecosystems and human health, account for the remaining 12%.
In 2019, 6.1 Mt of plastic waste leaked into rivers, lakes and the ocean. Over the years, significant stocks of plastics have already accumulated in aquatic environments, with 109 Mt of plastics accumulated in rivers, and 30 Mt in the ocean. The build-up of plastics in rivers and the slow transport downstream implies that leakage into the ocean will continue for decades to come even if mismanaged plastic waste was significantly reduced. Furthermore, cleaning up these plastics is becoming more difficult and costly as plastics fragment into ever smaller particles.
Figure 4. Globally, 22 Mt plastic materials leaked into the environment in 2019
29Mt 4Mt
33Mt
22Mt
55Mt
429Mt
2Mt 431Mt 460Mt
Estimation for 2019 ows
Estimation for accumulated stocks (1970-2019) 3120Mt
353Mt 67Mt
174Mt
3Mt 82Mt 2.7Mt
6Mt
13Mt
26Mt
34Mt
0.3Mt 0.2Mt
5.8Mt
109Mt
1.4Mt
0.3Mt
30Mt
0.1Mt
Source: OECD (2022), Global Plastics Outlook: Economic Drivers, Environmental Impacts and Policy Options, OECD Publishing, Paris, https://dx.doi.org/10.1787/de747aef-en.
Figure 5. Rivers accumulate leaked plastics and carry them to the ocean
6.1 Mt 0.3 Mt
2.7 Mt 1.7 Mt 1.5 Mt
0.2 Mt
<0.1 Mt
30 Mt
3.1 Mt
Estimation for 2019 ows
109 Mt
Estimation for accumulated stocks (1970-2019)
Source: OECD (2022), Global Plastics Outlook: Economic Drivers, Environmental Impacts and Policy Options, OECD Publishing, Paris, https://dx.doi.org/10.1787/de747aef-en
Critical levers to reduce the environmental impact of plastics
The Global Plastics Outlook (OECD, 2022) identifies four key levers for “bending the plastic curve”:
l Develop recycled plastics market by combining push and pull policies. While global production of secondary plastics from recycling has more than quadrupled in the last two decades, they are still only 6% of the total feedstock. Since secondary plastics are mainly considered substitutes for primary plastics, rather than a valuable resource in their own right, the secondary plastics market remains small and vulnerable. Some countries have successfully strengthened their markets by “pushing” secondary plastics supply – for example, through extended producer responsibility schemes – as well as “pulling” demand via recycled content targets. The recent decoupling of prices for primary and secondary polyethylene terephthalate (PET) in Europe and increasing innovation in recycling technologies are positive signs that the combination of these policies is working. l Boost innovation for a more circular plastics lifecycle.
Innovation can deliver significant environmental benefits – by reducing the amount of primary plastics needed, prolonging the useful life of products and facilitating recycling. This report shows that patented environmental plastics technologies increased more than threefold between 1990 and 2017. Yet circular plastics innovation makes up only 1.2% of all plastics-related innovation. More ambitious policies are needed, including a combination of investments in innovation and interventions aimed at increasing demand for circular solutions while restraining plastics consumption overall.
l Strengthen the ambition of domestic public policies. Public policies are a key lever for reducing the environmental consequences of plastics use. However, the current plastics policy landscape is fragmented and can be strengthened significantly. A larger rollout of wellknown economic instruments such as Extended Producer
Responsibility schemes for packaging and durables, landfill taxes, deposit-refund and Pay-as-You-Throw system, is needed to improve recycling rates and reduce leakage.
Moreover, upstream policy instruments, such as recycled content targets and plastics taxes are emerging as
innovative tools to restrain consumption and incentivise design for circularity. The impact of these instruments could be improved considerably by extending coverage to more product types and more countries. To make the lifecycle of plastics more circular and reduce leakage, a policy roadmap for countries is proposed with three increasingly ambitious phases.
l Close leakage pathways. Build sanitary waste management infrastructure, organise waste collection and structurally reduce plastics littering by enlarging the scope of anti-littering policies (bans or taxes of frequently littered items) and enhancing implementation of legislation.
l Create incentives for recycling and enhance sorting at source. The required measures include extended producer responsibility (EPR) schemes, landfill taxes and incineration taxes, as well as deposit-refund and pay-as-you-throw schemes. l Restrain demand and optimise design to make plastic value chains more circular and recycled plastics more price competitive. Instruments such as plastics taxes and recycled content targets can create financial incentives to reduce use and foster circularity. Their impact could be improved considerably by extending them to more product types and more countries.
Similarly, chemicals management policies are important tools that can help improve the design of products and materials.
l Strengthen international co-operation to make plastics value chains more circular and achieve net zero plastic leakage. With mismanaged waste a widespread problem, especially in developing countries, major investments in basic waste management infrastructure are needed. To finance the required estimated costs of EUR 25 billion a year in low and middle-income countries (Soós, Whiteman and Gavgas, 2022)., all available sources of funding will need to be mobilised, including official development assistance which currently covers only 2% of the financing needs. Efficient use of such investments will also require effective legal frameworks to enforce disposal obligations.
Figure 6. A policy roadmap for a more circular use of plastics use can involve a stepped approach
• Invest in collection & disposal infrastructure • Ban or tax frequently littered items
• Extended Producer Responsibility for packaging & durables • Land ll & incineration taxes • Deposit-refund • Pay-as-You-Throw
• Ban or tax single-use plastics • Remove fossil-fuel subsidies • Regulate hazardous substances • Impose recycled content standards • Modulate Extended Producer Responsibility fees
Source: OECD (2022), Global Plastics Outlook: Economic Drivers, Environmental Impacts and Policy Options, OECD Publishing, Paris, https://dx.doi.org/10.1787/de747aef-en
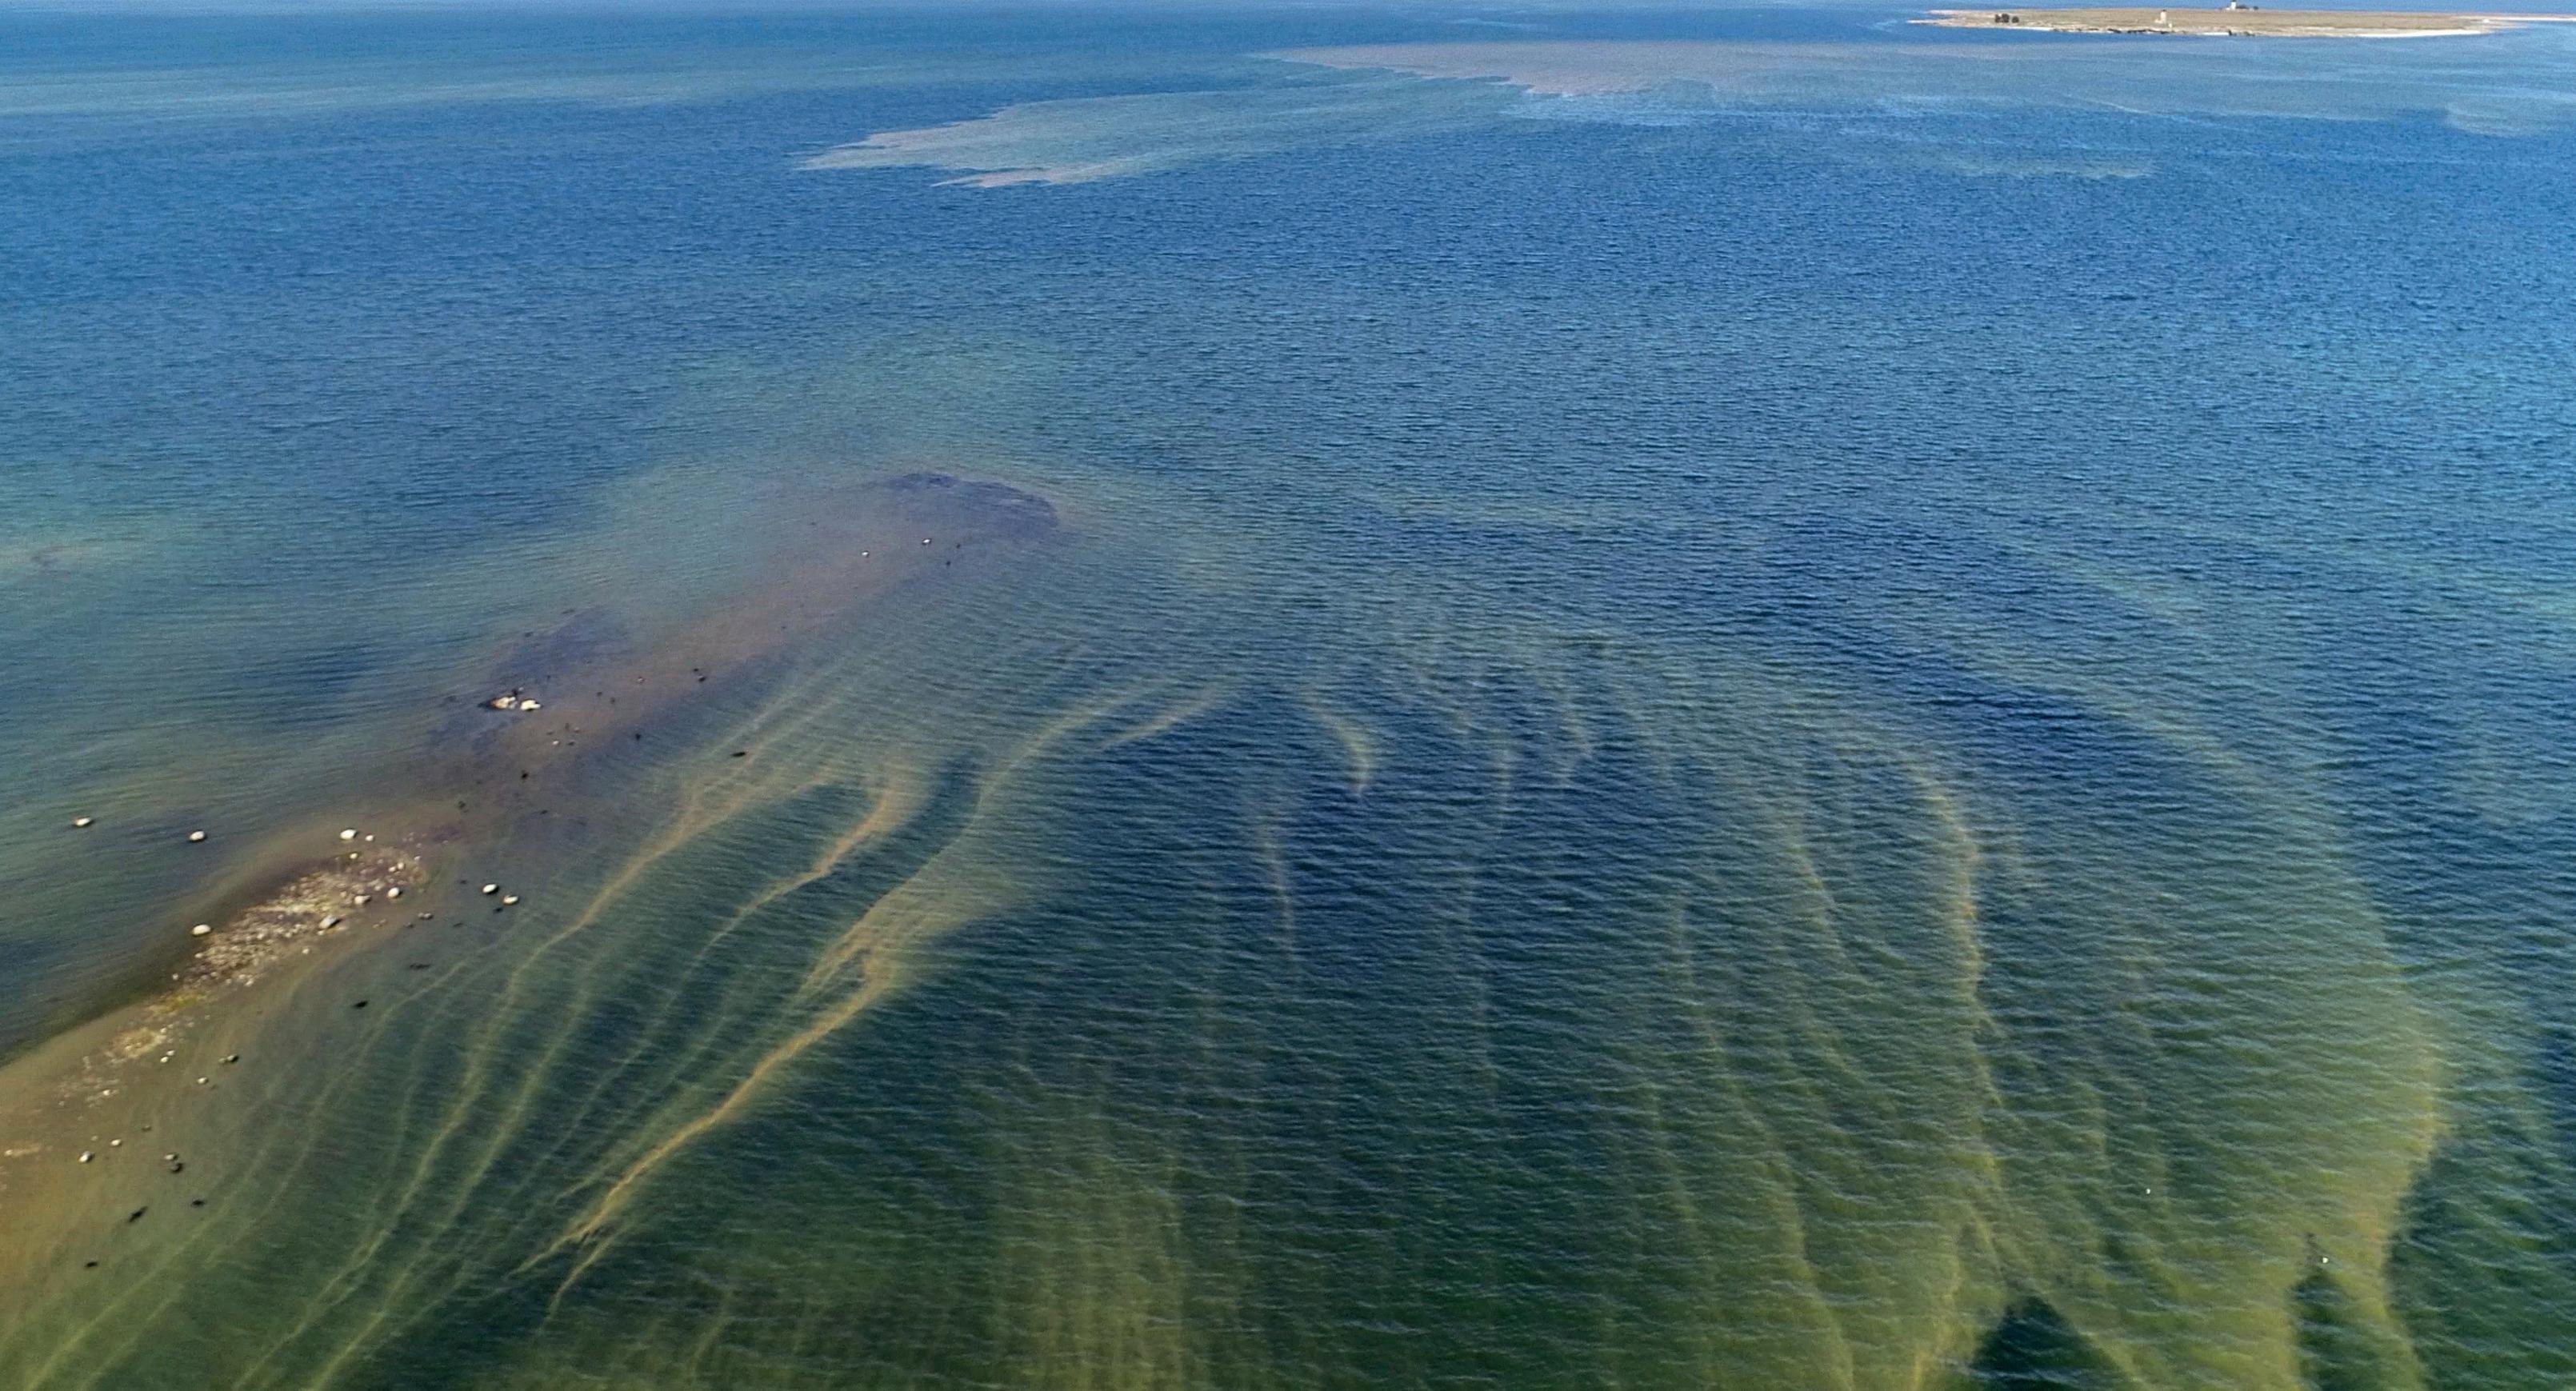
Eutrophication and ocean dead zones are a growing global challenge
Globally, one of the most prevalent water quality challenges is eutrophication; a form of water pollution caused by excess use of nutrients (nitrogen and phosphorous). Eutrophication can trigger toxic algal blooms and cause “dead zones” (oxygen depletion) in the ocean and coastal waters leading to significant loss of marine biodiversity. Excessive nitrogen in the environment also contributes to climate change, depletion of the ozone layer, air pollution, nitrate toxicity in groundwater and drinking water, loss of biodiversity and deterioration of soil quality.
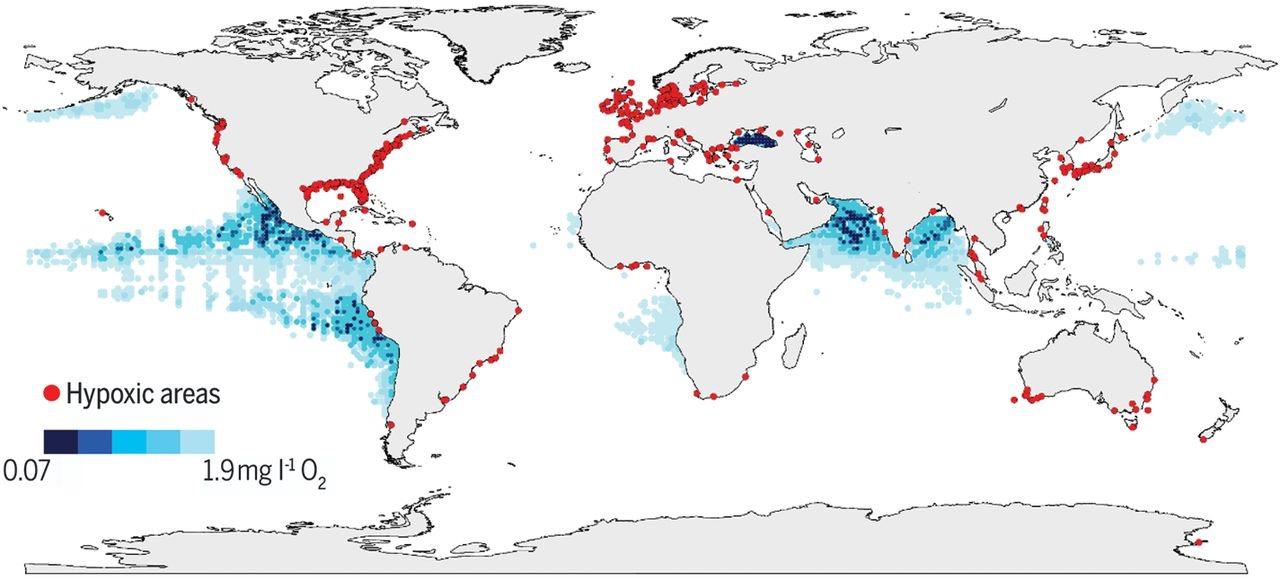
Figure 4 shows coastal and ocean sites where anthropogenic nutrients, such as nitrogen from fertilisers and livestock manure, have exacerbated or caused low oxygen levels (shaded blue areas), leading to the formation of dead zones (red dots). The number and size of ocean dead zones has doubled each decade since the 1960s, mostly due to nutrient pollution from agriculture. Manage and prevent water pollution risk
Improving water quality from source-to-sea requires managing both point and diffuse sources of pollution. The distinction between the two sources is an important function of water quality policy and pollution regulation.
Point sources of pollution are largely controlled in OECD countries. However, contaminants raise emerging concern; for example, pharmaceutical residues, microplastics or other substances can have harmful consequences for human health and freshwater, coastal and marine ecosystems. Mitigation requires a joint approach with industry, as wastewater collection and treatment alone will not suffice and comes at a high cost. In the case of pharmaceutical residues, OECD promotes a life-cycle approach, with active co-operation of all players, from research and manufacturing, to healthcare and the water industry.
Figure 7. Anthropogenic nutrients exacerbate or cause low oxygen-levels and dead zones
Hypoxic areas
0.07 1.9mg I-1O2
Source: Breitburg, D. et al (2018), “Declining oxygen in the global ocean and coastal waters”, Science, 5 January, https://science.sciencemag.org/content/359/6371/eaam7240. Source: BREITBURG ET AL, SCIENCE 2018
Diffuse sources of pollution prevail in OECD countries and limiting diffuse water pollution within acceptable boundaries is essential. An optimal strategy entails a mix of policy interventions reflecting the basic OECD principles of water quality management – pollution prevention, treatment at source, the polluter – pays and beneficiary – pays principles, equity, and policy coherence. While water quality goals are at the core of a policy response, many other sectoral policy frameworks need to be aligned if efforts to reduce the costs of diffuse pollution are to be fruitful. Pharmaceutical Residues in Freshwater: Hazards and Policy Responses (OECD, 2019), Human Acceleration of the Nitrogen Cycle: Managing Risks and Uncertainty (OECD, 2018) and Diffuse Pollution, Degraded Waters: Emerging Policy Solutions (OECD, 2017) examine the risks and provide a combination of policy recommendations and measures to tackle this growing global challenge. OECD reports Water Governance in Cities (OECD, 2016) and Water and Cities: Ensuring Sustainable Futures (OECD, 2015) explore policy responses at the central and local government levels. They focus on mutually dependent dimensions of governance, finance, innovation and urbanrural linkages. Nitrogen requires a different approach, as it disseminates in water, air and soil. A three-pronged approach is called for to tackle nitrogen pollution: 1) in the context of air, water and biodiversity policies, manage the risks of local pollution by better understanding the nitrogen pathways between sources and impact (the “spatially targeted risk approach”); 2) in the context of climate change mitigation and ozone layer protection policies, take into account global atmospheric concentrations of nitrous oxide (the “global risk approach”); and 3) monitor remaining nitrogen surplus (through a national nitrogen balance) and assess the most cost effective ways of maintaining it at a level acceptable to society (the “precautionary approach”). Economic instruments, such as pollution charges or tradable entitlements, are an underutilised means of increasing the cost effectiveness of pollution control strategies while simultaneously promoting innovation.
REFERENCES IUCN (2017), Primary Microplastics in the Oceans: A Global Evaluation of Sources, https://portals.iucn.org/library/sites/library/files/ documents/2017-002.pdf.
Jambeck, J. R. et al., (2015), “Plastic waste inputs from land into the ocean”, Science, 347(6223), 768–771, https://doi.org/https://doi.org/10.1126/science.1260352.
UN Environment (2017), “Marine Litter Socio-Economic Study”, United Nations Environment Programme, Nairobi, Kenya.
WEF (2016), “The New Plastics Economy: Rethinking the future of plastics”, World Economic Forum.
KEY PUBLICATIONS OECD (2022), Global Plastics Outlook: Economic Drivers, Environmental Impacts and Policy Options, OECD Publishing, Paris, https://dx.doi.org/10.1787/de747aef-en.
OECD (2021), A Chemicals Perspective on Designing with Sustainable Plastics : Goals, Considerations and Trade-offs, OECD Publishing, Paris, https://dx.doi.org/10.1787/f2ba8ff3-en
OECD (2021), Policies to Reduce Microplastics Pollution in Water: Focus on Textiles and Tyres, OECD Publishing, Paris, https://dx.doi.org/10.1787/7ec7e5ef-en
OECD (2019), Pharmaceutical Residues in Freshwater: Hazards and Policy Responses, OECD Studies on Water, OECD Publishing, Paris, https://doi.org/10.1787/c936f42d-en.
OECD (2018), Human Acceleration of the Nitrogen Cycle: Managing Risks and Uncertainty, OECD Publishing, Paris, https://doi.org/10.1787/9789264307438-en.
OECD (2018), Improving Markets for Recycled Plastics: Trends, Prospects and Policy Responses, OECD Publishing, Paris, https://doi.org/10.1787/9789264301016-en.
OECD (2018), Meeting report of the Global Forum on Environment: Plastics in a circular economy – Design of Sustainable Plastics from a Chemicals Perspective, ENV/EPOC/ WPRPW/JM(2018)1/FINAL, Environment Directorate, https://oe.cd/gfe-env18.
OECD (2018), “Considerations and Criteria for Sustainable Plastics from a Chemicals Perspective”, Background paper for the 2018 OECD Global Forum on Environment, https://oe.cd/gfe-env-bg18.
OECD (2018), “Technical Tools and Approaches in the Design of Sustainable Plastics”, Background paper for the 2018 OECD Global Forum on Environment, https://oe.cd/gfe-env-bg18-2.
OECD (2018), “Policy Approaches to Incentivise Sustainable Plastic Design”, Background paper for the 2018 OECD Global Forum on Environment, https://doi.org/10.1787/233ac351-en. ITF (2021), “Zero carbon supply chains; The case of Hamburg”, International Transport Forum at the OECD, Paris, https://www.itf-oecd.org/sites/default/files/docs/zerocarbon-supply-chains-hamburg.pdf
ITF (2021), “Navigating towards cleaner maritime shipping: Lessons from the Nordic Region”, International Transport Forum at the OECD, Paris, https://www.itf-oecd.org/sites/default/files/docs/navigatingcleaner-maritime-shipping.pdf
ITF (2018), “Decarbonising Maritime Transport: Pathways to zero-carbon shipping by 2035”, International Transport Forum at the OECD, Paris, https://www.itf-oecd.org/decarbonising-maritime-transport.
ITF (2018), “Decarbonising Maritime Transport: The case of Sweden”, International Transport Forum at the OECD, Paris, https://www.itf-oecd.org/decarbonising-maritime-transportsweden.
ITF (2018), “Reducing Shipping GHG Emissions: Lessons from port-based incentives”, International Transport Forum at the OECD, Paris, https://www.itf-oecd.org/reducing-shipping-ghg-emissions.
OECD (2017), Diffuse Pollution, Degraded Waters: Emerging Policy Solutions, OECD Publishing, Paris, http://dx.doi.org/10.1787/9789264269064-en.
ITF (2016), “Reducing Sulphur Emissions from Ships: The impact of international regulation”, International Transport Forum at the OECD, Paris, https://oe.cd/itf-rses16.
ITF (2014), “Shipping Emissions in Ports”, International Transport Forum at the OECD, Paris, https://www.itf-oecd.org/shipping-emissions-ports.
KEY WEBSITES www.oecd.org/water/water-quantity-and-quality.htm www.oecd.org/environment/waste/ www.itf-oecd.org/maritime www.oecd.org/chemicalsafety/risk-management/
CONTACTS Resource productivity and waste Peter Börkey – Peter.Borkey@oecd.org
Water quality Xavier LeFlaive - Xavier.LeFlaive@oecd.org
Maritime transport Olaf Merk – Olaf.Merk@itf-oecd.org
Chemical safety Eeva Leinala – Eeva.Leinala@oecd.org