





Megger’s





Sunday, February 23 9:00 AM-4:00 PM
Megger BestPractices
Join us as Megger hostsa FREEHands-On BestPracticesSeminar at NETA'sPowerTest2020! Megger 's Best Practices Seminars are designed to bring y ou up to speed on new testing techniques and technology as well as offer the opportunity to engage in technical discussions with our expert engineers. Megger 's world-class Applications Engineers utilize their vast industry knowledge and experience to craft an in-depth program backed by Megger 's expertise in the market. This full-day of quality education includes training related to key industry topics as well as some of the best practices to follow when performing offline electrical testing
PreconferenceEvent- TommyGun's Garage
SponsoredbyDude ElectricalTestingLLCand PotomacTesting,Inc.
Join us for dinner and drinks , comedy , music and a show! Tommy Gun 's Garage is an audience interactive speakeasy that transports you back to the 1920s which includes non-stop comedy and dangerous fun. Be ready to hide your hooch - you could get pulled up on stage to perform a sobriety test given by Officer Murphy! Cost is $ 155includes transportation to and from event, dinner, drinks, and entertainment.
Social Pass
The Social Pass includes admission to the Hospitality Suites, Trade Show , Breakfast and the PowerBash reception. $75 per person This pass is intended for guests of attendees who are not interested in attending technical presentations. Those attending Mon-Thurs sessions do not need to purchase a social pass, as it is included in full conference registration (with exception to the PowerBash reception - this is an additional $35).
Monday, February 24th 12:00 PM - 2:00 PM
PowerDBUser'sGroup
Annual User's Group Meeting open to licensed users of PowerDB Pro Software. Agenda will include presentations by the PowerDB Pro development team as well as utility, industrial and contractor groups discussing how this product is an integral part of their business operations. Pre-registrationis required by contacting PowerDB at (979) 690-7925 ext. 702 or by registering at www.powerdb.com.
5:00 PM-6:00 PM
New ProductForum
Attendees will have the opportunity to learn about dozens of the latest products and innovations, major expansions, and significant improvements by the leading industry-specific manufacturers and suppliers at the Tuesday Trade Show. Stay until the end for the chance to win an exclusive prize! Must be present to win


A NETA World Journal Special Publication
FALL 2019 04 08 11 14

A publication dedicated to disseminating information on technical and professional training for the advancement of the electrical power systems industry




ADAPTING IN THE FACE OF CHANGE: GEN Z AND TRAINING
Jackie M. Peer, OMICRON electronics Corp. USA
THE MAKING OF A LEGEND
Alan M. Ross, SDMyers
ELECTRICAL SAFETY TRAINING: WHAT’S MISSING?
By James R. White, Shermco IndustriesHOW TO AVOID PROSECUTION FOR OSHA OR OH&S VIOLATIONS
Terry Becker, TW Becker Electrical Safety Consulting, Inc.
Since its introduction in the early 1900s, the design and operation of the modern power system has been conducted in a steady-as-she-goes manner. The fundamental protection principles and applications have for the most part remained unchanged; however, with the recent advent and overlay of digital technology along with a more distributed grid, the pace of change has been fast and furious with no signs of slowing down soon.
Electric power, arguably the most critical of all infrastructures, must be generated and delivered in a safe and reliable manner. Society and our way of life depend on it. In recent decades, the electric power industry has faced challenges with the amalgamation of an aging infrastructure with modern technology and systems.
Sometimes described as eclectic, today’s grid is controlled, monitored, and protected by a wideranging mix of technology — electromechanical, solid state, and digital. New control and communications technologies introduce new capabilities and flexibility, but not without added complexity and vulnerability. The rapidly changing
generation resource mix and the integration of renewables to the grid through inverter-based systems have presented new performance and protection considerations. Increased frequency and severity of natural disasters and cyber- and physicalsecurity threats pushes grid resiliency initiatives as a top priority. All this creates even more demand for personnel equipped with mixed skill sets. At this same time, and for the first time with the incumbent Generation Z workforce, we now have five generations working side-by-side.
In the face of change, this article discusses training considerations for today’s evolving grid and multigenerational workforce. Understanding generational differences in the context of workforce development and training can help organizations build richer and more diverse learning experiences to ensure personnel are equipped with mixed skills to design, operate, maintain, and troubleshoot the grid.
Among the many training methods available to train today’s workforce, five types are common.
1 Classroom training. A traditional approach, instructor-led training brings learners (students) together in the same place and at the same time. It provides a dedicated space for instruction and learning that is distraction free from typical day-to-day work and pressures. The classroom experience provides face-to-face personal interaction and an environment where questions are asked and answered and dialog occurs. Students learn from one
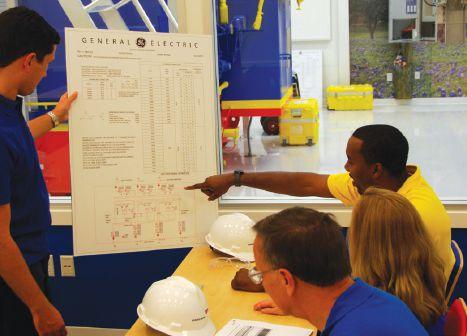
another as well as from the instructor. Two disadvantages are removal from the job students are being trained for (equipment, technology, processes) and lack of hands-on experience.

2 Hands-on training. In this practical approach, trainees dive in and get their hands on what they are learning. This active approach with active participation is typically preferred because the hands-on aspects require focus and help improve retention. This learning-by-doing approach is not always feasible or practical depending on the availability of the technology, apparatus, or system to be trained on, and it lacks instruction on the theory behind the application.

3 eLearning. Electronic learning has been around for decades. It has many definitions that sometimes lead to confusion when trying to articulate exactly what it is: training provided
via a digital device or computer, allowing technology to facilitate learning anytime, anywhere. eLearning can easily scale for delivery to one or many and can be tailored and targeted to meet specific learning objectives. The flexibility to learn based on the learner’s time and schedule and at their own pace is a strong benefit. Switching from traditional classroombased instruction with human interaction to self-paced eLearning provides an entirely different learning experience for the students. However, eLearning can be a challenge for those who struggle with time management and self-motivation in self-directed scenarios.
4 Coaching and mentoring. To coach or to mentor are often used interchangeably, even though there are key differences in the two relationships between coach and coachee and mentor and mentee, respectively. A mentor is someone who offers their knowledge, expertise, and advice to someone with less experience, the mentee. A mentor’s top priority is to develop skills that are relevant not only for the mentee’s present job, but also for future jobs. Coaching tends to be shorter term, more structured and formal, aimed at performance that impacts the present job.
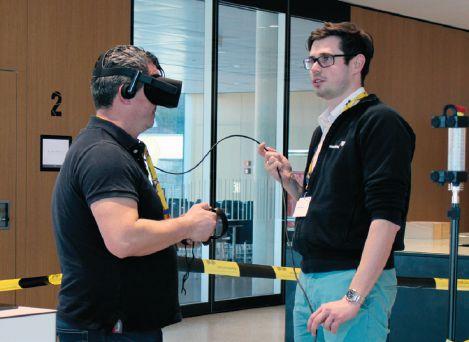
5 Video and Augmented Reality (AR). The influence of video on our everyday life is undeniable, and it’s a powerful medium. It’s only natural that it will extend into the workplace education setting. The online nature of videos allows them to easily be shared, and people tend to learn best when concepts are conveyed
visually. Video boosts engagement and helps retention.
AR is a game changer for training field engineers and technicians, especially for those responsible for testing and troubleshooting. As systems become ever more complex, the use of AR training can increase awareness and, in turn, work safety by practicing virtual equipment maintenance, high-risk tasks, troubleshooting, or working in unique situations.
Traditionally, blended training marries e-learning and instructor-led training to create a hybrid and unique learning experience. Blended training gains popularity because it breaks away from the traditional methods of teaching — methods that don’t work for all students. Blended training covers all learning styles and provides a tailored and favorable learning experience. Combining modern technology such as video or AR with traditional training methods appeals to all different learning styles.
Welcome Gen Z! For the first time, five generations are working side by side: Silents, Baby Boomers, Generation X (Gen X), Generation Y (Gen Y), and Generation Z (Gen Z) (Table 1).
Over the past century, a new generation has been formed every 15-20 years, shaped largely by cultural trends and world events. Multiple generations coexisting in the workplace is not new, but it has become a hot topic for human resources, hiring and training managers, and instructional designers as yet another generation joins the workforce at the same time older workers are postponing retirements and working longer.
Why does this matter? Understanding each generation is important because they have different viewpoints and expectations for their work, workplace culture, and learning and knowledge sharing, making each generation unique from the others.
How important are generational differences when it comes to training? It depends. If you want to create relevant learning and development, it is important.
Let’s face it: Learning styles vary from individual to individual regardless of generation. People learn in different ways, so providing different options for learning appeals to individual preferences, regardless of generation or rank.
Gen Z, for example, is markedly different than their Gen Y predecessors when it comes to learning using digital technology. They use technology differently and are interactive learners who prefer to learn digitally and visually; video is a favorite media versus learning by listening. Understanding the connection between digital engagement and a learner’s experience is key.
This presents an opportunity to enhance training programs and delivery methods, not only to appeal to incumbent Gen Zers, but more so to adapt to a larger range of learner styles and preferences.
To address the topic of learning, LinkedIn conducted a survey comprised of about 400 learning and HR professionals and more than 2,000 Gen Z students.
■ 58% indicated they would like to learn a new skill, but don’t feel they have the time to do so.
■ 43% preferred a fully self-directed and independent approach to learning.
When asked how they preferred to learn new skills, Gen Zers replied:
■ Prefer to learn by doing 55%
■ Prefer online learning, watching a video, or through an online course 38%
■ Prefer to learn by listening 7%
A key takeaway from this survey is that Gen Z students want to learn on their own terms and prefer bite-sized learning. As native internet users, learning and development leaders should consider investing in micro-learning, also referred to as bitesized learning, known for quickly closing skill and knowledge gaps.
The electric power industry depends on the knowledge and expertise of the workforce to support the grid and to ensure the safe and reliable delivery of electric power to society. Today’s power system is going through a transformation with new advancements in technology, more connection
Table 1: Understanding the Generations Silents Baby Boomers
Born 1925–1945
aka Traditionalists
Born 1946–1964
Born 1965–1981
Veterans Builders aka Boomers Me Generation aka Gen X Latch-Key Kids
Telephone
Largely disengaged from technology
Face-to-face
Teach Me
Prefer structured command- and control-oriented learning, classroom lectures, books, and on-the-job training
Face-to-face; telephone or email if required
In Person
Prefer classroom setting with in-class participation; will use technology, may prefer books to reading online
Born 1982–1995
MTV Generation 13th Generation aka Gen Y Millennials Echo Boomers aka iGeneration (iGen) Post-Millennials Centennials
Text messaging or email
Learn by Doing
Prefer self-directed learning and freedom to figure things out on own; computer before books
through communications, and more distributed energy resources. And amid this change, five generations are now working together. All these changes come at the expense of added complexity and vulnerabilities that today’s workforce must understand. This collective change to the grid and the workforce presents an opportunity to understand generational differences, learner styles, and preferences and to create effective

Online/social media and text messaging
Short and Sweet
Thrive on flexibility and space to explore; favor on-demand, highly personalized, and interactive training
Visual communication using technology
Prefer to learn on own terms; prefer visual, interactive, bite-sized, and hands-on learning; use of technology and social media is a given
and appealing training programs. The ultimate goal is to provide effective learning and development opportunities to industry personnel to ensure a skilled workforce is in place to support the grid of today and tomorrow. For companies with limited resources and facilities to create and deliver training, outsourcing to trusted and proven training experts is a practical and feasible option.
JACKIE M. PEER currently serves at OMICRON electronics Corp. USA as Head of Strategic Business Development in North America. Jackie previously worked for more than two decades at Schweitzer Engineering Laboratories (SEL) in a variety of leadership positions in R&D, sales, and technical marketing and as director of SEL’s Modern Solutions Power Systems Conference and SEL University. An IEEE Senior Member, Jackie is a member of the Society of Women Engineers and IEEE Women in Engineering and is a board member for IEEE Women in Power and the IEEE Foundation. She participates at the regional and national levels with IEEE’s Scholarship Plus Initiative, which is devoted to increasing the supply of well-qualified, entry-level engineers to the power and energy industry. Jackie is president of the board of directors for Boys & Girls Clubs of the Lewis Clark Valley, which severs over 4,000 area youth. In 2014, she received the Manufacturing Institute’s Women in Manufacturing STEP (Science, Technology, Engineering and Production) Award, which recognizes women in those disciplines who have made significant achievements in manufacturing.
Irecently had the opportunity to do a podcast interview with Craig Stiegemeier, who is retiring after 40 years with ABB. Craig is the inspiration behind Legends, the podcast featured on Energy Central and Transformer Technology, but he isn’t the only legend who inspired me: Pat Ryan, Executive Director of the IEEE Power & Energy Society; Dan Smith of Austin Energy; Wayne Bishop of OMICRON and Vice President of Meetings for IEEE; John McDonald of GE…and I could go on and on; these are the real legends who have set the standard for all of us.
Why did their interviews inspire me? What were the common traits that make up a legend? The first trait I noticed was the humble way they approach success. Humility is “strength under control for the benefit of others.” At least, that’s my definition. But humility is hard to measure given the very fact that legends tend to be the difference-makers in their professions, the ones who are leaving or have left an impact. So at first glance, they appear to be the leaders, the bold ones who stand head and shoulders above the crowd.
But humility simply gets you through the gate. I’ve observed three of the most important traits that make up the criteria for being a legend.
Legends are life-long learners. This means the person is curious about the world around them and never arrives. They delight in learning more — learning new things in their field of expertise, but also learning for the sake of learning. Being a lifelong learner is innate, something you are born with, but it is also something that can be honed.
Since I have been writing for NETA’s Training Talk, I have come to realize just how important training and education is in this process. Bad training can poison the well and make learning a chore and a bore and worse, a necessary evil. Training should be about learning, and good training should make people want to learn, want to grow their knowledge base, and want to commit to the time, energy, and money good training requires. Training, education, and development for legends are never necessary evils; they are a commitment to the future.
Legends share — openly and willingly — with anyone who wants to learn. You might say that in addition to being life-long learners, they are also life-long teachers. Over ten years ago, a coworker introduced me to Craig Stiegemeier. Craig turned to me and said, “Alan, if there is anything I can share with you to help you learn about our industry, please don’t hesitate to call on me.” That is a life-long teacher,” and over the course of the next decade, Craig was true to his word.
It’s not enough to learn, you must also want others to learn and grow; you delight in watching someone become more than they were, to become life-long learners themselves. And you must be able to give unconditionally and freely. The legends I mentioned are those kinds of people. Most effective trainers meet both of the first two traits because in order to be an effective teacher, you must also be a learner.
Ultimately, in every situation — personally, in their career, in their avocation, or in their community — legends leave it better than they found it. You know them. You know the difference between retirees who are leaving it better than they found it, those who are just leaving it, and those who think a great legacy is all about taking it with them. The word legacy is closely associated with legends because while engaged in their careers, legends are stewards of the time and talents they
have. But they go beyond stewardship into the realm of legacy.
Stewards are responsible for the here and now, for the resources and opportunities we have today. Legacy is what we leave behind for posterity, and for many legends, that is what they are doing — leaving a lasting legacy. We hear too often about how the next generation is not going to be able to know what the boomers knew, that we are losing legacy knowledge by the bucket-full. That is true, but legends give back; they make sure they don’t leave future generations in the lurch. I joke with my sons, telling them that I want my headstone to read, “He left it better than he found it.” Wouldn’t it be a great epitaph for every generation to say, “We left it better than we found it?”
When you combine all three attributes, you have a legend. Sadly, we usually think of the entertainment or sports industries as creating legends, not engineering or technical professions. This article is my call to all legends to realize that we might not make an issue of Sports Illustrated or a show on ESPN, but we can and should try to be a legend, and it does not matter at what age you start. Lifelong learning is just that: learning over an entire lifetime. You can’t start at the end of your career and hope to make up for a life of mediocrity, with twenty years of experience, one year at a time. We must build a full twenty or thirty or even forty years of experience while adding experience on top of experience, knowledge on top of knowledge, wisdom piled high upon wisdom.
Learning without wisdom is like honey without sweetness. It’s just a sticky mess. Wisdom, the application of learning, and teaching others to apply that knowledge is what leaving it better than we found it is all about. Wisdom is knowledge applied in a way that positively impacts every single person you come into contact with.
When I interviewed John McDonald, of GE, he was the most excited and animated when he talked
about his work with students, with GE but also with IEEE. While you could make a case that it was great for GE to be able to recruit the next generation’s best and brightest, that was not John’s main motive: It was to share the passion and the purpose he has had his entire life with a future generation that in most, if not all, cases could never do anything to advance his career. He was leaving a legacy. Unselfishness is a hallmark of legends.

Wouldn’t it be a great epitaph for every generation to say, “We left it better than we found it?”


Wayne Bishop, a Vice President at OMICRON and Vice President of IEEE Meetings is young enough to be able to have significantly more impact with future generations, but Wayne is already a legend in the making. He is already leaving things better than he finds them and will continue to do so as he grows in his career. Wayne is fortunate to have some pretty strong role models to follow, but more important, he is going to be a role model for others to follow.


Change is the wind beneath a legend’s wings.
There are too many to list here, but they know who they are. Their satisfaction comes from knowing that what they are doing matters for future generations. They are also inquisitive. I was recently quoted as saying, “I wish I was 40 years old again.” Why? These are some of the most exciting times for the electrical power industry. Whether industrial, commercial, utility, or government, power is changing.
Technology, robotics, automation, artificial intelligence (AI), machine learning (ML), distributed energy resources (DER), digitalization, micro-grids, smart

cities, smart grid…I could go on and on. There has never been a time with as much change in the power industry as there is today or as much as we will face into the very near future. Change is the wind beneath a legend’s wings. They will learn and apply what they have learned to new ways of doing things, new solutions to not only age-old problems, but to new problems we can only imagine facing in the future. These are the environments where legends thrive.
If all this sounds rather esoteric and unrealistic, it is not. It is powerful, life affirming, and meaningful. Is what we do important? Is what we do leaving things better? Is what we do something we can teach others, so they might learn from our mistakes or leverage our successes beyond what we have been able to experience? I hope so. I hope this simple Training Talk article spurs someone to desire to become a Legend, to espouse the attributes that make up what it means to be a legend: life-long learning, life-long teaching, and making it better than we found it.
ALAN ROSS is Vice President of Reliability at SDMyers, Inc., where he is responsible for developing and executing long-term reliability strategies and next-generation leadership for all domestic and international operating units. Alan often presents at industry conferences and has authored several trade publication articles on transformer maintenance and reliability, including articles featured in Solutions and Uptime magazines, and is the author of two books: Unconditional Excellence and Beyond World Class. He earned a BS in mechanical engineering at Georgia Institute of Technology and an MBA in marketing from Georgia State University, graduating Magna cum Laude. Alan is a Certified Reliability Leader and a member of the IEEE Reliability Society.
Table 1: Fatalities by Event, All Ownerships, 2003-2016
BY JAMES R. WHITE , Shermco IndustriesAtop priority for NETA Member Companies is to continually raise awareness of the hazards of electric shock, arc flash, and arc blast. The concern is warranted due to the frequency these three hazards are faced in electrical work. But with this focus on electrical safety training, are we missing something? What additional types of safety training should we address?
One way to answer this question is to look at your company’s loss and incident history for the last 12 to 18 months. What incidents occurred? What caused those incidents? Another good source of information is OSHA (www.osha.gov). What are the most frequent incidents in the industrial environment? Table 1 reflects fatalities by event from 2003–2016.
#1. Note that transportation is the number one cause of fatalities, and it has been the number one cause of fatalities for far longer than this table goes back. One reason for this is that there are so many people on the road going everywhere at all times of the day or night. This statistic suggests that implementing a safe driving program, which includes associated safety training, should be provided to employees in an effort to reduce accidents and fatalities. Some companies have gone even further and installed a device in each company vehicle that prevents people from texting or performing tasks that would be a distraction while driving. Anything that can be done to reduce the possibility of a traffic incident translates into less opportunity for an injury or fatality.
#2. The number two cause of fatal injuries is workplace violence! Read the paper and it seems every day includes a new story of someone taking out his/her frustrations on others. Maybe your employees would benefit from training on how to recognize people under stress and how to handle a potentially dangerous situation. Many schools have started to offer this type of training for students and teachers. Your employees may not have the same level of risk as a high school student, but can it be said that there is no risk?
#3. Fatalities from falls come in at number three, where it has been for several years. Many people think falls are the leading cause of fatalities in the workplace, but it is only third on the fatalities list. However, falls are the number one cause of nonfatal injuries in the workplace. How much training do your employees have in ladders including when and how to tie off a ladder, what constitutes an unsafe ladder, when guardrails are needed, and what to do if they are not being used? How much training have your field people had in the use of fallarrest systems? The list goes on, because so much is involved with fall protection training. Don’t forget office staff may also need to training in how to change light bulbs or hang signs.
#4. Struck by an object or equipment (number four) is fairly self-explanatory, as being struck implies that the worker may not have been fully aware of the situation or circumstance.
#5. Exposure to harmful substances or environments, excluding electrical, is fifth on the list. Training is primarily needed for those who work around potentially dangerous chemicals, but this could also apply to spray solvents, lubricants, and cleaners. Many workers think approved solvents and cleaners are safe, but reading the cautions on the container makes it clear that the substance is not completely safe — only safer. What is the risk involved in using these items in an enclosed space? Training on the requirement for and use of safety data sheets (SDSs) for all potentially hazardous products should be provided for all workers.
#6. Continuing down the list, “caught in or compressed by equipment or object” sounds especially painful. There are a variety of ways this could happen, but training is typically unique to specific equipment and devices encountered in the workplace.
#7. At the number-seven position is contact with or exposure to electric current — primarily from electric shock. Electrical safety training is typically focused on the areas of electric shock, arc flash, and arc blast hazards. Electrical test and maintenance companies tend to focus their training efforts on electrical safety training. OSHA considers arc flash and arc blast under the heading of explosions.
Thinking electrical equipment or systems are offline without confirmation can result in catastrophic incidents. Workers should be trained on how to recognize hazards and the risks associated with those hazards. I once observed painters within an outdoor substation preparing to paint a 13.8 kV transformer without confirming that the transformer was deenergized. They refused to heed warnings of the potential hazards present. This resulted in a call to the substation owner. The painters were very upset when the substation owner stopped work to investigate the near-miss incident. This is not an example of being caught in the act of wrongdoing, but it does show that people don’t know what they don’t know.
A library or collection of causes of injury or fatality data should be maintained so that up-todate information on actual events and incidents is
available for training purposes. Examples and case histories are always good, as they bring the topic from arm’s length to more personal. Examples within the company will obviously carry the most weight.
Most important, when it comes to safety training, don’t be a box-checker — a company that just wants to get the training over and done with.
OSHA has issued a Letter of Interpretation making it clear that jobs that can present a clear and present danger to workers (such as qualified electrical workers and technicians) require an employer to provide hands-on labs for the demonstration of skills, an instructor who is immediately available to answer questions, and a program that meets all the training requirements of OSHA 1910.332. Therefore, don’t expect training for qualified persons to take just a half-day. Remember that although electrical shock causes more fatalities than arc flash or arc blast, the injuries from an arc flash or arc blast event can be very severe and life altering. The latest data available from the Electrical Safety Foundation International (ESFi) for shock-related fatalities is shown in Figure 1. Based on this information, the industry is moving in the right direction, even though there was a spike in 2016.
Electrical testing and maintenance companies should provide electrical safety training for their

COMPILED BY THE ELECTRICAL SAFETY FOUNDATION INTERNATIONAL USING DATA FROM THE U.S. BUREAU OF LABOR STATISTICS, CFOI, 2003-2016
employees, but safety training should not be limited to just electrical safety. We should strive to provide whatever training is necessary to enable our workers to recognize hazards and the risks associated with those hazards. This means a company should investigate the causes of injury and fatalities in its workplace and provide training to reduce workers’ exposure to those specific injuries and fatalities.
JAMES (JIM) R. WHITE, Vice President of Training Services, has worked for Shermco Industries Inc. since 2001. He is a NFPA Certified Electrical Safety Compliance Professional and a NETA Level 4 Senior Technician. Jim is NETA’s principal member on NFPA Technical Committee NFPA 70E®, Standard for Electrical Safety in the Workplace®, NETA’s principal representative on National Electrical Code® Code-Making Panel (CMP) 13, and represents NETA on ASTM International Technical Committee F18, Electrical Protective Equipment for Workers. Jim is Shermco Industries’ principal member on NFPA Technical Committee for NFPA 70B, Recommended Practice for Electrical Equipment Maintenance and represents AWEA on the ANSI/ISEA Standard 203 Secondary Single-Use Flame Resistant Protective Clothing for Use Over Primary Flame Resistant Protective Clothing. An IEEE Senior Member, Jim received the IEEE/IAS/PCIC Electrical Safety Excellence Award in 2011 and NETA’s Outstanding Achievement Award in 2013. Jim was Chairman of the IEEE Electrical Safety Workshop in 2008 and is currently Vice-Chair for the IEEE IAS/PCIC Safety Subcommittee.
Due diligence: Two words that are and will be interpreted differently by employers, supervisors, safety professionals, electrical engineers, electrical technologists, electricians, and other qualified workers when referring to shock and arc flash hazards. OSHA in the USA and Federal, Provincial, and Territorial OH&S legislation in Canada outline the legal requirements for workplace safety. If there is an electrical incident, the onus is on the employer to prove they have met their legal duties under OSHA or OH&S legislation, including doing everything “reasonably practicable” to avoid the incident.
The Provincial Government’s OHS Branch in Alberta, Canada, provides the following explanation of due diligence:
“Due diligence is the ability to demonstrate that a person did what could reasonably be expected under their circumstances, in order to satisfy a legal requirement. A due diligence defence depends on your ability to demonstrate the actions taken before an incident occurs, not after.
Due diligence is providing reasonable efforts to comply with the legislation; not a perfection standard. Even within the best health and safety systems, non-compliance may occur from time-to-time, and those incidents of non-compliance may result in a serious incident.”
There are many similarities between the concepts of “doing what is reasonably practicable” and “due diligence.” The key difference is that “doing what is reasonably practicable” is a legal obligation that must be performed at all times. “Due diligence” is a defense when the person has failed to comply with an OHS legal requirement, but can prove they did everything reasonable to avoid the non-compliance.”
One additional element of the due diligence defense is demonstrating reasonable care. In a reasonablecare defense, an employer must demonstrate they have taken all reasonable actions to foresee and prevent an incident. An employer’s actions should include:
■ Take the time to review and document actions. Appoint an electrical safety committee. Document meeting minutes to show that OSHA and OH&S legislation has been reviewed; that NFPA 70E, Standard for Electrical Safety in the Workplace or CSA Z462, Workplace electrical safety Standard will be referenced and applied; and that gap analysis will be completed.
■ Proactively identify workplace hazards. Inventory existing energized work tasks that will be performed where a worker may be exposed to shock and/or arc flash hazards and identify what worker role will perform the inventoried work tasks.
■ Eliminate the hazards if possible. Ensure that an established and audited lockout/tagout program is in place. Ensure justification is established when energized electrical work must be performed. Follow the requirements outlined in NFPA 70E or CSA Z462.
■ Develop and implement a management system (e.g., an electrical safety program) for arc flash and shock hazards to control, mitigate, or manage any hazards that cannot be eliminated.
■ Audit the management system to ensure it is working.
■ Ensure that work is not done if it is not possible to eliminate, control, or manage the hazards or mitigate their effects to an acceptable level.
If an employer provided arc flash and shock training several years ago, isn’t that all they were required to do?
As noted under OSHA and OH&S legislation, regulators expect that appropriate due diligence has been implemented and substantiated. Providing training only once several years ago would not be appropriate due diligence.
Due diligence is risk based. Greater oversight is required where there is a greater likelihood of potential injury or damage to health. The employer may also be held accountable to the standard set by other companies in their industry.
To demonstrate due diligence, an employer, safety professional, supervisor, electrician, electrical engineer, electrical technician, and other task-qualified workers should complete these occupational health and safety tasks:
1 The employer recognized shock and/or arc flash hazards with the potential to cause injury or damage to the health of employees or contractors. Risk-based assessments for work tasks were completed to identify whether there is exposure and determine which Hierarchy of Risk Control Methods must be applied to reduce risk. The employer and employee have shared roles and responsibilities. Elimination must be the first priority, and energized electrical work must be documented and justified.
2 The employer developed a management system (e.g., an electrical safety program) to prevent potential injury or damage to health from occurring. NFPA 70E and CSA Z462 provide guidance on the content that should be included in an electrical safety program).Occupational health and safety management system standards (e.g., ANSI Z10 for the USA or CSA Z1000 for Canada) should be consulted to determine the framework or table of contents. Direction on the content of a safety management system is also provided by OSHA in the USA and OH&S regulators in Canada.
3
The employer took reasonable steps to ensure the electrical safety program was working (e.g., audits


or assessments were completed internally or by a third-party electrical safety subject matter expert following an OHS audit process). The employer ensured that the findings and recommendations of an audit were implemented.
4 The employer pre-qualified the company or consultant hired to provide training and reviewed the course content to ensure it complied with NFPA 70E or CSA Z462. Exercises focused on field application of the knowledge, and a formal test was administered. Certificates were issued to students, and the employer retained copies.


5 The employer provided specific direction and instructions to employees and contractors who would be exposed to shock and/or arc flash hazards. The employer developed, implemented, and audited an electrical safety program that included policies and practices that would be applied to an assigned Job. A qualified person was assigned to identify a specific work task(s) related to executing the assignment if there were exposed to shock and/or arc flash hazards. A job safety plan was documented by the qualified person and a job briefing was completed before energized electrical work tasks were executed.
6 The employer provided information and training on the specific requirements in the employer’s electrical safety program, including policies, practices, procedures, PPE procured, electrical incident reporting requirements, emergency response program requirements, etc. Information was posted in the electrical shop or electrical rooms. Arc flash and shock hazard warning or danger equipment labels were installed on electrical equipment.
7 The employer monitored the effectiveness of the electrical safety program to ensure it was working and sustainable. Expected risk control methods

were actually applied in the field to achieve the expected residual risk level. Occupational health and safety management standards and practices were used to monitor observations by supervisors and follow up on near-miss reports, employee testing, and electrical room inspections (e.g., monthly preventive maintenance tasks). Formal electrical safety audits were conducted internally or by a third-party electrical safety SME, including the number and reason for any energized electrical work permit (EEWP) issued in the last 12 months.
Effective due diligence will only really be measured if your company experiences an electrical incident where there is a significant injury and an OSHA or OH&S officer is onsite completing an investigation. This is obviously not the best method to test your company’s due diligence for shock and arc flash hazards. Being proactive in electrical safety as outlined in the seven steps listed above will provide the basis for effective due diligence and reasonable care. Implement and audit the performance of a developed electrical safety program and follow a continuous improvement model. PLAN, DO, CHECK, ACT!
TERRY BECKER, PE, CESCP, IEEE SENIOR MEMBER, is an independent electrical safety specialist and consultant at TW Becker Electrical Safety Consulting, Inc. As the previous owner and visionary of ESPS Electrical Safety Program Solutions Inc., he spent more than 10 years growing the company into an industry-leading total solutions provider for electrical safety consulting, licensed electrical safety programs, and training solutions, including the e-Learning Electrical Safety Training System (ESTS), Electrical Worker, and Non-Electrical Worker training programs. Terry brings more than 28 years of experience as an Electrical Engineer working in both engineering consulting and for large industrial oil and gas corporations. He is the first past Vice-Chair of the CSA Z462 Workplace Electrical Safety Standard Technical Committee and is currently a voting member and leader of Working Group 8 Annexes. Terry is also a voting member of the IEEE 1584 Arc Flash Hazard Calculations Standard Committee and a voting member of the CSA Z463, Maintenance of electrical systems Standard Committee. He attends all NFPA 70E technical meetings as a guest, is recognized as an electrical safety subject matter expert, and participates in NFPA 70E Working Groups. Terry is a Professional Engineer in the Provinces of Alberta, British Columbia, Saskatchewan, and Ontario, and has presented on CSA Z462, NFPA 70E, and electrical safety practices at industry conferences and workshops in Canada, the United States, Australia, and India.
All AVO courses are IACET accredited; most are eligible for NETA CTDs.*
After more than 55 years, AVO Training Institute remains a global leader in electrical safety and maintenance training. With over 57 IACET accredited electrical training courses, our experienced instructors deliver an engaging, hands-on experience in a professional, real-world environment. Our courses are offered at 12 training locations across the US. We also provide convenient on-site training at your facility, custom course design, and online training courses. To complement our training courses, our registered engineering division analyzes power systems to identify conditions that create instability and hazardous work spaces. They offer arc flash studies, risk assessment analysis, and a full menu of electrical engineering services.
Available Courses:
Protective Relay
• Protective Relay Maintenance - Basic
• Protective Relay Maintenance - Advanced
• Protective Relay Maintenance - Generation
• Protective Relay Maintenance - Solid State
• Microprocessor Based Relay Testing - Feeder Protection
• Microprocessor Based Relay Testing - Transformer Protection
• Advanced Visual Testing Software
Circuit Breaker
• Circuit Breaker Maintenance, SF6
• Circuit Breaker Maintenance, Molded- and Insulated-Case
• Circuit Breaker Maintenance, Medium-Voltage
• Circuit Breaker Maintenance, Low-Voltage
Cable
• Cable Splicing and Terminating, Medium-Voltage
• Cable Fault Location and Tracing, Medium-Voltage
• Cable Testing and Diagnostics, Medium-Voltage
Substation
• Battery Maintenance and Testing
• Transformer Maintenance and Testing
• Advanced Transformer Maintenance and Testing
• Substation Maintenance I
• Substation Maintenance II
• Power Factor Testing

Safety
• NFPA 70E 2018 Electrical Safety
• Electrical Safety for Utilities
• Electrical Safety for Mining
• Electrical Safety for Industrial Facilities
• Electrical Safety for Inspectors
• Electrical Safety for Overhead Contact Systems
• 2017 National Electrical Code
• OSHA Electrical Safety Related Work Practices
• Maritime Electrical Safety
Basics
• Basic Electricity
• Basic Electrical Troubleshooting
• Electronics Troubleshooting
• Electronics for Electricians
• Electrical Print Reading
• Grounding & Bonding
Engineering
• Short Circuit Analysis
• Protective Device Coordination Utilities
• Protective Device Coordination Industry
• Power Quality & Harmonics
Motors/Controls
• Programmable Logic Controllers
• Maintenance & Troubleshooting
• Motor Maintenance and Testing
• Motor Controls and Starters, Low-Voltage

Throughout the year, Doble hosts accredited technical trainings on a variety of topics to help engineers and technicians of all levels be more efficient, effective, and safe in the field. Learn from the industry’s top experts, receive real-world training that you can immediately apply, and build your professional network.
• Power Transformers Training
Doble’s transformer design engineers, chemists, and testing specialists bring experience and proven methodologies to provide you the training you need to have an immediate impact at your workplace.
• Laboratory Seminars
Learn how to review data to assess transformer condition from instructors presenting theory and practical examples that illustrate common problems found in the field.
• Protection Training Courses
Choose from a range of protection courses that will prepare you for testing a modern grid, power plant, and industrial facility.
• Substation Equipment Training
Circuit breaker, current transformer, and other electrical asset theory and hands-on testing courses using Doble and Vanguard instruments and software.
• Rotating Machinery Training
Learn to identify and assess emerging rotating machine conditions with off-line and in-service electrical testing.
• Power Cables Training
Interactive course covering the entire asset life-cycle for cables including power cable design, selection and operation, and maintenance best practices.
• Asset Management Training
Reliability-centered maintenance (RCM) theory and practical application training to develop maintenance strategies to improve network reliability and optimize asset life-cycle costs. Courses are offered throughout the year.
• Circuit Breaker Seminar
October 14–18, 2019 | Atlanta, GA
Brush up on circuit breaker fundamentals, get practical hands-on training, and learn from the experts at the industry’s best circuit breaker educational seminar.
• Life of a Transformer Seminar
February 10–14, 2020 | Orlando, FL
The world’s premier training experience on the most critical aspects of large power transformers.
• 2020 Protection Seminar
June 1–4, 2020 | Washington, D.C.
Brings together managers, engineers, and technicians who work in protection testing across generation, transmission, and asset management.
• Free Webinar Series
Offered throughout the year
Join us for our free webinars. Each topic is discussed for approximately one hour. Doble experts cover testing techniques, safety, theory, and industry trends.
Companies with Doble Services Agreements can also join us for these client events:
• Doble Client Committee Meetings & Conference
October 6–10, 2019 | Vancouver, BC, Canada
• International Conference of Doble Clients
March 8–13, 2020 | Boston, MA
Doble Engineering Company is accredited by the International Association for Continuing Education and Training (IACET). Doble complies with the ANSI/IACET Standard, which is recognized internationally as a standard of excellence in instructional practices. As a result of this accreditation, Doble Engineering Company is accredited to issue the IACET CEU. Visit: www.doble.com/earning-ceuswww
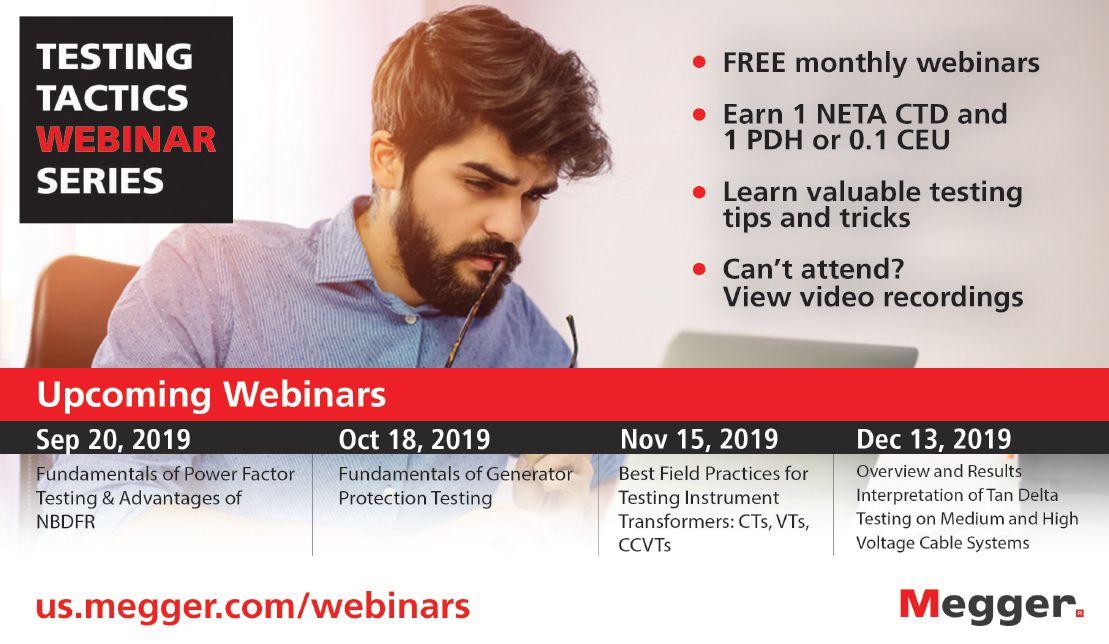
Learn valuable testing tips and tricks from Megger application engineers and product managers. In this webinar series, our experienced staff will show you how to make your testing more efficient by sharing their lessons learned in the field. You will find answers to frequently asked questions, learn how to avoid the most common mistakes, and accelerate your testing.
• Fundamentals of Power Factor Testing & Advantages of NBDFR
Sep 20, 2019 | Presenter: TBD
• Fundamentals of Generator Protection Testing
Oct 18, 2019 | Presenter: David Beard
• Best Field Practices for Testing Instrument Transformers: CTs, VTs, CCVTs
Nov 15, 2019 | Presenter: Daniel Carreno
• Overview and Results Interpretation of Tan Delta Testing on Medium- and High-Voltage Cable Systems
Dec 13, 2019 | Presenter: Steven Spikes

• PD Testing in the Life Management of a Cable
April 19, 2019 | Presenter: Robert Probst
• Battery Maintenance Load Testing: Standards, Requirements & Recommended Practices
May 17, 2019 | Presenter: Volney Naranjo
• Dielectric Frequency Response & Analysis of IEEE Guide C57.161
June 21, 2019 | Presenter: Diego Robalino
• Basics of Distance Protection
July 19, 2019 | Presenter: Abel Gonzalez
• Medium Voltage Cable Fault Location & Reading TDR Traces
Aug 16, 2019 | Presenter: Henning Oetjen
• Megger Webinars are held on the 3rd Friday of every month
• Time: 10:00 AM Central Time
• Sessions are FREE
• Earn 1 NETA CTD and 1 PDH or 0.1 CEU
• us.megger.com/webinars
Webinar Registration: http://us.megger.com/webinars
Megger designs and manufactures portable electrical test equipment. Megger products help you install, improve efficiency, reduce cost, and extend the life of your or your customers’ electrical assets or your own. For more information, visit http://us.megger.com/.
• Power System Protection Testing with the OMICRON Test Universe
Focus on testing the most commonly used protection schemes in transmission and distribution systems. Learn to efficiently test overcurrent, distance, and transformer differential relays using Test Universe, including manual testing, creating automated test plans, element testing (pick-up and delay time of relay elements), and relay logic testing. Perform hands-on tests with various types of relays.
• Recloser Control Testing with ARCO 400
Learn recloser theory and distributions system application. Use the ARCO to test various recloser controls quickly and reliably and get familiar with the software-guided workflow in ARCO Control. Hands-on also includes meter checks, protective function operating characteristics, reclosing sequences, and restoration schemes.
• Introduction to Protection Testing
Focus on basic skills needed by protection and control professionals, including technical math, fault types, CT/ PT introduction, and basic relay concepts. Learn basic protection and control system schemes and techniques for testing them.
• Generator Protection Application and Testing
Get a thorough introduction to synchronous generators and understand the key principles of generator protection. The course covers fundamental concepts, generator connections, and main protection principles for stator fault protection, abnormal operating conditions, and system backup protection. Learn to efficiently test generator protection relays in theoretical and hands-on sessions.
• IEC 61850 Concepts, Application, and Testing
Get an introduction to the data model, services, and engineering process of the IEC 61850 standard. Learn to work with the client/server, GOOSE, and sampled values services for power utility automation in theoretical and hands-on sessions. Perform commissioning and functional testing of IEC 61850-based IEDs and systems.
• Electrical Diagnostic Testing of Power Transformers
Learn how to perform and assess many conventional electrical diagnostic tests recommended for power transformers, including power factor, exciting current, TTR, leakage reactance, DC winding resistance, DGA/ oil screen, life expectancy, SFRA, DFR, bushings, LTCs, surge arresters, and demagnetization techniques using the CPC100, CP TD1, FRANEO, and TESTRANO.
• Basics of Conducting Partial Discharge Measurements Using the MPD 600
Learn the basics of PD measurement applications, including transformers, rotating machines, and cables, plus operating the MPD 600 partial discharge detector and software, gating and noise mitigation, using 3PARD and 3FREQ PD separation techniques, and interpreting typical PD patterns.
• Introduction to the CIBANO 500 and Testing Circuit Breakers
MICRON offers a wide variety of training courses in Houston, Texas; Waltham, Massachusetts; Hamilton, Ontario, Canada; or on your site. Courses include both classroom and hands-on instruction. For pricing, training location, and additional information, visit www.omicronenergy.com/na-training or call 1-800-OMICRON. For dates, details, and locations please visit: www.omicronenergy.com/na-training
Focus on timing, travel, and contact resistance measurements of circuit breakers using the CIBANO, including test plan creation and test result analysis. Includes hands-on measurement including main contact timing, pole spread, dwell/dead timing, travel/stroke, contact wipe, minimum pick-up, and static/dynamic resistance.
• Current Transformer Testing and Analysis
Gain an understanding of the IEEE and IEC assessment standards that apply to protection and metering CTs. The CT Analyzer will be used to assess the accuracy and serviceability of various CT classes (C, K, T, and B) by hands-on measurement of ratio, burden, winding resistance, and knee-point excitation curves.

Shermco is a leader in electrical power systems maintenance, repair, and testing, and for years, we have trained others in those skills. Offering onsite, classroom, and hands-on training, Shermco conducts a wide variety of courses covering Electrical Systems Maintenance, Electrical Safety, and Electrical Technical Skills. Some of the most influential leaders in electrical safety work at Shermco Industries, and now you have direct access to that experience and expertise! Shermco offers technical and electrical safety programs year-round and at multiple locations in the U.S. and Canada. NETA CTDs and CEUs through IEEE are available for most courses where applicable. Train with the experts. Train with Shermco.
• Electrical Safety for Qualified Electrical Workers
Austin. TX
2019 - 11/12
2020 - 2/11; 5/12; 8/11; 11/10
Chicago, IL
2019 - 10/1
2020 - 2/25; 5/19; 8/18; 11/17
Dallas, TX
2019 - 9/10; 10/8; 11/5; 12/10
2020 - 1/7; 2/4; 3/3; 4/7; 5/12; 6/9; 7/7; 8/4; 9/1; 10/6; 11/10; 12/8
Cedar Rapids, IA
2019 - 10/1
2020 - 2/11; 6/9; 10/6
Houston, TX
2019 - 5/21; 6/18; 9/17; 10/22; 12/3
2020 - 3/10; 5/19; 6/9; 9/15; 10/13; 12/1
Tulsa, OK
2019 - 10/15
2020 - 1/28; 5/19; 8/18; 11/17
Wilmington, CA
2019 - 5/21; 6/11; 8/6;10/22
2020 - 3/24; 6/23; 9/22;12/8
• Fundamentals of Protective Relay Testing and Maintenance
Cedar Rapids, IA
2019 - 12/3
2020 - 1/21; 4/28; 7/21; 10/27
Chicago, IL
2019 - 12/3
2020 - 2/11; 5/19; 8/11; 11/17
Dallas, TX
2019 - 10/21; 12/16
2020 - 3/16; 6/15; 9/14; 12/7
Houston, TX
2019 - 10/21
2020 - 1/21; 4/28; 7/21; 10/27
Wilmington, CA
2019 - 10/16
2020 - 2/11; 5/19; 8/11; 11/17
• Low to Medium Voltage Circuit Breaker Maintenance
Cedar Rapids, IA
2019 - 10/14
2020 - 1/6; 4/20; 7/20; 10/19
Chicago, IL
2019 - 10/14
2020 - 1/13; 4/13; 7/13; 10/12
Dallas, TX
2019 - 9/30
2020 - 3/16; 6/15; 9/14; 12/14
Houston, TX
2019 - 10/14
2020 - 2/10; 5/11; 8/10; 11/9
Wilmington, CA
2019 - 10/14
2020 - 2/3; 5/4; 8/3; 11/2
• Introduction to SEL Relays
Dallas, TX
2020 - 3/17; 7/14; 11/17
Houston, TX
2020 - 1/28; 4/28; 7/21; 10/27
• Substation Maintenance I (Circuit Breakers, Grounding and Batteries)
Cedar Rapids, IA
2019 - 11/11
2020 - 2/4; 4/28; 8/25; 10/27
Chicago, IL
2019 - 11/11
2020 - 2/17; 5/11; 8/10; 11/9
Dallas, TX
2019 - 11/5
2020 - 4/6; 7/6; 10/5; 12/7
Houston, TX
2019 - 9/23; 12/2
2020 - 3/3; 6/16; 9/22; 11/10
Wilmington, CA
2019 - 9/23; 12/2
2020 - 3/17; 6/2; 9/22; 12/1
• Substation Maintenance II (Transformers and Relyas)
Cedar Rapids, IA
2019 - 11/18
2020 - 2/11; 5/5; 9/1; 11/3
Chicago, IL
2019 - 11/18
2020 - 2/24; 5/18; 8/17; 11/16
Dallas, TX
2019 - 11/12
2020 - 4/13; 7/13; 10/12; 12/14
Houston, TX
2019 - 9/30; 12/9
2020 - 3/10; 6/23; 9/29; 11/17
Wilmington, CA
2019 - 9/30; 12/9
2020 - 3/24; 6/9; 9/29; 12/8
Enroll today by visiting www.shermco.com/training or call 888-Shermco.
For more information, to download our current course catalog, or to register online, go to www.shermco.com/training or email traininginfo@shermco.com
• 888-SHERMCO


OMICRON invites you to participate in the training sessions on Transformer, Circuit Breaker, and Protection Testing at the OMICRON Academy in Houston.


Benefit from professional courses with expert trainers, full-scale training equipment, e ective methodology and excellent customer care. Then, try what you have learned in the classroom with some hands-on testing at our indoor substation
Find your training at www.omicronenergy.com/na-training



 Charles Sweetser Primary Engineering Services Manager


SDMyers.com | 800.444.9580 ext. 4018 180 South Avenue, Tallmadge, OH 44278, USA


Unlocking the Mysteries of Narrow BandDFR
Insulation power factor at 60 hertz is traditionally used to assess the quality of an insulation system. As the applied frequency decreases, the effect of capacitive current diminishes while the conductive watt losses remain constant. As a result, conductive losses become exponentially more visible at lower frequencies. The narrow band DFR protocol (NBD FR) is tremendously sensitive to small changes in insulation condition, representing a quantum leap in diagnostic reach compared to single-frequency power factor testing Changes in condition that would be undetectable at 60 hertz can be clearly seen at lower frequencies. Technicians must be cognizant of the effects of temperature, but the most significant challenge is to discern normal versus abnormal responses. Differing geometric influences are encountered when multiple manufacturers and voltage classes are evaluated, especially when working with distribution-class units.
ByRobertBreazealS(!UthernCaliforniaEdisonCo.7
President's Desk
Scott Blizard, Ame rican ElectricalTestingCo., LLC
NETA President
40 Progress in Transformer Dissolved-Gas Analysis
JamesJ Dukarm , PhD, D elta-X Research Inc
50 What's in a Partial Discharge Monitoring System?
William Higinbotham, EA TechnologyLLC
58 High-Voltage Arc Flash Assessment and Applications - Part 2
Albert Marroquin, PE, ETAP; Abdur Rehman, PE, Puget Sound Energy; and Ali Madani, AllumiaX Engineering
68 A Tribute to John Moore 1942-2019
John White, PE, Sigma Six Solutions
10 NFPA 70E–2021 Edition: Second Draft
Highlights and Summary
Ron Widup and James R. White, Shermco Industries
17 Safety Corner
Electrical Service Work and Worker Fatigue: Take Care of Yourself!
Ron Widup, Shermco Industries
22 Tech Tips
Another Test for Lightning Protection
Jeff Jowett, Megger
29 Tech Quiz
Emerging Technologies
James R. White, Shermco Industries
78 Three Tips to Reduce Wasted Time When Testing Transformers
Brandon Dupuis, OMICRON electronics Corp. USA
84 Using Measurement Results to Diagnose the Condition of High-Voltage Rotating Machines —Part 2
Mladen Šašić and Connor Chan, Iris Power
92 A Brief Summary: IEEE Guide for Dielectric Frequency Response Test
Diego Robalino, PhD, PMP, Megger
INSIGHTS & OBSERVATIONS — NETA CAP SPOTLIGHT
98 Protec Equipment Resources: Large Enough to Serve Your Needs, Small Enough to Care
SPECIFICATIONS AND STANDARDS
106 ASTM F18 Committee Report
James R. White, Shermco Industries
109 NFPA 70B Committee Report
David Huffman, Power Systems Testing Company
111 IEEE Transformers Committee Report
Scott Reed, MVA Diagnostics, Inc.
116 NETA EPTT Courses Gain Enrollment
Bob Sheppard, Premier Power Maintenance, and Nenad Pasic, Tony Demaria Electric
120 Kerry Heid Receives CSA Award of Merit
122 NETA Accredited Companies
130 Advertiser List



3050 Old Centre Road, Suite 101
Portage, MI 49024
Toll free: 888.300.NETA (6382)
Phone: 269.488.NETA (6382)
Fax : 269.488.6383
neta@netaworld.org
www.netaworld.org
executive director: Missy Richard
NETA Officers
president: Scott Blizard, American Electrical Testing Co., Inc.
first vice president: Lorne Gara, Orbis Engineering Services, Ltd.
second vice president: Eric Beckman, National Field Services
secretary: Scott Dude, Dude Electrical Testing, LLC
treasurer: John White, Sigma Six Solutions, Inc.
NETA Board of Directors
Ken Bassett (Potomac Testing, Inc.)
Eric Beckman (National Field Services)
Scott Blizard (American Electrical Testing Co., Inc.)
Jim Cialdea (CE Power Engineered Services, LLC)
Scott Dude (Dude Electrical Testing LLC)
Lorne Gara (Orbis Engineering Field Services, Ltd.)
Dan Hook (Western Electrical Services, Inc.)
David Huffman (Power Systems Testing)
Alan Peterson (Utility Service Corporation)
Chasen Tedder, Hampton Tedder Technical Services
John White (Sigma Six Solutions)
Ron Widup (Shermco Industries)
NETA World Staff
technical editors: Roderic L. Hageman, Tim Cotter
assistant technical editors: Jim Cialdea, Dan Hook, Dave Huffman, Bob Sheppard
associate editor: Resa Pickel
managing editor: Carla Kalogeridis
copy editor: Beverly Sturtevant
advertising manager: Laura McDonald
design and production: Moon Design
NETA Committee Chairs
M O N S T E R E L E C T R I C A L H
conference: Ron Widup; membership: Ken Bassett; promotions/marketing: Scott Blizard; safety: Scott Blizard and Jim White; technical: Alan Peterson; technical exam: Dan Hook; continuing technical development: David Huffman; training: Bob Sheppard; finance: John White; nominations: Alan Peterson; alliance program: Jim Cialdea; association development: Ken Bassett and John White
© Copyright 2019, NETA
NOTICE AND DISCLAIMER
NETA World is published quarterly by the InterNational Electrical Testing Association. Opinions, views and conclusions expressed in articles herein are those of the authors and not necessarily those of NETA. Publication herein does not constitute or imply endorsement of any opinion, product, or service by NETA, its directors, officers, members, employees or agents (herein “NETA”).
All technical data in this publication reflects the experience of individuals using specific tools, products, equipment and components under specific conditions and circumstances which may or may not be fully reported and over which NETA has neither exercised nor reserved control. Such data has not been independently tested or otherwise verified by NETA.
NETA MAKES NO ENDORSEMENT, REPRESENTATION OR WARRANTY AS TO ANY OPINION, PRODUCT OR SERVICE REFERENCED OR ADVERTISED IN THIS PUBLICATION. NETA EXPRESSLY DISCLAIMS ANY AND ALL LIABILITY TO ANY CONSUMER, PURCHASER OR ANY OTHER PERSON USING ANY PRODUCT OR SERVICE REFERENCED OR ADVERTISED HEREIN FOR ANY INJURIES OR DAMAGES OF ANY KIND WHATSOEVER, INCLUDING, BUT NOT LIMITED TO ANY CONSEQUENTIAL, PUNITIVE, SPECIAL, INCIDENTAL, DIRECT OR INDIRECT DAMAGES. NETA FURTHER DISCLAIMS ANY AND ALL WARRANTIES, EXPRESS OF IMPLIED, INCLUDING, BUT NOT LIMITED TO, ANY IMPLIED WARRANTY OF FITNESS FOR A PARTICULAR PURPOSE.
ELECTRICAL TESTING SHALL BE PERFORMED ONLY BY TRAINED ELECTRICAL PERSONNEL AND SHALL BE SUPERVISED BY NETA CERTIFIED TECHNICIANS/ LEVEL III OR IV OR BY NICET CERTIFIED TECHNICIANS IN ELECTRICAL TESTING TECHNOLOGY/LEVEL III OR IV. FAILURE TO ADHERE TO ADEQUATE TRAINING, SAFETY REQUIREMENTS, AND APPLICABLE PROCEDURES MAY RESULT IN LOSS OF PRODUCTION, CATASTROPHIC EQUIPMENT FAILURE, SERIOUS INJURY OR DEATH.





Emerging technologies continually alter the way electrical testing is performed in the eld. New technology can vary from more e cient ways to perform long-standing test routines to introducing a new test technology and just about everything in between. is issue’s authors share their knowledge of recent developments in the eld of electrical testing.
Fall is typically one of the busiest times of the year. Customers are performing scheduled maintenance outages, and work days can be longer as well as more stressful than normal. To make the work environment safer for all, we must constantly evaluate and mitigate exposures to risk. When working with new technology, a technician must have all of the documentation and a clear understanding of how the technology interfaces with the device under test. Review the safety precautions needed to operate the equipment or device and ensure all recommended safety precautions are followed.
Mark your calendar for PowerTest 2020 on February 24–28, 2020, in one of the world’s most dynamic and popular cities: Chicago — at the Hyatt Regency. e PowerTest Conference Committee and the members of our local organizing committee have already met on-site, and I can tell you the venue and programs for PowerTest 2020 are sure to be outstanding.
On a sad note, the testing community lost John Moore — one of the original organizers of the National Electrical Testing Association (NETA) — in February. We remember John and thank him for his vision, commitment, and service to our industry as we pay tribute to him in this issue.
I look forward to being your President for the next two years as I follow the path set by my predecessors. I thank Jim Cialdea for the great job he has done. NETA’s dedicated sta , board of directors, volunteers, and members all working together will ensure NETA continues to be the leader in the electrical testing industry.
Coach safe behavior…Living injury free every day!

Scott A. Blizard, President
NETA — InterNational Electrical Testing Association
Safety First…No One Gets Hurt!

Modern turn-key solution for monitoring AC-PRO ® and AC-PRO-II ® networks at one convenient location


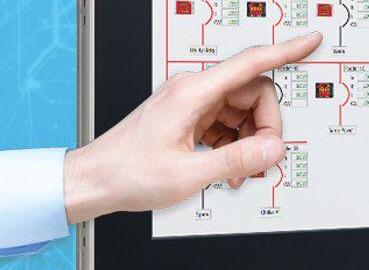


Based on a rugged industrial computer featuring pre-installed user friendly software and a 21.5” high-definition touchscreen, Smart 1-Line™ displays a field-configurable electronic one line diagram. Simply tap a breaker symbol to launch circuit breaker readings, status, waveforms, and more.



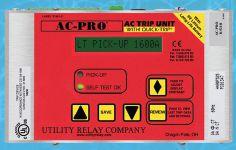


Compatible with AC-PRO ® & AC-PRO-II ®
• Field configurable to match one line drawing
• Display current, voltage, power, energy
• Full Modbus communications capabilities
• Improved Safety with Remote Tripping
• High resolution color touch screen
• Ethernet and RS-485 communications
• AND MUCH MORE!


 BY RON WIDUP and JIM WHITE, Shermco Industries
The second draft technical committee meeting for the 2021 Edition of NFPA 70E was held July 15–19, 2019 in Indianapolis, Indiana. The public comments submitted for committee action following the first draft meeting were discussed and voted on. NETA was represented at the meeting and participated in the actions.
To remind everyone of the NFPA process for changes to a standard:
1. The public submits an input for change or edit to an existing standard.
2. The technical committee votes to approve, reject, or modify the public input in the first draft meeting.
3. The public comments on the actions taken at the first draft meeting.
4. The technical committee reviews the public comments and can take four actions:
a. Accept and create a second revision
b. Reject but see a related second revision
c. Reject
d. Reject but hold for the next code cycle
Most of the changes under consideration through the public inputs and comments are to make the 70E more user-friendly. Especially in the last two revision cycles, the committee has strived to reorganize and revise the text so it is easier to understand and easier for technicians and electrical workers to apply in the field. This standard is not just for supervisors or managers; it is intended to be used by all workers who need it. (Key point: Remember that! This standard can be a valuable resource for you.) Here a few highlights of the actions taken.
To avoid confusion between the terms “barricade” and “barrier,” the words “ or to prevent unauthorized access to a work area” were removed from the term “barrier.” Simply put, a barricade is a physical barrier; a barrier prevents contact with energized parts.

*Editor’s Note: The term “SR No. [x]” signifies Second Revision, which is related to the process of executing a technical committee action.
Arguably one of the most important definitions in the standard, the Informational Note was modified to more clearly define “electrically safe work condition.” The revised text is as follows:
Informational Note: An electrically safe work condition is not a procedure; it is a state wherein all hazardous electrical conductors or circuit parts to which a worker might be exposed are in a zero energy de-energized state for the purpose of temporarily eliminating electrical hazards for the period of time for which the state is maintained.
In Chapter 2, Section 250.3 Safety Grounding Equipment, there was a proposal to add a requirement to test temporary grounding equipment when the user determines it is necessary or no more than every three years.
The three-year time requirement was rejected, but the requirement to test temporary grounding equipment “as service conditions require” was approved. This is an important requirement, as you do not want to use worn or damaged temporary protective grounds without testing them first. The section now reads (with revisions shown):
(B)
Prior to being returned to service, temporary protective grounding equipment that has been repaired or modified shall be tested. Temporary protective grounding equipment shall be tested as service conditions require. but in no case shall the interval exceed 3 years.
Several sections of article 110 were expanded at the first draft meeting.
Under the direction of the NEC Correlating Committee, a very important statement was added to clarify the priority of 110.1 Addressing Hazard Elimination. The revised text states:
Hazard elimination shall be the first priority in the implementation of safety-related work practices.
Many electrical workers miss this. They go right into using PPE without following the hierarchy of risk control methods. Elimination is the very first method mentioned and should be the culture in which we all operate. Remember, if you eliminate the hazard, the hazard doesn’t exist!
Informational Note No. 1 refers the user to Informative Annex F Risk Assessment and Risk Control. Informational Note No. 2 incorporates the new wording found in the definition of electrically safe work condition:
An electrically safe work condition is a state wherein all hazardous electrical conductors or circuit parts to which a worker might be exposed are placed and maintained in a deenergized state, for the purpose of temporarily eliminating electrical hazards. See Article 120 for requirements to establish an electrically safe work condition for the period of time for which the state will be maintained. See Informative Annex F for information regarding the hierarchy of risk control and hazard elimination.
This Informational Note was added primarily because there was some question whether placing equipment in an electrically safe work condition met the definition of elimination. This clarifies that it does.
To continue that line of thought, Section 110.2 General states:
Electrical conductors and circuit parts shall not be considered to be in an electrically safe work condition until all the requirements of Article 120 have been met. Safe work practices applicable to the circuit voltage and energy level shall be used in accordance with Article 110 and Article 130 until such time that electrical conductors and circuit parts are in an electrically safe work condition.
The two sections, 110.1 and 110.2, reinforce each other.
One question that often comes up in the field is what to do when an absence of voltage test is required, but you know that the incident energy exposure is very high.
Here’s a typical scenario: You are about to work on equipment between the transformer secondary and the line side of the main breaker, which has incident energy over the rating of your arc flash PPE. You have turned it off. You have a high degree of certainty that it is off, but you need to verify using a voltage detector. Revisions to the Informational Note in 130.7(C)(1) help clear this up:
(C) Personal Protective Equipment (PPE) (1) General.
When an employee is working within the restricted approach boundary, the worker shall wear PPE in accordance with 130.4. When an employee is working within the arc flash boundary, he or she shall wear protective clothing and other PPE in accordance with 130.5. All parts of the body inside the arc flash boundary shall be protected.
Informational Note: Although PPE is required for all parts of the body within the arc flash boundary, similar PPE can be used for parts of the body outside the arc flash boundary Where the estimated incident energy exposure is greater than the arc rating of commercially available arcrated PPE, then for the purpose of testing for the absence of voltage, the following examples of risk reduction methods could be used to reduce the likelihood of injury due to sound occurrence of an arcing event or the expulsion of burning particles or other projectiles severity of exposure:
(1) Use of non-contact proximity test instrument(s) or measurement of voltage on the secondary side of a low voltage transformer (VT) mounted in the equipment before use of a contact test instrument to test for the absence of voltage below 1000 volts.
(2) If equipment design allows, observe visible air gaps between the equipment conductors and circuit parts and the electrical source(s) of supply.
(3) Increase the working distance
(4) Consider system design options to reduce the incident energy level.
These are just a few of the revisions being considered for the next edition of NFPA 70E. There are many others, but these should be of general interest to NETA Member Companies. As a suggestion, go online and look at the NFPA’s website, www.nfpa.org, search for 70E, and select the Next Edition tab. Go to the Second Draft section, click on the View Public Comments link, and read the changes. They are all there for you to review the changes that have been proposed.
Although the public comment period has been over for some time, you can still ask us a question and we’ll get back to you — maybe in the next column!
Ron Widup and Jim White are NETA’s representatives to NFPA Technical Committee 70E, Electrical Safety Requirements for Employee Workplaces. Both gentlemen are employed by Shermco Industries in Dallas, Texas, a NETA Accredited Company.

Ron Widup, Shermco Industries Vice Chairman and Senior Advisor, Technical Services has been with Shermco since 1983, and currently serves on the company’s board of directors. He is a member of Technical Committee on NFPA 70E, Electrical Safety in the Workplace; a Principal Member of National Electrical Code (NFPA 70) Code Panel 11; a Principal Member of the Technical Committee on NFPA 790, Standard for Competency of Third-Party Evaluation Bodies; a Principal Member of the Technical Committee on NFPA 791, Recommended Practice and Procedures for Unlabeled Electrical Equipment Evaluation; a member of the Technical Committee on NFPA 70B, Recommended Practice for Electrical Equipment Maintenance, and Vice Chair for IEEE Std. 3007.3, Recommended Practice for Electrical Safety in Industrial and Commercial Power Systems. Ron also serves on NETA’s board of directors and Standards Review Council. He is a NETA Certified Level 4 Senior Test Technician, a State of Texas Journeyman Electrician, an IEEE Standards Association member, an Inspector Member of the International Association of Electrical Inspectors, and an NFPA Certified Electrical Safety Compliance Professional (CESCP).

James (Jim) R. White, Vice President of Training Services, has worked for Shermco Industries since 2001. He is a NFPA Certified Electrical Safety Compliance Professional and a NETA Level 4 Senior Technician. Jim is NETA’s principal member on NFPA Technical Committee NFPA 70E®, Electrical Safety in the Workplace; NETA’s principal representative on National Electrical Code® Code-Making Panel (CMP) 13; and represents NETA on ASTM International Technical Committee F18, Electrical Protective Equipment for Workers. Jim is Shermco Industries’ principal member on NFPA Technical Committee for NFPA 70B, Recommended Practice for Electrical Equipment Maintenance and represents AWEA on the ANSI/ISEA Standard 203, Secondary Single-Use Flame Resistant Protective Clothing for Use Over Primary Flame Resistant Protective Clothing. An IEEE Senior Member, Jim was Chairman of the IEEE Electrical Safety Workshop in 2008 and is currently Vice Chair for the IEEE IAS/PCIC Safety Subcommittee.




The largest NETA Accredited technical group in the industry, that never compromises safety.


As North America’s largest independent electrical testing company, our most important Company core value should come as no surprise: assuring the safety of our people and our customer’s people. First and foremost.
Our service technicians are NETA-certified and trained to comply and understand electrical safety standards and regulations such as OSHA, NFPA 70E, CSA Z462, and other international guidelines. Our entire staff including technicians, engineers, administrators and management is involved and responsible for the safety of our co-workers, our customers, our contractors as well as our friends and families.
Our expertise goes well beyond that of most service companies. From new construction to maintenance services, acceptance testing and commissioning to power studies and rotating machinery service and repair, if it’s in the electrical power system, up and down the line, Shermco does it.


 BY RON WIDUP, Shermco Industries
Chances are you are in an electrical career you love: Testing, maintaining, installing, commissioning, designing, rebuilding, engineering, improving… and generally making electrical power systems safer and better.
But are you doing so with a focus on managing the possible onset of acute or chronic fatigue?
We live in a busy world — do more with less; be efficient in your tasks; balance work, family, hobbies; keep up with industry rules; keep your phone on and answer emails….and make some cash along the way to pay for all of life’s expenses.
But be careful! Doing too much at one time or for too many days in a row can lead to worker fatigue and compromise your personal safety or the safety of those around you.
OSHA provides several interesting facts about worker fatigue. For instance, did you know


that decreased alertness was found to be a contributing factor in these industrial incidents?
• Texas City BP Oil Refinery Explosion
• Colgan Air Loss of Control on Approach
• Space Shuttle Challenger Accident
• Chernobyl and Three Mile Island Nuclear Accidents
In addition to these high-profile events, we all remember incidents we personally know of or have been involved in, and we likely have a few that can be directly related to fatigue. When you have been hurt or something goes awry, was it that last ski run of the day, the last substation on the list, the end of a long day, or after “I can do one more [insert task here]?”
So why wouldn’t we want to take care of our people and manage their safety and health when doing electrical work for long periods of time — either in a single day or over several consecutive days? Obviously, we would.
In 1984, I was involved in an arc flash incident. A 400-amp, 480-volt automatic transfer switch blew up and burned my face and arms. Not fun. And guess what: I was working on switch number seven — the last one of the day. Was I as fresh on switch number seven as I was on switch number one? Not a chance.

Does your company have a fatigue policy? If not, it should. We work in a potentially very dangerous industry that involves a hazard you can’t see, you can’t smell, and you can’t touch. You MUST be alert, aware, and always engaged. Always. Not doing so can have dire consequences.
Several things that might impact our level of fatigue normally fall into two categories: 1) lifestyle or 2) other physical/mental conditions.
Fatigue in the lifestyle category can be related to:
• Use of alcohol or drugs
• Excess physical activity shortly before going to bed
• Jet lag
• Not allowing enough time to get the rest your body needs
• Medications such as antihistamines and cough medicines
• Unhealthy eating habits that cause indigestion or upset stomach
Fatigue can also be brought about by other physical or mental conditions:
• Physical illnesses, like cancer, emphysema, COPD, and various heart conditions that affect your ability to rest
• Anxiety
• Depression
• Sleep apnea, which may keep your sleep from being restful
• Stress, when you just can’t seem to turn your brain off about things that bother or upset you
• Simply working too much (keep reading)
The most common causes of fatigue, and often the most overlooked, can fall into these two
categories: 1) extended or extreme work hours, or 2) continuous work days without breaks in the schedule. You can get yourself in trouble if you don’t monitor your health and allow for needed rest time.
Acute fatigue results from short-term sleep loss or from short periods of heavy physical or mental work. This type of fatigue can be reversed by sleep and relaxation.
Chronic fatigue is the constant, severe state of tiredness that is not relieved by rest. Symptoms are similar to the flu and can last longer than six months.
First, step back and think about it. How do you manage your projects? Your customers? And most important, yourself and your people? Take an honest assessment of how you manage your time, and if you are pushing yourself too hard, be proactive and change the situation.
Human performance training teaches us that we are fallible. We make mistakes. From time to time, we can have a lapse in judgment, and this can lead to disastrous consequences.
Here are a few key points to think about when it comes to fatigue management:
• Limit work shifts to 14–16 hours max. If the length of a shift is to be extended beyond 16 hours, senior management should be notified and mitigation steps to reduce hazards should be developed and approved.
• Employees who have worked 16 or more hours should be provided with a rest break of at least 8 hours.
• Work schedules should not exceed 14 consecutive day or night shifts, regardless of the number of hours worked per shift.
• Work sites should adhere to a schedule of work not to exceed 21 consecutive day or night shifts, regardless of number of hours worked per shift.

• Personnel should be scheduled for a minimum of 36 consecutive hours off after a 14- or 21-day work schedule.
• Have some fun in your life!
According to 2004 data from the Bureau of Labor Statistics and information from the U.S. Centers for Disease Control and Prevention (CDC), almost 15 million Americans work full time on evening shift, night shift, rotating shifts, or other employer-arranged irregular schedules. According to U.S. National Health Interview data from 2010, almost 19% of working adults work 48 hours or more per week, and more than 7% work 60 hours or more. Both shift work and long work hours have been associated with health and safety risks.
Electrical work, emergency outages both planned and unplanned, and long-term projects exacerbate the worker fatigue issue… because we must always be safe, error free, and aware of the hazards around us, regardless of the time of day or number of hours worked. Remember: We can’t see, hear, or smell an electrical hazard! Make sure fatigue doesn’t affect you or your workforce.
Here’s some advice for you: Get some rest! Good night.


ANSI/API Recommended Practice 755, Second Edition, Fatigue Risk Management Systems for Personnel in the Refining and Petrochemical Industries, May 2019.
OSHA Worker Fatigue Awareness: https://www.osha.gov/SLTC/workerfatigue/index. html.
Colgan Air Disaster: https://www.ntsb.gov/investigations/ AccidentReports/Reports/AAR1001.pdf.
BP America Refinery Explosion: https://www.csb.gov/file.aspx?DocumentId=5596.
Space Shuttle Challenger Accident, Rogers Commission Report: https://spaceflight.nasa.gov/outreach/ SignificantIncidents/assets/rogers_commission_ report.pdf.

Ron Widup, Shermco Industries Vice Chairman and Senior Advisor, Technical Services has been with Shermco since 1983, and currently serves on the company’s board of directors. He is a member of Technical Committee on NFPA 70E, Electrical Safety in the Workplace; a Principal Member of National Electrical Code (NFPA 70) Code Panel 11; a Principal Member of the Technical Committee on NFPA 790, Standard for Competency of Third-Party Evaluation Bodies; a Principal Member of the Technical Committee on NFPA 791, Recommended Practice and Procedures for Unlabeled Electrical Equipment Evaluation; a member of the Technical Committee on NFPA 70B, Recommended Practice for Electrical Equipment Maintenance, and Vice Chair for IEEE Std. 3007.3, Recommended Practice for Electrical Safety in Industrial and Commercial Power Systems Ron also serves on NETA’s board of directors and Standards Review Council. He is a NETA Certified Level 4 Senior Test Technician, a State of Texas Journeyman Electrician, an IEEE Standards Association member, an Inspector Member of the International Association of Electrical Inspectors, and an NFPA Certified Electrical Safety Compliance Professional (CESCP).


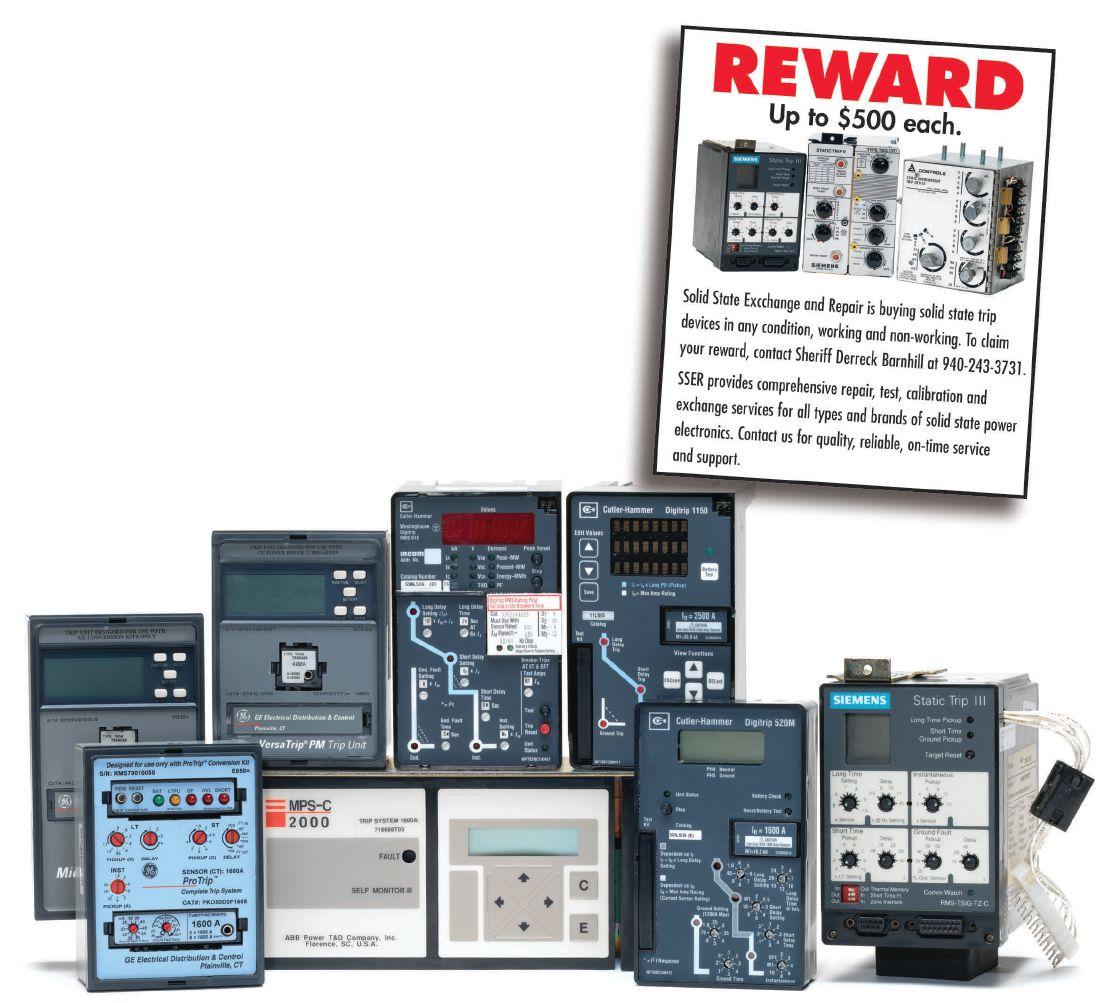
Featuring quality, reliable, on-time service and support for all brands and types of solid state power electronics.
Power electronics are our business
Let us suppoort you with our quality repair, calibration and servicing of your solid state equipment. We also buy, sell and trade:
•Communications devices for power equipment
•Protective relays
•Circuit breaker trip devices
•Motor overload relays
•Rating plugs
 BY JEFF JOWETT, Megger
It doesn’t take an electrician or engineer to know that lightning is a major cause of electrical interference and damage. Protecting the electrical system against such a danger is paramount. A lightning stroke can be hotter than the surface of the sun, with voltage estimated as high as 120 million volts, including 400 kA and 500 megajoules of energy. Utility transmission towers are particularly inviting targets due to their large metallic mass and their height above nearly all surrounding structures.
Therefore, a grounding wire runs above the conductors as a convenient point of initial contact and is continuous down the tower legs and into a grounding electrode at each foot. Such a structure provides excellent protection, but it must be maintained. Transferring massive lightning strokes into the earth in microseconds is a demanding task, and the electrode can become damaged or deteriorated in the process, even while preventing any notice of its presence on the electrical system. As part of installation and maintenance, it’s important to test and evaluate transmission line grounding impedance.
Prevailing methods to test tower grounds are performed at lower test frequencies, and their thoroughness and accuracy has been challenged. The connection to adjacent towers and the entire string further complicates the testing. Wouldn’t it be better to simulate a lightning-like impulse?
A pioneering test of an alternate method uses a pulse generator and digital oscilloscope to inject a 440-nanosecond transient pulse into the tower base and measures the transient response at a remote ground — the effect of the simulated lightning pulse on the immediate

soil environment. The remote ground was the sheath of a 50Ω coaxial cable, oriented at a right angle to the tower line. A 60-m reference potential lead to prevent reflections from distorting the measurements ran along the same line. The test equipment was centered at the tower base to counter problems associated with other proposed test methods, such as high-frequency attenuation and lethal test signals (Figure 1).
Results were evaluated against airborne electromagnetic data and traditional fall of potential test results and found to give a good indication of the effectiveness of the grounding under lightning impulse conditions.
A 200 V pulse applied between the tower base and the remote current terminal yielded a pulse width of 1.4 milliseconds (Figure 2). For confidence in the result, the electromagnetic value was calculated using NEC-4, Numerical Electromagnetics Code , which is a widely used computer code for analyzing the electromagnetic response of antennas. For this exercise, NEC-4 computations were carried out in the range of 195.3 kHz–100 MHz to simulate lightning conditions.

The method’s success was modeled after the behavior of a Beverage antenna, which is a horizontal wire antenna placed near lossy ground. Studies indicate that phase velocity will be slow for a surge injected into antennas near the earth, and losses will reduce the magnitude of the surge. This models the excitation of a large transmission tower with overhead ground wires using a signal that gives practical ground impedance results using low-voltage pulses. Using the Beverage antenna as a model, a step wave can be applied to the middle of the wire. The observed ratio of the step voltage to the currents in each leg of the dipole establishes the transient surge impedance.


This model and its test results are shown in Figure 3a, Figure 3b, and Figure 3c. Figure 3a shows a 200-meter dipole over lossy ground with a resistivity of 50 Ω-meters and a relative permittivity of 10, with a wire 5.4 mm above earth surface and with a radius of 1.8 mm. The insulation is pure dielectric, with relative permittivity of 3 and radius of 2.5 mm. Both ends of the dipole are terminated with ground rods buried 0.1 m in earth. The injected pulse meets the description shown in Figure 2. The slow propagation speed of the current along the wire at different distances from the source is shown in Figure 3b. The transient impedance, obtained by dividing the source voltage by the
NEC-4 computed current (Figure 3c), settles fairly rapidly to a value of 370 Ω and stays fairly constant until the effects of reflections from the ground rods arrive at 1.3 µsec. These reflections do not influence the result, as it is read out before their arrival. Translating this into robust transient impedance measurement, this model demonstrates that careful selection of pulse width and dipole length can enable a time window large enough for the measurement to be made. Tower ground measurement can be modeled on the example of the Beverage antenna.
Note that the result obtained (Figure 3c: 370 Ω) is high only because this was done on an experimental model of a Beverage antenna, not on an actual tower ground. It serves the purpose of illustrating that the method can be transferred to an actual tower serving in the place of the Beverage antenna with appropriate test parameters. Transient impedance varies with wire height and earth resistivity. The strong influence of dipole height (Figure 4) is shown for heights of 1 m and 0.01 m.
The results of an experiment performed with 200 m coaxial cable and a pulse injected into the sheath and current measured in both directions with CTs (Figure 5) compare favorably with the results shown in Figure 3c.
This experimental model can be adapted to actual tower grounds as depicted in Figure 1.
Figure 4: Dipole Transient Impedance Computed for Different Wire Heights with 50Ω Soil Resistivity
Observed Transient Impedance Using 200 V Pulse
Current injection and remote potential leads are 100 m and positioned parallel with the tower line, terminated with ground rods. The tower is 36 m tall with a foundation at a depth of 4.6 m. The adjacent towers are modeled as simple vertical stakes, spaced at 200 m, with an aerial ground wire bonded to structure. In the corresponding numerical model, the leads are at a constant height of 10 cm. The wave shape of injected current is shown in Figure 6 and tower base voltage shown in Figure 7. Tower transient impedance then settles to 5 Ω, a reasonably acceptable value, and holds until the reflections from the lead ends arrive.
The experiment was conducted in a relatively agreeable soil type with a resistivity of 50 Ωm (Figure 8). As an illustration of the profound effect of soil on grounding protection, a similar test conducted in 1,000 Ωm soil (Figure 9) revealed 46 Ω of ground impedance, not a desirable value. This further illustrates the importance of testing and maintenance, as a good ground cannot be presumed merely on structure.
It should also be noted that one objection to more traditional methods of testing is the effect of adjacent towers along the line that cannot be electrically separated. In both the Beverage antenna experiment and the tower ground actual test, the effects of the termination ground rods (Beverage antenna) and the adjacent towers are nullified, as the median current is measured before any reflections arrive. To cope with the variability of the electrical footprints of different
towers, all that must be done is to increase the lead lengths and pulse duration. Note how this parallels the solution to issues with traditional testing, like Fall of Potential, where increasing the lead distance is often the most effective remedy.


Figure 9: Typical Results Using NEC-4 Model for 1,000Ω Ground Resistivity
Numerous trials have shown good agreement between results calculated by NEC-4 and those observed using the transient injection method. NEC-4 results tend to be more pronounced in terms of faster return time and stronger magnitude of reflection, but this effect can be
reproduced by adjusting the height of the leads above ground. The transient injection method has the advantage of indicating potential rise at frequencies commensurate with those imposed by a lightning stroke, and its results match up well against those obtained by established methods.
E. Petrache, W. A. Chisholm, A. Phillips, “Evaluating the Transient Impedance of Transmission Line Towers,” IX International Symposium on Lightning Protection.

Jeffrey R. Jowett is a Senior Applications Engineer for Megger in Valley Forge, Pennsylvania, serving the manufacturing lines of Biddle, Megger, and MultiAmp for electrical test and measurement instrumentation. He holds a BS in biology and chemistry from Ursinus College. He was employed for 22 years with James G. Biddle Co., which became Biddle Instruments and is now Megger.


Wikipedia defines emerging technologies:


“Emerging technologies are technologies that are perceived as capable of changing the status quo. These technologies are generally new but include older technologies that are still controversial and relatively undeveloped in potential.”
In this issue, we look at some emerging technologies that are in use now or might be in the future. This Tech Quiz is different, as you will need to look up the references to answer the questions. Have fun! No. 127
1. Wind generation is a well-known technology, but according to Georgia Tech’s “12 Emerging Technologies May Help the Power Future,” not all states have wind generation facilities. Name three (in no particular order).
a. ________________
b. ________________
c. ________________
2. In a betavoltaic system being developed by Georgia Tech, what is used to produce electrical power?
a. Plutonium
b. Sunlight
c. Thermo-electro converter
d. Strontiom-90
See answers on page 114.
3. According to Utility Dives’ “Top Ten Trends Transforming the Electric Power Sector,” which power facility fuel is being phased out?
a. Natural gas
b. Nuclear
c. Coal
d. Hydroelectric
4. Name four emerging technologies for generating power mentioned in Business Insider’s “17 Emerging Energy Technologies.”
a. ________________
b. ________________
c. ________________
d. ________________
James (Jim) R. White, Vice President of Training Services, has worked for Shermco Industries Inc. since 2001. He is a NFPA Certified Electrical Safety Compliance Professional and a NETA Level 4 Senior Technician. Jim is NETA’s principal member on NFPA Technical Committee NFPA 70E®, Electrical Safety in the Workplace®, NETA’s principal representative on National Electrical Code® Code-Making Panel (CMP) 13, and represents NETA on ASTM International Technical Committee F18, Electrical Protective Equipment for Workers. Jim is Shermco Industries’ principal member on NFPA Technical Committee for NFPA 70B, Recommended Practice for Electrical Equipment Maintenance and represents AWEA on the ANSI/ISEA Standard 203 Secondary Single-Use Flame Resistant Protective Clothing for Use Over Primary Flame Resistant Protective Clothing. An IEEE Senior Member, Jim received the IEEE/IAS/PCIC Electrical Safety Excellence Award in 2011 and NETA’s Outstanding Achievement Award in 2013. Jim was Chairman of the IEEE Electrical Safety Workshop in 2008 and is currently Vice-Chair for the IEEE IAS/ PCIC Safety Subcommittee.


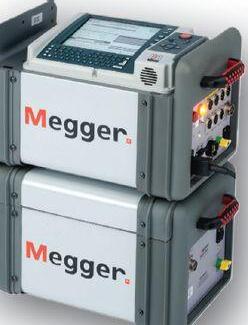


Providing Testing Solutions for:

• Protective Relays
• Transformers & Motor Analysis
• Partial Discharge/Corona
• Current Injection
• Cable Fault Location


• Switchgear/Circuit Breakers
• Insulation Resistance
• Tan Delta/Power Factor
• Current Transformers
• Ground Grid


 BY ROBERT C. BREAZEAL, Southern California Edison Co.
Southern California Edison (SCE) began using primary to secondary winding (CHL) narrow band dielectric frequency response (NBDFR) measurements for condition assessment of used distribution class transformers in 2015; 1800 units are evaluated annually. NBDFR is a series of insulation power factor measurements taken from 1–400 hertz, usually at a low voltage. The data derived from the series of CHL measurements constitutes the dielectric response for the transformer. The subsequent evaluation consists of a geometric analysis of the plot where measured power factors and corresponding frequencies are graphed. Insulation condition can be ascertained based on specific characteristics observed within the plot.
Insulation power factor at 60 hertz is the traditional method used to assess the quality of an insulation system. However, because of the magnitude of the capacitive current, a moderate increase in conductive losses will result in a negligible increase in percent power factor at 60 hertz. As the applied frequency is decreased, the effect of capacitive current diminishes while the conductive watt losses remain constant. As a result of this relationship, conductive losses through the insulation become exponentially more visible at lower frequencies. Because of this effect, the narrow band DFR protocol is tremendously sensitive to small changes in insulation condition. Th is represents a quantum leap in diagnostic reach compared to single-frequency power factor testing.
An ideal response for a typical 15 kV class-95 basic insulation level (BIL) distribution transformer is shown in Figure 1. The portion of the response from 1–10 hertz is dominated by the condition of the oil. The effects of winding geometry are seen in the form of interfacial polarization losses. This accounts for the beginning of the characteristic geometric hump seen at the lower end of the trace indicating deteriorated or contaminated insulation. The portion of the response from 10–100 hertz tends to be dominated by the condition of the cellulose components. The upper end of the response at 400 hertz is mildly influenced by winding geometry as well as the effects of static charge polarization losses.
With NBDFR, as in conventional testing, the magnitude at 60 hertz will be noted as the condition assessment reference. An earlier interpretation stated that if the slope at 60 hertz was positive at 20°C, then the insulation system in question was deemed to be in acceptable condition. However, this paradigm is an oversimplification, in that the slope at 60 hertz is determined by the location of the point of minimum magnitude or trough. As the insulation and oil deteriorates, the measureable watt losses increase with the generation of polar and conductive contaminates. Th ese


losses will distort the low-frequency end of the plot, pushing the entire response (including the trough) toward the upper-frequency end of the plot. In this scenario, the frequency at which the trough resides can be monitored and used as a marker to determine the degree of response migration. While the trough location is very sensitive to an increase in watt losses, the magnitude of a moderate change may not be detectible at 60 hertz.
By establishing a robust database, condition classifi cations can be established based on trough location. SCE uses this method in combination with magnitude at 60 hertz to determine suitability for refurbishment and reinstallation.

When SCE began utilizing the NBDFR protocol in 2015, it became evident almost immediately that, in many cases, trough location migrated very rapidly with very little change in CHL at 60 hertz. To better understand the degradative process as reflected through NBDFR, SCE performed a series of experimental protocols that subjected distribution transformers to prescribed overloads under controlled conditions. The transformers were de-energized on a monthly basis, and NBDFR measurements were performed after units had cooled to ambient temperature. Units that were loaded as per nameplate rating showed minimal changes


both in terms of CHL at 60 hertz and trough position. Low-frequency distortion in the responses was also negligible. Conversely, Figure 2 shows the overlaid NBDFR results for a unit operated at 97°C for six months.
Examination of the numerical data reveals that the CHL at 60 hertz increased from 0.366% to 0.510% for a difference of 0.144%. Conversely, the CHL at 1 hertz shot up from 0.469% to 3.601% with a difference of 3.132%. While an increase of 0.144% at 60 hertz for a distribution transformer returned from service would be considered normal, the increase at 1 hertz would be alarming. In addition, the trough migrated all the way from an initial position at 15 hertz to 110 hertz after heat cycle #6.

In a subsequent 2017 study, transformers were again subjected to prescribed loads in controlled conditions. Figure 3 shows the NBDFR traces for a unit operated at 120°C.
The initial trace is shown in black, with oneand six-month traces depicted in blue and red, respectively. After six months, the magnitude at 1 hertz was measured at 8.146%, which is obviously catastrophic. Proportionally, the trough migrated from an initial location at 20 hertz to a position at 446 hertz. The detail of note in this case is the magnitude at 60 hertz. With the tremendous concentrations of polar compounds in the oil and the contamination of the cellulose components, the assumption should logically be made that the magnitude at 60 hertz would reflect this degradation. However, this is not the case. CHL at 60 hertz actually dropped from 0.530% to 0.487%. In this scenario, the radical movement of the response toward the high-frequency end of the plot results in a situation where the CHL at 60 hertz is no longer a valid parameter. This perfectly illustrates the most significant shortcoming of single-frequency insulation power factor testing.
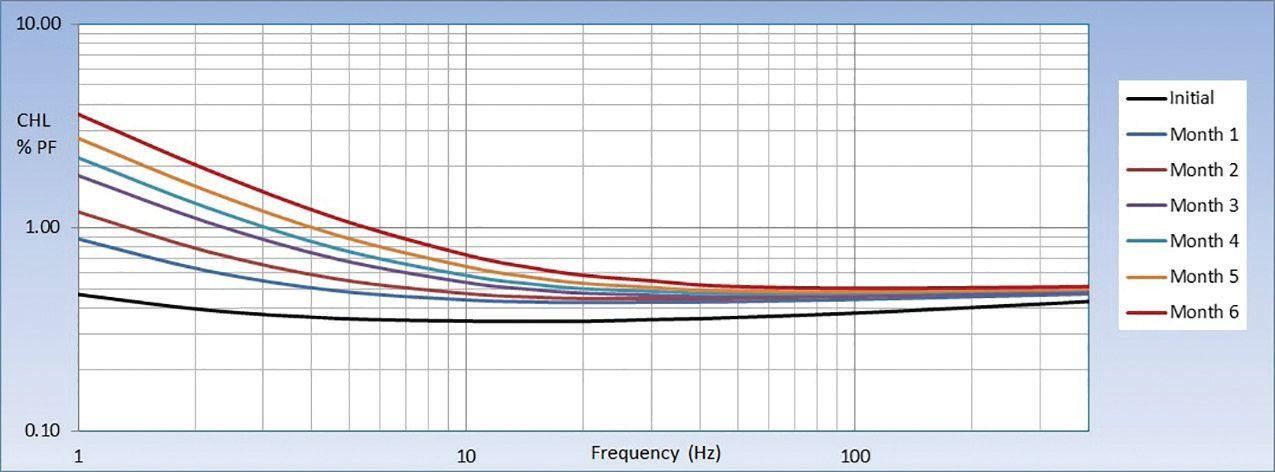

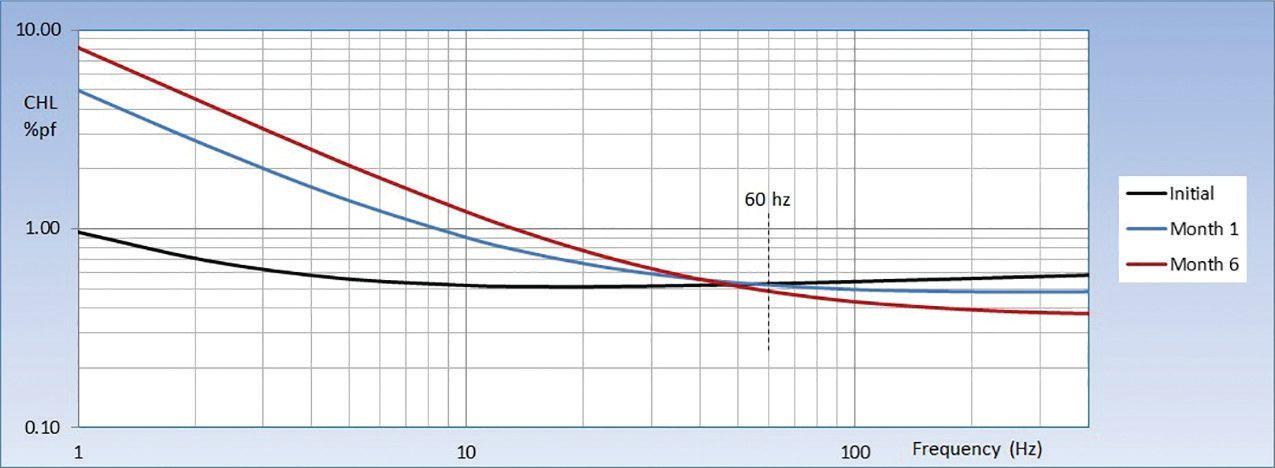

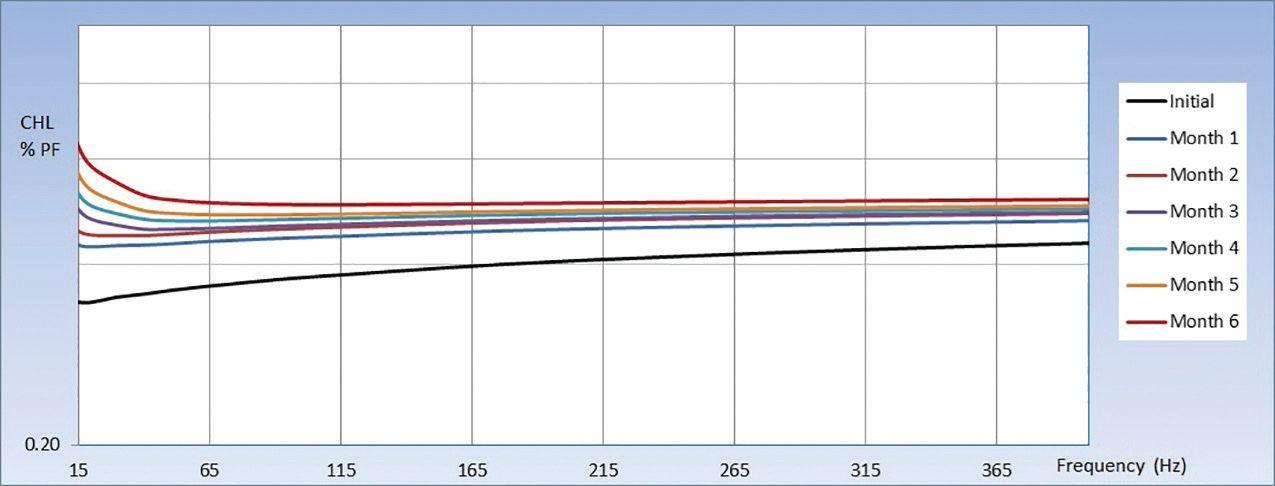
Some test equipment utilizes a frequency band ranging from 15–400 hertz. In addition, some equipment uses a linear plot. In Figure 4, the traces from Figure 2 are depicted using the 15–400 hertz linear plot method.
If the linear plot is used in conjunction with the 15–400 hertz measurement, the vital data below 15 hertz seen in Figure 3 is lost. Due to the vertical compression of the trace, trough location cannot be ascertained without consulting the corresponding data table. In this case, most of the traces in Figure 4 still provide evidence of transformer degradation. However, in cases of mild degradation, this method and format will prove problematic. The obvious advantage of the logarithmic method is that the low-frequency portion of the response is spread over a larger portion of the plot, making the critical information in the lower frequencies easier to extrapolate and analyze.
The black trace shown in Figure 3 represents the dielectric response from a new unit. Because of negligible conductive losses, the response is dominated by the influence of static charge polarization losses. In this condition, the response trace will be remarkably linear above and below 60 hertz. This linearity results in a

relationship where the applied correction is proportional to change in temperature. The slope at line frequency is positive for units in good condition; therefore, the applied correction should be upward when temperature increases.
The dielectric response for a degraded unit is depicted in the red trace in Figure 3. Because this response is driven by increasing resistive losses, the response shows significant distortion, especially at lower frequencies. This distortion results in a relationship where the applied correction is not proportional to changes in temperature. Because the slope at line frequency is negative, as temperature increases and the trace migrates to the right, the applied correction must be downward.

Conventional temperature correction tables are based on the assumption that the insulation system under test is in acceptable condition. It is therefore assumed that the slope at line frequency for this unit is positive, and that the applied correction will be reasonably proportional to temperature. Obviously, when power factor is corrected for temperature using standardized tables, the degree of correction will usually be inaccurate, and the value will be corrected in the wrong direction in some cases.
To further investigate this relationship, SCE performed an investigative study using


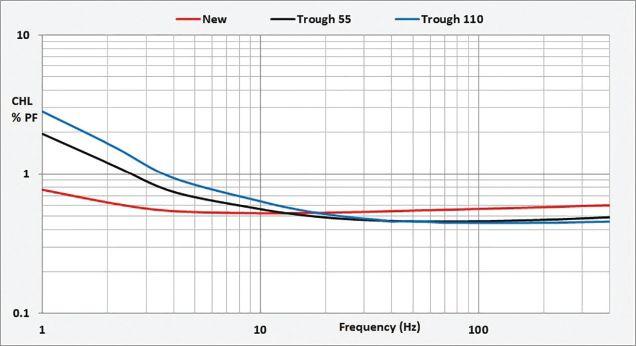

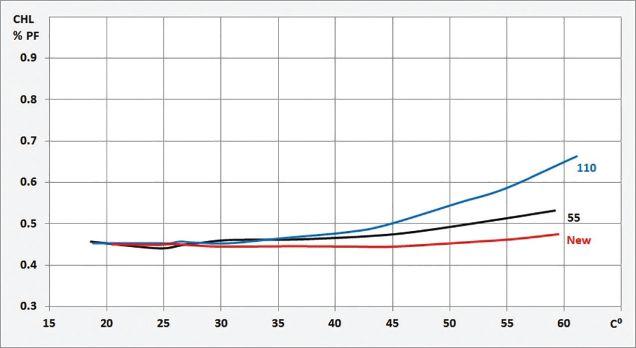

three transformers with differing conditions. The dielectric responses for each unit were recorded as the temperature was gradually and incrementally raised from 18⁰C to 60⁰C over a period of several weeks. The first specimen was a new unit with the trough located at 10 hertz. The second unit had been removed from service with the response trough located at 55 hertz. The final unit, also removed from service, had been more heavily loaded and had a response trough located at 110 hertz.
The dielectric response of the new unit is very linear between 4–400 hertz as illustrated by the red trace in Figure 5A. As temperature is increased from 18°C, the CHL at 60 hertz remains remarkably stable past 45°C. This results in a linear temperature correction factor (TCF) from 18°C–45C as shown in Figure 6B. As the temperature rises above 45°C, the
trough moves past 60 hertz and the TCF begins to trend downwards.
As the temperature is increased for specimen 55, the CHL initially begins to decrease slightly as illustrated in the black trace in Figure 5B. As the trough moves past 60 hertz, the CHL begins to increase, rising to a greater magnitude than that shown for the new specimen. This is due to elevated watt losses from contaminants.
The TCF in Figure 6B exhibits a hump from 18–30 hertz, which corresponds to the trough moving past 60 hertz.
The CHL for specimen 110 rises immediately as temperature rises due to the fact that the trough is well past 60 hertz (Figure 5B). The magnitude of rise for CHL is much greater than that generated by specimen 55 due to even higher watt losses. This is illustrated in the divergent TCFs (Figure 6B).
The traces in Figure 6A illustrate the changes in trough location for the three test specimens as temperature increases. The magnitude of response movement is also heavily influenced by the levels of contaminants within the oil and paper. The trough for the new specimen moves 90 hertz from 18°C to 60°C. Conversely, the trough for specimen 55 migrated 245 hertz, while the trough for specimen 110 migrated 490 hertz.
It has been established that conductive and polarization losses become increasingly visible at lower frequencies as capacitive current decreases. In addition to this relationship, the influence of winding geometry must be considered. With interfacial polarization (IFP), charged particles separate and move in response to the applied field, resulting in the accumulation of positive and negative charges at the interfaces of dissimilar dielectrics.
In this scenario, charged particles accumulate at the edges of the cellulose material surrounded by insulating mineral oil. This process generates measurable watt losses below 10 hertz. IFP is

driven by winding geometry. The CHL interface surface area creates the mechanism by which IFP losses may be generated. The influence of IFP on higher-voltage class transformers is profound versus distribution class transformers where this influence is minimal. This relationship is demonstrated in Figure 7, which features the responses of two new units that are identical, except that one unit’s primary winding is 95 kV BIL class, while the second unit is 200 kV BIL class. In the 200 kV BIL specimen, the magnitude at 1 hertz is significantly elevated with the trough located at 40 hertz versus 4 hertz for the 95 kV BIL specimen.
A 750 kVA transformer was subjected to condition assessment testing following removal from service. After a cursory turns-ratio test verified that the windings were intact, a narrow band DFR CHL test was performed. From 4–400 hertz, the response resembles a classic case of a transformer that has been subjected to overload conditions (Figure 8). Below 4 hertz, however, the rate of climb decreases, with the response leveling off at 2 hertz. The magnitude actually decreases slightly at 1 hertz. If the operator is astute in terms of understanding the nature of the DFR response, this scenario is particularly troubling because it is theoretically impossible unless a serious abnormal condition exists. In this case, salt fog contamination on the secondary bushings created a condition that generated parallel path watt losses, thereby distorting the response. The condition was mitigated, resulting in a normal response.
Th e NBDFR CHL response is profoundly sensitive to changes in conductive losses. With this method, changes in condition that would be undetectable at 60 hertz can be clearly seen at lower frequencies. It should be noted, however, that to differentiate between conductive losses due to moisture versus degraded insulation, full-frequency DFR must be used.
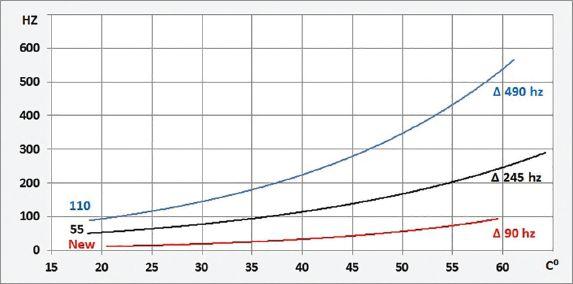


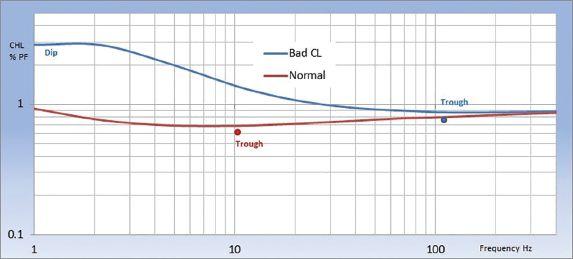


To obtain consistently accurate assessments, a robust database must be maintained to establish optimum responses for each transformer type in the utility inventory.
When utilizing the NBDFR technique, the technician must be cognizant of the effects of temperature, especially when ambient conditions in field applications are well above or below 20°C. The technician’s most significant challenge is to discern normal versus abnormal responses. Differing geometric influences are encountered when multiple manufacturers and voltage classes are evaluated, making interpretation problematic for the novice technician. This may be especially difficult when working with distribution-class units where greater variation is seen between identical units.

Breazeal, R. “Narrow Band Dielectric Frequency Response and Transformer Condition Assessment,” NETA 2018.


Duplessis, J. “Electrical Field Tests for the Life Management of Transformers,” OMICRON Electronics 2013.
Breazeal, R. “Effects of Loading on Insulation Degradation as Detected in Narrow Band Dielectric Frequency Response,” Weidmann 2017.
Breazeal, R. and Chhajer, D., “Expanding the Diagnostic Impact of Power Factor Testing,” Transformers Magazine, April 2019.

Robert Breazeal has specialized in condition assessment of power transformers at SCE for 35 years and is a leading practitioner of NBDFR in North America, testing nearly 2,000 transformers annually. Robert has authored numerous white papers and articles detailing the research and diagnostic protocols developed at SCE. Robert currently provides technical oversight for transformer repairs at the SCE Westminster Distribution Apparatus Facility and analytical support for the Distribution Apparatus Engineering and Root Cause Analysis groups.


 BY JAMES J. DUKARM, Delta-X Research Inc.
Dissolved-gas analysis started out many years ago as a quick and simple test: Someone in the substation would briefly open a valve and sniff the transformer’s head-space gas. The pungent odor of a trace of acetylene would signify a potentially serious problem.
By the late 1960s, it was possible to use a gas chromatograph as a much more sensitive nose for sniffing transformer oil. Pioneers such as R. R. Rogers and E. Doernenburg realized that the fault gases in oil came from breakdown of the solid and liquid insulation and intuitively understood the fundamental principle of transformer DGA (sidebar). They collected DGA data and came up with ideas for (a) detecting problems, (b) assessing their severity, and (c) identifying the general nature of the problem.
A transformer is designed not to damage its internal insulation in the course of normal operation. Therefore, if insulation deterioration byproducts dissolved in the oil are increasing (beyond what is expected due to normal aging), something is wrong.


Building on five decades of industry experience and data collection, plus the wide availability of computers, a re-examination of transformer DGA from the point of view of physical chemistry and advanced statistics is breathing new life into the subject. This article describes important advances. An example shows how they can improve fault detection and provide new risk assessment information.
Since about 2014, several innovations have increased the usefulness and effectiveness of DGA interpretation.
• Accounting for gas loss. Gas loss — whether by design or by accident such as leakage through a bushing gasket or air exposure of a DGA sample — can be a serious problem for DGA interpretation, especially when based on gas concentration and rate of change limits. It is helpful to work with cumulative data to avoid overlooking serious problems.
• Fault energy indexes for trend detection and severity assessment. It is known that some fault gases are more significant than others. For example, ethylene and acetylene are associated with extremely high-temperature faults. The physical basis for the differing significance of fault gases is their heats of formation from solid or liquid insulation. Those heats of formation, weighted by the respective gas concentrations in oil, can be used to calculate normalized energy intensity (NEI) for fault energy indexes to use for trending, fault detection, and severity assessment.
• Focus on gassing events. Concentrating on time intervals in which a fault energy index is trending upwards (boxed intervals
To detect problems, gas concentration and rate of increase limits were developed based on the reasonable assumption that an unusually high fault gas concentration or rate of change should be a sign of trouble. To assess severity, additional limits and considerations of rates of increase were employed to get a gradeschool report card result of OK, so-so, or bad, expressed in North America as numeric condition code scores from 1 (OK) to 4 (terrible). The limits-based approach to DGA interpretation has been refined over the years, and the IEEE C57.104 and IEC 60599 gas guides are considered the authoritative sources on how to apply it. Those guides include the gas ratio methods for fault type identification developed by Doernenburg, Rogers, Duval, and others. A good summary of limits-based DGA interpretation was published by Hamrick in NETA World, Winter 2009.



in Figure 4 and Figure 5) is a natural and very useful way to look at fault gas production.
• Gassing status score based on the fundamental principle of DGA. The fundamental principle of DGA provides a natural basis for ranking transformers according to their apparent need for extra attention. The transformer has either been gassing recently or not, and where there is gassing, it is either more or less severe (gassing status sidebar).
1. No significant fault gas production ever
2. Some fault gas production, but not recently
3. Recent moderate fault gas production
4. Recent extreme fault gas production
• Gas increments over gassing events for fault type identification. The Duval triangle (Figure 6) is a very good method for fault type identification. When trying to identify the cause of fault gas production during a gassing event, don’t use gas concentrations, which include possibly irrelevant pre-event gas. Instead, use gas increments calculated between the earliest and latest oil samples in that time interval.
• Percent change in the CO/CO₂ ratio for locating paper degradation. The carbon oxide gas ratio can be used to estimate the approximate location of a fault affecting paper insulation. It also sometimes gives early warning of a developing problem. A strong increase (by 200% or more) suggests a hot spot affecting winding insulation. A smaller increase suggests that paper insulation outside the windings, such as on bushing or LTC leads, may be affected. A decrease may indicate CO₂ production due to general low-range overheating of paper insulation.
• Reliability statistics relating DGA results to transformer failure. Instead of assessing severity in terms of limits exceeded, use a statistical model of the fault energy index distribution in transformers about to fail to estimate prior risk exposure and risk of near-term failure.
The statistical model referred to in the previous paragraph shows the distribution of fault energy index values in gassing transformers that are about to fail. The models (one for each fault energy index) were derived from a large DGA database with additional information about transformer failures. The information provided by the model of the failure-related values of the hydrocarbon gas fault energy index (NEI-HC) is summarized by the failure rate graph shown in Figure 1. The four vertical dotted lines represent (left to right) the 90th, 95th, 98th, and 99th percentiles of cumulative hydrocarbon gas fault energy index (NEI-HC) in a large DGA database. The peak failure rate occurs at about the 82nd percentile, well below
Figure 1: The curve shows transformer failure rate (fraction of surviving population) as a function of the cumulative hydrocarbon gas fault energy index (NEI-HC). Vertical dotted lines represent the 90th, 95th, 98th, and 99th percentiles of cumulative NEI-HC in a large DGA database.
the 90th percentile, suggesting that waiting for something to exceed the 90th percentile before investigating may not be a good idea!
If a transformer with very little fault gas begins to produce hydrocarbon fault gas, it should raise immediate concern since the associated failure risk is increasing very steeply. As NEIHC increases further, the failure rate decreases, indicating that — contrary to how higher DGA limits are often interpreted — continued gassing does not necessarily imply worsening reliability. This means that either:
a. Whatever is causing the gassing is not very harmful to the transformer and may continue indefinitely; or
b. The transformer is gassing because it is damaged or defective, and the next through fault may kill it; or
c. Something between the extremes of (a) and (b) is going on.
The new DGA approach using reliability statistics was evaluated on 7,200 transformers in 2016 by a large US electric utility. It performed so well, identifying many previously undetected serious problems, that the utility immediately adopted it as a key part of its transformer condition assessment system.
To see how the innovations mentioned above improve DGA for oil-filled transformers,
consider the example of a 250 MVA 230 kV nitrogen-blanketed transformer manufactured in the early 1980s. The transformer's fault gas levels were unexceptional, except for a persistently high CO₂ concentration averaging about 4200 ppm. One day in 2011, the transformer experienced turn-to-turn arcing and was removed from service. A post-mortem surprisingly revealed very extensive charring of winding insulation paper and pressboard spacers, suggesting that the windings had been overheating for a long time.
The problem had gone unnoticed for years because periodic gas expulsion by the head space nitrogen pressure regulation system had prevented upward trends in heat gases (methane, ethane, and ethylene) from developing. Except for the consistently high CO₂ levels, no gas concentration or rate of change limits were ever exceeded until the day the transformer failed.
Figure 2 shows that the transformer’s hydrogen and hydrocarbon gas concentrations were consistently low to moderate with a lot of bumps. Methane and ethane increased in 2008–2009, but no limits were exceeded. Those upward trends were reversed in 2009–2010.
Figure 3 shows that oxygen and CO₂ levels were consistent with some ups and downs. The average CO₂ concentration was about 4200 ppm. CO concentration was variable and always lower than 60 ppm. Nitrogen


2: Hydrogen and Hydrocarbon Gas Concentrations



was consistently very high, as expected in a nitrogen-blanketed transformer.
As Figure 2 and Figure 3 illustrate, it can be difficult to understand what is happening by trending and assessing multiple fault gases. On the other hand, fault energy indexes — one for the oil and one for the paper insulation — show when significant fault gas is produced and provide a sound basis for assessing severity. Compare Figure 4 and Figure 5 with Figure 2 and Figure 3.
Figure 4 and Figure 5 show how long-term fault gas production is revealed by:
a. Using cumulative data to compensate partially for gas loss
b. Trending fault energy indexes
The raw (non-cumulative) values of the fault energy indexes are shown as gray plus (+) signs, while the cumulative values are plotted as a solid line. Boxed intervals on the accumulated
Figure 4: The heavy black line represents the hydrocarbon gas fault energy index (NEI-HC) calculated from cumulative gas concentrations. The dotted line with plus symbols represents NEI-HC calculated from raw gas concentrations.
Figure 5: The heavy black line represents the carbon oxide gas fault energy index (NEI-CO) calculated from cumulative gas concentrations. The dotted line with plus symbols represents NEI-CO calculated from raw gas concentrations.
fault energy index graphs represent gassing events or time intervals when there appears to be active fault gas production. Clearly, the upward trends in both cumulative hydrocarbon gas NEI and cumulative carbon oxide gas NEI would be difficult to notice by looking at the spaghetti graphs in Figure 2 and Figure 3 or the raw numbers from the lab reports. Because there is evidently moderate ongoing carbon oxide gas production as of the latest sample, the gassing status of this transformer would be 3.
For each of the gassing events indicated in Figure 4 and Figure 5, increments of methane, ethylene, and acetylene during the event are used to plot a point on the Duval triangle (Figure 6), with the most recent result plotted as a red plus sign. The apparent fault type is consistently T1 — a thermal problem at less than 300° Celsius.
What about the CO/CO₂ ratio? In a transformer without gas loss, extensive charring of winding insulation would be expected to cause a large increase (by more than 200%) of the CO/CO₂ ratio due to rapid production
of CO. The subject transformer's reported CO concentration was consistently very low, however, and the CO/CO₂ ratio based on cumulative gas concentrations remained near 0.008 with very little variation. That could be explained by loss of CO as fast as it was produced; due to the low solubility of CO in oil, most of the CO in the oil migrated to the head space, where it was expelled by frequent pressure regulation gas release. The lack of any warning of winding insulation deterioration by the CO/CO₂ ratio in this case is an example of the potentially serious impairment due to gas loss of DGA’s sensitivity to faults, even when the gas loss is partially compensated for by the use of cumulative data.
The overall conclusion of this analysis using recent improvements in DGA is that, in spite of very significant gas loss due to headspace pressure regulation, this transformer’s abnormal fault gas production could have been detected several years before failure, raising the transformer's gassing status to 3 and providing an opportunity for investigation and possible mitigation of the thermal problem or at least planning for eventual replacement of the transformer. The application of DGA limits without consideration of gas loss failed to detect that the transformer had a problem.

Figure 6: Duval Triangle. Each plotted cross is based on the increments (amounts of increase) of methane, ethylene, and acetylene during a gassing event. The red plus sign represents the most recent gassing event. A persistent T1 thermal fault (below 300° Celsius) is indicated.
The quantitative statistical results as of August 2010 (seven months before failure) show a 1.1% probability of failure with NEICO below 24.2, meaning that about 11 transformers out of 1,000 would have failed at a lower level of cumulative NEI-CO. The hazard factor or estimated time-based failure rate as of that time was 0.18% per year, calculated by multiplying the NEI-CO model’s failure rate (0.1% per NEI unit) times the most recent rate of increase of NEI-CO (1.8/ year). These statistics indicate that the observed fault gas production to date, underestimated by an unknown amount due to gas loss, represents a modest amount of risk exposure, with that risk continualy increasing. Whether those results alone would have enabled the utility to avoid failure of the transformer is


questionable; however, with fair warning that the dice were being rolled, it would have been possible to prepare for eventual replacement, and the eventual failure would not have been surprising.
This analysis does not and cannot take into account the unknown amount of gas that was lost and never measured, so the severity and risk level are understated to an unknown degree. The new approach, however, could have led to early discovery that the transformer was gassing and that — as suggested by very low hydrogen and CO levels — gas loss could be masking the problem. Perhaps the pressure regulation system could have been locked down at that time to stop gas expulsion long enough to obtain a more accurate assessment of fault gas production, CO/CO₂ trend, and the associated hazard factor.
DGA Sniff Test described by S. R. Lindgren, personal communication.
CIGRE Working Group 15-01, “Application of Physico-Chemical Methods of Analysis to the Study of Deterioration in the Insulation of Electrical Apparatus,” Paper 15-07, 1970
CIGRE Session, Paris France, 1970.
IEEE Std. C57.104-2008, IEEE Guide for the Interpretation of Gases Generated in OilImmersed Transformers, February 2009.
International Electrotechnical Commission, IEC 60599-2015, Mineral Oil-Filled Electrical Equipment in Service – Guidance on the Interpretation of Dissolved and Free Gases Analysis, 3rd Edition, September 2015.
L. Hamrick, “Dissolved Gas Analysis for Transformers,” NETA World, Winter 2009.
F. Jakob and J. J. Dukarm, “Thermodynamic Estimation of Transformer Fault Severity,” IEEE Transactions on Power Delivery, Vol.30, No.4, pp.1941-1948, August 2015.
C. Rutledge and R. Cox, “A Comprehensive Diagnostic Evaluation of Power Transformers via Dissolved Gas Analysis,” 2016 IEEE/PES Transmission and Distribution Conference and Exposition, May 2016.
J. J. Dukarm and M. Duval, “Transformer Reliability and Dissolved-Gas Analysis,” 2016 CIGRE Canada Conference, Paper CIGRE-807, Vancouver BC, October 2016.

Dr. James J. Dukarm is the founder and Principal Scientist of Delta-X Research Inc. in Victoria BC, Canada. As a member of ASTM and CIGRE and an IEEE Life Member, Jim has been actively involved in the development and revision of IEEE Transformers Committee DGA guides C57.104, C57.139, and C57.155. He has co-authored several papers in IEEE journals and NETA World and has presented numerous times at industry conferences. Jim received an MS in mathematics from St. Mary’s University, San Antonio, Texas, and a PhD in mathematics from Simon Fraser University, Burnaby BC, Canada.







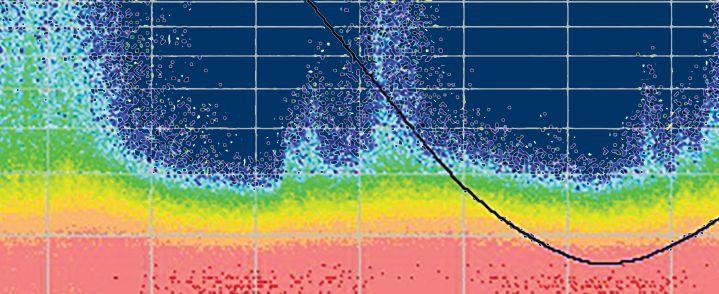
 BY WILLIAM HIGINBOTHAM, EA Technology LLC
Partial discharge (PD) testing is becoming common in U.S. industrial systems and is gaining acceptability in U.S. utilities. Testing in the form of periodic surveys can provide valuable insight into asset condition. Beyond periodic surveys, full-time system monitoring is the state of the art in PD detection, offering additional capabilities that:
• Warn of rapidly evolving PD situations that might go from inception to failure faster than a periodic survey interval.
• Allow trending of slowly evolving data to better confirm real degradation.
• Allow trending with external events such as load charges or environmental changes.
• Provide better data than periodic surveys through additional sensors or time-offlight fault location.
A permanently installed full-time monitor with dozens of sensors is a larger commitment in capital, effort, and expertise than a periodic survey tool. This article explains the technology involved in full-time monitoring.
Offline testing for PD has been around for several decades. IEC 60270 defines how it is to be done, and several IEEE/ANSI standards
discuss and clarify offline testing. A VLF PDfree power source energizes an electrical asset by measuring impedance. Any discharge current that is present in the sample causes a drop in voltage across the impedance that is proportional to the discharge current. The sample is disconnected from the power system, and the voltage is supplied by the external source. This process requires quite a bit of effort and expertise.
During online testing, the asset is in service and is energized by the power grid. A variety of sensing techniques can be used to detect PD in normal operation. Online testing has advantages and disadvantages. For example, the system voltage cannot be varied to determine where the PD starts and where it extinguishes. However, online tests are done at system frequency and real operating conditions, so they are more representative of real-world conditions. All full-time monitoring is online.
Monitoring systems are made up of hubs and sensors. Hubs are the access points for users. The sensors are connected to the hubs via cables and fibers. Sensors can be connected to the hub
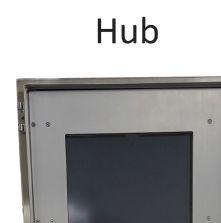
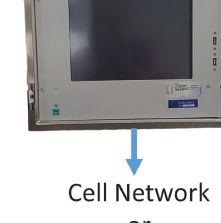

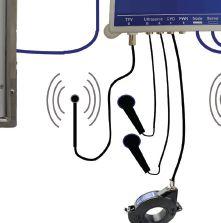
through intermediate nodes (Figure 1) or directly to the hub. Connecting hundreds of sensors directly to one hub requires significant wiring.
Called different names by various manufacturers, the hub is the brain of the system. The hub puts all the sensor data into a format for the user to see, stores the data, applies algorithms and filters, and provides the user interface. Hubs are mounted outside the high-voltage compartments and their user interfaces are accessed by local or cellular networks. Internet access allows the user to see the data from anywhere at any time. Hubs can generate alarms and emails alerting the user to degrading conditions.
Some hubs store all the data locally; others stream it to the cloud. Cloud-based systems allow users to get to the data even if the hub is temporarily offline. User interfaces vary, but many are graphical and allow visualizations of the data over time. Simple systems that do not provide sufficient data may not allow the user to differentiate noise from real PD.

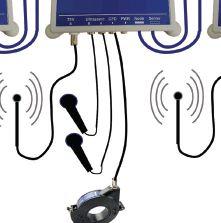


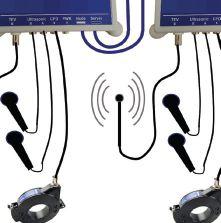






Online monitoring can be further broken down into direct connect and non-invasive methods. In direct connect systems, voltage sensors (coupling capacitors) are connected to bus bars and connection points. Radio frequency current sensors are sometimes added to cables. These sensors require the system to be de-energized and are usually installed prior to initial commissioning.
Non-invasive sensors pick up side effects of the discharge such as airborne acoustic energy, transient earth voltage, EMI emissions, ultraviolet (UV) light, and cable ground strap current. These sensors do not provide direct readout of PD discharge current, but they don’t require direct connection to HV conductors. This allows these systems to be retrofitted, sometimes without even de-energizing.
Voltage sensors containing a capacitive voltage divider connect directly to bus bars, breaker spouts, joints, etc. Th ese devices span the phase-to-ground voltage, so they require high power frequency voltage withstand capability. For safety, the voltage and basic insulation level (BIL) ratings of the sensor must equal the ratings of the switchgear. The sensor consists of two capacitors in series forming a divider ratio such as (1:2000). The smaller capacitor is attached to ground. A surge limiter across this capacitor is often used to protect the monitoring circuitry. These sensors must be installed with the same care as all other highvoltage components. Poor installation can cause PD or even catastrophic failure.
Another direct connect sensor is a radio frequency current transformer (RFCT) placed around the core conductor of a cable. This is typically installed on a portion of the cable after the shield is removed to avoid potential cancellation of the PD current. Cable insulation is still present, but the RFCT typically provides little or no insulation. This
means the RFCT is in a potentially hazardous area and must be placed carefully. Poor placement can cause PD or catastrophic failure just like the voltage sensor.
Once these sensors are properly installed and routed through signal cables outside the switchgear, the gear can be commissioned and monitoring placed into service. A full-voltage hi-pot test is required because the insulation of the sensors to ground must be confirmed prior to energization.
Non-invasive monitors use different sensing technology. These sensors are termed noninvasive because they are not directly connected to or placed around the conductor. They do not require insulation, and they do not provide insulation of system voltages. Many of these sensors can be placed with the system energized and the cubicle doors closed. Th is allows monitoring systems to be retrofitted either online or with a brief outage.
• Airborne ultrasonic. Surface discharge tends to generate significant acoustic energy in the ultrasonic band. Under the right conditions, an airborne sensor can pick this up even before visible damage is present. An airborne sensor requires an air path from the source of the discharge to the sensor. The sensor can be placed inside the cubicle but far away from the HV equipment, or it can be placed outside the cubicle (Figure 2) provided it is aimed at an airpath to inside such as a louver, vent, or bolt hole.
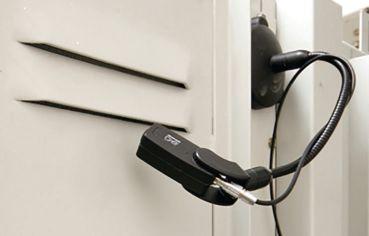
• Contact ultrasonic. In the event no airpath exists, as might be the case in well-sealed gear, a contact sensor outside the cubicle can be used. A contact sensor detects the vibration of whatever it is attached to. A sensor mounted on the outside of a door can detect airborne ultrasonic energy impinging on the door. For this to work, the sensor must be very sensitive. The downside is that the sensor is non-directional; ultrasonic noise from outside the cabinet or inside the cabinet will both cause the door to vibrate. This tends to result in a higher noise floor and less distinct sounds. Contact sensors should only be used where airborne sensors cannot be installed.
• Transient earth voltage. Transient earth voltage (TEV) is a by-product of partial discharge inside grounded conductive enclosures such as metalclad switchgear. Discovered by EA Technology in the late 1970s, TEV results in a short-duration (1–5 microseconds) unipolar voltage pulse on the outside surfaces of such an enclosure. The sensor, which is typically a flat plate 1–3 inches in diameter with some type of fixing arrangement such as magnets, uses a capacitive connection to the surface to detect the voltage. Because the pickup is capacitive, it can work through paint. The TEV sensor is placed on the outside surface of the switchgear; placement near the center of each panel is ideal, but not critical. Every high-voltage compartment should have a sensor. For example, if the bus bar compartment is separate, a sensor on its end plate would be helpful.
• RF antenna. RF antennas can serve two functions in non-invasive monitoring: They can detect PD or noise. If placed where PD detection is desired (for example, inside the cubicle), they can act as a source of signal to the monitor (Figure 3, lower left). These types of antennas vary greatly in size and shape. Ideally, the antenna is sensitive, omnidirectional, and tuned for a range of frequencies common to PD. The second use of antennas is to pick up noise. TEV
sensing, in particular, is subject to radio frequency interference. While it might not be mistaken for PD, radio noise can swamp the desired signal and make analysis difficult. If external antennas are used, the monitor can detect the noise and use time of flight to determine whether the signal originates outside the switchgear.
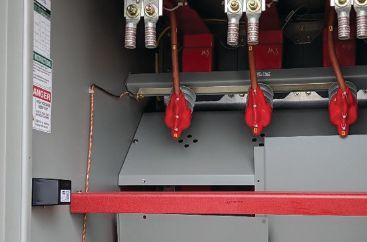
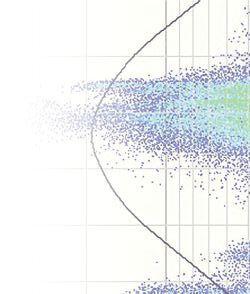

• Radio frequency current transformer. RFCTs are used in direct connect and non-invasive systems, but they tend to be used differently. In a non-invasive system, RFCTs are placed on the ground straps of shielded cables (Figure 4), where they can detect the PD current pulse that typically travels down the conductor, through the defect, to the shield, and down the shield. Placing the RFCT on the shield ground is inherently safe as long as the ground remains intact. It is the installer’s responsibility to ensure the ground wire will not fail under any fault condition. If the RFCT is on the high side of the break, failure of the ground wire could lead to


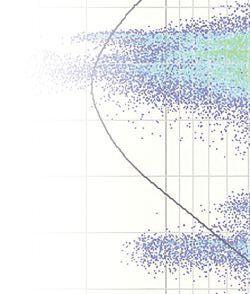


disastrous results. In IEC-type switchgear, ground straps tend to be outside the box, allowing easy installation while live. The ground is typically inside the HV compartment in U.S. switchgear, and it cannot be installed live.
Any monitoring system can use additional sensors to provide more input to the analysis process.
• Environmental. Since surface PD is related to humidity, ultrasonic and humidity trends can be matched. This can rule out other sources of ultrasonic noise.
• System frequency. As all PD occurs synchronous to the power system voltage cycle, knowing the exact frequency of the power system is important. Direct connect systems inherently obtain that information from the voltage sensors. A separate ac sensor (typically plugged into a wall outlet) provides that information to a non-invasive system.
• Temperature. Sensing the temperature of cabinet doors or busbar connections can help indicate severe problems. Many monitors include mechanisms to measure the temperature of panels and/or bus bar connections. Fiber connections from the
bus bar provide the isolation. The yellow fibers in Figure 3 are temperature sensors.
The many functions of PD monitors and the multiple ways to analyze the results are beyond the scope of this article. However, the major functions of PD monitors include:
• Phase-resolved plots that relate impulses from any sensor to the voltage wave provide a critical means to eliminate noise. PD occurs synchronously with the power system frequency; noise typically does not (Figure 5).
• Listening to audio/ultrasonic sound clips is a common way to detect PD. Listening remotely can avoid a site visit.
• Using multiple synchronized RF sensors to measure time of flight can locate the source by determining which sensor triggers first.
• PD is usually a gradually developing phenomenon, and long-term trending over months can highlight issues that might escape detection in a survey.
• False alarms are a nuisance and reduce customer confidence. Using complex alarming algorithms to look at a variety of factors can result in fewer trigger-happy alarms.
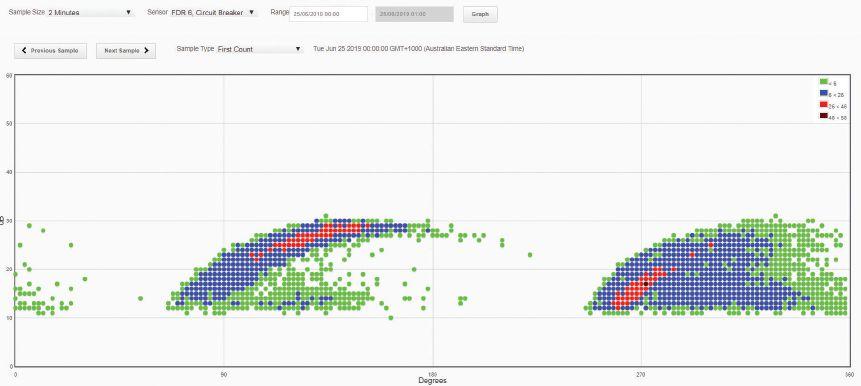
Figure 5: Phase Resolved Plot Showing Significant PD
Online monitoring systems provide the ultimate in PD detection. They can be seemingly complex and daunting for a new user, but they are merely extensions of the periodic test technology technicians already know. Configured, installed, and commissioned by a skilled tech, online monitoring can be a new source of revenue for testing firms while offering substantial benefits to their customers.
Editor’s Note: If you are interested in this topic and want to learn more, please plan to attend Bill Higinbotham’s seminar at PowerTest 2020.

William G. Higinbotham has been president of EA Technology LLC since 2013. His responsibilities involve general management of the company, including EA Technology activities in North and South America. William is also responsible for sales, service, support, and training on partial discharge instruments and condition-based asset management. He is the author or co-author of several industry papers. Previously, William was Vice President of RFL Electronics Inc.’s Research and Development Engineering Group, where his responsibilities included new product development, manufacturing engineering, and technical support. He is an IEEE Senior Member and is active in the IEEE Power Systems Relaying Committee. He has co-authored a number of IEEE standards in the field of power system protection and communications, and holds one patent in this area. William received a BS in computer/electrical engineering from Rutgers, the State University of New Jersey’s School of Engineering, and worked in the biomedical engineering field for five years prior to joining RFL.</pubtitle>
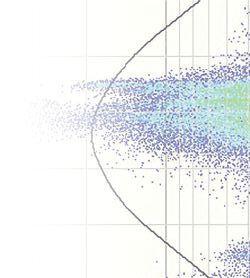


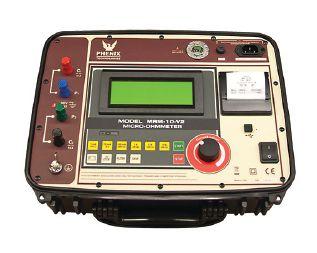


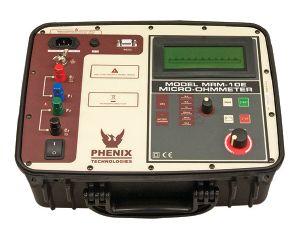
1

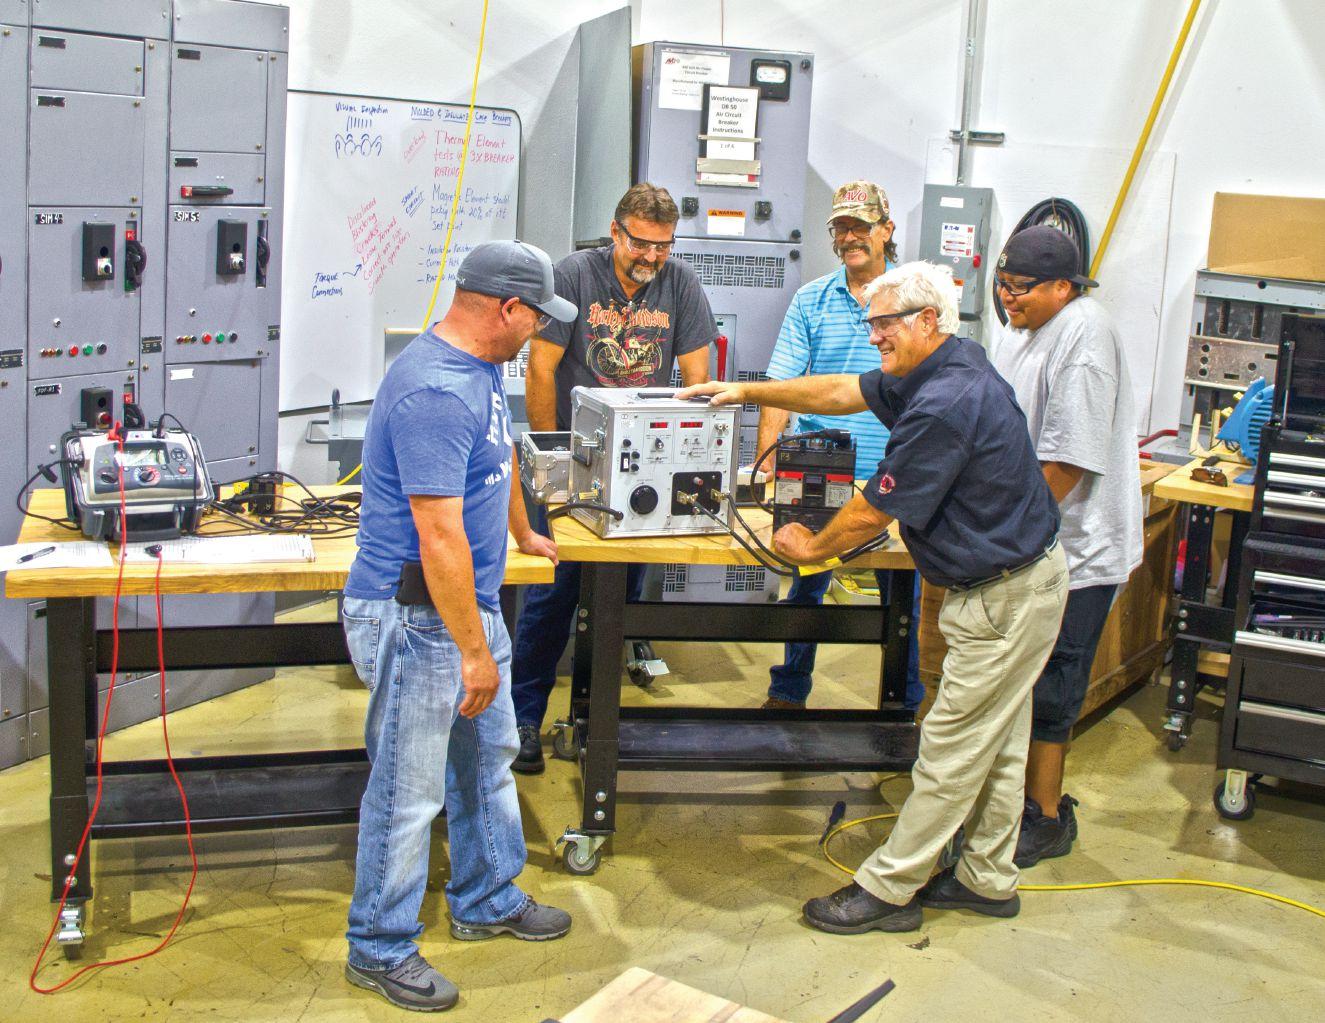



















 BY ALBERT MARROQUIN, PE, ETAP; ABDUR REHMAN, PE, Puget Sound Energy; and ALI MADANI, AllumiaX Engineering
Part 1 of this article, which was the cover story in the previous issue of NETA World, explored the need for high-voltage arc flash (HVAF) assessment to protect utility workers who are exposed to voltages above 15kV. It also compared various methods to calculate the incident energy from HV and MV electric arcs. Analyzing the results demonstrated that several methods can be used to calculate the incident energy generated by open-air, line-to-ground arc faults for systems within the range of NESC Table 410.2 and Table 410.3.
Part 2 discusses key driving factors that directly affect arc flash incident energy, along with PPE considerations for various scenarios. A real-life case study drives home the importance of highvoltage arc flash studies for utility applications.
Traditionally, all existing HVAF simulation programs (e.g., ARCPRO, Duke HFC) require a manual, time-consuming process to calculate incident energy because they do not contain
network and protective device information. This article illustrates the importance of performing a HVAF assessment for utility applications and highlights the benefits of using a tool capable of limiting human error factors from data transfer across different platforms by performing incident energy calculations along with network short-circuit currents (phase and sequence) and protective device operating time.



The three most important driving factors that directly affect arc-flash energy are the shortcircuit current, the gap between conductors, and the duration of the arc. Incident energy increases with higher short-circuit currents. However, due to the operation of protective devices (PD), higher short-circuit currents can result in lower incident energy because of faster PD operation. Similarly, the gap between conductors dominates the geometry of the arc column plasma and the voltage gradient, and the incident energy is significantly affected by the effect of this factor (EPRI TR-1022632). Accurate estimation of incident energy thus depends on the relationship between all three parameters. This section describes the operating characteristics of HV and MV protection systems assuming that accurate arc fault currents have been determined.
HV protection systems are standardized and designed to operate at high speeds due to the nature and importance of the system and the devastating implications of sustained arc faults. In fact, government regulations and organizations such as the Federal Energy Regulatory Commission (FERC) ensure that energy services are economically efficient, safe, reliable, and secure. Utility protection engineers use a combination of protection schemes particularly for the bulk electric system. Step-distance protection that detects and operates for phase faults (3PH & LL) and directional ground overcurrent protection that typically detects and operates for ground faults (1LG, 2LG) are the most common protection elements for HV transmission systems. Protective relays detect faults and send trip signals to HV circuit breakers rather quickly. High incident energy levels most commonly arise due to slow fault clearing times and should be given paramount importance in a HVAF evaluation. High-resistance arc faults (purely resistive in nature) show a constant




voltage drop proportional to the gap, and arc resistance will vary inversely with the current flowing through the arc. Distance protection components may need to be adjusted or shifted to account for resistive arc faults. Figure 1 depicts how a mho setting shifts the line impedance angle to gain greater arc resistance coverage while still maintaining coverage of the line.
High-impedance ground faults also produce lower short circuit current (because of additional ground path resistance) and typically operate slower in a directional ground overcurrent protection scheme. Protective relays commonly operate with a 0.30-second delay for ground overcurrent protection. Other examples of delayed fault clearing include breaker failure, stuck breaker, or relay failure conditions.
The concept of sequential tripping for ground fault protection is an important part of transmission line protection. During a close-in ground fault condition, the close-in terminal would detect the fault in the instantaneous region (50G), and the remote terminal would detect the fault in the time region (51G). However, as soon as a close-in terminal breaker opens, the fault current reroutes, and more





current flows through the remote terminal. This causes the time element to speed up into the instantaneous region.
High-voltage systems tend to have faster arc fault clearing times because distance relay protection is expected to operate fast. Distance relay (21-element) zones of protection include a main zone and backup-up zones. Typically, the first zone of protection is defined as Zone 1 (close-in). Arc faults in HV transmission systems are expected to produce fault currents and impedance zone detection within Zone 1 of the distance relay protection. Zone 1 protection typically has no delay and only detection time plus breaker opening time are considered to determine arc duration. Zone 2 and Zone 3 typically operate in 20–50 ms (1.5–3 cycles) and with 100–250 ms (6–15 cycles) delays. The delays are included to provide backup protection, coordination, and selectivity.
One way to determine a conservative arc fault exposure time (assuming a worst-case scenario)

is to assume Zone 1 failure and instead use the Zone 2 time-delay operation. This adds a 20–50 ms delay to the incident energy estimation and brings total HV system arc fault clearing time for incident energy calculations to 70–120 ms (20–50 ms delay + 50–80 ms for breaker opening time). Zone 3 protection operation for arc fault conditions is rarely used for incident energy calculations.
It is common for HV protection engineers at the author’s utility company to assume 2-cycle delay for microprocessor detection time in the case of instantaneous protection. For Zone 2 protection, 18-cycle delay is programmed. It is also common to assume 5-cycle clearing time for HV breaker opening time.
A tool used to perform high-voltage arc-flash incident energy calculations should allow simulation of distance protection components to minimize the human error factor of engineers who traditionally have been performing this analysis using manual older technology.


The length of the gap between conductors, which is directly related to incident energy, is also a factor. Typical line performance and design criteria clearly show that line-to-ground and line-to-line gaps between conductors vary signifi cantly mainly because of the design voltage of the power system. Longer arc lengths produce larger heat energy sources. In highvoltage transmission lines, the arc length is longer, and the shape of the arc plasma column is very different from the more spherical shape arc encountered in low-voltage (short gap) equipment. HV arc plasma clouds may take on a cylindrical shape. An 110kV line could have a gap between phase and ground conductors as long as 1,100 mm, whereas a typical gap between phase conductors in MV switchgear is 152–305 mm (Figure 2 and Figure 5). The shorter gap plasma cloud can be approximated as spherical for incident energy modeling purposes.
Furthermore, longer gaps provide the arc more room to elongate and spread out in all directions. Arc elongation, a phenomenon
described in Terzija and Konglin’s “Long Arc in Free Air: Laboratory Testing, Modeling, Simulation and Model-Parameters Estimation,” is not to be confused with the actual length between conductors. Arc movement along conductors caused by magnetic field forces is another factor that is not included in the methods proposed in this article; only the effect of longer arc length is considered in the models. Arc movement and arc elongation may cause the arc column and plasma to move away from the electrical worker; however, it can also cause the working distance to be reduced. This should be considered when selecting the working distance that will be used to determine the incident energy.
The authors use conductor gaps for a transmission line that vary with each type. For a 115kV overhead line (Figure 3, Figure 4, Figure 5), the gaps range from 2ft-6in for a compact, horizontal post line to as large as 11ft-3in for an H-frame type tower. On the other hand, the conductor gaps for highvoltage 34.5kV switchgear are shorter when compared to an overhead line. This is due to the lower voltage level, which permits shorter gaps without jeopardizing personnel safety.

Figure 3: Outdoor Substation


L-G Gap


L-L Gap
To demonstrate HV incident energy calculations, a utility application consisting of high-voltage equipment has been prepared as an example of an HVAF assessment using simulation software that implements the EPRI and Terzija/Konglin methods. Two examples are provided:
1. HV 115kV open air transmission line (Figure 6)
2. MV 34.5kV switchgear for a renewable energy collector system (Figure 7)






SOURCE: WESTINGHOUSE ELECTRIC CORP. “ELECTRICAL TRANSMISSION AND DISTRIBUTION REFERENCE BOOK”
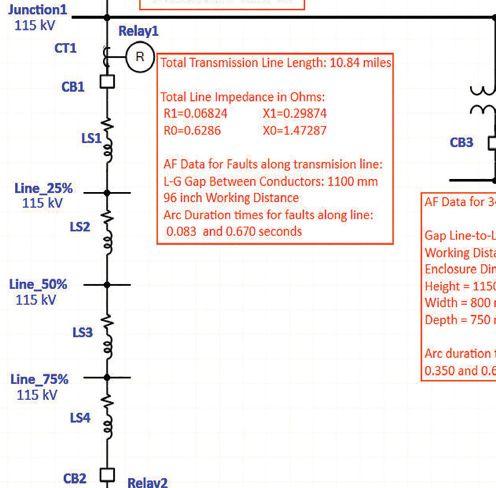


The incident energy of the 115kV transmission line is calculated at five different locations (i.e., 0%, 25%, 50%, 75%, and 100% taps (Figure 8). The incident energy analysis is performed using typical overcurrent relay fault clearing times. The electrical properties including resistance, reactance, short-circuit current, and other input data are also shown in Figure 8. The dimensions of the equipment, gap between conductors, and working distance are included in the figure legends.
For the 115kV system, line-to-ground arc faults are examined at different fault clearing times (FCTs). The term “FCT” is used interchangeably with arc exposure duration. FCTs are determined based on typical transmission system protective device settings. For both junctions, the selected fault clearing times are 0.083 sec and 0.670 seconds, respectively. For faults on the transmission
line taps (different segments along the line), a fault clearing time of 0.099 seconds is used.
Th e 35kV substation represents an outdoor collector system switchgear with available short-circuit current of 3.835kA. For this fault location, three-phase enclosed arc faults are examined with clearing times of 0.350 and 0.670 seconds, respectively.
Multiplying factors are used for each method (refer to individual method OEM reference manuals for details) to convert arc fault incident energy from L-G in open air to three-phase enclosed. Th e Duke Heat Flux Calculator does not off er direct inputs for correction factors; thus, they were applied manually. Th e ETAP ArcFault™, EPRI, and Terzija / Konglin methods presented in this paper are also adjusted using methodology described in R. Wilkins.



Table 1 lists the methods compared in Tables 2–6.
Table 1: Arc Fault Methods
/ Konglin



Table 2: L-G Arc Fault (AF) with Fault Clearing Time (FCT) = 0.083 Seconds
Analyzing the incident energy results of the four methods reveals several interesting findings and observations. The first general observation is that the results of the line to ground faults in open air are relatively close when the fault current values are within the range of the models. As the results at Junction 2 of Table 2 show, the incident energy difference is approximately 0.5/ cm2 (the highest delta is between maximum and minimum results). The short-circuit current at this location is 22.147kA, which is approximately in the middle of the current range of the models (approximately 5kA to 40kA). As short-circuit current increases past the upper limits of the model towards a value of 45.29 kA, the incident energy difference can increase significantly. This is evident when observing the results of Junction 1 in table 3.
Another basic observation from the results listed in Table 4 is that along the length of the line, energy flux appears to be directly proportional to the change in short-circuit current. Furthermore, when the arc-fault exposure time is 100 ms or less, incident energy is well below 2.0 cal/ cm2. Utilities commonly assume a normalized arc fault exposure time along a transmission line segment to calculate the incident energy at different approach distances. The results in
Table 3: L-G AF with FCT = 0.670 Seconds
Table 4: L-G AF at Different Line Locations with FCT =
6:



Table 4 assume an approach distance of 96 in. A high-voltage arc flash incident energy study may typically require the results to be presented at three different approach distances. It is also common for the results to be presented in the form of approach distances to different incident energy levels. In other words, at what approach distance is the incident energy exposure 2.0, 4.0, 8.0.… X.X cal/cm2?
One finding is related to the methods used to adjust the incident energy from open-air L-G to three-phase enclosed arc faults. Software manufacturers of high-voltage arc flash methods use different techniques to correct the energy flux. The correction factor to convert from L-G open air to three-phase open air varies between 1.5 and 2.5 p.u. The correction factor to convert from three-phase open air to threephase enclosed varies between 1.5 and 3.5 p.u. Similar conversion factors were applied to make the comparisons in Table 5 and Table 6.
The purpose of this paper was to explore and compare the various methods to calculate the incident energy from HV and MV electric arcs. New technology that considers the entire electrical network, calculates the short-circuit current, and simulates the response of various types of protective devices removes the main disadvantages of older methods requiring laborintensive, single-solution-at-a-time approaches that are prone to human error factors.
A. Marroquin, A Rehman, A. Madani, "High Voltage Arc Flash Assessment and Applications," IEEE IAS ESW Conference, Paper No. ESW2019-38, March 2019, Jacksonville, FL
T. A. Short, “Arc-Flash Analysis Approaches for Medium Voltage Distribution,” IEEE Transactions on Industry Applications, Vol. 47, No. 4, pp. 1902-1909, July/August 2011.
US Department of Labor, OSHA 1910.33, Occupational Safety and Health Administration Requirements.


NFPA 70-2017, National Electric Code, Quincy, MA: NFPA.
NFPA 70E-2018, Standard for Electrical Safety in the Workplace, Quincy, MA: NFPA.
EPRI TR-1022632, Arc Flash Issues in Transmission and Substation Environments: Results from Tests with Long Arcs, Electric Power Research Institute, Palo Alto, CA, 2011.
Parsons and A Marroquin, “A Framework for the Selection of Incident Energy Mitigation Technology,” IEEE IAS ESW Conference, Fort Worth, TX, 2018.
IEEE Std. 1584b-2011, IEEE Guide for Performing Arc Flash Hazard Calculations, New York, NY: IEEE.
Transpower TP.DS.62.01, Clearances and Conductor Spacings – and a safe access for ac switchyards, Issue 3, February 2009.
V.V. Terzija; H.J. Konglin, “Long Arc in Free Air: Laboratory Testing, Modeling, Simulation and Model-Parameters Estimation,” IEE Proceedings: Generation, Transmission and Distribution, Vol. 149, No.3, pp. 319-325, May 2002.
V.V. Terzija, H.J. Konglin, “New Approach to Arc Resistance Calculation,” IEEE Power Engineering Society Winter Meeting, February 2001.
R. Wilkins, “Simple Improved Equations for Arc Flash Hazard Analysis,” August 30, 2004. Online IEEE Electrical Safety Forum https://www.ieeecommunities.prg/ieee.esafety.
T. A. Short, “Arc Flash Analysis Approaches for Medium-Voltage Distribution,” Rural Electric Power Conference, May 2009.
NESC C2-2017, National Electrical Safety Code, New York, NY: IEEE.
IEEE 1584-2018 D6, Approved Draft Guide for Performing Arc-Flash Hazard Calculations, New York, NY: IEEE.



R. F. Ammerman, T. Gammon, P. K. Sen, and J. P. Nelson, “A Comparative Study of Arc Modeling and Arc Flash Incident Energy Exposures,” IEEE Petroleum and Chemical Industry Technical Conference, 2008.
IEEE Std. 1584-2002, IEEE Guide for Performing Arc Flash Hazard Calculations, New York, NY: IEEE.
Central Station Engineers of Westinghouse Electric Corp., Electrical Transmission and Distribution Reference Book, East Pittsburgh, PA: Westinghouse Electric Corp.,1964.
Federal Energy Regulatory Commission, Strategic Plan FY 2018-2022, September 2018.
NERC, “Glossary of Terms Used in NERC Reliability Standards,” July 2018.
Working Group D8, “Justifying Pilot Protection on Transmission Lines,” IEEE Power Engineering Society, 2008.


Albert Marroquin, BSEE, PE, IEEE Senior Member, is Vice President, Validation & Verification, and Senior Principal Electrical Engineer at ETAP. A registered Professional Engineer in the state of California, he is the main designer and product manager for ETAP’s AC and DC Arc Flash products, a working group member of IEEE 1584 and IEEE 1458, and an active attendee at NFPA 70E seminars and meetings.

Abdur Rehman, BSEE, MSEE, PE, is the Relay Operations Supervisor at Puget Sound Energy, where he leads a team of relay technicians who maintain, troubleshoot, and commission protection systems throughout PSE territory. Abdur brings a wealth of high-voltage experience in protection engineering and has performed various power system studies, high-profile incident investigations, troubleshooting, and RCAs.

Ali Madani, BSEE, is the lead Power Systems Engineer at AllumiaX Engineering. Ali has performed various power systems studies including modelling, short-circuit, coordination, and arc-flash studies for a variety of low- and medium-voltage facilities.


EXCLUSIVE INVITATION TO NETA EVENTS
Annual Member/Alliance Meeting
Annual Member/Alliance Luncheon
Meeting of the Minds
EXCLUSIVE DISCOUNTS
Discounted PowerTest Registration
50% o one ANSI/NETA Standard ($138 value)
20% o NETA Bookstore Purchases

20% o NETA Training and SPTS Courses STAY INFORMED
NETA World Journal ($40 value) SHARE INFORMATION

Post Press Releases Participate in Technical Working Committee Activities




 BY JOHN WHITE, PE, Sigma Six Solutions
I met John Moore in 1975 at an IEEE meeting in San Francisco. He had started Electro-test, Inc. (ETI) in his garage just four years earlier. I was fascinated by his enthusiasm and passion for his business. I was working at a large corporation then, and at the time, I didn't even understand why such a service was needed; the large manufacturers had that market. But he dearly had a vision for its success, and he was truly a pioneer in the western half of the country for such an independent service.
He moved forward, challenging the service divisions of the biggest of the big - GE and Westinghouse - and he won. John would go on to strongly influence the electrical industry.

John Moore speaks at a PowerTest session.
John’s primary focus was quality of service. He scrutinized everyone he hired. He wanted the best in all his choices, and he truly cared about everyone. He set a strong quality bar for his business and was diligent about always providing the best possible service. He never settled for anything less. John would go on to strongly influence the electrical industry, and ElectroTest made the Inc. 100 list of fast growing small companies. John sold Electro Test to Emerson Electric and retired at age 55 to pursue the next adventure: sailing the world with his wife, Nancy. He spent the last several years developing and managing the Crow Canyon Medical Center in Danville, California.

John ran at a high energy level. He was very productive, but his sense of timing wasn’t always his focus. He once flew to Seattle to deliver a talk at a dinner meeting to a group of engineers. He came out of the airport wearing a T-shirt, cut-off jeans, and sneakers, and carrying no bag. He jumped into the car
HE HIRED THE BEST PEOPLE HE COULD FIND — TALENTED, HIGHLY SKILLED PEOPLE — BUT HE COULD ALSO SEE HIDDEN TALENT AND WAS ALWAYS TRYING TO INNOVATE.


Iwas introduced to John Moore in 1973 by my father, who was a cable splicer at a company where John was testing new cable installations. I was 22 and had just moved to the Bay area. John had just moved his company out of his garage and into a small office. I had no electrical knowledge or experience, but he hired me as a shop tech — I was employee #7. Somehow, John saw I had interest and aptitude, and I was out in the field in two weeks assisting on jobs and being mentored. I found a home. I worked for John for 27 years and stayed with the company even after John retired. I ultimately retired as a Senior Field Engineer after 42 years in the field.
ETI was one of the first independent testing companies. It went on to break ground for many others. John saw his role as liaison between customer, design engineer, manufacturer, and contractor, and he was exceptionally good at it because he spoke all three languages. He also worked hard to establish relationships with the electrical unions and to secure our role as a non-union testing company. John always saw new opportunities and made the most of them.
John was always positive, optimistic, enthusiastic, and adventurous. He was always involved in something (skiing or sailing, for example), and he shared it all with us. He hired the best people he could find — talented, highly skilled people — but he could also see hidden talent and was always trying to innovate. He once hired someone we all thought was a mad scientist and set him to work building equipment to test highvoltage meters. That project resulted in a variety of high-current and high-voltage test equipment. ETI produced it in-house, and it is still out there upgraded and retrofitted today. It was one of his best innovations.
There are many stories of how John helped people be all they could be. He trusted you and fostered whatever you wanted to do, and education was a high priority. He made each person feel special, like they were a piece of the puzzle in a fast-growing company. John Moore touched my life in so many ways… I will always be grateful.
and said, “Let’s head to a department store; I need some clothes.” But there was no sense of panic or urgency in his demeanor. He always believed it would all come together — and it did. His optimism even worked the day he was late getting to the Oakland airport and chose to leave his car at the drop-off curb and run to his gate (all prior to security lines). He said having to pay to get his car out of impound was merely an expensive valet service.
Influence like John’s is something you either have or you don’t. John had it, and from that first meeting in 1975, he was a major factor in my life. I worked for John for 22 years until he retired. Not one year was like another because he was an experimenter and an optimist. When you combine those two traits, nothing stays constant.
John’s gift of influence was unique. His personality was magnetic and complex, combining intellect with humor, wisdom, and fearlessness. Many groups sought his participation, and people were drawn to him. He was a happy man, one who sought out adventure. When he delivered my performance reviews, it was often on the ski slopes or at another event such as wiring his new J-series boat during a cold Seattle winter. It was hard not to look forward to a review!


John Moore and I were cross-country competitors. I was in New England, ETI was in San Francisco. My father was Northeast Electrical Testing’s first NETA rep, and I took his place when he retired. I met John at a meeting very early in NETA’s infancy. The meeting was at Dick Beach’s (Burlinton Testing) cottage in New Jersey, and I remember wondering who that man was who was so lively! He did have that silly impish grin most of the time. We hit it off immediately and spent time together whenever we could through the years. We even served on each other’s boards for a time.
John was a pioneer in independent third-party testing. The industry needed it, because it was a conflict for manufacturers to test their own equipment. John was a true salesman, and he was able to sell that concept to the manufacturers, their customers, and to the engineering firms he reported back to — even the unions eventually bought in to the process!
There was something new every day. Lots of stress kept us sharp, but it was dangerous work back then, and there was lots of pressure to be back online quickly. You had to be ready to improvise. John was an innovator; he had great business acumen. For instance, he developed a tool accountability program that many others were modeled after.
We did so much together as friends that it’s hard to pick one thing that stands out. We teased each other, too. One time John wanted a northeast dinner, so we cooked a couple pounds of steamers. John looked at them and said, “What is that?” I said, “It’s his foot. Just peel it back, dip it in butter, and eat it.” The first one he picked up squirted water on him, and he wouldn’t touch them. He ate bellies instead.
We were there at the very beginning of NETA, and we saw it grow to young adulthood. NETA was started by and for just a few independent testing companies that were competing with big names like GE and Westinghouse. It was a learning curve for all of us, and we openly shared knowledge and techniques we knew the others didn’t have. It was a joint effort to market the concept to the industry.
John and I also shared our family philosophy: Family came first. Nancy supported and tamed him. When he retired, they sailed around the world, and John became a well-known philanthropist, founding the Crow Canyon Medical Center.


John Moore, John White, and I were the Three Musketeers — John White and I were corporate officers at ETI and later on took executive positions with Emerson as part of the acquisition of ETI. I lived near John in the same town of Danville, and in addition to work and office space, we shared some family history: We were both single for several years at the same time.
We also had humor in common. We were jokesters, always competing for the best practical joke, so each of us appreciated the other. We’d get even later. We also had a similar out-of-the-box mindset; John was always coming up with new ideas for growing the company and developing something new, and he supported my ideas, too.

John Moore, Jean-Pierre Wolff, and John White
JOHN WAS, ABOVE ALL, DEDICATED TO HIS FAMILY... AND NANCY WAS EXACTLY THE PARTNER HE NEEDED.
John always supported higher education, especially for his employees and partners. He encouraged me to get my master’s degree and PhD, and supported me through what can be a difficult time juggling a full-time job and going to school.
We had so many great experiences, many involving sailboats. When he got his first boat, I was his guinea pig for trial runs in San Francisco Bay. I remember thinking we were spending way too much time cleaning because John’s engineer mentality required everything to be spic-and-span.
At a NETA board meeting in St. Martin, John chartered a sail boat so he could get a little more practice island hopping. He insisted on checking out every little detail and every item on the inventory list — all in French. I was the interpreter and I had a little trouble with the nautical terms. Finally, the marina charter manager became impatient and asked me, “Is he renting this thing or is he going to buy it?” Dick Lussier joined us on that island sailing trip and became very seasick — green really — and John teased him relentlessly.
John loved to pick on his friends. On that same trip, he took me to a “clothing optional” beach and said we needed to enjoy the full experience. He wasn’t shy about sharing that experience, either. John got me many times. I bought a power boat from him, and it fell off my trailer at a big intersection in our small town, bringing lots of attention from local authorities. We belonged to Rotary, and he insisted on sharing the story in multiple meetings; each time, I was fined, which was Rotary’s way of fundraising. I complained when it got to $500, but John winked at me and just said, “Don’t worry; it’s for a good cause.”
John was married to Nancy for more than 24 years, and she was exactly the partner he needed. It’s not easy being married to an entrepreneur, especially one with John’s personality: always working, not always predictable, frequently cancelling plans at the last minute. Nancy was always gracious and understanding, even showing wonderful hospitality all those times he brought me home to dinner at the last minute. People don’t always think of who made it all possible, and for John, that was Nancy.
John’s influence was strongly felt by NETA, where he served many years on the board and was President from 1978–79 and again from 1983–84. He promoted NETA and its mission with all his customers. At NETA’s PowerTest 2019 conference technical conference, over 500 folks from all across North America observed a moment of silence for John. Over the next few days, many conference attendees expressed their sorrow to me and spoke of John’s influence on the industry. “We tried to emulate ETI,” they said; “ETI set the bar we strove to achieve,” and “we always viewed ETI’s methods as the ones to copy.” I’ve served on NETA’s board for the past 18 years, and his legacy is still held in the highest regard.
John’s reputation in the industry is amazing, but his positive aff ect on others is much grander than just the electrical industry. His energy, humor, and love of life were evident to all who knew him, and he created dear friends in every part of life he touched. He engaged others wherever he went. He listened. He cared.

Moore in 1984


John Moore had just expanded ETI outside San Francisco when I became employee #102 in 1986. I met John very soon and was impressed that he knew a lot about my background and family.

Back then, there were no specialized independent third-party companies to do the testing required by codes and specifications. It took an inventive go-getter like John to have the courage to make it happen. He always felt that to do what the customer wanted efficiently would require better tools, especially portable testing equipment, so he hired the right designer and started his own line.




John was respected and loved by his employees. Electrical work is stressful, and it is not a 9–5 job. Weekend and holiday work was common. We appreciated that John cared and that he took care of us. He was very aware of how the work affected families, and he made a point to recognize families, especially wives, and provide a support system for them. My wife had the greatest respect for him.
John was always there for you to offer sincere support, advice, guidance; I feel fortunate to have still been in contact with him over the years.
JOHN WAS RESPECTED AND LOVED BY HIS EMPLOYEES.

Nancy and John Moore on Lake Union.
John Moore was, above all, dedicated to his family. He is survived by his wife of 25 years, Nancy, three adult children — Michelle, John, and Janelle — and six grandchildren. He made sure to spend time with his wife and children, creating many memories from family gatherings and trips, and visited his sister, Jerilyn, and brother, Frank. In addition to his family, he enjoyed spending time with friends, relaxing at his home in Nuevo Vallarta,
working on his Ford F-150, venturing off-road, and playing dominoes.
Back in the 80s, Bev and I lost our oldest child in an accident. Months later as we struggled with the pain, Bev asked me who had been my biggest supporter. Without hesitation, John’s name came out of my mouth. That role is extremely difficult for most people. Difficult or not, John was always there; he would not run from it.
John Moore, age 76, was tragically killed on February 24, 2019. He was born in San Francisco and attended Sacred Heart High School. He earned a BS in electrical engineering at the University of California. John was the founder and President of Electro Test, Inc. A tireless volunteer and community leader, John was active in a number of organizations in addition to NETA: Danville Rotary, founding member of Crow Canyon Country Club, member of the board of Crow Canyon Country Club Homeowners Association, Crow Canyon Country Club Men’s Club, Sheriff’s Posse of Contra Costa County, San Ramon Medical Center board of directors, and Crow Canyon Country Club Emergency Response Team. He also served as Commodore of the Vallarta Yacht Club in Mexico where his friends all knew him as Capitan Juan Mas. His leadership and devotion to community service will be sorely missed by all who knew him.

John White is President Emeritus of Sigma Six Solutions, Inc. He previously was President of Electro-Test, Inc., which was a NETA Member Company for more 40 years. John has been on NETA’s board of directors for more than 18 years and served three one-year terms as President. He is currently Treasurer, Chair of the Finance Committee, and CoChair of the Association Development Committee. He holds a BSEE degree from Washington State University, is a registered Professional Engineer, and a NETA Senior Level IV Certified Technician. John was honored with NETA’s 2017 Outstanding Achievement Award.
You can count on us for specialized experience in healthcare, data center, o ce complex, and commercial acceptance and maintenance testing. Absolutely Power generation, petrochemical, oil & gas, and heavy industries also look to us for high demand services such as start-up commissioning, maintenance testing, shut-down and turnarounds, and breaker shop repair. Get started today.







AET Brings Precision and Value to Electrical Testing, Commissioning and Engineering… and Positive Results to Our Customers.
AET delivers the best value in the marketplace by offering the highest quality service at competitive prices. With a workforce and offices located throughout the country, AET is an industry leader and one of the largest independent electrical testing companies in the U.S.
To learn more about AET’s full range of testing and engineering services, visit www.aetco.us
• 800.992.3826


 BY BRANDON DUPUIS, OMICRON electronics Corp. USA
Performing offline electrical tests on transformers can be time consuming, especially when field measurements are not captured correctly the first time. This article identifies the electrical transformer test that technicians often struggle to perform efficiently and correctly and offers three field testing tips to address the issue. Building awareness can help test equipment users avoid situations where a significant amount of time is lost due to retesting, troubleshooting, and collaborating with test equipment manufacturers.
Customers seem to struggle most with the transformer power factor test, which includes an overall test, a bushing C1 test, and a bushing C2 test. The power factor test is highly sensitive to the test environment, to the lead connections, and to the test specimen’s earthground connection. This high sensitivity, which makes it challenging to obtain valid power factor measurements in the field, is a doubleedged sword: High sensitivity makes the test a powerful tool for identifying compromised insulation (e.g., moisture ingress, contaminated
oil, a bad bushing, etc.). It also makes the power factor test prone to measurement error.
To prevent wasted time, review the following checklist prior to executing any power factor measurement.
• Are the transformer tank and the test equipment solidly grounded to earthground potential? Failing to connect the test specimen and the test equipment to a solid earth-ground reference is the most common mistake technicians make in the field.
• Are the transformer bushing terminals completely disconnected and isolated from all cables, bus-bar, support insulators, surge arrestors, etc.? Before applying a test voltage of 10kV, establish a minimum clearance of 3 in. between energized terminals and all other surfaces. Avoid using a rubber blanket or insulated gloves to isolate the bushing terminals from external surfaces; the best insulator for power factor testing is air.
• Are the surfaces of the bushings dry and reasonably clean? Moisture on bushing surfaces can significantly influence a power factor measurement. In most cases, drying bushing surfaces with a clean, dry rag is sufficient. Use Windex or Collinite to remove excessive surface contamination from bushing surfaces.
• Are the groups of bushing terminals shortcircuited together? All primary-side (H) bushing terminals must be shorted together, and all secondary-side (X) bushing terminals must be shorted together. Always use NONinsulated conductor(s) to short circuit bushing terminals; do NOT use insulated shorting leads. If insulated conductor(s) are used, the conductor’s insulation can easily become part of the power factor insulation measurement. Connect the shorting jumpers as tightly as possible from bushing terminal to bushing terminal; do not let the shorting jumpers sag and/or touch any surface other than the energized terminal.
• Remove all in-service grounds from any neutral bushing terminals. For example, remove the in-service ground connection from the X0 bushing terminal.
• Place the load tap changer in an off/ neutral tap position. Some transformer load tap changers (LTCs) use a tie-in resistor, which has been known to influence power factor measurements when the transformer is tested in the neutral tap position. Federal Pioneer Electric and Federal Pacific Electric transformers with LTCs have been known to exhibit this behavior and must NOT be tested in the neutral position.
• Ensure that the exterior surface of the test equipment’s high-voltage cable is not touching any surface of the transformer at the far end where the test terminal is being energized. A conservative approach is to ensure that the last 2 ft. of the far end of the test equipment’s high-voltage cable is not touching the transformer tank, the surfaces of the bushings, etc.
• Be aware that the test environment can significantly influence a power factor measurement.
• Do not do a power factor test in the rain.
• Avoid testing in high-humidity situations where excessive moisture is present.
• Avoid power factor testing when the temperature of the transformer oil is below 0°C.
• If possible, run a power factor test after noon, when moisture/humidity are typically lowest.
The power factor checklist is intended to help test equipment users get the measurement right the first time, which is the most practical time-saving strategy. The variable frequency power factor test can be used in conjunction to quickly and easily confirm that the power factor measurements are indeed valid.
One common scenario when reviewing power transformer test results is that the customer’s data set is provided after the technician leaves the job site and returns to the office. Review of the data frequently identifies invalid power factor measurements that now must be retested to obtain valid results.
Whether the transformer is still offline or has been re-energized, the customer has wasted significant time and resources. If the crew must return to the field to retest, more time and resources will be spent. If the transformer has been re-energized, the company has wasted their time and resources on invalid test results that


cannot be used to assess the condition of the transformer.
Technicians can use the variable frequency power factor measurement to quickly identify and correct invalid power factor measurements before they leave the job site. With a power factor measurement at one test voltage and at one test frequency (i.e., with one power factor percentage value), it is difficult for the technician to verify whether the measurement is valid. However, invalid measurements often become obvious when the variable frequency power factor measurement is performed and analyzed.
A variable frequency power factor test performs power factor measurements at a series of test frequencies (e.g., 15Hz, 30Hz, 45Hz, 60Hz, 150Hz, 200Hz, 300Hz, and 400Hz). See “The Value of Performing Power Factor Sweep Measurements on Bushings” for general guidelines used to assess this test, as well as several case studies.
Figure 1 and Table 1 show the bushing C1 power factor measurements obtained by testing three Lapp POC 138kV bushings. Analyzing only the 10kV–60Hz power factor values, it is not obvious that the power factor measurements
are incorrect. However, note that the variable frequency power factor traces for the three bushings are erratic and jagged. In general, jagged frequency sweep traces indicate invalid power factor measurements. In this case, the customer determined they had not shortcircuited the primary-side (H) bushing terminals of the transformer before the C1 power factor measurements were performed on the bushings.
Table 1: Case Study: Lapp POC 138kV Bushings
Th e overall power factor measurements in Figure 2 and Table 2 were performed on a Kuhlman 118kV oil-filled transformer. The 10kV–60Hz power factor measurements look normal for an oil-filled transformer, but the variable frequency power factor traces show an abnormal CH frequency sweep trace. Note that as the test frequency increases, the CH trace approaches 0% power factor and even becomes negative. Negative power factor measurements are a telltale sign of an invalid measurement.
If the technician only had access to the 10kV–60Hz power factor measurements, it is conceivable that the incorrect measurement could have been overlooked. In this case, the customer determined that the transformer tank and the test equipment were not connected to a solid earth-ground reference potential.
Table 2: Case Study: Overall Power Factor Measurements on Kuhlman 118kV Transformer
Th e technician can use the variable power factor traces to quickly identify incorrect measurements and can retest before leaving the job site with invalid test results.


Field transformer test technicians often struggle with the dc winding resistance test. The dc winding resistance test is the offline measurement used to identify bad connections and discontinuities along the current-carrying path of a transformer. This test is an invaluable tool for identifying bad connections associated with tap changers, including de-energized tap changers (DETCs) and load tap changers (LTCs).
In theory, the dc winding resistance test is a simple concept that relies on the fundamental application of Ohm’s Law (V = I x R). In practice, however, obtaining the correct transformer resistance measurements is challenging because the transformer core must be saturated. A common mistake is not waiting long enough for the core to fully saturate. When resistance measurements are captured too soon, the measured resistance values are higher than expected. This makes it appear that there is a bad connection, even when no fault exists.
The best strategy to quickly saturate the transformer core and then obtain correct resistance measurements efficiently is to inject as high as possible dc current into the winding under test. The higher the injected test current, the faster the transformer core saturates, and the faster the test can be performed. Use the following guidelines to select the appropriate test current for a given winding resistance measurement.
• The lower the resistance of the winding under test, the higher the test-current should be.
• When the winding resistance under test is greater than 100mΩ, a test current in the range of 5–10A is typically sufficient. Most resistance measurements performed on the primary-side (H) transformer winding have resistance values greater than 100mΩ.
• When the winding resistance under test is less than 100mΩ, a test current in the range of 20–30A is ideal. Most resistance measurements performed on the secondary-side (X) transformer winding have resistance values less than 100mΩ.
• In North America, LTCs are usually applied to the secondary-side (X) transformer winding. In cases where the LTC is located on the secondary side, a technician may need to obtain up to 99 resistance measurements, and the magnitude is often well below 100mΩ. In these cases, it is important to use a sizeable test current (e.g., 20–30A) so the lengthy test sequence can be performed as quickly and accurately as possible.
• The test current should not exceed 10% of the rating of the winding under test.
• The test current multiplied by the resistance of the winding under test should not exceed the maximum compliance voltage rating of the test instrument’s dc current source. In general, the higher the power the test instrument’s dc current source is rated, the higher the test current that can be injected into a given winding, and the faster the dc winding resistance test can be performed.

Test equipment users often attempt to apply the same magnitude test current in both the dc winding resistance H and dc winding resistance X tests. However, since the magnitude of winding resistance is often significantly different when comparing these two tests, it is conceivable that two different test currents (one for the primary-side test and one for the secondaryside test) must be applied when performing both tests. The most common mistake is not injecting enough current when performing the dc winding resistance X test; this often leads to lengthier core saturation time and inaccurate measurements, especially when an LTC is involved.
Overall, the best way to reduce wasted time when testing transformers is to get the measurement right the first time.
B.Dupuis, “The Value of Performing Power Factor Sweep Measurements on Bushings,” presented at WEIDMANN 2018 Annual Technical Conference.
C.L. Sweetser, “Obstacles Associated with Winding Resistance Measurements of Power Transformers,” OMICRON electronics Corp. USA.

Brandon Dupuis joined OMICRON electronics Corp, in 2013 and presently holds the position of Regional Application Specialist for transformer testing. His focus is on standard and advanced electrical diagnostics for power transformers and circuit breakers. Brandon is an OMICRON Instructor for electrical transformer diagnostic testing theory, application, and test result analysis, including presentations and hands-on training. He is an active member of the IEEE/PES Transformers Committee. Brandon received a BS in electrical engineering from the University of Maine.


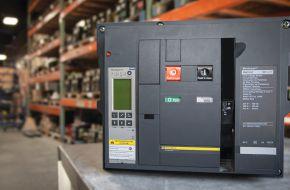


 BY MLADEN ŠAŠIC, PE, and CONNOR CHAN, Iris Power
Diagnosing the condition of complex systems such as high-voltage rotating machines has never been a simple task. Design requirements, the use of different materials, and demanding operating conditions require multiple off-line tests and on-line monitors to provide information on the machine’s condition. Part 1 of this article described the application of various off-line test techniques to assess stator and rotor insulation and stator core. Part 2 addresses the additional improvements that can be gained by combining visual inspection with information from on-line monitors that use multiple technologies.
On-line testing has many advantages, including two that are the most important: The machine does not have to be stopped for the test, and normal operating conditions (temperature, current, etc.) are present. However, on-line testing requires permanent or temporary sensors to be installed. The two tests performed most frequently with the machine in operation are the partial discharge test of stator winding and the detection of shorted turns in the rotor winding.
Partial discharges (PD) are small electrical sparks resulting from the electrical breakdown of a gas (for example, air) contained within a void or under a highly non-uniform electric field. If the void is within an organic solid or liquid, PD will degrade the organic material and may eventually cause the electrical insulation to fail. In addition to causing this electrical aging, PD may indicate thermal, mechanical, and environmental aging in highvoltage apparatus. For example, operating at high temperature may create voids within the epoxy-mica insulation of a stator winding; this can delaminate taped insulation systems. Similarly, mechanical stresses can lead to gaps, and contamination by partly conductive coatings can lead to high localized electrical stresses on insulation surfaces that result in discharges into the air.
When a partial discharge event occurs, electrons flow very fast from one side of the gas-filled void to the other. Since the electrons are moving close to the speed of light across a small distance, the measured pulse has a very short duration — typically a few nanoseconds. The PD current pulse creates a disturbance, and pulse current and voltage flow away from the PD site. Various types of permanent or temporary sensors are installed to detect PD on-line. Any sensor (also called a coupling device) sensitive to high frequencies can detect PD pulse currents; however, not every sensor will provide sufficient noise-to-signal ratio.
Capacitive (high-voltage coupling capacitors) and inductive (various antennas and highfrequency current transformers) sensors are commonly used types. Typical capacitances range from 80 pF to 1,000 pF. A capacitor is a very high impedance to high ac (50 or 60 Hz) voltage, but is a very low impedance to the high-frequency PD pulse currents. The sensor and PD detector (test instrument) selected will determine the frequency range of the whole system. On rotating machines, low-frequency (0.8 to 10 or 20 MHz) and high-frequency (40–350 MHz) methods are commonly used.
The major obstacle to establishing a proper diagnosis based on on-line PD measurement is the possible presence of noise or electrical interference. Electrical interference can come from corona on air-insulated transmission and distribution lines, power tool operation, arc welding, poor electrical contacts, electrostatic precipitators, etc. All produce sparks and/or discharges that create current pulses similar to PD. Separating this noise from test-object PD is important. Noise mistaken for PD will give a false indication of insulation deterioration, reducing the usefulness and credibility of the PD test. The most effective way to reject noise and outside PD is to apply hardware methods. One method measures the rise time or width of the pulse: A fast rise time (< 6 ns) pulse is likely to be PD in the stator winding, while a noise pulse tends to have a longer rise time due to transmission line dispersion as the noise pulse propagates along a power cable to the motor or generator.
Another method depends on the propagation time between a pair of sensors: Two capacitive sensors per phase are mounted on the machine terminals, separated by at least 2 m, or on two parallel paths within a hydro generator. Since the current pulses have a finite transmission speed on a busbar or power cable, PD pulses will arrive at the sensor closest to the stator winding first; outside PD from other equipment connected to the power system will arrive at the other sensor first. Digital logic can then determine on a pulse-by-pulse basis whether the pulse is stator PD or PD from


other equipment. Both of these hardware-based signal separation methods require measurement system bandwidth of 100 MHz or more in order to distinguish small differences in arrival time or accurately measure the rise time or pulse width. If only one sensor per phase is used, it is impossible to detect the direction of the pulse arrival, i.e., its place of origin within the rotating machine or externally. This compromise (use of just one sensor per phase) can have a significant impact on the quality of data collected from all machines except smaller machines connected to a power system with sufficiently (longer than 100 ft.) long highvoltage cables.
Most instruments used to collect PD data measure the number of pulses per second, as well as the polarity, amplitude, and phase position of each pulse. Using that data, various graphs can be generated to display the results from one or more measurements for trending purposes. In addition to noise interference, understanding measurement results and the credibility of various methods used in PD data collection are major concerns. The possibility of false positives, which may result in concluding that problems are present in the winding as a result of noise or misinterpretation, and the occasional (wrong!) claim that on-line PD monitoring can detect ALL insulation problems both create difficulty in using PD results for diagnosis.
The absence of standards defining acceptable levels of PD in rotating machines, along with uncertainties related to measurement methods and the fact that calibration is not possible all tend to minimize the diagnostic value of
this technique. However, standardization in selecting the sensor and instrumentation used for data collection on a large number of machines (more than 10,000) provides conditions for statistical data evaluation. More than 600,000 on-line PD results were collected and compiled to indicate the distribution of pulse amplitude (Qm) levels on machines of different voltage classes and sensor installation methods. The range in Qm from all the tests for each particular operating voltage was established for each set of the above factors. A sample of the statistical distribution is shown in Table 1.
For example, for 13-15 kV stators in hydro generators and pump-storage units, 25% of tests had a Qm below 35 mV; 50% (the median) had a Qm below 93 mV; 75% were below 193 mV; and 90% of tests yielded a Qm below 376 mV. Thus, if a Qm of 400 mV is obtained on a 13.8 kV hydro generator, it is likely that this stator is deteriorated, since it has PD results higher than 90% of similar machines. In fact, significant stator winding insulation deterioration was observed in over 200 cases where a machine was visually examined after registering a PD level greater than 90 percent of similar machines.
Publishing these results, together with taking the PD trend into account, seems to have reduced the risk of both false positives and false negatives and improved the test’s diagnostic value. An attempt was also made to study the correlation of PD level to visual observation. In 216 cases, PD indicated various failure mechanisms, such as contamination, design and manufacturing problems, and vibration. As
a result of a large number of installations using the same type of PD sensor, a standardized data collection approach, and the well-established correlation between PD patterns and insulation condition, PD monitoring identified many pending service problems, prevented a significant number of generator service failures, and has resulted in a major cost saving to the power generation industry.
Two types of rotors are generally used in synchronous electrical machines: round, for high speed machines, and salient pole for lower speed machines. A turbine generator rotor usually consists of a solid forging made from magnetic alloy steel and copper windings that are assembled in slots machined in the forging. The winding is secured in slots by steel, bronze, or aluminum wedges. At each end of the rotor, the end sections of rotor winding are supported by retaining rings. Modern rotor winding insulations are made mostly from epoxy, polyester glass, or Nomex™ laminate strips and channels. The strips are used to provide interturn insulation, and molded channels are used to provide ground insulation. Rotor insulation should be designed to withstand electrical, mechanical, thermal, and environmental stresses.
For moderate and large hydro generators and pumped storage generators, the most common type of salient pole rotor has a strip-on-edge winding on each pole. Such windings are composed of strips of copper that are fabricated around the pole piece much like a picture frame. Electrical insulation, most commonly fiberglass reinforced epoxy, is used to insulate each copper turn from adjacent turns, as well as provide ground insulation between the copper and the rotor pole. Failure of the rotor winding insulation can result in shorted turns. Shorted turns on a rotor may lead to unbalanced magnetic pull, which in turn may cause an increase in bearing vibration. However, shorts can exist with no increase in vibration; thus, bearing vibration is not an
infallible way to detect rotor winding aging. The condition of rotor winding insulation is difficult to assess during a shutdown due to limited access and the frequently intermittent nature of faults at operational speed and at standstill. Consequently, on-line testing is a more effective way to detect shorted turns.
Flux monitoring using temporary or permanently installed flux probes on turbine generators has been used since the early 1970s. Flux measurements are used to determine the existence of turn-to-turn shorts in the rotor winding. All of the methods available are based on measuring relatively weak stray flux (rotor slot leakage flux) using flexible or nonflexible polymer-encased stator wedge mounted probes. The stray flux is proportional to the total ampere turns in each rotor slot. If shorts develop between turns in any slot, then the ampere turns in that slot drop, and stray flux across that slot is reduced. The magnitudes of these stray fluxes can be measured using portable or permanently installed instruments, and shorted turns can be identified by comparing the difference in induced voltages from pole to pole. The main challenge in existing technology is the need to manoeuver the turbine generator load to achieve the maximum sensitivity of measurement to every slot of a rotor. This, together with issues including the type of hardware and algorithms used for the detection of shorted turns, has limited the use of this technology in the power industry.
To overcome this problem, new hardware and algorithms were developed in an attempt to make the flux test more sensitive to shorted turns in all coils, even if the generator load could not be changed to align the flux density zero crossing (FDZC) with every slot.
• The temporal and magnitude resolution of the hardware was improved compared to the conventional test.
• Concentration was focused on the main magnetic flux rather than the leakage flux.


• Three proprietary numerical methods were developed to improve the sensitivity to small differences between pole A and pole B main flux plots.
• The results from the three algorithms were compared to develop an index of confidence in the finding of the presence (or not) of shorted turns in each coil.
The new approach can be used with conventional wedge-mounted coils that protrude into the air gap. An alternative probe can be glued to the stator core tooth rather than the stator wedge. This probe directly measures the main magnetic flux that passes through the core tooth. A typical measurement result from
a two-pole turbine generator is shown in Figure 1. The grey line indicates the measured signal; the green line measures the integrated signal.
The vertical green line indicates the position of FDZC, a point with maximum measurement sensitivity at coil 6 (Figure 1). With load increase, the FDZC will move toward lower number coils, but will never reach coil 1. The measurement result shown in Figure 1 is of very low diagnostic value, since the pole-to-pole difference, per coil, is not visually detectable, so no judgment on the presence of shorted turns can be made. The graph shown in Figure 2 is more useful, but still lacks a clear and easy means to detect the existence of shorted turns.

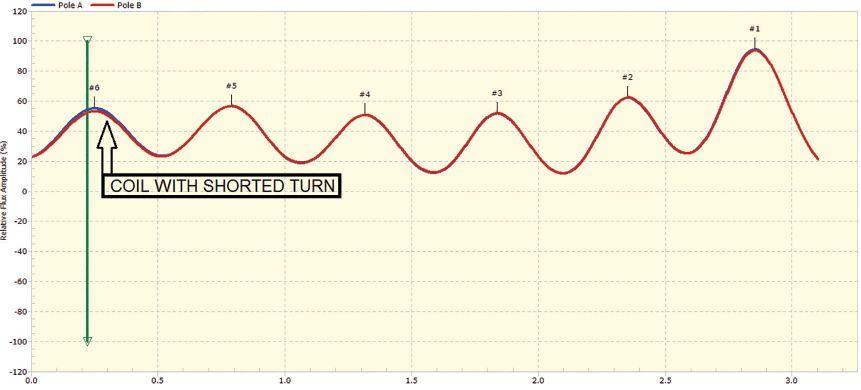
Using multiple algorithms resulted in great improvement in analysis reliability, providing measurement results can be used for diagnosis (Figure 3).
Analysing the condition of rotating machines has evolved from off -line testing to a combination of off-line tests and online monitoring. No single test is perfect or sufficient to completely diagnose the condition of a rotating machine, and presenting multiple measurement results graphically is frequently more valuable than a simple numerical reading. Further improvement can be gained by combining visual inspection with information from on-line monitors that use multiple technologies, including partial discharge, rotor flux, shaft voltage and current monitoring, and endwinding vibration monitoring.
IEEE Std. 1434, IEEE Guide for the Measurement of Partial Discharges in AC Electric Machinery
IEC 60034-27-2, Rotating Electrical Machines - Part 27-2: On-line partial discharge measurements on the stator winding insulation of rotating electrical machines.
G. Stone, “A Perspective on Online Partial Discharge Monitoring for Assessment of the Condition of Rotating Machine Stator Winding Insulation,” IEEE Electrical Insulation Magazine, September/October 2012.
V. Warren, “PD Progress Report,” Iris Rotating Machine Conference, 2015
C. Maughan, “Partial Discharge: A Valuable Stator Winding Evaluation Tool,” IEEE International Symposium on Electrical Insulation, 2006.
D. R. Albright, “Inter turn short-circuit detector for turbine-generator rotor windings,” IEEE Transactions on Power Apparatus and Systems, Vol. PAS-90, No. 2, pp. 478–483, March/April 1971.
M. Šašić, B. Lloyd, A. Elez, “Finite Elements Analysis of Turbine Generator Rotor Winding Shorted Turns,” IEEE Transactions on Energy Conversion, Vol. 27. No. 4, pp 930-937, December 2012.

Mladen Šašić, PE, IEEE Senior Member, is the manager of Rotating Machines Technical Services with IRIS Power, Canada. He has more than 30 years of experience in the design and testing of high-voltage electrical power equipment. He is an IEEE Senior Member and a registered Professional Engineer in Ontario, Canada. Mladen received a BS in electrical engineering from Sarajevo University, Yugoslavia, in 1987. He coauthored the Handbook of Electrical Motors, which published in 2004, and has written more than 100 technical papers.

Connor Chan has been a Rotating Machines Engineer at IRIS Power since 2001. He previously was Field Service Manager. Connor received his BS in electrical engineering from the University of Hong Kong. He is a member of IEEE, the Institution of Engineering & Technology (formerly IEE, UK), and the Institution of Engineers Australia, and is a Chartered Engineer.




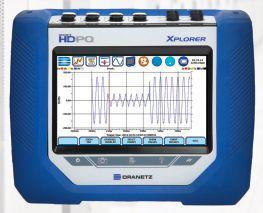


The Institute of Electrical and Electronic Engineers (IEEE) Standards Association recently approved the publication of IEEE Std. C57.161–2018, Guide for Dielectric Frequency Response Test. The work was developed within the IEEE Transformers Committee and the Dielectrics Subcommittee. The industry needed a document to better understand the field application of a non-intrusive and non-destructive method to assess the condition of oilpaper insulation in power and distribution transformers.
Over the last two decades, other technical references presented the development of dielectric frequency response (DFR), aka frequency domain spectroscopy (FDS), specifically its application for power and distribution transformers with oil-impregnated paper insulation. CIGRE Technical Brochures 254, 414, and 445, as well as IEEE Std. C57.152, addressed the importance of the research and the benefits of the method as applied to power and distribution transformers.
The IEEE Transformer Committee initially formed a task force to recommend (or not) the need to develop a guide describing the application of DFR on oil-impregnated transformers. From the initial step of forming
the task force to the publication of the guide, the contributions and participation of specialists, end-users, testing equipment manufacturers, transformer manufacturers, and academia made it possible to produce a practical and comprehensive guide for using DFR technology and interpreting a transformer’s insulation dielectric response in the frequency domain.
Around the mid-1900s, the frequency domain response was thoroughly studied, and the defi nition of dielectric losses at power or line frequency (50/60Hz) turned out to be a great success for transformer manufacturers,
end-users, and testing service companies. Technology evolved, however, and electronic components and control devices opened the door to a wider band frequency spectrum to analyze different insulation materials.
In 1996, WaBtech AB in Sweden brought the first portable device for DFR testing in the field to the market. Dr. Peter Werelius and Bjorn Bengtsson introduced the insulation diagnostics analyzer (IDA) mainly for cable and transformer testing. The practical application of DFR in the field generated interest in the industry, and international organizations took the lead on investigating this new technology that was revolutionizing testing practices in the field.
In 2002, CIGRE developed Technical Brochure 254, “Dielectric Response Methods for Diagnostics of Power Transformers.” This report from Task Force D1.01.09 focused on three dielectric response techniques: return voltage measurements (RVM), dielectric spectroscopy in time domain (TDS), and dielectric frequency domain spectroscopy (FDS). The task force concluded that (a) all three methods reflect the same fundamental polarization and conduction phenomena in transformer insulation and (b) the definition of moisture in solid insulation by time domain and frequency domain responses requires mathematical modelling and a good understanding of the dielectric properties of insulation system components.
In 2010, CIGRE continued the work and published Technical Brochure 414, “Dielectric Response Diagnoses for Transformer Windings,” which combined the acquired practical experience with the mathematical modelling approach to determine testing best practices. The document covers the fundamentals of the X-Y model, measurement configurations, test performance — and perhaps the most important part — case studies and comparative analysis using Karl Fisher titration (KFT) to validate using dielectric response methods to detect moisture estimation in solid insulation.


The technology was widely accepted in the field. Continuing the work, CIGRE Working Group A2.34 incorporated the dielectric response methods in time and frequency domain into Section 5.1.3 of Technical Brochure 454, which was published in 2011. Dielectric response methods are included as “Special or Advanced Measurements.” DFR or FDS is an advanced testing technique used in the field to determine the water content in the solid cellulose insulation of oil-paper insulation and detect insulation failures and insulation contamination. Moisture content in solid insulation is derived from field testing and mathematical modelling, and a database source is compared against limits given for dry, moderately wet, and extremely wet insulation in IEC 60422. IEC 60422 states that although the determination of water content in transformer paper by measuring the water in oil has been frequently described, practical results are often not in line with the theoretical predictions. All calculations and correlations of the water content in oil and the water content in the oil/paper system depend on the equilibrium state between the insulating oil and the oil/paper system.
In North America, the IEEE Transformer Committee revised IEEE Std. 62, Guide for Diagnostic Field Testing of Electric Power Apparatus — Part 1: Oil filled Power Transformers, Regulators, and Reactors. One of the fundamental reasons for revising this document was the application of new testing techniques that were not previously described but were considered important to help manufacturers and end-users meet current requirements, especially in the field. It is interesting that IEEE 62 (R2005), Section 6.3.12 provides two tables with general guidelines for interpreting data expressed in percent saturation of water in oil and in percent moisture by dry weight of paper.
The work carried out by the IEEE Transformer Committee ended with the 2013 publication of IEEE Std. C57.152, Guide for Diagnostic Field Testing of Fluid-Filled Power Transformers, Regulators and Reactors. The amount of
information assembled in this document is difficult to describe in just few lines, but this guide added Informative Annex G, which provides a brief description of the dielectric frequency response method and its interpretation for oil-paper insulation systems in power transformers.
The continuous work of IEEE and its members is well-reflected in IEEE Std. C57.161, IEEE Guide for Dielectric Frequency Response Test, which is applicable to liquidimmersed transformers. The guide includes a thorough description of the DFR method, comparative analysis of line-frequency power factor and the dielectric response in a wide frequency spectrum, recommendations for instrumentation, procedures for performing the tests, and guidelines for interpreting the data. The application of DFR allows testing in the factory and in the field.
After a general overview, Section 4 introduces the DFR method. DFR is a non-intrusive and nondestructive off-line testing technique performed in the frequency domain to determine the moisture content of a transformer’s solid insulation and the conductivity of the liquid insulation. This paragraph covers one very important characteristic of the dielectric response: It can discriminate between the effects of moisture versus contamination in liquid or solid insulation.
Section 4 describes several important facts.
• First, DFR, as with any other dielectric response method, depends on the unique dielectric properties of the material, the electric field, and the temperature of the specimen at the time of the test.
• Second, DFR follows the same measurement principle as the linefrequency power factor test, but the excitation signal applied by DFR instruments varies frequency in the range
from 1 kHz down to 1 mHz (typical range at 20°C). The complex impedance of the dielectric system is measured at different frequencies, and the dielectric response is plotted as percentage dissipation factor, permittivity, or capacitance as a function of frequency.
To evaluate the condition of the insulation system, the modelling algorithm requires specific information. The normally fixed information is:
a. Liquid insulation relative permittivity (εr)
b. Thermal activation energy for solid and liquid insulation
c. Temperature of the insulation under test
The outcome of the test will provide:
• Liquid insulation conductivity (σ)
• Moisture in solid insulation (µ)
In addition to modelling, it is important to understand that the test is performed in the field following the same instrument-toobject hook-up principles as those used for power factor/dissipation factor testing at line frequency. Figure 1 depicts the hook-up diagram of the DFR test set to a commonly used two-winding transformer.
Section 5 provides best practices and confi gurations to perform the test in the field. As in any other electrical test, the very first recommendations are related to safety. For many readers, safety is not just a best practice; it is a life style. Therefore, the local and federal regulations required to perform the test as well as the safety instructions provided by the test set manufacturer must be followed. An additional advantage of DFR is that the test involves a low-voltage excitation signal, typically ≤ 140VRMS.
Working conditions in the field might not be optimal. Section 5 provides guidelines to minimize the effect of external factors on test performance as well as the measurement


configurations. At this stage, the reader should be aware that the most accurate estimation of moisture in the solid insulation is related to the test between windings in an ungrounded specimen test (UST) mode. In a two-winding transformer, the capacitance of interest is the inter-winding insulation between the high- and low-voltage windings represented in Figure 1 as CHL. Other insulation systems between the high-voltage winding and ground (CH) or between the low-voltage winding and ground (CL) are susceptible to the influence of bushings and other components, such as tap changers, inside the transformer. Nevertheless, UST measurements are often taken to identify non-typical responses related to contamination or degradation of the insulation system.
Section 6 provides the guidelines to generate the test report, including an example of the report.
Th e most important part of the guide is undoubtedly Section 7, Measurement Analysis and Interpretation. This section provides the diff erences between the dielectric response of liquid and solid insulation, graphically represented in Figure 2. Liquid insulation dielectric properties can be described by a simple parallel RC-circuit: The capacitance represents the liquid permittivity; the resistance represents the liquid conductivity. The


dielectric properties of solid insulation are more complex; both capacitance and losses vary with frequency in a manner that cannot be described by a simple parallel or series RC-circuit.
After a clear description of the behavior of the materials under an alternating excitation signal in a wide frequency spectrum, various factors affecting the dielectric response are described. One of the most important factors to consider is the presence of noise (EMI) in the surrounding test area. To overcome the effect of EMI on the measurement signal, use of a voltage amplifier is optional in the field, especially for low-capacitance specimens and tests at temperatures close to 0°C.
Four annexes are included in the document:
• Dielectric frequency response analysis — theory and validation
• Non-moisture related factors influencing the DFR measurements
• Examples of typical measurement challenges
• Bibliography
This article, which was originally published in Transformer Technology Magazine, represents a brief summary of a well-developed document provided by IEEE and its members. The author considers it imperative for asset managers, utility operators, transformer manufacturers, and testing service providers to acquire this document and follow the guidelines given.

Diego Robalino, PhD, PMP, IEEE Senior Member, is a Principal Engineer at Megger, where he specializes in the diagnosis of complex electrical testing procedures. He has over 20 years of involvement in the electrical engineering profession with management responsibilities in the power systems, oil and gas, and research arenas. Diego is a member of the IEEE/PES Transformers Committee, a certified Project Management Professional with the Project Management Institute (PMI), and the General Chair for the IEEE/DEIS 2020 Electrical Insulation Conference. He is the author and co-author of multiple technical articles related to power, distribution, and instrument transformer condition assessment. Diego received his PhD in electrical engineering from Tennessee Technological University while doing research in power system optimization with a focus on aging equipment.

NETA Corporate Alliance Partners (CAPs) are a group of industry-leading companies that have joined forces with NETA to work together toward a common aim: improving quality, safety, and electrical system reliability.

In our CAP Spotlight series, we look at what makes CAPs special and highlight some of their successes. In this issue, NETA World interviews Cody Richards, Protec’s Vice President of Business Development.
Protec, specialists in the electrical testing equipment rental industry, offers a large, nationwide rental fleet of electrical test and measurement equipment. A leader in the industry for over 15 years, Protec understands that their customers need experienced people to align them with the proper equipment, getting it to the right place at the right time. With Protec’s multiple locations (Dallas, Houston, Chicago, Atlanta, Reno-Tahoe and Northern New Jersey) stocked with inventory, all shipping options are always considered to save customers the most time and money. And with electrical testing application support from a team that works hard to get to know a customer’s special requirements, Protec is a company that prides itself on doing what it takes to help get the job done right.
NW: What is something NETA World readers don’t know about Protec?
Richards: Protec Equipment Resources doesn’t just rent electrical test equipment. We have two calibration labs, and we have recently launched an Asset Management program. If you need equipment calibrated with a quick turnaround or need assistance with the day-today grind of owning a large fleet, Protec is here to help in a wide variety of ways.
NW: What recent company achievement or milestone are you particularly proud of?
Richards: We recently launched our customer portal (portal.protecequip.com) and an app, Protec Connect. Both offer our customers a smart new way to rent the electrical test and
WITH IMMENSE INDUSTRY GROWTH, THERE IS ALWAYS A LARGE HOLE TO BE FILLED WHEN SOMEONE WITH A GREAT DEAL OF KNOWLEDGE AND EXPERIENCE RETIRES OR STEPS AWAY FROM THE INDUSTRY.

measurement equipment they need. It puts a nationwide equipment rental fleet at their fingertips.
NW: What evolution do you see on the horizon that will have a positive impact on your work?
Richards: The automobile industry — as it evolves into a more electric dependent business — and the forthcoming 5G network technology will have extensive positive impacts on our industry.
NW: What challenges do you see going forward for the industry?
Richards: We believe the challenges we face will remain the same. With immense industry growth, there is always a large hole to be filled when someone with a great deal of knowledge and experience retires or steps away from the industry. This results in an ever-expanding need for people to fill those roles and also the need to find people who have the knowledge and flexibility to perform a broader range of testing. Thus, emphasizing a need for not only people to perform the work, but the need to train those who don’t yet have the knowledge and experience to be able to perform this work in the future.

0-5/10/20kVthump 1000joulesalloutputs
REVISION IN PROCESS




ANSI/NETA ECS, Standard for Electrical Commissioning of Electrical Power Equipment and Systems, 2015 Edition, continues the American National Standard revision process. A project intent notification published in ANSI’s Standards Action on May 18, 2018, announced the intent to revise the standard. A 30-day initial ballot period and a 45-day public comment period began on April 26, 2019. A second ballot was issued July 5, 2019, and closed on August 5, 2019. The 45-day second ballot public comment period was scheduled to close on August 20, 2019. The intent is to release the revised edition of ANSI/NETA ECS in March 2020.
ANSI/NETA ECS describes the systematic process of documenting and placing into service newly installed or retrofitted electrical power equipment and systems. This document shall be used in conjunction with the most recent edition of ANSI/NETA ATS, Standard for Acceptance Testing Specifications for Electrical Power Equipment and Systems




The individual electrical components shall be subjected to factory and field tests, as required, to validate the individual components. It is not the intent of these specifications to provide comprehensive details on the commissioning
of mechanical equipment, mechanical instrumentation systems, and related components.
Voltage classes addressed include:
• Low-voltage systems (less than 1,000 volts)
• Medium-voltage systems (greater than 1,000 volts and less than 100,000 volts)
• High-voltage and extra-high-voltage systems (greater than 100 kV and less than 1,000 kV)
References:
• ASHRAE, ANSI/NETA ATS, NECA, NFPA 70E, OSHA, GSA Building Commissioning Guide
The 2015 Edition is available for purchase in the NETA Bookstore at www.netaworld.org
Single copy of draft document: $495 Order from: Richard Piet (888) 300-6382 rpiet@netaworld.org
Send comments to Richard Piet, rpiet@netaworld.org, with copy to psa@ansi.org
ANSI/NETA MTS, Standard for Maintenance Testing Specifications for Electrical Power Equipment and Systems, 2019 Edition, completed an American National Standard revision process having received ANSI approval on February 4, 2019. The revised edition of ANSI/NETA MTS was released in March 2019 and supersedes the 2015 edition.
ANSI/NETA MTS contains specifications for suggested field tests and inspections to assess the suitability for continued service and reliability of electrical power equipment and systems. The purpose of these specifications is to assure that tested electrical equipment and systems are operational and within applicable standards and manufacturers’ tolerances, and that the equipment and systems are suitable for continued service. ANSI/NETA MTS-2019 revisions include online partial discharge survey for switchgear, frequency of power systems studies, frequency of maintenance matrix, and more. ANSI/NETA MTS-2019 is available for purchase at the NETA Bookstore at www.netaworld.org.
ANSI/NETA ATS-2017, Standard for Acceptance Testing Specifications for Electrical Power Equipment and Systems is scheduled to complete an American National Standard revision process in fall 2020. A project intent notification was published in ANSI’s Standards Action on November 30, 2018.
ANSI/NETA ATS covers suggested field tests and inspections for assessing the suitability for initial energization of electrical power equipment and systems. The purpose of these specifications is to assure that tested electrical equipment and systems are operational, are within applicable standards and manufacturers’ tolerances, and are installed in accordance with design specifications.
This document is scheduled for release as a revised standard in the spring of 2021. Those interested in participating in the revision process should contact the NETA office for more information.
ANSI/NETA ETT, Standard for Certification of Electrical Testing Technicians, 2018 Edition, was approved by ANSI as an American National Standard on February 22, 2018. It is available now in the NETA Bookstore at www.netaworld.org, where a complimentary PDF copy can be downloaded or a printed copy ordered.
ANSI/NETA ETT establishes minimum requirements for qualifications, certification, training, and experience for the electrical testing technician. It provides criteria for documenting qualifications for certification and details the minimum qualifications for an independent and impartial certifying body to certify electrical testing technicians.
Comments and suggestions on any of the standards are always welcome and should be directed to NETA. To learn more about the NETA standards review and revision process, to purchase these standards, or to get involved, please visit www.netaworld.org or contact the NETA office at 888-300-6382.
ANSI/NETA STANDARDS





Third-generationvacuum interruptertest set. Determines vacuumpressureIntegrityto determineusefullifeexpectancy.

Testscurrenttransformers & voltage transformers.Compileswith applicable ANSIand IECteststandards.
The ASTM F18 committee meeting was held in Denver, Colorado, on April 1–5, 2019. Committee meetings are held annually in April and October.
The F1506 Wearing Apparel Task Group did the main work in this session. This actually became several sessions, as F1506 was divided into smaller pieces so it could be handled more easily. The task group chair is Marcia Eblens, who is retired from PG&E.
Task group WK-55661 covers visibility enhancements, after-flame testing, and zippers; WK-59582 covers patches and logos; WK60221 covers areal density; WK-55666 covers conformity. Each of these was discussed in detail, and concerns over the wording or new requirements were voiced.
Several ballots were sent to task group members:
• WK-55661. A requirement for D6413 testing every six months by the manufacturer was added, mostly due to concern that changes could be made by component suppliers without notifying purchasers. There was disagreement on testing every six months; this will be re-balloted. Zippers were identified as a potential problem if exposed, as zipper ratings were lower than fabric ratings. Slide fastener tape must be flame
resistant and can’t be exposed on the inside of the garment. This question will also be reballoted.
• WK-59582. The vote on pulling language from the appendix into the body of the standard failed. The wording was modified to better align with NFPA 2112, Flash Fire Protection. Patches and logos are limited to 16 square inches individually and no more than 40 square inches total as stated in NFPA 2112.
• WK-60221. The proposal for three weight ratings was deemed too confusing and will be re-balloted.
• WK-55666. Many negatives were brought up, as conformity is a concern for manufacturers. To a large extent, they did not believe a separate requirement is needed, since the label does this. The label will probably meet the need for the conformance requirement at this time.
Rubber insulating glove testing was also discussed extensively. Confusion remains on what “first issued” really means or is intended to mean. The proposed language states that the gloves will be
tested based on the date of issue with retesting not to exceed six months if issued for service. If in storage, gloves must be retested within 12 months or meet the six-month test interval, whichever comes first. For example, a pair of gloves that has been in storage for nine months after electrical testing can only be used for three months.
Testing has found that rubber insulating gloves sewn with Kevlar thread show minute abrasion damage and do not meet ASTM F696. The damage caused by the thread is cumulative. Thread is available that meets F696 and is arc resistant. On a side note, rubber insulating gloves should be stored separately, not inside leather protector gloves.
On ASTM F855 Class H and Class I clamps will be removed, as no one uses them.
The next meeting is scheduled October 20–23, 2019, in Houston.

James (Jim) R. White, CESCP, Vice President of Training Services, has worked for Shermco Industries since 2001. He is a NFPA Certified Electrical Safety Compliance Professional and a NETA Level 4 Senior Technician. Jim is NETA’s principal member on NFPA Technical Committee NFPA 70E®, Standard for Electrical Safety in the Workplace; NETA’s principal representative on National Electrical Code® Code-Making Panel (CMP) 13; and represents NETA on ASTM International Technical Committee F18, Electrical Protective Equipment for Workers. Jim is Shermco Industries’ principal member on NFPA Technical Committee for NFPA 70B, Recommended Practice for Electrical Equipment Maintenance and represents AWEA on the ANSI/ ISEA Standard 203, Secondary Single-Use Flame Resistant Protective Clothing for Use Over Primary Flame Resistant Protective Clothing. An IEEE Senior Member, Jim was Chairman of the IEEE Electrical Safety Workshop in 2008 and is currently Vice Chair for the IEEE IAS/PCIC Safety Subcommittee.

• Cables
• LV/MV Circuit Breakers
• Rotating Machinery
• Meters
• Automatic Transfer Switches
• Switchgear and Switchboard Assemblies
• LV/MV Switches
• Relays - All Types
• Motor Control Centers
• Grounding Systems
• Transformers
• Insulating Fluids
• Thermographic Surveys • Reclosers • Surge Arresters • Capacitors
• Batteries
• Ground Fault Systems
• Equipotential Ground Testing • Load Studies
• Transient Voltage Recording and Analysis
• Electromagnetic Field (EMF) Testing • Harmonic Investigation
• Replacement of Insulating Fluids
• Power Factor Studies

• Thousands of Air Circuit Breakers in Stock!
• Switchgear Line-ups you can't find anywhere else!
• Now Available as Reconditioned with AC-Pro Trip Units! 475 Annandale Blvd ·Annandale· Minnesota 55302 www.bullockbreakers.com • Email:jason@bullockbreakers.com
Over25 Yearsof Experience & Reliability
Acceptance Testing Services
Low , Medium , and High Voltage
Substations • Distributionswitchgear • Transformers • Cables • Relays
Preventative Maintenance & Testing
Switchgear
Infra-redsurveys• Circuitbreakers• Relaytesting and calibration
Transferswitches• Completemaintenance of ACB's-OCB's-SF6CB's
UPS&station battery maintenance• Gen load tests
Transformers
TTR• Powerfactor testing• Oiltesting andfield analysis
Oilreconditioning& reclaiming• field replacements
EngineeringServices
Arc-flash, short circuit, and coordination studies
Powerfactor correction • Power quality and harmonicstudies
Loadsurveys• Groundingsystem design
Trustus to keep yourbusinessup and running Callfor a free consultationtoday.
P: 781-767-0888 • Email: infrared ma@verizon net 152 Centre Street • Holbrook , MA 02343 www infraredbps.com
The NFPA 70B ~Committee met in Nashville, Cfennessee, in March 2019 to ~ontinue working on the NFPA 70B chapters. The narrative and explanatory sections in each chapter were moved to an annex. L + i
Whil l the curre b t -documenuitle indicates that _ with the objective of making 70B a standard 70B is a irecommended practice, it's actually will begin. The next meeting will be a pre-draft a guide. The work being done and keepi ng meeting in Septem ber 2019. the word "should" in the recommended 1 k tions moves his document closer to a true .,. .,. recommended practice.
The com ittee is cur rent ly divided into task groups, each with assigned cha J ters. T ask group reports are due to NFPA by August 2019.
Following this rewrite to make 70B a recommended practice, an additional rewrite

David Huffman has been with Power SystemsITesting, a NETA Accredited Company, since January JJ988 and is currently CEO. He graduated from CaliforniaState Univdrsity,Fresno,and is a licensedProfessionalElectricalEngineerin the state of Californiaas well as a N ETA LevelIV CertifiedTechnicianDavid is a NETA boardmember,1 NETA'sPrincipalRepresentativeto the NFPA 70B Committee, and servesas a memberof variousNETA committees.

• Full Member of the InterNational Electrical Testing Association (NETA)
• Licensed Electricians (IBEW-JIW)
• ISO/IEC 17025 Accredited
• Member of the National Electrical Contractors Association (NECA)
•Acceptance Testing •Preventative and Predictive Maintenance •Technical Support•Protective Relays • Transformers• Switchgear • Breakers • Infrared & Ultrasonic Survey • Cable Locating • VLF & Tan Delta Testing• Partial Discharge• Meters• Grounding• Generator Controls• ATS• UPS• Battery Systems • Motor Control Centers • Switches• Capacitor Banks


C57.104, IEEE Guide for The Interpretation of Gases Generated in Oil-Immersed Transformers (DGA) has undergone a significant revision that completely changes how DGA results should be interpreted for mineral-oil filled transformers. The last time the guide was revised was 2008. It has gone through numerous draft versions and multiple ballots, and hundreds of comments have been reviewed. The final draft went out for ballot in March 2019, and the comments were reviewed and voted on at the last IEEE Transformer Committee working group meeting on March 26, 2019. The next step is to submit the revised guide to IEEE for review and approval. If accepted, the guide is expected to be published later this year.
C57.166. The new Working Group for IEEE Guide C57.166, Guide for Acceptance and Maintenance of Insulating Liquids in Transformers and Related Equipment , continues to make progress. This new guide will incorporate and establish fluid quality thresholds for all fluid types. Currently, users have to reference a separate guide for a specific fluid type to research the minimum acceptable values. This guide will simplify accessing data for end-users. Much development work remains to be done regarding this new guide.
C57.146. Because of the high interest in C57.146, IEEE Guide for Interpretation of Gasses Generated in Silicone-Immersed Transformers (primarily for industrial plant applications), it was decided to keep the guide
active and to renew the par scheduled to expire December 31, 2021. A working group will be organized to start the review. However, since the information from C57.111, IEEE Guide for Acceptance of Silicone Insulating Fluid and Its Maintenance in Transformers and C57.121, IEEE Guide for Acceptance and Maintenance of Less-Flammable Hydrocarbon Fluid in Transformers will be included as part of the new C57.166 guide, it was decided to let these pars expire.
C57.93 , IEEE Guide for the Installation and Maintenance of Liquid Immersed Power Transformers was republished. This guide covers the installation and maintenance of transformers that are 501 kVA and larger, with a secondary voltage of 1,000 Volts or higher. The guide includes pad-mount and network transformers, but does not include specialty transformers such as furnace or rectifier transformers.
Transformer Condition Assessment Task. This task force met to continue to determine the title, scope, and purpose of this new guide so it can be a useful tool for performing a transformer condition assessment. The scope of the guide is to present existing condition assessment methodologies that quantify the current condition of liquid-immersed transformers, reactors, and their components. After the title, scope, and purpose are finalized, it will be submitted for approval to develop
a new guide. If approved, work can begin to develop this new guide.
C57.148. In other areas of the Power Transformer Subcommittee, it was recommended that C57.148, IEEE Guide for Control Cabinets for Power be sent out for ballot. Work continued to develop checklists for design reviews related to transportation, impact recorders, and shipping with natural ester within PC57.150/D10, Guide for the Transportation of Transformers and Reactors Rated 10,000 kVA or larger.
A new Bushing Overload Conditions Task Force was created, but is just getting started. In other areas, work continues on C57.19.00, IEEE Guide for The Standard General Requirements and Test Procedures for Power Apparatus Bushings. The goal is to have this revised guide published by 2020.
C57.127, IEEE Guide for the Detection of Acoustic Emissions from Partial Discharges in Oil-Immersed Power Transformers was approved and published. C57.160, IEEE Guide for the Electrical Measurement of PD in HV Bushing and Instrument Transformers went out for ballot, and the group is resolving comments.
A new Instrument Transformer Accuracy Task Force was formed. The first step will be to develop a title, scope, and purpose for this new group.
The C57.123 working group for IEEE Guide for Transformer Loss Measurement recommended the guide go out for ballot. The subcommittee approved unanimously. In the IEEE Guide for FRA for Liquid Filled Transformers, work continues toward reviewing grounding practices and fine tuning the analysis section of the test curves to help end-users.

Scott Reed is President of MVA Diagnostics, which specializes in the diagnostic analysis of oil in substation transformers throughout the United States. He received a BS in electrical engineering from North Carolina State University with a concentration in power and joined Baltimore Gas & Electric performing relay system protection design work. Scott serviced transformers, including vacuum filling, oil processing, repairing, electrical testing, and oil testing for 25 years before founding MVA Diagnostics. He has written and published various papers for the industry and is very active with the IEEE Transformer Committee, where he serves as Secretary of the IEEE Insulating Fluids Subcommittee; Vice Chairman of IEEE Std. C57.166, Acceptance and Maintenance of Insulating Liquids in Transformers; and Secretary of IEEE Std. C57.93, Installation and Maintenance of Liquid Immersed Power Transformers.

We've got answers.
Discoverpage after page of comprehensive,component-specific,technical resourcesfor training and referencepurposes.Over 200 of the very best articlesfrom NETA World Journaland technica l presentationsfrom NETA'sPowerTestconferences.
To order, please visit netaworld.orgor ca ll 888.300.6382


1. According to Georgia Tech’s “12 Emerging Technologies May Help Power Future,” several states have no wind generation facilities. In other states, wind generation is limited to the coast. I was surprised, as I thought wind generation was common throughout the United States. Any of these would be correct answers. These states do not have wind sites.
a. South Carolina
b. Arkansas
c. Georgia
Some states only have wind sites on their coasts.
a. Alabama
NFPA Disclaimer:
Although Jim White is a member of the NFPA Technical Committee for both NFPA 70E, Standard for Electrical Safety in the Workplace, and NFPA 70B, Recommended Practice for Electrical Equipment Maintenance, the views and opinions expressed in this column are purely the author’s and shall not be considered an official position of the NFPA or any of its technical committees and shall not be considered, nor be relied upon, as a formal interpretation or promotion of the NFPA. Readers are encouraged to refer to the entire text of all referenced documents.
b. North Carolina
c. Virginia


4. Business Insider’s “17 Emerging Energy Technologies” mentions several more. Any three would be satisfactory.
a. Tidal turbine: Converts the waves from tides to electricity.

b. Micro-sterling engines: Transforms energy into compression and expansion strokes. Can be 3-D printed to cover heat generating surfaces to generate electrical power.
c. Solar panel positioning robots: Small robots that re-position solar panels depending on weather conditions. More efficient than attached tracking systems.
d. Second-generation biofuels: Cellulosic ethanol and biodiesel from microalgae produce low to zero greenhouse gases.
e. Photovoltaic transparent glass: Uses IR to convert sunlight into electricity. Could be used in office buildings.
2. d. Stronium-90. Stronium-90 emits two high-energy electrons during its decay (halflife). Using an electron beam, researchers at Georgia Tech believe it could be 40,000 times more energy dense than lithium-ion batteries.
3. c. Coal. Utility Dives’ “Top 10 Trends Transforming the Electric Power Sector” states that 25,000 MW of coal capacity has been retired since 2009, and there are plans to retire that much more by 2022. Coal won’t go away completely, however. The EPA expects coal to be a major energy source through 2030, through the use of “clean coal” technology.
f. Space-based solar power: Collects solar energy in space and transmits it to Earth as microwaves. Much higher collection rate than current solar panels.
g. Micro-nuclear reactors: These small reactors, just a few tens of meters in length, can be shipped.
h. Thorium reactor: Uses thorium as a fuel in nuclear reactors. Produces 10 to 10,000 times less radioactive waste and does not require enrichment like uranium does.


NETA Training Committee Members
Talk to Career Technical Education Night Attendees
More students are taking advantage of the NETA Electrical Power Testing Technician program opportunity at Long Beach City College (LBCC) in California. The curriculum, which debuted in early 2018 at LBCC, is meant to attract those interested in a path to a career as an Electrical Power Testing Technician (EPTT). The program has also identified new NETA Certified Technicians as instructors for the program.
Fourteen students completed the first course of the curriculum, High Voltage Safety Awareness, in fall 2018. Twenty-two completed the course in spring 2019.
NETA continues to raise awareness about the program. On May 17, 2019, three NETA Accredited Companies (NACs) represented NETA at the LBCC Open House and first of its kind Career Technical Education (CTE) Night. During the free, trade show-style event, attendees and prospective students were greeted by members of the NETA Training Committee including Bob Sheppard, Premier Power Maintenance; Nenad Pasic, Tony Demaria Electric; and Ken Peterson, Hampton Tedder Technical Services. Tommy Reyes, Darwin Salvatierra, and Hayatt Salvatierra, all of Tony Demaria Electric, as well as two future LBCC instructors, Neil Sepulveda, PE, and Erfan Bamdad, PE, both with Tony Demaria Electric, assisted the committee members.
The NACs representing NETA raised awareness about the program and potential careers to local residents and prospective students. Numerous questions were answered and NETA promotional items distributed, leaving prospective students with a better idea about what a career in the electrical testing industry entails.
The NACs were joined by LBCC staff, including John Hauck, a retired LBCC Electrical Technology instructor who was instrumental in aligning the NETA Curriculum courses developed by Bob Sheppard with LBCC’s existing curriculum and the State of California Department of Education. Scott Fraser, LBCC Trades and Industry Department Chair and Electrical Technology Professor, also spent time at the NETA booth. Fraser is scheduled to participate in the upcoming NETA Member Meeting in San Diego on September 20, 2019.

LBCC Electrical Technology, NETA High Voltage Test Technician Associate in Science Degree Curriculum Guide
LBCC’s Electrical Technology Associate in Science degree with an emphasis in NETA High Voltage Test Technician curriculum is attainable for students. As the Curriculum Guide for Academic Year 2019-2020 indicates, the Associate of Science in NETA High Voltage Test Technician Certificate of Achievement will prepare students for entry-level employment in the high-voltage testing and certification industry.
All new students must attend an electrical orientation prior to enrollment to ensure the safety of LBCC electrical students. Upon

completion of the Electrical Technology Certificate of Achievement and the NETA High Voltage Test Technician Certificate of Achievement, the student should be able to test, maintain, and repair high-voltage electrical systems in a safe manner.
Required concentration courses for NETA High-Voltage Test Technician program include:
• ELECT 250 – Electrical Code–Industrial, 3 units
• ELECT 256 – High Voltage Safety Awareness, 1 unit
• ELECT 265 – Conductors, 2 units
• ELECT 266 – Circuit Breakers, 2 units
• ELECT 267 – Switchgear and Switchboards, 2 units
• ELECT 268 – Transformers, 2 units
The ELECT 250, Electrical Code–Industrial course is already taught by an LBCC instructor, while ELECT 256, High Voltage Safety Awareness, first offered in fall 2019, continues
to be taught by Mike Paik, PE, of Tony Demaria Electric.
Sepulveda and Bamdad have been identified as potential new instructors for the LBCC program, but there is still an ongoing need for more instructors. This would ensure faster program implementation, as well as continuous and additional course offerings each semester, and would speed up graduation of the first future NETA High Voltage Test Technicians. Interviews are conducted to assure that instructor candidates possess the required teaching skills; have been and are exposed to the industry, field work, and acceptance and maintenance testing; and have the professional level of skills and knowledge needed to teach the required LBCC concentration courses from the LBCC Electrical Technology, NETA High Voltage Test Technician program.
To express interest in becoming a EPTT instructor, contact Scott Fraser, LBCC department head of trades and industrial technology, at sfraser@lbcc.edu


Bob Sheppard is currently the Director of Sales and Marketing for Premier Power Maintenance. He is the company’s NETA Accredited Representative, and serves on various committees in the NETA organization. He earned a BS in electrical power at Idaho State University.
Nenad Pasic (Neno) is the NETA Accredited Representative and IT Manager for Tony Demaria Electric (TDE). Neno has been working with TDE for almost 20 years. He is a member of the NETA Training Committee and NETA Promotions and Marketing Committee. Neno is active in IEEE as a member of the IEEE Computer Society, IEEE Communications Society, and IEEE Information Theory Society. He is an NFPA Member, and an Electrical Section of the NFPA Member. Neno earned a BS in computer information systems, business administration from California State University–Dominguez Hills, and has earned project management and information technology management certificates from the University of California–Los Angeles (UCLA).
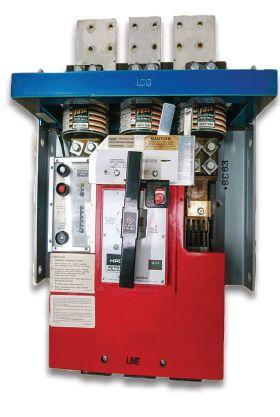

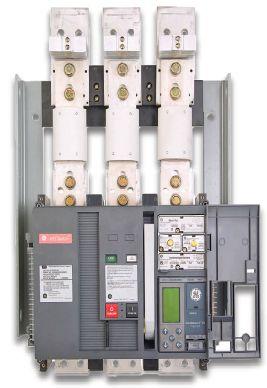





Former NETA President Kerry Heid was honored with the prestigious Award of Merit from the Canadian Standards Association at CSA’s 100th anniversary awards ceremony and gala on June 18, 2019, in Ottawa, Ontario.
Kerry was nominated by his peers and was strongly supported by members of the CSA Z462, Workplace Electrical Safety and CSA Z463, Maintenance of Electrical Systems technical committees. Heid currently chairs the Z463 Technical Committee and has been NETA’s representative to CSA since 2006.
The award was presented “in recognition of inspirational leadership, collaborative guidance, and relentless advocacy of the use of safety standards in the area of electrical hazard control.”
Kerry was honored for “leading the charge to ensure principles of equipment maintenance were made an integral part of the CSA Group’s Z462, Workplace Electrical Safety. He went on to gather industry support for a new standard on maintenance of electrical equipment, guided the development of the first CSA guideline on this subject, and spearheaded the effort to convert it into a National Standard of Canada. Despite conflicting views, the enormous challenge of changing a guideline into a standard, and the tight time-lines involved, Mr. Heid kept the work on track, and the standard was published on time. Thanks to his contributions as Technical Committee Chair, Z463 now parallels the basic requirements for equipment maintenance in the Canadian Electrical Code (CE Code) and connects those requirements with standards related to all industrial and commercial machinery and equipment.”
“What a huge surprise and an even bigger honor to receive national recognition,” Kerry says. “In the past 15 years, we established the Z462 (safety) and Z463 (maintenance) standards, and they have become world-class documents. At the end of the day, all we want is for everyone to come home safely.”
Kerry is President and CEO of Shermco Industries Canada. Since graduating as an Electrical Engineering Technologist, Kerry has spent 31 years in the electrical testing and engineering business. He served on NETA’s
“IN THE PAST 15 YEARS, WE ESTABLISHED THE Z462 (SAFETY) AND Z463 (MAINTENANCE) STANDARDS, AND THEY HAVE BECOME WORLD-CLASS DOCUMENTS. AT THE END OF THE DAY, ALL WE WANT IS FOR EVERYONE TO COME HOME SAFELY.”
board of directors from 2003 to 2013 (as President from 2006–2008), is a NETA Level IV Certified Technician, won NETA’s Outstanding Achievement Award in 2010, and continues to serve on various committees.
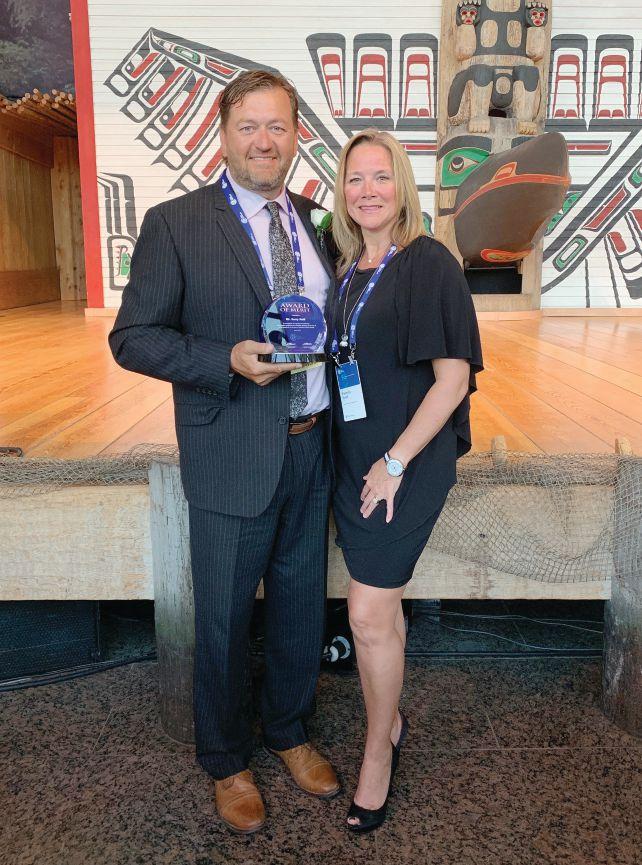
A&F Electrical Testing, Inc.
80 Lake Ave S Ste 10 Nesconset, NY 11767-1017 (631) 584-5625
kchilton@afelectricaltesting.com www.afelectricaltesting.com
Kevin Chilton
A&F Electrical Testing, Inc.
80 Broad St Fl 5 New York, NY 10004-2257 (631) 584-5625 afelectricaltesting@afelectricaltesting.com Florence Chilton
ABM Electrical Power Services, LLC
720 S Rochester Ste A Ontario, CA 91761-8177 (301) 397-3500 rob.parton@abm.com www.abm.com/electrical Rob Parton
ABM Electrical Power Services, LLC
1005 Windward Ridge Pkwy Alpharetta, GA 30005 (770) 521-7550
ABM Electrical Power Services, LLC
4221 Freidrich Lane Suite 170 Austin, TX 78744 (210) 347-9481
ABM Electrical Power Services, LLC
3600 Woodpark Blvd Ste G Charlotte, NC 28206-4210 (704) 273-6257
ABM Electrical Power Services, LLC
9800 E Geddes Ave Unit A-150 Englewood, CO 80112-9306 (303) 524-6560
ABM Electrical Power Services, LLC
6940 Koll Center Pkwy Suite# 100 Pleasanton, CA 94566 (408) 466-6920
ABM Electrical Power Services, LLC 6541 Meridien Dr Suite 113 Raleigh, NC 27616 (919) 877-1008
ABM Electrical Power Services, LLC 3585 Corporate Court San Diego, CA 92123-1844 (858) 754-7963
ABM Electrical Power Services, LLC
2631 S. Roosevelt St Tempe, AZ 85282 (602) 722-2423
ABM Electrical Power Solutions
4390 Parliament Place
Suite S Lanham, MD 20706 (301) 967-3500
Christopher.smith@abm.com www.abm.com
Christopher Smith
ABM Electrical Power Solutions
3700 Commerce Dr # 901-903 Baltimore, MD 21227-1642 (410) 247-3300
ABM Electrical Power Solutions
317 Commerce Park Drive Cranberry Township, PA 16066-6407 (724) 772-4638
Absolute Testing Services, Inc.
8100 West Little York Houston, TX 77040 (832) 467-4446 www.absolutetesting.com
Accessible Consulting Engineers, Inc. 1269 Pomona Rd Ste 111 Corona, CA 92882-7158 (951) 808-1040 info@acetesting.com www.acetesting.com Iraj Nasrolahi
Advanced Electrical Services 4999 - 43rd St. NE Unit 143 Calgary, AB T2B 3N4 Canada (403) 697-3747 zakhouk@aes-ab.com ww.aes-ab.com Zachary Houk
Advanced Testing Systems 15 Trowbridge Dr Bethel, CT 06801-2858 (203) 743-2001 pmaccarthy@advtest.com www.advtest.com
Pat MacCarthy
American Electrical Testing Co., LLC 25 Forbes Boulevard Suite 1 Foxboro, MA 02035 (781) 821-0121
sblizard@aetco.us www.aetco.us
Scott Blizard
American Electrical Testing Co., LLC
Green Hills Commerce Center 5925 Tilghman St Ste 200 Allentown, PA 18104-9158 (484) 538-2272 jmunley@aetco.us
Jonathan Munley
American Electrical Testing Co., LLC
91 Fulton St., Unit 4 Boonton, NJ 07005-1060 (973) 316-1180
jsomol@aetco.us
Jeff Somol
American Electrical Testing Co., LLC 76 Cain Dr Brentwood, NY 11717-1265 (631) 617-5330 bfernandez@aetco.us
Billy Fernandez
American Electrical Testing Co., LLC 34 Clover Dr South Windsor, CT 06074-2931 (860) 648-1013
jpoulin@aetco.us
Gerald Poulin
AMP Quality Energy Services, LLC
352 Turney Ridge Rd Somerville, AL 35670 (256) 513-8255 brian@ampqes.com
Brian Rodgers
Apparatus Testing and Engineering
11300 Sanders Dr Ste 29 Rancho Cordova, CA 95742-6822 (916) 853-6280 info@apparatustesting.com www.apparatustesting.com
Harold (Jerry) Carr
Apparatus Testing and Engineering 7083 Commerce Cir Ste H Pleasanton, CA 94588-8017 (916) 853-6280
Applied Engineering Concepts 894 N Fair Oaks Ave. Pasadena, CA 91103 (626) 389-2108 michel.c@aec-us.com www.aec-us.com
Michel Castonguay
Applied Engineering Concepts 8160 Miramar Road San Diego, CA 92126 (619) 822-1106 michel.c@aec-us.com www.aec-us.com
Michel Castonguay
BEC Testing 50 Gazza Blvd Farmingdale, NY 11735-1402 (631) 393-6800 ddevlin@banaelectric.com www.bectesting.com
Daniel Devlin
Burlington Electrical Testing Co., Inc.
300 Cedar Ave Croydon, PA 19021-6051 (215) 826-9400
waltc@betest.com www.betest.com
Walter P. Cleary
Burlington Electrical Testing Co., Inc. 846 Waterford Drive Delran, NJ 08075 (609) 267-4126
C.E. Testing, Inc. 6148 Tim Crews Rd Macclenny, FL 32063-4036 (904) 653-1900 cetesting@hotmail.com www.cetestinginc.com
Mark Chapman
CE Power Engineered Services, LLC 4040 Rev Drive Cincinnati, OH 45232 (800) 434-0415 info@cepower.net
Jerry Daugherty
CE Power Engineered Services, LLC 10338 Citation Drive Suite 300 Brighton, MI 48116 (810) 229-6628 ken.lesperance@cepower.net
Ken L’Esperance
CE Power Engineered Services, LLC 18940 York Street NW Elk River, MN 55330 (877) 968-0281 jason.thompson@cepower.net
Jason Thompson
CE Power Engineered Services, LLC 1260 Industrial Park Eveleth, MN 55734 (218) 744-4200
Joseph Peterson
CE Power Engineered Services, LLC 8490 Seward Rd. Fairfield, OH 45011 (800) 434-0415 info@cepower.net
Jerry Daugherty
CE Power Engineered Services, LLC 72 Sanford Drive Gorham, ME 04038 (800) 649-6314 mike.roach@cepower.net
Michael Roach
CE Power Engineered Services, LLC 10840 Murdock Drive Knoxville, TN 37932 (800) 434-0415 don.williams@cepower.net
Don Williams
CE Power Engineered Services, LLC
1803 Taylor Ave. Louisville, KY 40213 (800) 434-0415
joe.psillos@cepower.net
Joe Psillos
CE Power Engineered Services, LLC
3496 E. 83rd Place Merrillville, IN 46410 (219) 942-2346
lucas.gallagher@cepower.net
Lucas Gallagher
CE Power Engineered Services, LLC
480 Cave Rd Nashville, TN 37210-2302 (615) 882-9455
dave.mitchell@cepower.net
Dave Mitchell
CE Power Engineered Services, LLC
40 Washington St Westborough, MA 01581-1088 (508) 881-3911
jim.cialdea@cepower.net www.cepower.net
Jim Cialdea
CE Power Solutions of Florida, LLC
3502 Riga Blvd., Suite C Tampa, FL 33619 (866) 439-2992
robert.bordas@cepowersol.com www.cepowersol.com
Robert Bordas
CE Power Solutions of Florida, LLC
3801 SW 47th Avenue Suite 505 Davie, FL 33314 (866) 439-2992
robert.bordas@cepowersol.com www.cepowersol.com
Robert Bordas
Control Power Concepts
3750 Las Vegas Blvd S. Unit 3303 Las Vegas, NV 89158 (702) 448-7833 jtravis@ctrlpwr.com www.controlpowerconcepts.com
John Travis
Dude Electrical Testing, LLC
145 Tower Drive, Unit 9 Burr Ridge, IL 60527-7840 (815) 293-3388
scott.dude@dudetesting.com www.dudetesting.com
Scott Dude
Eastern High Voltage, Inc. 11A S Gold Dr Robbinsville, NJ 08691-1685 (609) 890-8300
bobwilson@easternhighvoltage.com www.easternhighvoltage.com
Robert Wilson
ELECT, P.C.
375 E. Third Street Wendell, NC 27591 (919) 365-9775
btyndall@elect-pc.com www.elect-pc.com
Barry W. Tyndall
Electek Power Services, Inc. 870 Confederation Street
Sarnia, ON N7T2E5 (519) 383-0333
tvanderheide@electek.ca
Tim Vanderheide
Electric Power Systems, Inc. 21 Millpark Ct Maryland Heights, MO 63043-3536 (314) 890-9999 s.reed@epsii.com www.epsii.com
Steve Reed
Electric Power Systems, Inc. 8515 Calle Alameda NE Ste A Albuquerque, NM 87113 (505) 792-7761
Bill Lewis
Electric Power Systems, Inc.
306 Ashcake Road suite A Ashland, VA 23005 (804) 526-6794
Chris Price
Electric Power Systems, Inc. 7308 Aspen Lane North Suite 160 Brooklyn Park, MN 55428 (763) 315-3520
Paul Cervantez
Electric Power Systems, Inc. 56 Bibber Pkwy # 1 Brunswick, ME 04011-7357 (207) 837-6527
Electric Power Systems, Inc. 2888 Nationwide Parkway 2nd Floor Brunswick, OH 44212 (330) 460-3706
Garth Paul
Electric Power Systems, Inc. 11211 E. Arapahoe Rd Ste 108 Centennial, CO 80112 (720) 857-7273
Thomas Reed
Electric Power Systems, Inc. 140 Lakefront Drive Cockeysville, MD 21030 (443) 689-2220
Chris Myers
Electric Power Systems, Inc. 1090 Montour West Ind Park Coraopolis, PA 15108-9307 (412) 276-4559
Ed Nahm
Electric Power Systems, Inc. 1230 N Hobson St. Suite 101 Gilbert, AZ 85233 (480) 633-1490
Louis Gilbert
Electric Power Systems, Inc. 1129 E Highway 30 Gonzales, LA 70737-4759 (225) 644-0150
Electric Power Systems, Inc. 7169 East 87th St. Indianapolis, IN 46256 (317) 941-7502
Daniel Douglas
Electric Power Systems, Inc. 6141 E Connecticut Ave Kansas City, MO 64120-1346 (816) 241-9990
Joe Dillon
Electric Power Systems, Inc. 5850 Polaris Ave., Suite 1600 Las Vegas, NV 89118 (702) 815-1342
Devin Hopkins
Electric Power Systems, Inc. 54 Eisenhower Lane North Lombard, IL 60148 (815) 577-9515
George Bratkiv
Electric Power Systems, Inc. 915 Holt Ave Unit 9 Manchester, NH 03109-5606 (603) 657-7371
Cindy Taylor
Electric Power Systems, Inc. 684 Melrose Avenue Nashville, TN 37211-3121 (615) 834-0999
Larry Christodoulou
Electric Power Systems, Inc. 6679 Peachtree Industrial Dr. Suite H Norcross, GA 30092 (770) 416-0684
Jeremy Russell
Electric Power Systems, Inc. 3209 Gresham Lake Rd. Suite 155 Raleigh, NC 27615 (919) 210-5405
Ray Livingston
Electric Power Systems, Inc. 783 N. Grove Rd Suite 101 Richardson, TX 75081 (214) 821-3311
Thomas Coon
Electric Power Systems, Inc. 11861 Longsdorf St Riverview, MI 48193-4250 (734) 282-3311
t.lindemann@eps-international.com
Teresa Lindemann
Electric Power Systems, Inc. 120 Turner Road Salem, VA 24153-5120 (540) 375-0084
Virginia@EPS-International.com
Bruce Eppers
Electric Power Systems, Inc. 7925 Dunbrook Rd. Suite G San Diego, CA 92126 (858) 566-6317
Devin Hopkins
Electric Power Systems, Inc. 3806 Caboose Place Sanford, FL 32771 (407) 578-6424
Doug Pacey
Electric Power Systems, Inc. 1330 Industrial Blvd. Suite 300 Sugar Land, TX 77478 (713) 644-5400
Houston@eps-international.com
Electrical & Electronic Controls 6149 Hunter Rd Ooltewah, TN 37363-8762 (423) 344-7666
eecontrols@comcast.net
Michael Hughes
Electrical Energy Experts, LLC W129N10818 Washington Dr Germantown, WI 53022-4446 (262) 255-5222
tim@electricalenergyexperts.com www.electricalenergyexperts.com
Tim Casey
Electrical Engineering & Service Co. Inc. 289 Centre St. Holbrook, MA 02343 (781) 767-9988
jcipolla@eescousa.com www.eescousa.com
Joe Cipolla
Electrical Equipment Upgrading, Inc.
21 Telfair Pl Savannah, GA 31415-9518 (912) 232-7402 kmiller@eeu-inc.com www.eeu-inc.com
Kevin Miller
Electrical Maintenance & Testing, Inc.
12342 Hancock St Carmel, IN 46032-5807 (317) 853-6795 brian.borst@emtesting.com www.emtesting.com
Brian Borst
Electrical Reliability Services
610 Executive Campus Dr Westerville, OH 43082-8870 (877) 468-6384 info@electricalreliability.com
Electrical Reliability Services
8500 Washington St NE Ste A6 Albuquerque, NM 87113-1861 (505) 822-0237
Electrical Reliability Services
2222 W Valley Hwy N Ste 160 Auburn, WA 98001-1655 (253) 736-6010
Electrical Reliability Services
5909 Sea Lion Pl Ste C Carlsbad, CA 92010-6634 (858) 695-9551
Electrical Reliability Services
221 E. Willis Road, Suite 3 Chandler, AZ 85286 (480) 966-4568
Electrical Reliability Services
7100 Broadway Ste 7E Denver, CO 80221-2900 (303) 427-8809
Electrical Reliability Services
1057 Doniphan Park Cir Ste A El Paso, TX 79922-1329 (915) 587-9440
Electrical Reliability Services
11000 Metro Pkwy Ste 30 Fort Myers, FL 33966-1244 (239) 693-7100
Electrical Reliability Services
3535 Emerson Pkwy Suite A Gonzales, LA 70737 (225) 755-0530
Electrical Reliability Services
1426 Sens Rd. Ste. #5 La Porte, TX 77571-9656 (281) 241-2800
Electrical Reliability Services
6351 Hinson Street, Suite A Las Vegas, NV 89118-6851 (702) 597-0020
Electrical Reliability Services
400 NW Capital Dr Lees Summit, MO 64086-4723 (816) 525-7156
Electrical Reliability Services
2275 Northwest Pkwy SE Ste 180 Marietta, GA 30067-9319 (770) 541-6600
Electrical Reliability Services
4099 SE International Way Ste 201 Milwaukie, OR 97222-8853 (503) 653-6781
Electrical Reliability Services
6900 Koll Center Pkwy Ste 415 Pleasanton, CA 94566-3119 (925) 485-3400
Electrical Reliability Services
9736 South Sandy Pkwy 500 West Sandy, UT 84070 (801) 975-6461
Electrical Reliability Services
10606 Bloomfield Ave Santa Fe Springs, CA 90670-3912 (562) 236-9555
Electrical Reliability Services
9636 Saint Vincent Ave Unit A Shreveport, LA 71106-7127 (318) 869-4244
Electrical Reliability Services
1380 Greg St. Ste. 216 Sparks, NV 89431-6070 (775) 746-8484
Electrical Reliability Services
245 Hood Road Sulphur, LA 70665-8747 (337) 583-2411
Electrical Testing and Maintenance Corp.
3673 Cherry Rd Ste 101 Memphis, TN 38118-6313 (901) 566-5557
r.gregory@etmcorp.net www.etmcorp.net
Ron Gregory
Electrical Testing Solutions 2909 Greenhill Ct Oshkosh, WI 54904-9769 (920) 420-2986
tmachado@electricaltestingsolutions.com
Tito Machado
Electrical Testing, Inc. 2671 Cedartown Hwy SE Rome, GA 30161-3894 (706) 234-7623
jamie@electricaltestinginc.com www.electricaltestinginc.com
Jamie Dempsey
Elemco Services, Inc.
228 Merrick Rd Lynbrook, NY 11563-2622 (631) 589-6343 courtney@elemco.com www.elemco.com
Courtney Gallo
EnerG Test, LLC 206 Gale Lane Kennett Square, PA 19348 (484) 731-0200
KMatthews@energtest.com www.energtest.com
Kevin Matthews
Energis High Voltage Resources 1361 Glory Rd Green Bay, WI 54304-5640 (920) 632-7929
info@energisinc.com www.energisinc.com
EPS Technology 37 Ozick Dr. Durham, CT 06422 (203) 679-0145 s.miller@eps-technology.com www.eps-technology.com
Sean Miller
Giga Electrical & Technical Services, Inc.
2743A N. San Fernando Road Los Angeles, CA 90065 (323) 255-5894 gigaelectrical@att.net www.gigaelectrical-ca.com
Hermin Machacon
Grubb Engineering, Inc. 2727 North Saint Mary’s St. San Antonio, TX 78212 (210) 658-7250
joy@grubbengineering.com www.grubbengineering.com
Robert D. Grubb Jr.
Halco Testing Services 5773 Venice Boulevard Los Angeles, CA 90019 (323) 933-9431 d.genutis@halco.net www.halcotestingservices.com
Don Genutis
Hampton Tedder Technical Services 4563 State St Montclair, CA 91763-6129 (909) 628-1256 x271
Chasen.tedder@hamptontedder.com www.hamptontedder.com
Chasen Tedder
Hampton Tedder Technical Services 4113 Wagon Trail Ave. Las Vegas, NV 89118 (702) 452-9200
Roger Cates
Hampton Tedder Technical Services 3747 W Roanoke Ave Phoenix, AZ 85009-1359 (480) 967-7765 Linc McNitt
Harford Electrical Testing Co., Inc. 1108 Clayton Rd Joppa, MD 21085-3409 (410) 679-4477 testing@harfordtesting.com www.harfordtesting.com
Vincent Biondino
High Energy Electrical Testing, Inc. 515 S Ocean Ave Seaside Park, NJ 08752-1843 (732) 938-2275 judylee@highenergyelectrical.com www.highenergyelectric.com
High Voltage Maintenance Corp. 5100 Energy Dr Dayton, OH 45414-3525 (937) 278-0811
High Voltage Maintenance Corp. 29 Diana Court Cheshire, CT 06410 (203) 949-2650 www.hvmcorp.com
High Voltage Maintenance Corp. 941 Busse Rd Elk Grove Village, IL 60007-2400 (847) 640-0005
High Voltage Maintenance Corp. 1052 Greenwood Springs Rd. Suite E Greenwood, IN 46143 (317) 322-2055
High Voltage Maintenance Corp. 14300 Cherry Lane Court Suite 115 Laurel, MD 20707 (410) 279-0798
High Voltage Maintenance Corp. 10704 Electron Drive Louisville, KY 40299 (859) 371-5355
High Voltage Maintenance Corp.
8787 Tyler Blvd. Mentor, IN 44061 (440) 951-2706
High Voltage Maintenance Corp.
3000 S Calhoun Rd New Berlin, WI 53151-3549 (262) 784-3660
High Voltage Maintenance Corp.
1 Penn Plaza Suite 500 New York, NY 10119 (718) 239-0359
High Voltage Maintenance Corp.
24371 Catherine Industrial Dr Ste 207 Novi, MI 48375-2422 (248) 305-5596
High Voltage Maintenance Corp.
355 Vista Park Dr Pittsburgh, PA 15205-1206 (412) 747-0550
High Voltage Maintenance Corp.
24 Walpole Park S Walpole, MA 02081-2541 (508) 668-9205 www.hvmcorp.com
HMT, Inc.
6268 State Route 31 Cicero, NY 13039-9217 (315) 699-5563
jack.mcdonnell@resapower.com www.hmt-electric.com
Jack McDonnell
Industrial Tests, Inc. 4021 Alvis Ct Ste 1 Rocklin, CA 95677-4031 (916) 296-1200 greg@indtest.com www.industrialtests.com
Greg Poole
Infra-Red Building and Power Service, Inc. 152 Centre St Holbrook, MA 02343-1011 (781) 767-0888
Tom.McDonald@infraredbps.com www.infraredbps.com
Thomas McDonald Sr.
J.G. Electrical Testing Corporation 3092 Shafto Road Suite 13 Tinton Falls, NJ 07753 (732) 217-1908 www.jgelectricaltesting.com h.trinkowsky@jgelectricaltesting.com
Howard Trinkowsky
M&L Power Systems, Inc.
109 White Oak Ln Ste 82 Old Bridge, NJ 08857-1980 (732) 679-1800
milind@mlpower.com www.mlpower.com
Milind Bagle
Magna IV Engineering 1103 Parsons Rd. SW Edmonton, AB T6X 0X2 Canada (780) 462-3111 info@magnaiv.com www.magnaiv.com Virginia Balitski
Magna IV Engineering 106, 4268 Lozells Ave Burnaby, BC VSA 0C6 (604) 421-8020
Scott Nixon
Magna IV Engineering Suite 200, 688 Heritage Dr. SE Calgary, AB T2H 1M6 Canada (403) 723-0575
Magna IV Engineering
96 Inverness Dr E Ste R Englewood, CO 80112-5311 (303) 799-1273 info.denver@magnaiv.com
Kevin Halma
Magna IV Engineering 141 Fox Cresent Fort McMurray, AB T9K 0C1 Canada (780) 791-3122 Info.fmcmurray@magnaiv.com
Ryan Morgan
Magna IV Engineering Avenida del Condor sur #590 Oficina 601 Huechuraba, 8580676 +(56) -2-26552600 info.chile@magnaiv.com Harvey Mendoza
Magna IV Engineering 4407 Halik Street Building E Suite 300 Pearland, TX 77581 (346) 221-2165 info.houston@magnaiv.com aproskurniak@magnaiv.com
Aric Proskurniak
Magna IV Engineering 3124 Millar Ave. Saskatoon, SK S7K 5Y2 (306) 713-2167 info.saskatoon@magnaiv.com
Adam Jaques
Midwest Engineering Consultants, Ltd. 2500 36th Ave Moline, IL 61265-6954 (309) 764-1561
m-moorehead@midwestengr.com www.Midwestengr.com
Monte Moorehead
MTA Electrical Engineers 350 Pauma Place Escondido, CA 92029 (760) 658-6098 tim@mtaee.com
Timothy Shaw
National Field Services 651 Franklin Lewisville, TX 75057-2301 (972) 420-0157 www.natlfield.com
Eric Beckman
National Field Services
1890 A South Hwy 35 Alvin, TX 77511 (800) 420-0157
Jonathan.wakeland@natlfield.com www.natlfield.ocm
Jonathan Wakeland
National Field Services 3711 Regulus Ave. Las Vegas, NV 89102 (888) 296-0625
www.natlfield.com howard.herndon@natlfield.com
Howard Herndon
National Field Services 2900 Vassar St. #114 Reno, NV 89502 (775) 410-0430 www.natlfield.com howard.herndon@natlfield.com
Howard Herndon
National Field Services 1405 United Drive Suite 113-115 San Marcos, TX 78666 (800) 420-0157 matt.lacoss@natlfield.com www.natlfield.com
Matthew LaCoss
Nationwide Electrical Testing, Inc. 6050 Southard Trce Cumming, GA 30040-6343 (770) 667-1875
Shashi@N-E-T-Inc.com www.n-e-t-inc.com
Shashikant B. Bagle
North Central Electric, Inc. 69 Midway Ave Hulmeville, PA 19047-5827 (215) 945-7632
ncetest@aol.com www.ncetest.com
Robert Messina
Northern Electrical Testing, Inc. 1991 Woodslee Dr Troy, MI 48083-2236 (248) 689-8980 ldetterman@northerntesting.com www.northerntesting.com
Lyle Detterman
Orbis Engineering Field Services Ltd. #300, 9404 - 41st Ave. Edmonton, AB T6E 6G8 Canada (780) 988-1455 accountspayable@orbisengineering.net www.orbisengineering.net
Orbis Engineering Field Services Ltd. #228 - 18 Royal Vista Link NW Calgary, AB T3R 0K4 Canada (403) 374-0051
Amin Kassam
Orbis Engineering Field Services Ltd. Badajoz #45, Piso 17 Las Condes, Santiago Chile +56 2 29402343 framos@orbisengineering.net Felipe Ramos
Pace Technologies, Inc. 9604 - 41 Avenue NW Edmonton, AB T6E 6G9 Canada (780) 450-0404 www.pacetechnologies.com cleavitt@pacetechnologies.com Craig Leavitt
Pace Technologies, Inc. #10, 883 McCurdy Place Kelowna, BC V1X 8C8 (250) 712-0091
Pacific Power Testing, Inc. 14280 Doolittle Dr San Leandro, CA 94577-5542 (510) 351-8811 steve@pacificpowertesting.com www.pacificpowertesting.com
Steve Emmert
Pacific Powertech Inc. #110, 2071 Kingsway Ave. Port Coquitlam, BC V3C 6N2 (604) 944-6697 www.pacificpowertech.ca jkonkin@pacificpowertech.ca
Josh Konklin
Phasor Engineering
Sabaneta Industrial Park #216 Mercedita, PR 00715 (787) 844-9366
rcastro@phasorinc.com www.phasorinc.com
Rafael Castro
Potomac Testing, Inc.
1610 Professional Blvd Ste A Crofton, MD 21114-2051 (301) 352-1930
kbassett@potomactesting.com www.potomactesting.com
Ken Bassett
Power Engineering Services, Inc. 9179 Shadow Creek Ln Converse, TX 78109-2041 (210) 590-4936 dstaudt@pe-svcs.com www.pe-svcs.com
Daniel Staudt
POWER PLUS Engineering, Inc. 47119 Cartier Court Wixom, MI 48393-2872 (248) 896-0200
Power Products & Solutions, LLC
6605 W WT Harris Blvd Suite F Charlotte, NC 28269 (704) 573-0420 x12
adis.talovic@powerproducts.biz www.powerproducts.biz
Adis Talovic
Power Products & Solutions, LLC 9481 Industrial Center Dr. Unit 5 Ladson, SC 29456 (844) 383-8617 www.powerproducts.biz
Power Products & Solutions, LLC 13 Jenkins Ct Mauldin, SC 29662-2414 (800) 328-7382 raymond.pesaturo@powerproducts.biz www.powerproducts.biz
Raymond Pesaturo
Power Solutions Group, Ltd. 425 W Kerr Rd Tipp City, OH 45371-2843 (937) 506-8444
bwilloughby@powersolutionsgroup.com www.powersolutionsgroup.com
Barry Willoughby
Power Solutions Group, Ltd. 172 B-Industrial Dr. Clarksville, TN 37040 (931) 572-8591
Chris Brown
Power Solutions Group, Ltd. 2739 Sawbury Blvd. Columbus, OH 43235 (614) 310-8018
sspohn@powersolutionsgroup.com www.powersolutionsgroup.com
Stuart Spohn
Power Solutions Group, Ltd. 5115 Old Greenville Highway Liberty, SC 29657 (864) 540-8434 fcrawford@powersolutionsgroup.com www.powersolutionsgroup.com
Anthony Crawford
Power Systems Testing Co. 4688 W Jennifer Ave Ste 108 Fresno, CA 93722-6418 (559) 275-2171 ext 15 dave@pstcpower.com www.powersystemstesting.com
David Huffman
Power Systems Testing Co.
6736 Preston Ave Ste E Livermore, CA 94551-8521 (510) 783-5096
Power Systems Testing Co.
600 S Grand Ave Ste 113 Santa Ana, CA 92705-4152 (714) 542-6089
Power Test, Inc.
2200 Highway 49 S Harrisburg, NC 28075-7506 (704) 200-8311 rich@powertestinc.com www.powertestinc.com
Rich Walker
POWER Testing and Energization, Inc. 14006 NW 3rd Ct Ste 101 Vancouver, WA 98685-5793 (360) 597-2800 www.powerte.com
POWER Testing and Energization, Inc. 1041 Red Ventures Dr. Suite 105 Fort Mill, SC 29707 (803) 835-5900
POWER Testing and Energization, Inc.
303 US Route One Freeport, ME 04032 (207) 869-1200
POWER Testing and Energization, Inc. 16825 Northchase Drive Houston, TX 77060 (281) 765-5536
POWER Testing and Energization, Inc. 12755 Olive Blvd., Suite 100 Saint Louis, MO 63141 (314) 851-4065
Powertech Services, Inc. 4095 Dye Rd Swartz Creek, MI 48473-1570 (810) 720-2280
kirkd@powertechservices.com www.powertechservices.com
Kirk Dyszlewski
Precision Testing Group 5475 Highway 86 Unit 1 Elizabeth, CO 80107-7451 (303) 621-2776
Premier Power Maintenance Corporation 4035 Championship Drive Indianapolis, IN 46268 (317) 879-0660
kevin.templeman@premierpower.us
Kevin Templeman
Premier Power Maintenance Corporation 2725 Jason Rd Ashland, KY 41102-7756 (606) 929-5969
jay.milstead@premierpower.us www.premierpowermaintenance.com
Jason Milstead
Premier Power Maintenance Corporation 7301 E County Road 142 Blytheville, AR 72315-6917 (870) 762-2100
Kevin.Templeman@premierpower.us Kevin Templeman
Premier Power Maintenance Corporation 7262 Kensington Rd. Brighton, MI 48116 (517) 230-6620
Brian.Ellegiers@premierpower.us Brian Ellegiers
Premier Power Maintenance Corporation 4537 S Nucor Rd. Crawfordsville, IN 47933 (317) 879-0660
kevin.templeman@premierpower.us
Kevin Templeman
Premier Power Maintenance Corporation 3066 Finley Island Cir NW Decatur, AL 35601-8800 (256) 355-1444
johnnie.mcclung@premierpower.us
Johnnie McClung
Premier Power Maintenance Corporation 4301 Iverson Blvd Ste H Trinity, AL 35673-6641 (256) 355-3006
Kevin.Templeman@premierpower.us
Kevin Templeman
RESA Power Service
46918 Liberty Dr Wixom, MI 48393-3600 (248) 313-6868
bruce.robinson@resapower.com www.resapower.com
Bruce Robbinson
RESA Power Service
3890 Pheasant Ridge Dr. NE Suite 170 Blaine, MN 55449 (763) 784-4040 Michael.mavetz@resapower.com
Mike Mavetz
RESA Power Service 13837 Bettencourt Street Cerritos, CA 90703 (800) 996-9975 roger.torrices@resapower.com
Roger Torrices
RESA Power Service 311 Bay Avenue A Highlands, NJ 07732 (888) 996-9975
RESA Power Service
19621 Solar Circle, 101 Parker, CO 80134 (303) 781-2560
Jody Medina
RESA Power Service 1401 Mercantile Court Plant City, FL 33563 (813) 752-6550
RESA Power Service 2390 Zanker Road San Jose, CA 95131 (800) 576-7372 roger.torrices@resapower.com
Roger Torrices
RESA Power Service
4540 Boyce Parkway Stow, OH 44224 (800) 264-1549
REV Engineering Ltd.
3236 - 50 Avenue SE Calgary, AB T2B 3A3 Canada (403) 287-0156 rdavidson@reveng.ca www.reveng.ca
Roland Nicholas Davidson, IV
Rondar Inc.
333 Centennial Parkway North Hamilton, ON L8E2X6 (905) 561-2808 www.rondar.com rshaikh@rondar.com Rajeel Shaikh
Rondar Inc.
9-160 Konrad Crescent Markham, ON L3R9T9 (905) 943-7640 www.rondar.com
Saber Power Services, LLC
9841 Saber Power Ln Rosharon, TX 77583-5188 (713) 222-9102 info@saberpower.com www.saberpower.com
Saber Power Services, LLC 14617 Perkins Road Baton Rouge, LA 70810 (225) 726-7793
Saber Power Services, LLC
1315 FM 1187 Suite 105 Mansfield, TX 76063 (682) 518-3676
Saber Power Services, LLC
4703 Shavano Oak Suite 104 San Antonio, TX 78249 (210) 267-7282
Scott Testing, Inc. 245 Whitehead Rd Hamilton, NJ 08619 (609) 689-3400 rsorbello@scotttesting.com www.scotttesting.com Russ Sorbello
Sentinel Field Services, LLC 7517 E Pine St Tulsa, OK 74115-5729 (918) 359-0350 gellis@spstulsa.com Greg Ellis
Shermco Industries 2425 E Pioneer Dr Irving, TX 75061-8919 (972) 793-5523 info@shermco.com www.shermco.com
Shermco Industries 33002 FM 2004 Angleton, TX 77515-8157 (979) 848-1406 info@shermco.com
Shermco Industries Boulevard Saint-Michel 47 1040 Brussels Brussels, Belgium +32 (0)2 400 00 54 info@shermco.com
Shermco Industries 1705 Hur Industrial Blvd Cedar Park, TX 78613-7229 (512) 267-4800 info@shermco.com
Shermco Industries 2100 Dixon Street Suite C Des Moines, IA 50316-2174 (515) 263-8482 info@shermco.com
Shermco Industries 1720 S. Sonny Ave. Gonzales, LA 70737 (225) 647-9301 info@shermco.com
Shermco Industries 4383 Professional Parkway Groveport, OH 43125 (614) 836-8556 info@shermco.com
Shermco Industries 1711 Hawkeye Dr. Hiawatha, IA 52233 (319) 377-3377 info@shermco.com
Shermco Industries 3807 S Sam Houston Pkwy W Houston, TX 77056 (281) 835-3633 info@shermco.com
Shermco Industries 5145 NW Beaver Dr. Johnston, IA 50131 (515) 265-3377 info@shermco.com
Shermco Industries 12796 Currie Court Livonia, MI 48150 (734) 469-4050 info@shermco.com
Shermco Industries 501 Union West Blvd. Matthews, NC 28104 (910) 568-1053 info@shermco.com
Shermco Industries 112 Industrial Drive Minooka, IL 60447-9557 (815) 467-5577 info@shermco.com
Shermco Industries 5211 Linbar Dr. Suite 507 Nashville, TN 37211 (615) 928-1182 info@shermco.com
Shermco Industries 4670 G. Street Omaha, NE 68117 (402) 933-8988 info@shermco.com
Shermco Industries 2901 Turtle Creek Dr. Port Arthur, TX 77642 (409) 853-4316 info@shermco.com
Shermco Industries 998 E. Berwood Ave. Saint Paul, MN 55110 (651) 484-5533 info@shermco.com
Shermco Industries 12000 Network Blvd Buidling D, Suite 410 San Antonio, TX 78249-3354 (210) 877-9090 info@shermco.com
Shermco Industries 5805 Hwy 43 Satsuma, AL 36507 (251) 679-3224 info@shermco.com
Shermco Industries 5805 Hwy 43 Satsuma, AL 36507 (251) 679-3224 info@shermco.com
Shermco Industries 1301 Hailey St. Sweetwater, TX 79556 (325) 236-9900 info@shermco.com
Shermco Industries 4510 South 86th East Ave. Tulsa, OK 74145 (918) 234-2300 info@shermco.com
Shermco Industries Canada 1033 Kearns Crescent RM of Sherwood, SK S4K 0A2 (306) 949-8131 www.shermco.com
Shermco Industries Canada 3434 25th Street NE Calgary, AB T1Y 6C1 Canada (403) 769-9300 info@shermco.com
Shermco Industries Canada 3731 - 98 Street Edmonton, AB T6E 5N2 Canada (780) 436-8831 info@shermco.com
Shermco Industries Canada 233 Faithfull Cr. Saskatoon, SK S7K 8H7 (306) 955-8131 info@shermco.com
Shermco Industries Canada 1375 Church Avenue Winnipeg, MB R2X 2T7 (204) 925-4022 info@shermco.com
Sigma Six Solutions, Inc. 2200 W Valley Hwy N Ste 100 Auburn, WA 98001-1654 (253) 333-9730 jwhite@sigmasix.com www.sigmasix.com John White
Southern New England Electrical Testing, LLC 3 Buel St Ste 4 Wallingford, CT 06492-2395 (203) 269-8778 dave.asplund@sneet.org www.sneet.org
Dave Asplund, Sr.
Southwest Energy Systems, LLC 2231 E Jones Ave Ste A Phoenix, AZ 85040-1475 (602) 438-7500
Dave.hoffman@sesphx.com www.southwestenergysystems.com
Dave Hoffman
Star Electrical Services & General Supplies, Inc. PO Box 814 Las Piedras, PR 00771 (787) 716-0925 ahernandez@starelectricalpr.com www.starelectricalpr.com Abelardo Hernandez
Taurus Power & Controls, Inc. 9999 SW Avery St Tualatin, OR 97062-9517 (503) 692-9004
robtaurus@tauruspower.com www.tauruspower.com
Rob Bulfinch
Taurus Power & Controls, Inc. 19226 66th Ave S. #L102 Kent, WA 98032-2197 (425) 656-4170
Tidal Power Services, LLC
4211 Chance Ln Rosharon, TX 77583-4384 (281) 710-9150
monty.janak@tidalpowerservices.com www.tidalpowerservices.com
Monty Janak
Tidal Power Services, LLC
8184 Highway 44 Ste 105 Gonzales, LA 70737-8183 (225) 644-8170
Darryn Kimbrough
Tidal Power Services, LLC
1056 Mosswood Dr Sulphur, LA 70665-9508 (337) 558-5457
Monty Janak
Titan Quality Power Services, LLC
1501 S Dobson Street Burleson, TX 76028 (866) 918-4826 www.titanqps.com
Titan Quality Power Services, LLC
7630 Ikes Tree Drive Spring, TX 77389 (281) 826-3781
Tony Demaria Electric, Inc.
131 W F St Wilmington, CA 90744-5533 (310) 816-3130 neno@tdeinc.com www.tdeinc.com
Neno Pasic
Utilities Instrumentation Service - Ohio, LLC PO Box 750066 998 Dimco Way Dayton, OH 45475-0066 (937) 439-9660
Utilities Instrumentation Service, Inc.
2290 Bishop Cir E Dexter, MI 48130-1564 (734) 424-1200
gary.walls@UIScorp.com www.uiscorp.com
Gary E. Walls
Utility Service Corporation PO Box 1471 Huntsville, AL 35807 (256) 837-8400
apeterson@utilserv.com www.utilserv.com
Alan D. Peterson
Western Electrical Services, Inc. 14311 29th St E Sumner, WA 98390-9690 (253) 891-1995
dhook@westernelectricalservices.com www.westernelectricalservices.com
Dan Hook
Western Electrical Services, Inc. 5505 Daniels St. Chino, CA 91710 (619) 672-5217 mwallace@westernelectricalservices.com
Matt Wallace
Western Electrical Services, Inc. 620 Meadow Ln. Los Alamos, NM 87547 (505) 469-1661
tking@westernelectricalservices.com
Toby King
Western Electrical Services, Inc. 5680 S 32nd St Phoenix, AZ 85040-3832 (602) 426-1667
carcher@westernelectricalservices.com
Craig Archer
Western Electrical Services, Inc. 3676 W California Ave Ste C106 Salt Lake City, UT 84104-6533 (888) 395-2021 rcoomes@westernelectricalservices.com
Rob Coomes
Western Electrical Services, Inc. 4510 NE 68th Dr Unit 122 Vancouver, WA 98661-1261 (888) 395-2021 www.westernelectricalservices.com



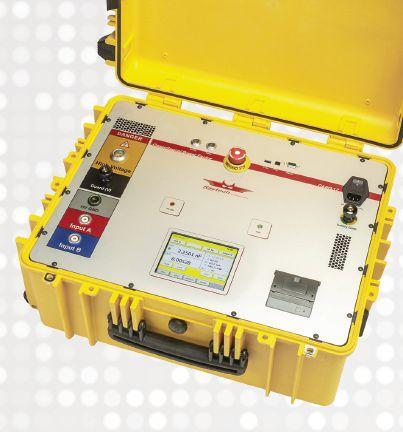


Raytech’s CAPO 12 offers features that allow you to take advantage of the current and future testing methods.
• Test Voltage up to 12kV | Built in Standard Capacitor
• Test Frequency – 10 Hz to 400 Hz
• Easy to Operate, Accurate & Reliable
• Internal Thermal Printer for Printing Test Results
• Internal Storage for Over 10,000 Test Results
• 5 Year Warranty
For more information regarding the newest test methods and standards for Insulation Power Factor testing, email: Info@RaytechUSA.com


Sweetser Regional Application Specialist

Compact, lightweight and powerful - this describes our test solution for o -line diagnostics on rotating electrical machines. With up to 15 kV at rated frequency, capacitance, dissipation/power factor, DC winding resistance, various impedances and contact resistance can be measured. At the same time, our solution serves as a high-voltage source for withstand voltage tests and partial discharge measurements. The intuitive software guides you during setup and measurement and it enables easy data management and reporting.