
INSULATION ASSESSMENT USING
NON-INVASIVE TECHNIQUES
We rent and support electrical test equipment
We carefully select the right equipment for your rental, prepare it in real-world conditions complete for the application. It’s field ready.
Testing needs support; the apparatus, the test equipment, the technician and the job. It’s what we do.
We make the connection between logistics and the job, wherever it is. Putting a label on a box isn’t enough. We proactively monitor the shipment, adapt, and ensure delivery commitment.
We support ...at intellirent it’s more than a transaction
Power Analysis
Data Acquisition
Photovoltaic
Relay and Protection Test
Battery
EV
Low and Medium Voltage Breakers
High Voltage Breakers
SF6 Analysis
Transformer Test and Diagnostic
Cable and Bus
Partial Discharge
Ground Test
Meters and Meter Test
Motor and Rotating Apparatus
Infrared Cameras
Patient Care Area
Electrical Safety
High Potential Test Sets
Insulation Resistance
Low Resistance Ohmmeters
Cable Fault Location
Process Calibration

Rental and technical support on your preferred manufacturers including Doble (Manta, Phenix, EnoServ, Vanguard), AEMC, Dilo, Drantz, ETI, Flir, Fluke, HV Diagnostics, HV Technologies, Megger, Omicron, Raytech, RH Systems, and many more! 888.902.6111
40 Insulation Assessment Using Non-Invasive Techniques
Abel González Gómez and Swapnil Marathe, Megger
Electric motors are essential to all industries, and a significant portion of electric motor failures are related to the insulation system. This article presents a simple sequence of preventive maintenance tests that can identify and correct potential failures and prevent costly downtime.
54 What Does Insulation Thermal Class Mean for Electrical Machines?
Kevin Alewine, Shermco Industries
To answer the question, “How hot is too hot?” end users must understand how insulation thermal classes affect machinery reliability and life expectancy. Learn how thermal classes are chosen and what they mean to an industrial maintenance team.
60 Electromagnetic Imperfection Measurements for Stator Core Condition Assessment
Fabian Oettl, OMICRON Technologies Italia, GmbH, and Mathieu Lachance, OMICRON electronics Canada
Several mechanical and electrical tests and methods are available for assessing stator core tightness and insulation condition. This article describes the benefits of performing a low flux measurement (ELCID) test, including low power requirements and a permanent record for use as a benchmark, plus equipment portability and easy setup.
72 New Method to Inspect Motor/Generator Windings for Electrical Integrity
Edis Osmanbasic, DV Power, Sweden, and Normen Kaemena, Siemens Gamesa, Germany
Learn about a new testing method capable of detecting even small irregularities in winding integrity that cannot be spotted using traditional winding resistance testing. This test has high value for asset owners and manufacturers because even small irregularities can develop into big failures.
TABLE OF CONTENTS

INSIGHTS AND INSPIRATION
8 Steve Newton: Learn and Pay It Forward
IN EVERY ISSUE
7 President’s Desk
Welcome to PowerTest 2023
Eric Beckman, National Field Services NETA President
12 NFPA 70E and NETA
Electrical and Thermal Burns: Why Is This an Important Topic in NFPA 70E?
Ron Widup, Shermco Industries
19 Relay Column
Event Analysis: Overall Differential Tripping
Steven Turner, Arizona Public Service Company
22 In the Field
Using Thermographic Surveys to Monitor Condition
Michael Labeit, 249th Engineer Battalion, U.S. Army Corps of Engineers
28 Safety Corner
Rotating Machinery Hazard Awareness
Paul Chamberlain, American Electrical Testing Co. LLC
32 Tech Quiz
Rotating Machinery
Virginia Balitski, Magna IV Engineering
35 Tech Tips
Using Grounding to Locate Cable Faults
Jeff Jowett, Megger
INDUSTRY TOPICS
82 Predictive Motor Maintenance: Static, Dynamic, and On-Line Testing
Drew Norman, Megger Baker Instruments
88 Staying Current with NERC Regulations
Casey Whitt, Shermco Industries, and Maysam Radvar, Power Systems Engineer
94 Detecting and Locating On-Line Partial Discharge
Bharat Nandula, Qualitrol
CORPORATE ALLIANCE CORNER
100 Advancements in Industry Acceptance and Maintenance Testing for Medium-Voltage Electrical Power Cables — Part 2
Thomas Sandri, Protec Equipment Resources
110 Partner Spotlight
OMICRON electronics: Leading with People
NETA NEWS
116 In Memoriam — Alan “Al” Peterson
122 In Memoriam — Peter “Pete” Sherman 126 PowerTest 2023 Product Showcase 128 NAMO Update SPECIFICATIONS AND
131 NETA Accredited Companies 138 Advertiser List





3050 Old Centre Road, Suite 101
Portage, MI 49024
Toll free: 888.300.NETA (6382)
Phone: 269.488.NETA (6382)
Fax: 269.488.6383
neta@netaworld.org
www.netaworld.org
executive director: Bryant Phillips
deputy director: Melissa York
NETA Officers
president: Eric Beckman, National Field Services
first vice president: Bob Sheppard, Premier Power Maintenance
second vice president: Dan Hook, CBS Field Services
secretary: Chasen Tedder, Hampton Tedder Technical Services
treasurer: John White, Sigma Six Solutions, Inc.
NETA Board of Directors
Virginia Balitski (Magna IV Engineering)
Ken Bassett (Potomac Testing, Inc.)
Eric Beckman (National Field Services)
Scott Blizard (American Electrical Testing Co., Inc.)
Leif Hoegberg (Electrical Reliability Services)
Dan Hook (CBS Field Services)
David Huffman (Power Systems Testing)
Chasen Tedder, Hampton Tedder Technical Services
Ron Widup (Shermco Industries)
non-voting board member
Jim Cialdea (Sigma C Power Services)
Lorne Gara (Shermco Industries)
John White (Sigma Six Solutions)
NETA World Staff
technical editors: Roderic L. Hageman, Tim Cotter
assistant technical editors: Jim Cialdea, Dan Hook, Dave Huffman, Bob Sheppard
associate editor: Resa Pickel
managing editor: Carla Kalogeridis
copy editor: Beverly Sturtevant
design and production: Moon Design
NETA Committee Chairs
conference: Ron Widup; membership: Ken Bassett; promotions/marketing: Scott Blizard; safety: Scott Blizard; technical: Lorne Gara; technical exam: Dan Hook; continuing technical development: David Huffman; training: Bob Sheppard; finance: John White; nominations: Dave Huffman; alliance program: Jim Cialdea; association development: Ken Bassett
© Copyright 2023, NETA
NOTICE AND DISCLAIMER
NETA World is published quarterly by the InterNational Electrical Testing Association. Opinions, views and conclusions expressed in articles herein are those of the authors and not necessarily those of NETA. Publication herein does not constitute or imply endorsement of any opinion, product, or service by NETA, its directors, officers, members, employees or agents (herein “NETA”).
All technical data in this publication reflects the experience of individuals using specific tools, products, equipment and components under specific conditions and circumstances which may or may not be fully reported and over which NETA has neither exercised nor reserved control. Such data has not been independently tested or otherwise verified by NETA.
NETA MAKES NO ENDORSEMENT, REPRESENTATION OR WARRANTY AS TO ANY OPINION, PRODUCT OR SERVICE REFERENCED OR ADVERTISED IN THIS PUBLICATION. NETA EXPRESSLY DISCLAIMS ANY AND ALL LIABILITY TO ANY CONSUMER, PURCHASER OR ANY OTHER PERSON USING ANY PRODUCT OR SERVICE REFERENCED OR ADVERTISED HEREIN FOR ANY INJURIES OR DAMAGES OF ANY KIND WHATSOEVER, INCLUDING, BUT NOT LIMITED TO ANY CONSEQUENTIAL, PUNITIVE, SPECIAL, INCIDENTAL, DIRECT OR INDIRECT DAMAGES. NETA FURTHER DISCLAIMS ANY AND ALL WARRANTIES, EXPRESS OF IMPLIED, INCLUDING, BUT NOT LIMITED TO, ANY IMPLIED WARRANTY OF FITNESS FOR A PARTICULAR PURPOSE.
ELECTRICAL TESTING SHALL BE PERFORMED ONLY BY TRAINED ELECTRICAL PERSONNEL AND SHALL BE SUPERVISED BY NETA CERTIFIED TECHNICIANS/ LEVEL III OR IV OR BY NICET CERTIFIED TECHNICIANS IN ELECTRICAL TESTING TECHNOLOGY/LEVEL III OR IV. FAILURE TO ADHERE TO ADEQUATE TRAINING, SAFETY REQUIREMENTS, AND APPLICABLE PROCEDURES MAY RESULT IN LOSS OF PRODUCTION, CATASTROPHIC EQUIPMENT FAILURE, SERIOUS INJURY OR DEATH.
ISSN 2167-3594 NETA WORLD JOURNAL PRINT ISSN 2167-3586 NETA WORLD JOURNAL ONLINE

WELCOME TO POWERTEST 2023
Welcome to Orlando, Florida, and PowerTest 2023! We are excited to return to Florida and enjoy the sunshine and warm weather. I hope everyone can enjoy golf or some of the theme parks in the local area while also participating in the premier electrical testing and safety conference.
Electric motors play a crucial role in many modern technologies, including transportation (electric cars), manufacturing, oil and gas production, and power generation, and assessing machine condition and predicting failures is equally as critical. In this edition of cover story highlights the importance of effectively evaluating insulation using non-invasive techniques.
Discussions on assessing stator cores, new methods for inspecting motor and generator windings, and determining the thermal class of an electrical machine are also featured. As industry and technology continue to grow worldwide, electrical machines will continue to convert mechanical energy into electricity and vice versa, thereby remaining the workhorse of the electrical world. Commissioning, testing, and assessing electrical machines will always be of vital importance.
Importantly, this issue honors the loss of two individuals who have meant so much to the electrical industry and to NETA: Alan Peterson and Pete Sherman. These two men did so much for the electrical testing world, and they will forever be remembered for the way they helped shape the industry.
Plan ahead and always put safety first!
Eric Beckman, PE, President InterNational Electrical Testing Association

STEVE NEWTON: LEARN AND PAY IT FORWARD
Steve Newton, National Training Center Training Program Manager at National Field Service, is a great example of a veteran making the most of his service years. Now, as he approaches 33 years in the industry, his mission is to pay his experience forward to a new generation.

Newton is also a subject matter expert for the National Institute for Certification in Engineering Technologies (NICET); a certified National Center for Construction Education and Research (NCCER) Instructor; a Master Trainer for the Instructor Certification Training Program; and a Level IV NETA Certified Senior Engineering Technician in electrical power testing. He is a certified instructor for electrical, instrumentation, electronic, solar, and various power curriculums. Newton holds several professional memberships, including IEEE and NFPA, and is actively involved in reviewing and developing training and procedural materials for the electrical industry.
In our continuing series celebrating NETA’s Level IV Certified Technicians, Newton describes his journey and shares his advice for new technicians and upcoming professionals in the industry.
NWJ: What initially attracted you to electrical testing?
Newton: I was attracted by the mixture of electrical technology, emerging computer applications in the power industry, and the variety of field work and office projects. Every day was a learning opportunity without an end.
NWJ: How long have you been in the field, and how did you get started?
Newton: I’ve been in the electrical field for 32 years — going on 33. I started when I left the Navy after 14 years, where I was involved with electrical and electronicrelated operations. I went to work for a small
STEVE NEWTON
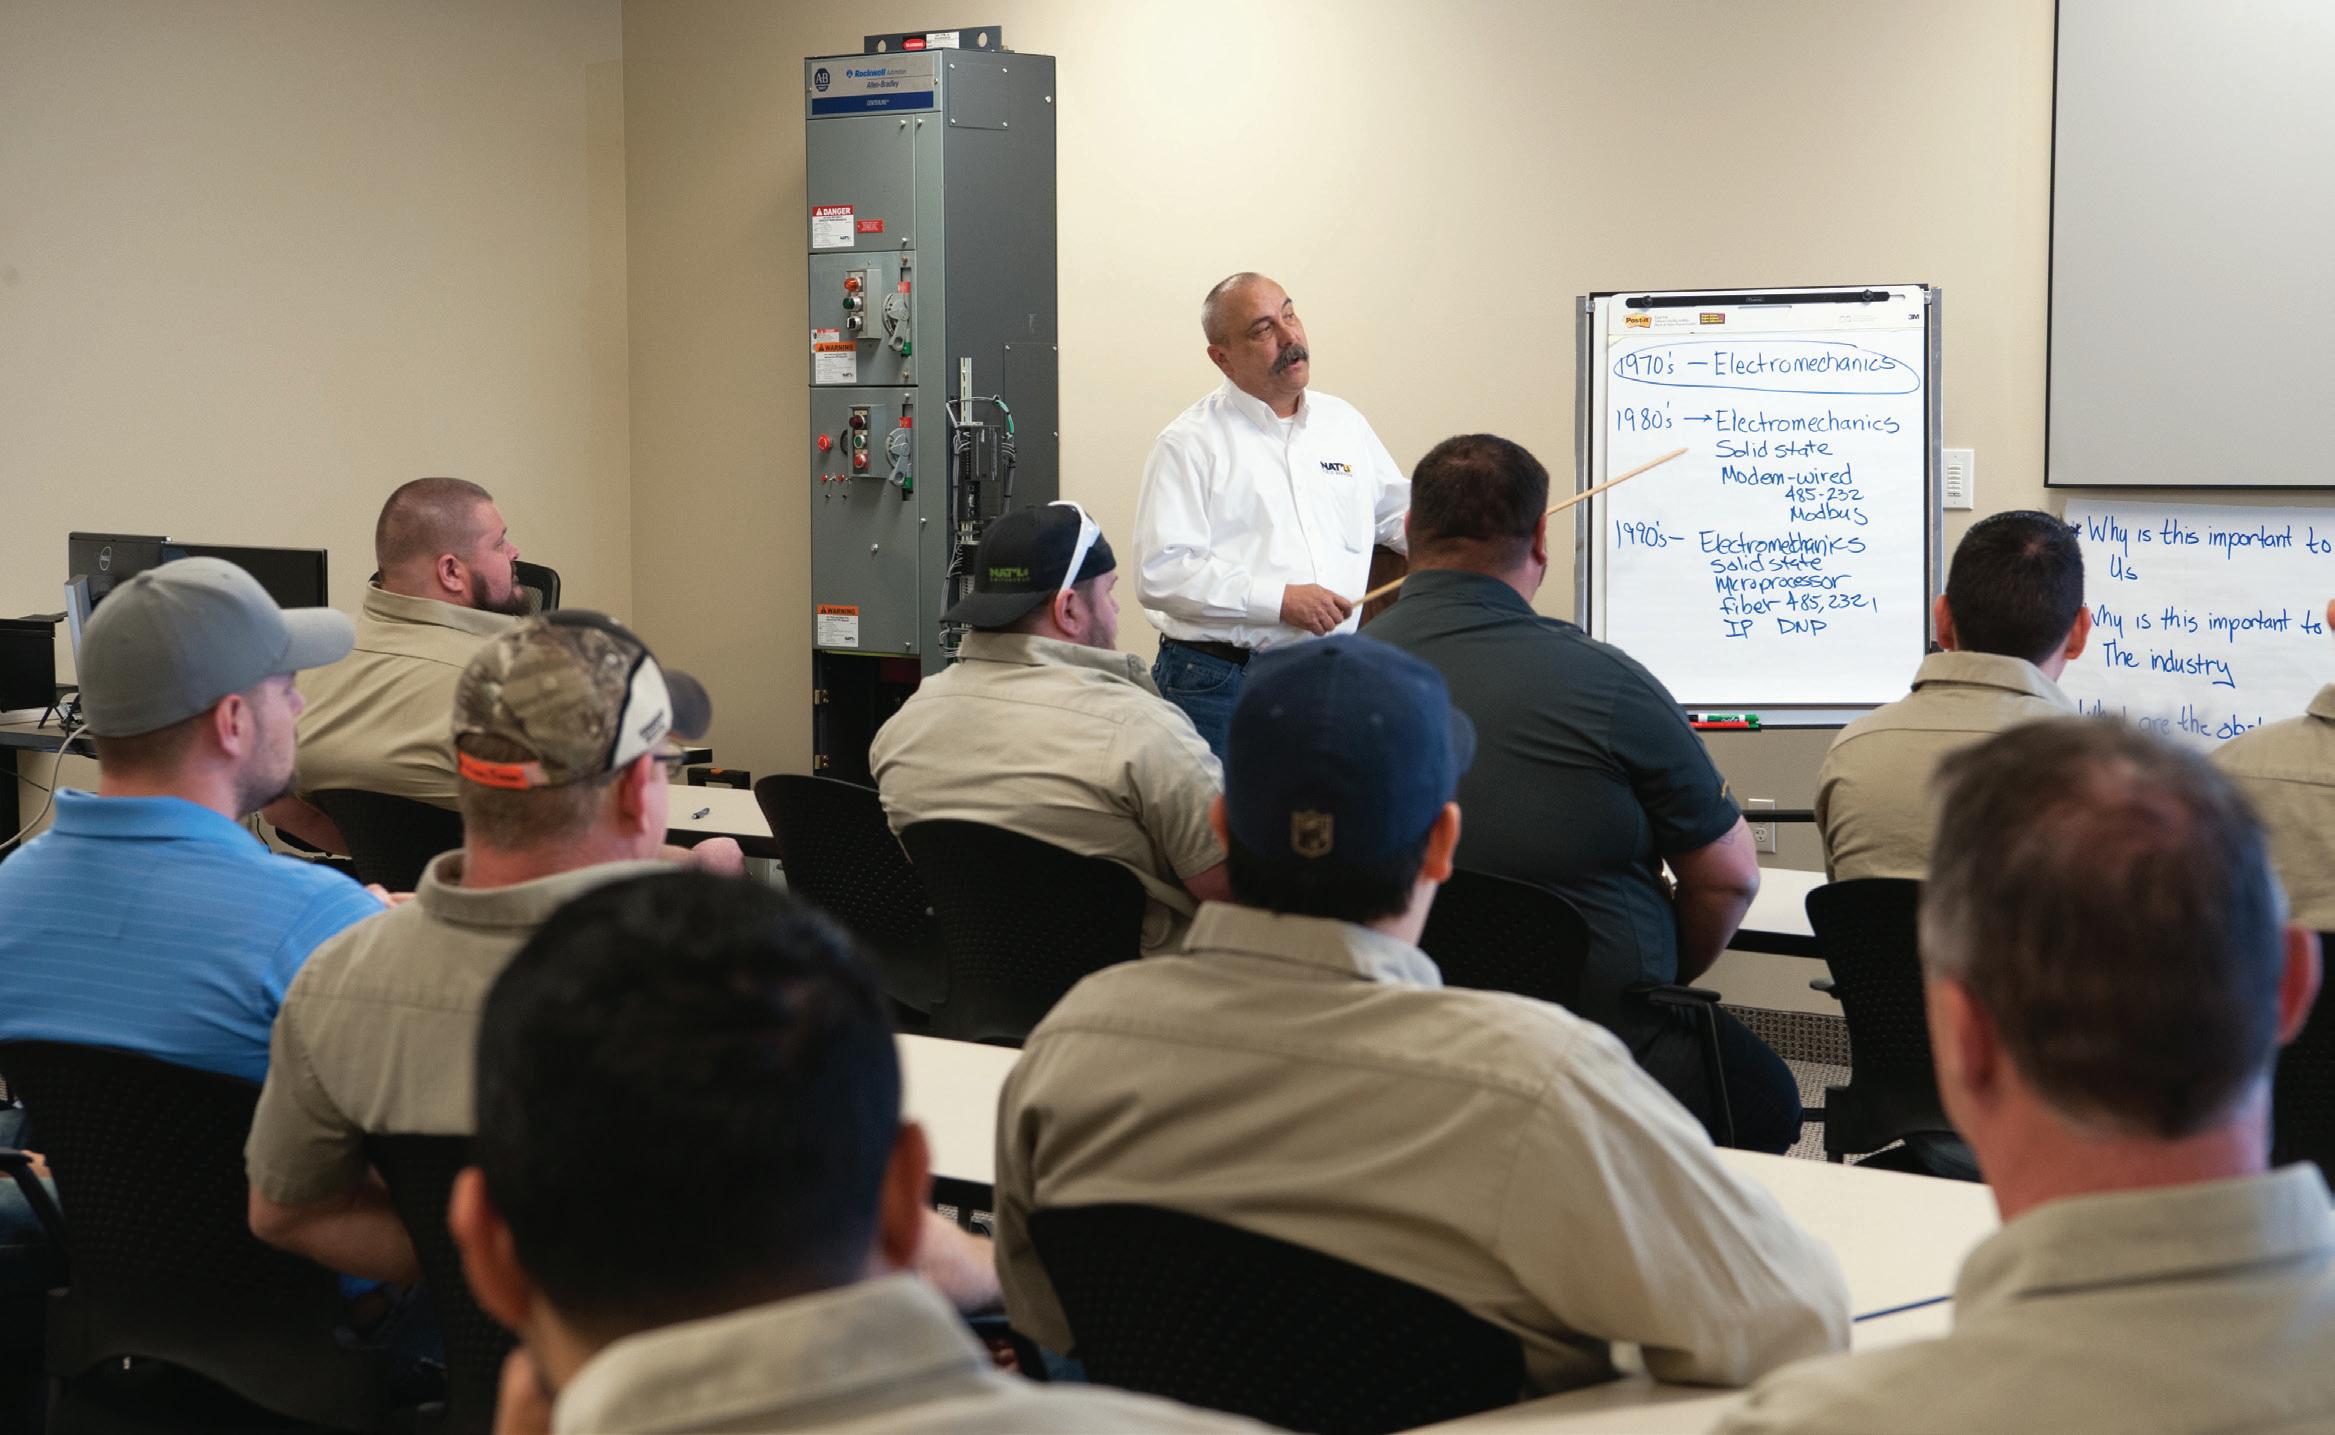
construction and maintenance contractor in a specialty area testing electrical equipment and commissioning new installations. That company was sold to a larger contractor, and I became a shareholder. When that company was sold again to an even larger contractor, I retired and went to work with National Field Services as an SME in training and electrical safety.
NWJ: How did you get to your current position?
Newton: During the 20 years I worked in the field, I never said no to a job, and I went wherever I was asked no matter what the challenge. I also listened to those around me including engineers, manufacturers, and other technicians, and I checked everything I was told and heard against the standards and practices. I was always studying, always learning.
At National Field Services, I moved to technical support, training, and safety and have filled roles with increasingly higher responsibility.
NWJ: Who has influenced or mentored you along the way?
Newton: God, Jim White, Larry Nelson, Monty Humphreys, Gene Newton (my father), and Kelso Vernor, but not necessarily in that order (except for God, of course). My spiritual walk taught me to find contentment from inside myself without basing it on external factors regardless of the circumstances. Larry Nelson and Monty Humphreys taught me how this field started and put me on track to develop my own way in it. Jim White taught me the importance of being involved in changing and improving the quality of the field through participation in organizations. Finally, Kelso Vernor and my father taught me what it meant to be a man, a friend, a father, and a husband.
NWJ: What about this work keeps you committed to the profession?
Newton: I personally feel that my generation has let our children and grandchildren down by having smaller households and not recreating our skills as we should have. My goal is to spend the rest of my life left giving back as much as I can to all of them.
NWJ: Describe one of your best workdays… what happened?
INSIGHTS & INSPIRATION
Newton: While on a project that spanned a couple of years, including two months of fighting with a transformer manufacturer about the validity of power factor test results on two identical large units, the day came when we detanked the problematic unit and found a coating of rust all around and everywhere above the oil. After more discussion, we learned that the contractor had dressed it out in the rain. The power factors only deviated from each other by a small amount, but it was enough to be a red flag that warranted additional investigation. I trusted the test results and my ability to run the test, and it paid off. The power factor readings only varied by about 0.4%. Although this could have been the result if the factory had not processed them the same way, it still required further investigation based on comparing sister units and at least an inspection.
NWJ: Please share the story of a day that didn’t go as planned. How did you respond and what did you learn?
Newton: While working protection and controls on a 354/138/69 kV utility yard in northern Ohio, a contractor had been working on a de-energized 138 kV line below an energized 345 kV line. They had rendered it electrically safe and properly grounded everything. I had been watching a lot of the grounding process, but then went back in the control rooms with my crews.
An hour later, we heard screaming outside. They were lowering a limp electrician down in a manlift, and the young man was pronounced dead by life flight. We learned that one of the grounds was in his way, and violating every single mitigation requirement, he moved the ground and was shocked by what we estimated based on some related metering was an approximately 10 kV induction.
This was the third fatality I had been exposed to that was associated with safety grounding. Today, I place an emphasis on grounding in all of my electrical safety training.
NWJ: What energy trend do you think will affect your work in the future?
Newton: I don’t think any of the current trends will affect our work. In the end, unless we change physics, our profession will always be needed in one way or another. I will say that electric vehicles — if they stay — will be become a phenomenal opportunity for our industry.
NWJ: As an industry, what do you think should be our No. 1 priority over the next year?
Newton: We must bring in and train new talent — as many and as fast as we can.
NWJ: If you were talking to a young person interested in knowing more about being an electrical testing technician, how would you describe the job, and what advice would you give them?



Newton: If you will come into this field, work hard, learn what we teach you, challenge what we teach to make sure it is accurate, and go where asked whenever you are asked, you will make plenty of money. If you continue to do these things as you get older, you will eventually find true success, which in my view is when you are being paid for what you know rather than what you can do.
When you are looking for a job, you can ask what it pays, but an important followup question should be, “How much can I be making 20 years from now, and what type of advancement potential am I looking at?”
NWJ: to share?
Newton: content.”


ELECTRICAL AND THERMAL BURNS: WHY IS THIS AN IMPORTANT TOPIC IN NFPA 70E?
BY RON WIDUP, Shermco Industries
How much heat does it take to burn unprotected skin?
Not very much, right? We’ve all had it happen to us: Just stay outside in the sun for a short amount of time with unprotected skin, and there you have it — a burn to your skin.
Now, place unprotected skin in front of a potential source of great heat, such as electrical equipment, and the damage and risk become exponentially greater, and quite possibly lethal.
NFPA 70E addresses the hazards associated with exposure to the four potential burn injuries in the workplace: electrical (shock), thermal (arc flash), chemical (e.g., batteries), and radiation (e.g., X-rays). While all four are dangerous, this article will focus on electrical and thermal burns.
HUMAN SKIN IS VERY FRAGILE
Did you know that burning of the skin can occur at only 118°F? The National Institute for Standards and Technology (NIST) says human skin begins to feel pain at a temperature of 111°F (think hot bathwater). At 118°F, human

skin can sustain first-degree burns; a seconddegree burn injury can occur at a temperature of only 131°F. While burn severity is a function of exposure time and temperature, human skin is very fragile when elevated temperatures are encountered.
Your skin has three layers.
Epidermis
The epidermis is the outermost (and thinnest) layer of your skin. It protects your body from harm, keeps your body hydrated, produces new skin cells, and contains melanin, which determines the color of your skin.
PHOTO: © WWW.SHUTTERSTOCK.COM/G/RAYSAY
Epidermis
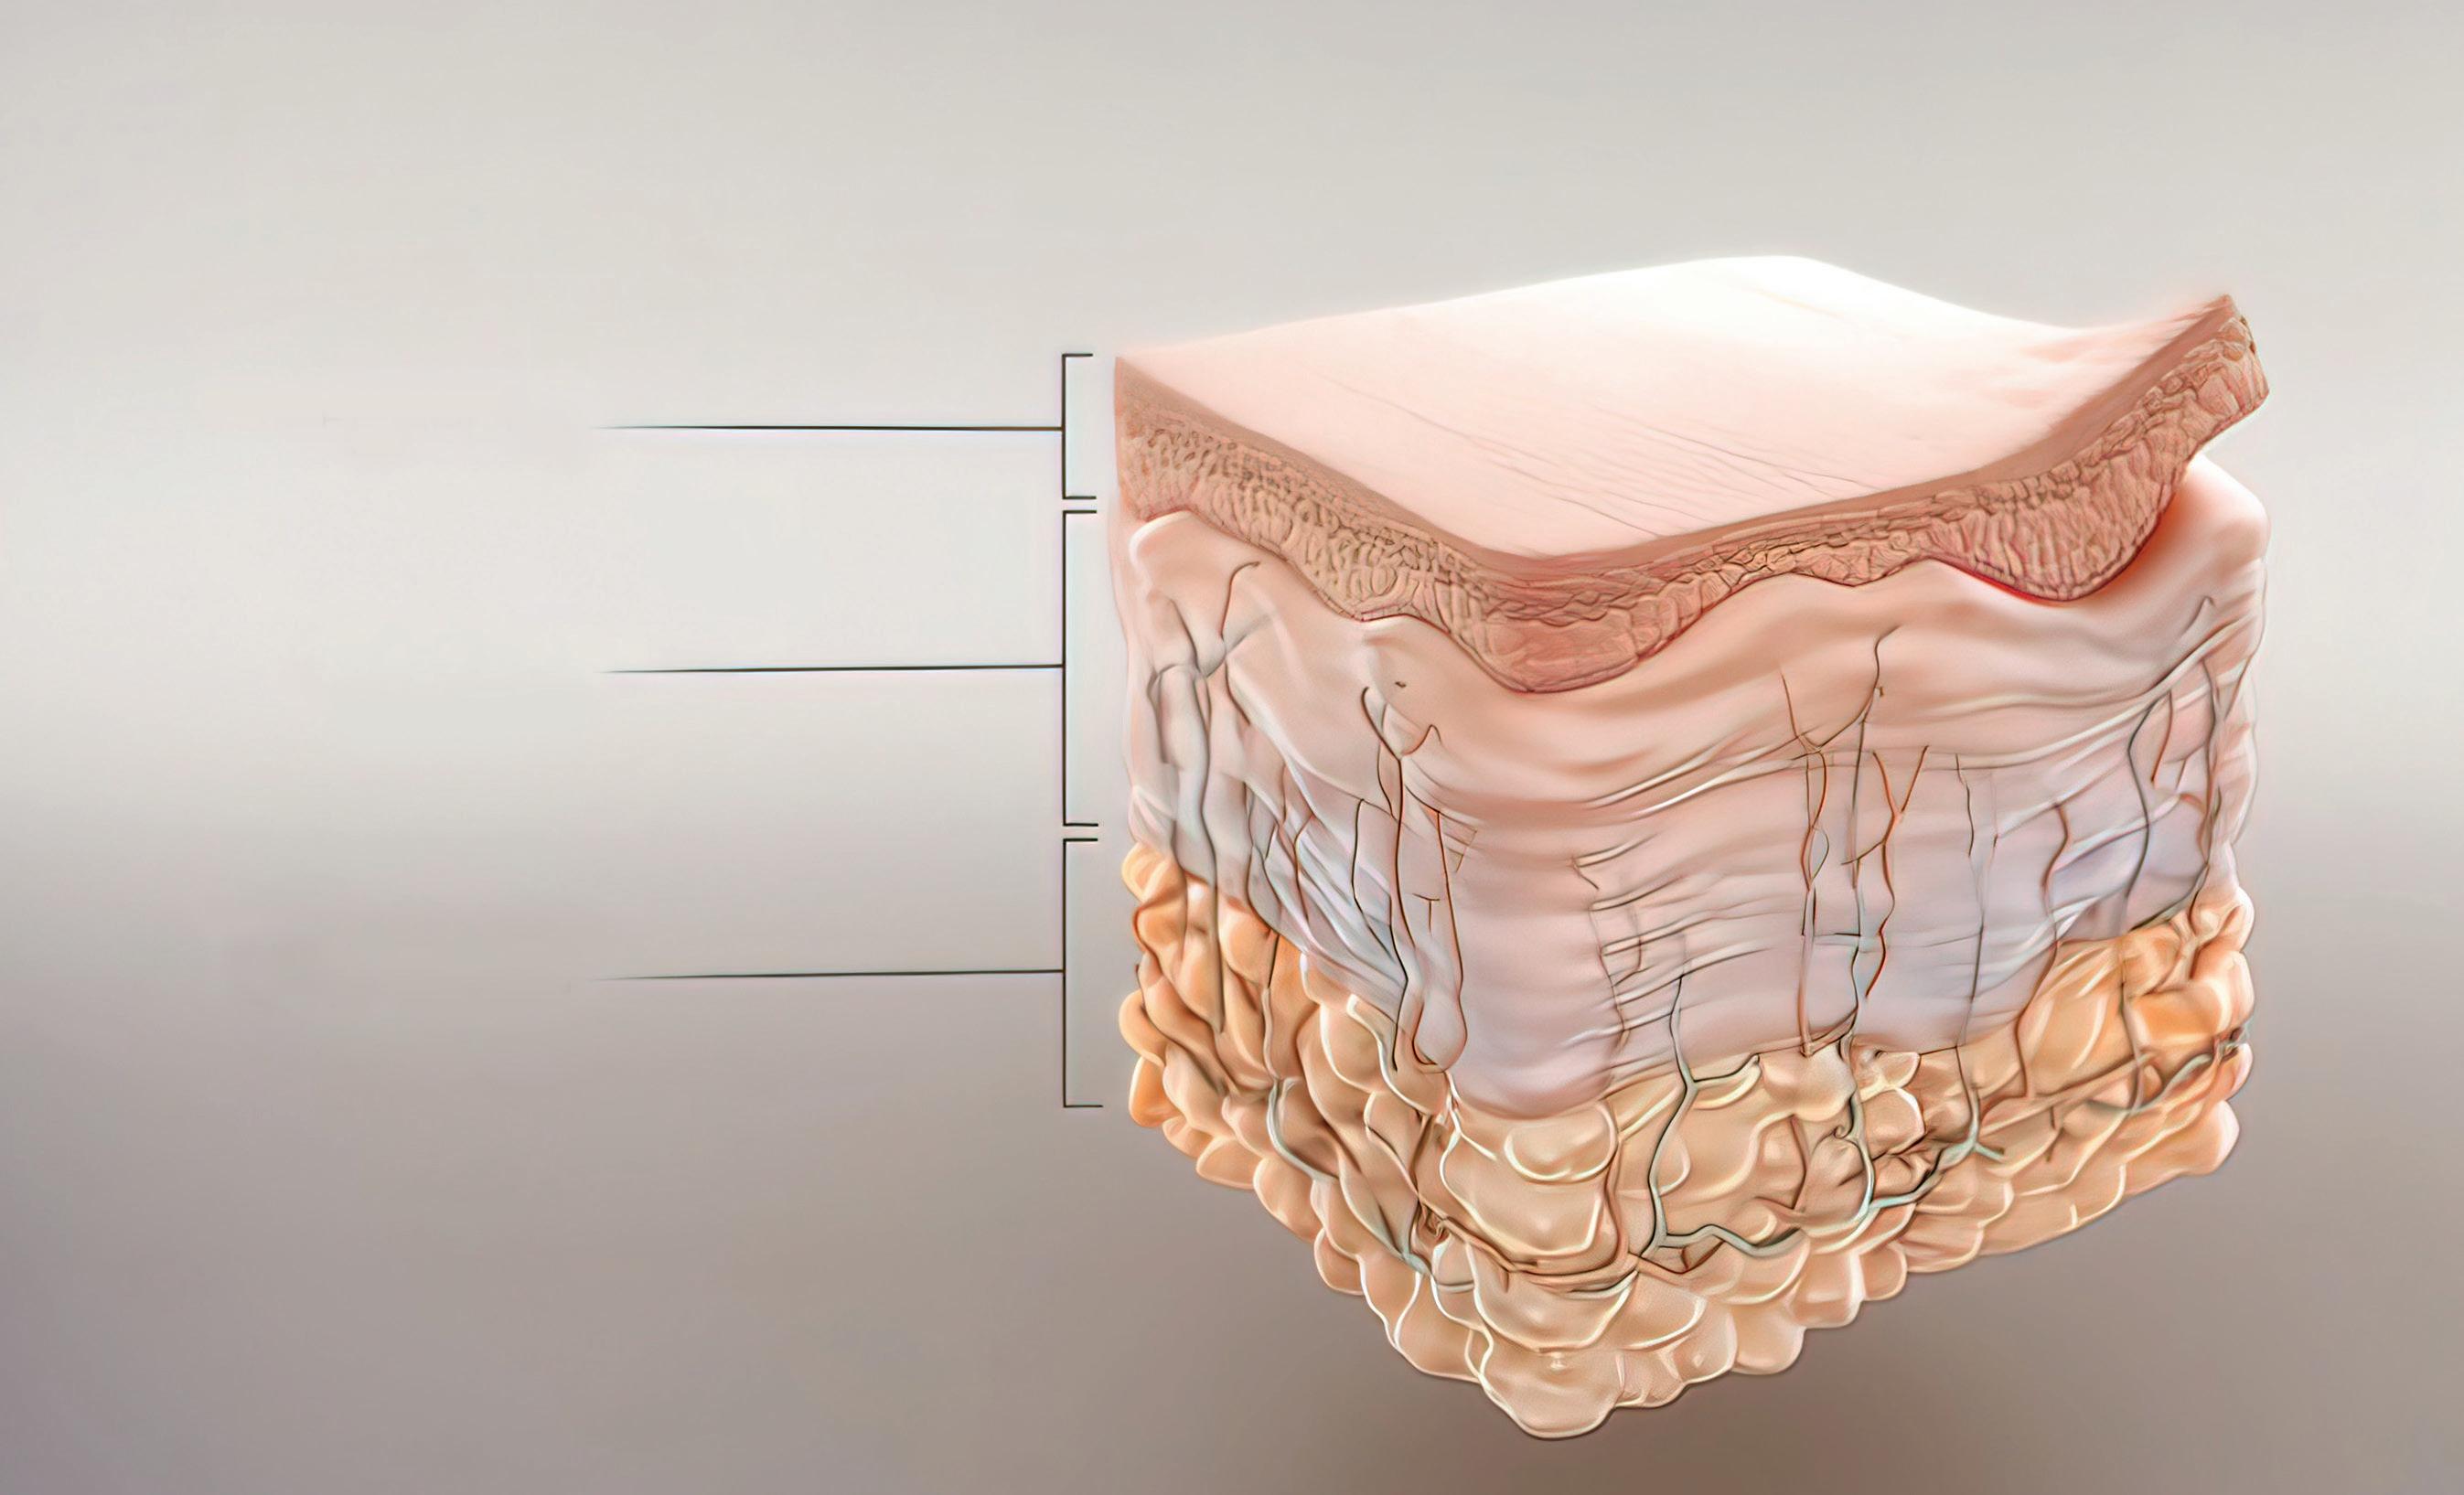
Dermis
Hypodermis
Dermis
The dermis is the middle layer of the skin. The dermis contains blood vessels, hair follicles, sweat glands, and nerves.
Hypodermis
The hypodermis is the bottom layer of skin in your body. It has many important functions such as storing energy, connecting the dermis layer of your skin to your muscles and bones, insulating your body, and protecting your body from harm.
BURN DEGREE RATINGS
Burns are classified by a degree rating depending on how deeply and severely they penetrate the skin’s surface: first, second, third, and fourth. It should be noted that the initial burn may not be able to be classified, as it can progress and worsen over time, especially in the case of an electrical contact injury or burn (Figure 1).
First-degree (superficial) burns affect only the outer layer of skin, which is the epidermis. For this type of burn, you can expect redness around
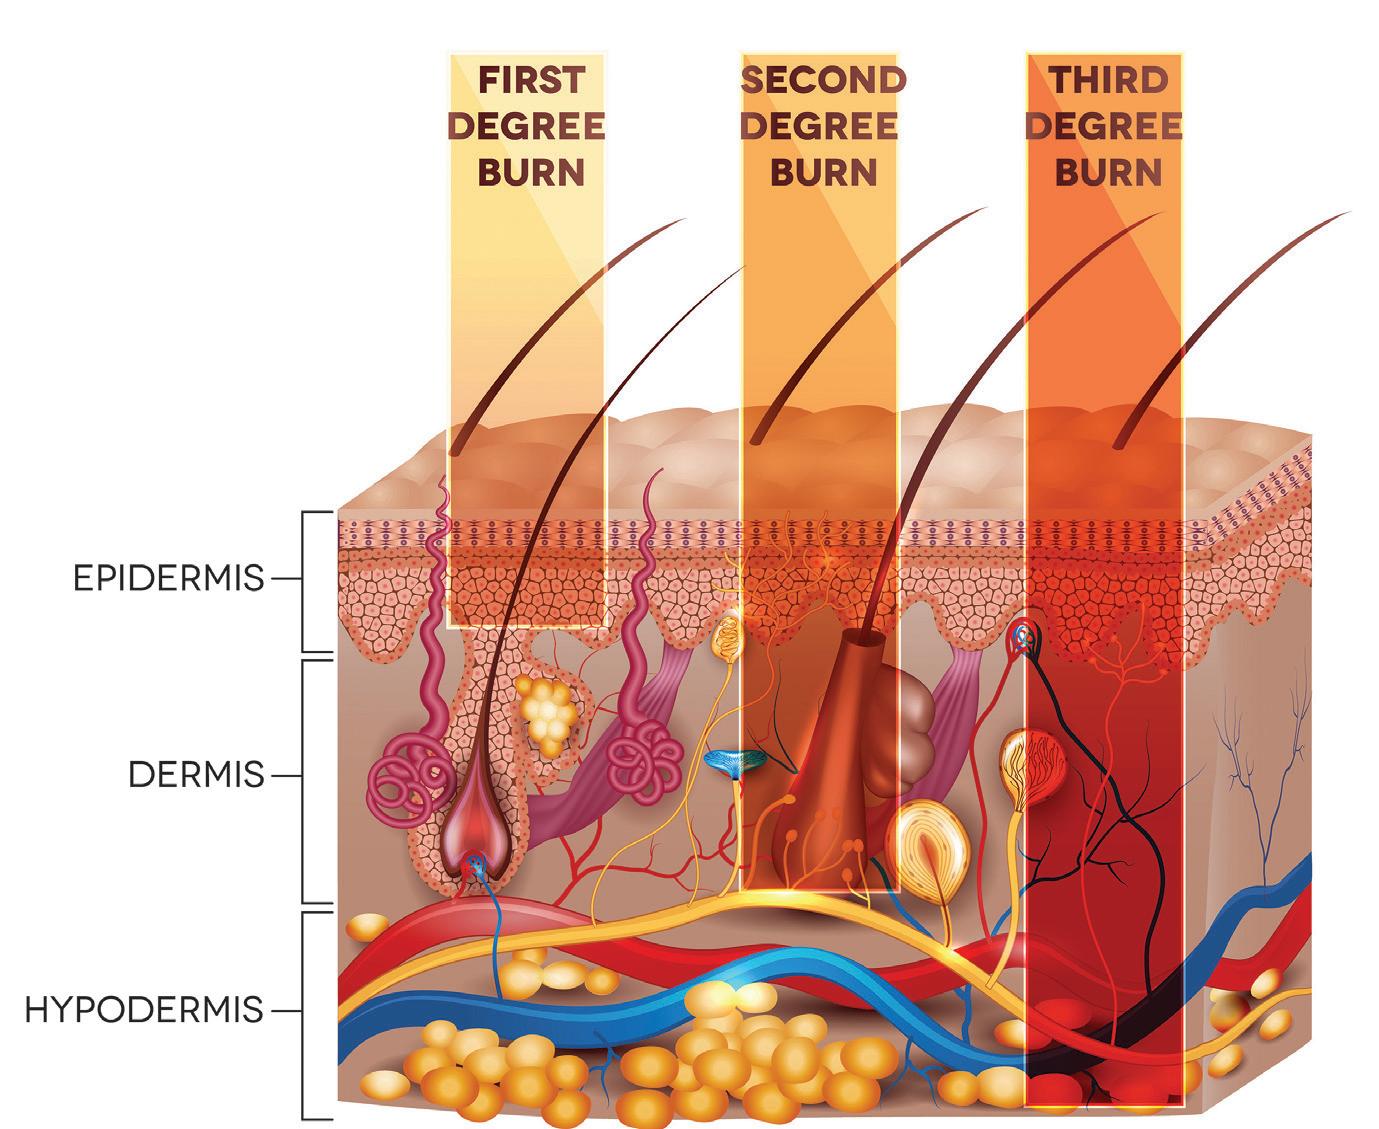
Figure 1: Layers of the Skin and Depth of Burns
SOURCE: TEFI/SHUTTERSTOCK.COM
THE NFPA 70E AND NETA
the affected area and some level of pain. It is dry and has no blisters. An example would be a mild sunburn, and long-term tissue damage is rare.
NFPA 70E primarily focuses on preventing the next classification of burn, the second-degree (partial thickness) burn. Second-degree burns involve the epidermis and part of the lower layer of skin, the dermis. The burn site looks red and blistered and may be swollen and painful. PPE ratings typically protect to a point where a second-degree burn starts. The usual minimum thermal value exposure is 1.2 cal/cm2.
Next, third-degree or full-thickness burns destroy the epidermis and dermis. This burn can go into the innermost layer of skin, the subcutaneous tissue. The burn site may look white or blackened and charred.
Finally, the worst classification is the fourthdegree burn. These burns go through both layers of the skin and underlying tissue as well as deeper tissue, possibly involving muscle and bone. There is no feeling in the area because the nerve endings are destroyed. This classification does not get talked about as much, but it is a level of burn that has devastating consequences for the body.
OK, WE GET IT. BURNS ARE BAD — NOW WHAT?
As qualified electrical workers, we are constantly exposed to the hazards of electricity, and one of the biggest hazards is receiving injury from electrical and thermal burns. How do we prevent injury from occurring? The key is in the first sentence of this definition from NFPA 70E, which defines a qualified person as:
“One who has demonstrated skills and knowledge related to the construction and operation of electrical equipment and installations and has received safety training to identify the hazards and reduce the associated risk.”
Now, read that again. Think about the words and what they mean. It’s the key to everything when it comes to protecting you and those around you. If you understand what you are working on and the potential hazards you will

Is this a qualified person?
encounter, understand these facts, and take steps to avoid the hazards (including turning it off!), then you have greatly improved your situation and likely will not be hurt or injured. Again, read the words before doing the work!
EFFECTS OF ELECTRICAL CONTACT AND BURNS
A severe electrical burn can be a seriously devastating injury —not only physically, but emotionally as well. The incident will affect not only the burn victim but also the entire family.
NFPA’s Fire Protection Research Foundation produced a report in March 2015 titled Fatal Electrical Injuries at Work . The following information is from the report:
Electrical hazards take a variety of forms and produce different types of injury. The National Safety Council reported in its 2014 edition of Injury Facts that there were 961 fatal injuries from 2008 through 2010 due to exposure to electric current, radiation, temperature, and pressure. While relatively uncommon, electrical injuries are noted for having the potential to be particularly debilitating, with high morbidity and mortality.
Further, the report goes on to say:
The OSHA incidents and research show that a variety of factors contribute to the failure to comply with NFPA 70E requirements — inadequate training, sense of time pressure, desire
to meet customer needs, and desire to get scheduled work done. In some cases, injuries result when workers encounter unmarked power sources or unsafe or unanticipated electrical conditions that are left behind by prior work.
The research indicates that many workers who experience electrical injury have inadequate safety training to recognize safety hazards and follow proper procedures. This may frequently be the case in some service occupations, as well as with immigrant workers or workers in temporary positions, but it is also evident that managers and supervisors — even those who work in the electrical field — may not themselves be knowledgeable about electrical hazards, even as they direct the activities of employees who may be exposed to energy sources in the course of their work.
The text in red shows you exactly what the 70E Technical Committee and the electrical safety community strive for each and every day: Produce a work practices standard that identifies the risk, puts forth a mitigation strategy for the risks, and provides guidance to the worker in the field on what type and rating of PPE is necessary to prevent injury.
BURN EXPOSURE
Fatal Electrical Injuries at Work, a 2018 report from the NFPA Research Foundation, states:
Over the five-year period from 2012 – 2016, data from the U.S. Bureau of Labor Statistics (BLS) indicate that 739 workers suffered fatal injuries as a result of exposure to electricity.
Electrical hazards are a potential source of injury to workers in a wide array of work settings. Occupations that routinely involve electrical work are the most obvious at-risk populations for electrical injury, but virtually any environment that utilizes electrical equipment — which is to say, most work settings — may involve exposure to hazardous electrical energy, whether due to frayed cords, faulty equipment, missing ground prongs, or some other factor. It is accordingly important for workers across industry and occupational groups to be able to recognize electrical hazards
Figure 2: Types of Exposures Causing Fatal Injures
SOURCE: NFPA RESEARCH FOUNDATION
in their work environments and for employers to take appropriate steps to protect employees from electrical injury.
Exposure Types
Figure 2 from the report shows that “53% of fatal electrical injuries by type of exposure resulted from direct exposure to electricity and 41% from indirect exposure. Exposure was unspecified for 6% of the injuries. Indirect exposure to 220 volts or more accounted for 37% of the fatal injuries and direct exposure to 220 volts or more was responsible for 36% of the injuries. Direct exposure to less than 220 volts accounted for 17% of deaths and indirect exposure to 4% of the deaths.”
Electrical arcing can produce temperatures as high as 35,000°F at the arc terminals and may cause severe burns, hearing loss, eye injuries, skin damage from blasts of molten metal, lung damage, and blast injuries. The threat from electrical thermal burns is real, and many sections of the 70E address protection from arc flash and thermal burns.
Electrical shock, whether low-voltage or highvoltage, creates a unique set of circumstances for medical personnel after a contact event. It should be noted that in high-voltage shocks, direct contact is not required. The resulting arc can carry
THE NFPA 70E AND NETA
electrical current from the source to the victim. This is why we focus so much on understanding minimum clearances and approach boundaries. Electricity will literally reach out and grab you.
Current Path
During a shock event, the path at which the current travels and the resulting burns and tissue destruction can place organs at risk and stop your heart. Get a shock to your brain, and you can suffer respiratory arrest, seizures, and paralysis.
An electrical shock incident that involves a vertical path can put your central nervous system, heart, and respiratory system at risk.
A horizontal path, entering one hand and exiting out the other or another part of the body, can pass lethal current across your heart.
Worst of all, should you maintain contact for an extended period of time, serious damage to the body can occur and your clothing may catch on fire.
Persons with severe burns may be left with a loss of certain physical abilities, including loss of limb(s), disfigurement, loss of mobility, scarring, and recurrent infections because the burned skin has decreased ability to fight infection. In addition, severe burns can penetrate deep skin layers, causing muscle or tissue damage that may affect every system of the body.
Burns can also cause emotional problems such as depression, nightmares, or flashbacks from the traumatizing event. The loss of a friend or
ADDITIONAL RESOURCES
Download the complete NFPA report, Occupational Injuries from Electrical Shock and Arc Flash Events, from the Fire Protection Research Foundation, here: https://www.nfpa.org/News-andResearch/Data-research-and-tools/ Electrical/Occupational-Injuries-fromElectrical-Shock-and-Arc-Flash-Events.
family member and possessions in the fire may add grief to the emotional impact of a burn.
CONCLUSION
The key to all of this? Educate yourself on the hazards and the risks associated with electrical work, follow safety protocols and OSHA requirements, read and understand NFPA 70E (and importantly the “why” behind the standard), and never, ever, get complacent. Pay particular attention to Article 120 and Article 130. Understand those two sections completely, because if you do so, you can likely prevent an incident from ever happening.
Electricity is not forgiving, but if you follow a few basic safety tenets you won’t have any issues.
And by the way, before working on it? — Turn it off!
REFERENCES
R. Campbell. Fatal Electrical Injuries at Work, NFPA Research Foundation, May 2018. Accessed at https://www.nfpa.org/News-andResearch/Data-research-and-tools/Electrical/ Fatal-electrical-injuries-at-work

Ron Widup is the Vice Chairman, Board of Directors, and Senior Advisor, Technical Services for Shermco Industries and has been with Shermco since 1983. He is a member of the NETA Board of Directors and Standards Review Council; a Principal member of the Technical Committee on Standard for Electrical Safety in the Workplace (NFPA 70E); Principal member of the National Electrical Code (NFPA 70) Code Panel 11; Principal member and Chairman of the Technical Committee on Standard for Competency of ThirdParty Evaluation Bodies (NFPA 790); Principal member and Chairman of the Technical Committee on Recommended Practice and Procedures for Unlabeled Electrical Equipment Evaluation (NFPA 791); a member of the Technical Committee Recommended Practice for Electrical Equipment Maintenance (NFPA 70B); and Vice Chair for IEEE Std. 3007.3, Recommended Practice for Electrical Safety in Industrial and Commercial Power Systems. He is a member of the Texas State Technical College System (TSTC) Board of Regents, a NETA Certified Level 4 Senior Test Technician, State of Texas Journeyman Electrician, a member of the IEEE Standards Association, an Inspector Member of the International Association of Electrical Inspectors, and an NFPA Certified Electrical Safety Compliance Professional (CESCP).


February 26 – March 1, 2024 | Monday – Friday
Hilton Anatole | Dallas, Texas
Mark your calendars for the electrical power industry’s premier technical conference tailored to the system reliability and safety needs of electrical power professionals. Explore 5+ days of learning, technical training, and networking opportunities at PowerTest 2024.
EVENT ANALYSIS –OVERALL DIFFERENTIAL TRIPPING
BY STEVEN TURNER, Arizona Public Service
The overall differential protection for a generator step-up transformer (GSU) began to trip when the generator was synced to the plant switchyard. Figure 1 shows the one-line diagram for the overall differential protection.
There is one set of current transformers (CTs) on the high side of the GSU, one set of CTs on the low side of the GSU not including the generator, and one set of CTs on the high side of the auxiliary transformer.
FIELD INVESTIGATION
Field inspection of the CT wiring revealed that A-phase and C-phase CTs on the low side of the GSU were rolled. Engineering initially requested that the wiring be changed to eliminate rolling the CTs. However, inspection of the low-side
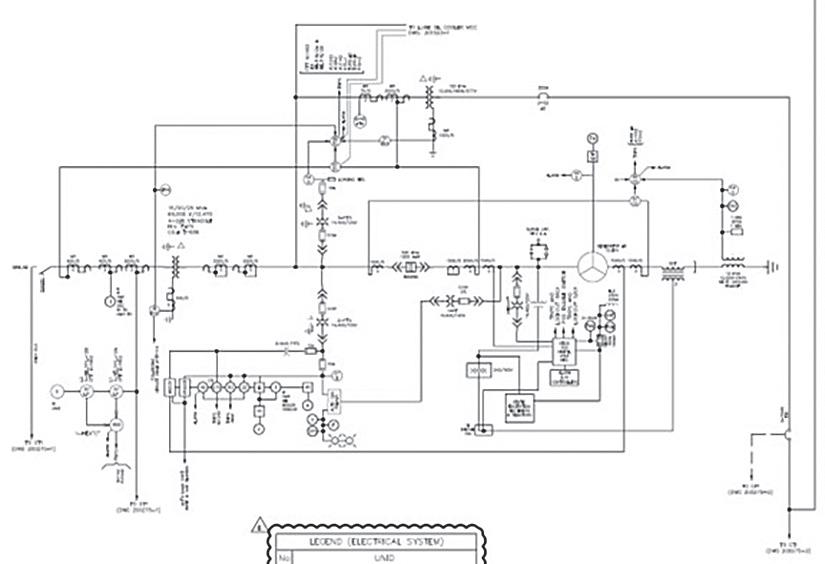
Figure 1: Differential Single-Line Diagram
RELAY COLUMN
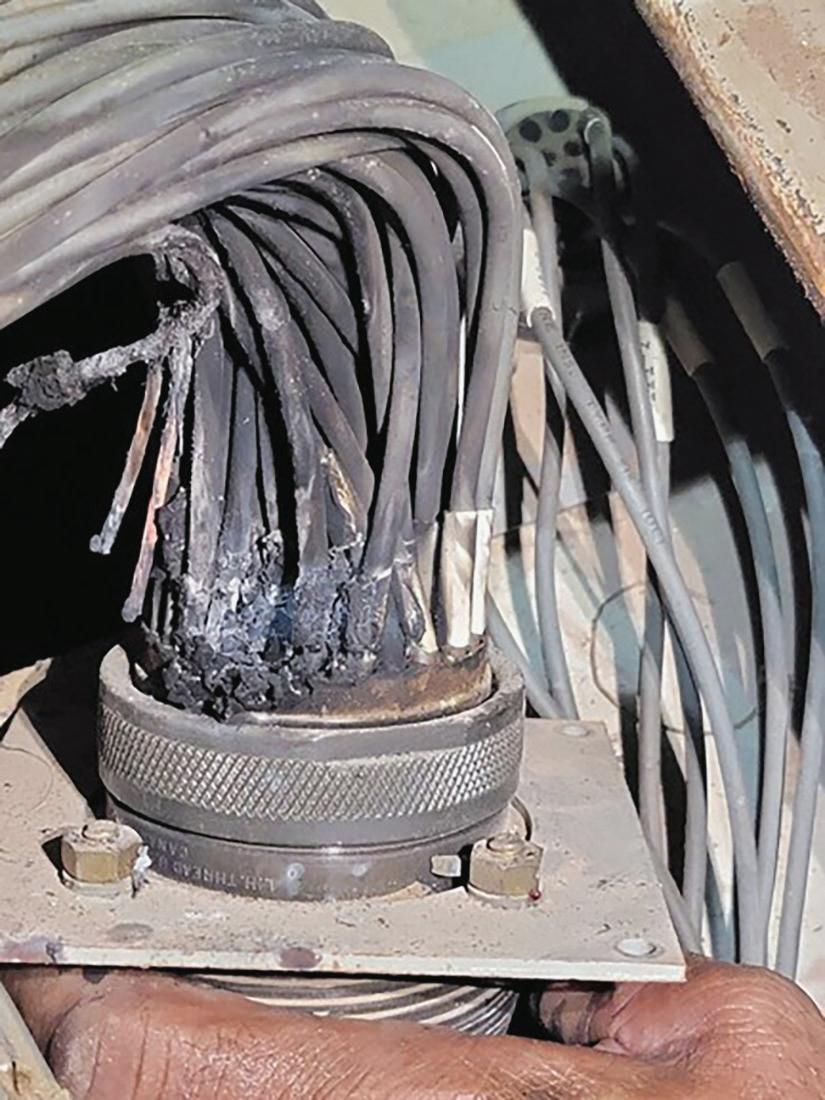
bus revealed that A-phase and C-phase were also rolled. Further field inspection revealed that the B-phase wire running from the set of CTs on the low side of the GSU had failed as a high impedance (Figure 2).
Review of Figure 2 reveals that some of the CT wiring had corroded, which was the cause of the high impedance presented to the differential relay. The bad wires were replaced, which eliminated the problem.
CIRCUIT ANALYSIS
Figure 3 illustrates why the differential protection would operate due to the highimpedance wiring.
Assume that the impedance is high enough on the secondary side (Ib) that we can consider it an open circuit. Normally, the operate coil sees no differential current during load flow:
IOP = IB – Ib = 0
However, due to the open circuit, there is no current on the secondary side, so there is a differential current:
IOP = IB – 0 = IB
CONCLUSION
The overall differential protection for a GSU began to trip when the generator was synced to the plant switchyard. It was first thought that the trips were due to incorrect wiring for the CTs, but if this had been the case, it should have tripped the first time the protection was put into service. Further investigation revealed that the trips were because the B-phase wire running from the set of CTs on the low side of the GSU had failed as a high impedance. The bad wiring was replaced, and the differential protection stopped misoperating.

Steve Turner is in charge of system protection for the Fossil Generation Department at Arizona Public Service Company in Phoenix. Steve worked as a consultant for two years, and held positions at Beckwith Electric Company, GEC Alstom, SEL, and Duke Energy, where he developed the first patent for double-ended fault location on overhead high-voltage transmission lines and was in charge of maintenance standards in the transmission department for protective relaying. Steve has BSEE and MSEE degrees from Virginia Tech University. Steve is an IEEE Senior Member and a member of the IEEE PSRC, and has presented at numerous conferences.
Figure 2: Wiring Conduit
Figure 3: B-Phase Differential Loop



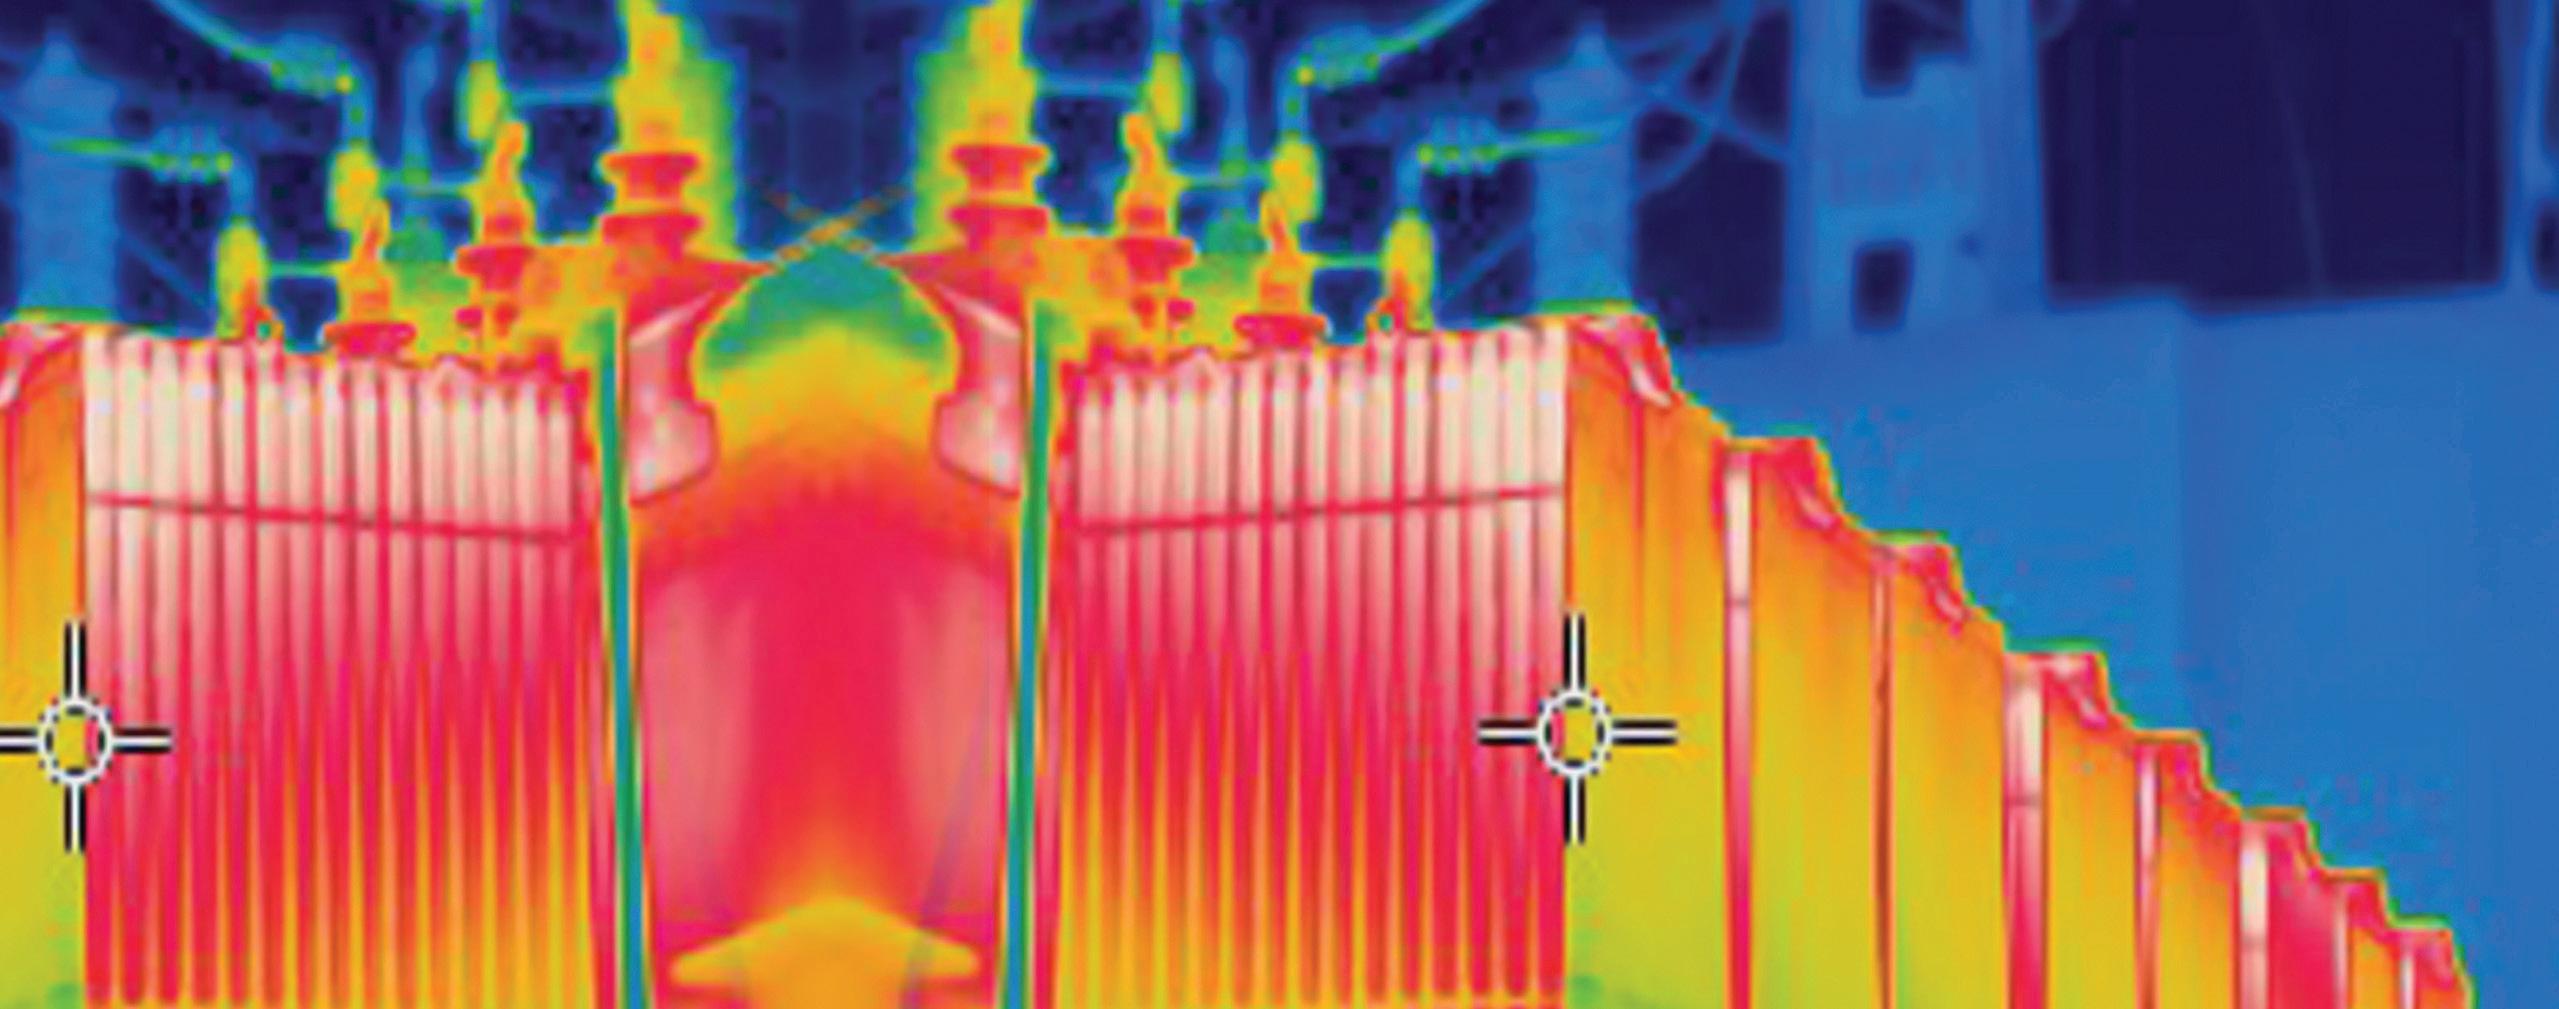
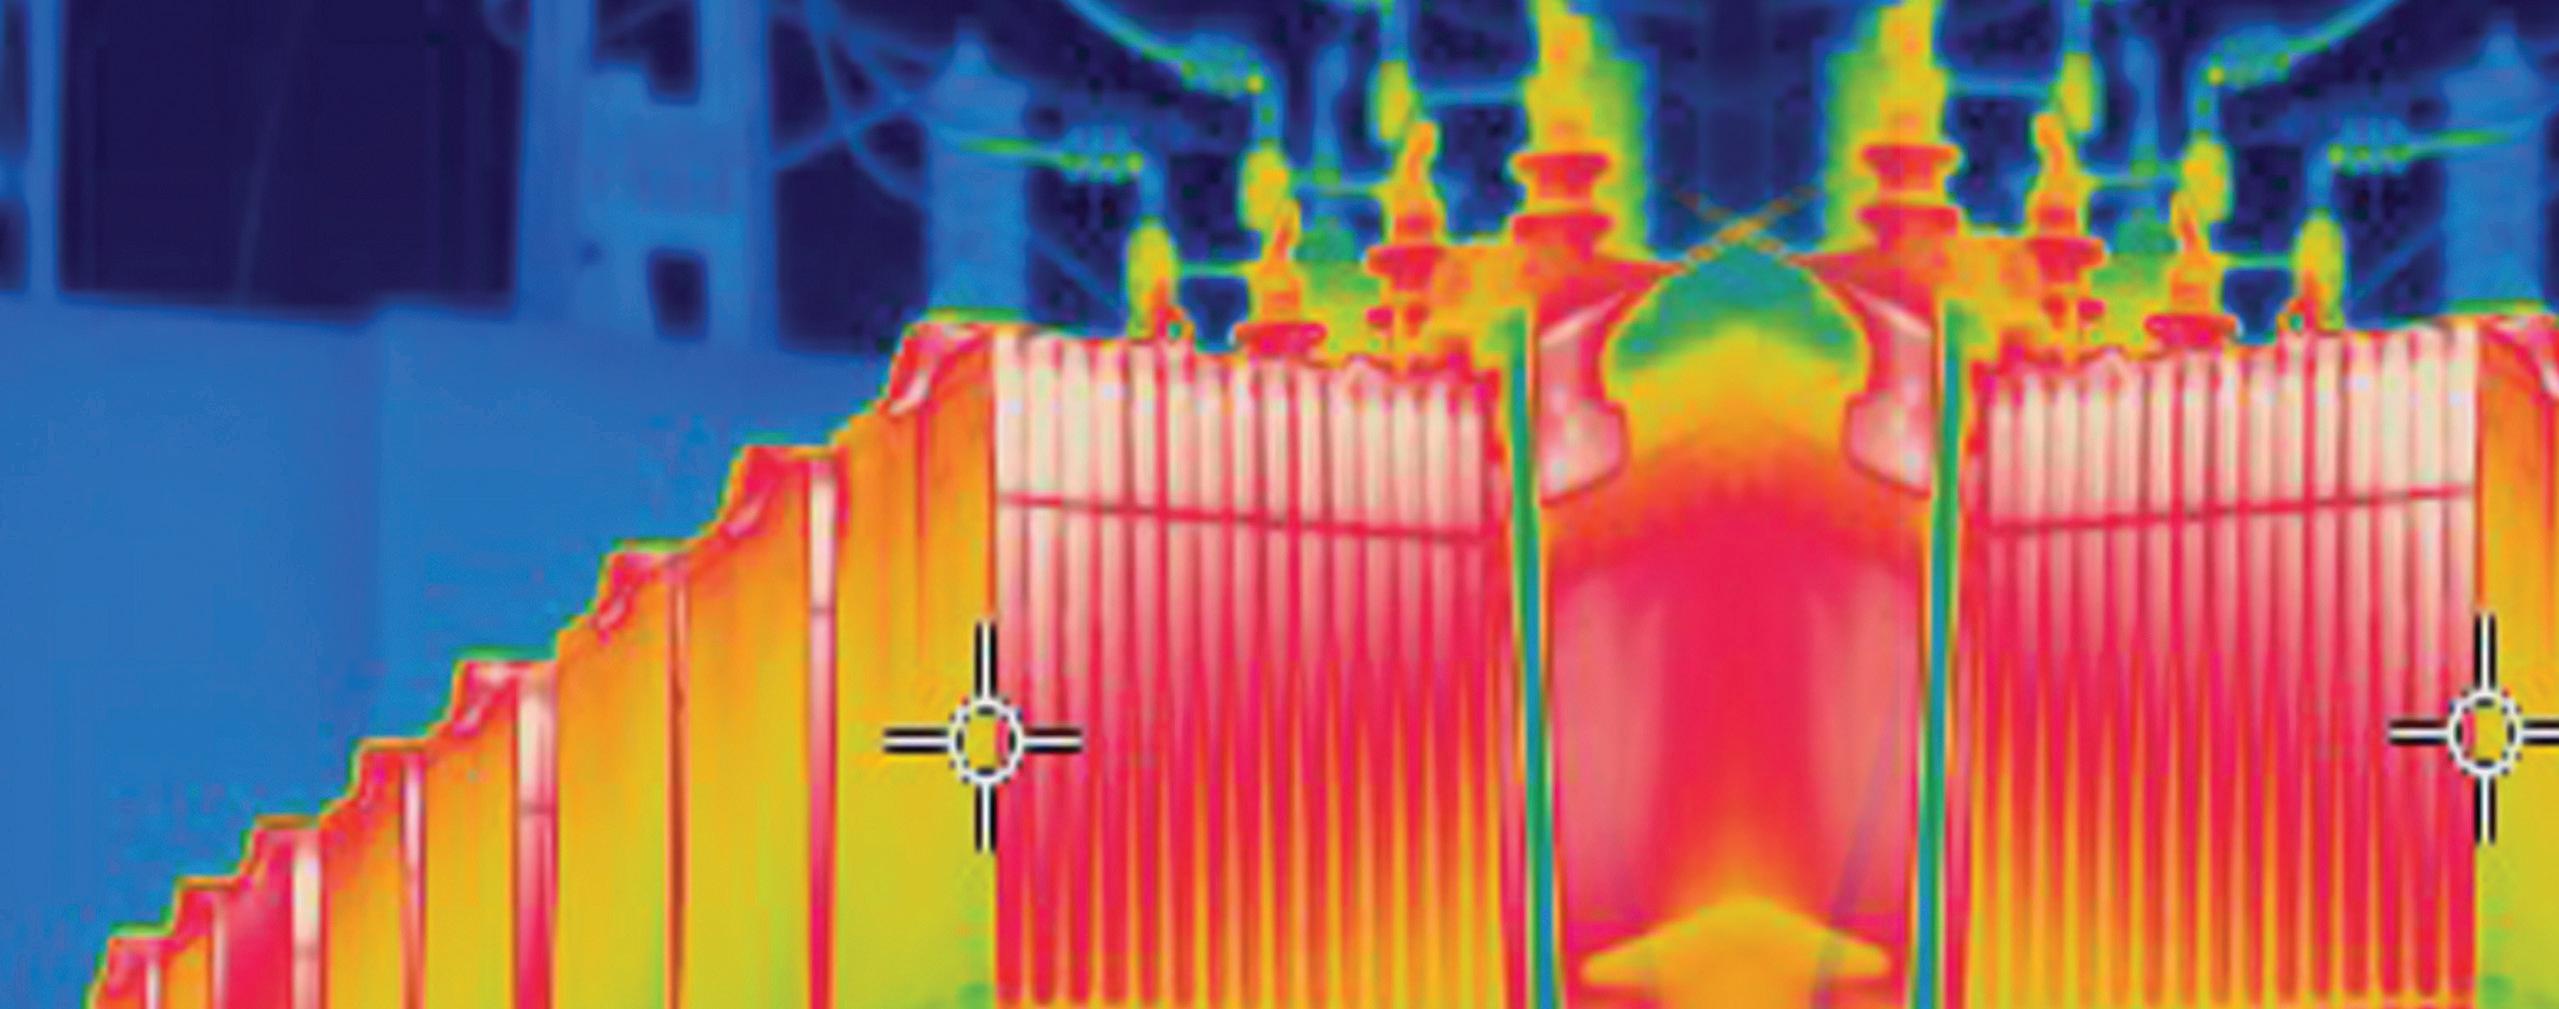
USING THERMOGRAPHIC SURVEYS TO MONITOR CONDITION
BY MICHAEL LABEIT, 249th Engineer Battalion, U.S. Army Corps of Engineers
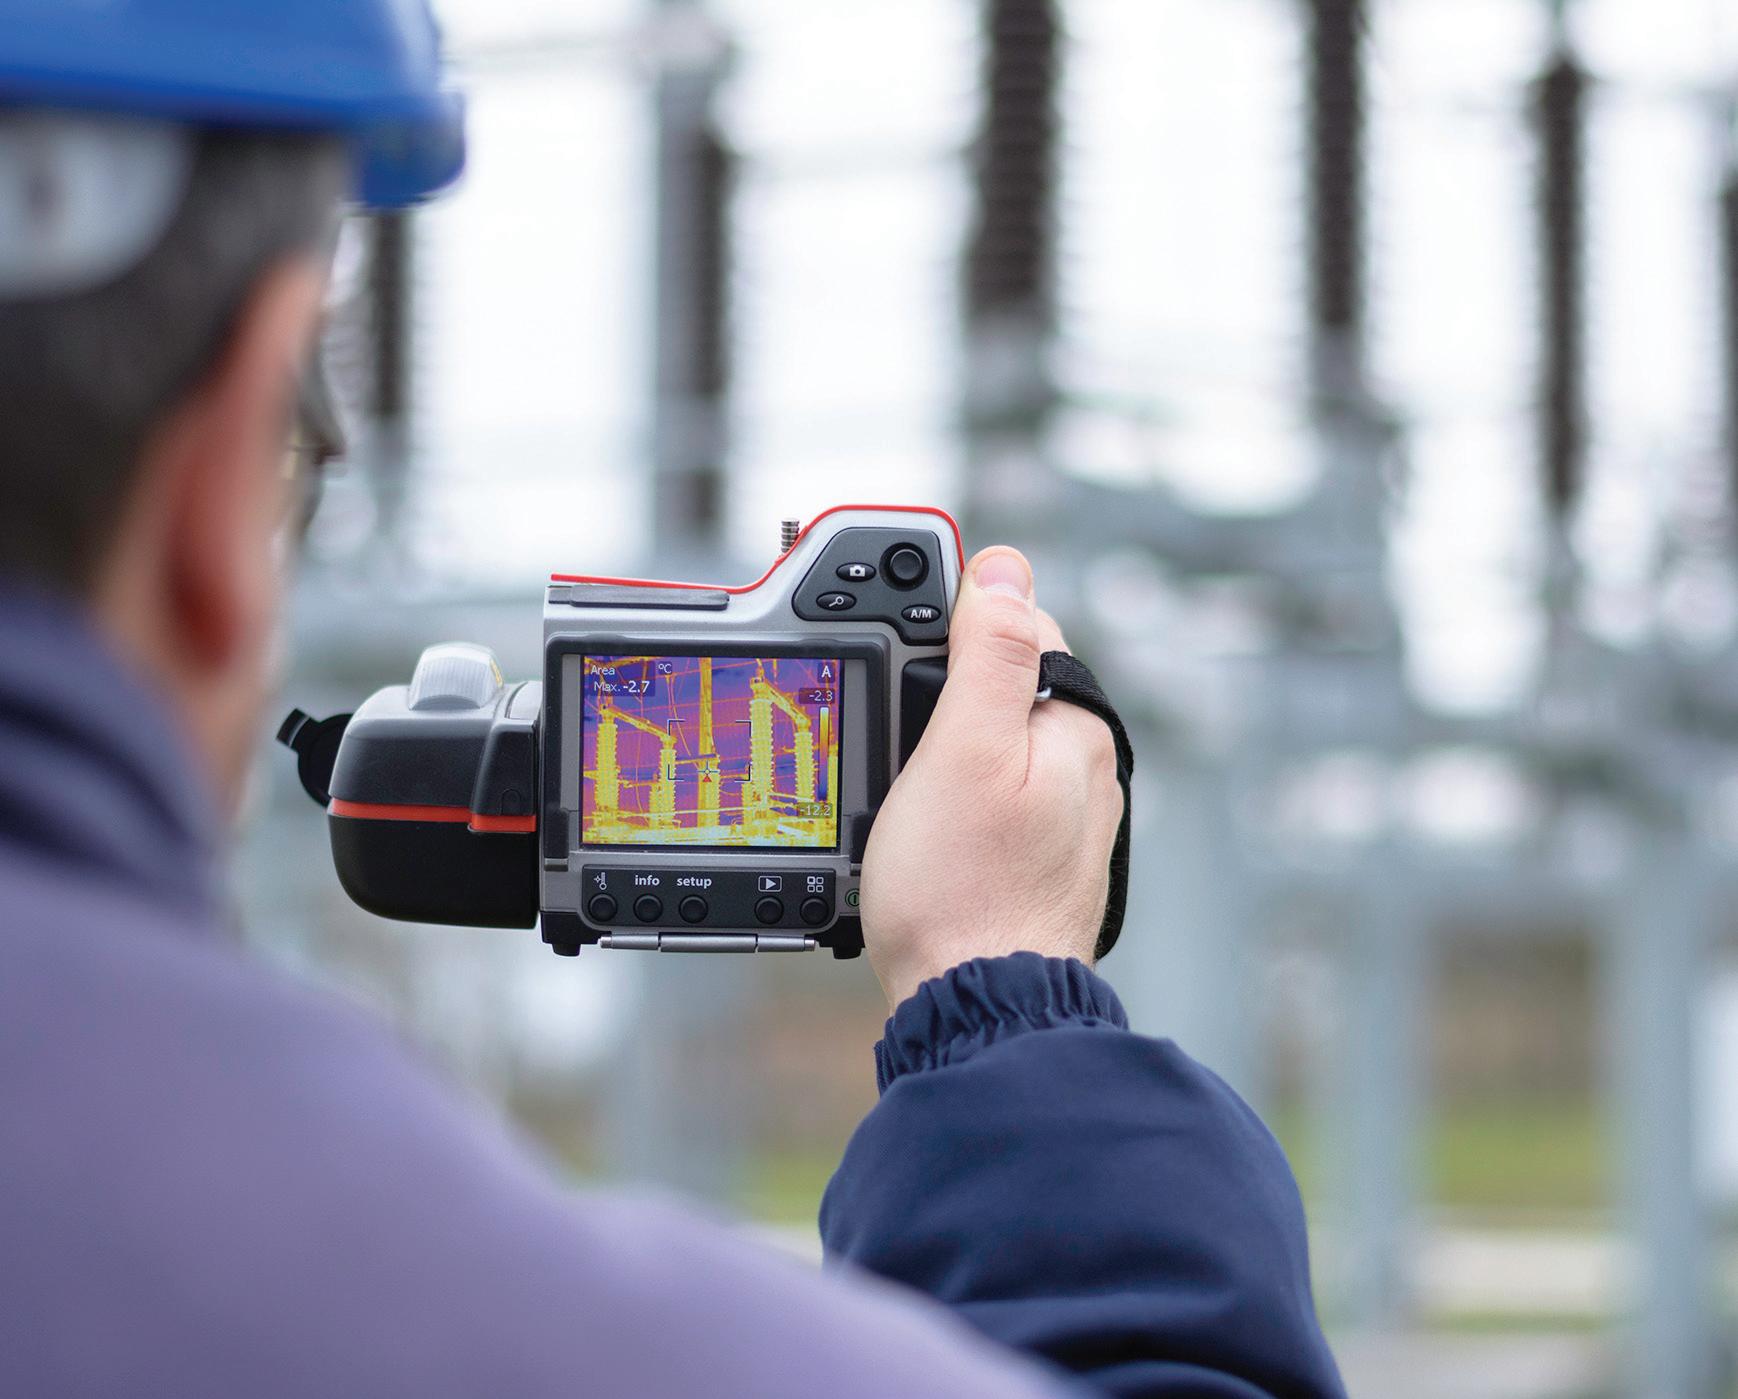
The most basic maintenance begins with our senses. Electrical and mechanical equipment tend to produce distinct sights, sounds, or smells before it fails. However, our senses have strict limitations.
• Bad sights, sounds, and smells are late indicators of defects. If a cable termination makes audible noise, you can be sure that the internal anomaly producing said noise has been metastasizing for quite a while. Our senses rarely enable us to locate early defect indicators when the cost of equipment repair would be cheaper.
• Our senses are severely narrow. For example, the visible light spectrum, the range of photon wavelengths available to human eyes, constitutes only 0.0035% of the electromagnetic spectrum. That leaves out 99.9965% of the spectrum. To fill that large gap, we need specialized equipment that goes beyond our senses. One such piece of equipment is a thermal imager/camera.
BACK TO SCIENCE CLASS
Anything above zero kelvin will produce infrared radiation. There is no molecular movement at 0 K, including electron movement. When electrons move back into inner atomic orbitals (which is only possible above 0 K), a photon is released. Photons constitute electromagnetic radiation. Gamma rays are photons. So are radio waves. The electromagnetic spectrum simply refers to the
range of wavelengths and frequencies that photons can possess. Visible light constitutes photons with a wavelength from 0.38 μm to 0.75 μm. Above that wavelength, we have infrared radiation, which ranges from 0.75 μm to 1,000 μ m. Most infrared cameras are equipped to detect radiation in the long wave zone, roughly from 8 μm to 14 μm.
For our purposes, all infrared radiation (also known as radiant power) measured by a thermal imager is emitted ϵ, reflected ρ, or transmitted τ (or some combination of all three) at a given wavelength (Figure 1). Mathematically, this means that ϵ + ρ + τ = 1, where each variable is a unitless number ≤ 1.
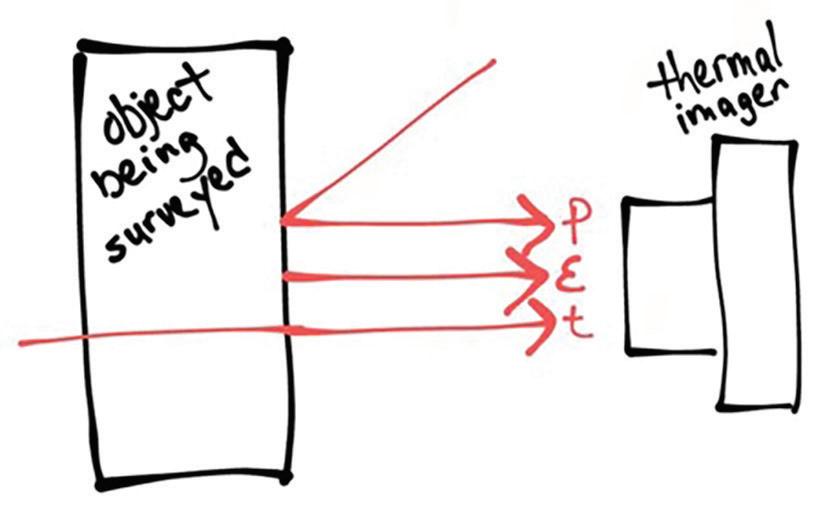
Figure 1: IR Radiation Paths
Objects can emit, reflect, and transmit infrared radiation at widely varying levels. Insulators like polymers and porcelain have high emissivities, meaning their infrared signatures largely reflect their own temperatures. By contrast, conductors like copper and aluminum tend to have low emissivities (particularly when they are polished). Instead, they have high reflectivities, meaning their infrared signatures largely reflect temperatures of background objects. Lastly, some objects like air have high transmissivities; their infrared signatures largely reflect objects behind them.
USING A THERMAL IMAGER
Suppose you want to measure the surface temperature of an opaque (τ = 0) object — let’s call it X. The thermal imager measures the incident radiant power Rmea of X in units called watts per steradian per square meter (Wsr-1m-2). Then, taking into consideration the radiation reflected Rref by X from background objects
(i.e., the ambient temperature converted into radiant power via a pre-programmed radiance vs temperature curve) and the emissivity of X, it calculates the radiation Robj that strictly corresponds with X’s surface temperature via the following equation (Lanzoni, 2015):
Robj = (Rmea – ((1 - ϵ)Rref))/ϵ
After calculating Robj, the imager uses the same radiance vs. temperature curve for Rref to convert Robj to Tobj, the surface temperature of X (Figure 2). The transmissivity of the atmosphere can be safely ignored (i.e., τatm = 1) as a mathematical variable if viewing objects within 50 m (Lanzoni, 2015). Let’s do an example.
Suppose you want to measure the surface temperature of a cold-shrink splice in a TRXLPE medium-voltage cable. Cold-shrink splices are typically made of synthetic rubber.
PHOTO: © ISTOCKPHOTO.COM/PORTFOLIO/SHINYFAMILY
The emissivity ϵ of rubber is at least 0.9. Suppose also that the ambient temperature is 20°C (this setting is not modifiable in all thermal imagers). After manually entering the ambient temperature (which the imager

converts to approximately 1.61 W/m2sr as shown in the measured radiance vs. temperature curve in Figure 2), and the splice emissivity into the imager settings, you aim the imager at the splice. Say the imager measures a radiant power Rmea of 2.3 W/m2sr on the surface of the splice. After that measurement, the imager makes the following rapid calculation:
Robj = (Rmea – ((1 - ϵ)Rref))/ϵ
Robj = (2.3 W/m2sr – ((1 – 0.9)1.61 W/m2sr))/0.9
Robj = 2.377 W/m2sr
2.377 W/m2sr converts to approx. 30.5°C IAW the measured rad vs. temp curve
Tobj = approx. 30.5°C = what appears on the imager screen
As you can see, correct emissivity settings are critical for accurate temperature readings.
VOLTAGE, INC.




PREVENTATIVE ELECTRICAL MAINTENANCE PROGRAMS
DATA CENTERS, COMMERICAL HIGH RISES, CRITICAL ENVIRONMENTS & FINANCIAL INSTITUTIONS
DEVELOPMENT & UPDATES OF ELECTRICAL SINGLE LINE DIAGRAMS
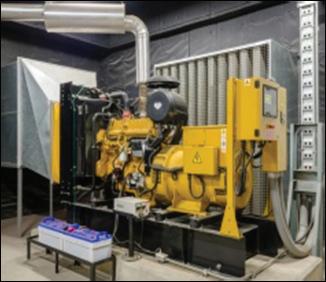
EMERGENCY GENERATOR & PARALLELING SWITCHGEAR TESTING
SITE SPECIFIC SAFETY & TECHNICAL TRAINING
24 HR EMERGENCY SERVICE
INFRARED SCANNING
ACCEPTANCE TESTING
ENGINEERING
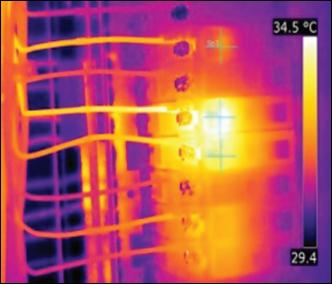
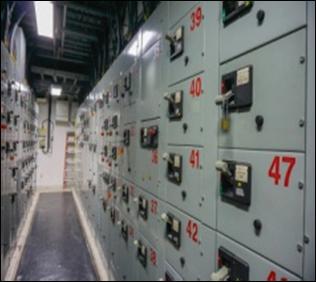

Figure 2: Radiance vs. Temperature (Lima Filho et al., 2017)
Overestimating the emissivity of a target object will lead to underestimating its temperature. Luckily, emissivities for various materials can be easily referenced.
BACK TO THE FIELD
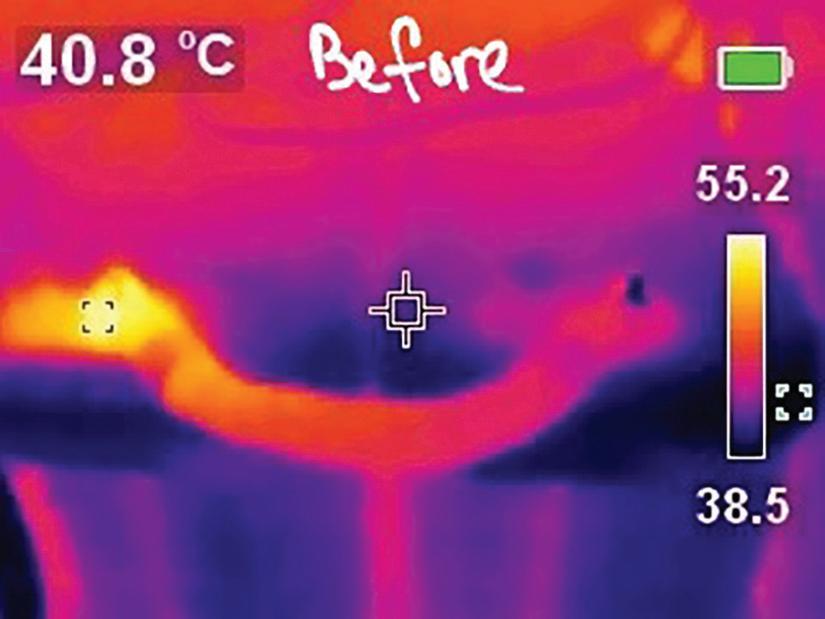
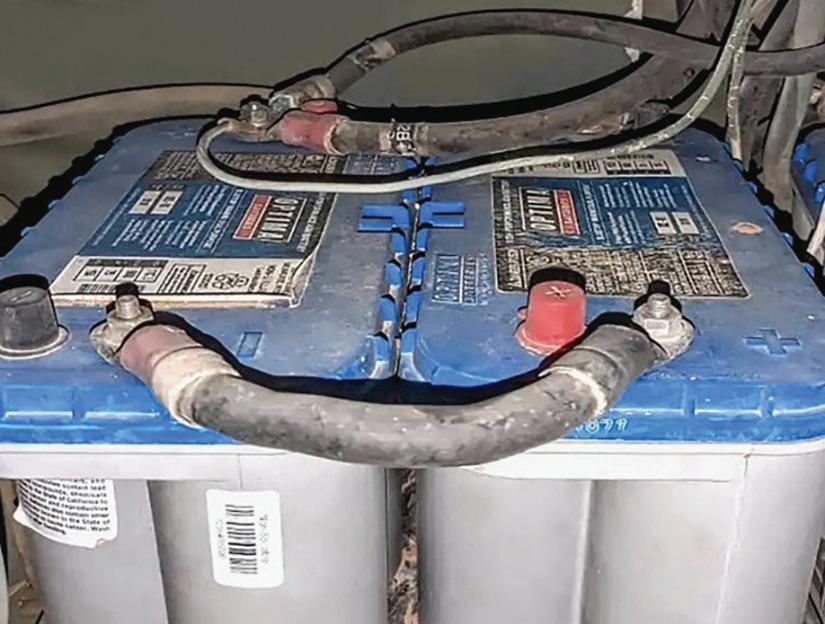
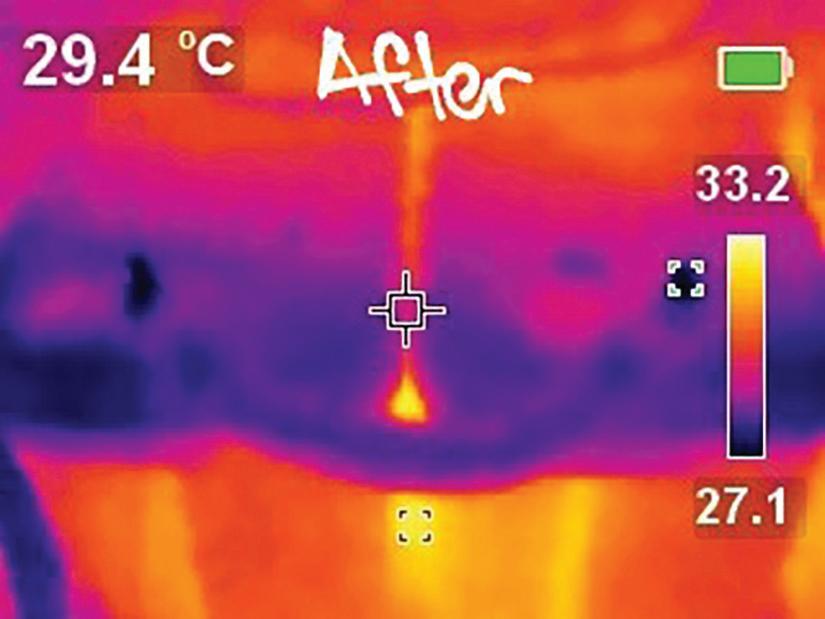
I perform thermographic surveys as part of my personal electrical inspection routine. When I arrived on site during a year-long, overseas deployment as a medium-voltage power plant operator for the U.S. Army Corps of Engineers (USACE), I immediately began surveying the plant with my personal imager, a Klein TI250. Just a few minutes into my very first survey on my second day of shift work, I found a thermal anomaly, better known as a hotspot, i.e., an area of overheating, on one of the terminals of a generator battery bank (Figure 3).
Electrical hotspots are usually caused by loose connections (loose connections cause high resistance and high resistance produces extra heat). Loose connections occur particularly often on generators because they are constantly vibrating, thereby reducing the clamp load of bolted connections. But when I moved the battery strap to see if it was loose, it didn’t budge as I expected. Maybe the nut on the threaded terminal needed to be re-torqued just a few ftlbs, I thought.
I noticed other defects as I inspected further. The ammeter on the battery bank charger was fluctuating wildly. I checked the current again on the battery strap with a DC clamp-on ammeter, and sure enough, the ammeter reading kept
fluctuating between 2 A and 5 A. I know from both experience and my reading that battery chargers are supposed to rectify AC into nonpulsating DC. Fluctuating current, otherwise known as ripple current, occurs when the rectifier on a battery charger malfunctions. DC that has been rectified from AC still pulsates like AC. Rectifiers require a series of inductors and capacitors to filter the pulsating DC into smooth,
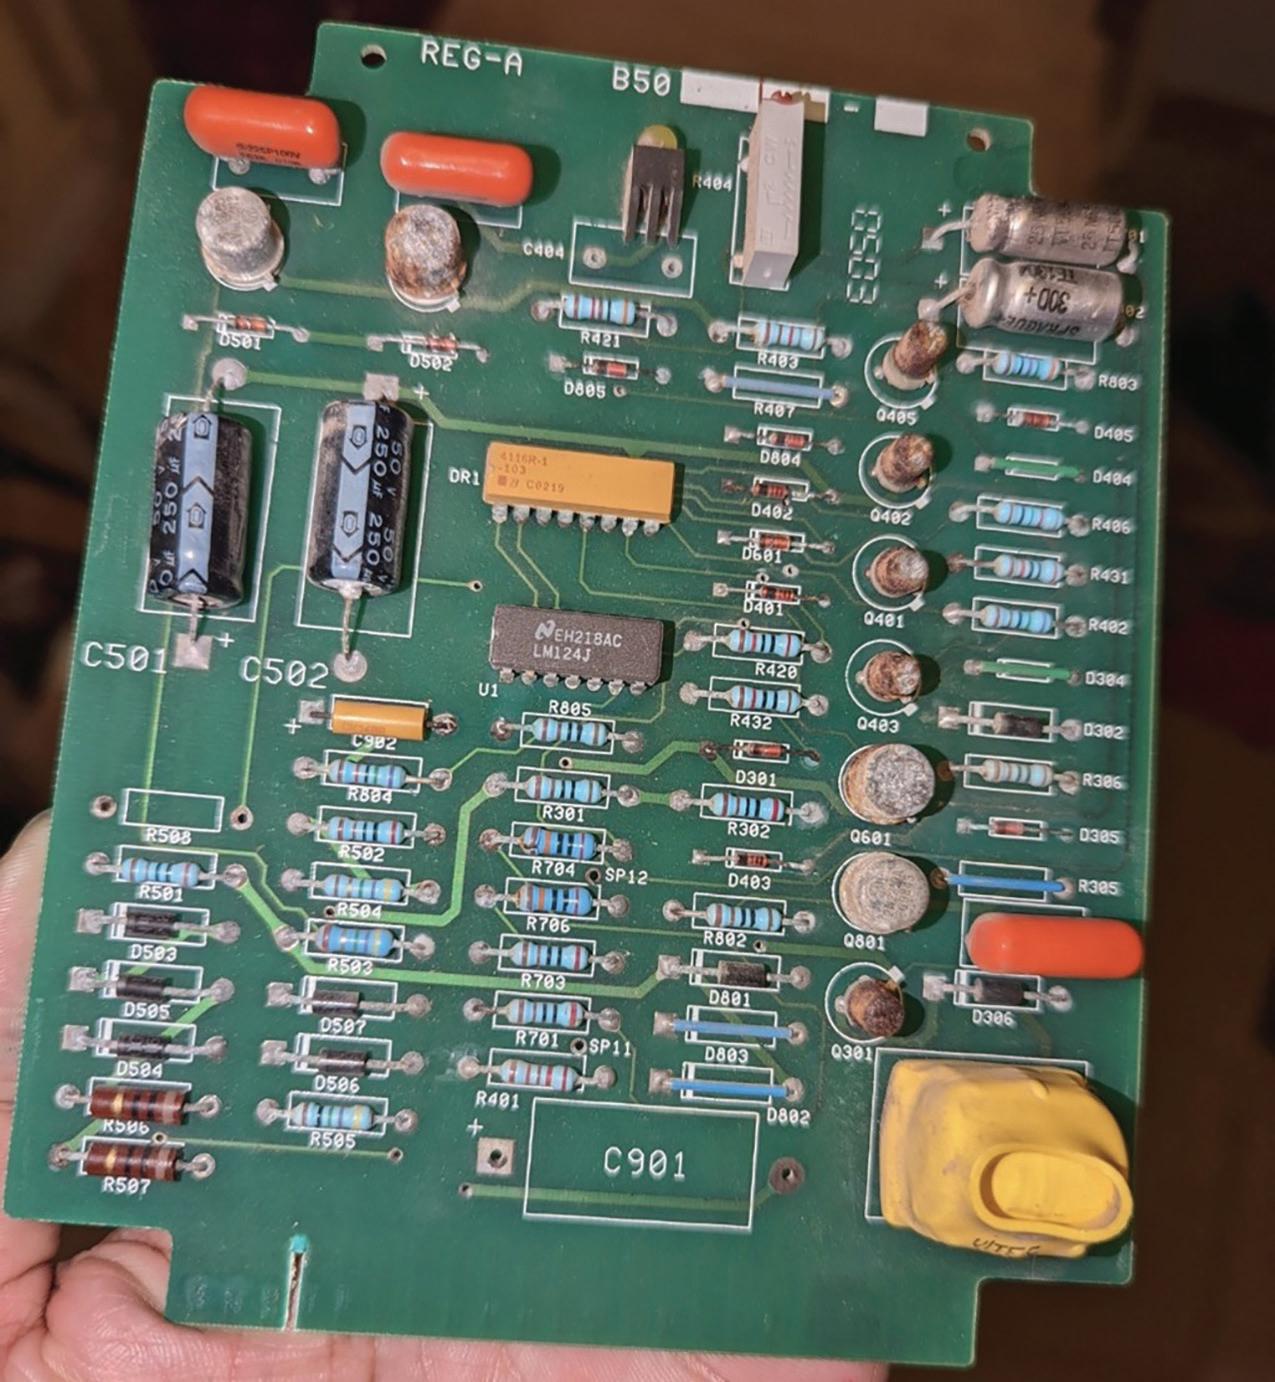
Figure 3: Thermal Anomaly (Hotspot) on Battery Bank Terminals
Old Rectifier Card
IN THE FIELD
non-pulsating DC. If any of those capacitors or inductors fail, the DC will begin pulsating again.
Ripple current leads to continual charging and discharging of battery banks, creating undesirable heating that can eventually lead to thermal runaways, especially on valve-regulated lead-acid batteries, which happened to be the only batteries used in this plant.

When we pulled the rectifier card (pictured) from the charger, we weren’t surprised. The card was visibly worn, and many of the bipolar junction transistors had developed rust. We replaced the old card with a new one, and when I conducted my survey the next day, the thermal anomaly had disappeared.
LESSONS LEARNED
1. Do infrared thermographic surveys — often. Infrared surveys vastly extend our sense perception, enabling us to detect a whole host of anomalies, defects, and faults that are otherwise concealed. Moreover, they are non-destructive and do not require scheduled shutdowns. There’s a reason why thermographic surveys figure prominently in ANSI/NETA MTS-2019. They have their own section (#9), their own table (100.18), and feature as a visual/mechanical inspection performance step for basically every testable component
Figure 4: Anomaly Has Disappeared
2. Compare and contrast similar pieces of equipment. Equipment in good condition will perform similarly under similar circumstances. The charger in question was the only one in the plant that fluctuated; the rest were steady. This was a tell-tale sign that either circumstances were different or the equipment was not in good condition. Circumstances hadn’t changed, so that narrowed it down to equipment condition.
3. Diagnostics are everything. One way of comparing equipment is to gather data. Similar equipment under similar conditions will yield the same data, e.g., the same temperature, the same current, the same voltage, etc. You can’t investigate an anomaly if you don’t know it exists, and the best way to become aware of anomalies is through gathering data.
REFERENCES
Lanzoni, D. (2015). 2.1.4. Infrared Thermography: Electrical and Industrial
Applications (pp. 43-47). CreateSpace Independent Publishing Platform, ISBN 1511836679.
Lima Filho, G.M.; Almeida, R.D.; Castro, R. M.; & Damião, A. J. (2017). “Operational Measurements for Infrared Camera Characterization.” Journal of Aerospace Technology and Management, 9(4), 519-528. doi:10.5028/jatm.v9i4.589.

Michael Labeit is a Prime Power Production Specialist, Lineman, and NETA Level 2 Technician in the 249th Engineer Battalion, U.S. Army Corps of Engineers. Michael has operated and maintained medium-voltage power plants in Turkey, Saudi Arabia; Ft. Leonard Wood, Missouri; and Ft. Bragg, North Carolina. He is presently overseas and in charge of condition-based maintenance for Defense Department electrical assets. His team won 1st place in the military division at the 2021 International Lineman’s Rodeo in Kansas City. He graduated from Prime Power School in 2018 and has an AS in applied science from Excelsior College.

ROTATING MACHINERY HAZARD AWARENESS
BY PAUL CHAMBERLAIN, American Electrical Testing Co. LLC
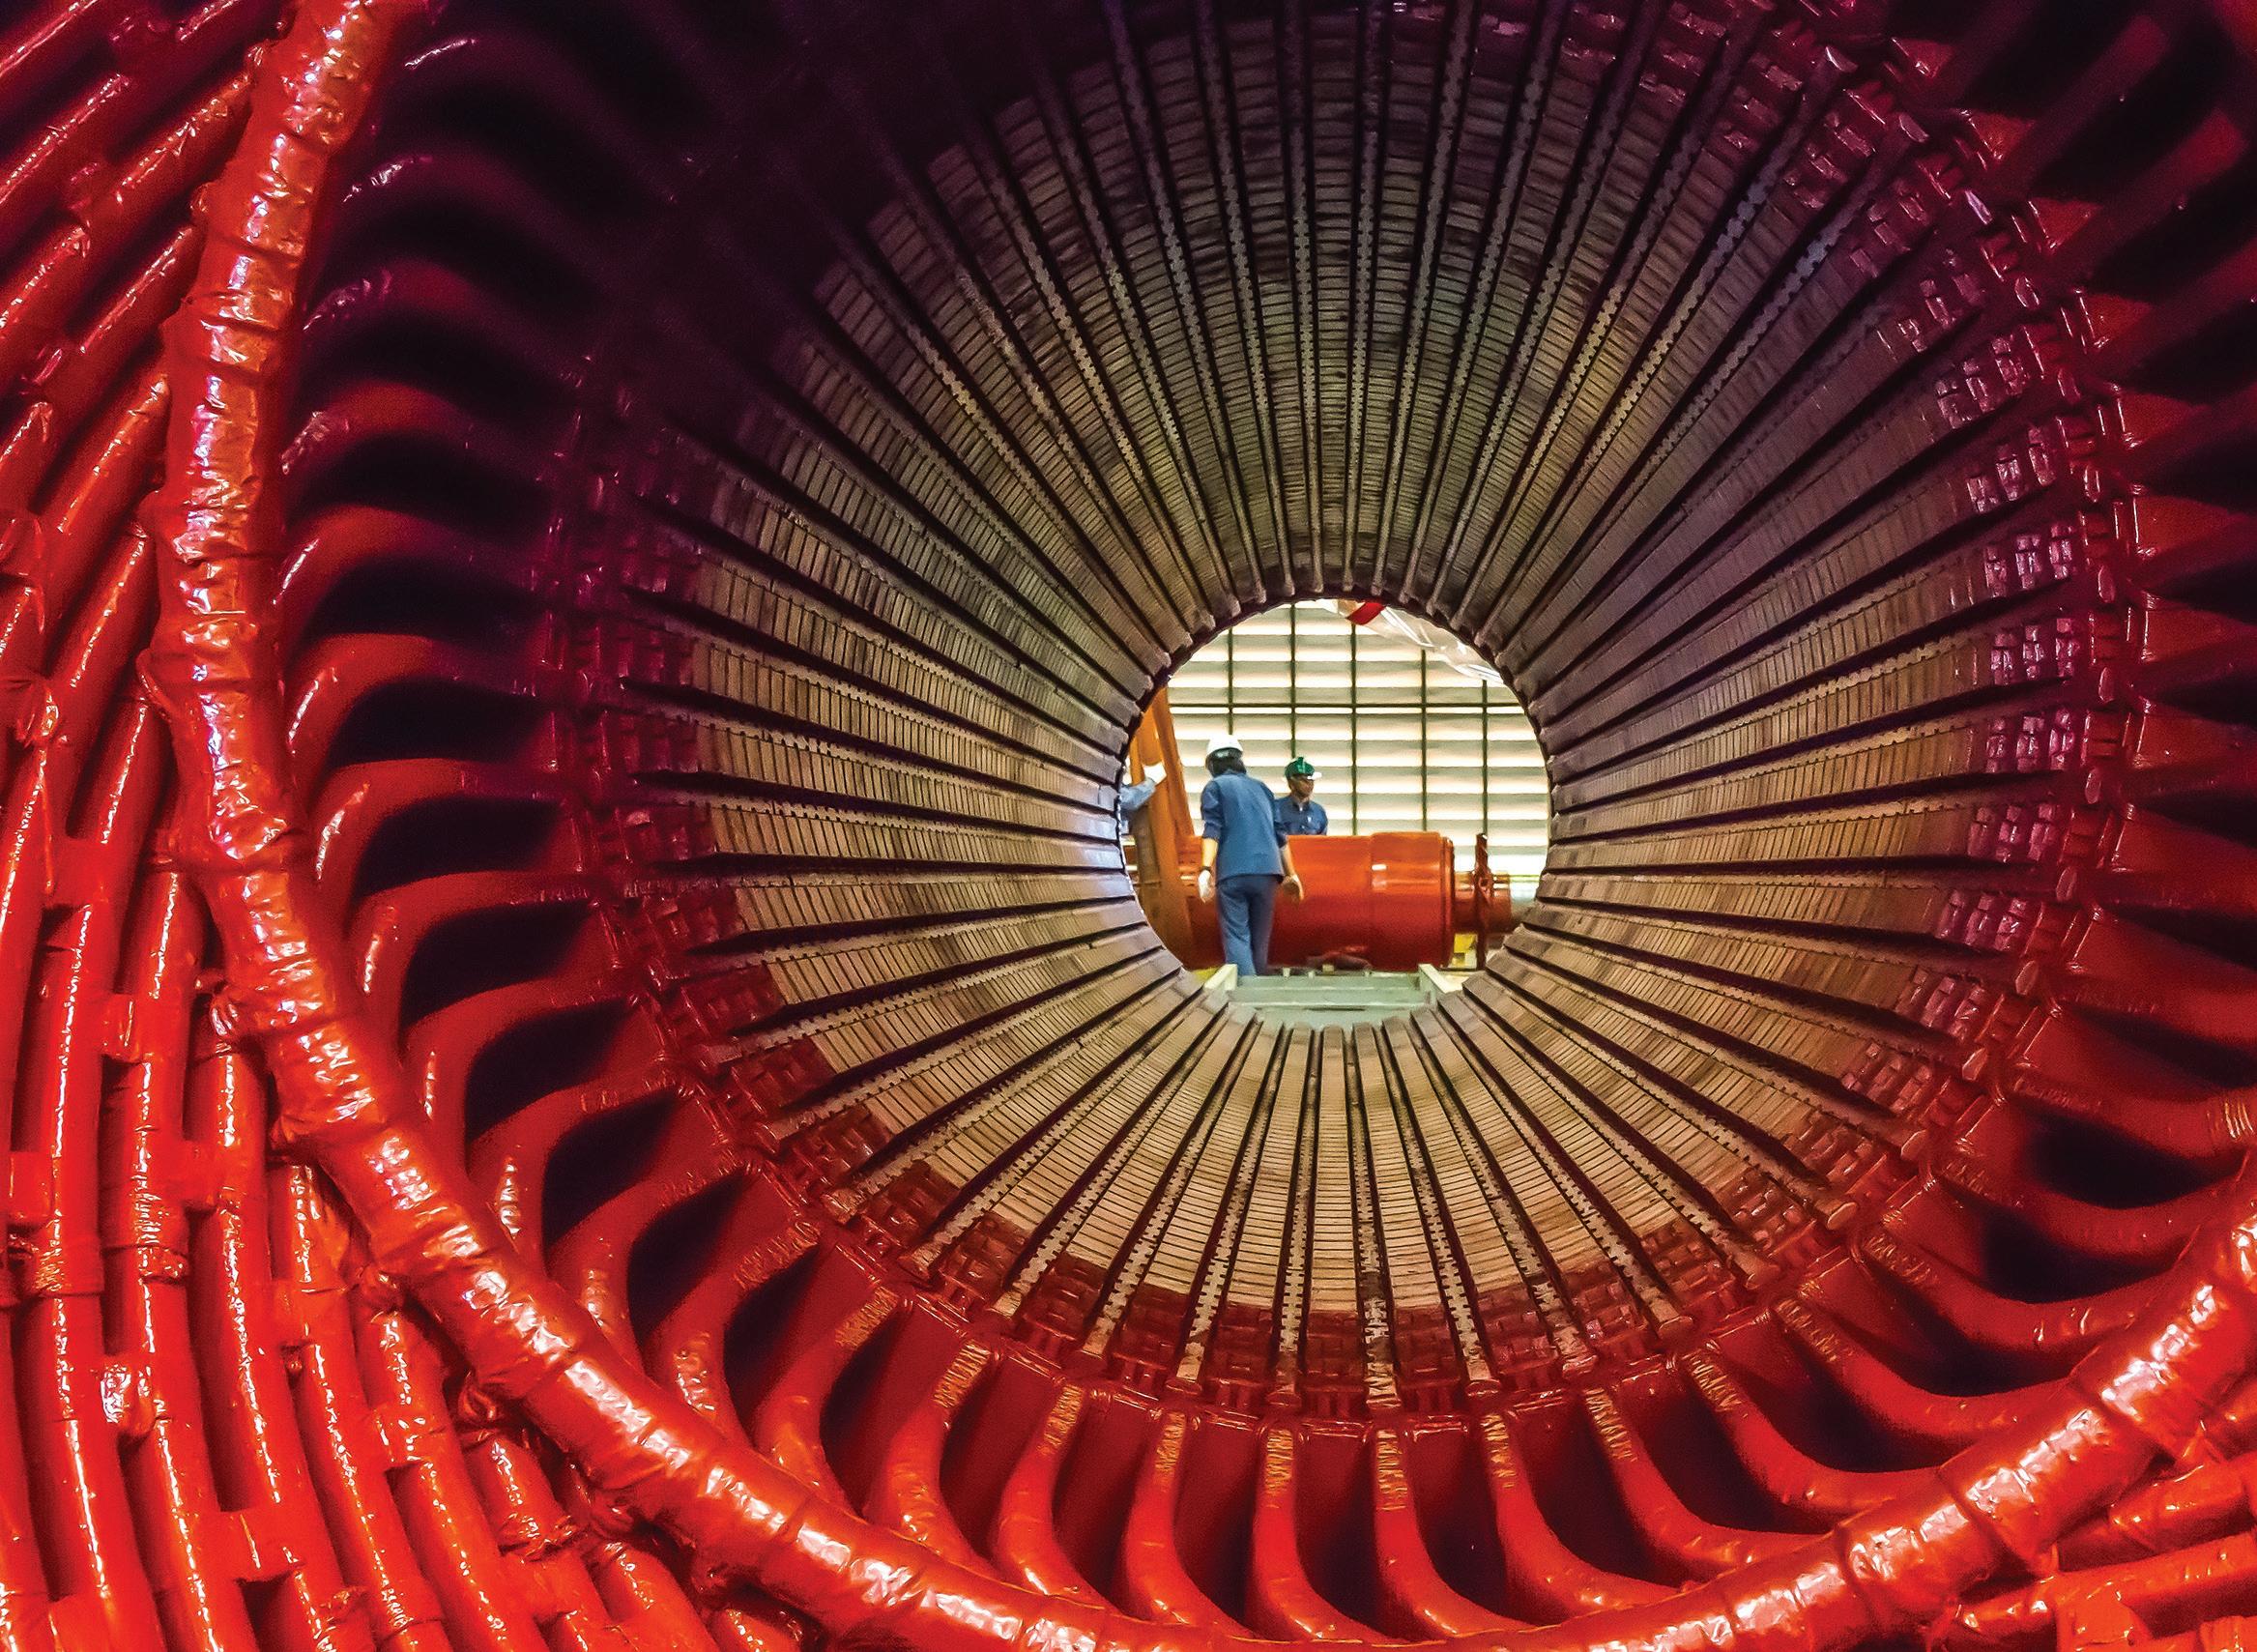
Performing condition analysis or maintenance on rotating machinery is a hazardous task that requires an experienced individual who is capable of performing the duty and possesses a solid ability to identify any potential hazards and mitigate their risks.
Inadvertent injuries, such as crushed hands, arms, severed fingers, blindness, or death can occur from rotating machinery if extreme caution is not exercised. The use of lockout/ tagout, personal protective equipment (PPE), and other means of safeguarding can mitigate possible injuries. Social media is full of videos showing employees who were seriously injured when they failed to use caution while working around rotating machinery.
Analyzing the condition of rotating equipment can be performed using products designed to access equipment while it is operating, including infrared survey, partial discharge detection, and vibration analysis. The PPE required for the task should be appropriate and adequate for all tasks that are to be performed. Long sleeves, long hair, jewelry, and other loose articles are an invitation for disaster when around rotating machines. Make sure sleeves are tight, hair is pulled back or tied up, and any other sources of entanglement are removed.
Any machine part, function, or process that can cause injury must be safeguarded. When
operating a machine or when accidental contact with a machine can injure the operator or others in the vicinity, the hazards must be mechanically controlled or eliminated.
When visually inspecting rotating machinery, ensure all guards are properly installed per the manufacturer’s instructions and comply with OSHA 29 CFR 1910.212, General Requirements for All Machines , Subpart O, Machinery and Machine Guarding, as well as OSHA 29 CFR 1910.219, Mechanical PowerTransmission Apparatus. For Canada, refer to the Canadian Center for Occupational Safety and Health (CCOHS) regulation CSA Z432, Safeguarding of Machinery. Depending on the type of machinery being inspected, additional regulations may apply.
HAZARDS
The following paragraphs identify and examine hazards, the means of safeguarding them, and potential ways to mitigate the associated risks. This article does not include EVERY potential hazard from performing a task, but explores potential hazardous situations.
Additional hazards may exist, depending upon the type or condition of the equipment. Take all procedures seriously, and verify that the instruction manuals used are specific to the equipment. Check for and identify potential hazards prior to beginning every task by using a pre-job brief worksheet.
Electrical and Mechanical Hazards
Improper lockout/tagout procedures are a major contributing factor to injuries caused by rotating machinery. Controlling the hazardous energy of the motor is essential, and many forms of energy may be involved. Always refer to the appropriate OSHA regulation or required procedure, such as 29 CFR 1910.147 and 29 CFR 1910.333 or CCOHS CSA Z460-20, Control of Hazardous
Energy — Lockout and Other Methods, and the manufacturer’s instructions to determine the proper lockout/tagout or required procedure. The most obvious hazardous energy source that could cause injury to the worker is electrical. Other hazards may be harder to recognize.
Electrically de-energize rotating machinery from the primary energy source and ensure the equipment is disconnected from all sources of power, AC as well as DC, if applicable. Once de-energized, verify that the equipment is at a zero energy state using the manufacturer’s approved method. Verify the accuracy of the detection or voltage measuring device against a known source, then check for zero energy on the de-energized equipment, then test the
SAFETY CORNER
detection equipment against a known source again. This will verify that the detection meter was functional during the check. Testing for voltage will require its own level of PPE depending upon the voltage and test procedure per NFPA, OSHA, or CCOHS.
Electrical energy isn’t the only energy that requires lockout/tagout. Rotating machinery can also contain a large amount of mechanical energy, which may not be readily obvious. This energy must be dissipated prior to servicing, or serious injury could occur to the worker. Once the energy has been discharged or dissipated, it is also advisable to lockout/tagout any charging mechanism, if feasible. Ensure that remote operating handles are tagged in a local or manual mode. This will prevent another worker from inadvertently operating the machinery.
Chemical Hazards
Machinery operating mechanisms may also be pressurized with a liquid or a gas. Ensure the unit is depressurized and/or discharged and the source of the pressure is disabled. Ensure any valves upstream or downstream of the device are closed, and lockout/tagout each valve. Once disabled, this source must also be locked out/ tagged out prior to performing maintenance.
Chemicals can be a hazard, depending upon the type of rotating machinery and the process the machine is associated with. Caution must be taken with gas or liquid chemicals. Many processes produce gases that are denser than air, so the gas displaces oxygen in lower-lying areas. Ventilation must be used to avoid trapping these gasses.
Some lubricants and cleaners are a respiratory and skin irritant if used in enclosed areas or during contact with exposed skin. Knowing the material used, reading the container labeling, and checking the safety data sheet (SDS) is advised to identify any potential health effects from its use. Using proper PPE is necessary while using some cleaners and lubricants. Nitrile gloves, safety glasses, a face shield, and even respiratory protection may be needed in some cases.
Other Physical Hazards
When performing visual inspection, mechanical inspection, maintenance, or electrical testing on rotating machinery, gravity is a less-obvious form of energy that must be controlled. The size and weight of panel covers and inspection plates can make them difficult to handle. Should gravity be a potential energy source to a piece of rotating machinery, such as a drive motor for an inclined loaded conveyor belt, ensure the energy is dissipated and any flywheels or other sources of energy or moving parts are chained or locked in position prior to performing lockout/tagout and maintenance.
Human Error Hazards
Human error is a mistake someone makes. To help prevent an error, follow a procedure or checklist while performing the task. If one doesn’t exist, create one.
Nomenclature should be verified and re-verified upon approaching a piece of equipment — every time. Perform a self-check and a peercheck to ensure the task is being performed on the correct component.
Utilize markings such as flagging when working around similar-looking pieces of equipment to identify components that should not be touched. Flagging can take several forms depending upon the company or client’s policy and procedures. Do not forget to identify, mark, then lockout/ tagout all associated equipment (i.e., associated cables and compartments). Flagging can also be utilized to indicate a component that is not operating normally.
Use barricades to create a safe work zone. This prevents other workers from inadvertently entering the work area. It also ensures that maintenance and testing is conducted in a controlled area. The worker should utilize a test stand in this area if applicable. Ensure any control voltage required to operate the equipment during testing is within a secured area.
PPE Hazards
After verifying that the rotating machinery is de-energized, disconnecting the equipment
may require a different form or class of PPE. To ensure proper PPE is utilized for the class of disconnection methods, refer to the applicable regulatory agency for the required PPE and the hazard/risk class, which will indicate what level of protection is required. Identifying the correct level of PPE and gloves will help mitigate injury from a potential arc flash. Remember, these regulatory agencies only provide information based upon known values of the short-circuit current available, the clearing time in cycles, and the minimum working distance. If those factors are unknown, more information must be gathered prior to performing the work to ensure personnel safety.
Temporary Protective Grounds
Grounds are an excellent secondary means of protecting the worker from inadvertent energization. Refer to any applicable OSHA, CCOHS, and NFPA regulation for specific guidance on grounding locations and sizing of grounds required for the task. Grounds must always be applied upstream and downstream of the equipment and as close to the work as possible. Using correctly sized and applied grounds is an additional safeguard for employees should a form of electrical energy be introduced into the system or equipment. Induced voltage or back-feed are just two forms of energy that may be inadvertently introduced into a system that has not been properly locked out/tagged out.
CONCLUSION
There are many things to be aware of when performing maintenance and testing on rotating machinery.
SAFETY CORNER
1. Obtain all service bulletins, maintenance documents, arc flash studies, and manuals prior to beginning work for the specific device.
2. Review all prints and one-line documents associated with the equipment.
3. Establish a safe work area, and barricade off the work area.
4. Perform a pre-job brief with all employees on site.
5. Wear proper PPE.
6. Disconnect the electrical feed and control circuit(s), verify mechanical interlocks are properly engaged, and test equipment before performing visual or mechanical inspections.
7. If applicable, verify that there is zero energy (test, check, test), and discharge all stored energy including pressurized gasses and gravity.
8. If possible, lock out and tag out ALL energy sources.
9. Connect grounds where and/if applicable.
10. Identify, visually mark, and/or flag equipment being worked on.
Being aware of and mitigating these hazards can lead to a safer work environment while inspecting, maintaining, and testing rotating machinery.

Paul Chamberlain has been the Safety Manager for American Electrical Testing Co. LLC since 2009. He has been in the safety field since 1998, working for various companies and in various industries. Paul received a BS from the Massachusetts Maritime Academy.

ROTATING MACHINERY
BY VIRGINIA BALITSKI, Magna IV Engineering
Rotating machinery is an essential component of most power systems, from compressors in petrochemical plants to turbines in hydroelectric generation plants. NETA Certified Technicians must be familiar with the maintenance and possible failure means of various rotating machines.
1. What are the two mechanical components of an electric motor?
a. Magnets and armature
b. Rotor and stator
c. Field windings and electric coil
d. Motor housing and bearings
2. At steady state, at what frequency does a synchronous motor rotate?
a. The same frequency as the supply current
b. A frequency slightly less than the supply current
c. A frequency higher that the supply current
d. Rotation independent of the supply current
3. Stator cores of rotating machines are composed of many thin metal sheets called laminations that reduce which of the following?
a. Damage to the rotor
b. Eddy current losses
c. Cost of construction
d. Overvoltages
See answers on page 130.
4. ANSI/NETA standards specify insulation resistance tests on induction motors and generators in accordance with which standard?
a. NFPA 70B
b. IEC 60044
c. IEEE 43
d. ANSI C137.5
5. Before any testing is done on electric machinery, the winding insulation must be?
a. At rated voltage
b. At the same temperature
c. Discharged
d. Water cooled

Virginia Balitski, CET, Manager –Training and Development, has worked for Magna IV Engineering since 2006. Virginia started her career as a Field Service Technologist and has achieved NETA level 4 Senior Technician Certification. She has since dedicated her time to the advancement of training and safety in the electrical industry. Virginia is a Certified Engineering Technologist through ASET – The Association of Science & Engineering Technology Professionals of Alberta. She serves on NETA’s Board of Directors, is the current Vice-Chair of CSA Z462, Workplace Electrical Safety, and is a member of the NFPA 70E, Electrical Safety in the Workplace Technical Committee.


February 26 – March 1, 2024 | Monday – Friday
Hilton Anatole | Dallas, Texas

Communicate your knowledge, assist the industry, and gain visibility. Presentations are sought in a number of categories:
- Electrical Safety
- Reliability
- Equipment
- Case Studies
- Transformers
- Relays
- Renewable Energy
- Circuit Breakers
- Cables
- Emerging Technologies
- Electric Vehicle Charging Systems
USING GROUNDING TO LOCATE CABLE FAULTS
BY JEFF JOWETT, Megger
Locating faults in buried or concealed cable is one of the most demanding, inventive, and interesting chores in all of electrical maintenance. The operator’s skills, knowledge, and ingenuity are paramount. When the power goes out, an entire facility, neighborhood, or community can be abruptly shut down without warning. Normally, this goes largely unnoticed as the utility seamlessly switches to another feed. But there are situations where power can be out for extended periods and constitute a major problem. Either way, the fault must be located and repaired, often under time pressure.
At one time, operator skill was the defining feature of this operation. Veteran repair techs could walk the line and feel the vibrations from the arc with their feet. At other times, it could be heard. Obviously, these WERE not scientifically reliable methods. They depended on operator skill and experience, and that was not always available or effective. Acoustic
and electromagnetic pickups were invented to detect a thump and trace the path of the buried cable more accurately and reliably.
NEW TECHNOLOGY
Rescuing the cable and getting the line restored is accomplished using a number of instruments and techniques. These include time domain
reflectometer (TDR), arc reflection, and thumper. Fundamentally, a capacitor builds up a considerable charge and discharges it down the line between conductors. These can be phases, ground, shield, sheath, jacket…as long as the two conductors are metallic and parallel and separated by a constant thickness of insulation. The pulse is affected when it encounters the fault. Some energy is reflected back and can be detected, such as by using a TDR, or it may arc and be detectable from the surface. Several methods and technologies have evolved to make use of these parameters, and these applications are improving all the time.
Stand-alone TDRs can be handheld, battery powered, and completely safe. They can be all that is needed for wiring like telecommunications twisted pair and concentric. But for power cable, a TDR alone may miss all but the most profound faults, such as bolted faults or complete opens. For the far more common problems, a thumper or thumper-TDR combination (arc reflection)
are in order. In these operations, grounding is absolutely essential.
GROUNDING
In all of these functions, grounding is an important element that is subject to being overlooked in the rush to find the fault and re-energize the line. Lack of proper grounding can make the test ineffective or more difficult to interpret. Worse, it can produce significant damage to fault locating equipment and even imperil worker safety.
In many common electrical operations, grounding is regarded as merely an extraneous level of protection that can be overlooked or forgotten without pronounced consequences. But in thumping, a prodigious amount of energy is applied to a faulted circuit that no longer conforms to design parameters because it has broken down in some undefined manner. Grounding is therefore an indispensable part of the testing procedure.
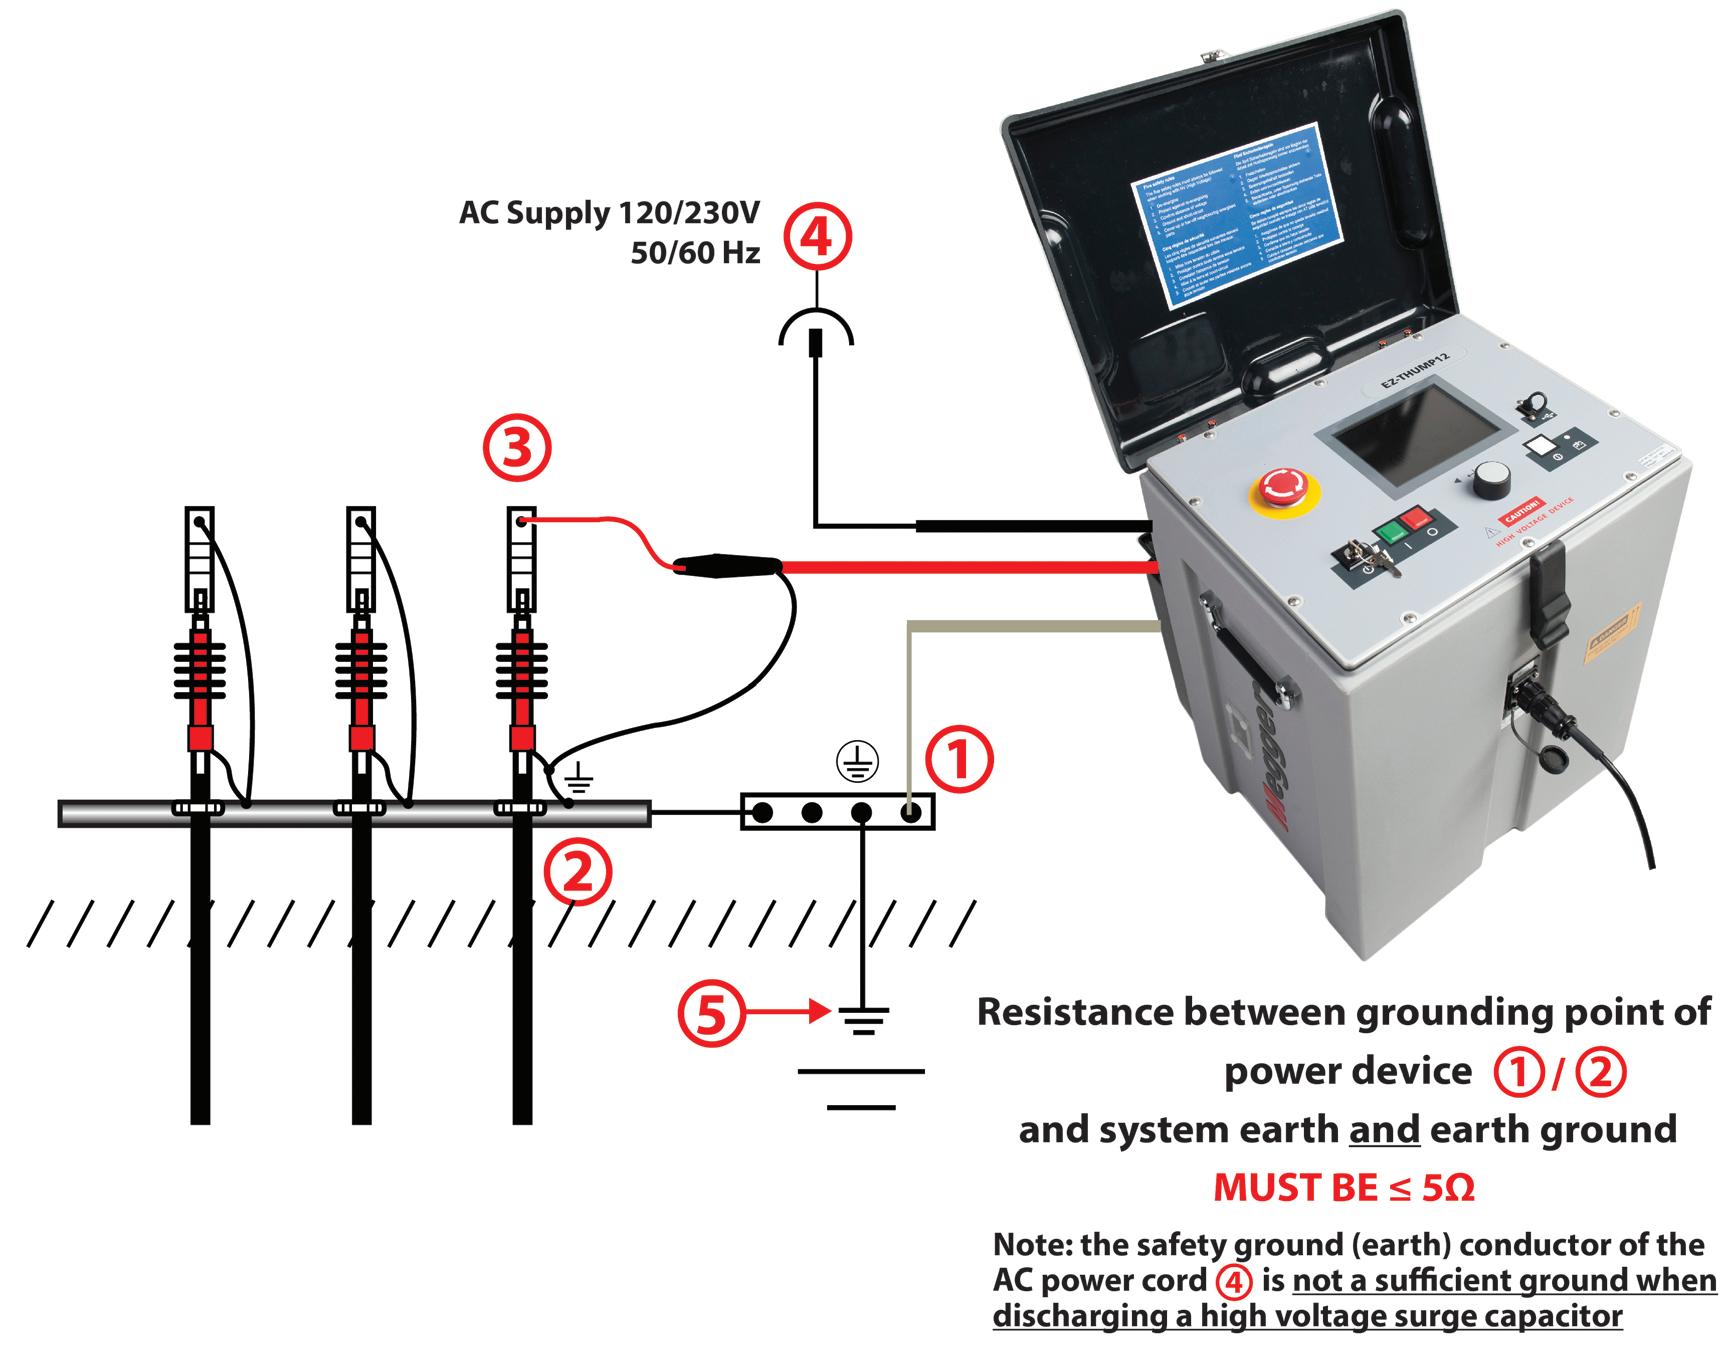
Figure 1: Single-Point Grounding Scheme
The tester should have a permanently attached safety ground lead that is connected to the system grounding point of the power device (transformer, switchgear, etc.). This should be attached by a firm clamp, not an alligator clip, because the levels of energy delivered by a thumper can knock an alligator clip loose and leave the system dangerously floating.
Temporarily driven ground rods are also discouraged because these may have too high a resistance to remote earth and therefore are not sufficiently protective. In the worst case, a large pulse can even dislodge them from the earth. The high-voltage return or shield of the test lead is connected (again via clamp, not clip) to the shield or neutral of the test item, and this is also bonded to the system grounding point. This grounding point in turn must have a resistance of no more than 5 Ω to remote earth measured with a dedicated earth ground meter.
Herein lies an imminent danger. This safety grounding must not be cavalierly regarded and ignored. If it cannot be achieved, then applicable safety procedures for hot, live, or energized work sites must be followed because the entire test circuit is floating above ground, presenting a serious hazard.
Safety Ground
Performance and safety are inseparable in fault locating. The surge generator may output
energy up to 10 kilo-joules at as much as 30 kV, so safe discharge is paramount for operator safety. Additionally, neither capacitor nor cable can be left in a charged state. The surge generator’s safety ground is connected to the system grounding point. The cable under test can be connected in a single-point grounding scheme (Figure 1) or separately grounded and paralleled to the system ground (Figure 2). The latter configuration is preferable but used less often because of time and convenience.
At the start of a test, check the isolated cable for stored voltage and ground it. The surge generator’s safety ground is connected to a system grounding point at the transformer, switch cabinet, or pole. Next, the high-voltage return lead is connected to a shield or neutral as close as possible to the high-voltage connection. The neutral is grounded at both ends. Finally, the high-voltage test lead is connected to the phase conductor.
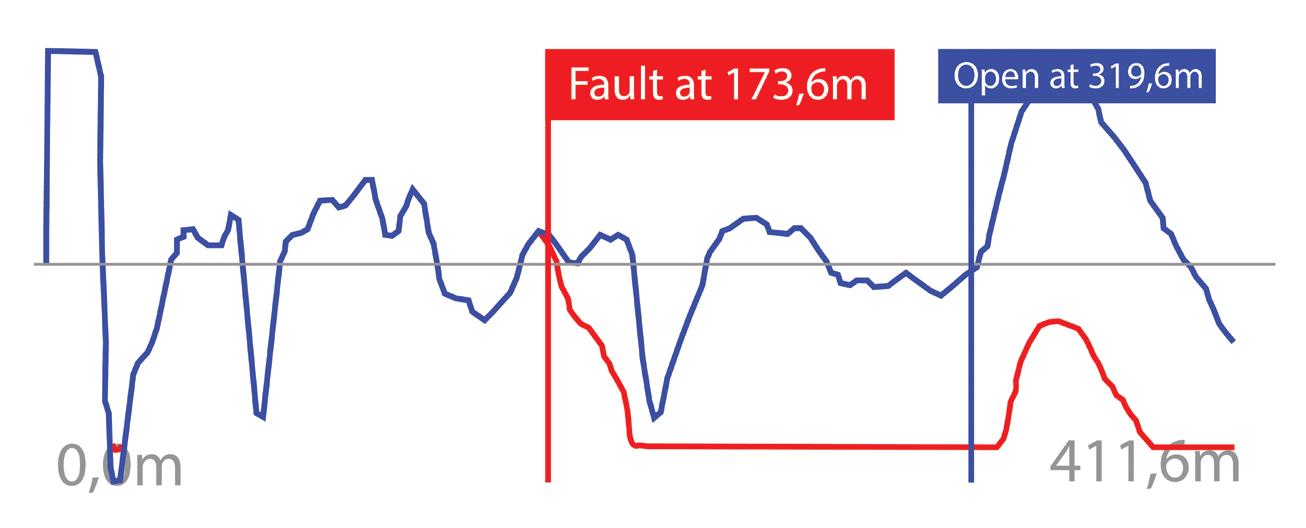
At the conclusion of a test, a mode switch is moved to ground, and all stored energy is discharged. Disconnection of leads is made in the opposite sequence. The safest and lowestresistance safety ground connection is system neutral, which will keep the system at zero volts in case of a back feed. If all is done correctly, a readable trace will appear on the test instrument’s display, indicating the distance to the fault (Figure 3).
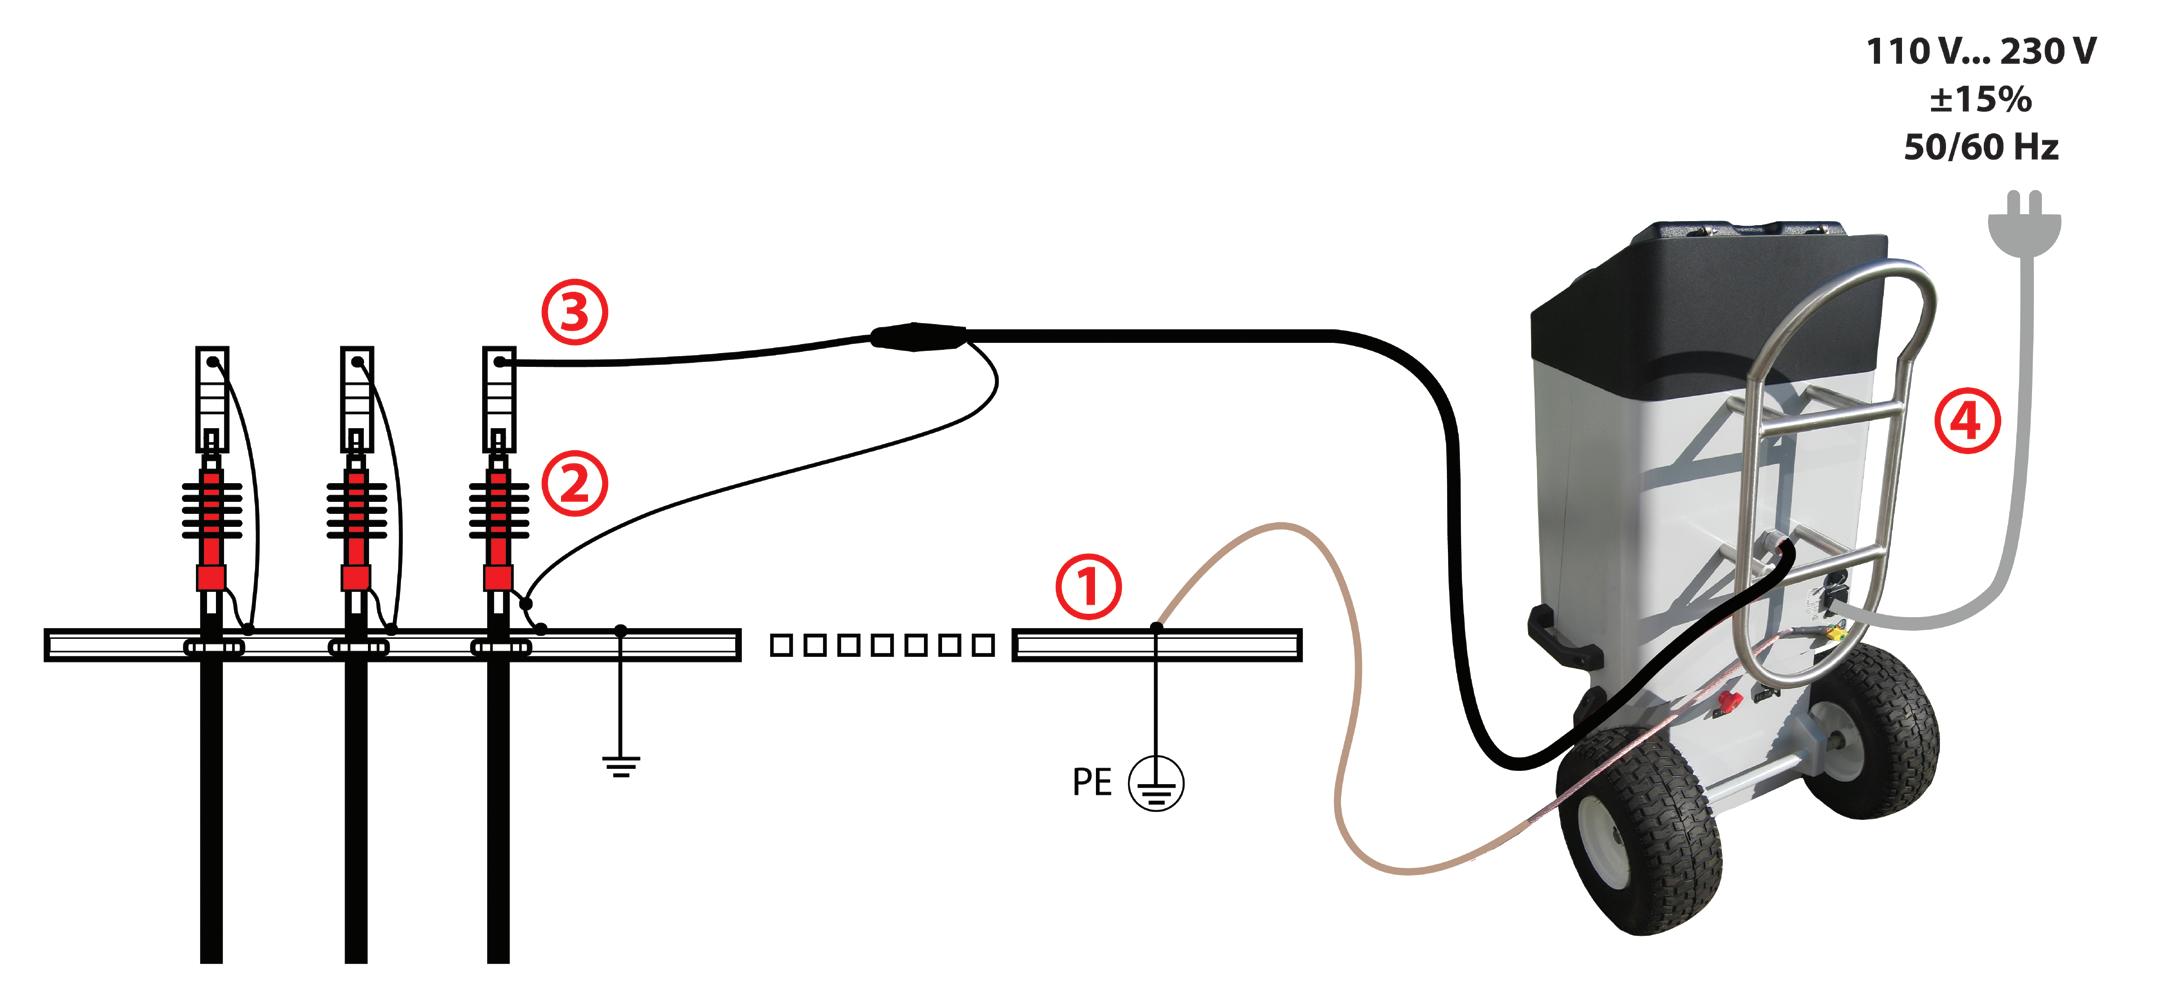
Figure 2: Separately Grounded and Paralleled to the System Ground
Bonded Grounds
Another interesting and ingenious use of grounding in fault location occurs with bonded grounds in conduit such as might be found with single-phase PILC cable. When there are well-bonded grounds at every manhole, impulse current through the phase conductor is slightly greater than return current in the neutral. This is because a small amount of return current flows through the neutral beyond the fault and into the earth through the bonded ground at the next manhole. This current returns to the surge generator through the bonded grounds before the fault. When relative readings are taken with a sheath coil pickup before and after the fault, the readings will all be positive. However, those taken before the fault will be higher in magnitude than those taken after the fault. Readings taken on the bonded ground at the second and succeeding manholes after the fault will be zero.
TRACING THE CABLE
Once the distance to the fault has been established, the job has only begun. In which direction is it? Accurate wire maps are a luxury. In most cases, the cable route must be traced. This can be done with specialized route tracers that place a trace signal on the cable. But there are many potential variables, and picking up the signal can be difficult. Various types of instrumentation and techniques exist, and grounding can assist in providing a strong, traceable signal.
If possible, drive temporary ground rods at the transmitter and at the opposite end of the cable. Soil is a relatively good conductor because of the moisture and dissolved salts it
contains and also because there is so much of it that current can find a relatively low-resistance path. Connect one lead from the transmitter to the faulted conductor and the other to the nearby ground rod. Pouring water on the rod and/or using a longer rod helps increase current flow and establishes a more detectable signal. The ground rod is placed off to the side, being careful to avoid other cables and pipes. Vary the position of the rod to provide the strongest signal. This configuration is strong because it is comprised of direct current flow and capacitive coupling. If the other end of the cable is not accessible, just the nearby ground may be enough to provide a detectable signal through capacitive coupling, but this is a weaker arrangement and may be harder for the pickup to detect.
CONCLUSION
Being cavalier about grounding must be scrupulously avoided in cable fault location. Here, proper grounding is integral and indispensable not only to the expressed purpose of finding the fault, but also — and more important — to keeping equipment safe from damage and protecting personnel from injury.
Once again, modern technology alleviates a serious problem with a reliable and ready solution. A dedicated transformer applies a small AC current between the surge return and the safety ground and checks the resistance. If grounding is not thoroughly established, the operator is alerted, and the operation is disabled until safely corrected. From walking the line in the early days, cable fault location has relentlessly improved to the thoroughly safe and reliable operation afforded by modern technology.

Jeffrey R. Jowett is a Senior Applications Engineer for Megger in Valley Forge, Pennsylvania, serving the manufacturing lines of Biddle, Megger, and MultiAmp for electrical test and measurement instrumentation. He holds a BS in biology and chemistry from Ursinus College. He was employed for 22 years with James G. Biddle Co., which became Biddle Instruments and is now Megger.
Figure 3: Tracing the Distance to a Fault

INSULATION ASSESSMENT USING NON-INVASIVE TECHNIQUES
BY ABEL GONZÁLEZ GÓMEZ and SWAPNIL MARATHE, Megger
The status of the insulation in a rotating machine can be evaluated using various testing techniques. Static tests are performed while the motor is disconnected from the system, typically during manufacturing, commissioning, maintenance, or repairs. The goal of a static test is to provide an accurate picture of the machine’s electrical characteristics. Static tests can often be performed from the motor control center and thus do not require opening or disassembling the motor in any way.
TESTING INSULATION STATUS
This article reviews the theory behind each of the static tests used to evaluate the status of the insulation of rotating machines, including tests to evaluate the ground wall insulation system using high-voltage direct current (DC) tests: insulation resistance, polarization index, dielectric absorption ratio, step voltage, and dielectric voltage withstand (hipot).
We also explain how to use voltage surge tests to evaluate the status of the turn-to-turn insulation, which is the weakest spot and the place where most insulation failures originate in a motor. During surge tests, voltage pulses are injected into the machine windings to simulate
the startup process where a nonlinear voltage distribution exists across the winding. The results can be used to diagnose the condition of the machine’s insulation system and can be used to plan machine replacement or overhaul when trended over time.
Best practices and applicable standards, as well as the criteria used to analyze the condition of the insulation in rotating machines, and test results of faults found using the different types of static tests, are presented.
Note: Additional types of static tests that apply high-voltage alternating current (AC) at nominal or very-low frequencies are not covered in this article.
Why Test
Electric motors use as much as 45% of all energy and are essential to all industries. Investing in preventative maintenance programs capable of detecting and correcting potential failures before they happen is essential for protecting operations.
A significant number of electric motor failures are related to the insulation system.
Table 1 summarizes the failure modes by incidence for two voltage levels. Most statorand rotor-related failures start as — or are the consequence of — a failure of the insulation system on the machine.
When to Test
Tests should be performed when the motor is built or rewound or during any maintenance cycle. One of the purposes of maintenance tests, particularly insulation tests, is to evaluate the motor’s location in the reliability curve (Figure 1). When the motor is built, the
Table 1: Motor Failure Modes
winding-to-ground insulation breakdown voltage is very high. This is represented in the curve as the point where it touches the vertical axis. As the motor ages, the insulation is degraded, and the insulation breakdown voltage begins to drop. This process is initially very slow but accelerates over time as the motor insulation ages. The motor fails when the breakdown voltage is lower than the bus voltage.
Figure 1 also shows why it is important to test at voltages higher than the nominal voltage of the motor. Once an insulation test fails, the motor will very soon fail if it is put back into service even if the breakdown voltage is still higher than the bus voltage of the motor.
Types of Tests
• Insulation tests fall under the category of static tests, which are performed with the motor disconnected from the main power. The most frequently used insulation tests are the basic DC insulation test (a.k.a
Megger test), polarization index (PI), dielectric absorption ratio (DAR), step voltage, hipot, surge, partial discharge, and power factor tip-up tests.
• Other static tests involve measuring the parameters of the windings as well as contact resistance. Winding parameters such as winding resistance and inductance are measured as part of a routine procedure to look for changes in the windings such as shorted turns or improper winding. Contact resistance is also evaluated using low-resistance ohmmeters.
A typical test sequence consists of:
1. Impedance measurements.
a. Winding resistance
b. Winding inductance
2. DC insulation tests
a. Basic insulation test
b. Polarization index (PI) or dielectric absorption ratio (DAR) tests
c. Step voltage test
d. HiPot test
3. Surge tests
TEST INTERPRETATION
In the following sections, we discuss how to perform and interpret this sequence of tests.
Impedance Measurement
For this first test, winding resistance and inductance are measured and compared. Ideally, similar windings in the machine will have similar parameters, e.g., the windings for phases A, B, and C in an induction machine should have similar resistances and inductances. This can be used to find issues after the machine is initially built, after a repair, or during scheduled maintenance.
Table 2: Impedance Measurements with Rotor Outside Machine
Figure 1: Evolution of Breakdown Voltage Over Time
Table 3: Impedance Measurements for a Motor with Rotor Inside Machine — Note Differences in Inductances
Ideally, the measured resistances and inductances of the three phases will be equal or very close to each other in value as can be seen in Table 2.
Differences in winding resistance can indicate missing or extra turns, wrong copper diameter, turn-to-turn shorts or opens, and problems with rusted, loose, or even broken connections. Differences in inductance can also indicate missing or extra turns or wrong connections of groups of turns.
Imbalance expressed as a percentage is the easiest indication of such differences. For a new motor, the % imbalance should be lower than 1%; for repaired motors, a percentage up to 3% is acceptable; and a difference of up to 10% can be considered acceptable for inservice motors. Trending these values over time is a valuable diagnostic tool.
Remember that inductance values are a function of the position of the rotor inside the machine and should therefore be approached with caution (Table 3). Only by comparing the values when the rotor is outside the machine can they be expected to be equal or very close to each other.
Basic Insulation Test
The basic DC insulation test is by far the most popular type of insulation test. It is performed to determine whether the motor´s insulation resistance is above a certain value. Insulation
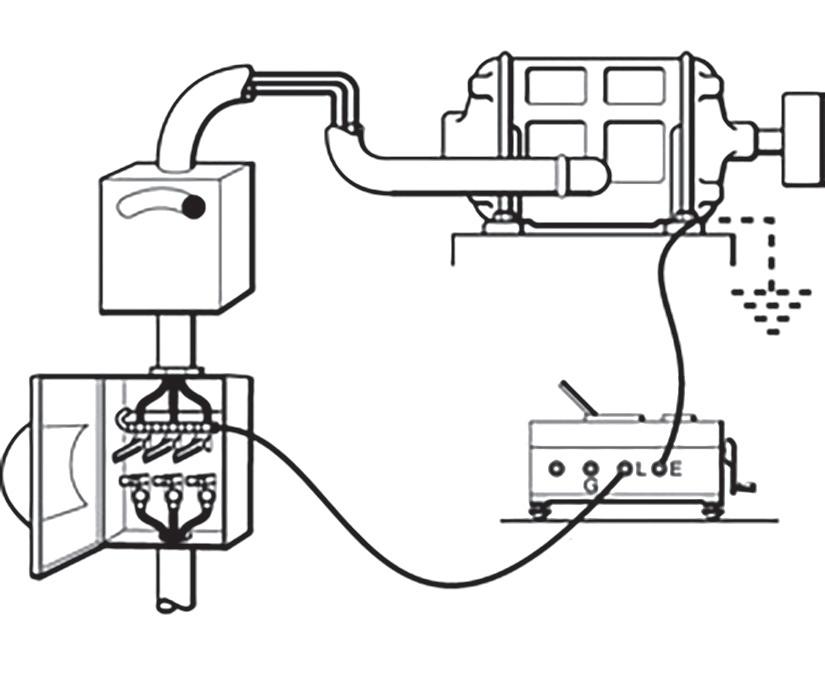
resistance is measured by applying a fixed DC voltage to the ground wall insulation of the motor, as shown in Figure 2. During the test, the circulating current is measured, and the resistance is calculated using Ohm´s law.
When injecting DC into a motor in the manner described in Figure 2, the insulation system behaves as a capacitor. This results in a transient electrical process that takes some time to settle as can be seen in Figure 3. During this process, several phenomena take place simultaneously: capacitive charging current, polarization of the insulation material, and absorption along with circulation of current due to leakage resistance. The insulation resistance test seeks to determine the leakage current that is due to the insulation resistance of the motor’s insulation system.
Figure 2: Insulation Resistance Test Circuit Connections
Total current
Capacitive current
Absorption current or polarisation
Current conduction or leakage
For this reason, insulation resistance values are not taken immediately after applying DC voltage; some time is allowed to pass before determining the insulation value to be used. To obtain consistent results, a time of 1 minute is usually used for reading the insulation resistance value.
IEEE Std. 43, IEEE Recommended Practice for Testing Insulation Resistance of Electric Machinery[1] offers the following guidance for insulation resistance test voltages with respect to the rated line-to-line voltage for threephase AC machines, line-to-ground voltage for single-phase machines, and rated direct

Figure 3: Current Components Over Time During an Insulation Test
Table 4: IEEE Std.43, Section 12.3 Voltage for Basic Insulation Test
(DC)
voltage for DC machines or field windings. The recommended minimum insulation resistance value should be as specified in Table 4. This table also applies to PI and DAR tests.
Insulation resistance values are temperature dependent, e.g., a 400 MΩ value measured at 20°C means 200 MΩ at 30°C and 100 MOhm at 40°C. For this reason, insulation resistance values are temperature corrected to 40°C so they can be evaluated against the standard and compared to each other.
The temperature-compensated insulation resistance results are then compared to the minimum insulation resistance values established by the applicable standards. Table 5 from IEEE Std. 43 tells us the minimum temperature-compensated insulation resistance value for each type of motor.
Historical temperature-compensated values of this test can be trended (Figure 4). A downward trend can indicate a problem developing with the insulation even when the absolute value of the insulation resistance is high. A stable trend
even when the values are low can indicate an insulation system in good shape. Motor 2 is probably in good condition even though it has a lower absolute value of insulation than Motor 1. Motor 1, on the other hand, needs to be investigated because the insulation has been steadily decreasing.
The basic insulation test is a go-no-go test in which failure tells us that the motor’s insulation is in bad shape. However, a pass cannot guarantee that the insulation in the motor is good.
Polarization Index Test
During the insulation resistance test, a process called polarization happens in the insulating material. This process involves all polar molecules inside the insulation system.
Figure 4: Insulation Resistance Trend for Two Motors
Table 5: Recommended Minimum Insulation Resistance Values at 40°C (MΩ)
[IR] _1 min = kV + 1 For most windings made before 1970, all field windings, and others not described below
[IR] _1 min = 100 For most AC windings built after 1970 (form-wound coils) [IR] _1 min = 5 For most machines with random-wound stator coils and form-wound coils rated below 1 kV and DC armatures
• Note1: IR 1 min is the recommended minimum insulation resistance in MΩ at 40°C of the entire machine winding (all phases).
• Note 2: KV is the rated line-to-line rms voltage for three-phase AC machines, line-to-ground voltage for single-phase machines, and rated direct voltage for DC machines or field windings.
It is expressed by current flowing into the insulation system that is high initially but drops as the molecules of the insulation align with the applied voltage. This means that a lower insulation resistance value is initially to be expected due to the higher current, but the insulation resistance value will recover over time (Figure 5).
Other polar molecules such as water and certain contaminants can cause this process to take longer than expected. This will reflect in the insulation resistance remaining at lower values and not recovering to the expected values (Figure 6).
This recovery is characterized during the PI test by calculating the ratio of two resistances measured at separate times during the test. Typically, the resistance at 10 minutes is divided by the
Table 6: Recommended Minimum Values of Polarization Index for Insulation Per Thermal Class of Machine Components
resistance measured at 1 minute: ��_10/��_1. Some instruments will calculate the PI value using total current as can be seen in ��_1/��_10. As a rule, the higher the PI value, the better the status of the insulation.
Table 6 from IEEE Std. 43 shows typical PI values for several types of insulation material and motor classes.
The PI test is not applicable to non-insulated field windings. However, newer insulation types that recover extremely quickly have placed into question the value of the PI test for these kinds of insulation. The dielectric absorption ratio (DAR) test uses the same principle as the PI test, but the ratio is calculated between the resistance at 1 minute and the resistance at 30 seconds — or the inverse if currents are used. Although higher values of DAR are recognized as better, no standard recognized values exist for this test.
Polarization index and dielectric absorption ratio tests are performed at the same voltage as the basic insulation test shown in Table 4 and are typically performed as an extension.
Step Voltage Test
In an ideal insulation system, insulation resistance should remain constant as voltage increases. A healthy insulation system will follow similar behavior within the boundaries of its own maximum breakdown voltage. This characteristic is used during a step voltage test in which the voltage is increased in fixed steps starting at the basic insulation test level and going up to a maximum value established for the motor’s voltage class.
Five voltage steps are typically used The voltage for each step is kept constant during a 1-minute interval. At the end of each interval, leakage
Figure 5: Leakage Current and Insulation Resistance Over Time During PI Test
Figure 6: Resistance Curves During PI Tests
current is measured and the insulation
is calculated. As voltage increases, the current is expected to increase in the same proportion, according to Ohm’s law, but resistance should remain stable. During the test, a voltage vs. leakage current graph is drawn. A line is then drawn connecting the leakage current values at the end of each interval (Figure 7).
A straight line indicates a healthy insulation system since it means that the resistance value is constant during the test, i.e., the resistance is independent of the applied voltage. A curved line, like the one shown in Figure 8, indicates that resistance changed — usually dropped — at some point during the test, which will be signaled by a higher-than-expected increase in
AROUND THE CLOCK RESPONSE SERVING THE POWER INDUSTRY

BET is an independent third-party testing firm with more than 50 years of experience serving industrial, commercial, and institutional facilities’ low- to high-voltage electrical testing and maintenance needs, including:
• Acceptance Testing & Commissioning
• Switchgear Reliability Testing
• Protective Relay Setting
• Transformer Repair
• Transformer Oil Analysis
• Circuit Breaker Retrofits
• Battery Bank Testing
• Cable Fault Locating
• Meter Calibration
• Motor Testing & Surge Analysis
• Infrared & Ultrasonic Inspections
• Load Survey & Analysis
• Coordination & Short Circuit Studies
• Arc Flash Hazard Analysis
Figure 7: Step Voltage Test
the leakage current. This voltage dependence on the insulation can be an indication of early partial discharge occurring inside the motor.
High Potential Test
The high potential or hipot test is performed to verify that the insulation system can withstand the voltage applied. DC or AC voltage is applied for 1 minute; the voltage magnitudes to be used are defined in IEEE Std. 95-2002, IEEE Recommended Practice for Insulation Testing of AC Electric Machinery (2,300 V and Above) With High Direct Voltage. [2]
Surge Test
During the motor’s life, certain transient processes such as starts, stops, and transients resulting from switching electronic valves in VFD-fed motors are present. This results in a nonlinear distribution of voltage across the motor windings (Figure 9).
This nonlinear distribution of voltage means that the initial turns are the section of the winding that suffers the fastest degradation in the entire insulation system. This is expressed by a lower value of turn-to-turn insulation resistance in these first few turns in each motor winding, which eventually results in a few shorted turns inside the windings. Shorted turns result in a so-called transformer effect where these turns behave like a shorted secondary winding in a transformer. Even a small, induced voltage produces circulation of a high current, which then burns through the motor’s insulation via the joule effect. Remember that the power dissipated in resistance is directly proportional to the square of the current: P = Iˆ2 * R.
Turn-to-turn insulation failure is the main cause of insulation failure in electrical motors; as much as 80% of stator failures start as turnto-turn faults.
Figure 8: Failed Step Voltage Test
Figure 9: Nonlinear Voltage Distribution on Winding During a Transient
Table 7: Hipot Test Results
The surge test is designed to simulate the nonlinear distribution of voltage in the motor’s winding. The equivalent circuit for a surge test is presented in Figure 10.
The capacitor is charged at the initial test voltage, and the energy stored in the capacitor is discharged into the motor’s winding. Several pulses are applied at the same test voltage. Voltage is then increased, and the process is repeated until a maximum test voltage has been reached, a turn-to-turn failure has been found, or a breakdown condition has been detected.
Figure 10 shows that a series RLC circuit is formed during the test by the motor’s winding and the ringing capacitor. The resulting oscillating voltage measured at the capacitor has a waveform like the one in Figure 11.
The frequency of this voltage is constant and depends only on the electrical parameters of the circuit as can be seen in this equation:
A change in frequency is an indication of a change in the electrical characteristics of the RLC circuit formed by the ringing capacitor and the motor winding under test. The capacitance value is kept constant during the test and, barring equipment failure, depends exclusively on the design of the test equipment used. Therefore, any change in
frequency indicates a change in the electrical characteristics of the winding under test. When a short happens between turns in the winding, the inductance of the winding changes with the square of the number of turns. This reflects as a sudden change in the frequency of measured voltage as can be seen in Figure 12, which presents actual measurements of tests performed on a 4,160 V motor. The resulting waveform for Lead #1 is completely different from the other two.
As we can see in Figure 13, the area under the curve is significantly different for two consecutive pulses if the frequency between them changes. This characteristic is used to detect turn-to-turn insulation failure during
Figure 10: Circuit for Surge Testing[6]
Figure 11: Oscillating Voltage for Surge Test
3-Phase Summary
3-Phase Summary
surge tests. A parameter known as pulse-topulse error area ratio (EAR) is calculated as the ratio of the normalized area under the curve for two consecutive pulses. If that value, expressed as a percentage, exceeds a certain predefined setting, an insulation failure is declared.
It is important to note that when a turn-toturn short is present from the beginning of
In this case, comparing the error area ratio results between motor windings can be useful, Time [μs] Time [μs]
a test for a particular winding, there is the possibility of finishing the test all the way to the maximum voltage without experiencing a change in inductance. Therefore, we would be led to think that everything is OK with the winding.
Figure 12: Pulse-to-Pulse Error Area Ratio (EAR) Failure
Figure 13: Differences in Surge Response Between Phases in a Motor
since all the windings should have similar inductances and therefore present similar behavior. This line-to-line error area ratio (L-L-EAR%) comparison is especially useful in induction machines when the rotor is outside the stator since the position of the rotor inside the stator can influence inductance values and therefore the results of the test.
Test Voltage
Two common questions are often asked when performing insulation tests:
1. How much voltage should I apply to the motor for this test?
2. Will testing at voltages higher than nominal line voltage damage the motor?
To answer the first question, let`s remember that:
a. When the motor is built, the insulation breakdown voltage is much higher than the nominal voltage of the motor.
b. During the motor’s life, it sustains voltage transients with magnitudes up to 5 times the peak line to neutral voltage (pu): p.u. = √(2/3) xV _line.
c. In Figure 1, we saw that as the motor approaches its end of life, degradation of the breakdown voltage happens very quickly.
Tests such as step voltage test, hipot, and surge should be performed at voltages higher than the nominal voltage of the motor. Different standards have different recommended test voltages, and proper discussion of all of them goes beyond the scope of this article. A compilation of recommended test voltages for different standards can be found in “The
State of Surge Testing on Induction Motors.”[5]
A useful and practical rule of thumb used in the industry is to test at a voltage equal to twice the nominal voltage plus 1,000 V: V = 2x Vline+1000 V. This aids in selecting the proper test instrument for a specific case.
GENERAL NOTES
The insulation tests mentioned here can usually be performed at either the motor or the MCC. When performing these tests at the MCC, the tester should be aware that the results include cables, breakers, other equipment, and the motor. If an insulation issue is found, it is then necessary to disconnect the motor from the MCC and test again. On the other hand, the capacitance of cables and auxiliary equipment must be considered when selecting the test equipment. It will sometimes be necessary to disconnect the motor from the cables and test at the motor rather than the MCC if the test equipment does not have the required energy output for the test.
SUMMARY
Regularly testing motors can help prevent outages and avoid future pitfalls by recognizing patterns in the test results. Motor testing should be included in a complete program that includes low-voltage and high-voltage testing to diagnose and trend specific parameters related to the equipment’s electrical health.
This article presented a sequence of tests usually performed on motors during the initial stages of the motor’s life and during regular maintenance checks. This simple, tried-andtrue sequence of tests helps identify issues with motor insulation and can prevent costly downtime.
Table 8: Comparison of LL and PP EAR
REFERENCES
[1] IEEE. IEEE Std. 43-2013, IEEE Recommended Practice for Testing Insulation Resistance of Electric Machinery, 2013.
[2] IEEE. IEEE Std. 95-2002, IEEE Recommended Practice for Insulation Testing of AC Electric Machinery (2,300 V and Above) With High Direct Voltage, Power Engineering Society, 2002.
[3] Megger. A Stitch in Time: The Complete Guide to Electrical Insulation Testing, 2006.
[4] EASA. EASA Technical Manual, Section 7 Electrical Testing, January 2019. Accessible for members at https://easa.com/resources/ easa-technical-manual.
[5] SKF Group. “The State of Surge Testing on Induction Motors,” 2013. Accessed at: http://www.cmcbaker.com/manuals/ surge%20test%20whitepaper.pdf.


Abel Gonzalez has been a Senior Relay Applications Engineer with Megger LTD in Markham, Ontario, since 2013. His research areas include analysis operation, control, and protection of electric power systems. Following several appointments in the Faculty of Electrical Engineering at the Universidad Central de Las Villas, Cuba, where he taught courses in electrical drives and power electronics, and worked as a Tele-Traffic Engineer, Control Engineer, and Head of the Marketing Department for the Cuban Telecommunications Company as well as a professor of Marketing and Electrical Engineering, for the Universidad Central de Las Villas, Cuba, Abel worked as a Design Engineer for Arteche Medición y Tecnología in Zapopan, Jalisco, Mexico, and Curitiba, Brazil. He earned BS and MSc degrees in electrical engineering from the Universidad Central de Las Villas, Cuba.

Swapnil Marathe has been a Substation Application Engineer with Megger since 2020. His focus is testing transformers, batteries, and motors. He previously worked as a Megger intern on relay and Substation applications. Swapnil graduated from the University of Texas at Arlington with a BS in electrical engineering.


Freedom isn’t usually a requirement when searching for a power system testing company. But it should be! Our relationally-focused freedom powers everything we do. As a locallybased, independently owned, third-party testing organization, we answer only to you.


WHAT DOES INSULATION THERMAL CLASS MEAN FOR ELECTRICAL MACHINES?
BY KEVIN ALEWINE, Shermco Industries
How hot is too hot? Motors and transformers have maximum operating conditions, but can I exceed those ratings on occasion and not damage the equipment?
In my years as an electrical insulation application consultant, the most common questions posed by end users regard insulation thermal classes and what effect they have on machinery reliability and life expectancy. Many articles have been written on this topic, but I hope to clarify how the thermal classes are chosen and what they really mean to an industrial maintenance team, especially when choosing among various systems offered in the aftermarket.
THERMAL CLASSES
Early electrical machines were all constructed with copper windings insulated using available materials from natural sources: paper, cotton fibers and cloth, asphalt, lacquer, organic varnishes, etc. These are not normally acceptable for modern industrial machines even though they are still in limited use for some consumer products. One exception is power transmission transformers that utilize liquid insulation designs. Paper insulation is still the leading material, and that deserves its own discussion at another time.
Current dry-type transformers, such as those for motor and generator systems, typically use thermoset and thermoplastic components and might utilize copper or aluminum windings with a wide range of primary conductor insulation. These systems are developed and tested using the same methodologies used for motors and generators. The choice of insulation thermal class as well as the other properties of the materials utilized is dependent on the machine operating thermal class as designed as well as the actual enduse application.
Electric machine thermal rise is determined by electrical losses during operation and the efficiency of thermal transfer away from the conductors including other cooling systems such as fans, heat exchangers, and liquid cooling jackets. All of these must be functioning as designed or the insulation might be damaged. The National Electric Manufacturers Association (NEMA) and the International Electrotechnical Commission (IEC) have very similar definitions regarding the operating classes of motor and
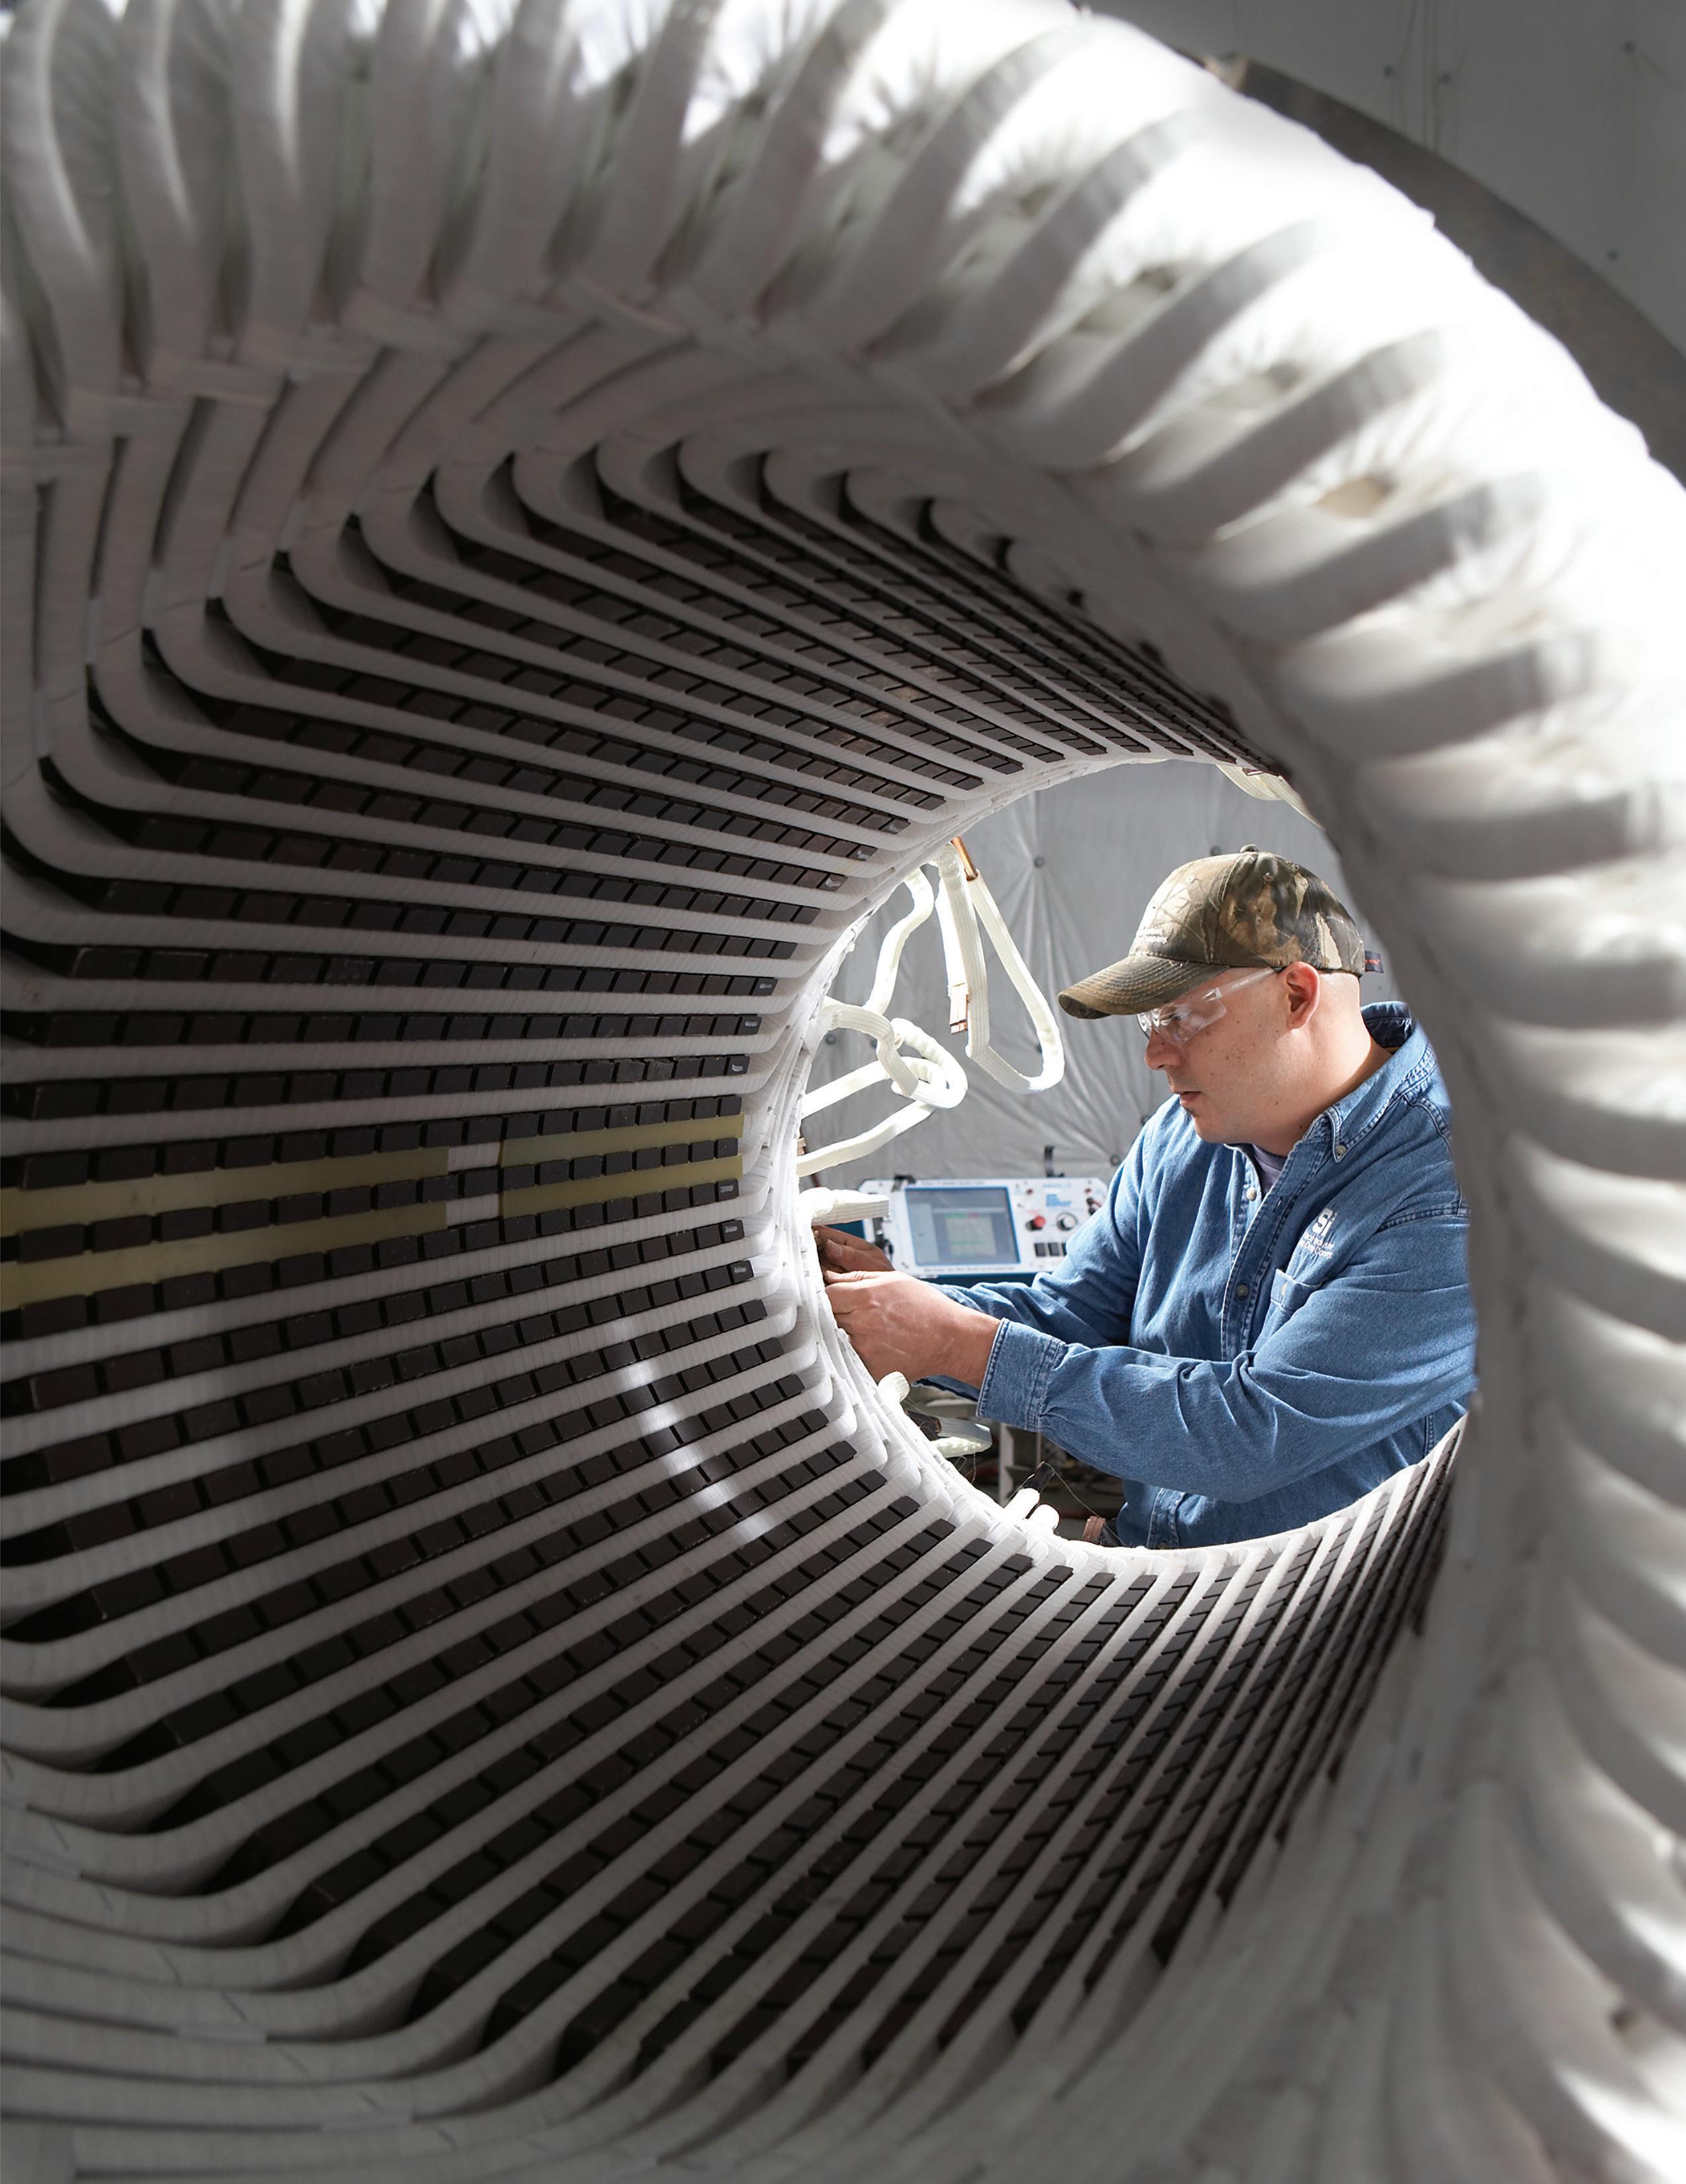
Typical Rewind Utilizing a Class H Insulation System
transformer insulation systems. These are often referred to by letter classifications. The most common are 130°C (B), 155°C (F), 180°C (H), and 220°C (C).
These operating classes are based on the hottest part of the windings (often in the center of the slot section for motors) added to the acceptable maximum ambient temperature and atmospheric pressure along with a factor (normally 10°C) for hotspot variations. For easy comparison, the maximum ambient is normally accepted as 40°C at 3,300 feet above sea level, although there are many specialty designs outside of this range. This calculation might also be affected by any service factor or duty type included in the machine design. The hottest spot during proper operation determines the thermal class of the insulation required.
It is very common in larger machines to design the temperature rise at one thermal class lower than the insulation, i.e., a 130°C rise/ambient design with a 155°C class insulation system. This is done to maintain a level of extra thermal performance to cover manufacturing variances or some intermittent overload conditions. However, in special cases such as small generators designed for intermittent use, they are designed to operate well above the normal insulation thermal design to improve output to
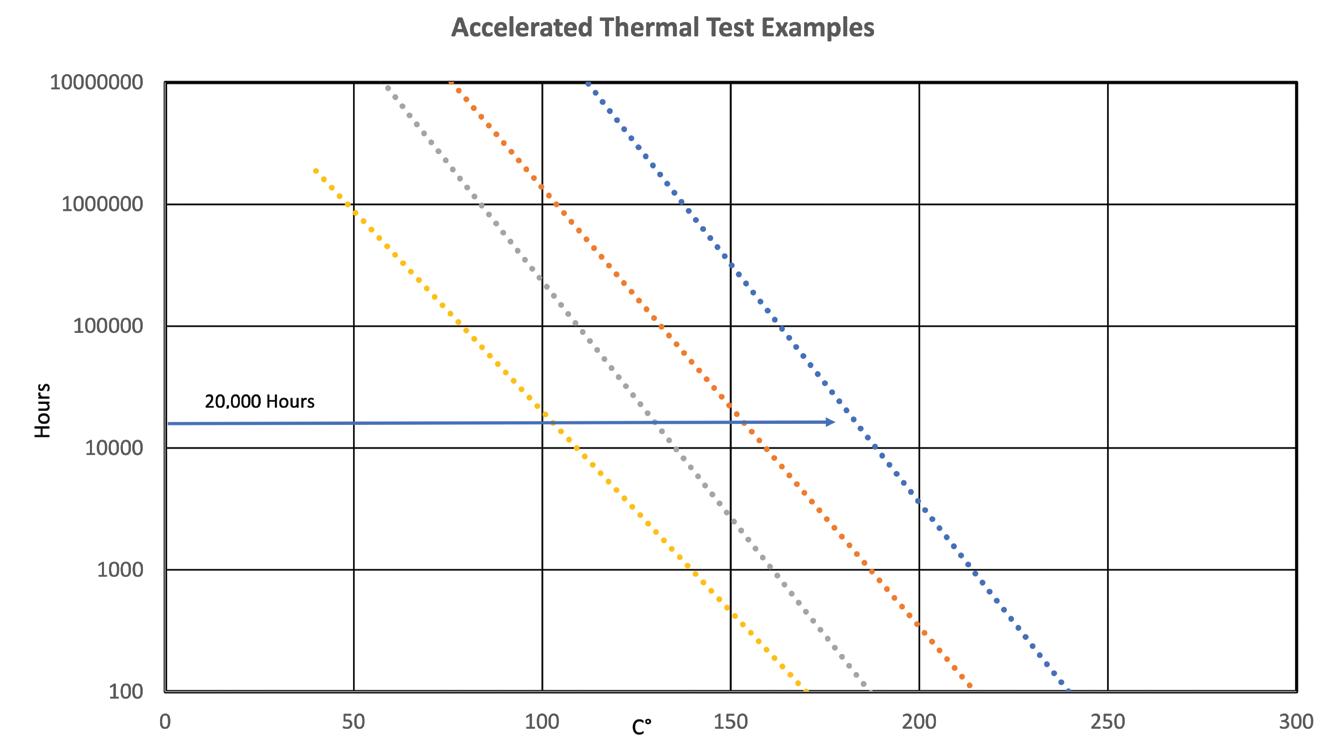
Figure 1: A thermal class evaluation (expressed on a logarithmic scale) illustrates expected results for successful testing.
size ratio, while still offering a reasonable life for short-term operating conditions.
Insulation degrades in several ways, and the primary concern in choosing the proper family of insulation materials is the voltage rating of the machine. At 6 kV and below, most insulation failures are due to short-term electrical stress, mechanical failure of the supporting components, or general degradation from embrittlement and weight loss over time due to heat. Above 6 kV, a key factor in insulation system failure is the presence of partial discharge (corona). PD can cause erosion or oxidation of organic materials such as resins, so the use of corona management systems and inorganic insulation such as micabased tapes is critical to reliability. Most systems above 1 kV utilize mica anyway due to its excellent electrical and mechanical properties, but the design of the coil package and the quality of processing is also essential at higher voltages. It is also important to remember that systems testing of insulation materials only establishes the theoretical thermal class, not necessarily appropriateness for the application.
Typically, only conductors and resins officially have their own thermal ratings. Other materials — flexible insulation, tapes, supporting materials, lead wires, etc. — are all tested together with the appropriate conductor type and resin as a system. The thermal rating of that system is based on a multifactor evaluation typically at three progressively higher temperatures above the expected rating.
For low-voltage applications that are typically random-wound with flexible ground and phase insulation, IEEE Std. 117, Test Procedure for Thermal Evaluation of Systems of Insulating Materials for Random-Wound AC Electric Machinery is the testing protocol. IEEE Std. 1776, IEEE Recommended Practice for Thermal Evaluation of Unsealed or Sealed Insulation Systems for AC Electric Machinery Employing Form-Wound Pre-Insulated Stator Coils for Machines Rated 15 000 V and Below, is used for higher-voltage designs where pre-insulated form-wound coils are the most common design (Figure 1).
The expectation outside of the United States is often that each component is rated at or above the system rating, but that can lead to confusion due to the various methods used to calculate thermal performance depending on the type of material. For low-voltage systems (<1 kV) that require UL ratings, there are methods to modify the set of materials utilized in
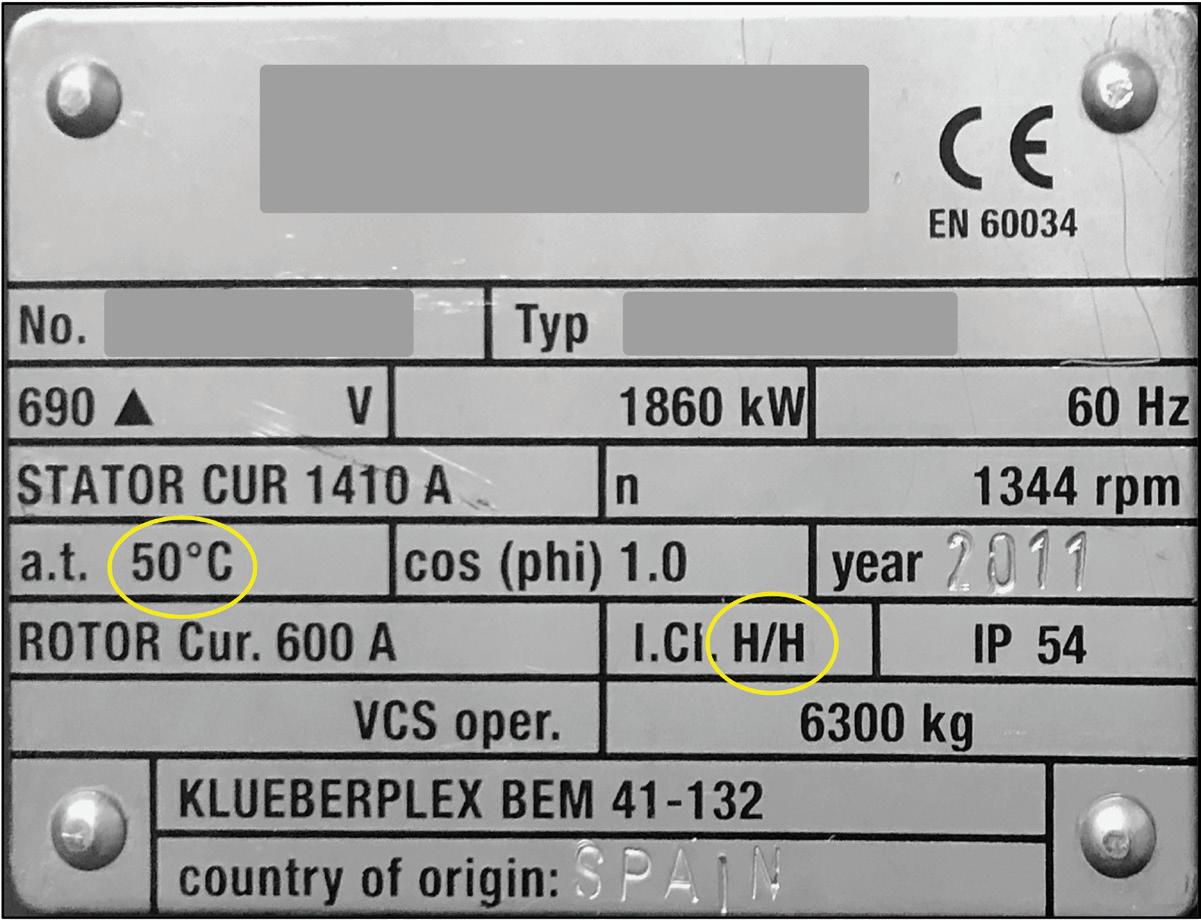


HOW HOT IS TOO HOT?
So back to the original question: How hot can things get before it becomes a threat to reliability? With an insulation system rated 155°C and an ambient temperature limit of 40°C, that only leaves 115°C to play with. With the normal allowance of 10°C as a hot-spot allowance, that means the designed thermal rise of the machine is only 105°C at the hottest point (Figure 2).
However, operating at that range, testing shows a minimum life expectancy of only 20,000 hours. Sounds impressive, but that only works out to a little over two years of continuous duty. That might be fine for an intermittent device such as a power tool, but for an industrial motor or a wind turbine generator, that is really not good enough. So most designs use one class lower for their machine design criteria. In the case above, the thermal rise is limited to 80°C.
All this brings up the rule of thumb that the life of the machine can be doubled if operated at 10°C below the rated thermal class or cut in half if operated at 10°C above the design rating. That is possibly true for the thermal life of the insulating system, but other factors, such as thermal growth, bearing lubrication heat performance, and VFD drive influences might have greater impact on the reliability than insulation system failures. In the case of wind generators and other intermittent applications, thermal cycling conditions are much more detrimental to reliability than the maximum temperature experienced in normal operation.
Even if the thermal class of the system is 180°C and the electrical properties are excellent, the mechanical properties could suffer, as many high-temperature resins are fairly brittle, which can lead to mechanical breakdown and movement of the coils or supporting materials much sooner than would be shown in the thermal models. The key performance criteria for systems are mechanical, electrical, chemical, and thermal. To perform well in all of these areas requires a lot of very expensive components that are typically impractical in commercial applications. All good insulation systems
are therefore compromises between thermal endurance and the other physical properties required for the application. As an example, a shredder motor in a steel mill runs from lightly loaded to a massive overload for just a few seconds and back. The thermal shock is bad, of course, but the mechanical requirements of shredding an automobile also extract a toll. You probably wouldn’t use the same system design as you would for a gentler application.
IMPROVED INSULATION SYSTEMS
Many motor repair centers utilize thermally and mechanically upgraded insulation systems as compared to original manufacturers because they service many industries and must be prepared for almost any conditions they might encounter. As the aftermarket industry invested in higher thermal class systems and large vacuum-pressure impregnation equipment, it became popular to feature Class H as a differentiator for marketing purposes. Does this really matter? Is there an advantage? The not-so-short answer is that in some applications, such as traction motors and other compact designs, it does make a difference because those machines are mostly designed with a higher temperature rise to minimize the size of the motor.
For the typical Class F machine designed with a Class B rise, it can help to minimize premature degradation if the reprocessed core lamination is less efficient than the original, but mostly it just inspires confidence that the windings have some additional margin at the upper range of the operating temperatures. An exception, in my experience, concerns larger machines such as synchronous motors and hydro generators. The higher thermal class will make little difference, especially in voltages above 6 kV, and when dealing with partial discharges, it can be even easier to manage them with Class F pressed coils than with VPI designs. Although considered expensive for high-volume manufacturers, preimpregnated pressed coils are extremely reliable and offer many other advantages to the repair facility as well as the end user.
Dry-type, air-cooled transformers are normally subjected to very little mechanical stress, so
high thermal rise is more acceptable. Specialty supports and barrier insulation sheets as well as silicone or modified epoxy resins are the rule rather than the exception. It all comes down to cost. With cast-coil designs, Class F is the norm as those materials are relatively easy to use and are very cost-effective.
CONCLUSION
It is really up to the original designer of the equipment to specify the right type of materials for the thermal requirements as well as the mechanical stresses of the application. They most often get it right, but sometimes an aftermarket solution is an improvement over the original design because a wide range of options is available to address a known failure mode that might not be apparent to the original equipment manufacturer. Be sure and consult with a competent and experienced repair specialist, and make an informed decision on the thermal class and other properties needed to achieve optimum life expectancy for the repair.
Takeaways
• Thermal class shouldn’t be the only criterion.
• Not all high-temperature systems are right for every application.
• Be aware of de-rating requirements if operating in higher ambient temperatures.
• Carefully consider the operating conditions before specifying the motor or the repair, and share that with the provider.

Kevin Alewine is Director of Renewable Energy Services at Shermco Industries with a focus on business development in the wind-energy business sector. He has extensive global experience with the application of electrical insulation materials, systems, and processes for the manufacture and repair of electrical machinery. Kevin formerly chaired the American Clean Power Operations and Maintenance Committee developing recommended practices for wind-energy asset maintenance. Additionally, Kevin was the General Chair of the 2019 IEEE Electrical Insulation Conference and is a member of the IEEE Dielectric and Electrical Insulation Society Administrative Committee.


ELECTROMAGNETIC IMPERFECTION MEASUREMENTS FOR STATOR CORE CONDITION ASSESSMENT
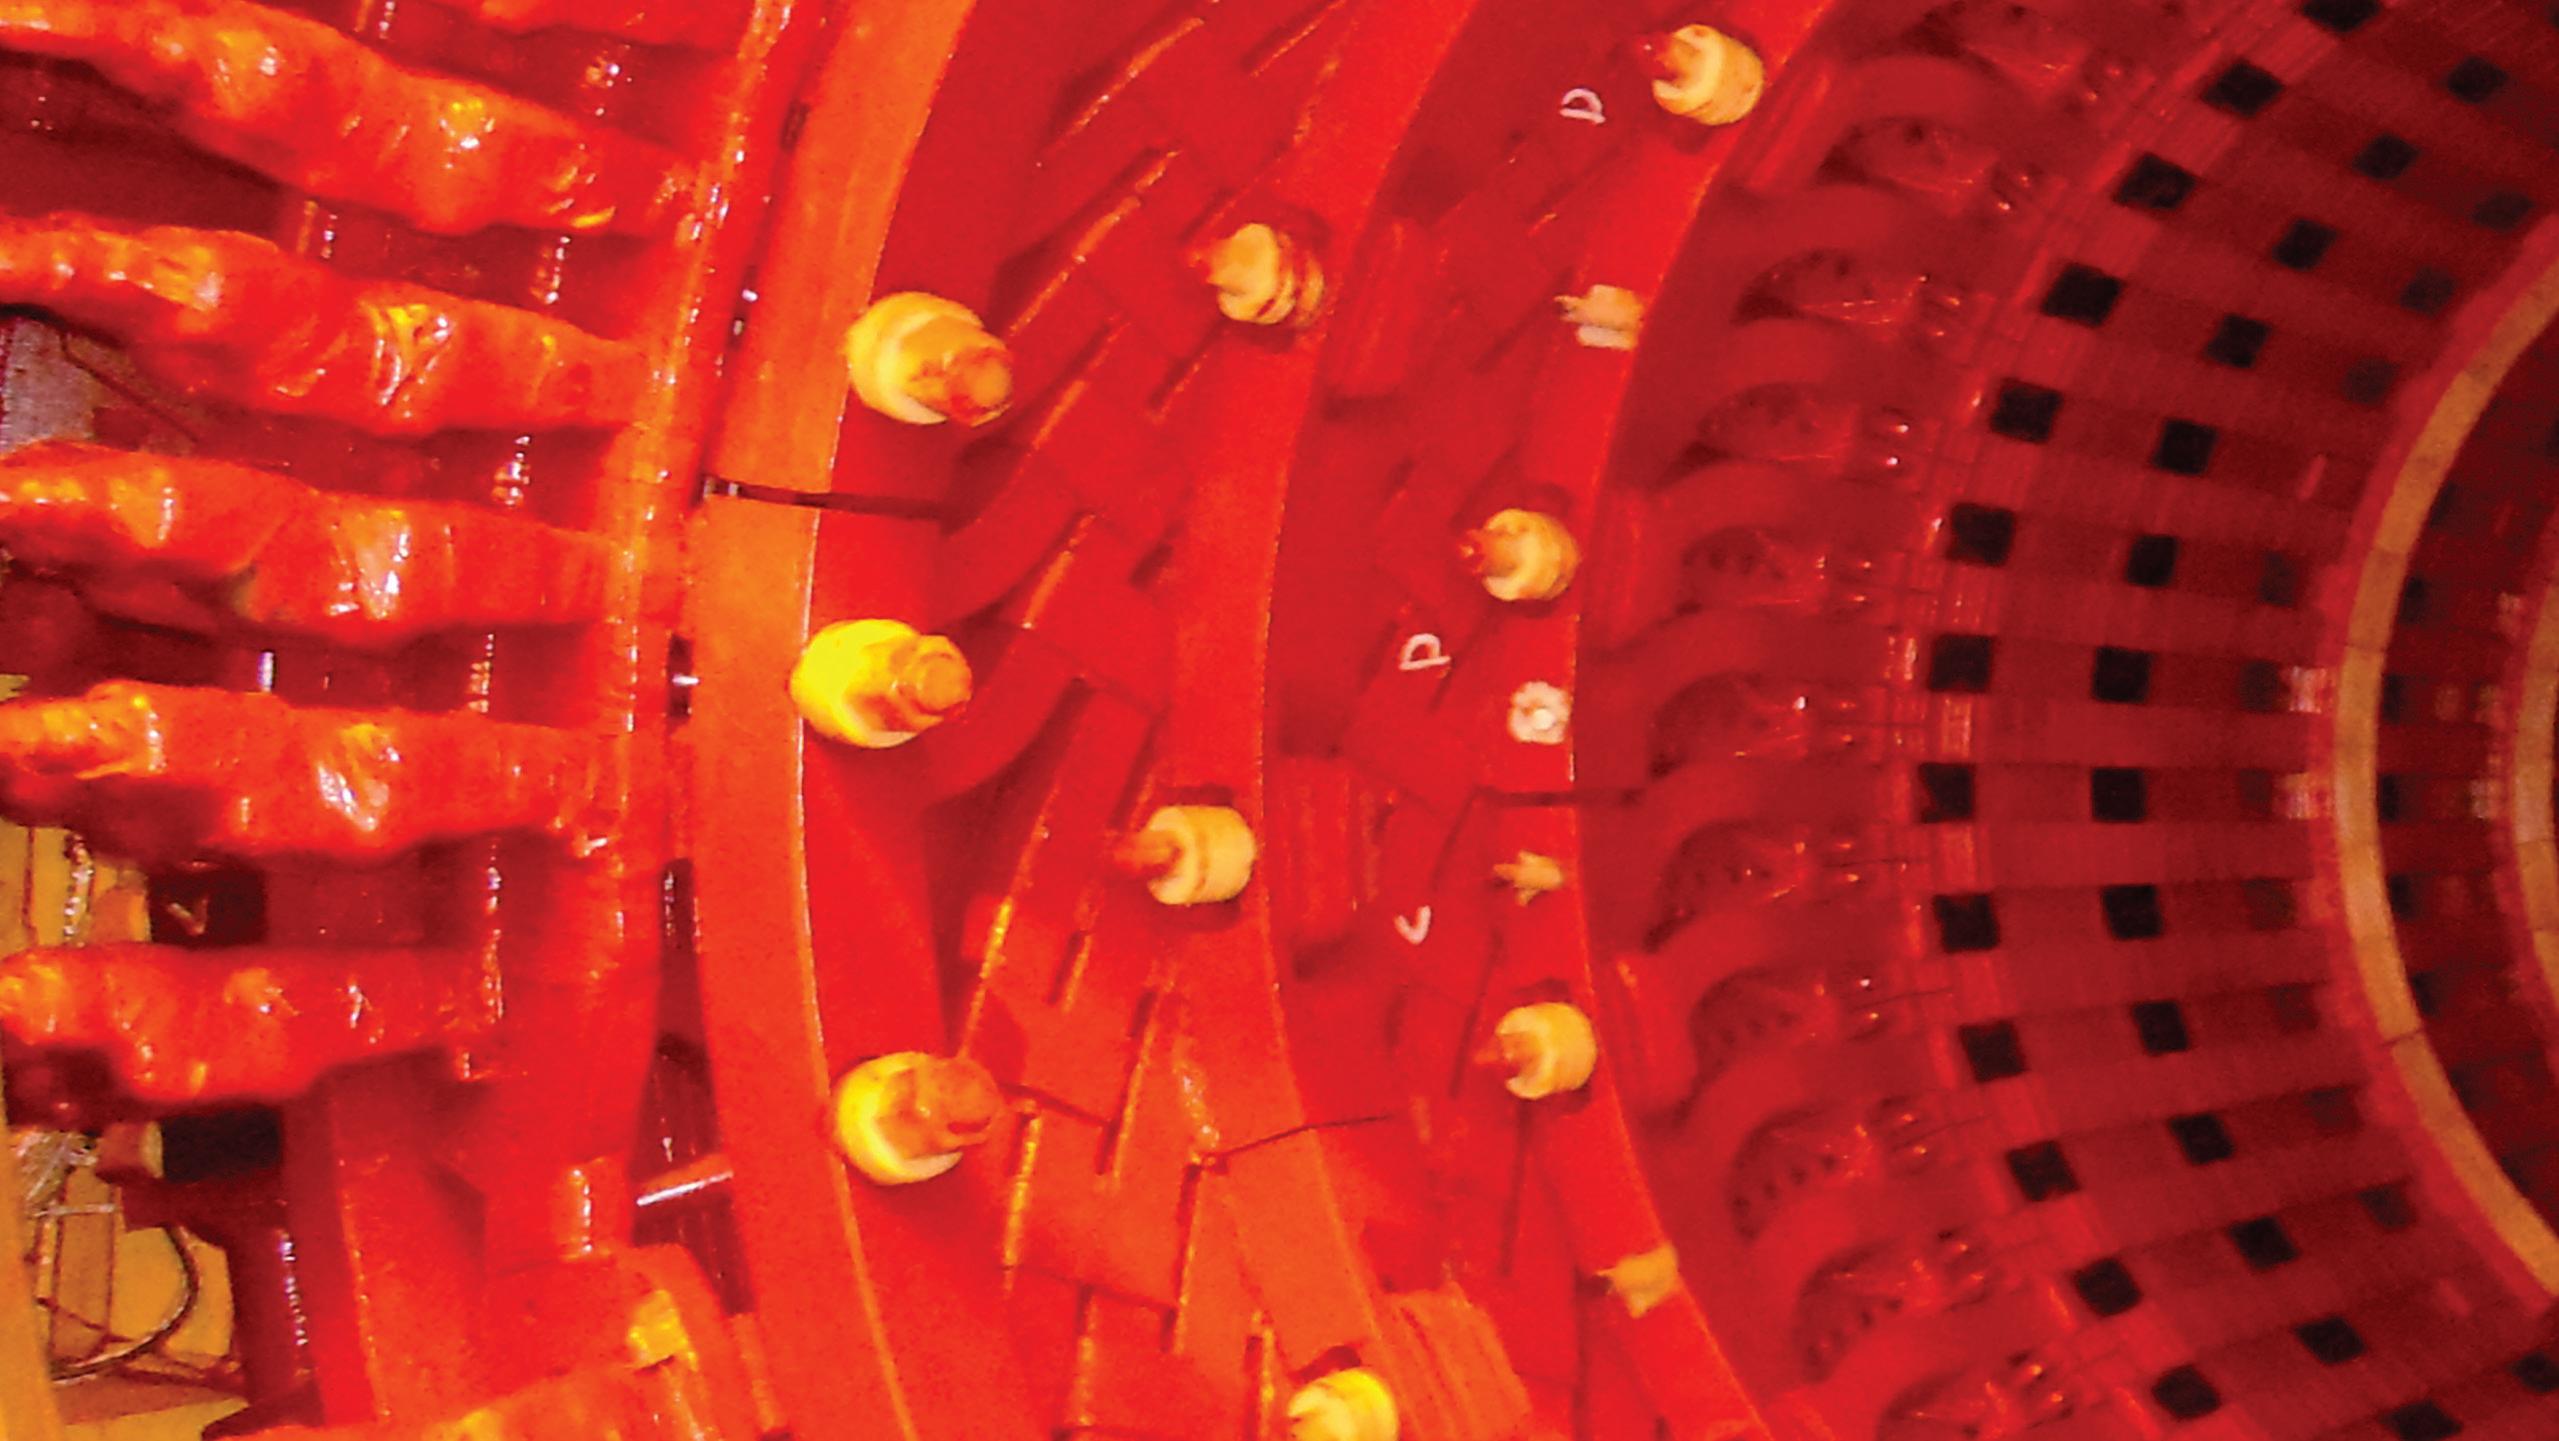
BY FABIAN OETTL, OMICRON Technologies Italia GmbH, and MATHIEU LACHANCE, OMICRON electronics Canada
The stator core of a rotating machine is composed of multiple stacked layers to minimize eddy current losses. A short between two or more layers leads to higher local eddy currents. This in turn can lead to local hot spots, which in a worst-case scenario can cause a partial core melt and eventually damage the machine. A ring flux (or full flux) measurement, where the machine is excited at rated flux and potential hot spots are detected using a thermographic camera, demands a high amount of power. Furthermore, the setup is time- and resource-consuming.
Stray flux measurement (also known as electromagnetic imperfection measurement) is a reliable alternative that uses a portable power source and a measurement device that can be energized via an ordinary power plug. In addition to conventional measurement at rated frequency, using a power source that allows the stator core to be excited at higher frequencies (up to 400 Hz) can lead to improved sensitivity in certain conditions. Injection at different frequencies allows faults to be detected deeper in the core and can be compared to ring flux measurement.
ASSESSING CONDITION
Throughout a rotating machine’s lifetime, several conditions are undesirable for optimal performance. Such conditions might be discovered during a visual inspection or specific off-line or on-line tests. Considering that the core laminations that make up the stator core are shorted together at the back of the core by building bolts or keybars, it is vital for the rest of the lamination surfaces to be electrically insulated from adjacent laminations. This condition might not be too serious for a single
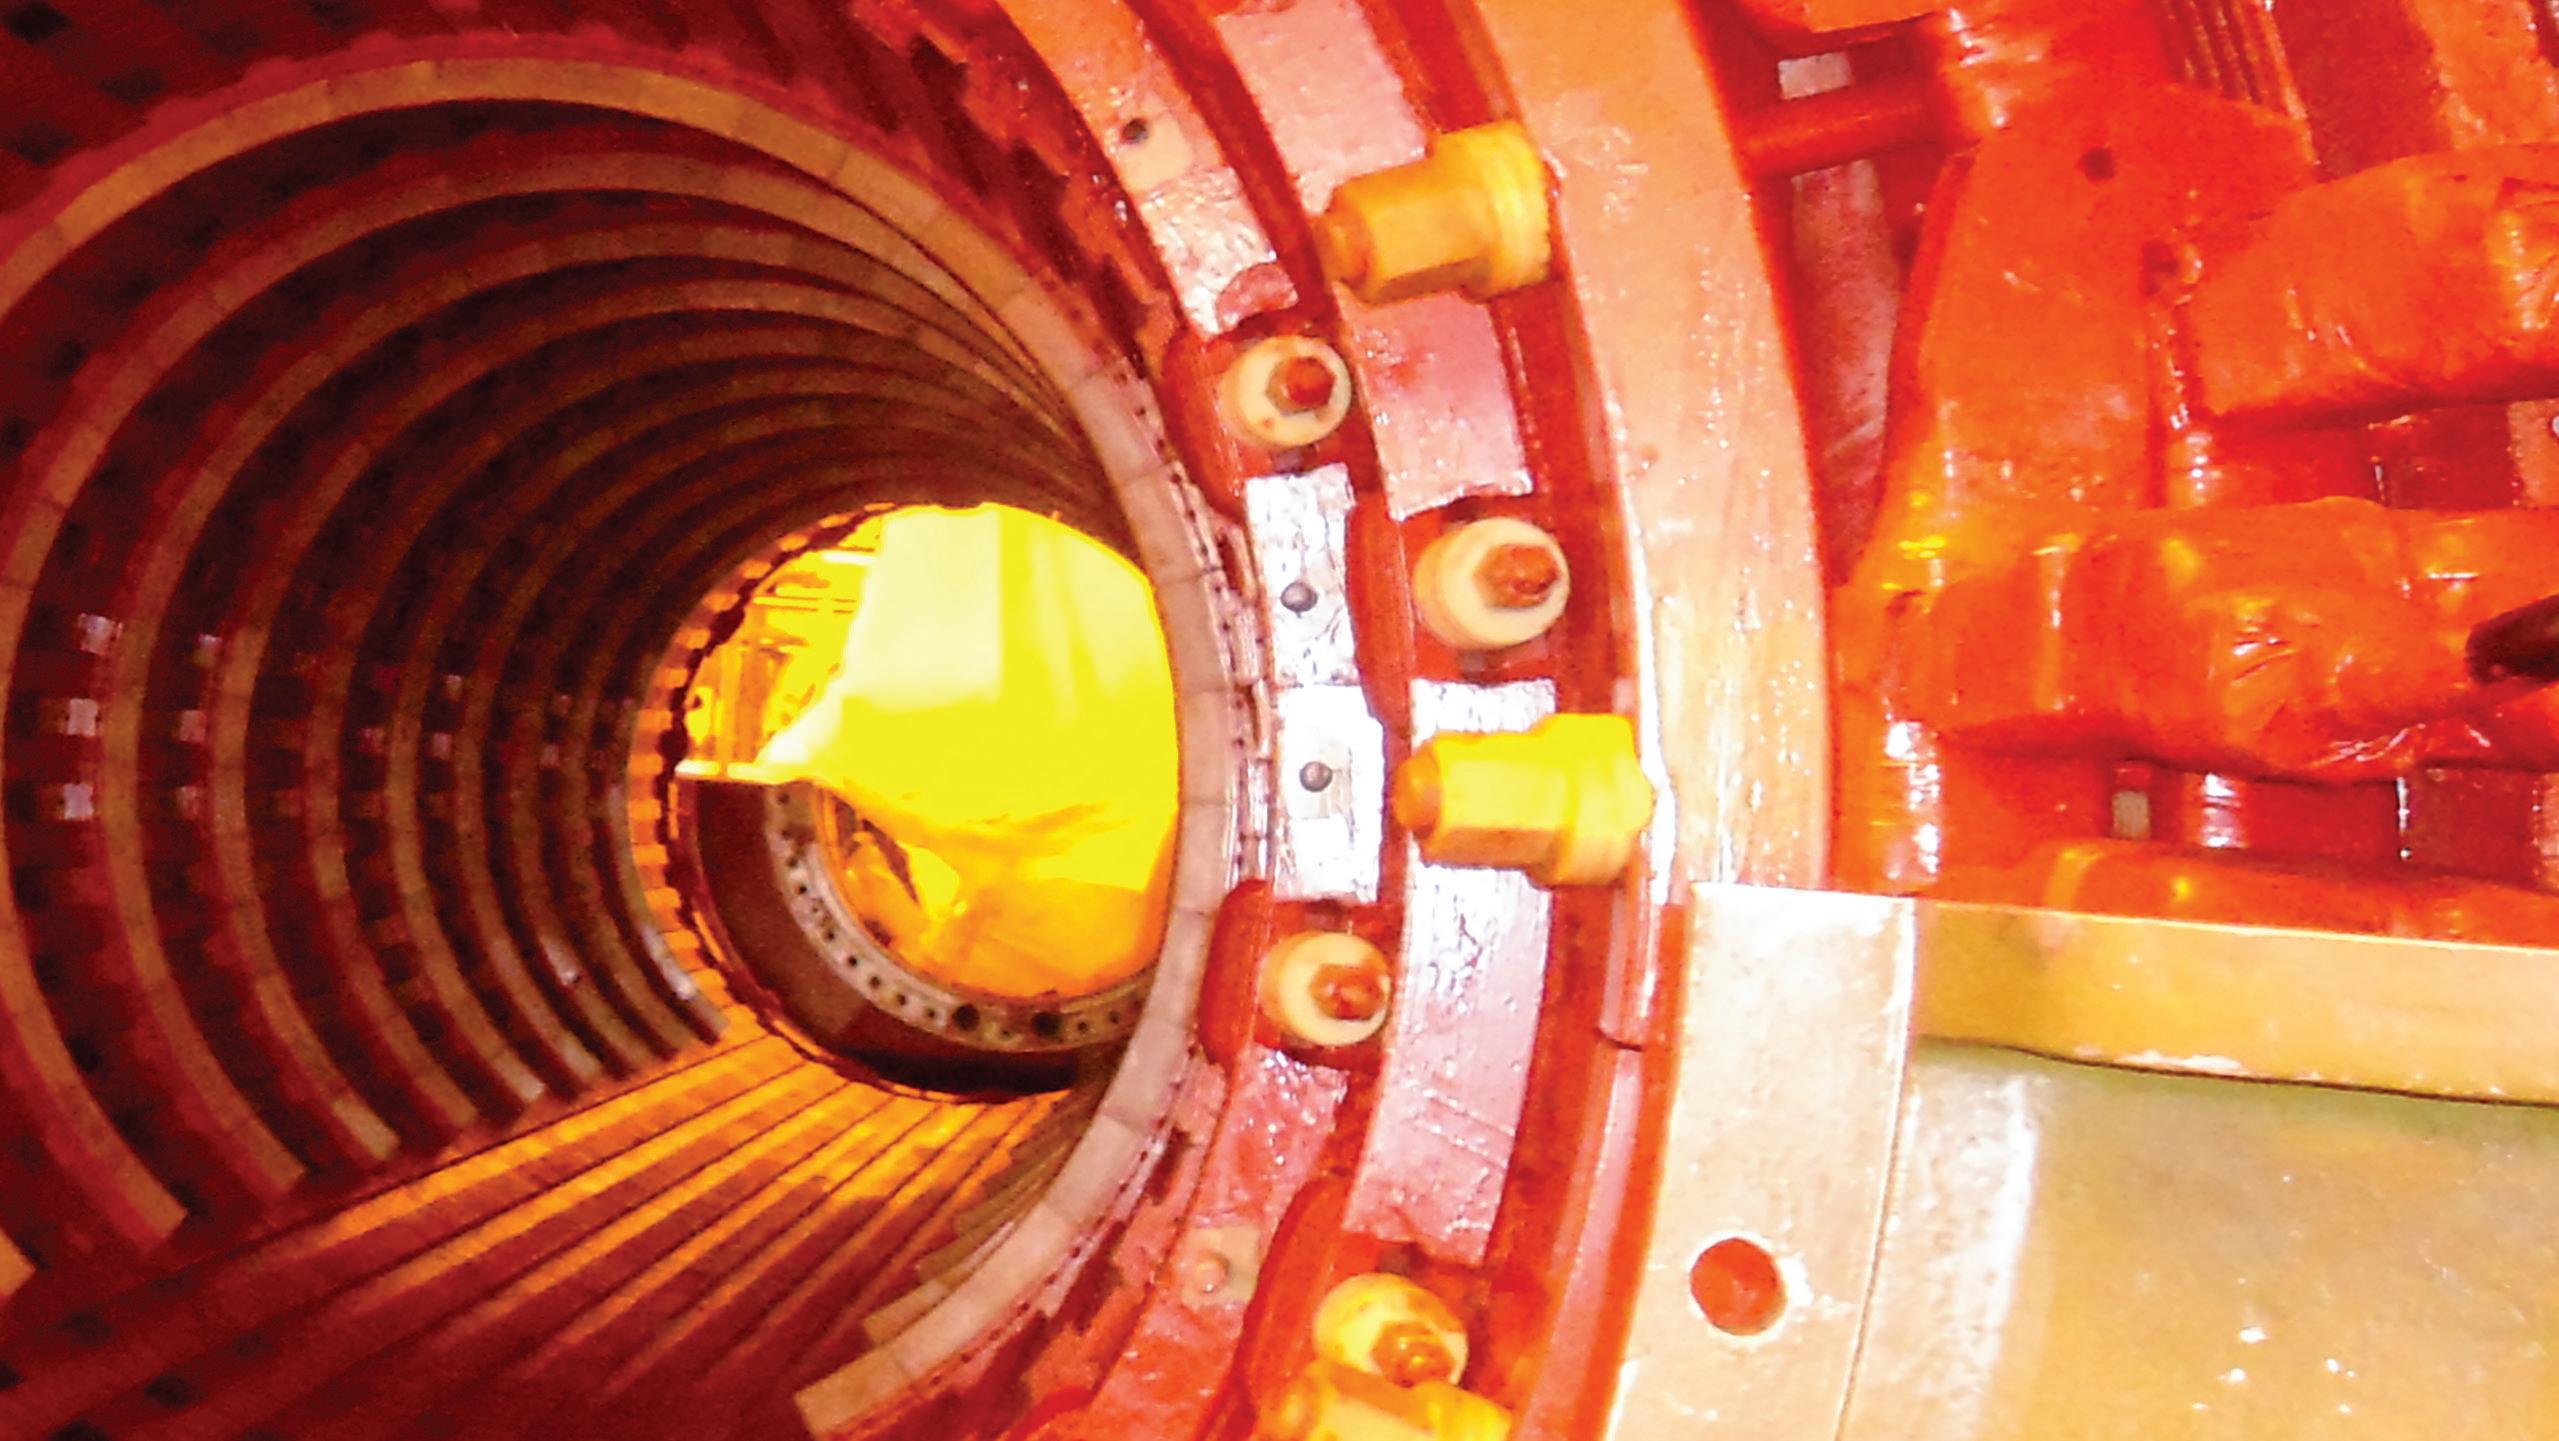
PHOTO: © ISTOCKPHOTO.COM/PORTFOLIO/ADEKABDULLAH
short between two laminations, but several shorts along adjacent laminations in addition to the building bolts or keybars would form a loop, and the induced circulating currents could be large enough to cause excessive local heating. If this heat cannot be sufficiently dissipated by local cooling, more inter-laminar failures would follow. If such an abnormal condition is not detected and repaired at an initial stage, the fault condition could lead to the melting of the core laminations and eventually total machine failure in the worstcase scenario.
Several mechanical and electrical tests and methods are available for assessing stator core tightness and stator core lamination insulation. These test methods usually require that the rotating machine be taken out of service and the rotor pulled out. The condition of the interlaminar insulation in the stator core can be assessed using electromagnetic test methods.
This article describes the benefits of performing a low flux measurement (ELCID) test to assess the condition of stator cores. Some of the advantages of this method include low
power requirements and short setup time. This method has the additional benefit of producing a permanent record of the condition of the interlaminar core insulation, which can be used as a benchmark for further comparisons.
For the benefit of readers, a short description of stator core construction and an introduction to the basic principles of performing a low flux measurement are first explained. Investigations are then detailed to show the influence of the frequency of the induced flux on the test results. The results of a low-flux measurement and a full flux measurement are compared.
STATOR CORE CONSTRUCTION
The primary functions of the stator core are to hold the stator windings in place and to provide a low-reluctance path to the magnetic flux. The core must handle magnetic field flux densities in the stator teeth and in the core back or yoke area.
The stator core is manufactured of thin laminations or sheets of electrical-grade (electrical steel sheets),
3%–4% silicon or grain-oriented, and 0.355 mm or 0.483 mm thick steel, such as the single lamination shown in Figure 1. They are segmented, meaning that from 10 to 24 laminates (depending on the machine design) are laid side by side to form a full 360-degree ring layer. Each of these layers is staggered relative to the locations of adjacent layers above and below by the butted radial edges of the adjacent laminates in each ring layer.
Usually, the stator core contains thousands or tens of thousands of core laminations that must be held tightly together, especially when the machine is laid sideways during installation and operation. To keep the laminated ring segments in line with each successive layer, they are fitted onto keybars in a stator frame structure. It is common for the laminations to be electrically connected at their outside edges where they are clamped to the building bars via keybars. Additionally, they are clamped axially to consolidate the core as a solid and stiff mass.
Two basic methods are used to achieve axial clamping force in larger machines:
• The most common is to use the keybar structure, on which the core is mounted by dovetail slots in the core laminates at the core back, in conjunction with a large full-ring pressing plate at each end of the stator.
• The other is to additionally use throughbolts installed through holes in the core yoke area that extend the full axial length of the stator core and through the pressing plate.
Building bolt notches/ Keybars Back iron/ Yoke
Finger Through bolt holes
Wedge Grooves
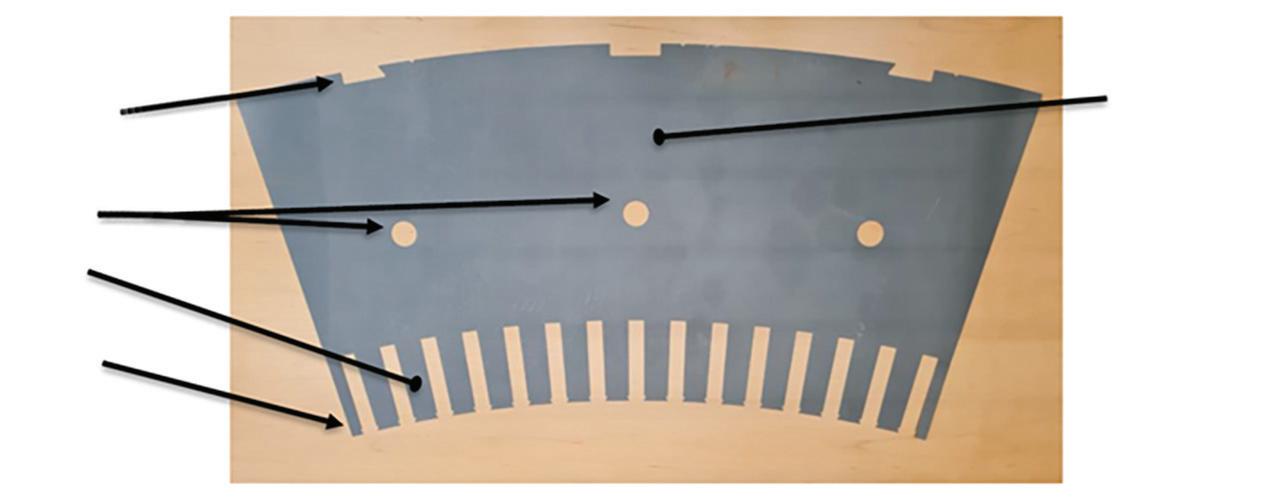
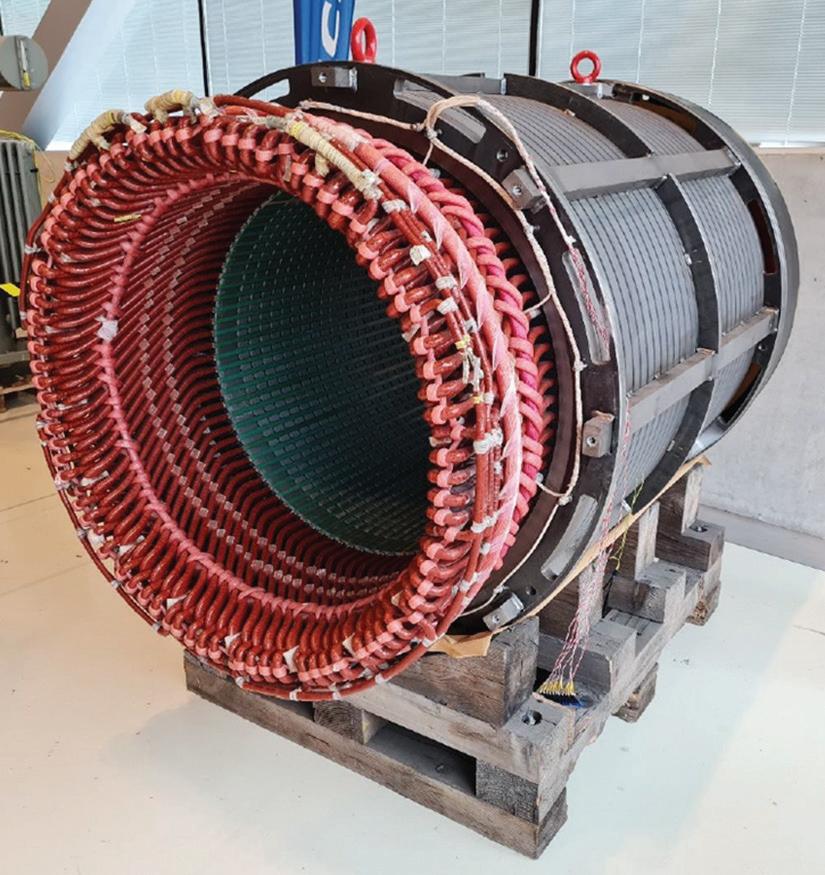
The laminations are usually welded to the stator frame in smaller machines, such as the one in the photo. In this case, welding provides good electrical contact. Therefore, a short between two or more of the laminations will cause a circulating current, resulting in a local hotspot.
Each lamination is insulated on both sides with an organic or inorganic compound of very thin dimension. The purpose of the interlaminar insulation is to confine any induced eddy currents by reducing the area where it can be induced to a minimum (Figure 2). This reduces the current magnitude and results in an overall reduction of eddy-current loss and associated temperature rise.
Slots are provided in the stator core for installation of the stator winding. Core material is removed to accommodate the winding;
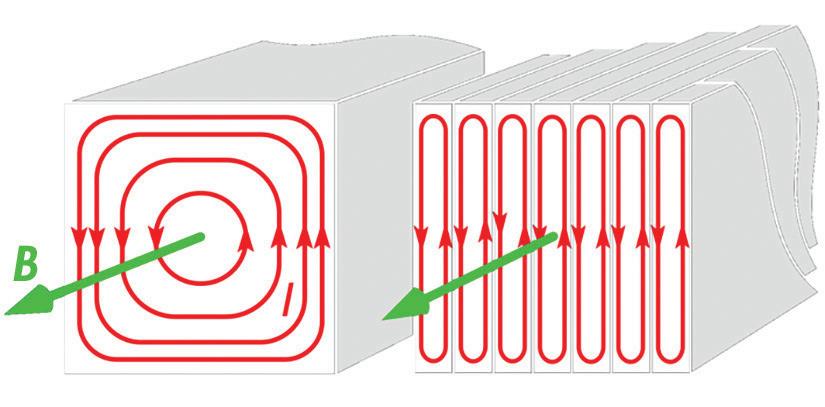
Figure 1: Individual Core-Plate Segment or Laminate (Lamination)
Figure 2: Eddy Current; Green Represents the Insulation Between Laminations
Construction of the Stator Core
Building bolt notches/ Keybars
Finger Through bolt holes
hence, the tooth flux densities are very high in this area. This affects the generated losses and heating in the core and the winding, which the machine cooling must dissipate. The portion of the core below the bottom of the winding slots is called the yoke or core back area.
Finger
Wedge Grooves
Wedge Grooves Excitation
BASICS OF LOW FLUX MEASUREMENTS
Wedge Grooves Excitation loop Power
The purpose of the low flux test is to assess the interlaminar insulation condition of a rotating machine’s stator. This method uses two main elements: an excitation winding and a Chattock potentiometer sensor. The excitation winding is wound around the core. Its function is to induce a flux inside the core with typically 4% of operating flux (Figure 3). The induced fault currents are measured by sensing the magnetic field using the Chattock potentiometer sensor.
As previously mentioned, it is common for the laminations in the stator cores of rotating machines to be electrically connected only at their outside edges. Therefore, an additional electrical connection (weak spot) between two or more laminations at a point other than their outside edges will produce a circuit loop between the weak spot and the clamped point on the back of the iron core, inducing circulating current (Figure 4).
The low flux test method essentially searches for weak spots in the stator core. These weak spots can arise when the insulation between two or more consecutive laminations in the stator core
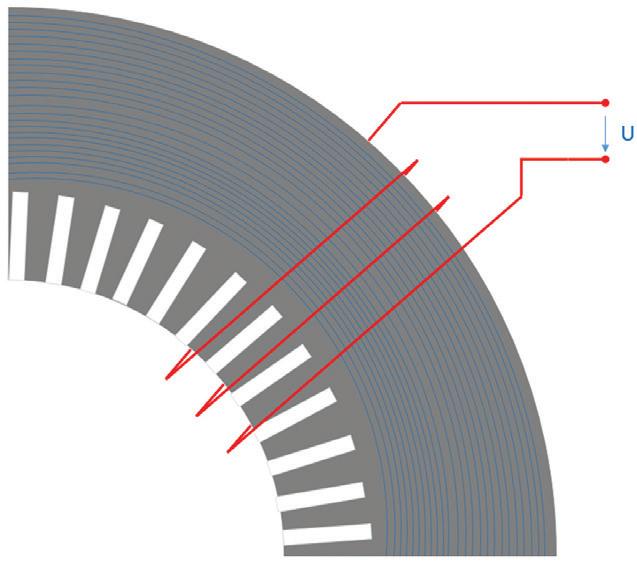
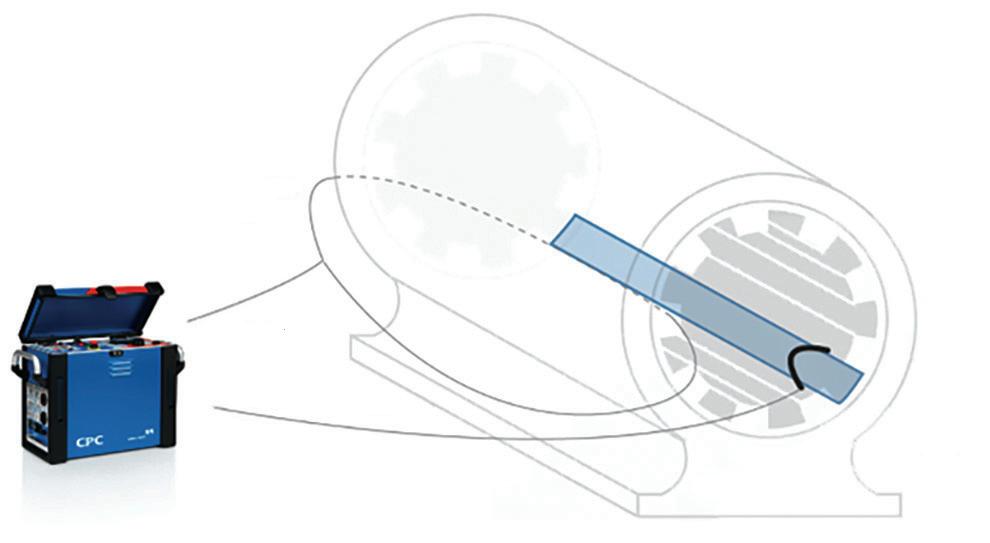
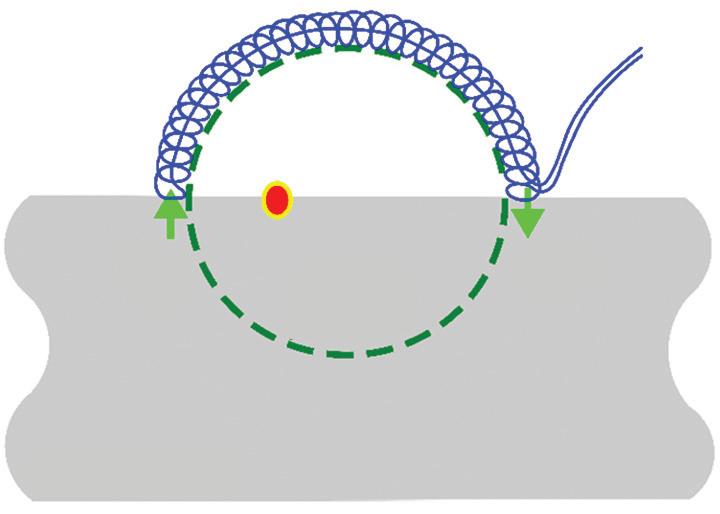
has broken down or is defective. An induced current can flow in the circuit loop established by the shorted laminations and the keybars or the welding connections at the frame as shown in Figure 5.
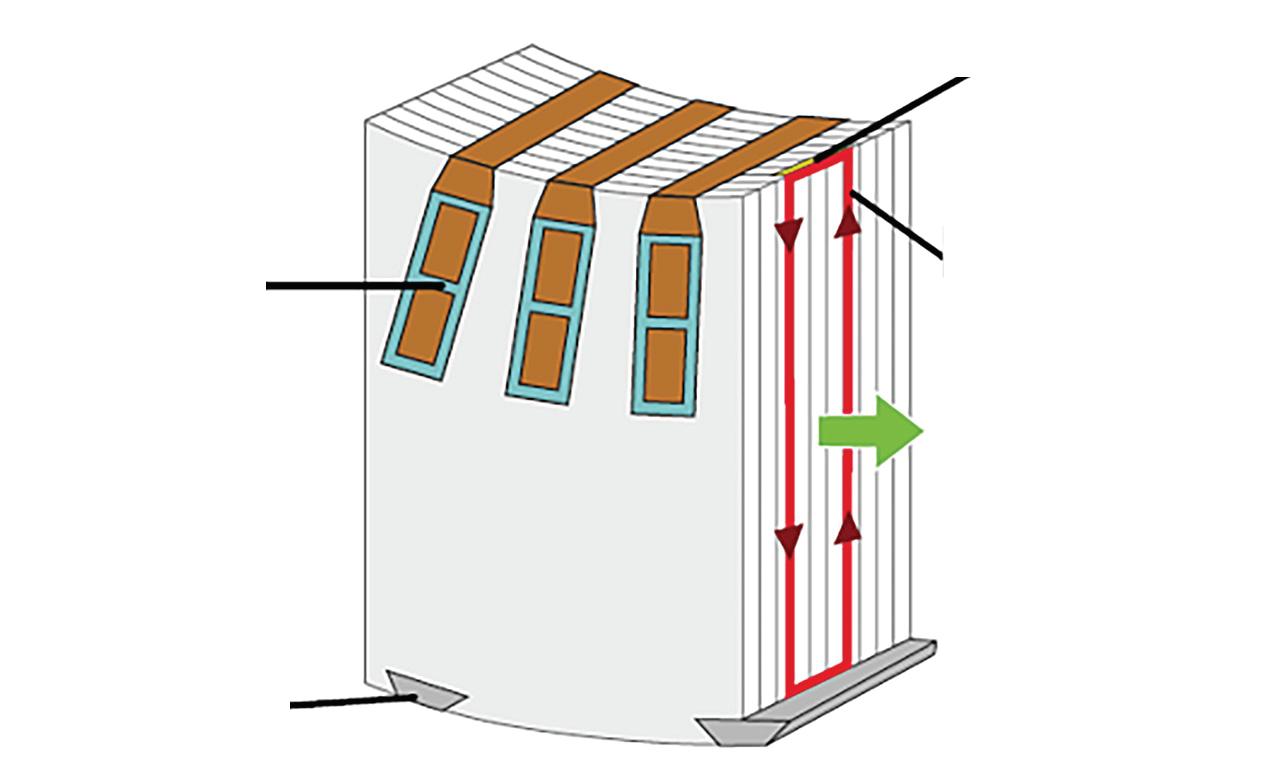
core
Figure 3: ELCID Measurement Principle with Excitation Winding, Chattock Sensor, and Control Device
Figure 4: Chattock Potentiometer Positioned on a Fault
Figure 5: (Left) Auxiliary Winding Wrapped Around Core; (Right) Higher Eddy Current Due to Damaged Stator Core
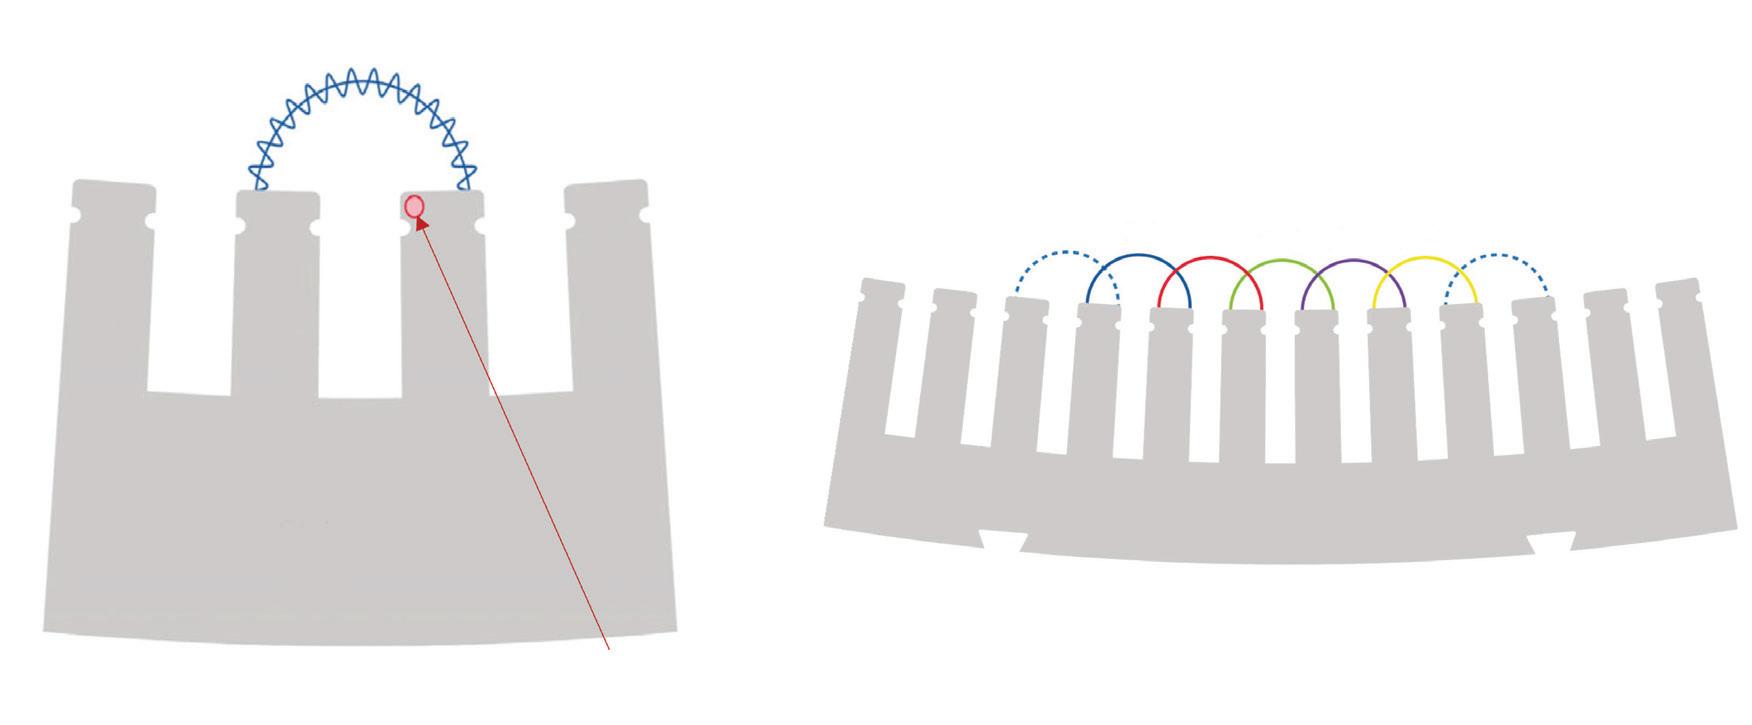
The fault current can be detected as a higher stray flux by a Chattock or Rogowski coil scanning the stator surface as shown in Figure 6.[3] Slots are scanned one by one by the measuring coil. The coil readings are correlated to a certain position within the stator core and are usually visualized using a heat map or by displaying all measured currents on a single graph. A common value at which locations should be investigated is 100 mA of the quadrature current when measurements are performed at 4% of rated flux and rated frequency.[1, 2] Later in this article, Figure 13 shows a graph with several traces superimposed, and Figure 14 provides an example of a heat map.
As the measurement coil width and the number of turns of the sensor remain the same for each measurement, a calibration should be obtained prior to each measurement.
Different slots are sequentially scanned by different measurements. The coil span is between the teeth of one slot to the next slot to ensure a certain overlapping area.
EXPERIMENTAL SETUP
Investigations regarding reproducibility and measurements with various frequencies have been performed on a small, decommissioned hydro generator with a rated voltage of 6.4 kV and 156 slots. The stator winding is a coil winding with two turns per coil. All other experiments described in the sections on
Detecting Faults Deeper in the Stator Core and Comparison to Ring Flux Measurements have been performed on different machines. The setup is explained in the corresponding sections.
For better visibility into the effect of various excitation frequencies on reproducibility, the experiments on the small hydro generator have been carried out by measuring over an artificial fault. A stator segment is shorted by a wire as shown in Figure 7. The reason for this modification is that it is easier to use the wire over two ventilation ducts rather than damaging the stator core.
In the Reproducibility section, a different artificial fault was used than in the section on Measuring With Different Frequencies.
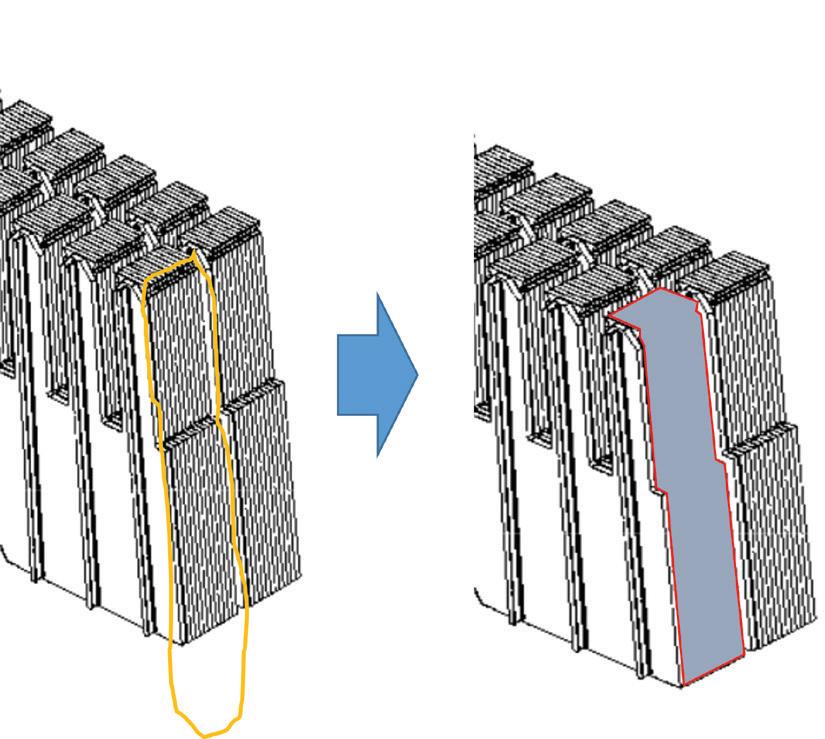
7: Implementing an Artificial Fault
Stator core
Chattock coil
Fault current
Figure 6: Detecting Fault Current by Measuring the Stray Flux by the Sensor
Figure
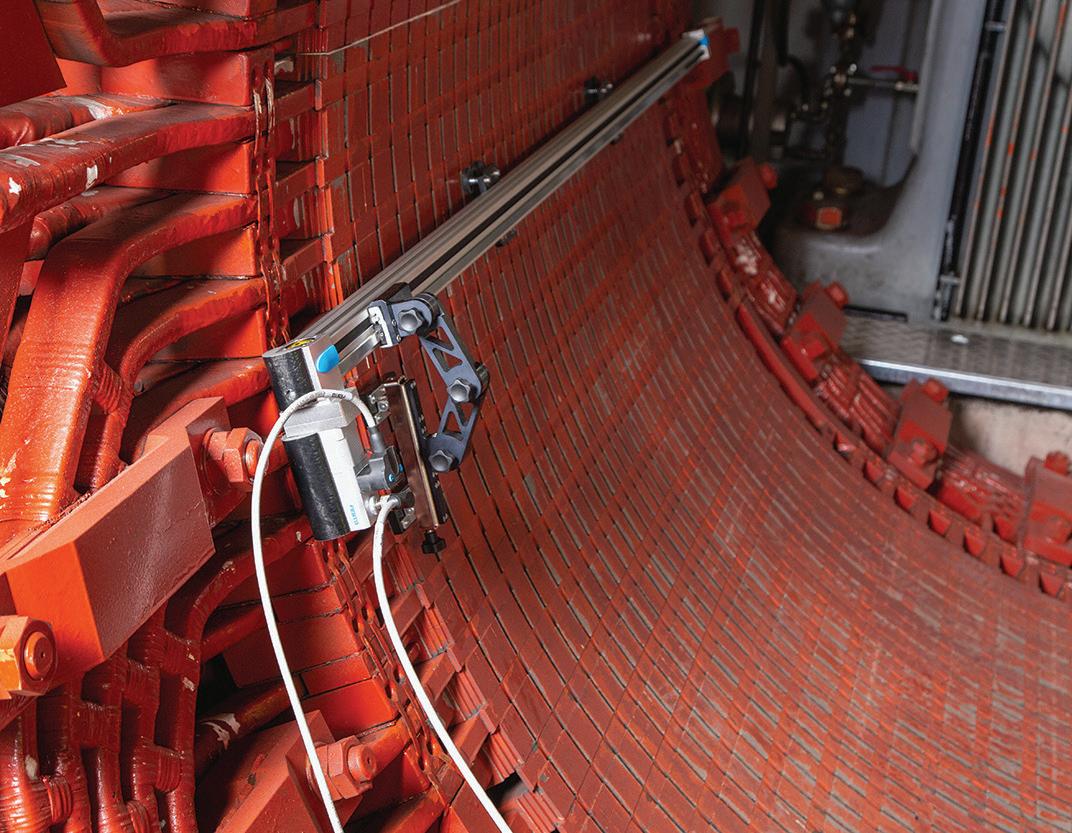
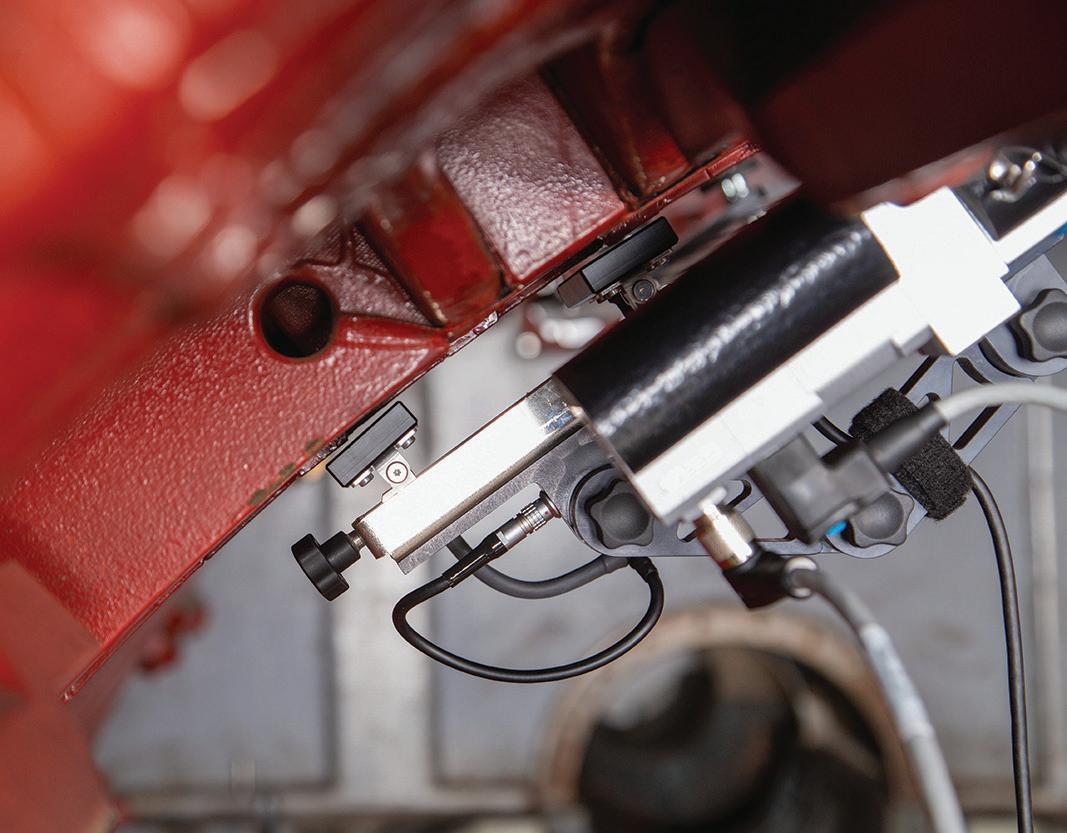
REPRODUCIBILITY
The measurement device in this investigation consists of a semiautomatic movement of the Chattock sensor on a rail. The sensor itself travels over the stator surface at 2 mm to 3 mm, which ensures a sensitive measurement. The setup is shown in the photo.
To ensure that the often-used interpretation limit is not influenced by the measurement setup, investigations on reproducibility have
been performed. It becomes even more important to estimate the criticality of existing potential weak spots as the user wants to have a way to trend the results over time.
The first comparison in Figure 8 shows two measurements on the same slot with a fault without changing any setting.
As the high reproducibility is not surprising, in the next comparison in Figure 9 the mechanical


9: Measurements of the Same Slot After Setting Up and Adjusting the Rail and Coil Every Time Before Measuring
(Left) Rail and Coil Support During a Measurement; (Right) Excitation Winding Not Shown
Figure
Figure 8: Two Measurements of the Same Slot
setup and adjustment were performed each time at the beginning of each measurement. In this case, the same healthy slot was scanned, so no fault was implemented in these measurements. Each measurement trace was recorded after redoing the mechanical setup each time at the beginning of each measurement. The spread of the results is higher than in Figure 10, but it is still very low and does not present a hindrance to reliable measurement.
MEASURING WITH DIFFERENT FREQUENCIES
The effect of the measurement with higher frequencies is explained with two comparison measurements at 50 Hz and 400 Hz. Both measurements were executed on the identical slot with the same artificial fault. No changes or modifications were made between the different measurements; the only changes made were to the excitation parameters. The measurement was performed on the small hydro generator
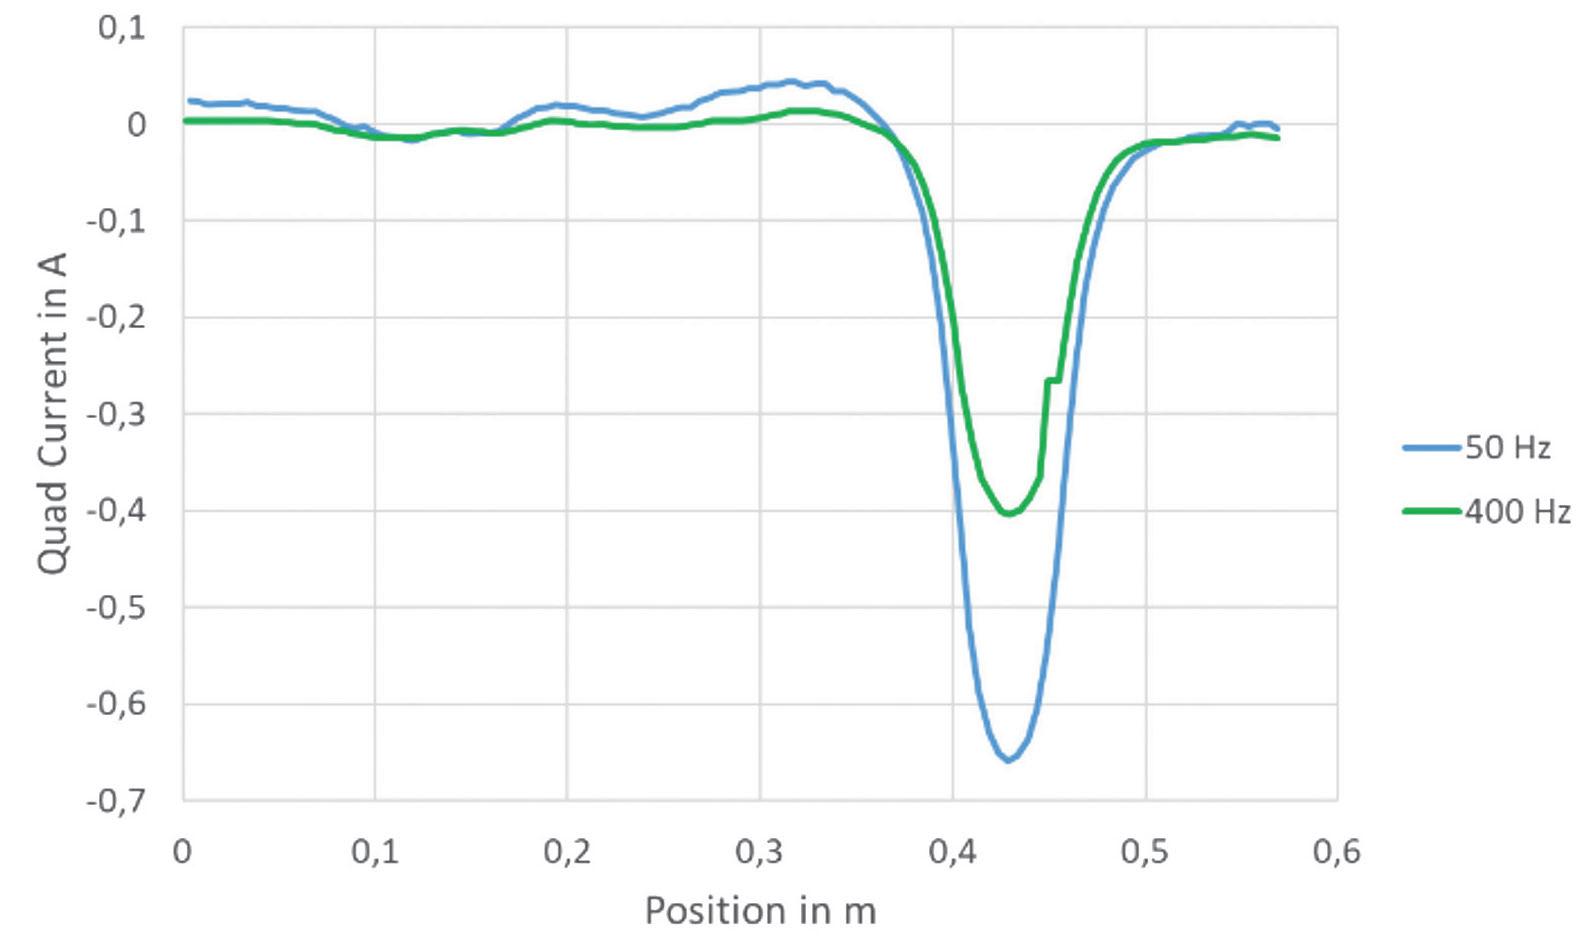
Table 2: Measurement with the Same Flux for Both Frequencies
with 24 excitation windings described in the Experimental Setup section.
As known, flux is inversely proportional to frequency but behaves proportionally to the voltage. To compare two measurements with different frequencies, the excitation voltage was kept the same in the first experiment. Consequently, the flux for the 8-times-higher frequency measurement decreased by a factor of 8.
However, in the second attempt, flux was kept the same for both measurements. Therefore, the excitation voltage had to be adapted accordingly. Table 1 and Table 2 offer an overview of the two settings.
If measured with 0,5% of rated flux at 400 Hz, the highest peak at the defect has an absolute amplitude value of around 400 mA, while at 4% and 50 Hz, the peak reaches around 650 mA (Figure 10). Although this is much lower, flux was decreased by a factor of 8!
Furthermore, we also see lower fluctuation around the zero line of the 400 Hz measurement when looking at the healthy section of the slot (Figure 11).
As already assumed from the first experiment, when keeping flux equal for both frequencies, the picture changes completely, as displayed in Figure 12. In this case, the amplitude of the 400 Hz measurement is much higher than the 50 Hz measurement. When comparing this with the measurement in Figure 10, please be aware of the different scaling on the vertical axis.
Table 1: Measurement with the Same Excitation Voltage for Both Frequencies
Figure 10: Measurement with the Same Excitation Voltage
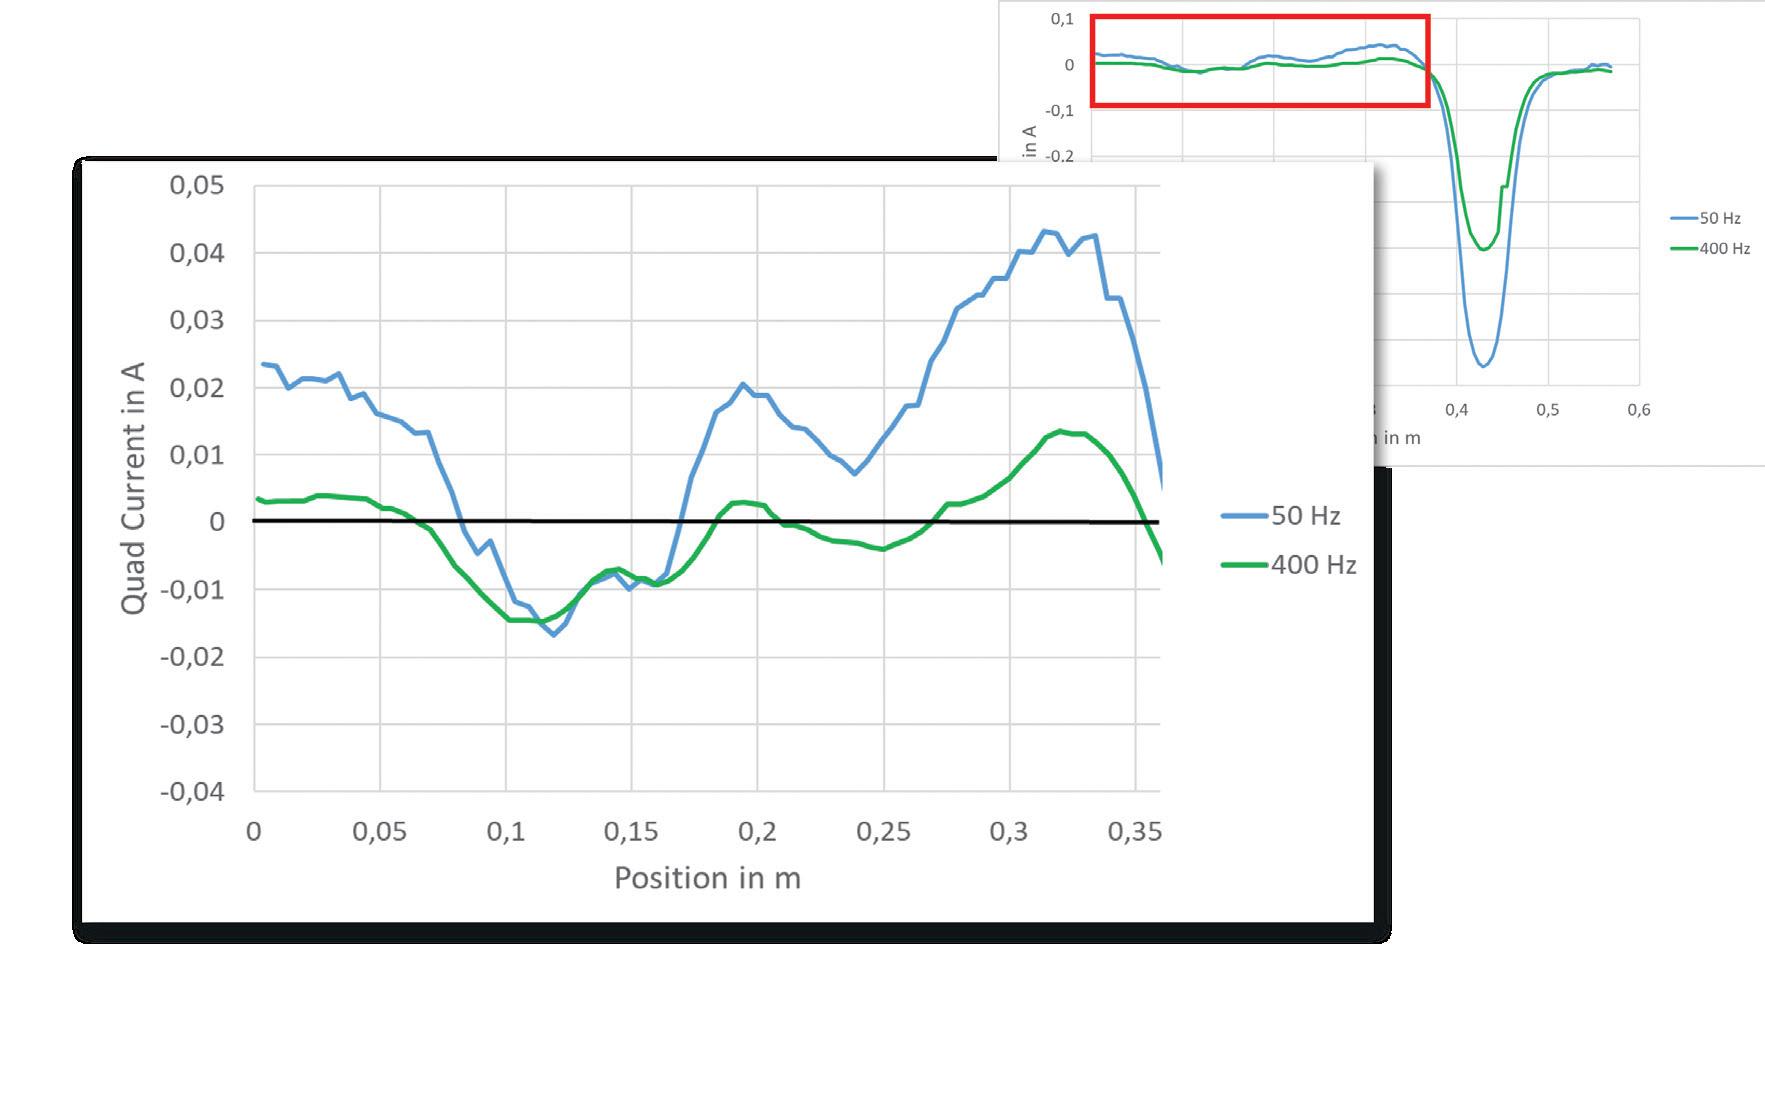
11: Zoom-Out of the Slot Section Without the Fault
An absolute limit for frequencies different than the rated frequency does not exist and might be the topic of future investigations. Although no limits exist, measurement with higher frequencies

could be an attractive approach. As the stray flux measurement is also a comparative method, it seems as though measurement spikes on fault locations are clearly visible with higher frequencies.
EC13004105 • 24 Hour Emergency Ser vice ACCEPTANCE AND MAINTENANCE TESTING AND REPAIR
• Cables
• LV/MV Circuit Breakers
• Rotating Machiner y
• Meters
• Automatic Transfer Switches
• Switchgear and Switchboard Assemblies
• Load Studies
• LV/MV Switches
• Relays - All Types
• Motor Control Centers
• Grounding Systems
• Transformers
• Insulating Fluids
• Thermographic Sur veys
• Reclosers
• Surge Arresters
• Capacitors
• Batteries
• Ground Fault Systems
• Equipotential Ground Testing
Co NSul TING AND ENGINEERING SERv ICES
• Transient Voltage Recording and Analysis
• Electromagnetic Field (EMF) Testing
• Harmonic Investigation
• Replacement of Insulating Fluids
• Power Factor Studies

Figure
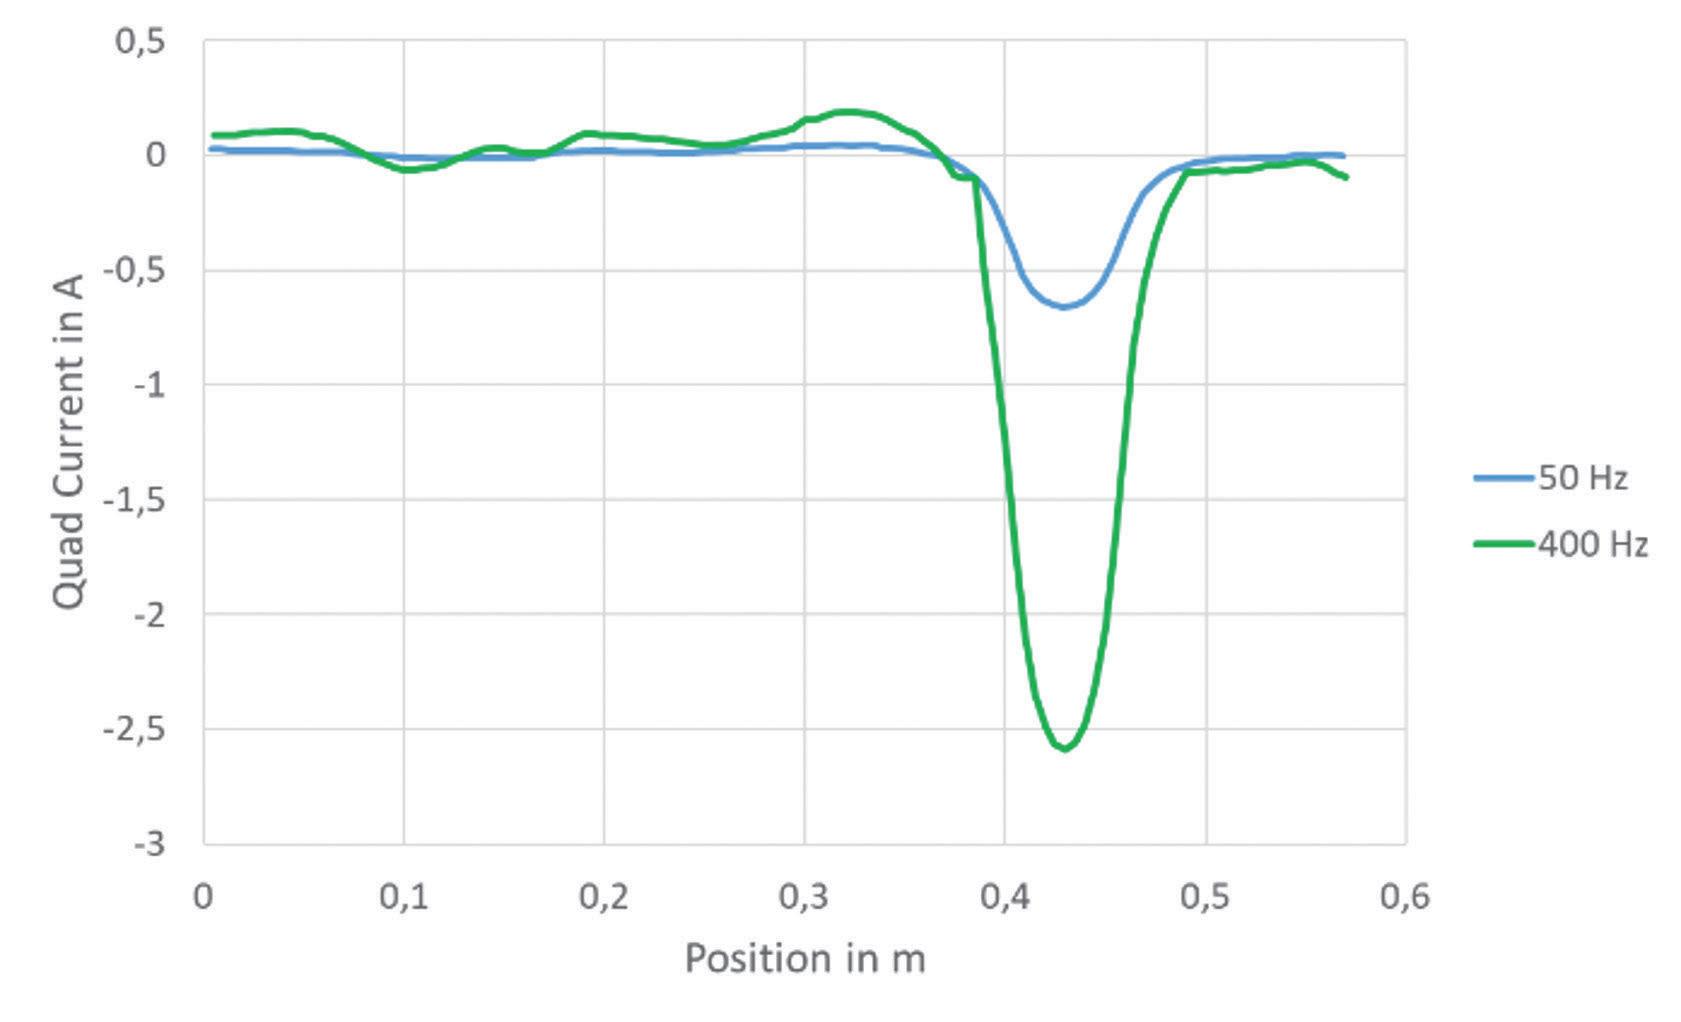
DETECTION OF FAULTS DEEPER IN THE STATOR CORE
Faults in the lamination insulation can be detected even if they are located deeper within the stator core. This is demonstrated in a practical use case, where a motor was in a repair shop due to a phase-to-ground fault in the machine. The protection worked well in this case and tripped immediately; therefore, the damage in the machine due to the fault was comparably small and not visible from outside. An endoscopic inspection of each ventilation duct was able to localize the issue.
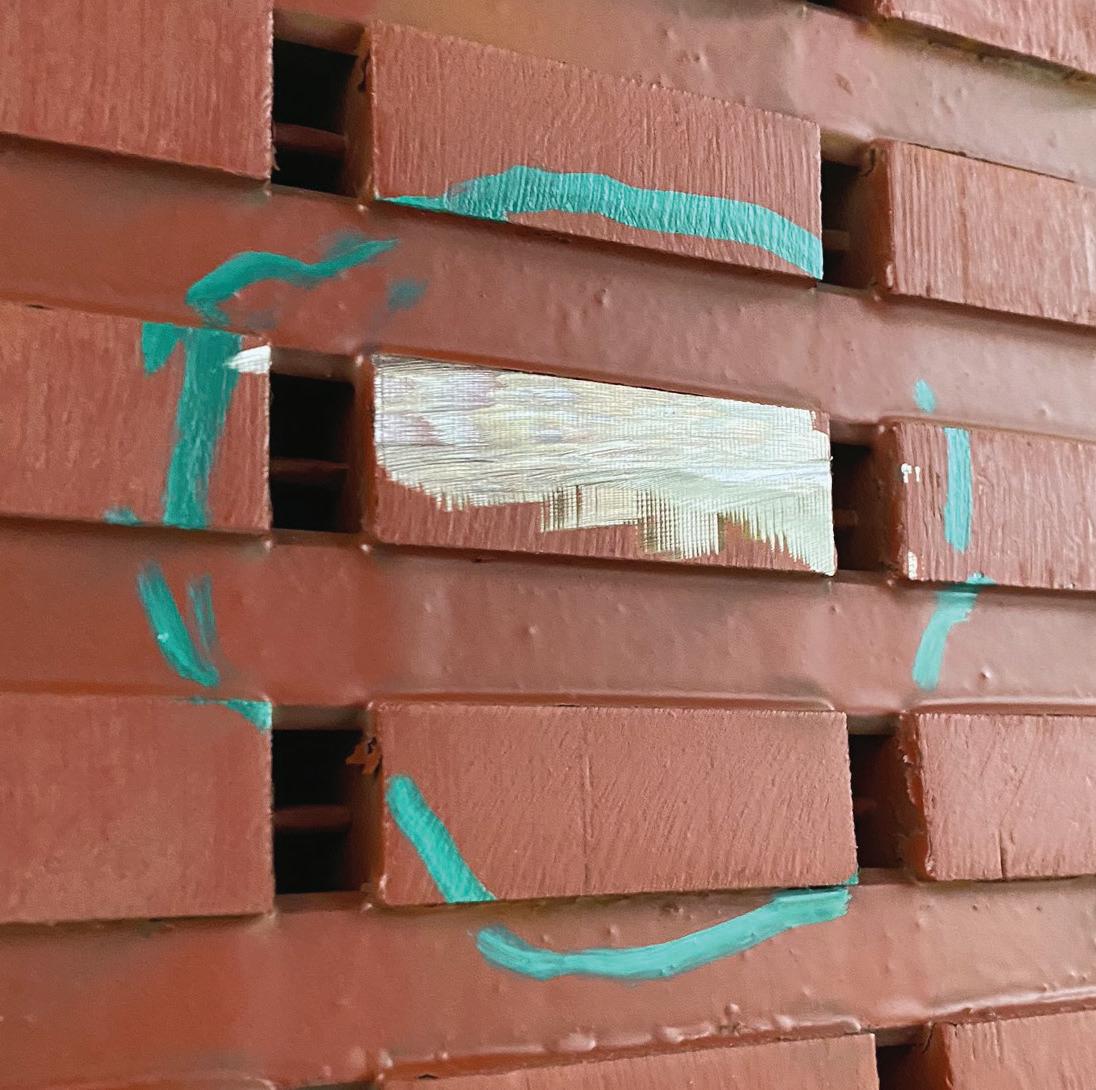
From this investigation, it was known that the fault is located on the bottom side of a lower bar. The project leader responsible for the repair wanted to know whether the stator core was affected and needed to be repaired as well. The measurement results depicted in Figure 13 show a clear peak over 100 mA at around 800 mm of the stator core.
The operator was convinced that the problem in the stator core was already present before the maintenance work, and the damage did not happen during the change of the coil.
COMPARISON TO RING FLUX MEASUREMENTS
To compare the stray flux measurement and the situation during machine operation, a comparison measurement was performed. The test machine was completely renewed so it was possible to implement faults and compare the measurement with the full flux test and a thermographic camera.
These photos show two ways of implementing these faults.
Depending on the modification technique, not every spot shows a significant increase in temperature during the full flux test or in the stray flux measurement. Two modifications
Fault Implementation (left) and Black Painting (right) Prevent Reflection During Thermographic Measurement
Figure 12: Measurement with Same Flux — Note Different Scaling at Vertical Axis Compared to Figure 10

Figure 13: Measurements of the motor in the repair shop show a visible problem in the stator core at around 800 mm.
showed a temperature raise of >10°C, which is considered critical. [1] These locations could also be reliably detected with the stray flux measurement and an amplitude higher than 100 mA. The heat map with the results of the entire stator as well as the thermographic picture of the two critical spots is displayed in Figure 14. The other spots showed less temperature increase compared to the
surroundings. They were also visible in the stray flux measurement, as locations with higher stray flux remained below the limit of 100 mA.
CONCLUSION
The stray flux measurement is a reliable method to detect weak spots in the interlamination insulation of stator cores.





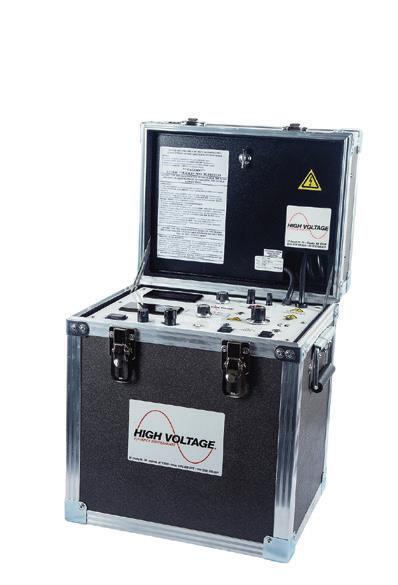


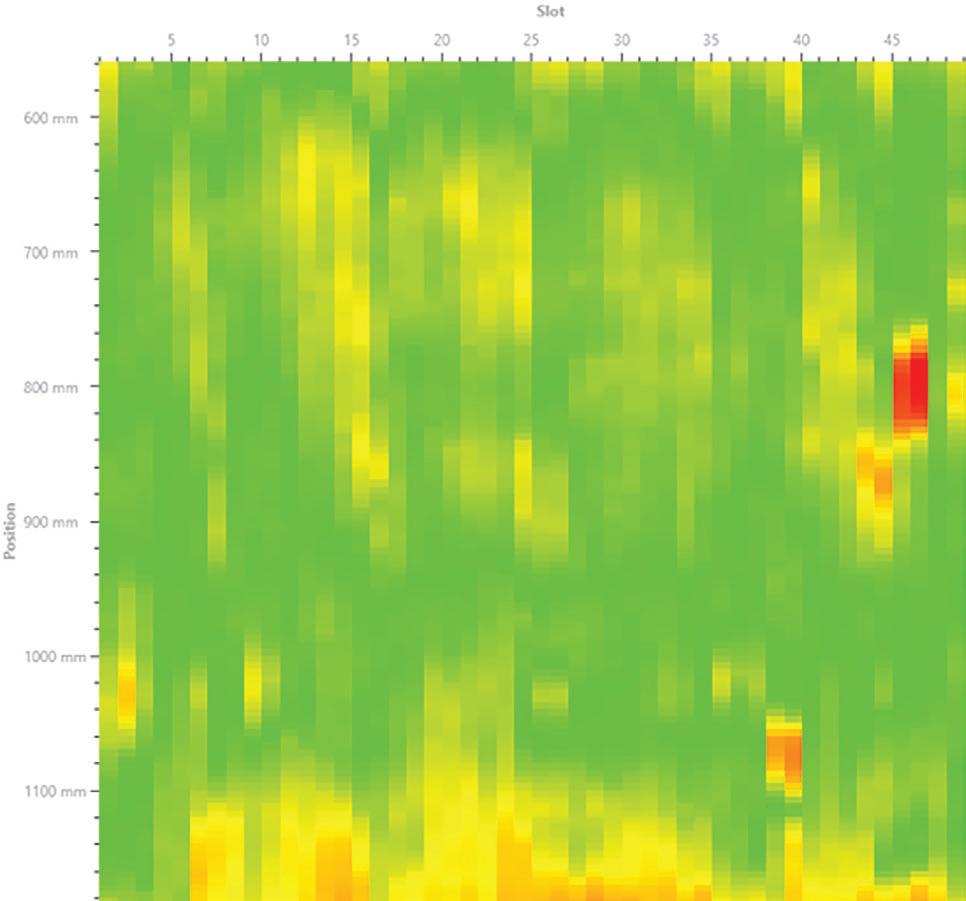
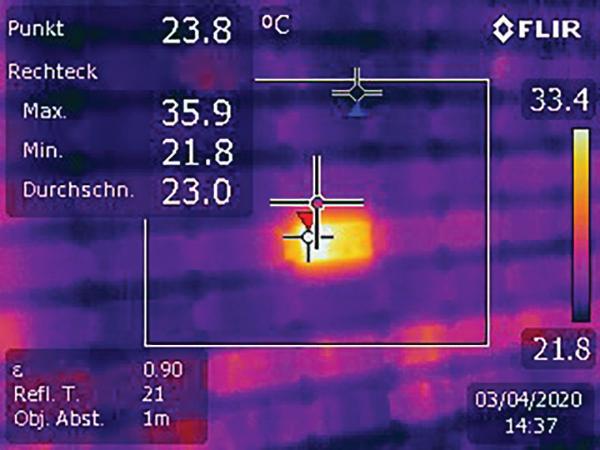
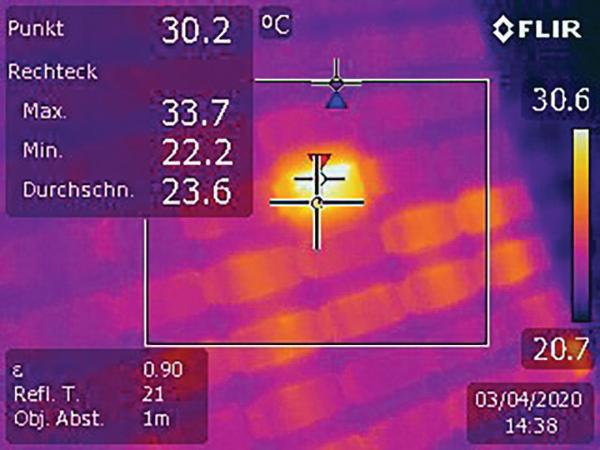
The repeatability between tests was successfully demonstrated, and a comparison between a full flux measurement showed similar results. In addition, when using a frequency variable power source, increased frequency could lead to improved sensitivity on some defects for specific circumstances.
Equipment portability and easy setup make the solution interesting for performing on-site measurements as well as workshop applications.
REFERENCES
[1] IEEE Std 56-2016, IEEE Guide for Insulation Maintenance of Electric Machines, Annex D (informative), September 2016.
[2] Cigre. Brochure 257, EL CID (Electromagnetic — Core Imperfection Detector) Testing of Large Steam-Turbine Driven Generators. Working Group A1.01.06, October 2004.
[3] Bertenshaw, David Ronald. “Stator Core Interlamination Faults and Their Detection by Electromagnetic Means.” PhD Thesis, University of Manchester, Faculty of Engineering and Physical Sciences, 2014.

Fabian Öttl is a Product Manager at OMICRON Technologies Italia GmbH. In his role, he is responsible for rotating machine testing and diagnostic equipment. Before he joined OMICRON, Fabian worked in the R&D department of a manufacturer of large generators as a highvoltage insulation specialist. He has written many scientific and technical papers and contributes to various working groups of Cigre and IEC. He received his MSc from Graz University of Technology in 2011.

Mathieu Lachance joined OMICRON electronics Canada in 2019 and presently holds the position of Regional Application Specialist for partial discharges and rotating machines for North America. Before joining OMICRON, Mathieu worked as a test engineer in the fields of partial discharges and high voltage. His current interests are partial discharge testing, dielectric frequency response analysis, and condition assessment of high-voltage and medium-voltage equipment. He received a BS in electrical engineering from Université Laval and currently pursues his graduate education at École de technologie supérieure, with a focus on the use of dielectric frequency response analysis applied to stator winding insulation systems.
Figure 14: This heat map (left) of the stray flux measurement includes thermographic pictures (right) comparing two locations where the measured current was above 100 mA.
Newest Circuit Breaker Test Set:
BUILT FOR FIELD SERVICE
The perfect test set for every service vehicle in your fleet. Up to 1,000A output, under 50 lbs, easy to connect and use, which makes this lightweight & rugged test set ideal for every day use.
NEW SAFETY ENHANCEMENTS
Improved Cam-Lok output connectors helps ensure a secure connection.
ACHIEVE PEAK OUTPUT OF 1,000A
This test set achieves peak output of approximately 1000A, making the unit ideal for testing circuit breakers, motor overload relays and ground fault trip devices, whether magnetic, thermal or solid state.
NEW METHOD TO INSPECT MOTOR/GENERATOR WINDINGS FOR ELECTRICAL INTEGRITY
BY EDIS OSMANBASIC, DV Power, Sweden and NORMEN KAEMENA, Siemens Gamesa, Germany
Measuring the winding resistance of generators and motors is one of the essential tests used in factory acceptance testing and during periodic routine testing procedures. This test can detect various problems in rotating machine windings, including a turn-to-turn short circuit in windings, which reduces a motor/generator’s ability to produce a balanced magnetic field, and a phase-to-phase short circuit, which in most cases results in a motor/generator trip, etc. The usual procedure for winding resistance measurement tests is using DC current, waiting for resistance stabilization, and recording the resistance value. The resistance value is dependent on the winding temperature; therefore, it is necessary to correct the value to the reference temperature.
Recently, manufacturers of rotating machines and test instruments have joined forces to develop a new testing method capable of detecting even small irregularities in winding integrity (weak connections) that could not be spotted using the traditional way of testing winding resistance. The new method requires a high DC test current of at least 300 A and the capability to run a continuous test to generate heat in the weak points in the generator. The measurement circuit must continuously record resistance values with very-high accuracy to
detect even very-low resistance changes (in the range of a few µΩ).
This test has high value for asset owners and manufacturers of large generators with nominal currents of thousands of amperes. Even small irregularities in connections can cause significant temperature increases concentrated in a single point. Since rotating machines usually operate under high vibration and mechanical stress, small irregularities can develop into big failures.
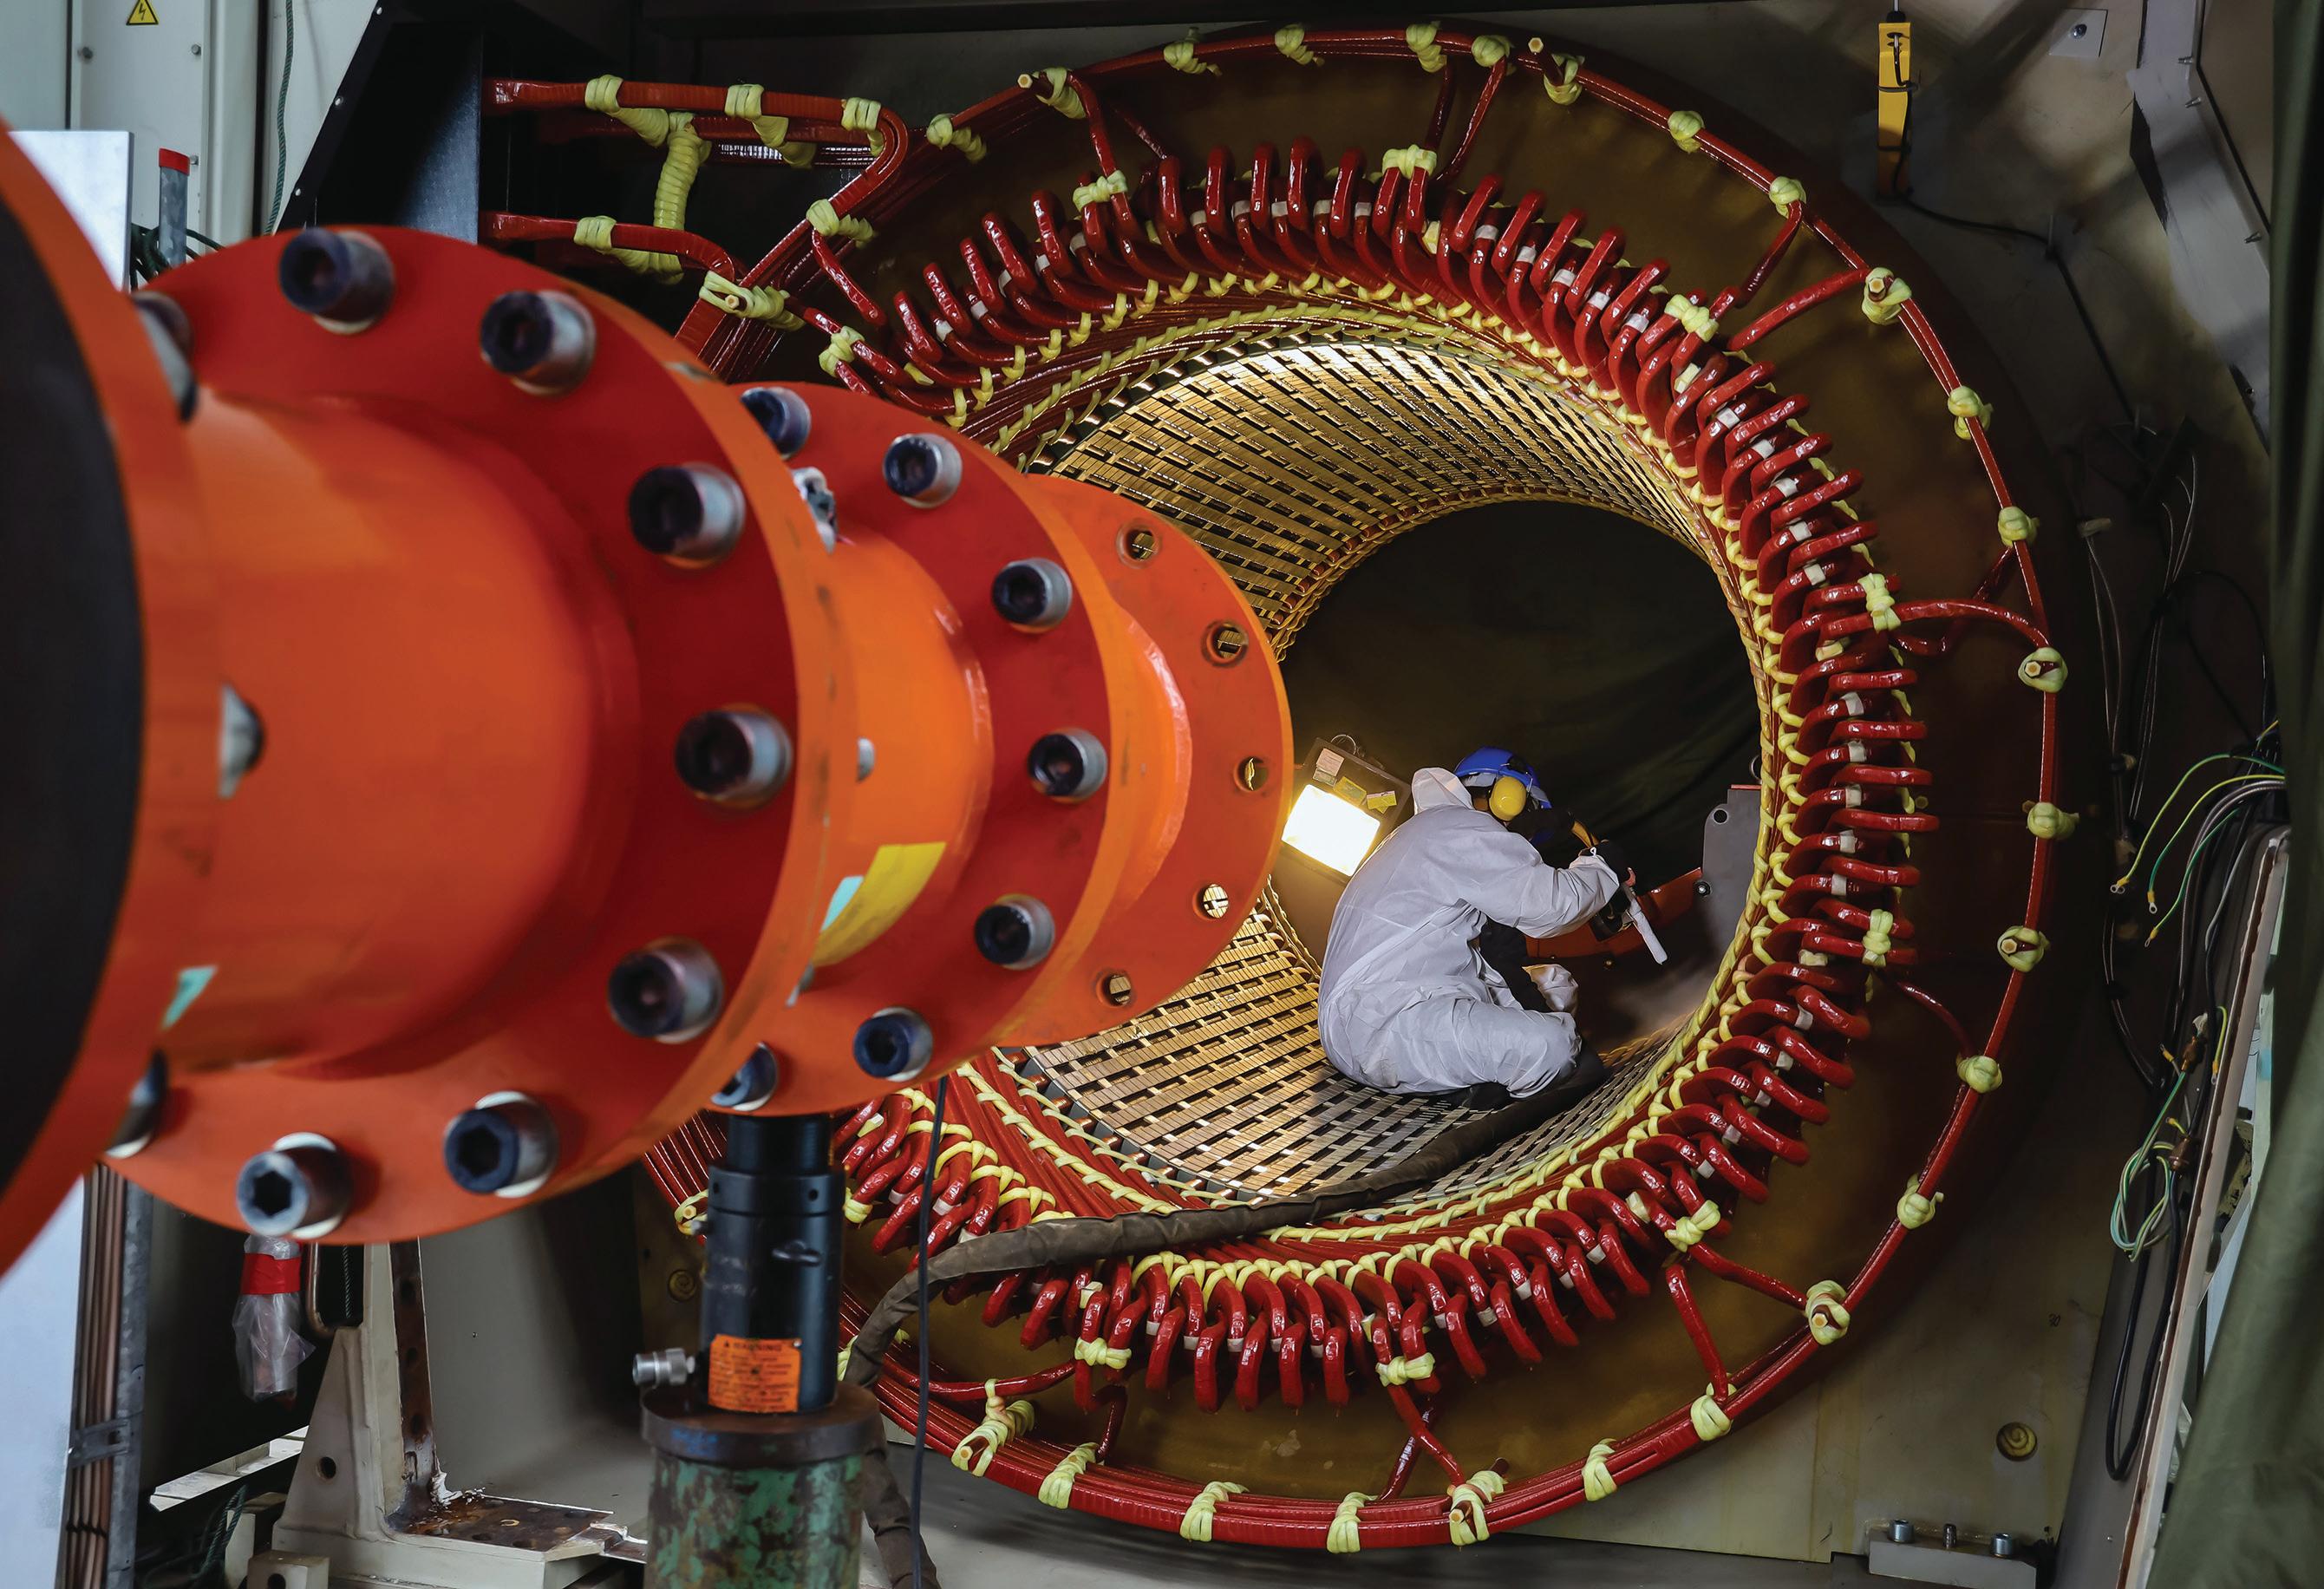
MAINTAINING ROTARY MACHINES
The market offers a wide range of electrical rotating machines (motors and generators). They are key components in the power generation and industrial sectors. Electrical machines operate in important applications and must be reliable since failure can introduce huge damage to the machines as well as the entire system, causing high economic losses. Generators are exposed to various negative influences during operation:
• Thermal: High and low temperatures, overload, hot spots
• Electrical: Partial discharges, surges, overvoltages
• Ambient: Contamination, humidity, particles
• Mechanical: Vibration
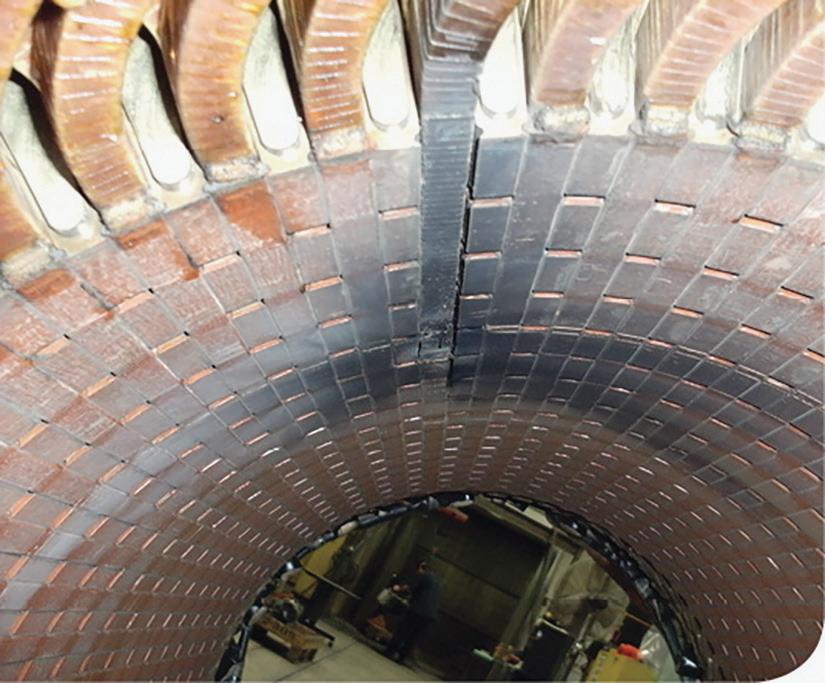
It is critically important to create a maintenance strategy that will not only find a failure but also predict possible failures (such as a missing wedge shown here) and provide an estimate of the remaining asset
PHOTO: ©SHUTTERSTOCK.COM/G/NUTTHAPAT+MATPHONGTAVORN
A missing wedge at the top has caused a coil failure.[1]
life span. The strategy should include a set of testing methods employed to investigate the condition of various parts of the motor by checking insulation, connections, power losses, vibrations, etc., to increase the reliability of the asset and extend reliable service life.
RELEVANT STANDARDS
Fortunately, relevant standards and guides clearly define testing procedures for rotating machines. Standards and guides are defined based on the collaborative work and experience of numerous relevant companies worldwide. It is important to mention these relevant standards:
• IEEE Std. 43-2013, IEEE Recommended Practice for Testing Insulation Resistance of Electric Machinery
• IEEE Std. 112-2017, IEEE Standard Test Procedure for Polyphase Induction Motors and Generators
• IEEE 1415-2006, IEEE Guide for Induction Machinery Maintenance Testing and Failure Analysis
Additionally, handbooks and maintenance guides created according to the relevant standards and internal experience are available from manufacturers.
TESTING METHODS
A rotary machine should be tested and inspected during each phase of its life cycle, including manufacturing and final testing, commissioning, periodical routine testing, after experiencing a faulty condition, and after repair/refurbishment. Several electrical diagnostic testing methods that allow condition assessment of various components of the rotary machine are available and recommended. Common electrical testing methods include:
• Capacitance and tan δ test
• Partial discharge (PD) test
• Voltage withstand test
• Insulation resistance test
• DC winding resistance test
• Connection resistance test
• SFRA (sweep frequency response analysis)
This article focuses on two similar tests: DC winding resistance and contact resistance.
Winding Resistance Measurement
The DC winding resistance test checks stator and rotor windings and all circuit connections. Winding resistance measurement procedures are provided in IEEE Std. 118-1978, IEEE Standard Test Code for Resistance Measurement and IEEE Std. 119-1974, IEEE Recommended Practice for General Principles of Temperature Measurement as Applied to Electrical Apparatus
The procedures should be followed when measuring the resistance of the stator winding and the rotor winding on wound-rotor machines. The test results are also used to calculate power losses in stator windings (I2R).
Connection Resistance Measurement
The contact resistance measurement test focuses only on checking individual contacts. Contact resistance is usually very low, from a few to tens of microOhms. Accurate and reliable measurement requires a higher test current to create a higher voltage drop (measured signal). During the manufacturing process in the factory, the connection resistance test is important to verify that all wires, windings, and leads are connected properly, which means tight contact with good pressure without the possibility of moving and shaking. Insufficient contact will cause higher resistance, which will be followed by higher power losses in the form of heating. Heating is concentrated in the weak point (connection) and can create a larger problem in the form of damage to windings or insulation.
A DC voltage instrument is used to measure winding resistance R. The test cables should be connected to the outputs of the machine, and the resistance will be measured between those points. DC and DC voltage are measured simultaneously for each phase, and the resistance is calculated simply as:
However, motors and generators are inductive loads, and the stator and rotor windings have
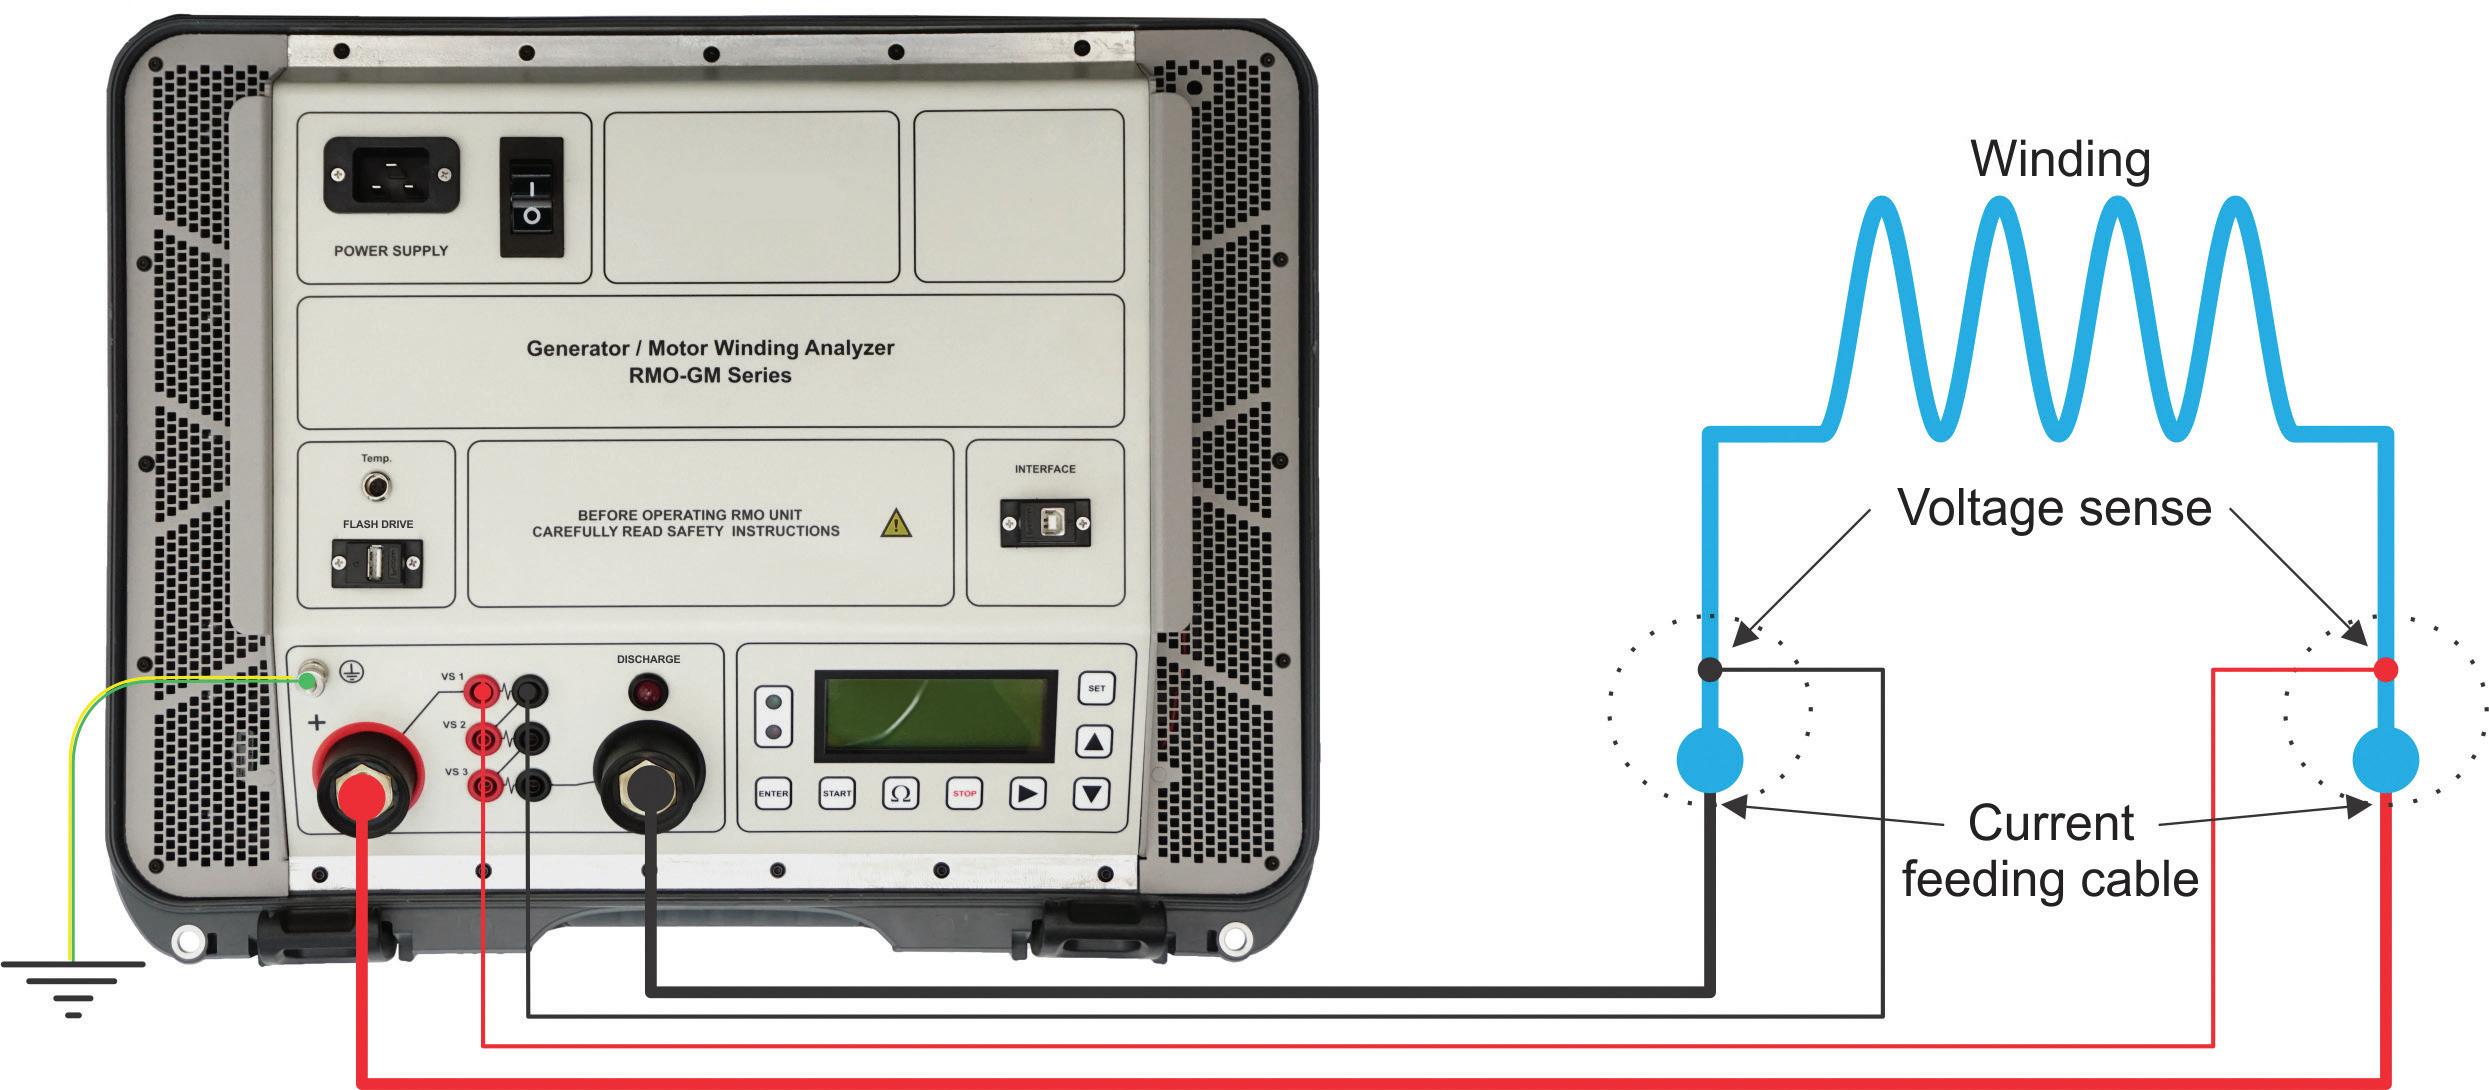
inductance L and capacitance C in addition to resistance R. This means the reach of the test current should be slightly longer than in the case of a purely resistive shunt. At the beginning of the measurement, it is common to see a slightly different resistance value than expected, but this will stabilize on the expected value after a certain period defined by the time constant of the RLC circuit.
When the test is finished, some of the inductive or capacitive energy remains in the circuit. The test device must have a safe discharging circuit capable of discharging remaining energy after the winding resistance test has been completed.
Four-Wire Testing Method
The winding resistance test is usually performed by using a four-wire measurement approach. This enables the most reliable test results and minimizes the influence of the test setup because it ensures that the resistance of the connecting current cables is not included in the measurement.
The test current is passed through the windings using high-current cables. The voltage drop across the windings is measured using sensing cables. The placing of the cables is very important. The current cables should always be placed outside of the sensing cables. That way, the resistance of cables and clamps is
almost completely excluded from the resistance measurement (Figure 1).
Resistance Temperature Compensation
Generator windings are made from materials (usually Cu) whose resistance is dependent on temperature. Since the winding resistance test is a comparative method, the resistance values must be temperature corrected to a reference temperature to compare the results. Resistance correction for temperature is performed according to the following equation from IEEE Std. 112-2017[3]:
Where:
Ra is the measured winding resistance value at temperature ta ta is the temperature in ˚C of winding when the resistance Ra was measured tb is the reference temperature for resistance compensation Rb is the measured winding resistance value corrected to the temperature tb k1 is the specific temperature coefficient for the winding material (e.g., 234.5 for copper or 225 for aluminum)
The test device’s temperature channel enables the temperature value to be measured whenever
Figure 1: Connecting RMO-M to a Test Object[2]
the resistance value is recorded. Additional temperature sensors can be used to increase temperature measurement accuracy. The average temperature of all measured sensors should be used when the resistance was the measured winding temperature at the moment of the resistance measurement. This is to compensate for the resistance value to a reference temperature.
NEW TESTING APPROACH
The proposed testing method’s main goal is to detect small contact irregularities in the windings of large generators with high
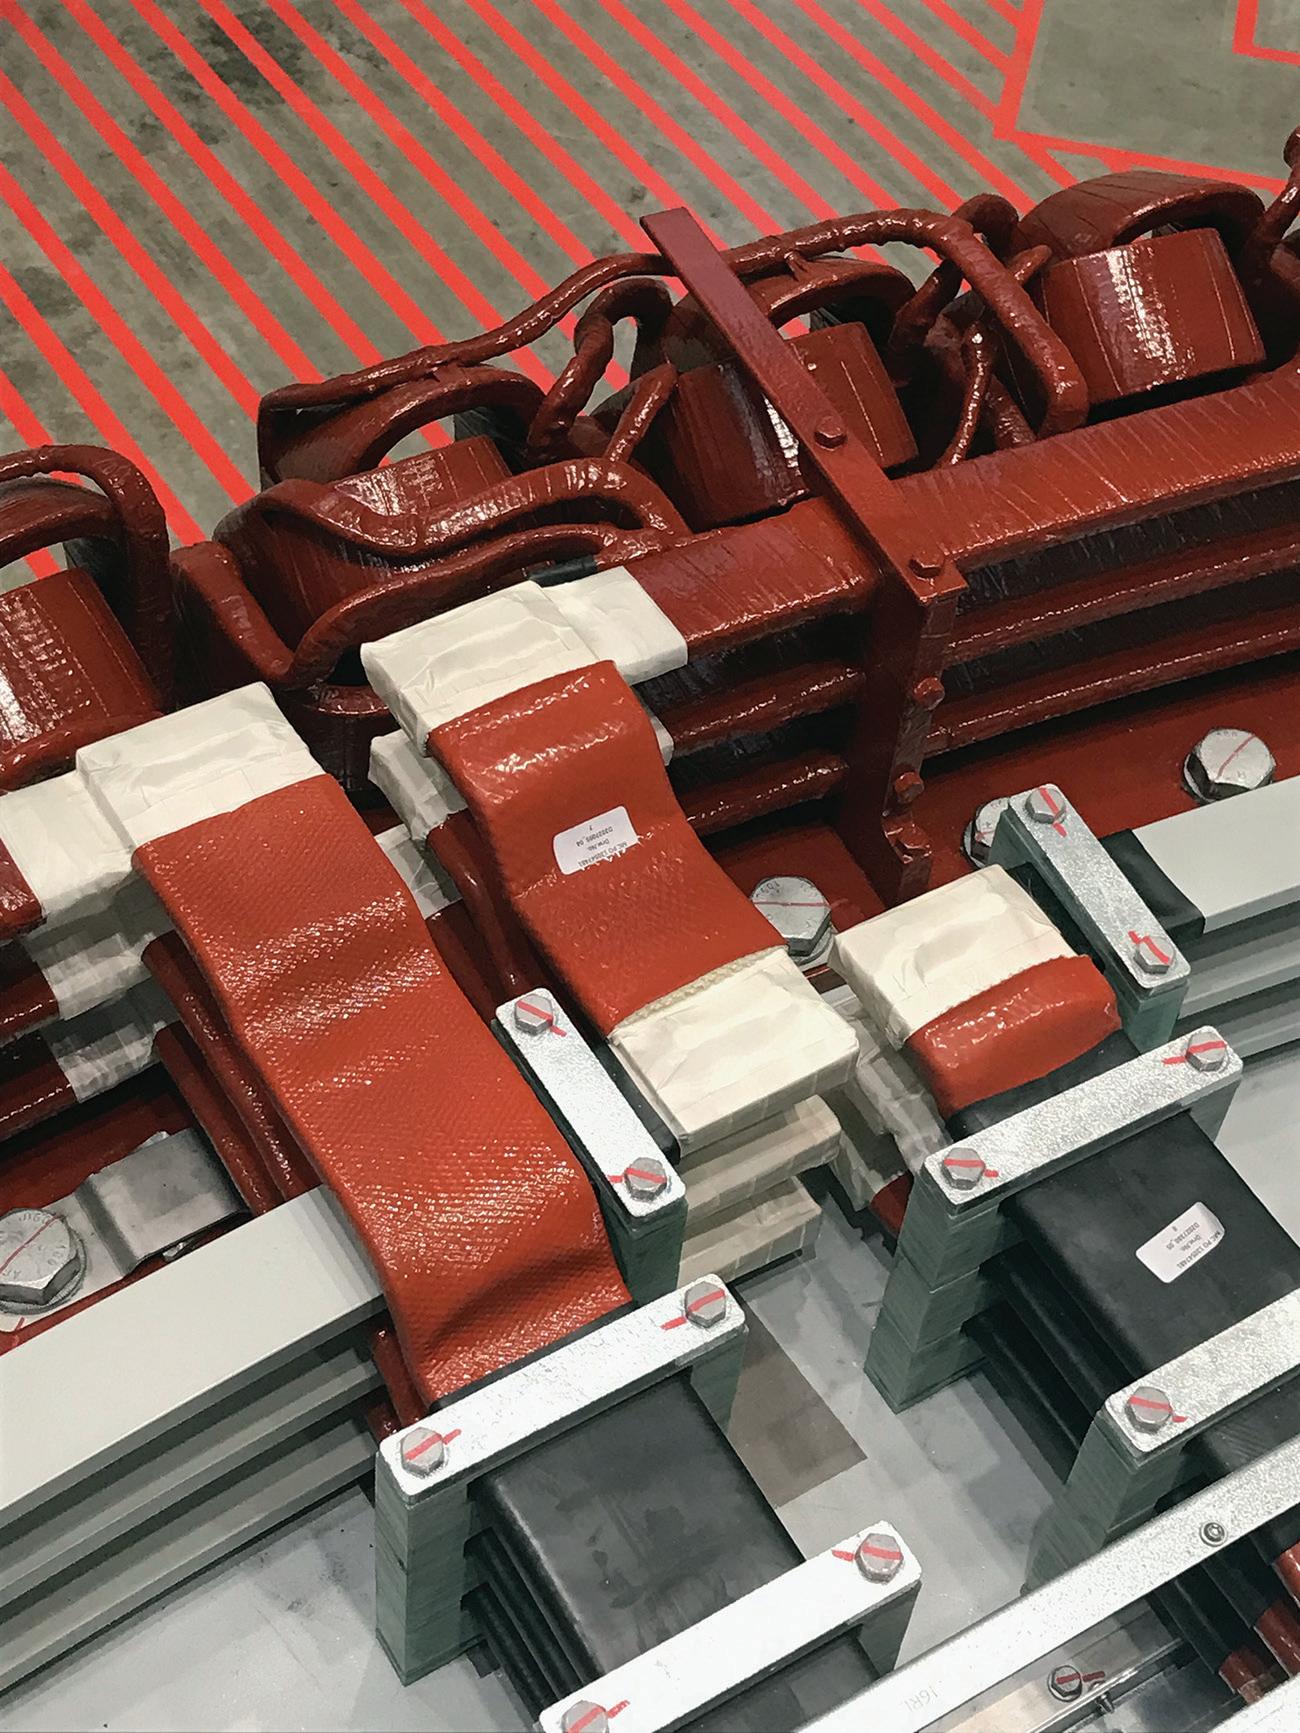
Joints and connections inside the generator could present weak points affected by mechanical stress and manufacturing imperfections. The test method should detect whether any abnormality exists in those connections.
nominal current where even a small irregularity in windings, connections, or joints has the potential to create a huge problem. Any contact irregularity will increase resistance.
Power losses through heating are proportional to the square of the current ( P = RI² ). In the case of generators with high nominal current, even small changes in resistance will create significant heating concentrated at that point. To get a better feeling for a potential issue, 10 microOhms of increased resistance with a nominal current of 8,000 A results in additional heating of 640 W at that point.
The new test could have a huge benefit in the factory to verify that everything is connected properly before transporting the generator to the customer site. It would also be useful to perform this test during commissioning to determine whether transportation and installation have caused any connection issues.
The method to detect changes is to inject a high current through generator windings — high enough to initiate heating on weak points. The initiated heating should influence resistance, which can be detected by measuring the device while continuously recording resistance values. It is also important for the test current to flow continually for a certain period. During that measuring period, the winding resistance will be recorded periodically (e.g., every second). Based on numerous experimental tests on large wind turbine generators, a test duration of 60 seconds and a sampling time of 1 second are proposed.
The test device should be powerful enough to run a high test current through the generator windings for a longer period. The electrical circuit contains cable resistance and winding resistance. The test device (Figure 2), specially designed for this application, can provide a test current of 300 A DC for a period of 600 seconds (a lower test current can run for an unlimited time) and can measure the winding resistance of the majority of large generators with a winding resistance up to approximately 30 mOhms.
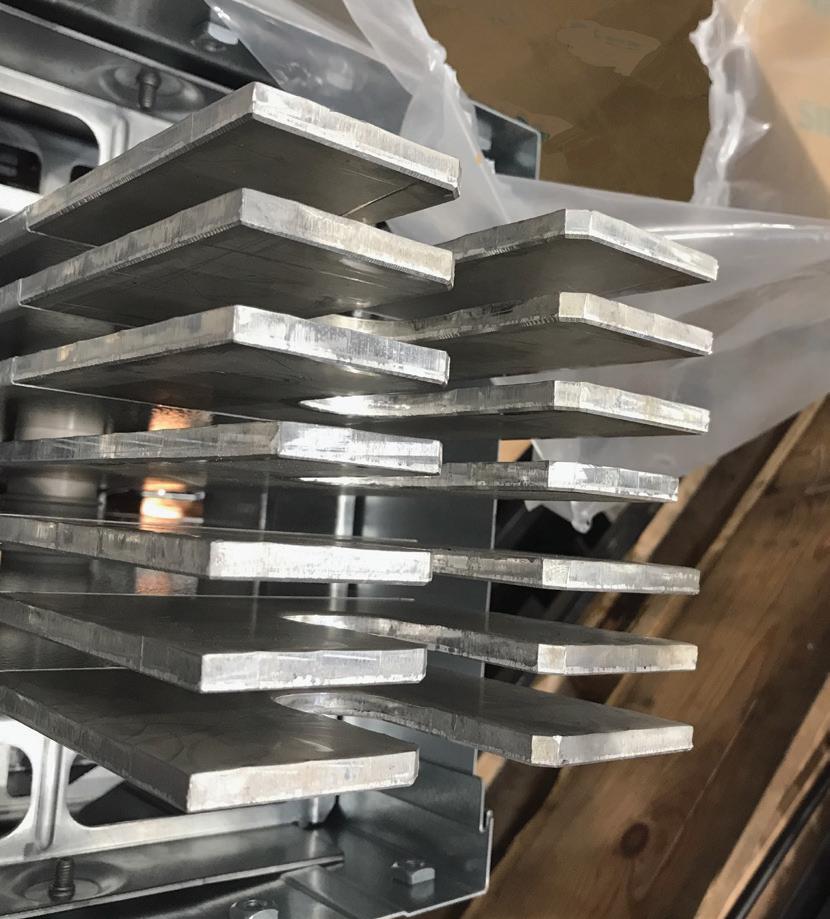

Since the goal is to detect even small changes in resistance (range of µΩ-s), the test device should have high accuracy. The device used for this test has a typical accuracy of ± (0.1% rdg + 0.1% FS) and resolution of 0.1 µΩ for the range 0 µΩ–999.9 µΩ and 1 µΩ for the range 1,000 mΩ–9.999 mΩ, where rdg is reading and FS is full-scale value. IEEE Std. 1122017 requires the test device to have a valid calibration certificate within 12 months and minimum accuracy of ±0.2% of the full scale.
When inspecting test results, winding resistance and behavior resistance in the test period should be analyzed (Figure 3). Based on experimental tests, it was concluded that 60 seconds is enough time to catch the stable value of the resistance. This period is also long enough to show the change in resistance if some irregularity is presented.
If unexpected resistance value and resistance behavior during the measurement period is detected and confirmed, additional testing and inspection should be performed. This includes visual inspection of each connection and joint in the windings and measuring connection resistance directly on the connections using a high test current of 300 A DC. A good connection between connections and test leads must be confirmed.
TEST RESULT INTERPRETATION AND ANALYSIS
When the winding resistance test is performed, the test results should generally be compared with the reference results between different phases or with the sister unit. A variation indicates a potential connection problem or winding damage. In some testing methods, it is important to focus not only on the value of the behavior of test results but also on a predefined period.
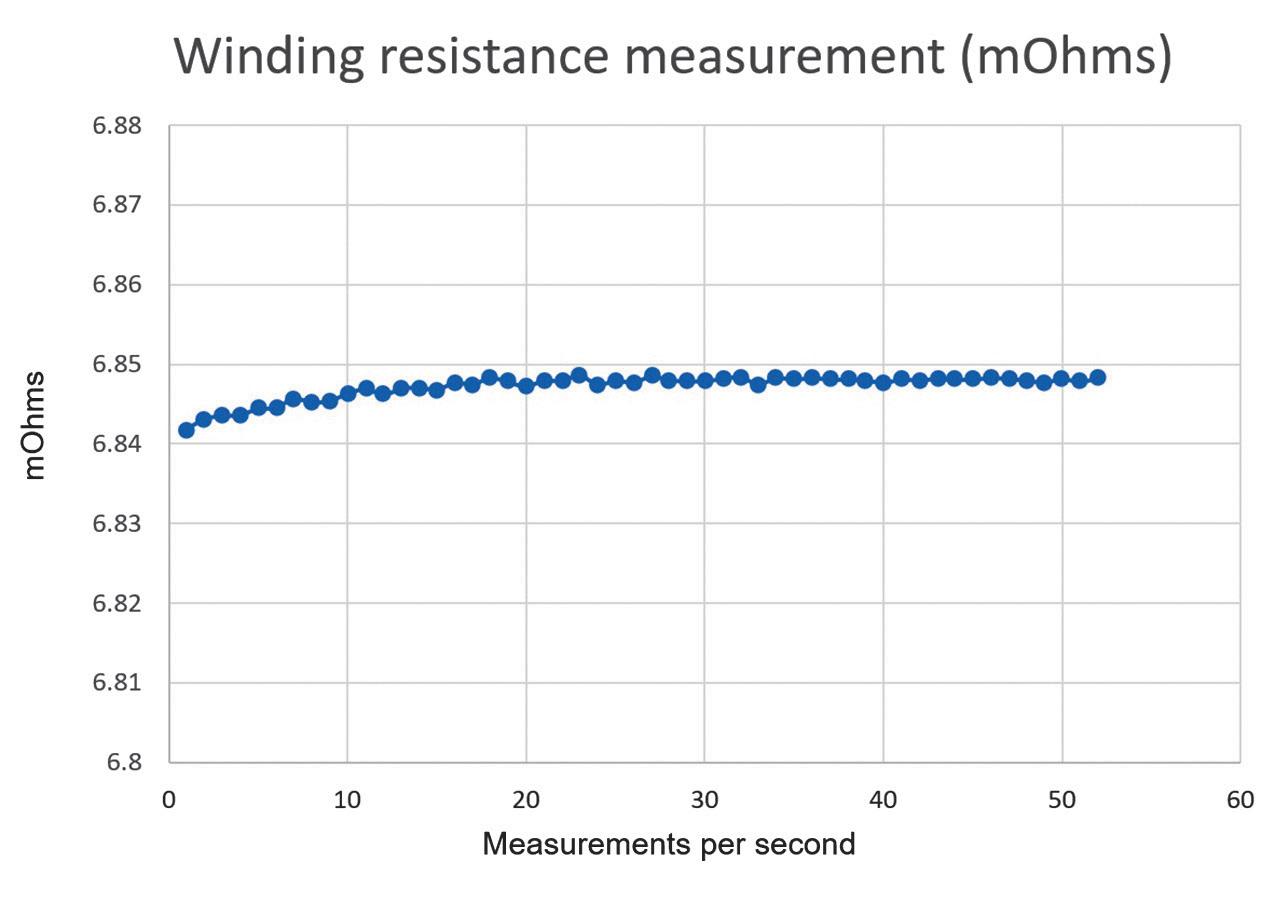
3: Typical Winding Resistance Measurement Graph Records Each Second in the 60-Second Period
Figure 2: Typical Terminal Connections to Generator Windings (2-Winding Systems) and Proposed 600 A Current Test Clamps Suitable for Application
Figure
CASE STUDY
The tested generator is a wind turbine direct-drive generator with permanent magnets. The continuous nominal power is 11 MW. The generator has two systems, each with 3 phases, connected to a converter. The converters control the generator and the grid feed (usually it is between 20 kV and 66 kV).
Because of the high nominal current, the tested generator’s two cable systems must be tested separately. Test results between the three phases for both systems are presented in Figure 4 through Figure 9.
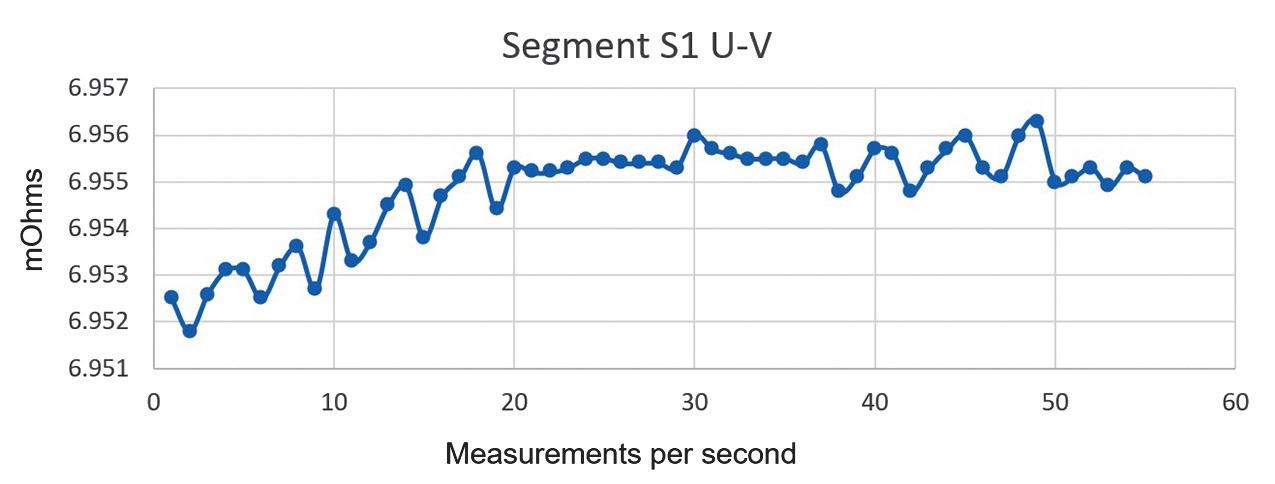
Figure 4: Generator Winding Resistance Measurement System 1 Phase U-V
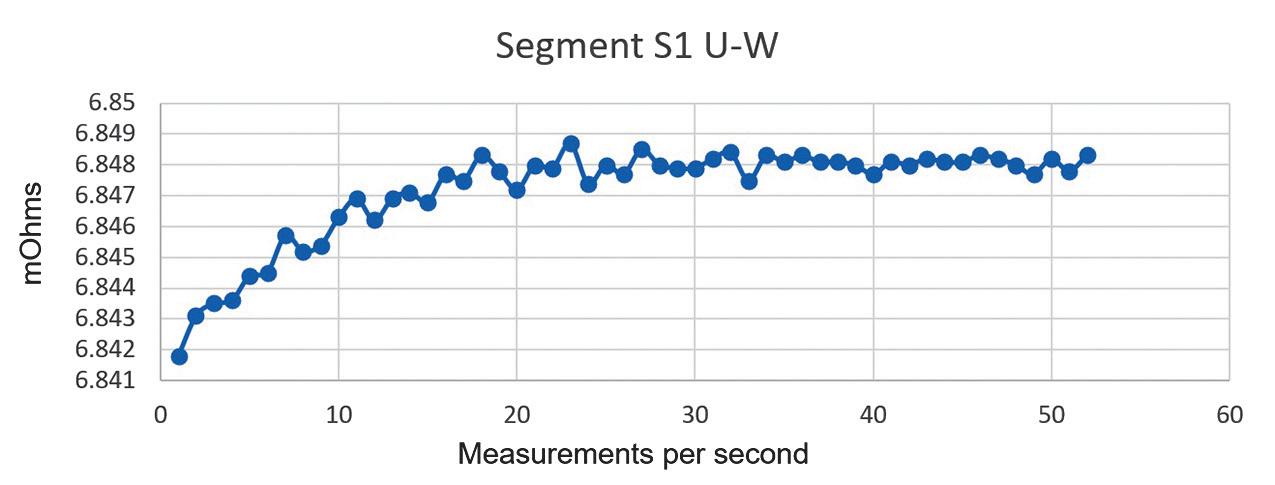
Figure 6: Generator Winding Resistance Measurement System 1 Phase U-W
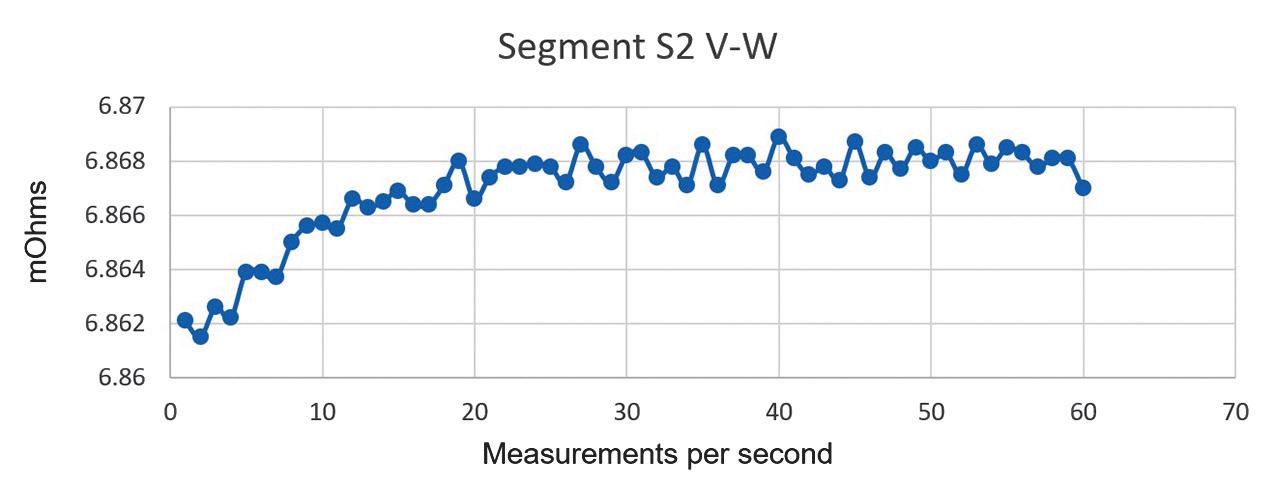
Figure 8: Generator Winding Resistance Measurement System 2 Phase V-W
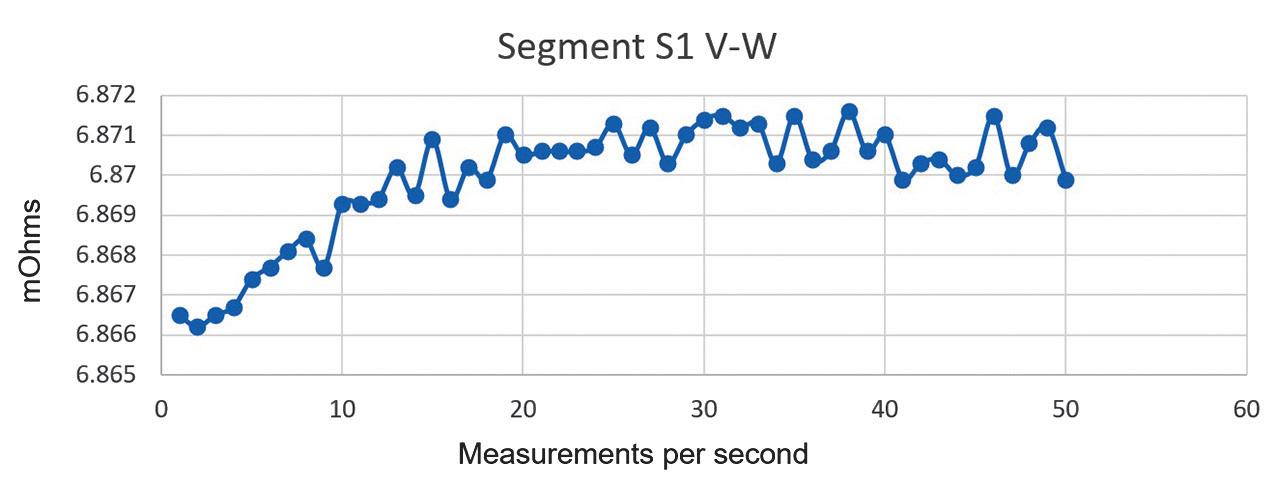
Figure 5: Generator Winding Resistance Measurement System 1 Phase V-W
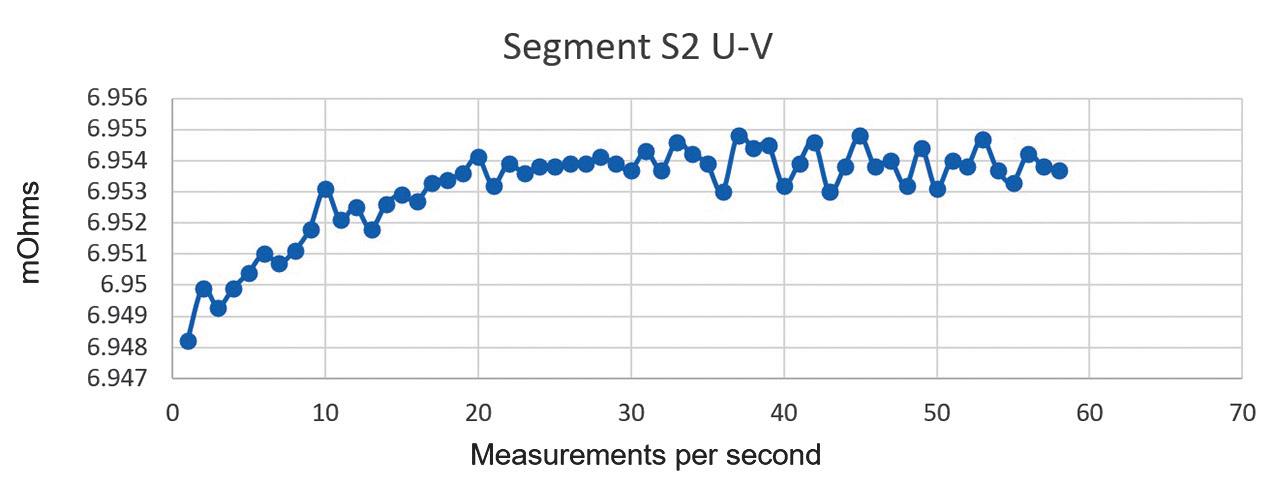
Figure 7: Generator Winding Resistance Measurement System 2 Phase U-V
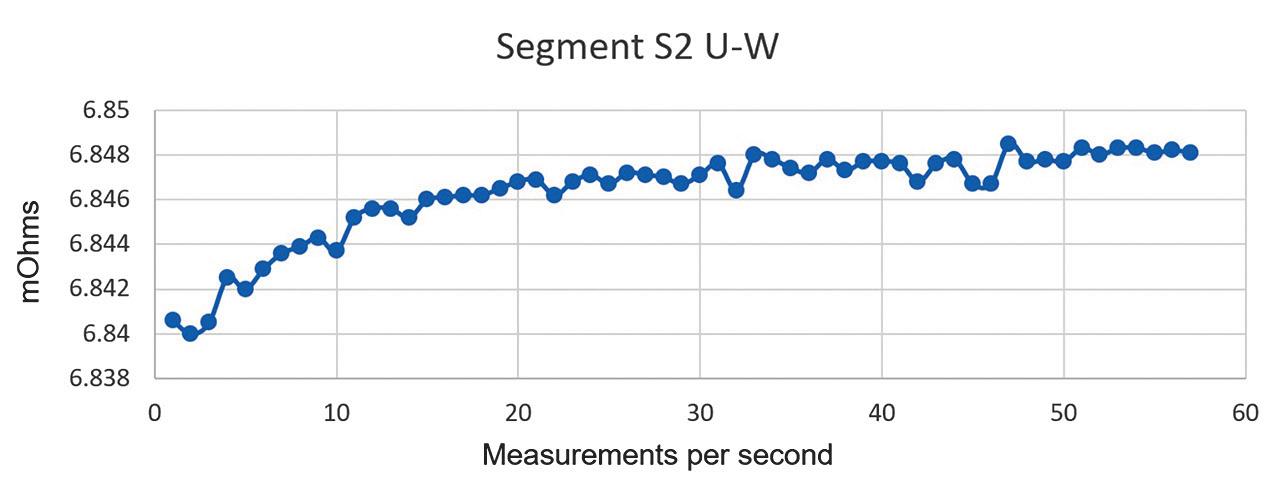
Figure 9: Generator Winding Resistance Measurement System 2 Phase U-W
Figure 10 shows the typical winding resistance graph for the tested wind turbine generators.
Note: The graph is zoomed in, and the total resistance change is quite small — approximately 6 µΩ. However, two zones can be detected on the graph:
• The first zone is the stabilization process. In this case (big generator with a permanent magnet instead of the rotor windings), the dominant component is capacitance, not inductance. The generator has high capacitance, which charges over time and causes the stabilization process defined by
the time constant RC. High cross-section windings with a lot of insulating materials and large surface connections all cause high capacitance between components and components to ground.
• The second zone is where the dominant component in the circuit is resistance R, which is the focus of interest. Changes in resistance value in this graph are most likely caused by heating. Small changes between samples (0.5 µΩ) are not of interest, as they are caused by the imperfection of the real test device. We are interested in the tendency for the resistance value to change if the slope of the graph in the second zone increases.
An example of changing resistance caused by heating is presented in Figure 11. The trend of changing (increasing) resistance is noticeable even in the second part of the graph.
CONCLUSION
Understanding how large and expensive problems can appear in the case of a generator or motor failure will determine the various inspection and maintenance strategies. For example, the reliability of generators used in power generation is crucial, so the maintenance strategy is quite strict and is continuously being improved by using new testing methods and online monitoring.
The proposed test method provides benefits in various stages of a generator’s lifecycle. The method can be used to verify the manufacturing process and eliminate possible manufacturing imperfections. The test will provide information about the winding resistance value as well as the tendency for the value to change. Questionable results could initiate an additional inspection of all connections and joints in the generator windings.
The test can be useful during commissioning testing to verify whether transporting the generator caused any damage to the joints and connections of the winding. Since the wind turbine generator operates in a demanding
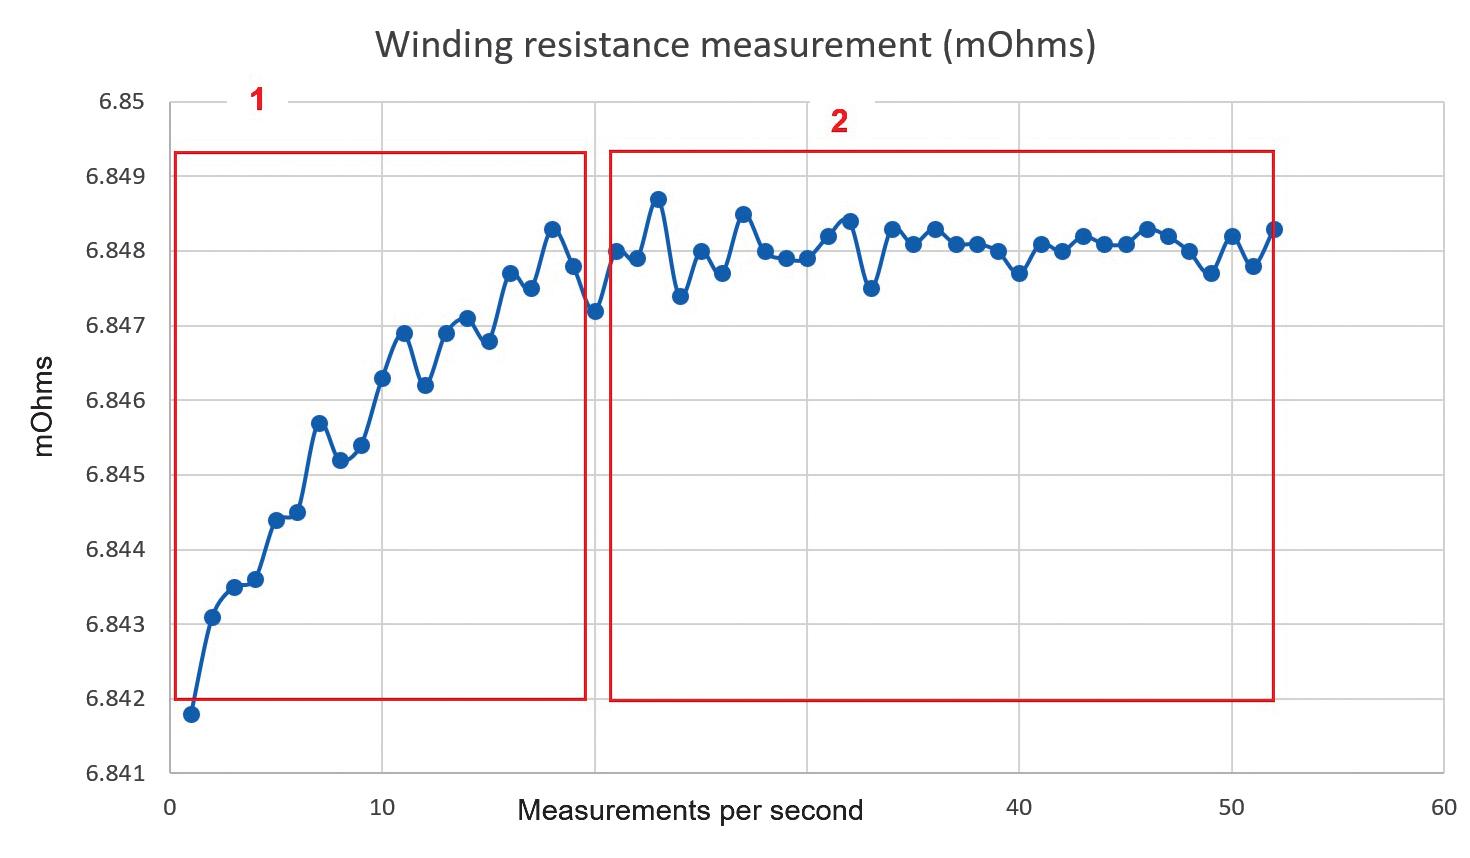
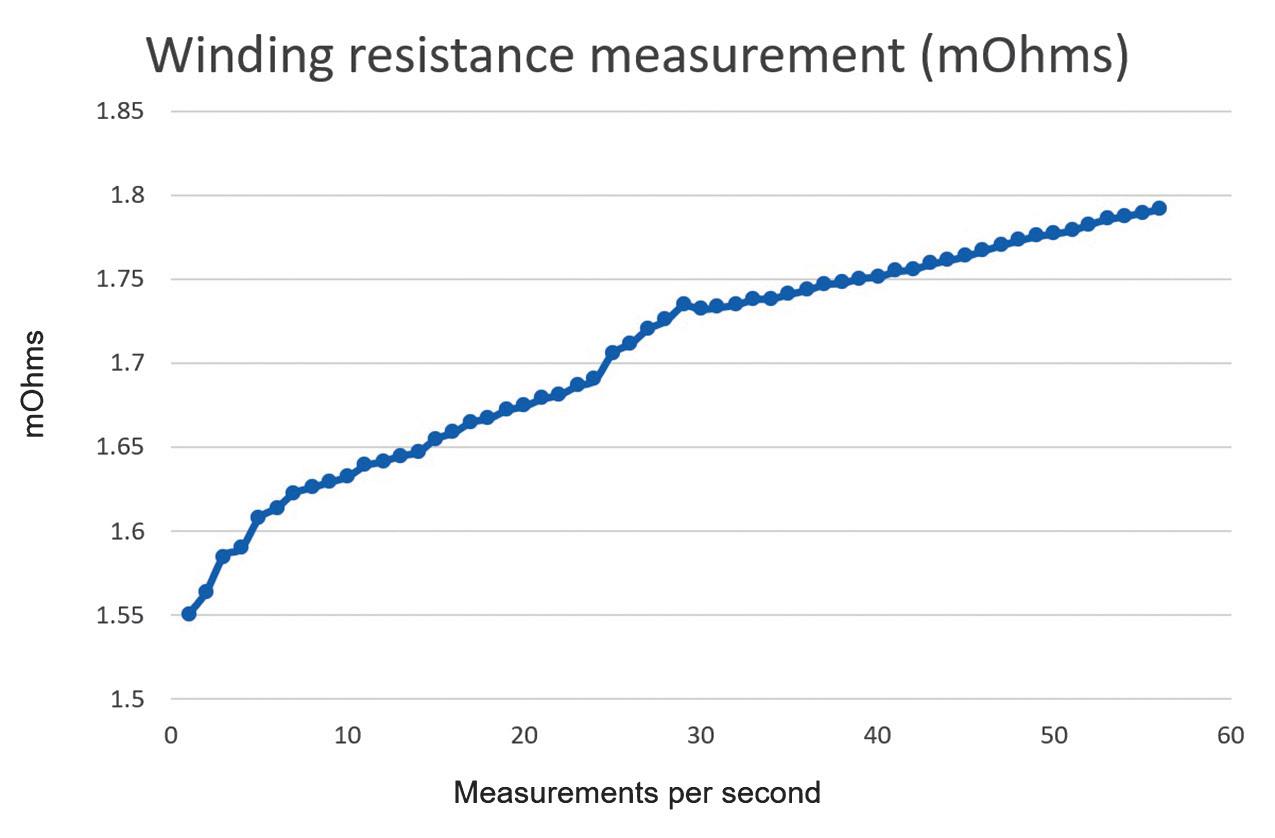
environment due to weather, vibration, mechanical stress, etc., it could be useful to periodically perform the routine procedure.
Since the method is new, failures and experiences collected over time could bring some modifications to the method. One potential improvement is to use a higher test current. Higher test current has the potential to generate more heating in weak points of generator windings that would cause changes in resistance. However, the nominal generator current should be considered as well, and the test current should not be too high; otherwise, it can heat a complete winding and increase
Figure 11: Changing Resistance Caused by Heating
Figure 10: Winding Resistance Graph for Wind Turbine Generators
resistance. This would require a more complex analysis. For operators who follow ANSI/IEEE standards, the maximum test current should not be higher than 15% of the nominal current. For those who follow IEC, the maximum test current should be 10% of the nominal current.
REFERENCES
[1] Dvorak, Paul. “Why Wind Generators Die Young and How to Make Them Work Longer.” Windpower Engineering. Accessed at www.windpowerengineering.com/whywind-generators-die-young-and-how-tomake-them-work-longer/
[2] DV Power. DV Power Manual RMOGM — M-RXX0MN-307-E. May 2019. Accessed at www.dv-power.com/download/ rmo-a-series-user-manual/.
[3] IEEE Std. 112-2017, IEEE Standard Test Procedure for Polyphase Induction Motors and Generators.
[4] IEEE Std. 43-2013, IEEE Recommended Practice for Testing Insulation Resistance of Electric Machinery
[5] IEEE 1415-2006, IEEE Guide for Induction Machinery Maintenance Testing and Failure Analysis.

Edis Osmanbasic is an Application and Testing Specialist at DV Power, Sweden. His work involves the analysis and development of test methods for condition assessment of transformers, OLTCs, and generators. He is responsible for DV Power transformer test equipment field application and diagnostics of transformer test results and is also involved in defining and proposing the maintenance strategy for the HV equipment. Edis has published numerous papers on DRM methodology and transformer testing methods. He holds an MS in electrical engineering from the University of Sarajevo.

Normen Kaemena is an Electrical Engineer for test benches and production support at Siemens Gamesa Renewable Energy GmbH. He is responsible for testing methods, laboratory test development, production support, and production process optimization. He is also involved in creating maintenance plans and maintenance strategies. He specializes in partial discharge measurement.





PREDICTIVE MOTOR MAINTENANCE: STATIC, DYNAMIC, AND ON-LINE TESTING

BY DREW NORMAN, Megger Baker Instruments
This article reviews current electrical testing methods and trends in the operational health of electric motors in the context of successful predictive maintenance programs. It explains the concepts of static motor testing — testing a motor that is not running — as well as dynamic motor monitoring, which involves analyzing motors while they are in service or operating within their application environment.
It also introduces an emerging type of online dynamic monitoring involving a permanently installed networked motor analyser that enables maintenance professionals to monitor motor system conditions from any web-accessible computer. The benefits and features of various types of test equipment and motor testing methodologies with regard to conditions that can impact the health of a motor but can be external to the motor itself are discussed.
PREDICTIVE MAINTENANCE
Predictive maintenance programs are crucial to an organization’s ability to avert unplanned or
unnecessary downtime that can adversely affect a company’s ability to produce or operate. Unlike time-based or run-to-failure approaches to maintenance management, condition-based programs are ideally geared to pay for the cost of implementation by extending the service life of motors and rotating equipment, averting costly unplanned downtime, and minimizing the costs of replacing expensive equipment. Predictive maintenance programs are most effective when all available means to measure health and analyze health trends of electric motors, cables, power quality, and load are rigorously implemented.
Safe and continuous operation of plants and facilities drives revenue and profit, and it depends upon high motor reliability. Predictive maintenance of motor systems is a necessity when it comes to supporting reliability objectives that in turn support a company’s or organization’s business objectives. The power generation industry ranks at the top of this requirement for uninterrupted operation and safe, continuous production.
Some motors run equipment that is ancillary to the production or health of a company (for example, a rooftop motor for an HVAC system that doesn’t have an immediate impact on the HVAC system if it stops working). Other motors are critical to a company’s ability to conduct business: They are motors that drive such things as conveyor systems, fluid pumps, or production-line machinery that a company relies upon to generate revenue and profit.
The goal of a predictive maintenance program is almost always to reduce unscheduled downtime. An effective predictive maintenance program is measured by how well it works to predict imminent failures and identify potential problem areas before they fail and create expensive recovery costs for an organization. The program should also work to determine the root causes of failures and ultimately save money by extending the service life of motors and rotating equipment. This is why electrical testing of motors is such a critical component of predictive maintenance. Static and dynamic analysis, along with trend data acquisition and analysis, provides the information technicians need to make good decisions regarding the use or maintenance of a given motor.
Motor Systems
Motors, whether used to drive conveyors, pumps, cooling fans, or any other machinery, are best viewed as core parts of a system. These are often referred to as motor systems or sometimes machine systems and include the motor, the source of the motor’s power, and the equipment or machinery driven by the motor (Figure 1).
Electric motor test equipment today is generally categorized into two types: static motor test equipment and dynamic motor test equipment. The static motor test is capable of simulating real-world situations when motors are off-line. Dynamic motor test equipment is used to safely acquire accurate and valuable health data across a working motor system or a motor’s in-service environment.
Static Motor Testing
Static motor test data provides visibility into the integrity and condition of a motor’s insulation and motor circuit. Modern equipment can help maintenance technicians predict or identify imminent failures before they cause costly unplanned downtime of motors and the rotating machinery they support. The most effective static test equipment is capable of testing the components of motors at voltage levels similar to those the motor will see in its normal operation without destructive currents.
Static testing should include the surge test, which is the most effective method to ensure the integrity of a motor’s turn-to-turn insulation. The best static motor analyzers produce trend logs and reports that allow technicians to track any decline or degradation of a given motor’s health.

Figure 1: Typical Motor or Machine System Consisting of Power Supply, Motor, and Load
Dynamic Motor Testing
The latest dynamic test equipment can locate and identify problems that adversely impact motor health and motor life that are on either side of the motor within the motor system. These are generally power-related issues and load problems but can include vibration or circuit condition problems within a motor while the motor is in service.
Dynamic motor analyzers can calculate speed and torque, define rotor bar problems, and measure distortion. Dynamic motor testing can also identify mechanical issues such as bearing problems or motor shaft misalignment. Dynamic testing helps isolate mechanical (system) issues from electrical (internal to the motor) issues while providing valuable information to discern the root causes of motor failures.
Off-Line Testing
Static testing (off-line testing of motors in their static, powered-down state) is commonly performed just once in a given period of months, usually up to a year or more. It’s also performed opportunistically during outages when a motor is shut down for other reasons.
Off-line testing is often used as a quality assurance measure when receiving new, reconditioned, or rewound motors from a supplier or motor shop. This is to assure they work as expected before they are stored or returned to service. Testing these motors proves the motor shop is doing its job properly and creates new baselines for future trend analysis.
TEST EQUIPMENT
Static motor test equipment can troubleshoot motor problems or failures. Any time a problem occurs, the motor involved should first be tested for insulation integrity. Out-of-spec voltages, motor loads, and contaminants are examples of problems that can adversely impact a motor’s internal insulation. Typical static tests include winding resistance, insulation resistance (IR), polarization index (PI), DC step voltage, and surge testing. These tests should be performed in that sequence with modern, state-of-the-art test equipment. Surge-test analyzers can reproduce
real-world experiences without causing damage to a motor’s insulation system and underscore the importance of testing motors at the voltage levels and conditions a motor experiences in normal, everyday operation.
Winding resistance tests confirm that a motor’s phases are balanced; they detect shorts and opens in the motor’s windings as well as high, out-of-spec resistance connections. A static insulation resistance test can determine whether the motor’s windings are grounded or contaminated. The IR meter is probably the most-used test instrument in the field but it has its limitations. IR testing is usually performed at voltages slightly above line voltage.
It is important to note that an insulation resistance test can determine if a motor is bad, but it cannot confirm the motor is good. Low results are an indication of impending failure, but high values do not ensure that a motor is free of other faults. A polarization index (PI) test can also confirm poor/degraded insulation within a motor, but while it can indicate when a motor’s insulation is old and brittle, it does not find potential turn-to-turn faults.
A DC step-voltage test involves exposing the entire winding to voltage equal to that commonly seen at start-up or shut-down. It looks for weak ground-wall insulation. Weak or damaged cable problems can also show up during this test, and it may be necessary to separate the motor at its junction box in order to determine the root cause of the problem. DC step-voltage testing is commonly performed at double the line voltage plus an additional 1,000 volts but has no adverse impact on the motor or motor insulation when properly applied.[1]
Lastly, once a motor has passed all the other tests, a surge test should be applied. Surge testing is the only way to locate weak turn-to-turn insulation. These copper-to-copper faults are the primary cause of more than 80% of all winding-related failures, and they would go undetected if not for the surge test. Most motors, when allowed to run to failure, will blow to ground in a slot. That is because a slot provides a ready path to steel, but most such shorts will have started as a copper-
to-copper/turn-to-turn fault.[²] Locating weak insulation areas before they become hard-welded faults allows a maintenance professional time to plan for repairs before a catastrophic failure causes unscheduled downtime, expensive repairs, and lost production. Once these turn-to-turn faults have become hard-welded faults, a motor typically only has about 15 more minutes of service life.
On-line (dynamic) monitoring
Dynamic or on-line monitoring is performed while the motor is powered on and working within its normal system or application. Data collection using dynamic motor testers is safe, fast, and nonintrusive. Dynamic testing provides information regarding power quality and conditions such as voltage levels, unbalances, and distortion. A small amount of voltage unbalance coupled with minor harmonic voltage distortion may result in a NEMA (National Electrical Manufacturers Association) de-rating that will not be seen with simple multimeters and amp probes. Current levels and current unbalances also

affect motor performance, so monitoring them is essential when trending motor health.
Dynamic testing can and should be performed more often than off-line testing at a frequency similar to vibration analysis. The concept is relatively new compared to static testing, but it has rapidly emerged as a common, standard condition monitoring approach.
In addition to monitoring electrical issues, data collected using dynamic testing technology can discern mechanical issues. A good dynamic analyzer provides relevant condition information about all three motor/ machine system components: power source, load source, and the motor itself. Monitoring conditions such as voltage levels, unbalances, and distortion that affect motor performance is essential for analyzing motor health trend data.
Many motor problems are created by adverse or mismatched loads or by poor supply power.
Experts in Electrical Reliability.
Whether you need startup services, ongoing maintenance, or emergency response, you need a partner you can rely on.
Trust High Voltage Maintenance (HVM) and our team of NETA-certified technicians to deliver a unique combination of engineering expertise, industry application knowledge, and implementation capabilities.
To learn more, visit HVMcorp.com or call 866-HVM-TEAM
HVM’s Electrical Power System Life-Cycle Services: Acceptance Testing and Maintenance | Battery Maintenance Protection and Control | Electrical Engineering | Compliance Services
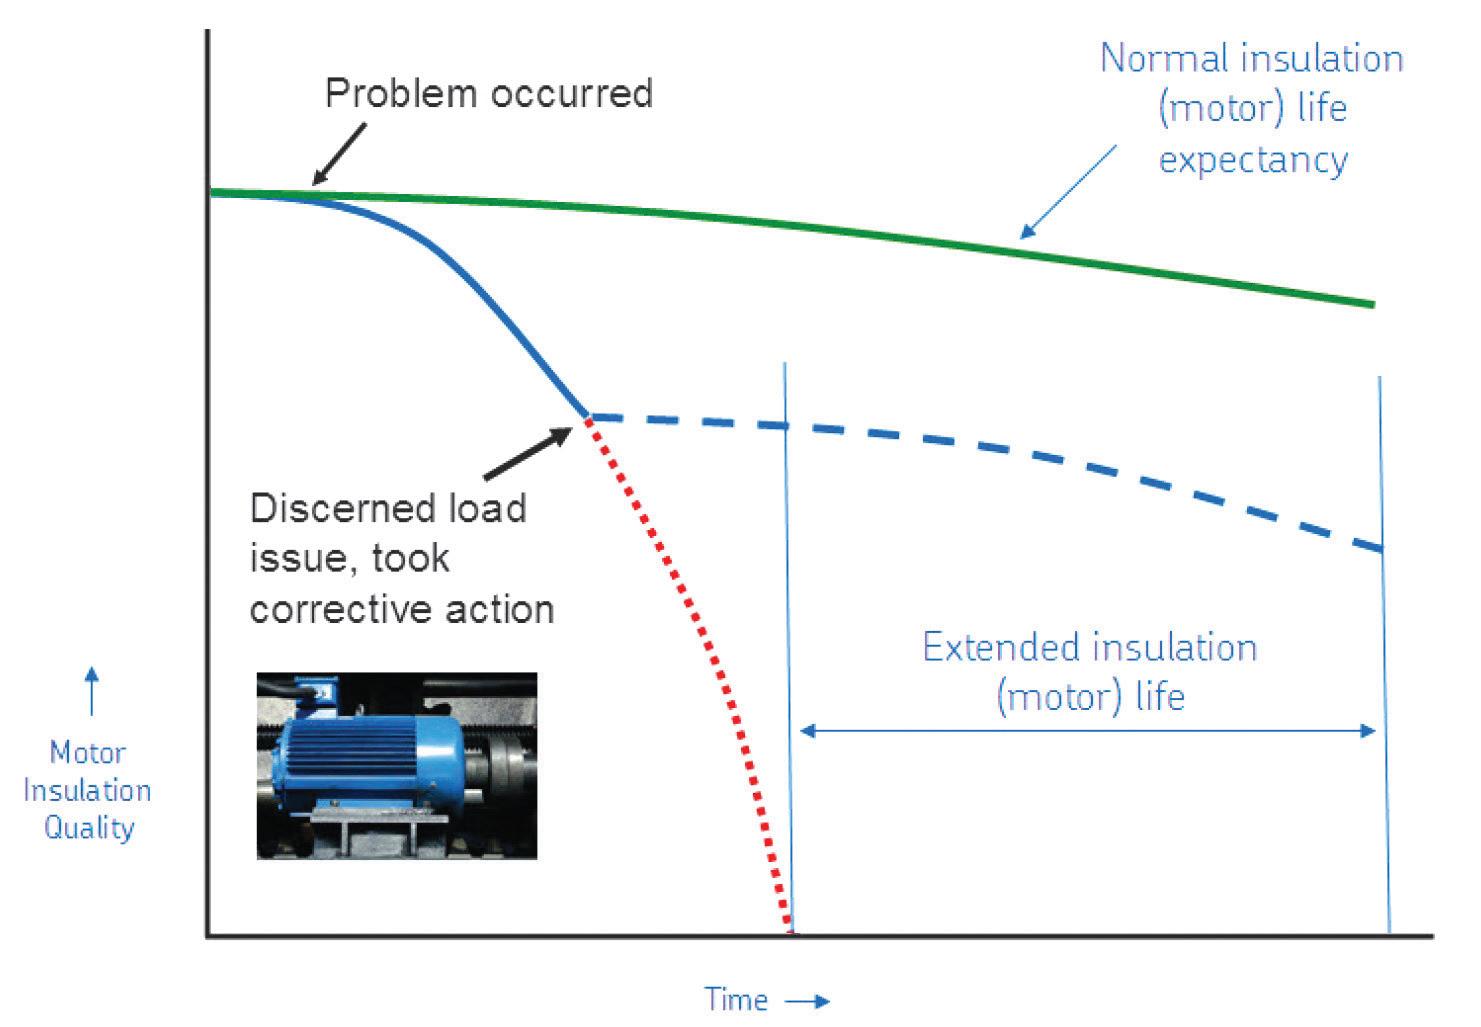
Torque and current spectra have proven to be highly useful in determining mechanical issues, including bearing faults, looseness (vibration or misalignment), and eccentricity.
Without a way to analyze data from monitoring across a motor system, the true root cause of motor failure often goes undetected. The ability to acquire and define such adverse impacts as torque anomalies provides the means to separate mechanical issues from electrical issues, improve decision-making concerning repair or replacement, and otherwise extend the service life of the motor (Figure 2).
Another challenge with electric motors is tracking rotor condition. Today’s dynamic motor analyzers help predict rotor bar failures or potential failures if the load is relatively steady. A pump, fan, or blower operating at a steady frequency will show very clear rotor bar signatures that make rotor fault diagnoses easier than ever before. During normal operation, a motor’s rotor is stressed by its load. Torque waveform analysis provides a picture of those stresses, and when they reach levels out of spec for the motor, they can indicate a number of mechanical problems. Cavitations and belt flapping, for example, are easily seen in a torque waveform signature. Motor analyzer manufacturers continue to improve on the ability of test equipment to discern mechanical motor system issues earlier and with greater accuracy.
STATIC AND DYNAMIC TESTERS
Nearly all modern static and dynamic testers are portable. Static testers can be used in a shop or easily carried into the field. Dynamic testers are by nature used in the field (wherever running motors are located) but often test via a motorcontrol center (MCC). However, emerging new technology has spawned a dynamic motor analysis tool that is permanently installed in proximity to the locations of up to 32 motors via motor busses within MCCs. The concept is to perform all of the same tests a portable dynamic motor tester does, but with the additional benefits of continuous monitoring and the ability to view the status of a given motor from a central office location — anywhere in the world with a PC and a good Internet connection.
This new technology enables maintenance professionals to make better decisions faster than the spot-testing method of testing characterized by route-running once every few months to yearly. It captures information that can’t otherwise be captured in a single testing session performed with a portable tester. Alerts can be set to flag maintenance professionals to the need to investigate and/or replace critical motors. Moreover, the trend data from months of monitoring provides valuable insight that informs predictive maintenance planning and helps prioritize resources and actions. Finally, because the monitoring is effectively performed remotely, online dynamic analyzers all but eliminate safety hazards associated with testing in-service motors in the field.
Dynamic monitoring also provides efficiency information that allows maintenance professionals to make wise and practical decisions when confronted with choices to repair or replace a given motor. Improving efficiency by just 2% can result in thousands of dollars in excessive annual energy costs.
CONCLUSION
Static and dynamic testing of electric motors is critical for successful implementation of predictive maintenance programs. Static testing is the most effective means of measuring the integrity of the motor’s insulation system, and it also can be used for quality assurance when a motor is out of service.
Figure 2: Extending Motor Life with PdM Testing
Dynamic testing provides valuable information about motor systems, including power condition, load, and the motor, including physical aspects that can affect the life or operation of the motor. Online motor monitoring adds the dimension of gathering motor system health data at regular intervals throughout the day, 365 days a year. Combined, the data presents a comprehensive picture of motor and motor system health that can be the foundation for a successful predictive maintenance program. Because it provides the full spectrum of motor condition information
Conference and Electrical Manufacturing and Coil Winding Conference (Cat. No.01CH37264), 2001, pp. 323-326, doi: 10.1109/EEIC.2001.965645.
[2] R.M. Tallam, T.G. Habetler, R.G. Harley. “Transient Model for Induction Machines with Stator Winding Turn Faults.” IEEE Transactions on Industry Applications, Vol. 38, No. 3, May/June 2002.

Drew Norman has worked as an Applications Support Engineer and product training lead at Megger Baker Instruments

February 26 – March 1, 2024 | Monday – Friday
Hilton Anatole | Dallas, Texas

Exhibit to an audience of 500+ electrical testing professionals including leading decision-makers looking for new products and services.

STAYING CURRENT WITH NERC REGULATIONS
BY CASEY WHITT, Shermco Industries, and MAYSAM RADVAR, Power Systems Engineer
In the upcoming years, changes to the existing NERC standards and approved models will be proposed. These changes will impact the synchronous generator (SG) compliance approach and representation. This article outlines proposed changes relevant to generator owners and the impacts on compliance efforts for two such standards: MOD-025 and PRC-019. We also briefly discuss the newly proposed generator model, GENQEC, which is now accepted by NERC as well as the Western Electricity Coordinating Council (WECC), and provide references for more information about these changes are provided.
MOD-025
NERC Project 2021-01 includes two standard authorization requests (SARs). The first SAR proposed modifications to MOD-025-2, the active version of the MOD-025 standard. As it stands, MOD-025 requires testing to be performed every 5 years to verify the real and reactive capabilities of generating units. Verification must also be performed if a change is made to the unit that will impact its capabilities. This testing includes reaching the leading and lagging reactive capabilities at both minimum and maximum active power. The main objective of this standard is to provide transmission planners with confirmation that units can reach expected power limits, ideally by hitting the over-excitation limiter (OEL) or under-excitation limiter (UEL), if used.
The issue with this testing is that the results are mainly dependent on grid conditions at the time testing is performed. For example, if the grid is operating at a higher voltage level, the generating unit will not be able to export as much lagging reactive power before reaching a high-voltage limit as in a low grid-voltage condition. Conversely, if the grid is operating at a lower voltage level, the generating unit will not be capable of absorbing as much leading reactive power before reaching a low-voltage limit as in a high grid-voltage condition. In theory, the transmission operator could be contacted and asked to adjust the voltage, but in practice, it is not usually feasible to adjust the voltage enough to observe the entire reactive range of the generators.
Draft 1 of a new revision, MOD-025-3, seeks to address these concerns by expanding the available methodologies for verifying the generator’s real and reactive capabilities to include an engineering review in addition to the already available staged testing or operational data approaches. [1] The engineering review would include consideration of the equipment design, excitation limiters, and operational limitations to justify the reported capabilities. The draft also provides a graphical composite capability curve to document the minimum and
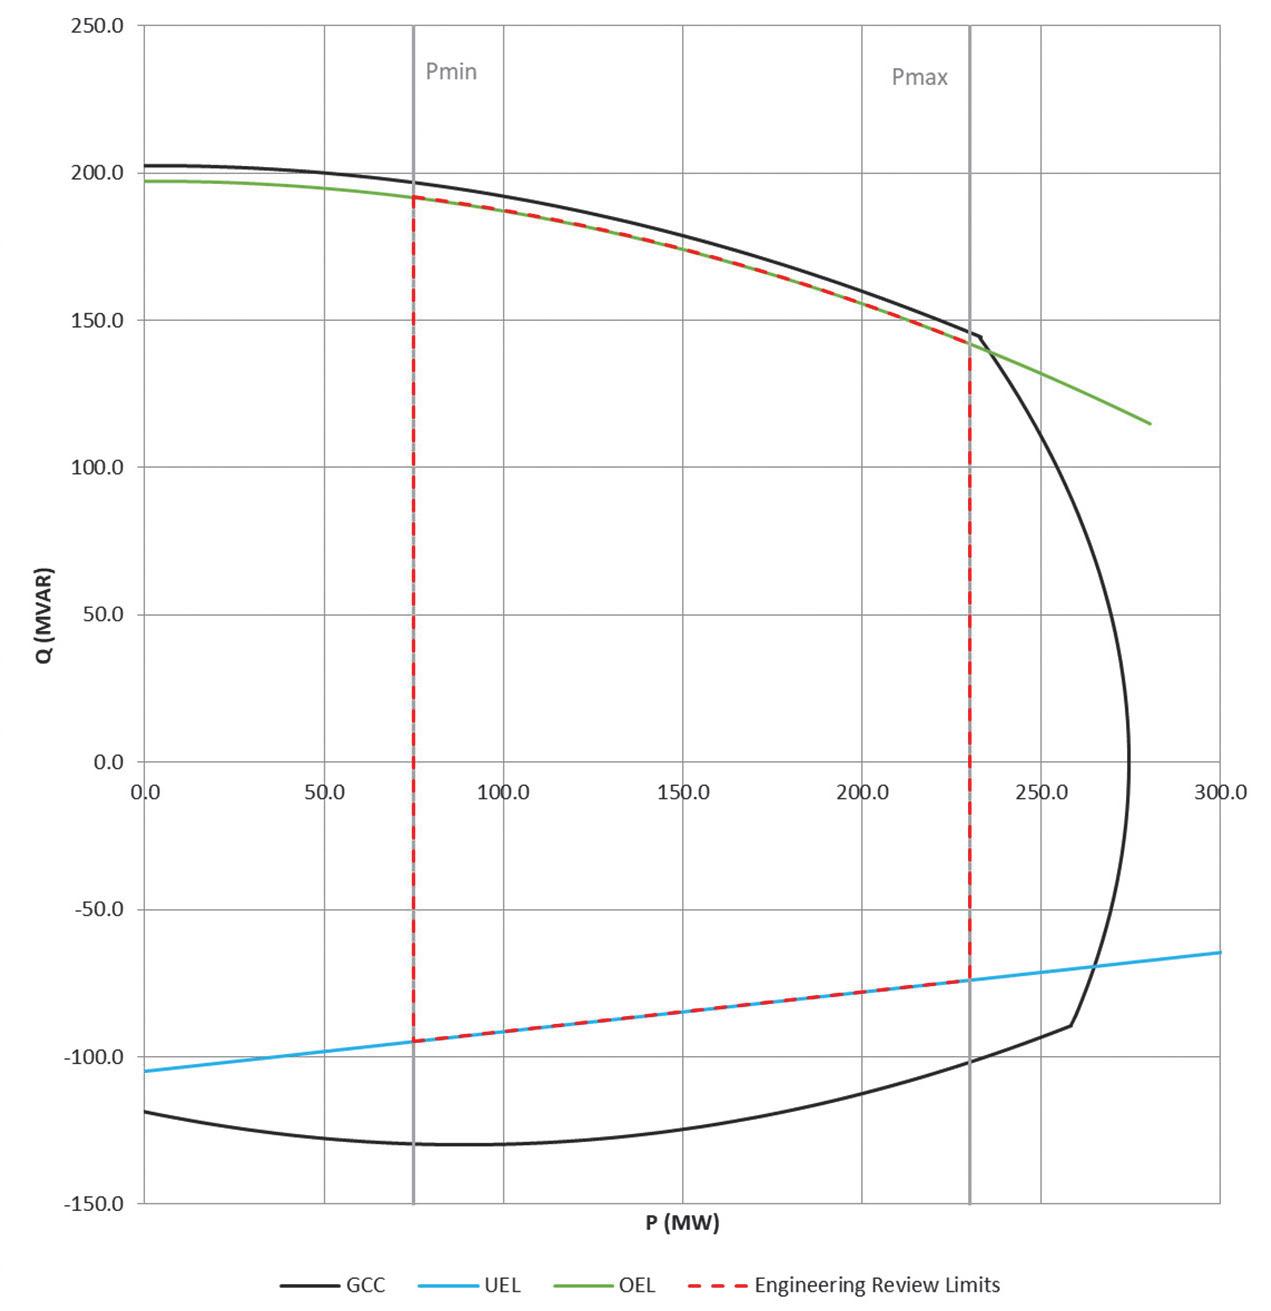
maximum capabilities alongside the generator capability curve (GCC) as well as limiters such as OEL or UEL, if used (Figure 1).[1]
Additional changes in the proposed draft include extending the periodicity of reverification from every 5 years to every 10 years provided no other applicable event, such as a qualifying outage or a change made to a limiter setting, that impacts the reported capability of the generator[1] occurs.
The comment period for the draft ran from September to November 2022, followed by the voting period in November 2022. The draft was not approved, and drafters are now reviewing and deciding on the next steps, but comments and ballot results are available for viewing on the NERC Project 2021-01 webpage.[7] While the fate of the standard is not sealed, expect this standard to be revised with new requirements in the near future.
Figure 1: Generator Capability Curve with Limits
INDUSTRY TOPICS
PRC-019
The second NERC Project 2021-01 SAR includes proposed modifications to PRC-019-2, the active version of the PRC-019 standard. While most of these modifications propose changing the standard to better consider the unique aspects of inverter-based resources (IBRs), the SAR also includes proposed edits that impact synchronous generation compliance evaluation.
In Draft 1 of the new revision, PRC-019-3, the requirements have been reformatted such that Requirement R1.1 relates to synchronous generation while Requirement R1.2 relates to IBR generation. Requirement R1.1 is largely similar to the existing PRC-01902 R1.1 since the standard was originally written with a bias toward synchronous generation. However, one significant proposed change is the removal of requiring protective functions to coordinate
In the conventional assumption for SSSL calculations, it is assumed that a generator operates with fixed field voltage. This is a conservative assumption since interconnection agreements and transmission planners require the majority of synchronous generators to operate with automatic voltage regulation (AVR) in automatic, not manual, mode. In other words, a unit’s AVR continuously regulates the voltage so that the SSSL is not reached. Therefore, the new PRC-019 revision does not include coordination between the loss of field relays or the UEL with the SSSL.
Another proposed change in Attachment 1 includes synchronous generator reactive capabilities in the list of functions that need to coordinate with equipment capabilities. Related to MOD-025, this would require confirming that the OEL and UEL are reasonably set against the equipment capabilities. [1] The industry has generally already included this confirmation in a


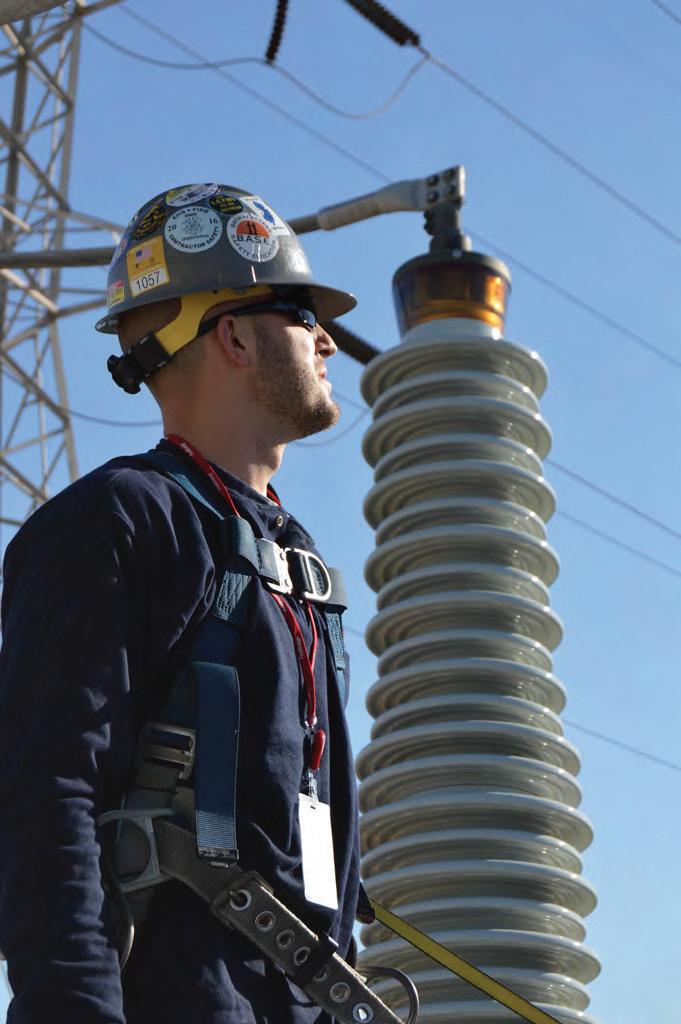

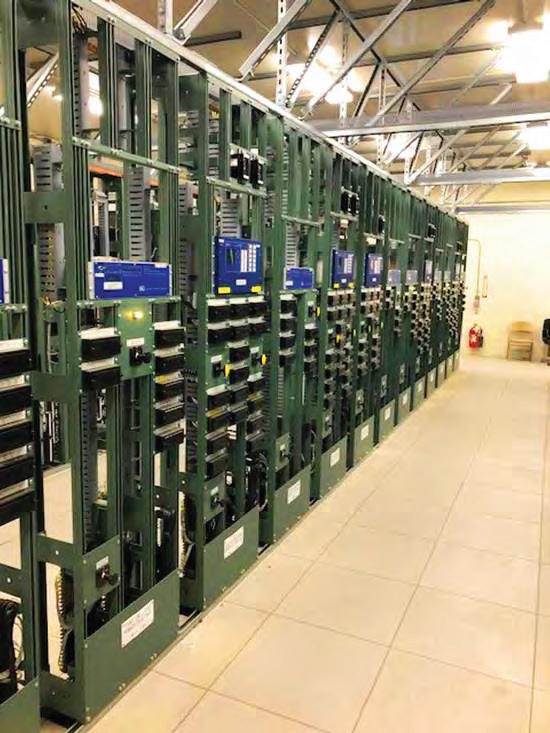


JET Electrical Testing, LLC is a 24/7 full service testing company founded upon the premise of providing exceptional customer service and the most highly skilled technicians in the industry. The team of project managers, engineers, support staff, and field technicians form the cohesive team in which customers have relied on year after year. JET specializes in commissioning, preventative maintenance, equipment repair, apparatus testing, and emergenc y response/troubleshooting. Electrical system reliability is JET’s goal.

PRC-019 assessment, but the revision would explicitly require it.
The draft of this standard had the same comment period and voting period as MOD025. This draft was also not approved, and drafters are reviewing and deciding on next steps. Comments and ballot results are available for viewing on the NERC Project 2021-01 webpage. Similar to MOD-025, while the fate of the standard is not sealed, expect this standard to be revised with new requirements in the near future.
GENQEC GENERATOR DYNAMIC MODEL
Several dynamic models exist for synchronous generators. These models have been used to represent various generator configurations — round-rotor, salient-pole, etc. — and have been accepted by various regulatory entities at different times. One of the major differences between the generations of synchronous generator models is how saturation is represented by the dynamic parameters and accounted for within the model.[2][3]
GENQEC models saturation using a new parameter: Kw. This parameter represents the rotor field current compensation factor and can be determined in multiple ways as outlined by Wang.[4] The first method covered here uses the zero-power-factor saturation curve and the opencircuit saturation curve. These curves are typically available from generator manufacturers. However, if they are not available, this Kw saturation factor can also be determined through testing. Wang includes a detailed description of the model and references an example of how to determine Kw.
Highlights from Wang include:
1. The necessary test points are obtained while the unit is online.
2. High-load operating test points also produce good Kw fitting results for other operating points.
3. Generator terminal voltage, active power, reactive power, and rotor field current must be measured.
4. Unless generator rotor position/angle can be measured, accurate generator parameters are critical for good fitting.
With appropriate test results available, Kw can be fitted by comparing outputs from the model to measured values.
Using GENQEC is not yet required, but the model is currently accepted by both NERC and WECC. [5][6] Looking ahead, however, generator models for sites in WECC should be transitioned to using GENQEC following testing. WECC will no longer accept GENTPF or GENTPJ models after December 31, 2023, and while GENROU and GENCC will still be approved and accepted, these models should also be converted to GENQEC, following WECC conversion guidance.[5]
CONCLUSION
NERC standards and accepted models are always evolving. While many revisions are inspired by the vast number of IBRs being added to the grid, improvements and adjustments are still being made in the synchronous generator world. In order to maintain and improve the sustainability of the power grid, it is crucial for generator owners to be aware of and comply with most current revisions of NERC regulations.
REFERENCES
[1] Jason Eruneo, Kory Haag, and Chris Larson. NERC Industry Webinar Project 2021-02: Modifications to MOD-025 & PRC-019, October 18, 2022.
[2] Pouyan Pourbeik, Bajarang Agrawal, Shawn Patterson, and Randy Rhinier. “Modeling of Synchronous Generators in Power System Studies,” CIGRE Science and Engineering, October 2016.
[3] NERC. Modeling Notification Use of GENTPJ Generator Model, November 18, 2016.
[4] Quincy Wang. GENQEC Generator Dynamic Model Specification, September 9, 2020.
INDUSTRY TOPICS
[5] WECC PPMVDWG. Retirement Plan for GENTPJ Model from WECC Study Cases, January 27, 2022.
[6] NERC. Acceptable Models List.xlsx, Version 17, June 2021.
[7] NERC. Project 2021-01 Modifications to MOD-025 and PRC-019. Accessed at https://www.nerc.com/pa/Stand/Pages/ Project_2021-01_Modifications_to_MOD025_and_PRC-019.aspx

Casey Whitt has worked for Ready Technologies Inc., a Division of Shermco, since she graduated from Oregon State University with a BS in electrical and computer engineering and a minor in computer science. Her current area of focus is assessing NERC compliance, particularly for renewable sites, but she is also interested in renewable energy
positive sequence modeling, electromagnetic transient modeling, and protection system design. She is currently working towards her Professional Engineer license.

Maysam Radvar, MEng, PEng, PE, SMIEEE, is a Senior Power Systems Engineer. After acquiring BS and MS degrees in electrical engineering at the University of Alberta, he established his career in the field of power systems and protection Systems. Maysam is interested in NERC compliance studies, generator baseline testing, NERC MOD-026 and MOD-027 testing, power system dynamic and transient stability analysis, power system protection design, and renewable energies. He is a Senior Member of the IEEE Power and Energy Society (SMIEEE), the North American Generator Forum (NAGF), and the Western Interconnection Compliance Forum (WICF). He is a Professional Engineer in Washington, Wyoming, Colorado, California, Texas, South Dakota, and Maine, as well as in the Canadian provinces of Alberta, British Columbia, Saskatchewan, and Ontario.

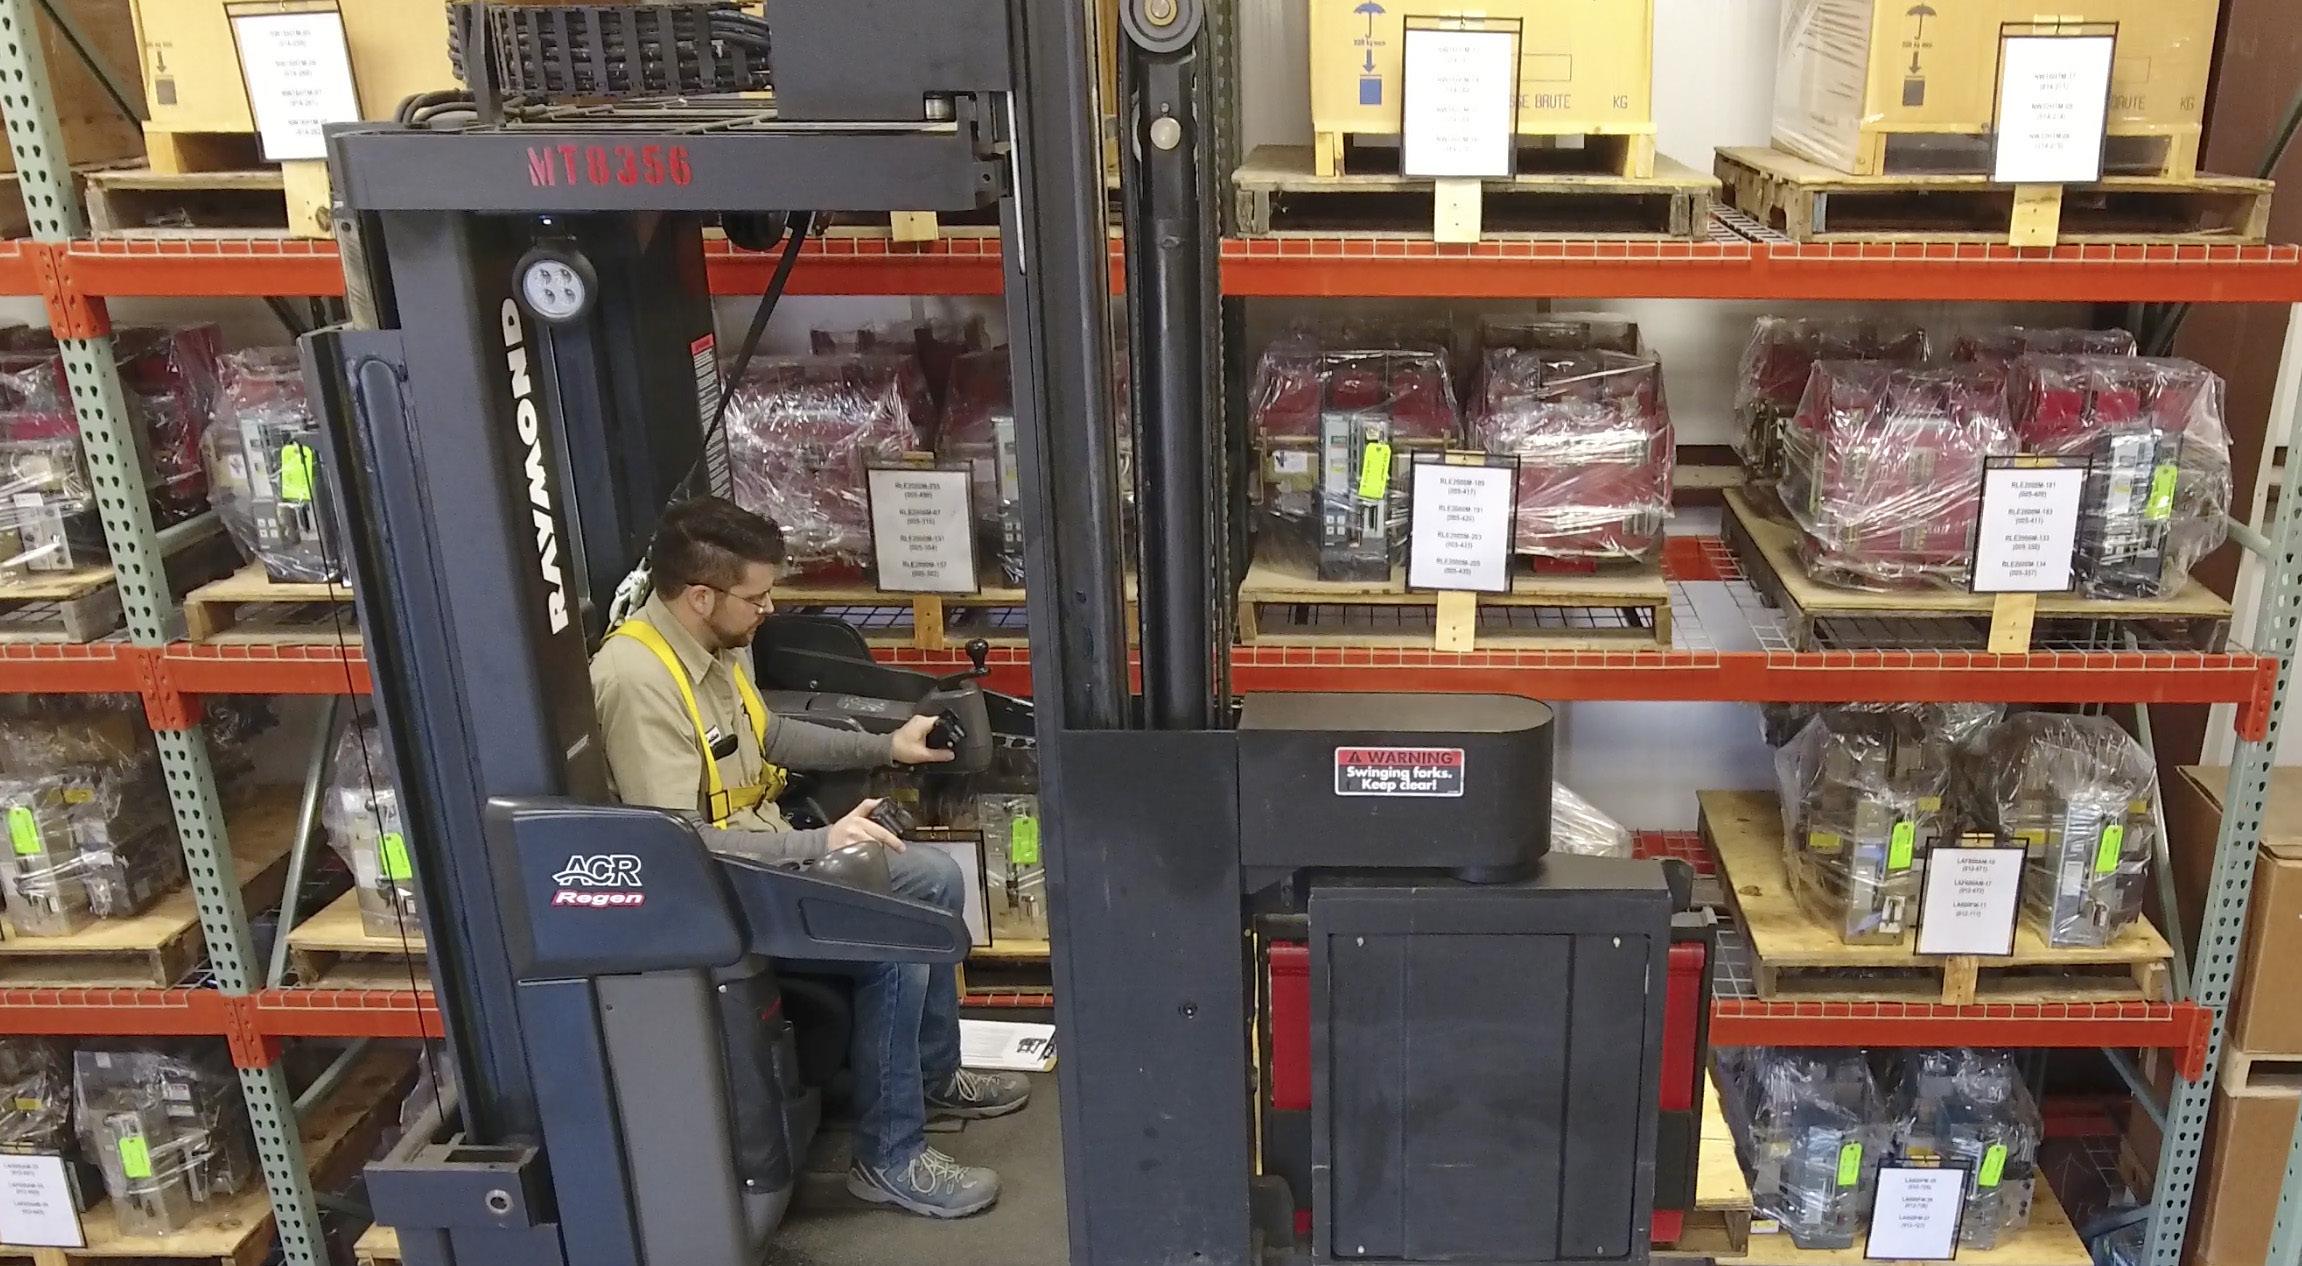
When equipment fails, every minute spent searching for what you need is bad for the bottom line. Our massive inventory of millions of new, surplus and repurposed circuit breakers, switchgear and related products is here for you. We have the expertise to see the big picture, understand your problem and recommend the best solution. Already know exactly what you need? Our website is constantly being updated with products and the online buying process is easy.
Tap into the power of National Switchgear at nationalswitchgear.com or call us today at (800) 322-0149.
DETECTING AND LOCATING ON-LINE PARTIAL DISCHARGE
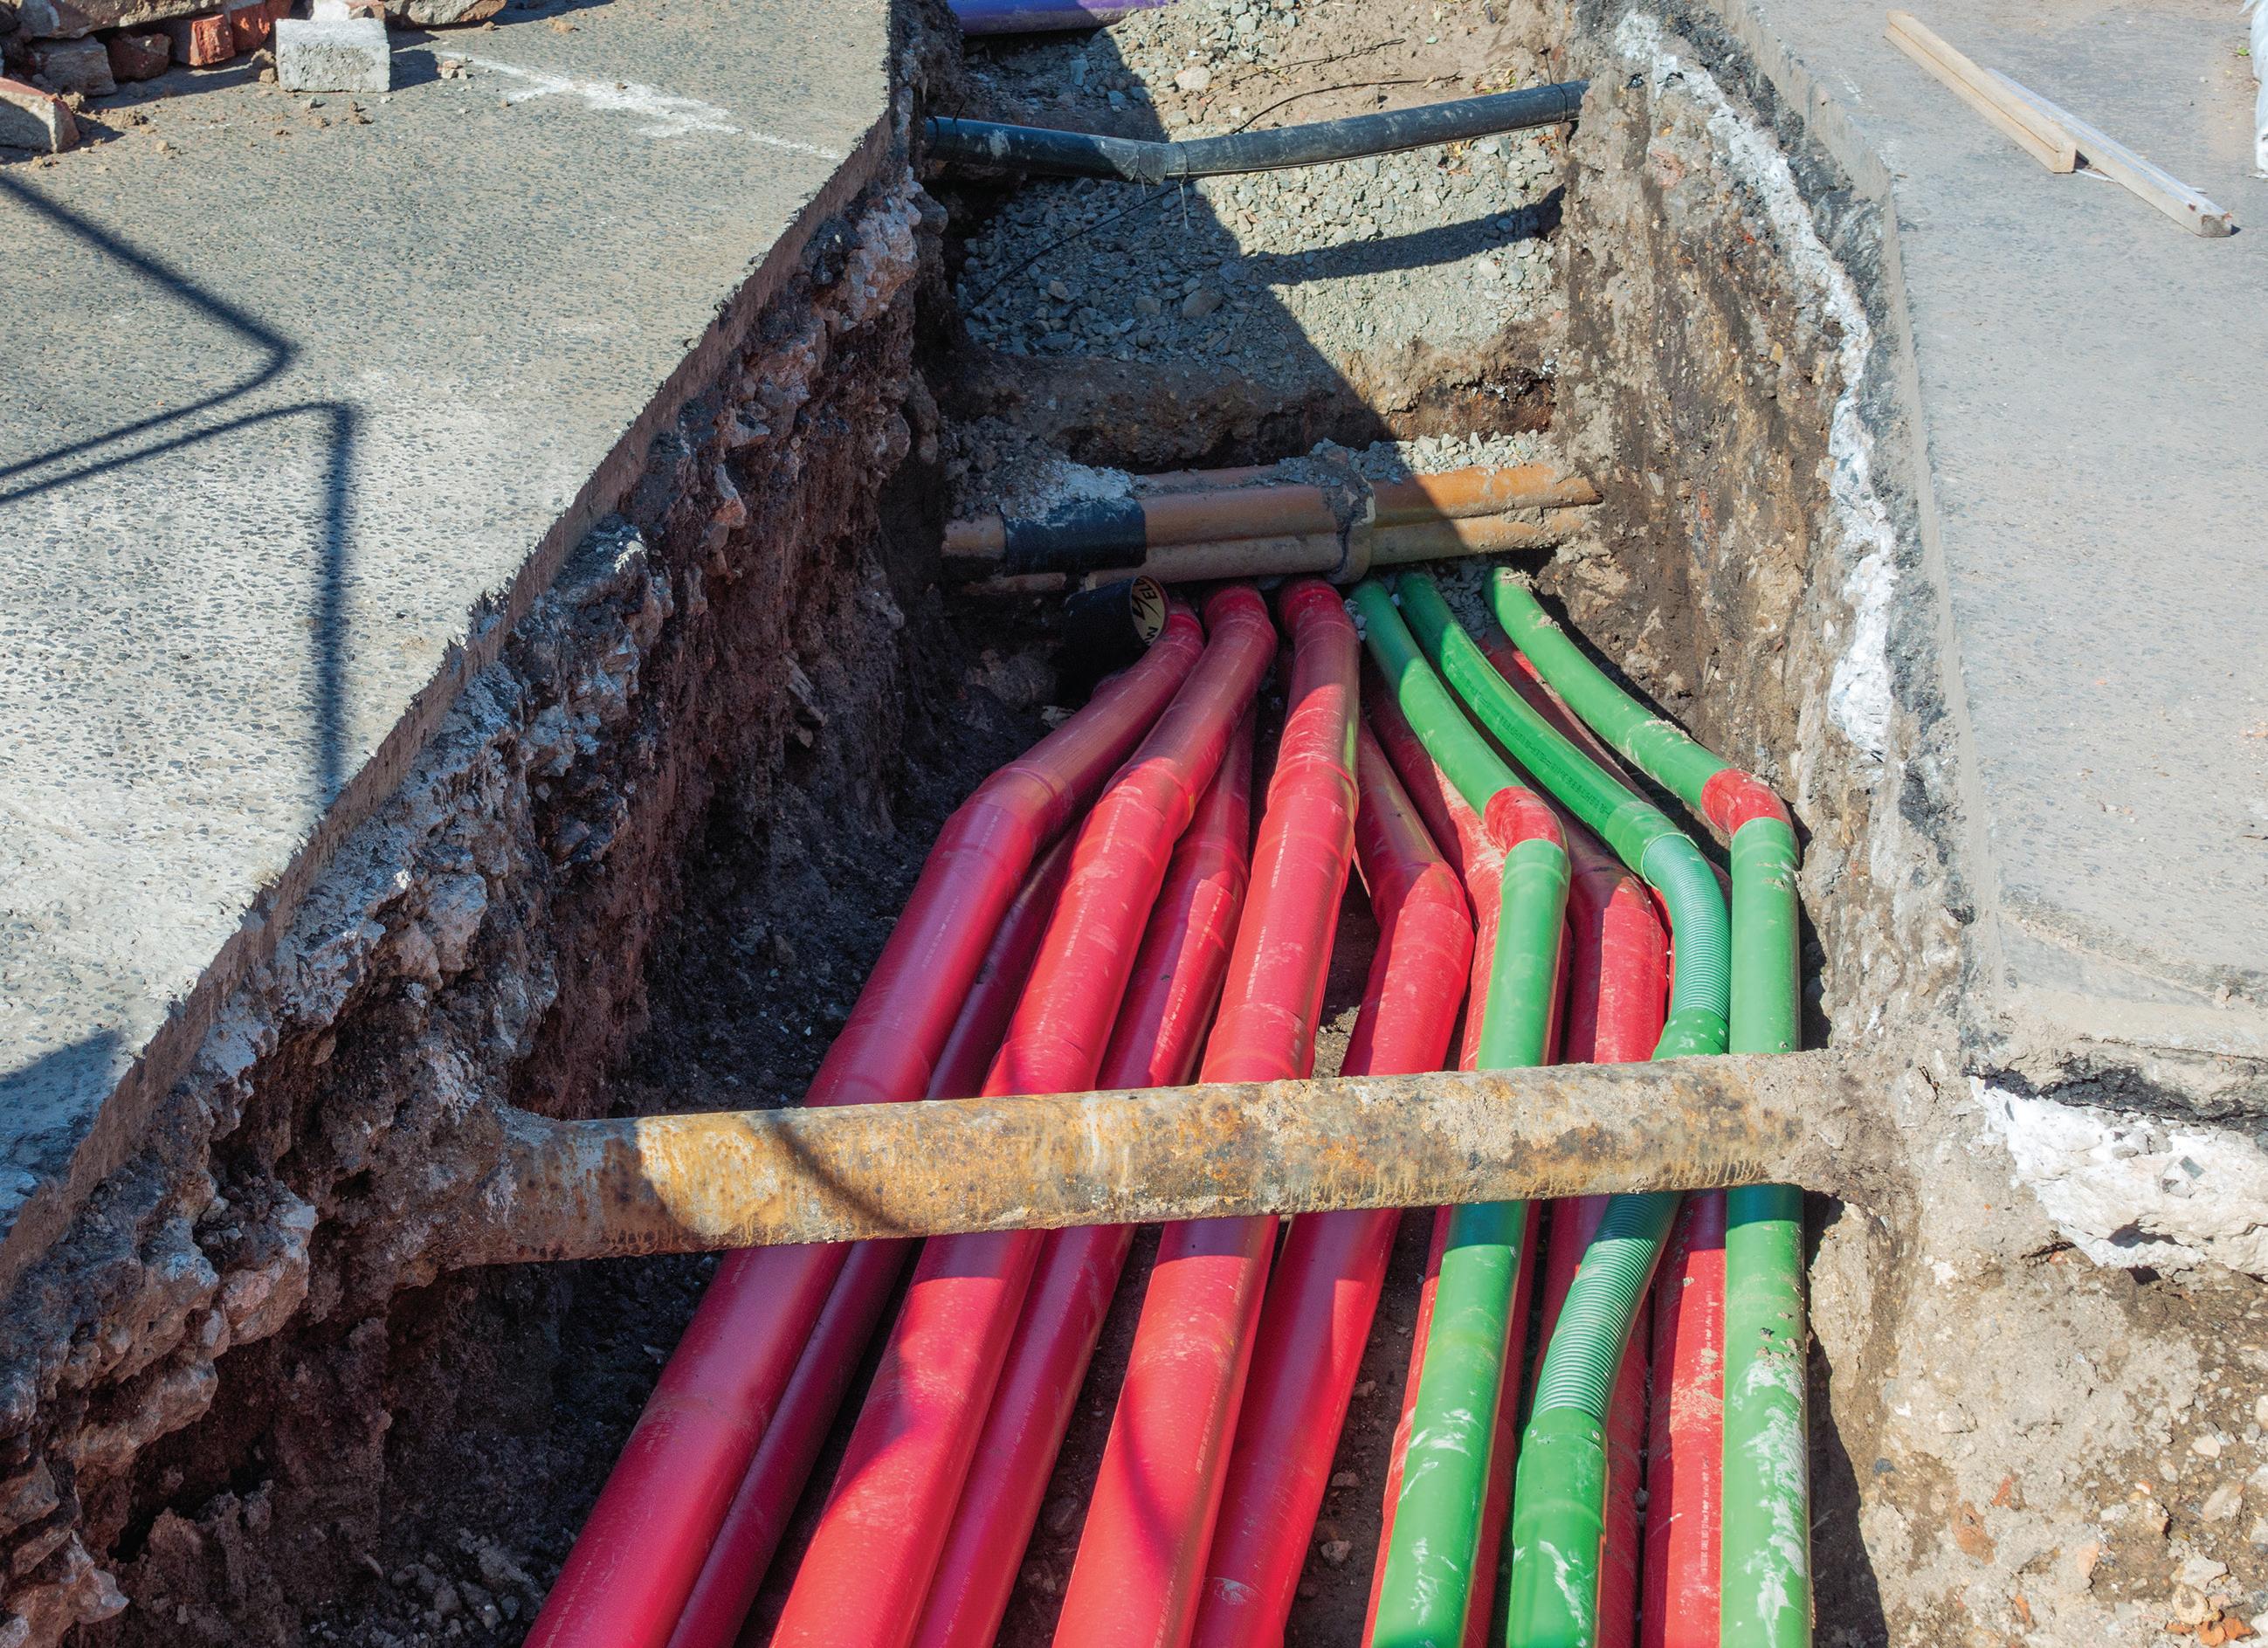
BY BHARAT NANDULA, Qualitrol
Power cables are important assets in transmission networks for the reliable operation of power systems. To prevent catastrophic failures in underground cables and terminations, it is important to know how to leverage the various types of available sensors that can detect PD and locate the source so that appropriate action can be taken to avoid inservice failures. This article answers questions about how technology can help identify partial discharge in underground cables without expensive shutdown time.
Power cable systems consist of the cables themselves and their accessories — joints and terminations. In recent years, the use of highvoltage power cables has increased due to more densely populated urban areas, and new power cables are being installed in old networks.
New synthetic polymer materials have boosted the birth of extruded XLPE power cables, and the use of XLPE insulation in high-voltage cables is increasing due to its advantages: low dielectric losses, suitability for high operating temperatures, and relatively easy and low-cost manufacturing.
Q: How can you ensure the reliability and availability of cables that experience transients, lightning, or switching surges and fault voltages?
Electrical diagnostic tests have played a role, though this often involves expensive shutdowns and other cost implications. Most dielectric failures in HV XLPE cables are associated with defects in joints and terminations that develop over the lifetime of a cable system. To detect such changes at an early stage, detailed information on insulation condition is necessary. As an alternative to traditional diagnostic methods, this information can be achieved by partial discharge monitoring during the operation of the equipment.
The most effective tool to detect local damage, defects, and/or localized aging processes in extruded cable systems is measuring partial discharge. On-line partial discharge measurements are most suitable for detecting problems in cable terminations and joints. Harmful levels of partial discharge can be detected well before a breakdown.
With continuous measurement, reliable estimations about insulation condition can be made.
• Possible applications for on-line partial discharge measurements are:
• Quality assurance of installed cables
• Continuous cable monitoring
• Location of problematic joints and terminations
• Prioritizing cable replacements
Q: What are the advantages of on-line partial discharge monitoring over off-line partial discharge measurement?
Using PD technology has proven to be an excellent method to identify problems in insulation. IEC 60270, High-Voltage Test Techniques — Partial Discharge Measurements details the most adaptive and conventional method of measuring partial discharge.
However, this method is most suitable for off-line diagnostics in environments with less electromagnetic interference. Because aging of the insulation of in-service HV components is ongoing, on-site PD testing and diagnosis have attracted increased interest for use in condition monitoring. Since conventional PD measuring systems used in a controlled factory environment are not generally suitable for onsite application, specialized PD detection and measurement methods have been introduced.
PD signals can be detected by unconventional PD measuring methods and systems that utilize the physical characteristics and properties of the PD processes. These methods have gained significant popularity as they can be applied while equipment is operating. Unconventional PD coupling methods based on, for example, inductive or capacitive sensors have led to increased sensitivity at the accessories (joints) compared to conventional PD detection at the cable end. One promising approach is the use of inductive PD sensors at terminations and cross-bonding the links of long HV cable systems.
Q:
What type of sensors or sensing techniques are used in on-line partial discharge testing?
To detect PD activity on-line, non-intrusive sensors must be used. For on-line PD detection, HFCTs are used to detect current pulses from PD in the cables and switchgear. Transient earth voltage sensors (TEVs) are used to detect electromagnetic radiation from PD activity from terminations and switchgear. By using a combination of sensors, sensitivity to various types of PD can be obtained, and the measurements from different sensors can be correlated to aid in the diagnosis. A combination of HFCTs and TEV (Figure 1) makes it possible to separate the signals that are coming from the switchgear panel, terminations, and cables.
HFCT
The most suitable sensors for underground cable PD measurement are inductive-type high-frequency current transformers (HFCT).
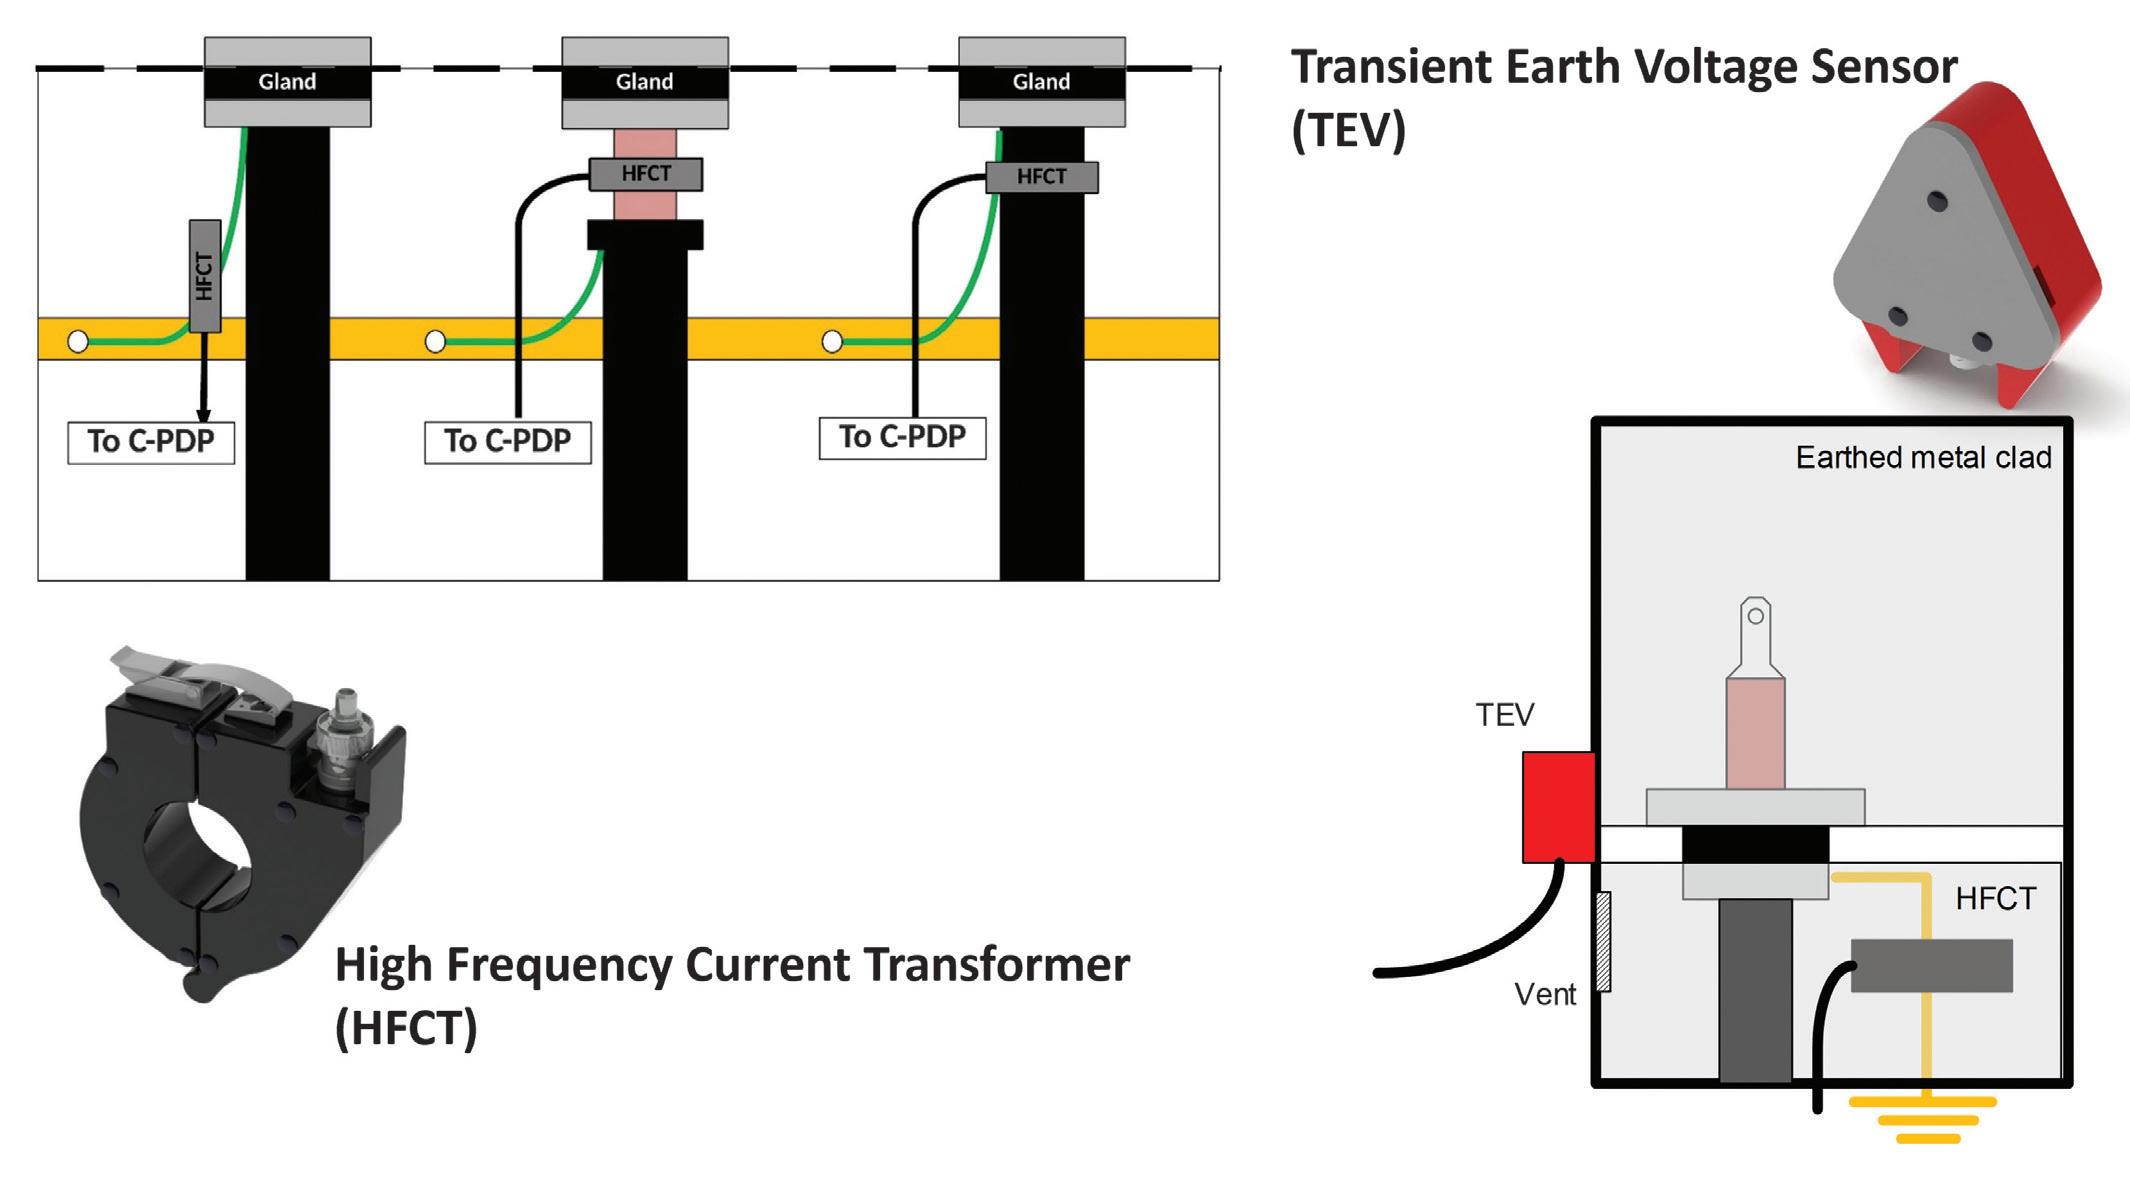
These sensors can be installed during operation of the cables. Typically, HFCTs are mounted on the ground straps of the MV or HV cable at the connection boxes of the cables. To design and select appropriate HFCTs for these applications, the lower and higher cut-off frequencies, polarity, and saturation characteristics must be considered.
Lower cut-off frequency is an essential parameter for HFCTs. It’s a compromise between the ability to detect dispersed signals from long cables and tolerating noise pickup from mains. Most of the HFCTs on the market for lower cut-off frequencies operate in a range from 50 kHz to 150 kHz. For special applications where no dispersed signals need to be captured, much higher-frequency ranges can be used with the benefit of obtaining lower noise levels.
Higher cut-off frequencies — the maximum frequency at which an HFCT needs to respond — depend on the application. A highfrequency HFCT cut-off is generally 10 MHz or higher based on the application. The HFCT should be clearly marked in terms of its polarity relationship, e.g., an arrow pointing towards
the grounding point of the cable or earthing strap. The orientation doesn’t seem to matter, but if more than one HFCT is used in a test and the polarity of the signals needs to be compared, a clear and common definition is needed.
TEV
Another type of sensor widely used in MV switchgear employs the transient earth voltage (TEV) phenomenon, which has been more widely exploited for condition monitoring and asset management of MV switchgear. Transient earth voltage sensors make use of the skin effect to measure electromagnetic radiation due to internal partial discharge. This is an attractive sensing option since measurements are inherently safe and can be made without any physical intrusion or modification to the switchgear. The benefits of TEV measurement derive from the ability to install sensors nonintrusively on in-service equipment.
Q: What are the possible approaches for monitoring PD?
Two approaches can be used to perform on-line PD testing on cables: periodic monitoring and continuous monitoring. Periodic monitoring is
Figure 1: HFCT and TEV Testing
reasonably immediate to deploy, with tests between a few minutes and a few hours per circuit.
Continuous on-line monitoring provides 24/7 monitoring and the ability to do trending. By trending this summary data, changes in PD activity during the monitoring session can be observed. For example, increases in PD magnitude indicate the defect is getting larger, and increases in PD count indicate defects are discharging more rapidly. When the activity meets pre-set event criteria and discharge magnitude levels and discharge rate, the system can generate alarms.
Q: What is the greatest challenge in doing on-line PD measurement?
The greatest challenge in on-line partial discharge measurement is distinguishing between actual partial discharge signals and noise from various sources such as EM interferences, noise from adjacent circuits, and corona when cables are connected to overhead lines. Several advanced software techniques and hardware solutions (Figure 2) are useful to discriminate between actual partial discharges and noise interferences.
In the following case study, capturing 50 nonconsecutive cycles and all pulses in the time domain while at the same time capturing the PRPD (phase resolved PD) data showed the data in different dimensions.
CASE STUDY: 33 KV POWER CABLE TERMINATION WITH SINGLE-ENDED PD DETECTION
In this study, periodic on-line monitoring was conducted on three-phase, 268-meterlong, single-core 33 kV cables terminated to switchgear. The remote ends were terminated to a transformer. The PD monitoring system utilized HFCTs, TEV, and a portable measuring instrument. PD recording was performed at a medium-voltage metal-clad switchgear cable termination box. HFCTs were clamped around individual earth shields of power cables, and TEV sensors were attached to the inner walls of the switchgear cable termination enclosure.
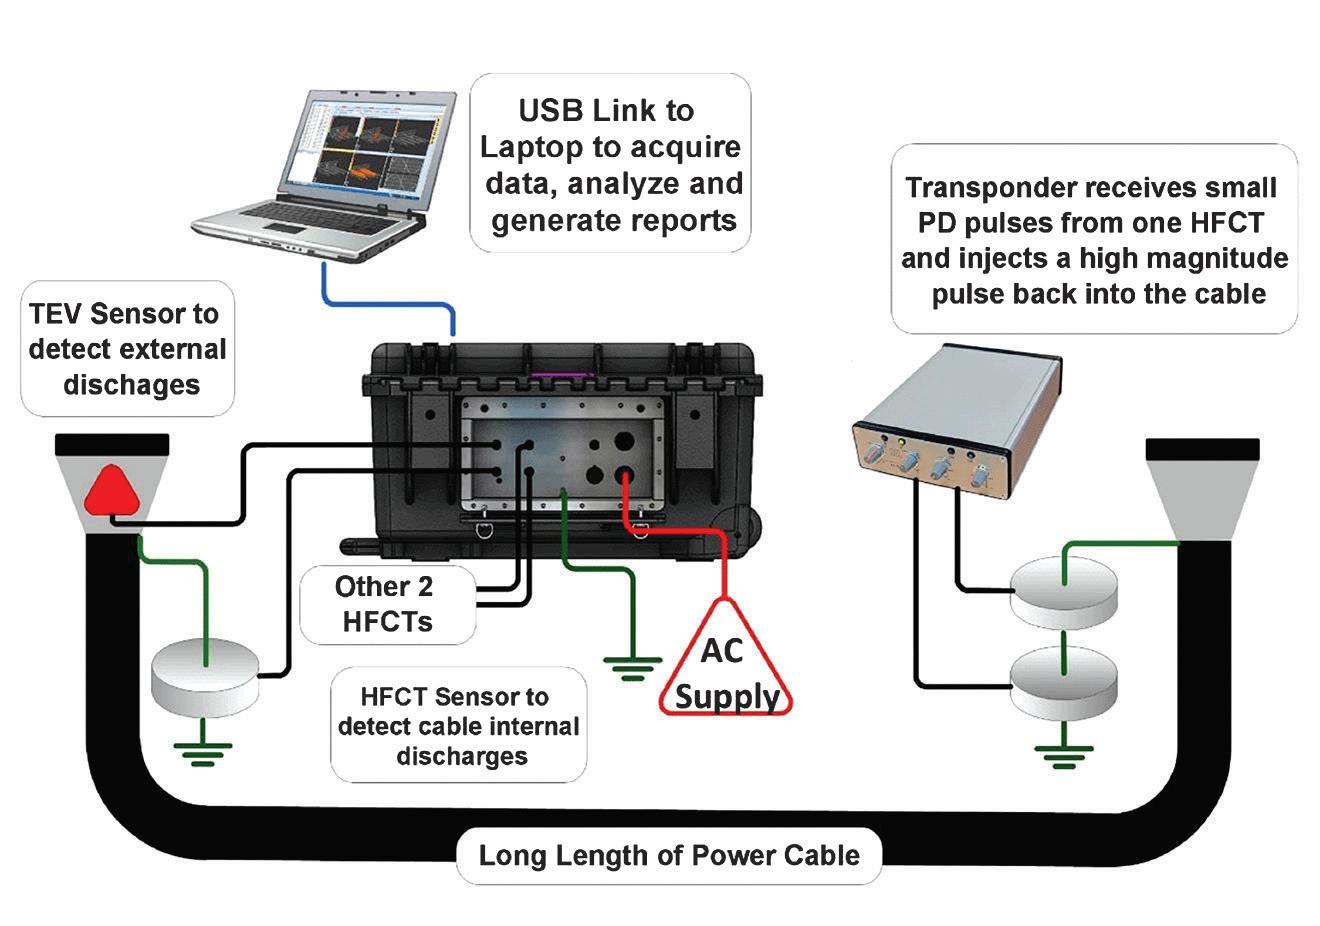
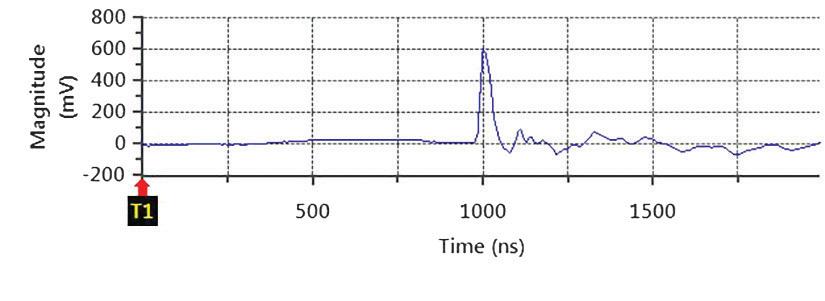
Fifty (50) non-consecutive cycles were recorded, and with the help of software and algorithms like artificial intelligence and pulse shape analysis, the data was divided into PD and non-PD categories as shown in Figure 3 and Figure 4.
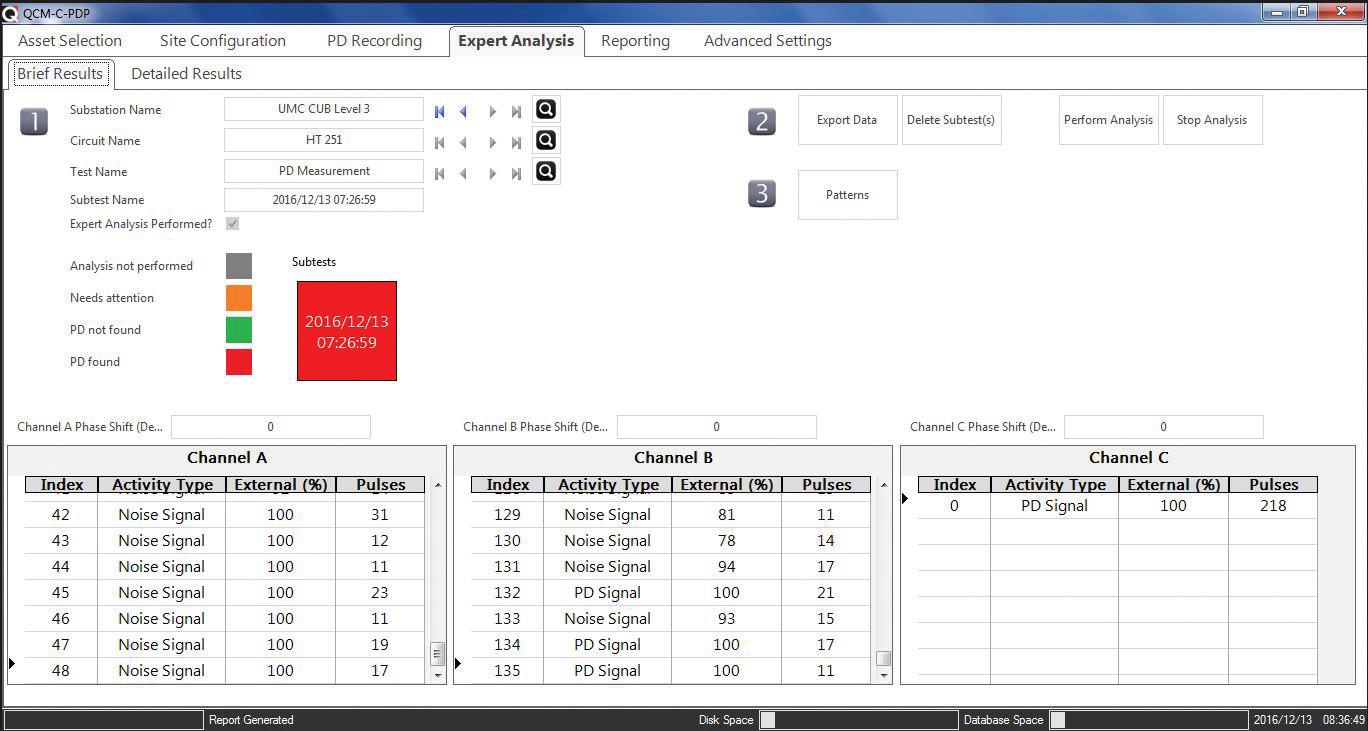
Figure 2: Portable System to Measure Cable PD
Figure 4: Phase C Showing Clear Partial Discharge Signals
Figure 3: Signal Magnitude
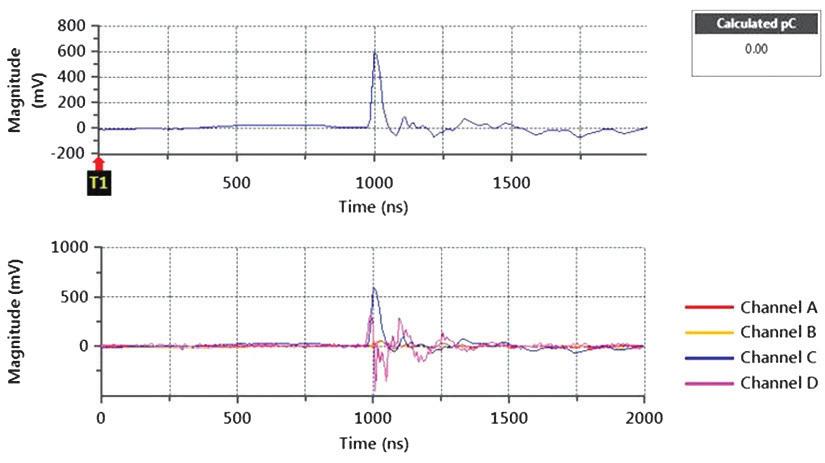
The investigation further considered data including phase activity, pulse shapes, and PRPD compared with TEV and HFCT graphs. Note that phase graphs were phase consistent and pulse-shape graphs confirmed the PD source from Phase C. The next task is to determine the location of the partial discharges. Comparing the HFCT and TEV data indicated the same activity from both sensors. As this software and monitoring device can capture individual pulses, we further looked at data in the time domain. The same activity was observed in pulse-shape analysis graphs from the HFCT, which was installed on phase C, and the TEV sensor, which was placed on the panel.
Observing Phase C and TEV activity in the time domain (Figure 5), it was clear that the PD activity was located at the termination end. You can see that HFCT and TEV activity was occurring at the same time at a high magnitude.
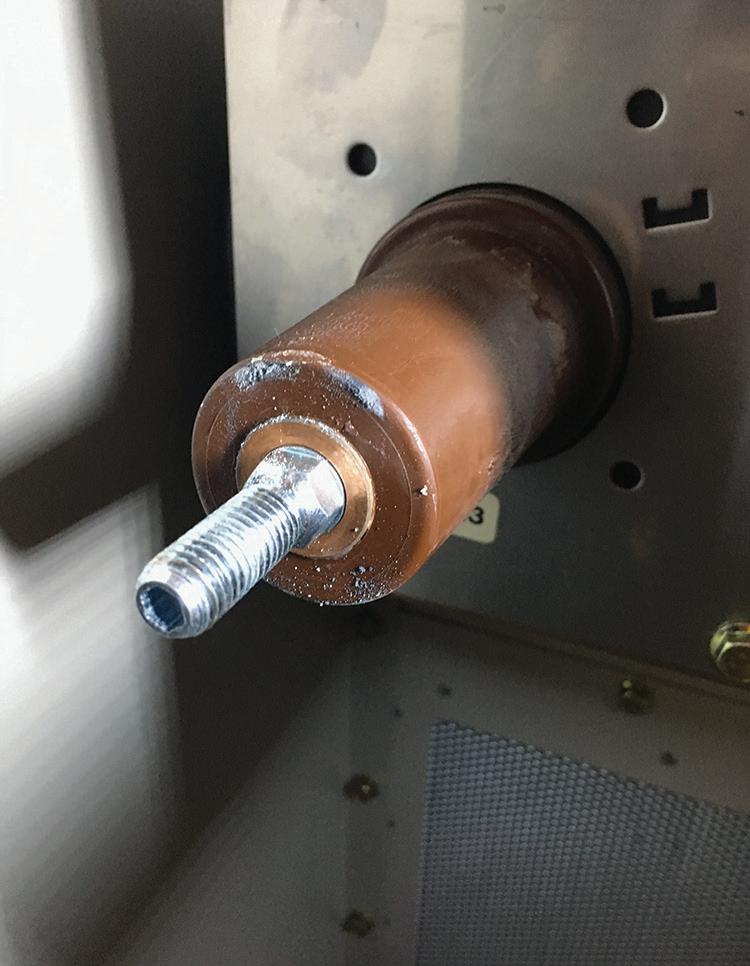
When the terminations were opened a few months later, it was clear that there was sparking at the termination, which could eventually break down the bushing connected to the cable.
CONCLUSION
On-line PD measurement is an important technique for use on power cables and switchgear during routine inspection and after installation to assess condition to prevent catastrophic failures. Implementing on-line periodic monitoring has been shown to be an effective solution to avoid catastrophic failures. The case study explained how important it is to have time-domain measurement. Time-domain characteristics were used to classify the signals, and partial discharge signal identification was achieved by an artificial intelligence and artificial neural network (ANN) expert system.

Bharat Nandula is a Technical Application Specialist at Qualitrol, where he serves as a technical resource on GIS, transformers, and high-voltage cable monitoring solutions for Qualitrol Engineering’s sales and product managers and end users. He understands partial discharge theory and has practical experience in electrical diagnostic testing and condition assessment on various types of power equipment as well as high-voltage off-line diagnostics and on-line partial discharge measurement. Bharat is a member of the IEEE Dielectrics and Electrical Insulation Society and a CIGRE member. He graduated from Pondicherry University with a BS in electrical and electronics engineering.
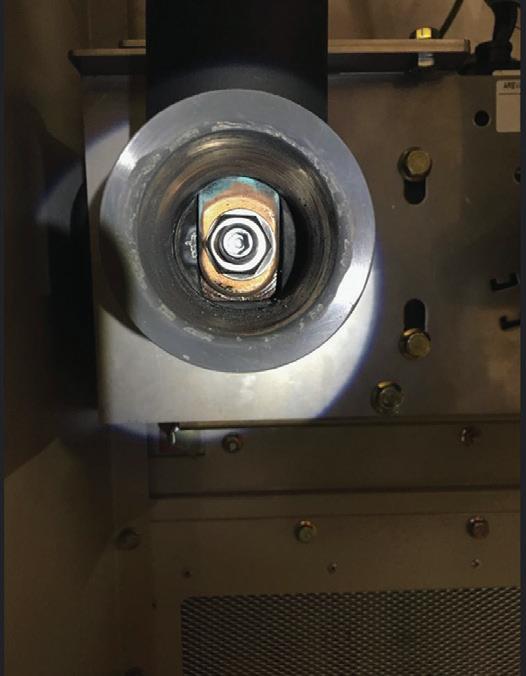
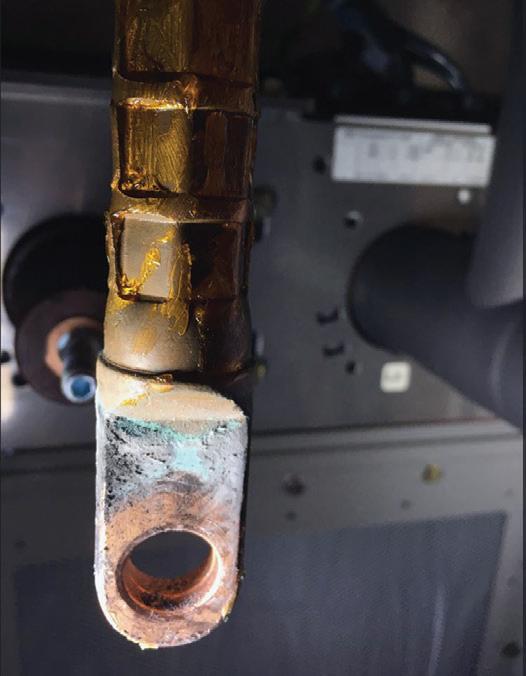
Figure 5: HFCT and TEV Activity
NFPA 70E Training
Get Your Workers Certified to the 2021 Standard!
Electrical Safety for the Qualified Worker training is aimed at qualified electrical workers to help them build capabilities, knowledge and safe work practices when working around energized electrical systems. Protec Equipment Resources now offers a live online instructor-led 2.5 day course that meets the NFPA 70E ® 2021 standard for electrical safety in the workplace!

Live Instructor-Led
People taking this class for the first time are required by the 70E 2021 standard to take it “live”. Whether online or in-person, to be compliant, there must be interaction and engagement with an instructor.



Great Price
Less expensive than in-person programs, with more curriculum and volume discounts!
Strongest Content Offering
20 hours (2.5 days) of practical tutorial that includes grounding as a topic!
Conveniently Consistent and Flexible
Virtual live online classes at a known date and time every month! Enroll 1 or 30.
Reduces Travel Time and Costs
Minimize workers’ time away from the office; eliminate the cost of travel and per-diems.
High Level of Instruction
Train with Tom Sandri, well-known in the electrical testing industry with over 30 years of experience. Tom was certified by a committee member and writer for the 70E certification.
FOR MORE INFORMATION
Scan the QR Code below with your phone’s camera and click the link that appears


Tom Sandri Director of Technical Services
ACCEPTANCE AND MAINTENANCE TESTING FOR MEDIUM-VOLTAGE ELECTRICAL POWER CABLES — PART 2 OF 3

BY THOMAS SANDRI, Protec Equipment Resources
In Part 1 of our three-part series on acceptance and maintenance testing for medium voltage electrical power cables, we reviewed cable construction and cable aging characteristics and started our discussions on cable testing options and philosophies. In Part 2 of this article, we move away from undervoltage testing and explore high potential testing techniques.
HIGH POTENTIAL TESTING PERFORMED WITH DIRECT CURRENT
For years, high-voltage direct current (DC) testing has been the traditionally accepted method for judging the serviceability of medium-voltage cables. Direct current tests have worked well for conducting high potential and condition assessment tests on paper-insulated, lead-covered (PILC) cable, and when plastic-insulated cables were first introduced in the 1960s, DC continued to be the preferred method.
As time moved on, plastic-insulated cables became more abundant and began showing the
effects of service age. Direct current continued to be the dominant test, but concerns began to grow over its effectiveness. In the early 1990s, reports began to surface indicating that DC high potential testing could be at fault for latent damage experienced by extruded medium-voltage cable insulation (cross-linked polyethylene and ethylene propylene rubber). After receiving these reports, the Electrical Power Research Institute (EPRI) funded a study related to cross-linked polyethylene (XLPE) cables. This study (EPRI Report TR-
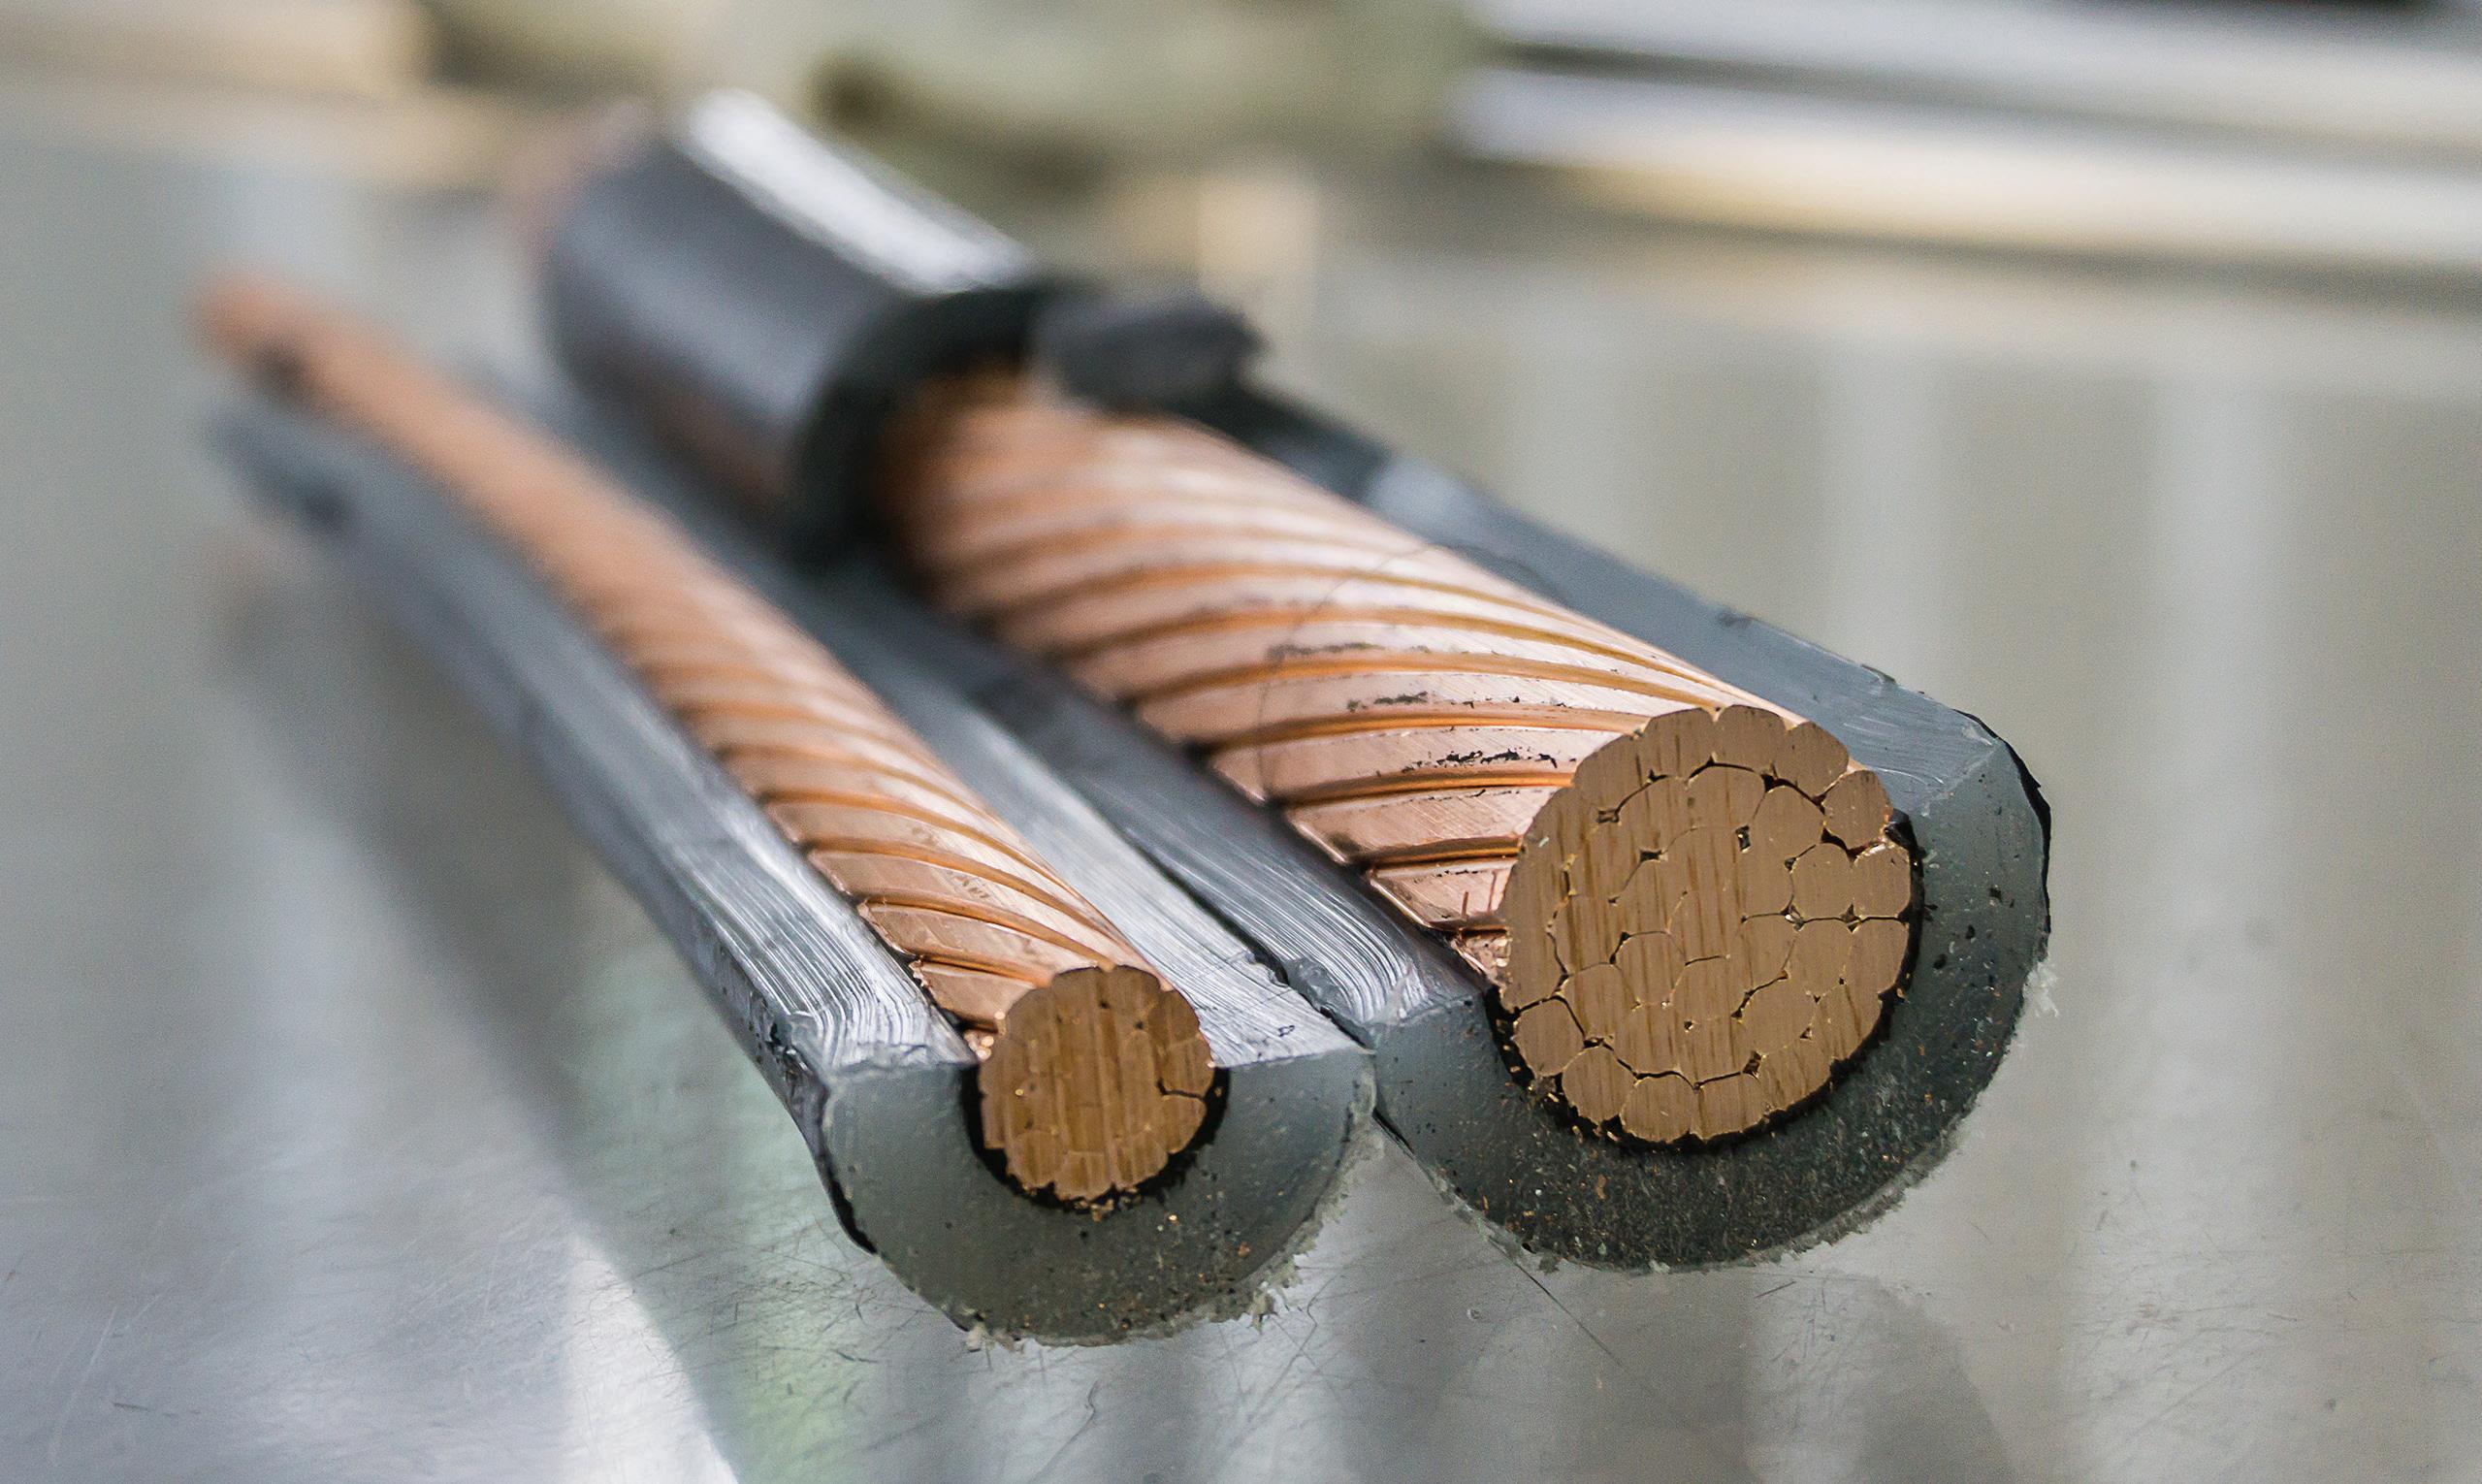
101245) yielded the following conclusions regarding XLPE cable:
• DC high potential testing of field-aged cable reduces its life.
• DC high potential testing of field-aged cable generally increases water tree growth.
• DC high potential testing before energizing new medium-voltage cable doesn’t cause any reduction in cable life.
To better understand the conclusions of the EPRI study, it is beneficial to again review the aging characteristics of extruded dielectric cables and the process of water treeing.
Water Trees
Water trees begin to form when a cable is exposed to water and normal operating voltage over an extended period of time. Electrical forces acting on water molecules — electrophoresis — at a microscopic point within the insulation increases the separation between polymer units. These water droplets
become oriented into a chain-like channel. The result is a sharp electrode, producing highly localized stresses. Once treeing is initiated, electrical stress exists from the base of the tree channel to its extremity.
When high levels of DC voltages are impressed on solid extruded polymeric materials, their good electrical insulation properties become degraded. For example, trapped or lowmobility electrically charged species within the bulk can give rise to space charge, resulting in localized electric stress enhancement. This can cause further concentration of charge and accelerate electrical ageing. The water tree part contains more ionic impurities than the sound part. It is therefore likely that in XLPE cable under DC voltage stress, space charges are formed in the water tree region and its vicinity, promoting an increase in water tree growth and reduced service life.
In 1996, a few years after the EPRI reports, the insulated conductor industry determined that DC high potential testing of plastic (XLPE)
PHOTO:
CORPORATE
insulation systems — in the cable factory as a routine production test or after installation as a high-voltage proof test — was detrimental to the life of the insulation. EPRI therefore discontinued recommending DC testing for plastic (XLPE) insulation systems.
IEEE Standards
In 2001, IEEE released IEEE Std. 400-2001, IEEE Guide for Field Testing and Evaluation of the Insulation of Shielded Power Cable Systems. The new standard includes statements such as:
Testing of cables that have been aged in a wet environment (specifically XLPE) with DC at the currently recommended DC voltages may cause the cable to fail after they are returned to service. These failures would not have occurred at that point in time if the cables had remained in service and had not been tested with DC.
This standard also indicates that other testing has shown that “even massive insulation defects in extruded dielectric insulation cannot be detected with DC at the recommended voltage levels.”
Current versions of most industry recommendations no longer include DC high potential testing of extruded cables (XLPE and EPR) as a maintenance test. Those that still do have all reduced the recommended test duration from 15 minutes to only 5 minutes. None endorses DC high potential testing as a factory test for extruded cables, but most documents continue to include DC high potential testing as an acceptance test on newly installed extruded cable. These industry recommendations and guides also no longer endorse DC high potential testing as a maintenance test for extruded cables that have been in service for more than five years.
Laminated insulation systems are not subject to the same aging characteristics as XLPE and EPR. Therefore, DC testing is more accepted for acceptance and maintenance testing of paper-insulated, lead-covered cable (PILC). Keep in mind, however, that the test has limitations. DC leakage can be affected
by external factors such as heat, humidity, and water level if unshielded and in ducts or conduits. It can also be affected by internal heating if the cable under test has recently been heavily loaded. These factors make comparisons of periodic data obtained under different test conditions very difficult. In practice, the shape of the leakage curve, assuming constant voltage, is more important than the absolute leakage current of a go-no-go withstand test result.
In 2021, IEEE Std. 400.5-2021, IEEE Guide for Field Testing of DC Shielded Power Cable Systems Rated 5 kV and Above with High Direct Current Test Voltages, was released. The recommended practices and procedures for direct voltage acceptance and maintenance testing of shielded, insulated power cable systems rated 5 kV and above for DC service are presented in this new guide. The guide applies to all types of power cable systems that are used for the transmission of DC voltages and can include laminated or extruded cables designed for DC service.
In this new guide, we see recommended test voltages of 1.45 times the nominal voltage rating of the cable and test durations of 15 minutes for high-voltage cable. The guide also emphasizes safety related to high-voltage DC testing and provides several warnings on the importance of sufficiently long periods of time for grounding after testing.
HIGH POTENTIAL TESTING PERFORMED AT POWER FREQUENCY
As the name implies, this test method is based on using alternating current (AC) at the operating frequency (50/60 Hz) of the system as the test source. This method has the advantage of stressing the insulation comparably to normal operating conditions. Power frequency high potential testing is most commonly conducted by cable manufacturers. The withstand testing determines the dielectric strength of the insulation system and identifies gross defects. The test looks at the bulk of the insulation and renders a pass or fail conclusion. A further advantage of power frequency testing
CORPORATE ALLIANCE CORNER — ADVANCEMENTS
is that it allows partial discharge and dissipation factor (tan δ) testing for diagnostic purposes.
It should be noted that power frequency testing methods can be categorized as withstand or diagnostic.
• In withstand testing, insulation defects are caused to break down (fault) at the time of testing. Faults are repaired or removed, and the insulation is retested until it passes the withstand test. The withstand test is considered a destructive test.
• Diagnostic testing allows the relative condition of degradation of a cable system to be identified and establishes, by comparison with figures of merit, whether a cable system can or cannot continue operation. Diagnostic testing is considered nondestructive.
As a field test, power frequency testing suffers a serious disadvantage since at increased voltage levels, the test sets require heavy, bulky, and expensive transformers. Field portable AC high potential test sets of the power frequency variety are used worldwide for field testing vacuum bottles, switchgear, reclosures, circuit breakers, etc. Field portable units will typically offer ratings of 3 to 7 kVA and will be portable and cost-effective for the applications mentioned.
The reason large transformers are necessary when referring to cable testing has to do with the capacitance of the load being tested. Capacitive reactance (Xc) changes as a function of frequency as seen in this formula:
Therefore, if we are testing a 15 kV rated cable of approximately 10,000 feet, the capacitance


Your Trusted Source for HAEFELY / TETTEX Substation Test Equipment
would be around 1 uF. Based on the formula, the capacitive reactance at 60 Hz would be 2,654 ohms:
To apply the IEEE-recommended 22-kV test voltage would require a power supply rated for 8.3 amps, or 183 kVA:
vehicles to transport them to and from field job sites.
HIGH POTENTIAL TESTING PERFORMED AT VERY-LOW FREQUENCY (VLF)
Similar to power frequency test methods, if used alone, VLF testing is considered a Type 1, go-no-go test, but it can be used with auxiliary equipment for the purpose of Type 2 diagnostic testing. Auxiliary equipment can include partial discharge and/or dissipation factor (tan δ) couplers and measurement equipment.
The physical size and weight of a transformer capable of this rating is obviously not practical as a portable field unit.
The size of the necessary equipment can be substantially reduced by using the principle of resonance. If the effective capacitance of the cable is resonated with an inductor, the multiplying effect of the resonant circuit (its Q factor, presently between 50 and 120) will allow the use of a smaller test source. In the ideal case of a perfect resonance, the test source will only be required to supply enough energy to balance the true resistive loss in the inductor and cable system. One of two resonant circuits is normally used, either series or parallel. Even with the application of resonance, these power frequency high-voltage supplies can be quite large and heavy, requiring dedicated test
The main advantage of testing at very-low frequency is that it significantly reduces the size, weight, and cost of the required power supply and thus offers greater attraction for field testing medium-voltage cables. If the test frequency were dropped to 0.1 Hz, the capacitive reactance, as calculated earlier, becomes 1.6 megohms. The same 22 kV would now only draw 14 mA or 0.303 kVA. Therefore, the size, weight, and portability of the power supply becomes very convenient for field use. VLF power supplies can be constructed for either a cosine-pulse (rectangular) waveform or sinusoidal waveform output.
Cosine-Pulse Waveform VLF
The cosine-pulse waveform version is constructed using a DC test set that acts as the high-voltage source. A DC to AC converter then changes the DC voltage to the VLF
Table 1: Advantages and Disadvantages of the Cosine-Pulse Waveform
Advantages
Sinusoidal transitions in the power frequency range can initiate a partial discharge at an insulation defect. The 0.1-Hz pulse wave can then develop the defect into a breakthrough channel faulting the defect during the scheduled outage.
Due to continuous polarity changes, space charges cannot develop. Therefore, no new defects will be initiated during the testing process.
Cables can be tested with an AC voltage up to three times the normal phase-to-ground voltage with a device comparable in size, weight, and power requirements to a DC test set.
Disadvantages
When testing cables with extensive water tree damage or ionization of the insulation, VLF testing alone is often not conclusive.
Due to the layout of cosine-rectangular test voltage generation, the waveform is dependent on the length of the cable being tested. A DC offset or bias may be possible.
AC test signal. The converter consists of a high-voltage inductor (choke) and a rotating rectifier that changes the polarity of the cable system every 5 seconds. This generates a 0.1-Hz bipolar wave. A resonance circuit, consisting of a high-voltage inductor and a capacitor in parallel with the cable capacitance, assures sinusoidal polarity changes in the power frequency range. The use of a resonance circuit to change cable voltage polarity preserves the energy stored in the cable system. Only leakage losses have to be supplied to the cable system during the negative half of the cycle.
The intent of the VLF cosine-pule waveform test is to generate a 0.1-Hz bipolar pulse wave that changes polarity sinusoidally. Sinusoidal transitions in the power frequency range will then initiate a partial discharge at an insulation defect, which the 0.1-Hz pulse wave develops into a breakdown channel. During the test period, typically within minutes, a defect can be detected and forced to break through. After the defect breaks through and faults, it can then be located with standard, readily available cable fault locating equipment. Identified faults can then be repaired during the scheduled outage.
When a cable system passes the VLF test, it can be returned to service. The recommended testing time periods range from 15 to 60 minutes.
Sinusoidal Waveform VLF
The VLF test set generates sinusoidally changing waves that are less than 1 Hz (0.1 Hz, 0.05 Hz, or 0.02 Hz). When the local field strength at a cable defect exceeds the dielectric strength of the insulation, partial discharge starts. Local field strength is a function of applied test voltage, defect geometry, and space charge. After initiation of partial discharge, the partial discharge channels develop into breakthrough channels within the applied test period. When a defect is forced to break through, it can then be located with standard fault locating equipment during a scheduled outage. VLF testing guides usually recommended a test time duration of 60 minutes or less.
Test Duration and Voltage Recommendations For VLF
According to the IEEE 400.2 standard for acceptance testing cables ranging from 5 kV to
Table 2: Advantages and Disadvantages of the Sinusoidal Waveform
Advantages
Cables are tested with an AC voltage up to three times the normal phase to ground voltage. After initiation of a partial discharge, a breakthrough channel at a cable defect develops very rapidly and can be located during a scheduled outage.
Due to continuous polarity changes, space charges cannot develop. Therefore, no new defects will be initiated during the testing process.
Cables can be tested with an AC voltage up to three times the normal phase-to-ground voltage with a device comparable in size, weight, and power requirements to a DC test set.
Due to the sinusoidal regulated waveform and to the highest electrical tree growth rate as compared to the cosine-rectangular waveform, electrical trees will be initiated at a defect within minutes.
The test voltage level and waveform is defined as RMS voltage and is completely independent of cable length.
Disadvantages
When testing cables with extensive water-tree damage or ionization of the insulation, VLF testing alone is often not conclusive.
The total charging energy of the cable has to be supplied and dissipated by the test in every electrical period. This limits the size of the cable system that can be tested.
35 kV, cables that are tested between 2 Vo and 3 Vo (phase to ground), 68% of the failures occurred within 12 minutes; 89% within 30 minutes; 95% after 45 minutes; and 100% after 1 hour. These results were found using the sinusoidal and cosine-rectangular types of power supply waveforms with the most commonly used being the sinusoidal waveform.
Suggested maintenance testing is generally 15 minutes in length slightly above or below the phase to phase voltage using the sinusoidal wave. The reason for this is that the test is performed at 0.707 rms of the peak value, while testing using the cosine-rectangular
waveform the test is performed at a slightly higher voltage assuming the rms is equal to the peak value.
DISSIPATION FACTOR (TAN δ ) TESTING
Dissipation factor testing, also called tan δ or loss angle testing, is a diagnostic method of testing cables to determine the quality of the cable insulation. This is done to try to predict the remaining life expectancy and to prioritize cable replacement and/or injection. It is also useful for determining which other tests may be worthwhile, such as VLF withstand or partial discharge.
If the insulation of a cable is free from defects such as water trees, electrical trees, moisture, and air pockets, etc., the cable approaches the properties of a perfect capacitor (Figure 1). It is very similar to a parallel plate capacitor with the conductor and the neutral being the two plates separated by the insulation material. In a perfect capacitor, the voltage and current are phase shifted 90 degrees and the current through the insulation is capacitive.
If there are impurities in the insulation, like those mentioned above, the resistance of the insulation decreases, resulting in an increase in resistive current through the insulation. It is no longer a perfect capacitor. The current and voltage will no longer be shifted 90 degrees. The shift will be something less than 90 degrees. The extent to which the phase shift is less than 90 degrees is indicative of the level of insulation contamination, hence quality/ reliability. This loss angle is measured and analyzed (Figure 2).
The tangent of the angle delta is measured. This will indicate the level of resistance in the insulation. By measuring IRp/ICp, we can determine the quality of the cable insulation. In perfect cable insulation, the angle would be nearly zero. An increasing angle generally indicates an increase in the resistive current through the insulation, meaning contamination. Keep in mind, however, that different insulation materials have higher or lower dielectric losses.
Figure 2: Typical Model for Insulation
Figure 1: Ideal Model for Insulation
Table 3: Historical Figures of Merit for Condition Assessment of Service-Aged PE-Based Insulations (e.g., PE, XLPE, and TRXLPE) Using 0.1 Hz
Condition Assessment
VLF-TD Time Stability (VLF-TDTS) Measured by Standard Deviation at U0, [10-3]
Differential VLF-TD (VLF-DTD) (Difference in Mean VLF-TD)
Between 0.5 U0 and 1.5 U0 [10-3]
Mean VLF-TD at U0 [10-3] No Action Required <0.1 and <5 and <4 Further Study Advised 0.1 to 0.5 or 5 to 80 or 4 to
Therefore, the angle or tan δ value may be higher for some insulating materials due to their associated dielectric losses.
We must keep in mind that the goal of tan δ testing is to provide a quality/reliability indication of an insulating system. In a cabling system, terminations and splices are part of that system. If the system insulation and all accessories are free from defects such as water trees, electrical trees, moisture, and air pockets, etc., the cabling system approaches the properties of a perfect capacitor as stated earlier. It should also be noted that if the cable circuit has transitions between multiple insulation types — for example, XLPE transitioned to EPR — the tan δ value will be influenced by the component with the higher dielectric losses. In this example, EPR has a higher dielectric loss, and the circuit would need to be evaluated based on the EPR component. This obviously hampers the effectiveness of the test since contamination growing in the XLPE may be masked by the higher dielectric losses of the EPR.
When analyzing tan δ results, we look at the stability of the tan δ reading at a given test voltage, the mean value of tan δ, and the gradient of change in the tan δ value as test voltage is increased. IEEE Std. 400.2-2013 provides historical figures of merit tables to assist in evaluating data obtained from various insulation systems.
It is important to note that tan δ does not locate defects in cabling systems; it simply gives an indication of the insulation quality between point A and B in the system. Tan δ test results may justify conducting other analysis such as time domain reflectometry (TDR) or offline
partial discharge analysis and mapping to uncover possible locations of contamination and ionization.
Unfortunately, an extensive library of test values for all types of cables and accessories does not exist. Testing is typically done on a comparative basis. Keep in mind that the purpose of the test is to grade cables tested on a scale from high quality to low quality. The point of the testing is to help an asset owner prioritize cable replacement or injection. Comparative testing will show which cables are worse than others.
While it is beneficial to have previous tests to compare to for trending purposes, it is not absolutely necessary. The very first test on a cable will render valuable information. If the cable’s insulation is in good condition, the tan δ will change little as the applied voltage is increased. The capacitance and loss will be similar with 0.5 Vo or 1.5 Vo applied to the cable. If contamination is changing the capacitive/resistive nature of the insulation, then the tan δ will be higher at higher test voltages.
A tan δ measurement system consists of a high-voltage divider and measurement circuit. The high-voltage divider measures the voltage and current input to the cable and sends this information to the controller, where the voltage and current waveforms are analyzed and the tan δ number is calculated.
A voltage supply is required to energize the cable under test to the desired test voltage(s). Although power frequency can and is used in factory testing, VLF is typically the chosen power supply for field application. As
CORPORATE ALLIANCE CORNER — ADVANCEMENTS IN INDUSTRY
mentioned earlier, to test a cable with 60 Hz power requires a very high power supply. When testing in the field, it is not practical — or in many locations not possible — to test a cable of several thousand feet with a 60 Hz supply. A typical VLF frequency of 0.1 Hz takes 600 times less power to test the same cable compared to 60 Hz, providing a significant size, weight, and cost advantage in field testing.
Additionally, the magnitude of the tan delta numbers increases as the frequency decreases, making measurement easier. As the following equation shows, the lower the frequency (f), the higher the tan δ number.
SUMMARY
In Part 2 of this series, we explored high potential testing techniques including Type 1
tests such as DC high potential, power frequency high potential, and VLF high potential. We also reviewed Type 2 diagnostic tests such as tan δ. In Part 3 of this series, we will focus on on-line and off-line partial discharge testing.

Thomas Sandri is Director of Technical Services at Protec Equipment Resources, where his responsibilities include the design and development of learning courses. He has been active in the field of electrical power and telecommunications for over 35 years. During his career, Tom has developed numerous training aids and training courses, has been published in various industry guides, and has conducted seminars domestically and internationally. Thomas supports a wide range of electrical and telecommunication maintenance application disciplines. He has been directly involved with and supported test and measurement applications for over 25 years and is considered an authority in application disciplines including insulation system analysis, medium- and high-voltage cable, and partial discharge analysis, as well as battery and DC systems testing and maintenance. Tom received a BSEE from Thomas Edison University in Trenton, New Jersey.
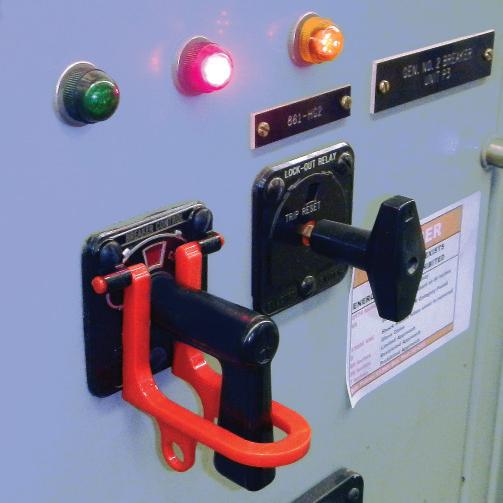
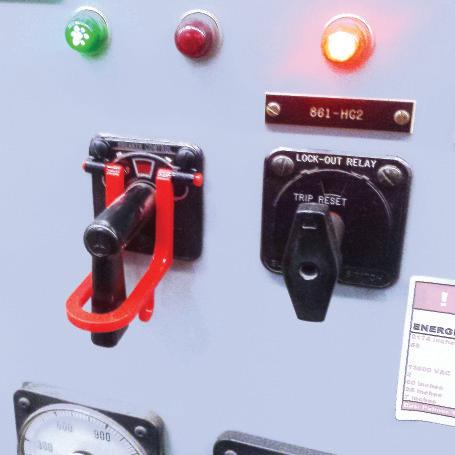
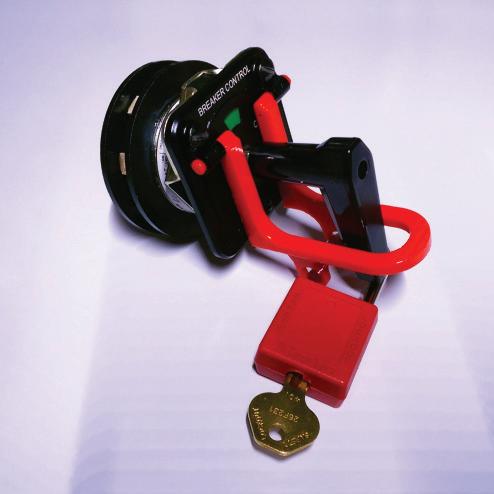



March 8 – 12, 2023 | Wednesday – Sunday
Rosen Shingle Creek | Orlando, Florida


OMICRON electronics: LEADING WITH PEOPLE
NETA’s Corporate Alliance Partners (CAPs) are a group of industry-leading companies that have joined forces with NETA to work together toward a common goal: Improve quality, safety, and electrical system reliability.

In our continuing CAP Spotlight series, NETA talks to Jackie Peer, Head of Strategic Business Development about the thought leadership and subject-matter expertise at OMICRON electronics.
NWJ: What are the biggest challenges facing your company right now?
Peer: This is the magic question for many of us these days! Here at OMICRON, we are fortunate to experience continued growth. As a result, new opportunities are always being created for our employees to meet the business needs, and at the same time, we are investing in new talent to join our team from entry level to senior positions. I think what gives us an upper hand is offering flexible options for where and how employees work, and I must mention our culture — it’s quite unique and appealing!
Supply chain is a given for everyone — the key is how you manage the situation. A huge contributor to OMICRON’s success is our investment into R&D. We continually feed our innovation cycle and offer new technology and solutions as a result. As you can imagine, this process can be complicated because of supply chain shortages and lead times. I’m proud of
our teams that manage product development and component procurement. They are doing an excellent job at staying on top of the issues to help us provide testing products to our customers.
NWJ: What are the biggest challenges facing your customers?
Peer: Our customers have similar challenges to most of industry when it comes to hiring and retention — it’s still a competitive market for talent. Those who are winning the hiring race are offering more than good pay. They are also offering flexible options for remote work, hybrid office and work-from-home scenarios, vacation, training, opportunities for advancement, etc.
Managing supply chains is testing many of us (no pun intended), and at the same time, we are proving to be resilient in the face of such challenges. Right now, we are dealing with two-, three- or even-more-year lead times on
JACKIE PEER
CORPORATE ALLIANCE CORNER — PARTNER
transformers, and the same holds true for bucket trucks and even for some of the electronics and components that go into products. I love hearing the examples of mutual aid where one utility comes to the rescue of another to keep the lights on by offering a spare transformer or sending line crews to help in restoration efforts.
Putting aside the challenges, the big one goes back to decarbonization efforts. Some states have arguably aggressive goals that in turn expedite things like integration of renewables into the mix. This has changed so much from the way utilities performed in decades past. Decentralized generation and control, bidirectional power flow, distribution, and transmission builds — all of these have their own challenges especially when combined with aggressive schedules and supply chain and resource challenges.
NWJ: Which industry trends are you keeping an eye on?
Peer: I’ve been keeping my one on the carbon reduction efforts. Electric vehicle (EV) mandates, adoption, and building infrastructure are headliners for sure. Sometimes it appears that the cart might be ahead of the horse when it comes to mandates and having an infrastructure in place to make the crossover seamless from fuel-based vehicles to electric. I’m also keeping a close eye on alternative forms of generation such as offshore wind and pumped storage as examples — this is fun if you ask me!
NWJ: Which new technologies affecting the industry are changing the way you work?
Peer: None, personally; however, automation and AI are big ones for our industry. I don’t fear them. I feel they create opportunities to improve safety and the dignity of work for our workforce, and at the same time, free many workers up for new and exciting work — and do so safely.
NWJ: What do you predict will impact your business most in the near future?
Peer: Our people. Industry trends will come and go. Technology will continue to advance,

and we will adapt. In my mind, people and their diversity of thought and opinion, individual creativity, and experiences will influence how we do our work for the better. Our people are our greatest assets!
NWJ: Is this a good time to be in the electrical power testing business?
Peer: Of course! This is an exciting time to work in electric power. Monitoring, testing, and commissioning are critical to the process of ensuring the delivery of safe and reliable electric power. Whether we are talking about new buildouts or upgrades to existing infrastructure, protection, control, and communications assets must be tested. No one wants to be in a situation where the system mis-operates and the root cause is improper settings or logic or a wiring error that could have been detected if proper testing had been performed. What we do, providing testing products, is a critical step in ensuring safe and reliable electric power.
NWJ: If you could change one thing about how your business operates, what would it be?
Peer: I would love to see more women in technical positions, not only at my company, but in industry, and especially in power system protection and electrical testing. Diversity of all types is important, and we can’t underestimate the importance of gender diversity.
OMICRON Campus at Night
NWJ: What advice do you have for young people entering the field?
Peer: Where do I start? I think I can boil it down to this being the most exciting time in history to work in electric power. Whether you are working in electrical testing, manufacturing, consulting, etc., we all have critical roles to play in electric power — arguably the most important of all critical infrastructures serving society.
I wish I would have been told to just be myself. Individuality is so key to the diversity of our workforce, and so many benefits result when diversity is in place. Don’t try and be like someone else — just be you!
NWJ: How important is mentoring in the electrical testing field and why?
Peer: I’ve spent most of my career mentoring and advocating for the next generation workforce. When it comes to workforce
development, I believe a combination of training and education along with mentoring is critical to one’s success. Our experienced workers possess a tremendous amount of knowledge and experiences that can’t be learned from a textbook or course but are better learned from someone who’s walked the walk. I like to share my lessons learned — where I’ve stubbed my toes as well as my successes and how I did it. This provides less-experienced folks with examples to consider as they go through their own learnings in their career.
NWJ: What strategies will keep professionals growing and learning?
Peer: Self-motivation all the way. You can’t force someone to learn and grow. Their desire to grow must come from within. I’ve always believed that to grow, you must get out of your comfort zone. You don’t grow when you are comfortable. When I’m uncomfortable, I know I’m learning.


ANSI/NETA STANDARDS UPDATE
ANSI/NETA MTS–2019 REVISION IN PROCESS
A standards revision is in process for ANSI/NETA–2019, Standard for Maintenance Testing Specifications for Electrical Power Equipment and Systems, 2023. The recirculation ballot and public comment period ended on December 18, 2022. The Standards Review Council will review all comments for consideration by the end of January. The revised edition of ANSI/NETA MTS is scheduled to debut at PowerTest 2023 in Orlando, Florida, in a PDF format and in hardcopy thereafter.

WWW.NETAWORLD.ORG
ANSI/NETA MTS contains specifications for suggested field tests and inspections to assess the suitability for continued service and reliability of electrical power equipment and systems. The purpose of these specifications is to assure that tested electrical equipment and systems are operational and within applicable standards and manufacturers’ tolerances, and that the equipment and systems are suitable for continued service. ANSI/NETA MTS–2019 revisions include online partial discharge survey for switchgear, frequency of power systems studies, frequency of maintenance matrix, and more. ANSI/NETA MTS–2019 is available for purchase at the NETA Bookstore at www.netaworld.org
ANSI/NETA ECS–2020 NEXT REVISION SCHEDULED
ANSI/NETA ECS, Standard for Electrical Commissioning of Electrical Power Equipment & Systems , will be revised following the American National Standard process. The next edition of the standard is scheduled to begin the American National Standard revision process in 2023, with a scheduled release in 2024. ANSI/NETA ECS–2020 supersedes the 2015 Edition.
ANSI/NETA ECS describes the systematic process of documenting and placing into service newly installed or retrofitted electrical power equipment and systems. This document shall be used in conjunction with the most recent edition of ANSI/NETA ATS, Standard for Acceptance Testing Specifications for Electrical Power Equipment & Systems The individual electrical components shall be subjected to factory and field tests, as required, to validate the individual
components. It is not the intent of these specifications to provide comprehensive details on the commissioning of mechanical equipment, mechanical instrumentation systems, and related components.
The ANSI/NETA ECS–2020 Edition includes updates to the commissioning process, as well as inspection and commissioning procedures as it relates to low- and mediumvoltage systems.
Voltage classes addressed include:
• Low-voltage systems (less than 1,000 volts)
• Medium-voltage systems (greater than 1,000 volts and less than 100,000 volts)
• High-voltage and extra-high-voltage systems (greater than 100 kV and less than 1,000 kV)
References:
• ASHRAE, ANSI/NETA ATS, NECA, NFPA 70E, OSHA, GSA Building Commissioning Guide

ANSI/NETA ECS-2020
REVISION IN PROCESS
PARTICIPATION


CERTIFICATIONOF ELECTRICAL
Comments and suggestions on any of the standards are always welcome and should be directed to NETA.
To learn more about the NETA standards review and revision process, to purchase these standards, or to get involved, please visit www.netaworld.org or contact the NETA office at 888-300-6382.
ANSI/NETA ATS–2021
LATEST EDITION
ANSI/NETA ATS, Standard for Acceptance Testing Specifications for Electrical Power Equipment & Systems, 2021 Edition, completed an American National Standard revision process and was published in the Spring of 2021.
ANSI/NETA ATS covers suggested field tests and inspections for assessing the suitability for initial energization of electrical power equipment and systems. The purpose of these specifications is to assure that tested electrical equipment and systems are operational, are within
applicable standards and manufacturers’ tolerances, and are installed in accordance with design specifications. ANSI/ NETA ATS-2021 new content includes arc energy reduction system testing and an update to the partial discharge survey for switchgear. ANSI/NETA ATS-2021 is available for purchase at the NETA Bookstore at www.netaworld.org
ANSI/NETA ETT–2022
LATEST EDITION
ANSI/NETA ETT, Standard for Certification of Electrical Testing Technicians , completed the American National Standard revision process. ANSI administrative approval was granted January 7, 2022. The new edition was released at PowerTest in March 2022 and supersedes the 2018 edition.
ANSI/NETA ETT establishes minimum requirements for qualifications, certification, training, and experience for the electrical testing technician. It provides criteria for documenting qualifications for certification and details the minimum qualifications for an independent and impartial certifying body to certify electrical testing technicians.
ANSI/NETA ATS-2021
ANSI/NETA ETT-2022

ALAN “AL” PETERSON
January 27, 1939 — August 14, 2022
NETA and the electrical testing industry have lost another giant – Alan “Al” Peterson — whose influence across the industry and the love and respect he enjoyed from employees and friends point to a man with rare talents.
Al received his formal education in electrical engineering at Northeastern University in Boston and completed various advanced studies at the Massachusetts Institute of Technology in Cambridge, Massachusetts. He was first employed by Brockton Edison Company (now National Grid) through Northeastern University’s Cooperative Program working in
the meter, line, and engineering departments. Al was inducted into the U.S. Army and served his entire term of service as an instructor at the U.S. Army Ordinance Guided Missile School at Redstone Arsenal, Alabama. He held Journeyman and Master Electrician certificates in several states.
Established by Alan and Shirley Peterson in 1963, Utility Service Corporation (USC) has specialized in electrical power system testing and maintenance for over 50 years, working in utility, industrial, and commercial power applications, troubleshooting, and repair. As
Al and Shirley Peterson at a PowerTest Dinner
a team, Al and Shirley created legacies and established a high caliber of excellence in the industry.
“ Al Peterson was a family friend as well as a mentor to a young man from Boston,” remembers Scott Blizard, Vice President and COO of American Electrical Testing Co. and fellow NETA Board member, who served with Al on several NETA committees. “I met Al in my 20s and enjoyed many evenings with Al and his lovely wife Shirley over the next 30plus years. Al possessed an amazing amount of knowledge and a memory to match, and he shared it with all who would listen. NETA is a much better organization today thanks to Al’s involvement.”
Utility Service Corporation became a NETA Accredited Company in 1983, and Al served on the NETA Board of Directors from 1984 until his death, holding the offices of President, First Vice President, and Second Vice President. He served on several NETA committees, was currently the Technical Committee Chair and a member of the Standards Review Council, and was instrumental in the writing and acceptance of ANSI/NETA ATS and ANSI/NETA MTS as national standards.
“I first met Al Peterson sometime around 35 to 40 years ago,” remembers NETA Treasurer John White, past-President of Sigma Six. “It was likely at a NETA conference, and that was the start of a very positive impression of Al. He was truly a gentleman and a scholar. Over the years of being on the Board with him, I learned that he was very knowledgeable in the area of electrical engineering.”
“It was my honor to serve as Al’s liaison to the Standards Review Council for many years,” notes Kristen Schmidt, former NETA Technical Services Director, now a Training Specialist at RESA Power. “He made the work rewarding in a way that carried me through tough times and celebrated all the successes we had together as a team with all our other NETA friends and family.”

USC employees looked forward to quality time with the boss.
SERVING THE INDUSTRY
As his company and reputation grew, Al found himself participating in multiple organizations dedicated to developing industry standards that would make the work safer for those who carried it out.
In addition to serving on the National Board of Directors of AIECA, now Independent Electrical Contractors (IEC), where he held the offices of National Vice President and National Treasurer, Al was also a member of the American National Standards Institute (ANSI) and served three three-year terms as a member of the ANSI Board of Standards Review (BSR).
Prior to his appointment to the BSR, he served on ANSI’s Electrical and Electronic Standards Board.
The late Charles K. Blizard, Sr, a good friend and colleague for over 40 years, recognized Al’s achievements in a NETA World article

celebrating the 2008 NETA Outstanding Achievement Award. “Al and I are a lot alike,” he said. “We worked together well on NETA’s Standards Review Council because we provided a balance to the electrical theorists on the committee with our perspective from the practical aspects of testing. Al was really the one who was persistent with getting NETA involved with ANSI. He was the prime mover and promulgated our cause through his tact.”
White adds, “Al was NETA’s guru in the area of dealing with other professional associations like NFPA and IEEE. It was important to NETA to be able to interface with these other standard writing organizations, and Al developed both the contacts and the knowledge to guide NETA in the correct direction when dealing with them.”
“NETA has a long history of leadership and volunteer contributors who have made the Association what it is today, and at the top of that list is Al Peterson,” says Ron Widup, NETA Board member and Vice Chairman and Senior Advisor, Technical Services for
Shermco Industries. ”As Chair of the Standards Review Council, Al was instrumental in the development, navigation, and ultimately the publishing of NETA’s first ANSI standard, the 2000 Electrical Test Technician (ETT) standard. This started our journey into standards writing and forever changed NETA into a serious contributor to our industry. I was President of the Association at the time ETT was first published and was fortunate to announce the standard and recognize Al for his work. He was proud of it, and we were proud of him.”
“Al is a man who will not be forgotten,” White says. His work at NETA will live on, and his legacy among our ANSI standards will be present forever.”
As a member of the Institute of Electrical & Electronic Engineers (IEEE), Al also participated on various IEEE technical committee working groups, specifically ANSI/ IEEE C-37 Power Switchgear, ANSI/IEEE C-57 Transformers, and ANSI/IEEE C-62 Surge Protection.
John White, Al Peterson, Ken Bassett, and Ron Widup
“The standards and guidelines Al worked so hard on were developed by some of the most brilliant minds in the industry, and Al was one of those brilliant minds,” notes Angela Russell, who enjoyed a 17-year career with USC’s Technical Services and Project Management Team and was Al’s liaison to NETA. “Great minds do great things, and he was definitely a great mind doing great things. Anyone who has ever used or will use a NETA standard will benefit from
his contribution to the power industry. Not many people can take credit for leaving behind something vital for future generations.”
Al represented NETA as a member of the National Fire Protection Association’s (NFPA) High Voltage Task Force, which was formed in 2008 for the purpose of adding provisions covering high- and medium-voltage installations to the National Electrical Code
ALAN “AL” PETERSON
A GREAT MAN, A GENTLEMAN, AND A SCHOLAR
Alan “Al” Dennis Peterson of Huntsville, Alabama, and Eastham, Massachusetts, passed away at 83 years of age on Sunday, August 14, 2022. The first of seven children born to John and Margaret (Sweeney) Peterson of Stoughton, Massachusetts, he grew up in Stoughton, attended Northeastern University, and completed advanced studies at Massachusetts Institute of Technology in Cambridge, Massachusetts. He was first employed by Brockton Edison Company — now National Grid — where he met his wife, Shirley.
Al was inducted into the U. S. Army and served his entire term of service as an instructor at the U. S. Army Ordinance Guided Missile School at Redstone Arsenal, Alabama. In 1963, he and Shirley established Peterson Electric Company of Huntsville, and in 1976, they founded Utility Service Corporation.

Alan “Al” Peterson
Alan was a 4th Degree Knight of the Knights of Columbus and a member of Holy Spirit Catholic Church in Huntsville, Alabama, Civitan International, the Elks of Huntsville, Moose International, Civil War Roundtable, and the American Legion. He also served on the National Affairs Subcommittee of the United States Chamber of Commerce.
Al loved splitting his time between his home in Huntsville and his beach house in Eastham, Massachusetts. He was always ready to raise a toast and tell an enthralling story. He was an avid reader, a lover of good wine, and loved history.
He is survived by his wife of 60 years, Shirley (Wright); son John (Pamela); son David; daughter Jacqueline (Sean) Dougherty; grandchildren Kyle, Alycia, and Kaelie Peterson; great-grandchildren Saida and Althea Peterson; siblings Juliana McGovern; Virginia (Donald) Delaney; William (Max Most) Peterson; Steve (Linda) Peterson; Ellen Curran; Joan (Phil) Clark; and many beloved nieces and nephews.
(NEC) for 2011. This task force was extended to address changes and additions to the NEC for 2014 and 2017.
Eric Beckman, PE, NETA President and Director at National Field Services, says, “Al was such a highly respected person in the industry. I didn’t get the opportunity to know Al as well as some of the other NETA Board, but I could tell how much respect and knowledge he had in the industry just by the way people talked about him. Al did so much for NETA and the electrical testing world. There’s no doubt that NETA has gained so much recognition and respect because of the work Al put in over the course of his career.”
USC General Manager Jacob Schrimsher remembers, “Al was more than just a businessman. He had in-depth knowledge of every facet of business and life, and he loved to share it with his people. No matter where we went — and we traveled all over — people would stop us to talk to him. He had a very broad reach, and it was obvious everyone loved and respected him.”
“We lost a good one when we lost Al Peterson,” says Widup, “but fortunately his work and legacy will continue to make NETA a great technical trade association and difference-maker for our industry. He will be greatly missed, but his mentorship, charisma, and laugh will never be forgotten by those who knew him.
A GENTLEMAN AND A SCHOLAR
“Al was always engaging, never short on stories on just about everything, and he was a phenomenal encyclopedia of information,” remembers Ron Widup. “It always amazed me how Al knew so much about so much… and his presentation skills were like no other. Especially when there was an element of humor in his stories — and often there was — his deep belly laugh and verbose delivery would turn heads from all around the room!”
Al was known for his extensive knowledge of military history. “He could quote military personalities from all the various wars in which
the U.S. has been involved and discuss a certain U.S. general’s strategy down to minute detail,” White says. “I recall a group dinner when my sister (a Canadian) had joined us for dinner and we were having a military discussion with Al about the War of 1812. I had spent hours studying that particular war as my sister and I used to debate it often. But when he joined the conversation, it was as if I knew very little about that war compared to Al.”
Schrimsher worked his way through every position over his 12 years with USC. “I learned a lot about business and how to succeed from Al, but perhaps the most important lessons were about being a good person,” he says. “Al genuinely cared for each employee as a person, and he was concerned about the well-being of every family.”
Beckman remembers the stories. “Al always had a way of making the conversation interesting,” he says. “I always loved hearing his war stories of testing projects and the interesting outcomes of various projects.”
“Al’s presence was bigger than life,” says Russell. “He was one of those people who would have the entire room’s attention while he told one of his epic stories. He was automatically your best friend — like you had known him forever. You could talk to him about anything and connect about everything in an instant.
Schmidt remembers, “Al was someone you just couldn’t get enough of. His toothy smile, booming voice, and unmistakable laughter filled every room he occupied and made everyone want to be in on the joke. Al’s generosity of spirit always made you feel like you were capable of anything because, by gum, he believed in you. And if a man as accomplished and well-traveled as Al Peterson knew it to be true, then it must be so.”
“Al and I shared a love of fine wines,” White says. “It was always a challenge and a pleasure to choose a wine to share with Al at dinner. And if the dinner wasn’t to include wine, then Al always had a Heineken beer. That was his cocktail-hour choice of drink.


PETER “PETE” SHERMAN
March 26, 1939 – September 24, 2022
One person can make a difference, and everyone should try.
William Barclay said, “There are two great days in a person’s life — the day we are born and the day we discover why.” On March 26, 1939, Peter Alan “Pete” Sherman was born, and it was a great day.
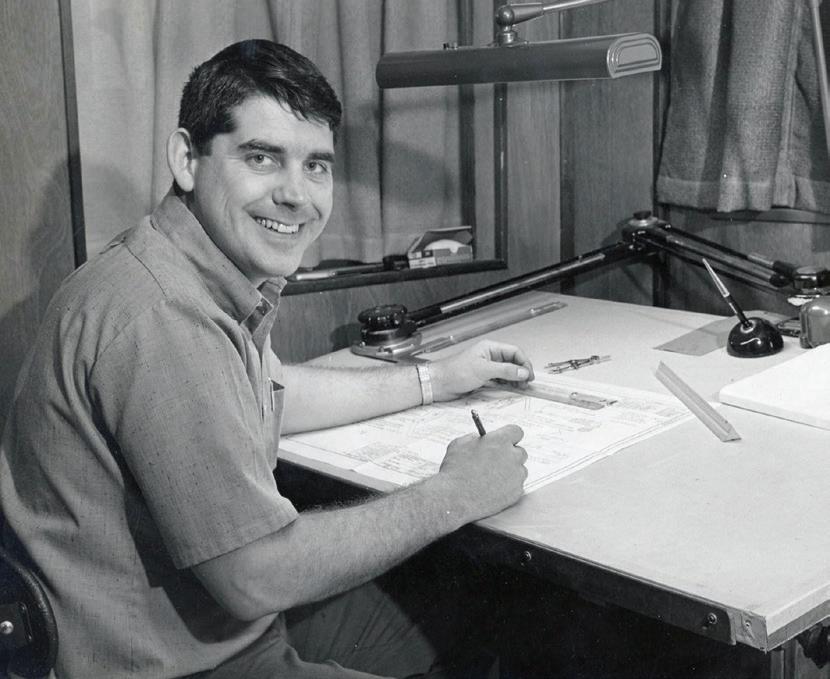
Bigger than life and full of love and never-ending generosity, Pete’s biggest joy in life was taking care of everyone around him, spending time with his family, traveling, relaxing with his beloved dogs, enjoying good wine and the occasional Dallas Cowboys victory — though there weren’t as many victories as he would have liked!
Born and raised in Dallas, Texas, Pete was a proud Texan. Always the patriot and proud of his country, he was a member of the Army National Guard, serving his country with pride and distinction and graduating from the U.S. Army Artillery and Missile School at Fort Sill, Oklahoma, in September 1961. During and after college at the University of North Texas, he worked for his father’s company, Trio Aviation.
TRIO AVIATION TO SHERMCO
His time at Trio formed the foundation for his success. They focused on avionics and aircraft infrastructure, part of which was
Pete Drafting in the Early Days at Trio
Pete and Virginia Sherman
electrical alternators and other electrical assets. It was there that his dad helped him get started in the next chapter of his life: Shermco Industries.
Seeing an opportunity to break out and form his own business, Pete left Trio in 1974 and started Shermco. From Sarge Howell hoisting the United States flag on the first day in business to the hiring of Vietnam veterans to do the work, Shermco began its journey.
Initially specializing in aircraft electrical power systems and electric motor repair, Shermco also serviced 400-cycle alternators for the government. Pete tells the story that at one time every B52 aircraft in the U.S. fleet likely had a Shermco-serviced generator on board!
A NETA ACCREDITED COMPANY
In the early 1980s, Shermco expanded its engineering services and became a NETA Accredited Company. The business grew and became one of the premier electrical engineering, electrical power, and rotating apparatus service companies in North America and one of the most respected NETA companies in the industry.
Pete positively impacted hundreds of his Shermco family. Through his loving, caring, and nurturing
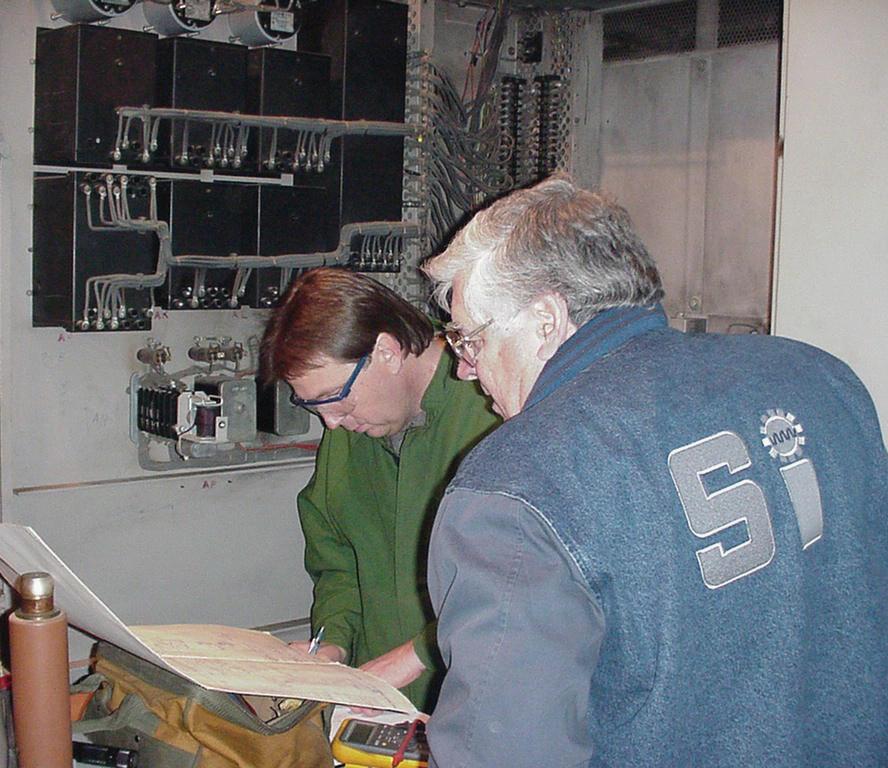
characteristics and servant-leadership skills, he was somebody you wanted to work for. He was truly a unique leader and “one of the good guys.”
FINDING OUR WHY
On September 24, 2022, Peter Alan Sherman unexpectedly and tragically passed away — and it was not a good day — but we leave you with this. At the beginning, we provided the Barclay quote, “There are two great days in a person’s life — the day we are born and the day we discover why.”
All of us who knew Pete Sherman share a common bond: Having known Pete and being lucky enough to have him in our lives, we can all take comfort in knowing that his positive
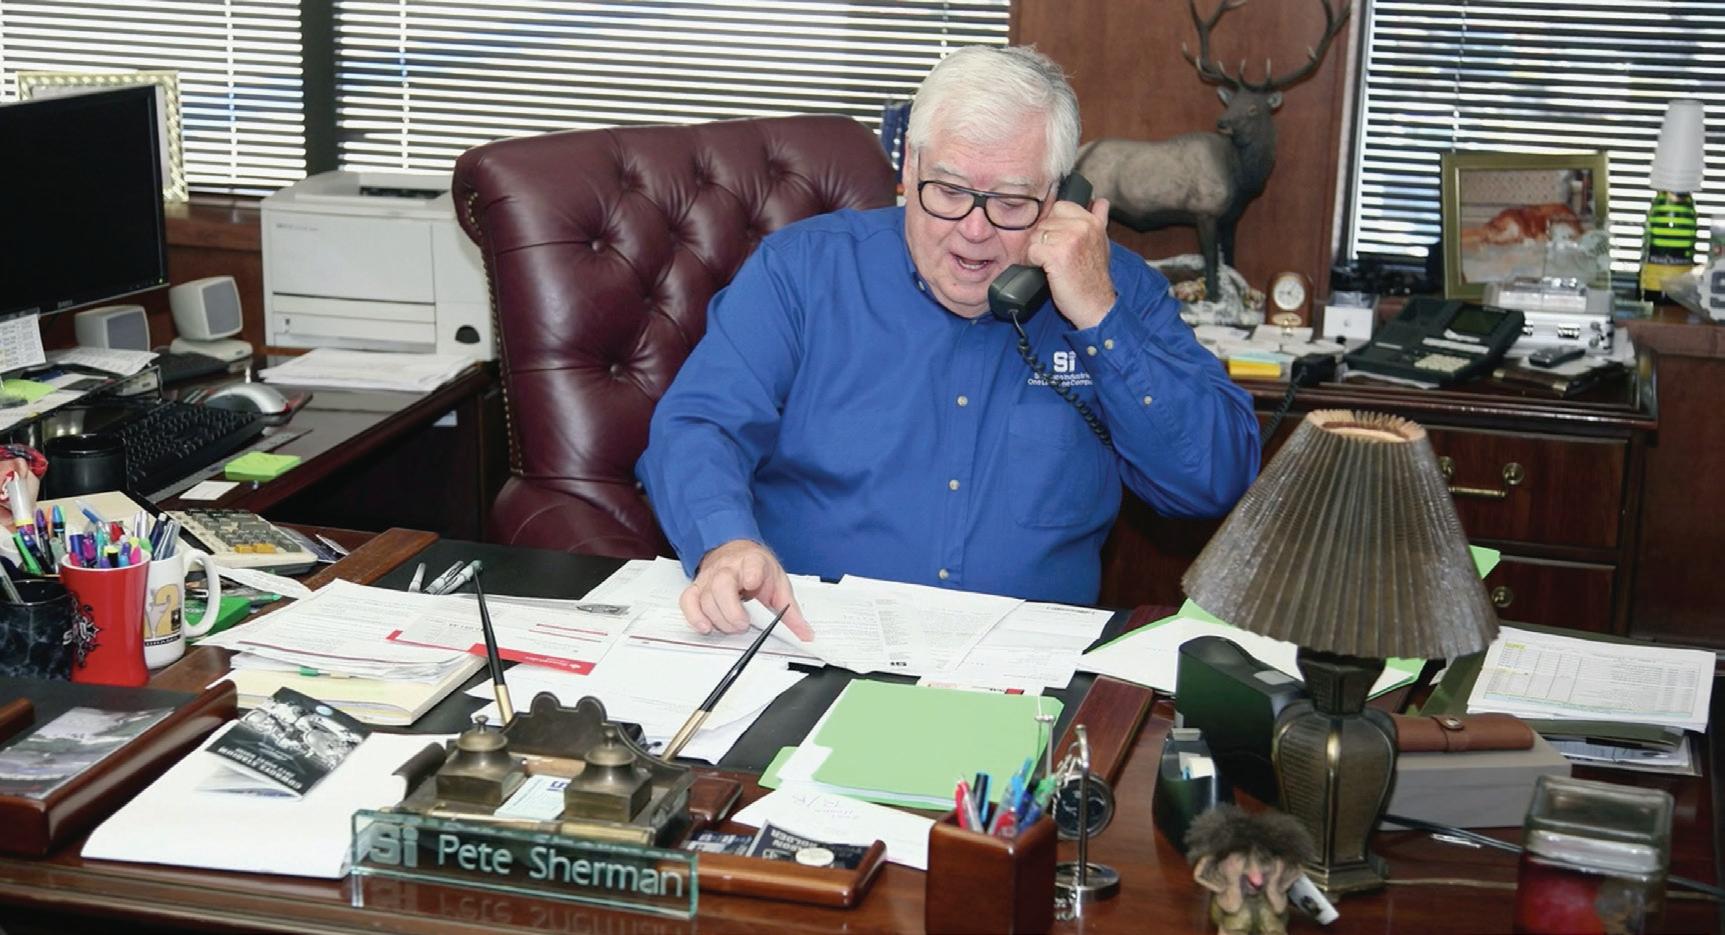
Pete and Ron Widup Studying Plans
influences were beneficial to everyone. For us, it’s our day of discovery. It’s our why.
Rest in peace, Pete.
EPILOGUE
From Pete’s retirement speech to the Shermco employees in December 2012:
There will always be change in life…
And it’s how we react to change and what we do with the opportunities that makes us better and stronger.
I hope that I will still be there in your hearts and minds because I guarantee that YOU will be in mine.
Have a great time as you continue to grow in your life and provide for your family.
PETE SHERMAN
HUSBAND, FATHER, AND FRIEND TO ALL
Peter Alan “Pete” Sherman, 83, passed away on Saturday September 24, 2022. He was born on March 26, 1939 and raised in Dallas, Texas. A 1958 graduate of Thomas Jefferson High School in Dallas. A member of the National Guard, he graduated from the U.S. Army Artillery and Missile School at Fort Sill, Oklahoma, graduated from officer candidate school as a lieutenant, and went on to serve his country with pride and distinction.

Peter “Pete” Sherman
Pete is survived by his beloved wife of 43 years, Virginia Sherman; daughter Missy Sherman-Balthrope; son John Sherman (Stephanie); son Larry Truitt (Allison); son Everett Truitt; daughter Leslie Schultea (Dennis); and eight grandchildren: Lauren Truitt, Brooke Balthrope, Sarah Schultea, Carter Truitt, William Balthrope, Price Schultea, London Sherman, and Brody Sherman. He also has two sisters: Susie Sherman and Dora Worrell.
He is preceded in death by his mother Mildred Sherman, father Jack Sherman, brother Jack “Jackie” Sherman, and granddaughter Grace Schultea. He is also preceded in death by his nephew, godson, and military hero, U.S. Army Major Matthew “Bubba” Worrell.
Pete loved to spend time with his family, friends, and prized golden retrievers at his home in the mountains of Red River, New Mexico. Getting away to the mountains any chance he could was a special pleasure in his life. Pete and his wife Virginia also enjoyed traveling around the world on cruises. Learn more about Peter Sherman is this memorial video: https://vimeo.com/756866426/4123d77c5c.
Introducing NETA Series III Handbooks

We’ve got answers. Discover page after page of comprehensive, component-specific, technical resources for training and reference purposes. Over 200 of the very best articles from NETA World Journal and technical presentations from NETA’s PowerTest conferences. To order, please visit netaworld.org or call 888.300.6382
2023 – NEW PRODUCT FORUM
AMBLYONIX INDUSTRIAL INSTRUMENT
www.amblyonix.com
The Model 800 HV Tester
The Model 800 Wireless HV Phase Tester measures phase sequence and real-time phasing relationships on power lines up to 110 kV using Bluetooth to communicate with the hand-held interface to provide measured values as well as audible indications. A brightly back-lit display indicates phasing, phase angle, frequency, and vector diagrams instantaneously and accurately. The telescoping fiberglass poles make for a lightweight and portable package.
A-RENT TEST EQUIPMENT
www.a-rent.com
New Location for A-Rent
A-Rent announces the launch of a new location in Houston, TX. Originally founded in Chicagoland in 2019, A-Rent successfully serves NETA customers nationwide with equipment rentals and calibration services. Over the course of the past four years, we have seen tremendous growth and are eager to bring our top tier service and equipment locally to Texas.
ECP SOLUTIONS
www.ecpsolutions.com/ ON-DEMAND CACHE
ECP Solutions announces On-Demand Cache, a is a digital ledger that records all transactions on a peer-to-peer network, including currency transfer, contracts, records, and other types of data. It’s decentralized, so there’s no need for a central certifying authority. All information is encrypted and every occurrence recorded, meaning it cannot be altered, and the information can be shared securely across multiple providers.
EGALVANIC, LLC
www.egalvanic.com
New Analytics
Solution
eGalvanic (eG) provides a sophisticated, end-to-end analytics solution for electrical distribution systems that
synthesizes data generated by the business processes of facilities managers, electrical contractors, and testers, as well as the streams of information captured by IoT sensors, to provide comprehensive understanding of critical power system condition. eGalvanic is a methodology and a suite of technology solutions that break down the barriers in our clients’ informational siloes, and enable them to harness the power of data. A predictive maintenance platform that unites electrical experts with data driven capabilities to realize the power of insight.
ENERGY MAINTENANCE TECHNOLOGIES LTD.
www.emt.global
MULTI-MODE SF6 & ECO GAS ANALYSER FROM EMT
Energy Maintenance Technologies has released the new Zerowaste Eco+, the world’s first 4in1 insulating gas analyser. The unique technology can determine the quality of SF6 insulating gas, and the blend and purity of SF6 alternative gases: Novec 4710 (g3) & 5110 and Dry/Clean Air systems. This allows users to test any insulating gas and its breakdown products on one portable, easy to use instrument within 1-2 minutes.
EXSERO SOFTWARE
www.exserosoft.com
ASPECT
ASPECT electrical/mechanical inspection and report generating software was developed on-site during production inspections by Level III Thermographers and highly experienced developers to streamline the inspection process and reduce the report post processing time to 15 minutes. The goal achieved is a dramatic improvement in the user experience and how to make the change to a vastly improved IR inspection and reporting software seamless and easy. And ASPECT is more than just an unparalleled IR inspection and reporting software; it’s a data management resource that’s easy to use and we invite you to give it a test drive at NETA PowerTest 2023.
HIPOTRONICS, INC.
www.hubbell.com/hipotronics/en
The D149-DI
Hipotronics has perfected its latest version of the Dielectric Breakdown System for testing in accordance with both National and International Standards. The D149-DI is an AC or DC high voltage breakdown test system with outputs up to 100kV. The unit features a fully automatic mode to complete the multiple test procedures to simplify the testing process. Dielectric Breakdown testing is a vital part of the R&D process for creating new materials that will build the future.
HV TECHNOLOGIES, INC.
www.hvtechnologies.com
The DDX 9160 & DDX 9161 Digital Partial Discharge Detectors
The DDX 9160 and DDX 9161 are the newest fully digital and state-of-the-art PD detectors from Haefely! Choose between a battery-operated (DDX 9160) or laboratory optimized (DDX 9161) version. These highly versatile detectors can accommodate up to four simultaneous PD/ RIV and Voltage channels as well as internal measuring impedances to reduce the number of components within the PD circuit. The fully galvanic isolation design with fiberoptic cables provides excellent interference suppression and highest safety levels for operating personnel. A modern and intuitive software allows for hassle-free and easy partial discharge analysis on any type of test object.
MADISON TESTING & ACQUISITION SERVICES, LLC
www.madisontesting.com
MadTest EB30
Madison Testing & Acquisition Services LLC, introduces the EB30 breakout adapter. The MadTest EB30 is specifically designed to work with Eaton Magnum DS Low-voltage Power Circuit Breakers. The EB30 allows a test technician to easily access and test the A & B auxiliary contact blocks with clearly displayed connection points.
Now, you can eliminate the worry of cross connection and develop repeatable, consistent procedures that deliver reliable results. Our adapter is easy to use, fast, safe, and consistent giving you reliable results and better productivity.
PROTEC EQUIPMENT RENTALS
www.protecequip.com
New Products Added to our Rental Fleet
Protec continues its annual multi-million-dollar investment into its rental fleet, most recently adding the HV Diagnostics Digi-Bridge Sheath Testing & Fault Locating Device; Fluke FEV100/TY1 & Megger EVCC300 EV Charging Station Testers; Megger STX40 Cable Fault Locating System; Raytech Mini-ATOS; and the Phenix 6CP200/100 Dielectric Test set.
UTILITY RELAY COMPANY
www.utilityrelay.com
AC-PRO-Grand
Utility Relay Company is proud to introduce AC-PROGRAND™, a portfolio-expanding addition to our ACPRO® family of low voltage circuit breaker modernization solutions. When more than retrofitting is needed and downtime must be minimized, think AC-PRO-GRAND™.
VOYTEN ELECTRIC AND ELECTRONICS
www.voyten.com
Factory New Eaton attachments for SPB breakers
Factory New Eaton attachments for SPB breakers will be made and supported by Voyten in the upcoming 2023 year! These include UVR’s, Shunt Trips, Aux Switch Assemblies, Motor Operators, and Spring Release assemblies. Our goal is to have all the voltages in stock and ready to ship! This continues our single point quoting support for all Factory New SPB breakers and parts. In addition, we are stocking Factory New Digitrip 510 and 910 programmers, rating plugs, and retrofit kits for the DS/DSII/SPB product line with ARMS upgrades.
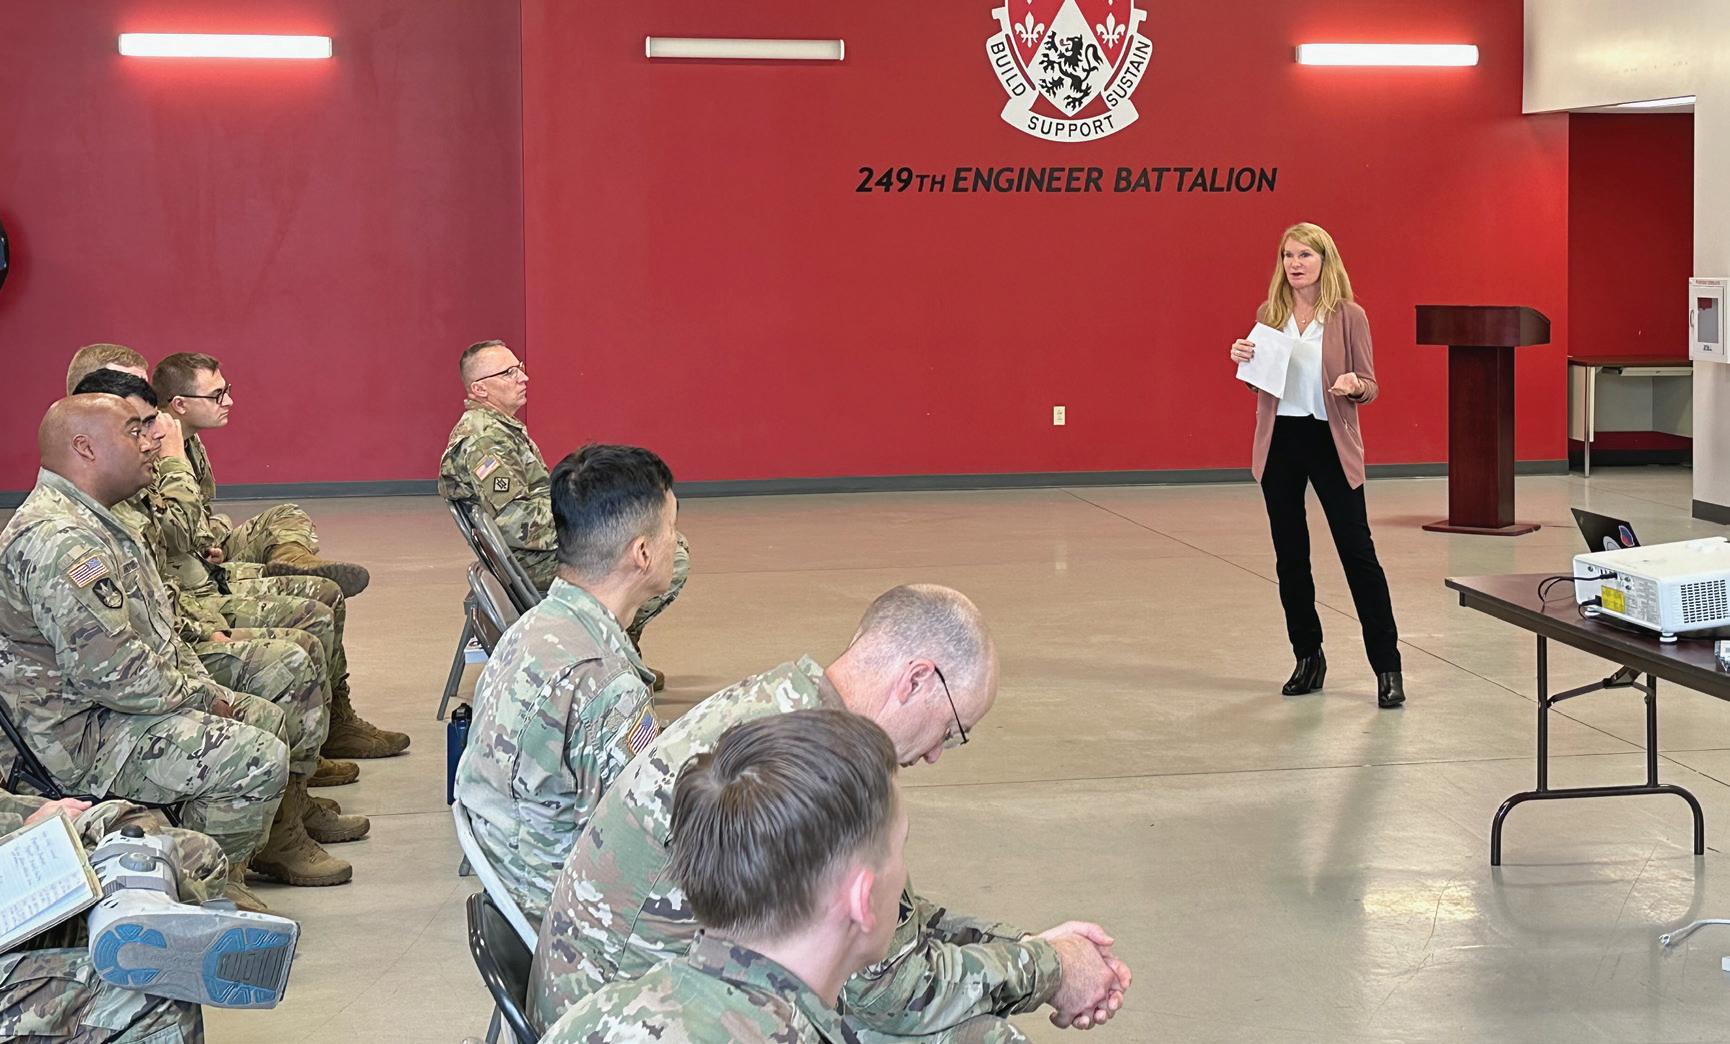
NAMO VISITS PROMOTE NETA CERTIFICATION IN THE MILITARY
NETA Approved Military Organization (NAMO) is a membership classification designed to serve military organizations whose missions align with NETA’s mission. Military personnel are provided with a qualification framework and a professional development path to obtain certification in accordance with nationally recognized industry standards.
NETA’s NAMO Advisory Committee members, along with support from NETA staff, perform face-to-face visits with companies in the NAMO program. The visits promote personal engagement to support the training and education offered for the certification. Challenge coins are presented to NAMO technicians who certify at Level 2, Level 3, and Level 4 to enhance this achievement.
In 2022, six committee members made presentations to the 249 th Army Engineer
Battalion and U.S. Navy Seabees Mobile Utilities Support Equipment (MUSE):
• Dan Hook, CBS Field Services and NAMO Committee Chair
• Ken Bassett, Potomac Testing and NETA Board of Directors
• Dave Kreger, Premier Power Maintenance Corp.
• Earl Wilcox, Henderson Building Solutions and Standard Alliance Partner
• Melissa Richard, NETA Executive Director
• Amy Williams, NETA Director of Membership
NETA continues outreach to other areas of the military that perform electrical testing. Interested military branches can contact the NETA office at neta@networld.org for more information on the NAMO program.
NETA Presentation by Amy Williams at Fort Belvoir
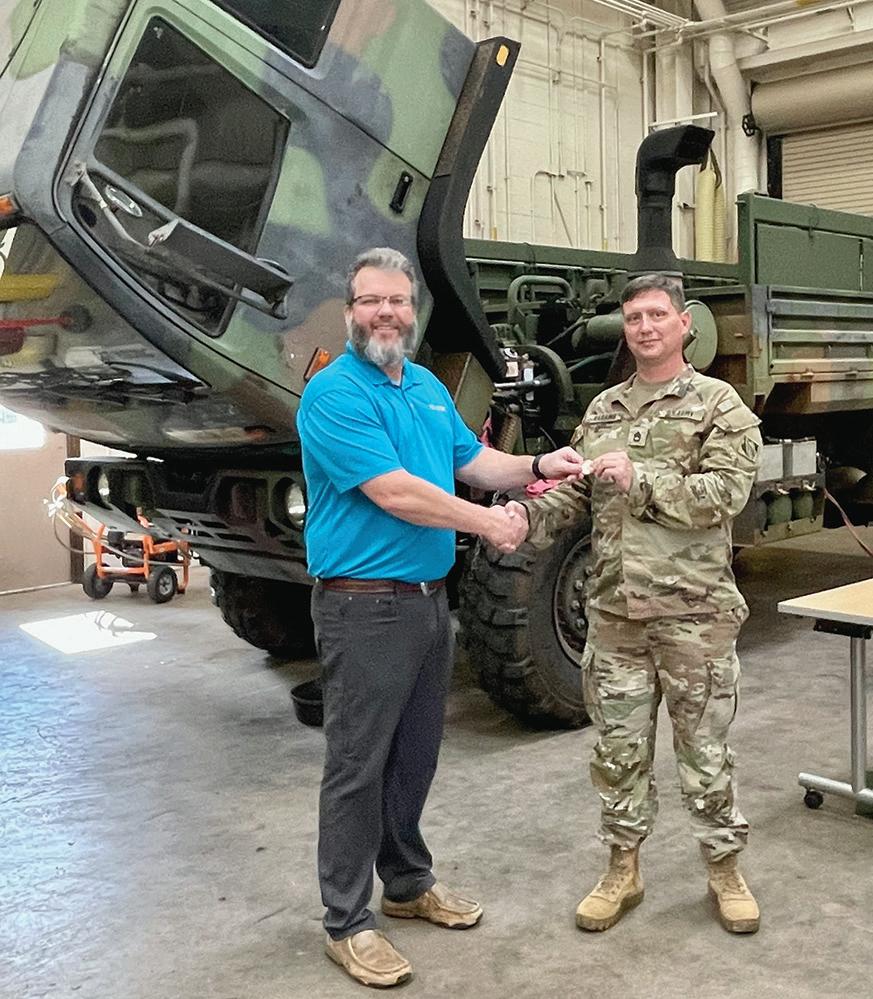
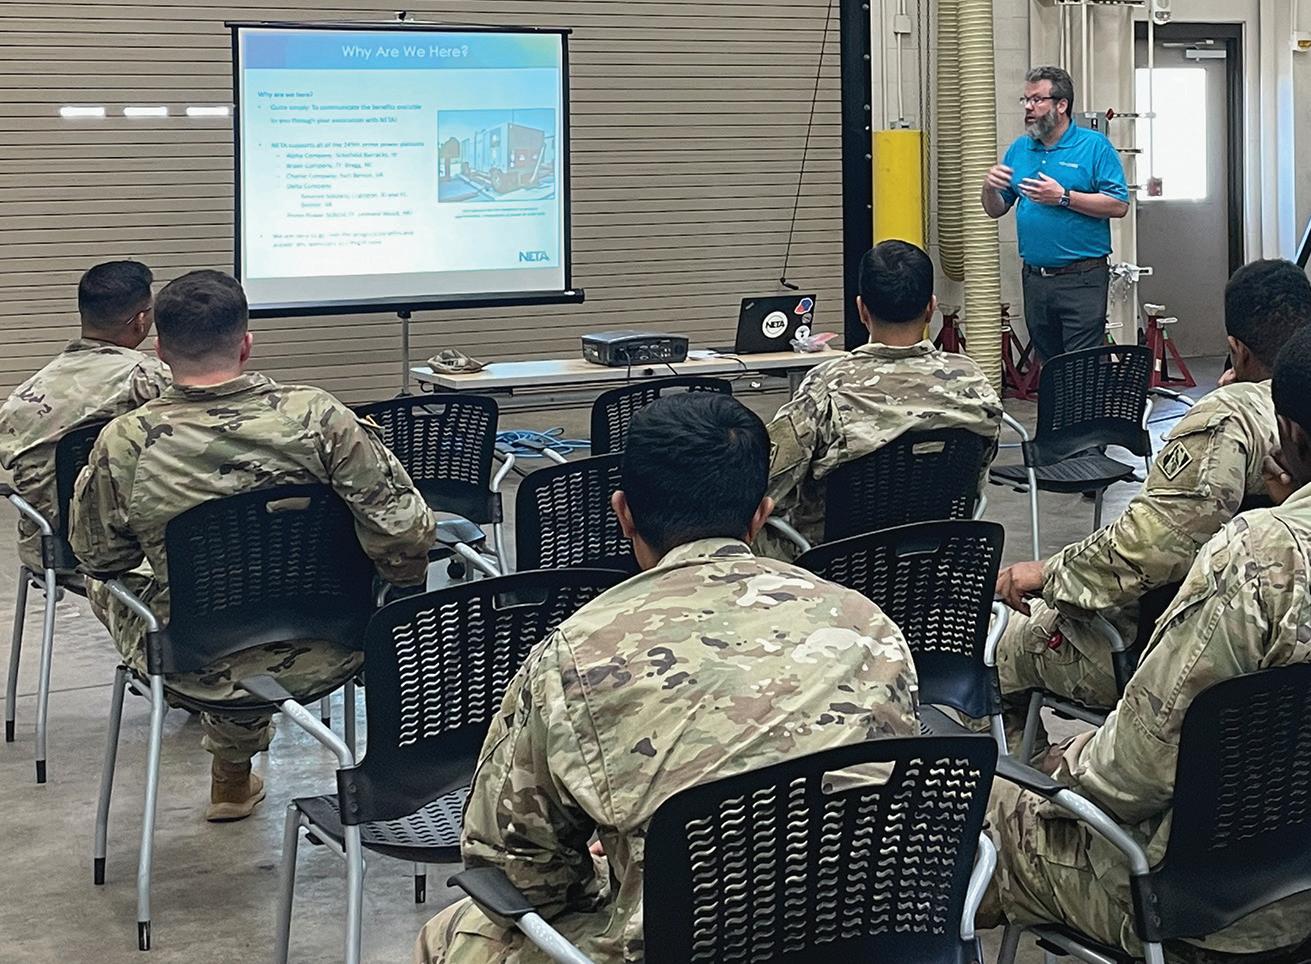

Ken Bassett Presents Level 2 Challenge Coin to Sgt. Barninger of Charlie Company
Dave Kreger and Earl Wilcox Present to U.S. Prime Power School Graduates
Charles Sweetser of OMICRON Provides Training to MUSE
Dan Hook Visits Alpha Company in Hawaii to Explain the NETA Certification Program
TECH QUIZ ANSWERS

ANSWERS
ANSWERS
1. b. Rotor and stator. The rotor and stator are the mechanical components of an electric motor. The stator is stationary and surrounds the rotor. The stator receives electrical energy and spins the rotor, converting it into mechanical energy.
2. a. The same frequency as the supply current. Synchronous machines rotate at the same frequency as the alternating current, which is 60 Hz in North America. An induction motor rotates at a frequency less than the supply, which is why they are also called asynchronous motors.
3. b. Eddy current losses. Many thin laminations are used to construct stator cores to decrease eddy current losses that would exist if a solid core were used. When layers of the stator laminations are shorted, this can lead to high eddy currents and an associated temperature rise.
4. c. IEEE 43. IEEE 43, IEEE Recommended Practice for Testing Insulation Resistance of Electric Machinery, describes the recommended procedure for measuring the insulation resistance of armature and field windings in rotating machines rated 750 W or greater.
5. c. Discharged. It is essential to verify that the winding insulation is fully discharged prior to testing. It is hazardous to begin any testing prior to verification, and the measurements may be incorrect if there is a residual charge in the insulation. It is also important to note that the testing is not complete until the winding is fully discharged. This may involve utilizing a discharge time of four times the voltage application duration.
NETA ACCREDITED COMPANIES Setting the
ABM Electrical Power Services, LLC
720 S Rochester Suite A Ontario, CA 91761-8177 (301) 397-3500 www.abmpowerservice.abm.com
ABM Electrical Power Services, LLC 6541 Meridien Dr Suite 113 Raleigh, NC 27616 (919) 877-1008 brandon.davis@abm.com www.abmpowerservice.abm.com Brandon Davis
ABM Electrical Power Services, LLC 2631 S. Roosevelt St Tempe, AZ 85282 (602) 722-2423
ABM Electrical Power Services, LLC 3600 Woodpark Blvd Ste G Charlotte, NC 28206-4210 (704) 273-6257
ABM Electrical Power Services, LLC
6940 Koll Center Pkwy Suite# 100 Pleasanton, CA 94566 (408) 466-6920
ABM Electrical Power Services, LLC
9800 E Geddes Ave Unit A-150 Englewood, CO 80112-9306 (303) 524-6560
ABM Electrical Power Services, LLC 3585 Corporate Court San Diego, CA 92123-1844 (858) 754-7963
ABM Electrical Power Services, LLC 1005 Windward Ridge Pkwy Alpharetta, GA 30005 (770) 521-7550 www.abmpowerservice.abm.com
ABM Electrical Power Services, LLC 4221 Freidrich Lane Suite 170 Austin, TX 78744 (210) 347-9481
ABM Electrical Power Services, LLC 11719 NE 95th St. Ste H Vancouver, WA 98682 (360) 713-9513
Paul.McKinley@abm.com www.abmpowerservice.abm.com
Paul McKinley
ABM Electrical Power Solutions 4390 Parliament Place Suite S Lanham, MD 20706 (240) 487-1900
www.abmpowersolution.abm.com
ABM Electrical Power Solutions 3700 Commerce Dr # 901-903 Baltimore, MD 21227-1642 (410) 247-3300 www.abmpowersolution.abm.com
ABM Electrical Power Solutions 317 Commerce Park Drive Cranberry Township, PA 16066-6407 (724) 772-4638 www.abmpowersolution.abm.com
ABM Electrical Power Solutions 814 Greenbrier Cir Ste E Chesapeake, VA 23320-2643 (757) 364-6145
keone.castleberry@abm.com www.abmpowersolution.abm.com
Keone Castleberry
ABM Electrical Power Solutions 1817 O’Brien Road Columbus, OH 43228 (724) 772-4638
www.abmpowersolution.abm.com
Absolute Testing Services, Inc. 8100 West Little York Houston, TX 77040 (832) 467-4446
ap@absolutetesting.com www.absolutetesting.com
Accessible Consulting Engineers, Inc. 1269 Pomona Rd Ste 111 Corona, CA 92882-7158 (951) 808-1040
info@acetesting.com www.acetesting.com
Advanced Electrical Services 4999 - 43rd St. NE Unit 143 Calgary, AB T2B 3N4 (403) 697-3747
accounting@aes-ab.com
Advanced Electrical Services 9958 - 67 Ave Edmonton, AB T6E 0P5 (403) 697-3747 www.aes-ab.com
Advanced Testing Systems 15 Trowbridge Dr Bethel, CT 06801-2858 (203) 743-2001
pmaccarthy@advtest.com www.advtest.com
Pat McCarthy
A&F Electrical Testing, Inc.
80 Lake Ave S Ste 10 Nesconset, NY 11767-1017 (631) 584-5625 kchilton@afelectricaltesting.com www.afelectricaltesting.com
A&F Electrical Testing, Inc. 80 Broad St Fl 5 New York, NY 10004-2257 (631) 584-5625 afelectricaltesting@afelectricaltesting.com www.afelectricaltesting.com
Florence Chilton
Alpha Relay and Protection Testing, LLC 2625 Overland Ave Unit A Billings, MT 59102 (406) 671-7227 zfettig@arptco.com www.arptco.com Zeb Fettig
American Electrical Testing Co., LLC 25 Forbes Boulevard Suite 1 Foxboro, MA 02035 (781) 821-0121 www.aetco.us
Jason Briggs
American Electrical Testing Co., LLC 5540 Memorial Rd Allentown, PA 18104 (484) 538-2272 jmunley@aetco.us www.aetco.us
American Electrical Testing Co., LLC 34 Clover Dr South Windsor, CT 06074-2931 (860) 648-1013 jpoulin@aetco.us www.aetco.us
Gerald Poulin
American Electrical Testing Co., LLC 76 Cain Dr Brentwood, NY 11717-1265 (631) 617-5330 bfernandez@aetco.us www.aetco.us
Billy Fernandez
American Electrical Testing Co., LLC 91 Fulton St., Unit 4 Boonton, NJ 07005-1060 (973) 316-1180 jsomol@aetco.us www.aetco.us
Jeff Somol
AMP Quality Energy Services, LLC 352 Turney Ridge Rd Somerville, AL 35670 (256) 513-8255 brian@ampqes.com
Brian Rodgers
AMP Quality Energy Services, LLC 41 Peabody Street Nashville, TN 37210 (629) 213-4855
Nick Tunstill
Apparatus Testing and Engineering 11300 Sanders Dr Suite 29 Rancho Cordova, CA 95742-6822 (916) 853-6280
jcarr@apparatustesting.com www.apparatustesting.com
Jerry Carr
Apparatus Testing and Engineering 7083 Commerce Cir Ste H Pleasanton, CA 94588-8017 (916) 853-6280
jcarr@apparatustesting.com www.apparatustesting.com
Jerry Carr
Applied Engineering Concepts 894 N Fair Oaks Ave. Pasadena, CA 91103 (626) 389-2108
michel.c@aec-us.com www.aec-us.com
Michel Castonguay
Applied Engineering Concepts 9235 Activity Road
San Diego, CA 92126 (619) 822-1106
michel.c@aec-us.com
www.aec-us.com
Michel Castonguay ARM CAMCO, LLC 667 Industrial Park Road Ebensburg, PA 15931 (814) 472-7980
acct@armcamco.net
Sam Morello
BEC Testing 50 Gazza Blvd Farmingdale, NY 11735-1402 (631) 393-6800
ddevlin@banaelectric.com www.bectesting.com
Blue Runner Switchgear Testing, LLC 924 Highway 98 East Suite C-200 Destin, FL 32541 (270) 590-4974
cneitzel@bluerunnerswitchgear.com www.bluerunnerswitchgear.com
Chris Neitzel
Brosz Technical Services 1300 Rodick Rd, Unit C Markham, Ontario Canada 905-472-6660
kbunte@brosz.net
Kyle Bunte
Burlington Electrical Testing Co., LLC
300 Cedar Ave Croydon, PA 19021-6051 (215) 826-9400 waltc@betest.com www.betest.com
Dan Calderbank
Burlington Electrical Testing Co., LLC 846 Waterford Drive Delran, NJ 08075 (609) 267-4126
Capitol Area Testing, Inc. P.O. Box 259 Suite 614 Crownsville, MD 21032 (757) 650-0740 carl@capitolareatesting.com www.capitolareatesting.com
Carl VanHooijdonk
CBS Field Services 14311 29th St E Sumner, WA 98390-9690 (253) 891-1995 dhook@groupcbs.com www.cbsfieldservices.com
Dan Hook
CBS Field Services 12794 Currie Court Livonia, MI 48150 (810) 720-2280
CBS Field Services 5680 S 32nd St Phoenix, AZ 85040-3832 (602) 426-1667 www.cbsfieldservices.com
NETA ACCREDITED COMPANIES Setting the Standard
CBS Field Services
3676 W California Ave Ste C106 Salt Lake City, UT 84104-6533 (888) 395-2021
www.cbsfieldservices.com
CBS Field Services
4510 NE 68th Dr Unit 122 Vancouver, WA 98661-1261 (888) 395-2021
www.cbsfieldservices.com
Jason Carlson
CBS Field Services
5505 Daniels St. Chino, CA 91710 (602) 426-1667
Matt Wallace
CBS Field Services
620 Meadow Ln. Los Alamos, NM 87547 (505) 469-1661
CBS Field Services
5385 Gateway Boulevard #19-21 Lakeland, FL 33811 (810) 720-2280
CBS Field Services
1313 Jewel Street Nashville, TN 37207
mramieh@cbsfieldservices.com www.cbsfieldservices.com
Mose Ramieh III
Control Power Concepts
3065 E. Post Road
Las Vegas, NV 89120 (702) 448-7833
jtravis@ctrlpwr.com www.controlpowerconcepts.com
Eastern High Voltage, Inc.
11A S Gold Dr Robbinsville, NJ 08691-1685 (609) 890-8300
bobwilson@easternhighvoltage.com www.easternhighvoltage.com
Robert Wilson
Electek Power Services, Inc. 870 Confederation Street Sarnia, ON N7T2E5 (519) 383-0333
kgadsby@electek.ca https://electek.ca/ Kathy Gadsby
ELECT, P.C.
375 E. Third Street Wendell, NC 27591 (919) 365-9775
btyndall@elect-pc.com www.elect-pc.com
Barry W. Tyndall
Electrical & Electronic Controls 6149 Hunter Rd Ooltewah, TN 37363-8762 (423) 344-7666 eecontrols@comcast.net
Michael Hughes
Electrical Energy Experts, LLC W129N10818 Washington Dr Germantown, WI 53022-4446 (262) 255-5222
mhanek@electricalenergyexperts.com www.electricalenergyexperts.com
Michael Hanek
Electrical Energy Experts, LLC 815 Commerce Dr. Oak Brook, IL 60523 (847) 875-5611
Michael Hanek
Electrical Engineering & Service Co., Inc. 289 Centre St. Holbrook, MA 02343 (781) 767-9988
jcipolla@eescousa.com www.eescousa.com
Joe Cipolla
Electrical Equipment Upgrading, Inc. 21 Telfair Pl Savannah, GA 31415-9518 (912) 232-7402 kmiller@eeu-inc.com www.eeu-inc.com
Kevin Miller
Electrical Reliability Services
610 Executive Campus Dr Westerville, OH 43082-8870 (877) 468-6384 info@electricalreliability.com www.electricalreliability.com
Electrical Reliability Services
5909 Sea Lion Pl Ste C Carlsbad, CA 92010-6634 (858) 695-9551 www.electricalreliability.com
Electrical Reliability Services 1057 Doniphan Park Cir Ste A El Paso, TX 79922-1329 (915) 587-9440 www.electricalreliability.com
Electrical Reliability Services
6900 Koll Center Pkwy Ste 415 Pleasanton, CA 94566-3119 (925) 485-3400 www.electricalreliability.com
Electrical Reliability Services
8500 Washington St NE Ste A6 Albuquerque, NM 87113-1861 (505) 822-0237 www.electricalreliability.com
Electrical Reliability Services 2275 Northwest Pkwy SE Ste 180 Marietta, GA 30067-9319 (770) 541-6600 www.electricalreliability.com
Electrical Reliability Services
12130 Mora Drive Unit 1 Santa Fe Springs, CA 90670 (562) 236-9555 www.electricalreliability.com
Electrical Reliability Services
400 NW Capital Dr Lees Summit, MO 64086-4723 (816) 525-7156 www.electricalreliability.com
Electrical Reliability Services
7100 Broadway Ste 7E Denver, CO 80221-2900 (303) 427-8809
www.electricalreliability.com
Electrical Reliability Services 2222 W Valley Hwy N Ste 160 Auburn, WA 98001-1655 (253) 736-6010 www.electricalreliability.com
Electrical Reliability Services 221 E. Willis Road, Suite 3 Chandler, AZ 85286 (480) 966-4568 www.electricalreliability.com
Electrical Reliability Services 1380 Greg St. Ste. 216 Sparks, NV 89431-6070 (775) 746-4466 www.electricalreliability.com
Electrical Reliability Services 11000 Metro Pkwy Ste 30 Fort Myers, FL 33966-1244 (239) 693-7100 www.electricalreliability.com
Electrical Reliability Services 245 Hood Road Sulphur, LA 70665-8747 (337) 583-2411 wayne.beaver@vertivco.com www.electricalreliability.com
Electrical Reliability Services 9736 South Sandy Pkwy 500 West Sandy, UT 84070 (801) 561-0987 www.electricalreliability.com
Electrical Reliability Services 6351 Hinson Street, Suite A Las Vegas, NV 89118-6851 (702) 597-0020 www.electricalreliability.com
Electrical Reliability Services 36572 Luke Drive Geismar, LA 70734 (225) 647-0732 www.electricalreliability.com
Electrical Reliability Services 9636 Saint Vincent Ave Unit A Shreveport, LA 71106-7127 (318) 869-4244
Electrical Reliability Services 1426 Sens Rd. Ste. #5 La Porte, TX 77571-9656 (281) 241-2800 www.electricalreliability.com
Electrical Reliability Services 9753 S. 140th Street, Suite 109 Omaha, NE 68138 (402) 861-9168
Electrical Reliability Services
190 E. Stacy Road 306 #374 Allen, TX 75002 (972) 788-0979
Electrical Reliability Services 4833 Berewick Town Ctr Drive Ste E-207 Charlotte, NC 28278 (704) 583-4794
Electrical Reliability Services 324 S. Wilmington St. Ste 299 Raleigh, NC 27601 (919) 807-0995
Electrical Reliability Services 13720 Old St. Augustine Rd. Ste. 8 #289 Jacksonville, FL 32258 (904) 292-9779
Electrical Reliability Services 3049 Old Hwy 52 Suite A-106 Moncks Corner, SC 29461 (239) 693-7100
Hugh McKee
Electrical Reliability Services 4099 SE International Way Ste 201 Milwaukie, OR 97222-8853 (503) 653-6781 www.electricalreliability.com
Electrical Testing and Maintenance Corp. 3673 Cherry Rd Ste 101 Memphis, TN 38118-6313 (901) 566-5557 r.gregory@etmcorp.net www.etmcorp.net
Ron Gregory
Electrical Testing, Inc. 2671 Cedartown Hwy SE Rome, GA 30161-3894 (706) 234-7623 clifton@electricaltestinginc.com www.electricaltestinginc.com
Electrical Testing Solutions 2909 Greenhill Ct Oshkosh, WI 54904-9769 (920) 420-2986 tmachado@electricaltestingsolutions.com www.electricaltestingsolutions.com/ Tito Machado
Electric Power Systems, Inc. 21 Millpark Ct Maryland Heights, MO 63043-3536 (314) 890-9999 STL@epsii.com www.epsii.com
James Vaughn
Electric Power Systems, Inc. 11211 E. Arapahoe Rd Ste 108 Centennial, CO 80112 (720) 857-7273 den@epsii.com www.epsii.com
Mike Benitez
Electric Power Systems, Inc. 120 Turner Road Salem, VA 24153-5120 (540) 375-0084 rnk@epsii.com www.epsii.com
Richard Kessler
Electric Power Systems, Inc. 1090 Montour West Ind Park Coraopolis, PA 15108-9307 (412) 276-4559
PIT@epsii.com www.epsii.com
Jon Rapuk
Electric Power Systems, Inc. 4300 NE 34th Street Kansas City, MO 64117 (816) 241-9990
KAN@epsii.com www.epsii.com
Rodrigo Lallana
Electric Power Systems, Inc. 1230 N Hobson St. Suite 101 Gilbert, AZ 85233 (480) 633-1490
PHX@epsii.com www.epsii.com
Mike Benitez
Electric Power Systems, Inc. 915 Holt Ave Unit 9 Manchester, NH 03109-5606 (603) 657-7371
MAN@epsii.com www.epsii.com
Sam Bossee
Electric Power Systems, Inc. 3806 Caboose Place Sanford, FL 32771 (407) 578-6424
ORL@epsii.com www.epsii.com
Justin McGinn
Electric Power Systems, Inc. 1129 E Highway 30 Gonzales, LA 70737-4759 (225) 644-0150
BAT@epsii.com www.epsii.com
Josh Galaz
Electric Power Systems, Inc. 684 Melrose Avenue Nashville, TN 37211-3121 (615) 834-0999
NSH@epsii.com www.epsii.com
James Vaughn
Electric Power Systems, Inc. 2888 Nationwide Parkway 2nd Floor Brunswick, OH 44212 (330) 460-3706
CLE@epsii.com www.epsii.com
Jon Rapuk
Electric Power Systems, Inc. 54 Eisenhower Lane North Lombard, IL 60148 (815) 577-9515
CHI@epsii.com www.epsii.com
George Bratkiv
Electric Power Systems, Inc.
1330 Industrial Blvd. Suite 300
Sugar Land, TX 77478 (713) 644-5400
HOU@epsii.com www.epsii.com
Electric Power Systems, Inc. 1361 Glory Rd Green Bay, WI 54304-5640 (920) 632-7929
info@energisinc.com www.energisinc.com
Electric Power Systems, Inc. 11861 Longsdorf St Riverview, MI 48193-4250 (734) 282-3311
DET@epsii.com www.epsii.com
Greg Eakins
Electric Power Systems, Inc. 4416 Anaheim Ave. NE Albuquerque, NM 87113 (505) 792-7761
ABQ@epsii.com www.epsii.com
Mike Benitez
Electric Power Systems, Inc. 3209 Gresham Lake Rd. Suite 155 Raleigh, NC 27615 (919) 322-2670
RAL@epsii.com www.epsii.com
Yigitcan Unludag
Electric Power Systems, Inc. 4216 N. Pecos Road, Suite 108 North Las Vegas, NV 89115 (702) 815-1342
LAS@epsii.com www.epsii.com
Electric Power Systems, Inc. 9835 Carroll Centre Rd Suite 103 San Diego, CA 91126 (858) 566-6317
SAN@epsii.com www.epsii.com
Electric Power Systems, Inc. 6679 Peachtree Industrial Dr. Suite H Norcross, GA 30092 (770) 416-0684
ATL@epsii.com www.epsii.com
Justin McGinn
Electric Power Systems, Inc. 1051 Technology Park Dr. Glen Allen, VA 23059 (804) 526-6794
RIC@epsii.com www.epsii.com
NETA ACCREDITED COMPANIES Setting the
Electric Power Systems, Inc. 7169 East 87th St. Indianapolis, IN 46256 (317) 941-7502
IND@epsii.com www.epsii.com
Ben Hocking
Electric Power Systems, Inc. 7308 Aspen Lane North Suite 160 Brooklyn Park, MN 55428 (763) 315-3520
MIN@epsii.com www.epsii.com
Paul Cervantez
Electric Power Systems, Inc. 140 Lakefront Drive Cockeysville, MD 21030 (443) 689-2220
WDC@epsii.com www.epsii.com
Jon Rapuk
Electric Power Systems, Inc. 675 N. Glenville Dr, Ste 125 Richardson, TX 75081 (214) 821-3311
Electric Power Systems, Inc. 11912 NE 95th St. Suite 306 Vancouver, WA 98682 (855) 459-4377
VAN@epsii.com www.epsii.com
Anthony Asciutto
Electric Power Systems, Inc.
Padre Mariano 272, Of. 602
Providencia, Santiago,
Electric Power Systems, Inc. 9860 Windisch Road
West Chester, OH 45069 (513) 644-2098
Aaron Galley
Electric Power Systems, Inc. 5653 Stoneridge Drive Suite 108 Pleasanton, CA 94588 (415) 683-7789
Mike Bloomfield
Electric Power Systems, Inc. 1780 E. McFadden Suite 112 Santa Ana, CA 92705 (714) 714-7226
Reynaldo Perez
Electric Power Systems, Inc. 1612 Poole Blvd
Yuba City, CA 95993 (530) 755-3123
Jim Wolfgram
Electro Test, LLC 401 N. Cane Street Unit A-4
Wahiawa, HI 96786 (808) 321-2028
bhelminen@electrotest.pro www.electrotest.pro Brad Helminen
Elemco Services, Inc. 228 Merrick Rd Lynbrook, NY 11563-2622 (631) 589-6343
courtney@elemco.com www.elemco.com
Courtney Gallo
EPS Technology 37 Ozick Dr. Durham, CT 06422 (203) 679-0145 www.eps-technology.com
ESR Electrical Services 425 S. 48th Street Suite 114 Tempe, AZ 85281 (661) 644-2430 jacob@esreliability.com
Jacob Webb
ESR Electrical Services 5009 Pacific Hwy East, Unit 13 Fife, WA 98424 (800) 342-4560
chuck@esreliability.com
Charles Duncan III
ESR Electrical Services 3204 NE 13th Place Hillsboro, OR 97124 (800) 342-4560
chuck@esreliability.com
Charles Duncan III
ESR Electrical Services 1737 NE 8th Street Hermiston, OR 97838 (800) 342-4560
chuck@esreliability.com
Charles Duncan III
ESR Electrical Services 23421 Spicebush Terrace Ashburn, VA 20148 (800) 342-4560 jacob@esreliability.com
Jacob Webb
Giga Electrical & Technical Services, Inc. 5926 E. Washington Boulevard Commerce, CA 90040 (323) 255-5894 gigaelectrical@gmail.com www.gigaelectrical-ca.com/ Hermin Machacon
Grubb Engineering, Inc. 2727 North Saint Mary’s St. San Antonio, TX 78212 (210) 658-7250 rgrubb@grubbengineering.com www.grubbengineering.com
Robert Grubb
Halco Testing Services 5773 Venice Boulevard Los Angeles, CA 90019 (323) 933-9431
accounting@halco.net www.halcotestingservices.com
Don Genutis
NETA ACCREDITED COMPANIES Setting the Standard
Hampton Tedder Technical Services
4563 State St Montclair, CA 91763-6129 (909) 628-1256
chasen.tedder@hamptontedder.com www.httstesting.com
Chasen Tedder
Hampton Tedder Technical Services
3747 W Roanoke Ave Phoenix, AZ 85009-1359 (480) 967-7765 www.httstesting.com
Linc McNitt
Hampton Tedder Technical Services 4113 Wagon Trail Ave. Las Vegas, NV 89118 (702) 452-9200 www.httstesting.com
Roger Cates
High Energy Electrical Testing, Inc. 5042 Industrial Road, Unit D Farmingdale, NJ 07727 (732) 938-2275
judylee@highenergyelectric.com www.highenergyelectric.com
High Voltage Maintenance Corp. 5100 Energy Dr Dayton, OH 45414-3525 (937) 278-0811
www.hvmcorp.com
High Voltage Maintenance Corp. 24 Walpole Park S Walpole, MA 02081-2541 (508) 668-9205
www.hvmcorp.com
High Voltage Maintenance Corp. 1052 Greenwood Springs Rd. Suite E Greenwood, IN 46143 (317) 322-2055
www.hvmcorp.com
High Voltage Maintenance Corp. 355 Vista Park Dr Pittsburgh, PA 15205-1206 (412) 747-0550
www.hvmcorp.com
High Voltage Maintenance Corp. 8787 Tyler Blvd. Mentor, OH 44061 (440) 951-2706
www.hvmcorp.com
Greg Barlett
High Voltage Maintenance Corp. 24371 Catherine Industrial Dr Suite 207 Novi, MI 48375-2422 (248) 305-5596
www.hvmcorp.com
High Voltage Maintenance Corp. 3000 S Calhoun Rd New Berlin, WI 53151-3549 (262) 784-3660
www.hvmcorp.com
High Voltage Maintenance Corp. 1 Penn Plaza Suite 500 New York, NY 10119 (718) 239-0359
www.hvmcorp.com
High Voltage Maintenance Corp.
29 Diana Court Cheshire, CT 06410 (203) 949-2650
www.hvmcorp.com
Peter Dobrowolski
High Voltage Maintenance Corp. 941 Busse Rd Elk Grove Village, IL 60007-2400 (847) 640-0005
High Voltage Maintenance Corp. 7380 Coca Cola Drive Suite 112-113 Hanover, MD 21076 (410) 279-0798 www.hvmcorp.com
Jeff Gyurasics
High Voltage Maintenance Corp. 10704 Electron Drive Louisville, KY 40299 (859) 371-5355
High Voltage Maintenance Corp.
1 Penn Plaza, Suite 1500 New York, NY 10119 (718) 239-0359
New York Area Service Center
High Voltage Maintenance Corp. Cincinnati/Kentucky Area Satellite Office (859) 371-5355
Hood Patterson & Dewar, Inc. 850 Center Way Norcross, GA 30071 (770) 453-1415 info@hoodpd.com https://hoodpd.com/ Brandon Sedgwick
Hood Patterson & Dewar, Inc. 15924 Midway Road Addison, TX 75001 (214) 461-0760 info@hoodpd.com https://hoodpd.com/
Hood Patterson & Dewar, Inc. 4511 Daly Dr. Suite 1 Chantilly, VA 20151 (571) 299-6773 info@hoodpd.com https://hoodpd.com/
Hood Patterson & Dewar, Inc. 1531 Hunt Club Blvd Suite 200 Gallatin, TN 37066 (615) 527-7084 info@hoodpd.com https://hoodpd.com/
Industrial Electric Testing, Inc. 11321 Distribution Ave W Jacksonville, FL 32256-2746 (904) 260-8378
gbenzenberg@bellsouth.net www.industrialelectrictesting.com
Gary Benzenberg
Industrial Electric Testing, Inc. 201 NW 1st Ave Hallandale Beach, FL 33009-4029 (954) 456-7020
gbenzenberg@bellsouth.net www.industrialelectrictesting.com
Gary Benzenberg
Industrial Tests, Inc. 4021 Alvis Ct Ste 1 Rocklin, CA 95677-4031 (916) 296-1200
greg@indtest.com www.industrialtests.com
Greg Poole
Infra-Red Building and Power Service, Inc. 152 Centre St Holbrook, MA 02343-1011 (781) 767-0888
Tom.McDonald@infraredbps.com www.infraredbps.com
Thomas McDonald Sr.
JET Electrical Testing, LLC 100 Lenox Drive Suite 100 Lawrenceville, NJ 08648 (609) 285-2800 jvasta@jetelectricaltesting.com jetelectricaltesting.com
Joe Vasta
J.G. Electrical Testing Corporation 3092 Shafto Road Suite 13 Tinton Falls, NJ 07753 (732) 217-1908
h.trinkowsky@jgelectricaltesting.com www.jgelectricaltesting.com
KT Industries, Inc. 3203 Fletcher Drive Los Angeles, CA 90065 (323) 255-7143 eric@kti.la ktiengineering.com
Eric Vaca
Magna IV Engineering 1103 Parsons Rd. SW Edmonton, AB T6X 0X2 (780) 462-3111 info@magnaiv.com www.magnaiv.com
Virginia Balitski
Magna IV Engineering 141 Fox Cresent Fort McMurray, AB T9K 0C1 (780) 791-3122 info@magnaiv.com
Ryan Morgan
Magna IV Engineering 3124 Millar Ave. Saskatoon, SK S7K 5Y2 (306) 713-2167 info.saskatoon@magnaiv.com
Adam Jaques
Magna IV Engineering 96 Inverness Dr E Ste R Englewood, CO 80112-5311 (303) 799-1273 info.denver@magnaiv.com Kevin Halma
Magna IV Engineering Avenida del Condor sur #590 Oficina 601 Huechuraba 8580676 +(56) -2-26552600 info.santiago@magnaiv.com
Harvey Mendoza
Magna IV Engineering Unit 110, 19188 94th Avenue Surrey, BC V4N 4X8 (604) 421-8020 info.vancouver@magnaiv.com
Rob Caya
Magna IV Engineering
Suite 200, 688 Heritage Dr. SE Calgary, AB T2H 1M6 (403) 723-0575 info.calgary@magnaiv.com
Morgan MacDonnell
Magna IV Engineering 4407 Halik Street Building E Suite 300 Pearland, TX 77581 (346) 221-2165 info.houston@magnaiv.com www.magnaiv.com
Aric Proskurniak
Magna IV Engineering 10947 92 Ave Grande Prairie, AB T8V 3J3 1.800.462.3157 info.grandeprairie@magnaiv.com
Matthew Britton
Magna IV Engineering 531 Coster St. Bronx, NY 10474 (800) 462-3157 Info.newyork@magnaiv.com
Donald Orbin
Midwest Engineering Consultants, Ltd. 2500 36th Ave Moline, IL 61265-6954 (309) 764-1561 m-moorehead@midwestengr.com www.Midwestengr.com
Monte Moorehead
M&L Power Systems, Inc. 109 White Oak Ln Ste 82 Old Bridge, NJ 08857-1980 (732) 679-1800 milind@mlpower.com www.mlpower.com
Milind Bagle
MTA Electrical Engineers 350 Pauma Place Escondido, CA 92029 (760) 658-6098 tim@mtaee.com https://mtaee.com/ Timothy G. Shaw
National Field Services 651 Franklin Lewisville, TX 75057-2301 (972) 420-0157 eric.beckman@natlfield.com www.natlfield.com Eric Beckman
National Field Services 1760 W. Walker Street Suite 100
League City, TX 77573 (800) 420-0157
don.haas@natlfield.com
Donald Haas
National Field Services 1405 United Drive Suite 113-115
San Marcos, TX 78666 (800) 420-0157 matt.lacoss@natlfield.com www.natlfield.com
Matthew LaCoss
National Field Services 3711 Regulus Ave. Las Vegas, NV 89102 (888) 296-0625 www.natlfield.com
Joe Laning
National Field Services 2900 Vassar St. #114 Reno, NV 89502 (775) 410-0430
Joe.Laning@IEMworldwide.com www.natlfield.com
Joe Laning
National Field Services 21818 S. Wiliminton Ave #409 Carson, CA 90810 (310) 549-5673
Joe.Laning@IEMworldwide.com
Joe Laning
National Field Services 1331 Baltimore Street Longview, WA 98632 (360) 425-8700
Steve Warren
North Central Electric, Inc. 69 Midway Ave Hulmeville, PA 19047-5827 (215) 945-7632 bjmessina@ncetest.com www.ncetest.com
Robert Messina
Orbis Engineering Field Services Ltd. #300, 9404 - 41st Ave. Edmonton, AB T6E 6G8 (780) 988-1455 accountspayable@orbisengineering.net www.orbisengineering.net
Orbis Engineering Field Services Ltd. #228 - 18 Royal Vista Link NW Calgary, AB T3R 0K4 (403) 374-0051
Amin Kassam
Orbis Engineering Field Services Ltd. Badajoz #45, Piso 17 Las Condes, Santiago +56 2 29402343 framos@orbisengineering.net
Felipe Ramos
Pacific Power Testing, Inc.
14280 Doolittle Dr San Leandro, CA 94577-5542 (510) 351-8811
steve@pacificpowertesting.com www.pacificpowertesting.com
Steve Emmert
Phasor Engineering
Sabaneta Industrial Park #216 Mercedita 00715 (787) 844-9366 rcastro@phasorinc.com www.phasorinc.com
Rafael Castro
Potomac Testing 1610 Professional Blvd Ste A Crofton, MD 21114-2051 (301) 352-1930
kbassett@potomactesting.com www.potomactesting.com
Ken Bassett
Potomac Testing 1991 Woodslee Dr Troy, MI 48083-2236 (248) 689-8980 www.northerntesting.com
Potomac Testing 12342 Hancock St Carmel, IN 46032-5807 (317) 853-6795
Potomac Testing 1130 MacArthur Rd. Jeffersonville, OH 43128
Power Engineering Services, Inc. 9179 Shadow Creek Ln Converse, TX 78109-2041 (210) 590-6214
pes@pe-svcs.com www.pe-svcs.com
Power Engineering Services, Inc. 4041 Ellis Road Suite 100 Friendswood, TX 77546 (832) 451-9876
jhill@pe-svcs.com www.pe-svcs.com
Jase Hill
Power Engineering Services, Inc. 1001 Doris Lane Suite E Cedar Park, TX 78613 (254) 410-9299
jlord@pe-svcs.com www.pe-svcs.com
Jason Lord
Power Products & Solutions, LLC 6605 W WT Harris Blvd Suite F Charlotte, NC 28269 (704) 573-0420 x12 adis.talovic@powerproducts.biz www.powerproducts.biz
Adis Talovic
NETA ACCREDITED COMPANIES Setting the
Power Products & Solutions, LLC 13 Jenkins Ct Mauldin, SC 29662-2414 (800) 328-7382
raymond.pesaturo@powerproducts.biz www.powerproducts.biz
Raymond Pesaturo
Power Products & Solutions, LLC 9481 Industrial Center Dr. Unit 5 Ladson, SC 29456 (844) 383-8617 www.powerproducts.biz www.powerproducts.biz
Power Solutions Group, Ltd. 425 W Kerr Rd
Tipp City, OH 45371-2843 (937) 506-8444
bwilloughby@powersolutionsgroup.com www.powersolutionsgroup.com
Barry Willoughby
Power Solutions Group, Ltd. 251 Outerbelt St. Columbus, OH 43213 (614) 310-8018
sspohn@powersolutionsgroup.com www.powersolutionsgroup.com
Power Solutions Group, Ltd. 5115 Old Greenville Highway Liberty, SC 29657 (864) 540-8434
fcrawford@powersolutionsgroup.com www.powersolutionsgroup.com
Anthony Crawford
Power Solutions Group, Ltd. 172 B-Industrial Dr. Clarksville, TN 37040 (931) 572-8591
Chris Brown
Power System Professionals, Inc. 429 Clinton Ave Roseville, CA 95678 (866) 642-3129 jburmeister@powerpros.net
James Burmeister
Power Systems Testing Co. 4688 W Jennifer Ave Ste 108 Fresno, CA 93722-6418 (559) 275-2171 ext 15 dave@pstcpower.com www.powersystemstesting.com
David Huffman
Power Systems Testing Co. 600 S Grand Ave Ste 113 Santa Ana, CA 92705-4152 (714) 542-6089 www.powersystemstesting.com
Power Systems Testing Co. 6736 Preston Ave Ste E Livermore, CA 94551-8521 (510) 783-5096
www.powersystemstesting.com
Power Test, Inc. 2220 Hwy 49 Harrisburg, NC 28075-7506 (704) 200-8311 rich@powertestinc.com www.powertestinc.com
Praetorian Power Protection, LLC PO Box 3366
Lynnwood, WA 98046 (206) 612-6367
MChislett@praetorianpower.com
Michael Chislett
Precision Testing Group 5475 Highway 86 Unit 1 Elizabeth, CO 80107-7451 (303) 621-2776
office@precisiontestinggroup.com www.precisiontestinggroup.com
Premier Power Maintenance Corporation 4035 Championship Drive Indianapolis, IN 46268 (317) 879-0660
bob.sheppard@premierpower.us
Premier Power Maintenance Corporation 2725 Jason Rd Ashland, KY 41102-7756 (606) 929-5969
jay.milstead@premierpower.us www.premierpowermaintenance.com
Jay Milstead
Premier Power Maintenance Corporation 3066 Finley Island Cir NW Decatur, AL 35601-8800 (256) 355-1444
johnnie.mcclung@premierpower.us www.premierpowermaintenance.com
Johnnie McClung
Premier Power Maintenance Corporation 7262 Kensington Rd. Brighton, MI 48116 (517) 715-9997
steve.monte@premierpower.us
Steve Monte
Premier Power Maintenance Corporation 1901 Oakcrest Ave., Suite 6 Saint Paul, MN 55113 (612) 430-0209
Zac.mrdgenovich@premierpower.us Zac Mrdjenovich
Premier Power Maintenance Corporation 119 Rochester Dr. Louisville, KY 40214 (256) 200-6833
Jeremiah.evans@premierpower.us
Jeremiah Evans
QP Testing, LLC 2200 Ellis Rd New Lenox, IL 60451 (815) 724-2216
spioppo@qp-testing.com
Steve Pioppo
Qualus Services, LLC 4040 Rev Drive Cincinnati, OH 45232 (800) 434-0415
Qualus Services, LLC 11620 Crossroads Cir Middle River, MD 21220-2874 (410) 344-0300
Steve.Pieroski@qualusmail.com
Steve Pieroski
NETA ACCREDITED COMPANIES Setting the Standard
Qualus Services, LLC
480 Cave Rd Nashville, TN 37210-2302 (615) 882-9455
Dave Mitchell
Qualus Services, LLC
4089 Landisville Rd. Doylestown, PA 18902 (215) 364-5333
Allison.Schultz@qualusmail.com
Qualus Services, LLC
40 Washington St Westborough, MA 01581-1088 (508) 881-3911
matthew.robinson@qualusmail.com
Matthew Robinson
Qualus Services, LLC
9200 75th Avenue N Brooklyn Park, MN 55428 (877) 968-0281
James.Karpowicz@qualusmail.com
James Karpowicz
Qualus Services, LLC
72 Sanford Drive Gorham, ME 04038 (800) 649-6314
Qualus Services, LLC
8490 Seward Rd. Fairfield, OH 45011 (800) 434-0415
Qualus Services, LLC
1803 Taylor Ave. Louisville, KY 40213 (800) 434-0415
Eric Croner
Qualus Services, LLC
1200 W. West Maple Rd. Walled Lake, MI 48390 (810) 229-6628
Ryan Wiegand
Qualus Services, LLC
10840 Murdock Drive Knoxville, TN 37932 (800) 434-0415
Don Williams
Qualus Services, LLC 3496 E. 83rd Place Merrillville, IN 46410 (219) 942-2346
Lucas Gallagher
Qualus Services, LLC
1260 Industrial Park Eveleth, MN 55734 (218) 744-4200
Kip Kennedy
Qualus Services, LLC
401 Independence Pkwy S La Porte, TX 77571 (361) 443-7714
Dusty Nations
Qualus Solutions of Florida, LLC
3502 Riga Blvd., Suite C Tampa, FL 33619 (866) 439-2992
robert.bordas@cepowersol.com www.cepowersol.com
Robert Bordas
Qualus Solutions of Florida, LLC
3801 SW 47th Avenue Suite 505 Davie, FL 33314 (866) 439-2992
robert.bordas@cepowersol.com www.cepowersol.com
Robert Bordas
RESA Power Service
50613 Varsity Ct. Wixom, MI 48393 (248) 313-6868
lester.mcmanaway@resapower.com www.resapower.com
RESA Power Service
3890 Pheasant Ridge Dr. NE Suite 170
Blaine, MN 55449 (763) 784-4040
Michael.mavetz@resapower.com www.resapower.com
Mike Mavetz
RESA Power Service
6148 Tim Crews Rd Macclenny, FL 32063-4036 (904) 653-1900
mark.chapman@resapower.com
Mark Chapman
RESA Power Service
4540 Boyce Parkway Cleveland, OH 44224 (800) 264-1549
garth.paul@resapower.com www.resapower.com
Garth Paul
RESA Power Service
19621 Solar Circle, 101 Parker, CO 80134 (303) 781-2560
john.leusink@resapower.com
John Leusink
RESA Power Service
40 Oliver Terrace Shelton, CT 06484-5336 (800) 272-7711
adam.stevens@resapower.com
Adam Stevens
RESA Power Service 13837 Bettencourt Street Cerritos, CA 90703 (800) 996-9975
bryan.larkin@resapower.com www.resapower.com
Bryan Larkin
RESA Power Service 2300 Zanker Road Suite D San Jose, CA 95131 (800) 576-7372
bryan.larkin@resapower.com www.resapower.com
RESA Power Service 1401 Mercantile Court Plant City, FL 33563 (813) 752-6550
matt.rice@resapower.com www.resapower.com
Matt Rice
RESA Power Service 6268 Route 31 Cicero, NY 13039 (315) 699-5563
art.mcmanus@resapower.com
Art McManus
RESA Power Service
#181-1999 Savage Road, Vancouver, BC V6V OA5 (604) 303-9770
ralph.schmoor@resapower.com
Ralph Schmoor
RESA Power Service
3190 Holmgren Way Green Bay, WI 54304 (920) 639-0742
kevin.carr@resapower.com
Kevin Carr
RESA Power Service
4552 Happy Valley Rd Cave City, KY 42127 (612) 930-8365
matthew.stewart@resapower.com
Matthew Stewart
RESA Power Service
1010 N. Plaza Drive Visalia, CA 93291 (559) 651-0141
sean.broderick@resapower.com
Sean Broderick
RESA Power Service
2443 W. 12th St. Suite #3 Tempe, AZ 85281 (480) 730-8871
brandon.carrasco@resapower.com
Brandon Carrasco
REV Engineering Ltd.
3236 - 50 Avenue SE Calgary, AB T2B 3A3 (403) 287-0198 rdavidson@reveng.ca www.reveng.ca
Jason Molstad
Rondar Inc.
333 Centennial Parkway North Hamilton, ON L8E2X6 (905) 561-2808
rshaikh@rondar.com www.rondar.com
Rajeel Shaikh
Rondar Inc.
9-160 Konrad Crescent Markham, ON L3R9T9 (905) 943-7640
Saber Power Field Services, LLC 9841 Saber Power Ln Rosharon, TX 77583-5188 (713) 222-9102
mtummins@saberpower.com www.saberpowerfieldservices.com
Mitchell Tummins
Saber Power Field Services, LLC 9006 Western View Helotes, TX 78023 (210) 444-9514 jnorsworthy@saberpower.com www.saberpowerfieldservices.com
Jacob Norsworthy
Saber Power Field Services, LLC
4205 Longhorn Dr. Alvarado, TX 76009 (682) 518-3676
buck.bilnoski@saberpower.com www.saberpowerfieldservices.com
Wesley Osborne
Saber Power Field Services, LLC 433 Sun Belt Dr. Suite C Corpus Christi, TX 78408 (361) 452-1695 jnorsworthy@saberpower.com www.saberpowerfieldservices.com
Jacob Norsworthy
Saber Power Field Services, LLC 6097 Old Jefferson Hwy Geismar, LA 70734 (877) 912-9102
dreinmuller@saberpower.com www.saberpowerfieldservices.com
Daniel Reinmuller
Saber Power Field Services, LLC 9672 IH-10 Orange, TX 77632 (346) 335-7011
wayne.rice@saberpower.com www.saberpowerfieldservices.com
Wayne Rice
Saber Power Field Services, LLC 2611 S. County Road 1206 Midland, TX 79706 (877) 912-9102 jnorsworthy@saberpower.com
Jacob Norsworthy
Scott Testing, Inc. 245 Whitehead Rd Hamilton, NJ 08619 (609) 689-3400 rsorbello@scotttesting.com www.scotttesting.com
Russ Sorbello
Sentinel Power Services, Inc. 7517 E Pine St Tulsa, OK 74115-5729 (918) 359-0350
vigneshpn@sentfs.com www.sentfs.com
Vignesh Palanichamy
Shermco Industries 2425 E Pioneer Dr Irving, TX 75061-8919 (972) 793-5523 info@shermco.com www.shermco.com
Shermco Industries 112 Industrial Drive Minooka, IL 60447-9557 (815) 467-5577 info@shermco.com
Shermco Industries 233 Faithfull Cr. Saskatoon, SK S7K 8H7 (306) 955-8131 www.shermco.com
Shermco Industries 2231 E Jones Ave Ste A Phoenix, AZ 85040-1475 (602) 438-7500 info@shermco.com
Shermco Industries 1711 Hawkeye Dr. Hiawatha, IA 52233 (319) 377-3377 info@shermco.com www.shermco.com
Shermco Industries 1705 Hur Industrial Blvd Cedar Park, TX 78613-7229 (512) 267-4800 info@shermco.com www.shermco.com
Shermco Industries 7015-8 St NE Calgary, AB T2E 8A2 (403) 769-9300 www.shermco.com
Shermco Industries 5145 Beaver Dr Johnston, IA 50131 (515) 265-3377 info@shermco.com www.shermco.com
Shermco Industries 4510 South 86th East Ave. Tulsa, OK 74145 (918) 234-2300 info@shermco.com www.shermco.com
Shermco Industries 1375 Church Avenue Winnipeg, MB R2X 2T7 (204) 925-4022 www.shermco.com
Shermco Industries 1033 Kearns Crescent RM of Sherwood, SK S4K 0A2 (306) 949-8131
Shermco Industries 33002 FM 2004 Angleton, TX 77515-8157 (979) 848-1406 info@shermco.com www.shermco.com
Shermco Industries 1355 Central Parkway S #700 San Antonio, TX 78232 (210) 392-9175 info@shermco.com www.shermco.com
Shermco Industries 3731 - 98 Street Edmonton, AB T6E 5N2 (780) 436-8831 www.shermco.com
Shermco Industries 417 Commerce Street Tallmadge, OH 44278 (614) 836-8556 info@shermco.com
Shermco Industries
3807 S Sam Houston Pkwy W Houston, TX 77053 (281) 835-3633 info@shermco.com
Shermco Industries 7050 S.109th Ave La Vista, NE 68128 (402) 933-8988 info@shermco.com
Shermco Industries 1301 Hailey St. Sweetwater, TX 79556 (325) 236-9900 info@shermco.com www.shermco.com
Shermco Industries 2901 Turtle Creek Dr. Port Arthur, TX 77642 (409) 853-4316 info@shermco.com www.shermco.com
Shermco Industries 5145 NW Beaver Dr. Johnston, IA 50131 (515) 265-3377 info@shermco.com www.shermco.com
Shermco Industries 998 E. Berwood Ave. Saint Paul, MN 55110 (651) 484-5533 info@shermco.com www.shermco.com
Shermco Industries 37666 Amrhein Rd Livonia, MI 48150 (734) 744-4594
Shermco Industries 2080 West Kenny Drive Gonzales, LA 70737 (225) 647-9301 info@shermco.com
Shermco Industries 7136 Weddington Rd #128 Concord, NC 28027 (910) 568-1053 info@shermco.com info@shermco.com
Shermco Industries 9475 Old Hwy 43 Creola, AL 36525 (251) 679-3224 info@shermco.com
Shermco Industries 5211 Linbar Dr. Suite 507 Nashville, TN 37211 (615) 928-1182 info@shermco.com
Aaron Andrews
Shermco Industries #307-2999 Underhill Ave Burnaby, BC V5A 3C2 (972) 793-5523
Brad Wager
Shermco Industries 1411 Twin Oaks Street Wichita Falls, TX 76302 (972) 793-5523
Trey Ingram
NETA ACCREDITED COMPANIES Setting the Standard
Shermco Industries 11800 Jordy Rd. Midland, TX 79707 (972) 793-5523
Trey Ingram
Shermco Industries 6551 S Revere Parkway Suite 275 Centennial, CO 80111 (877) 456-1342 www.shermco.com
Shermco Industries 2970 Calcasieu Industrial Dr. Suite 100 Sulphur, LA 70665 (337) 287-9024
Richard Landry
Sigma C Power Services, LLC 200 Friberg Parkway, Ste 3000B Westborough, MA 01581 617-938-3912
jim@sig-c.com
Jim Cialdea
Sigma Six Solutions, Inc. 2200 W Valley Hwy N Ste 100 Auburn, WA 98001-1654 (253) 333-9730
jwhite@sigmasix.com www.sigmasix.com
John White
Sigma Six Solutions, Inc. www.sigmasix.com Quincy, WA 98848 (253) 333-9730
Chris Morgan
Star Electrical Services & General Supplies, Inc. PO Box 814 Las Piedras, PR 00771 (787) 716-0925
ahernandez@starelectricalpr.com www.starelectricalpr.com
Aberlardo Hernandez
Taifa Engineering Ltd. 9734-27 Ave NW Edmonton, AB T6N 1B2 (780) 405-4608
fsteyn@taifaengineering.com
Taurus Power & Controls, Inc. 9999 SW Avery St Tualatin, OR 97062-9517 (503) 692-9004
powertest@tauruspower.com www.tauruspower.com
Rob Bulfinch
Taurus Power & Controls, Inc. 8714 South 222nd St. STE A Kent, WA 98031 (425) 656-4170 powertest@tauruspower.com www.taruspower.com
Tidal Power Services, LLC 4211 Chance Ln Rosharon, TX 77583-4384 (281) 710-9150
monty.janak@tidalpowerservices.com www.tidalpowerservices.com
Monty Janak
Tidal Power Services, LLC 8184 Highway 44 Ste 105 Gonzales, LA 70737-8183 (225) 644-8170
darryn.kimbroug@tpsgse.com www.tidalpowerservices.com
Darryn Kimbrough
Tidal Power Services, LLC 1056 Mosswood Dr Sulphur, LA 70665-9508 (337) 558-5457
rich.mcbride@tidalpowerservices.com www.tidalpowerservices.com
Rich McBride
Tidal Power Services, LLC 1806 Delmar Drive Victoria, TX 77901 (281) 710-9150
kelly.grahmann@tps03.com
Kelly Grahmann
Tony Demaria Electric, Inc. 131 W F St Wilmington, CA 90744-5533 (310) 816-3130 neno@tdeinc.com www.tdeinc.com
Neno Pasic
Utilities Instrumentation Service, Inc. 2290 Bishop Cir E Dexter, MI 48130-1564 (734) 424-1200
gary.walls@UIScorp.com www.uiscorp.com
Gary Walls
Utilities Instrumentation Service - Ohio, LLC 998 Dimco Way Centerville, OH 45458 (937) 439-9660 www.uiscorp.com www.uiscorp.com
Utility Service Corporation PO Box 1471 Huntsville, AL 35807 (256) 837-8400
accounting@utilserv.com www.utilserv.com
Accounts Payable
VISTAM, Inc. 2375 Walnut Ave Signal Hill, CA 90755 (562) 912-7779
ulyses@vistam.com


CAPO-12
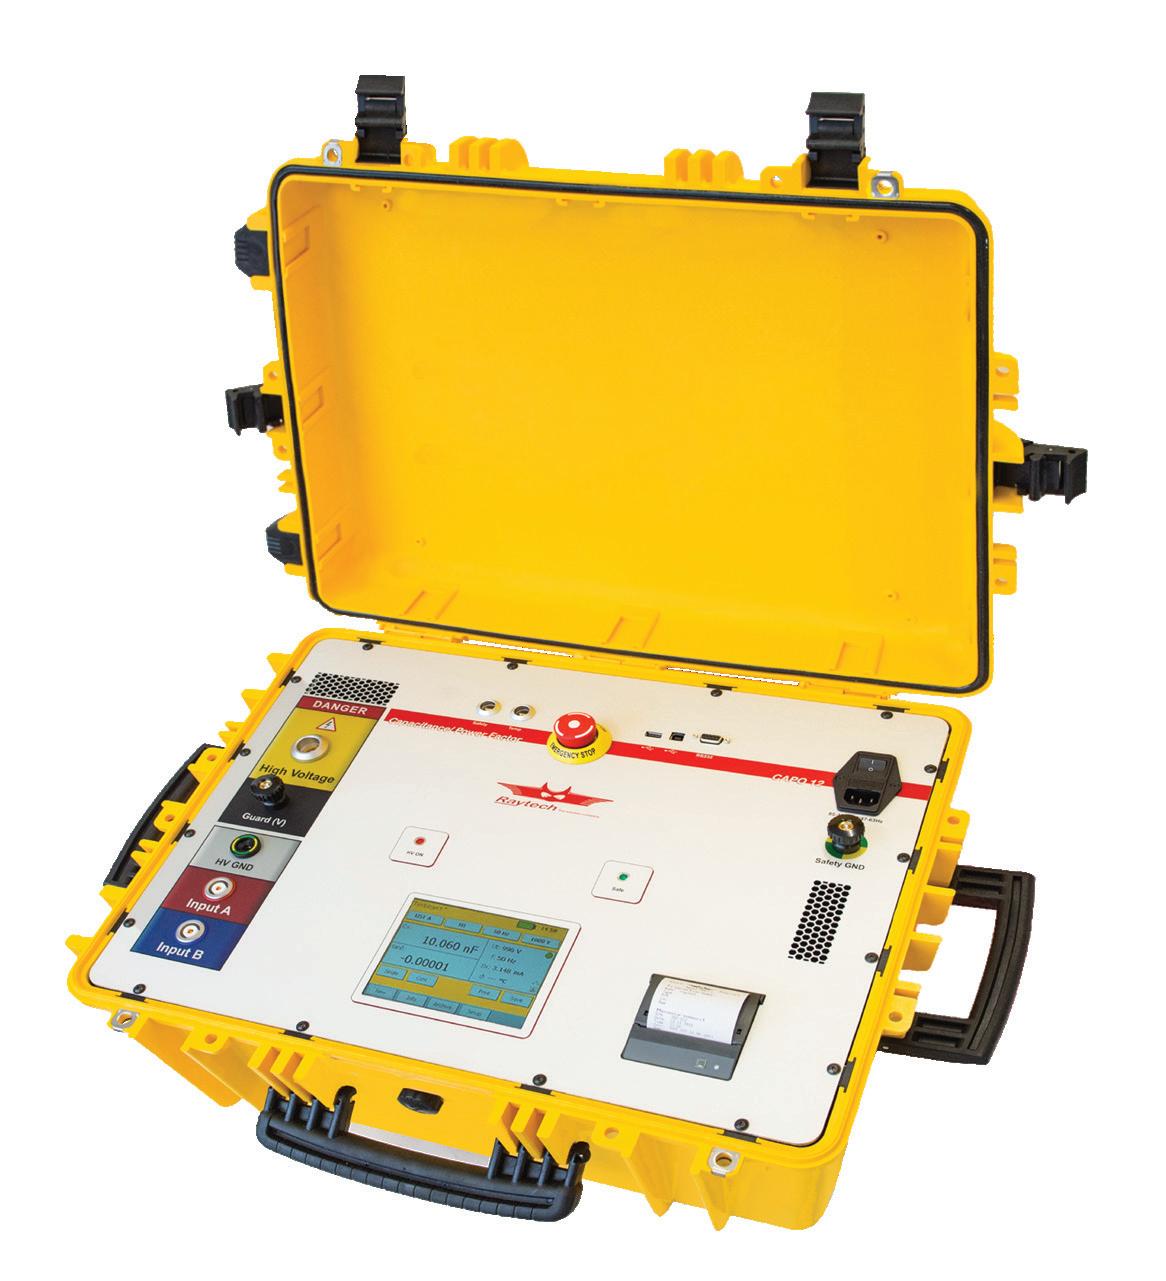
12kV Capacitance Power Factor
• Safe + Compact + Simple + Low cost
• Test voltage up to 12kV | Built in Standard Capacitor
• Best accuracy and resolution in the industry
• Test frequency – 10 Hz to 400 Hz
• Easy to operate, no computer needed
• Highest output power available in a portable system
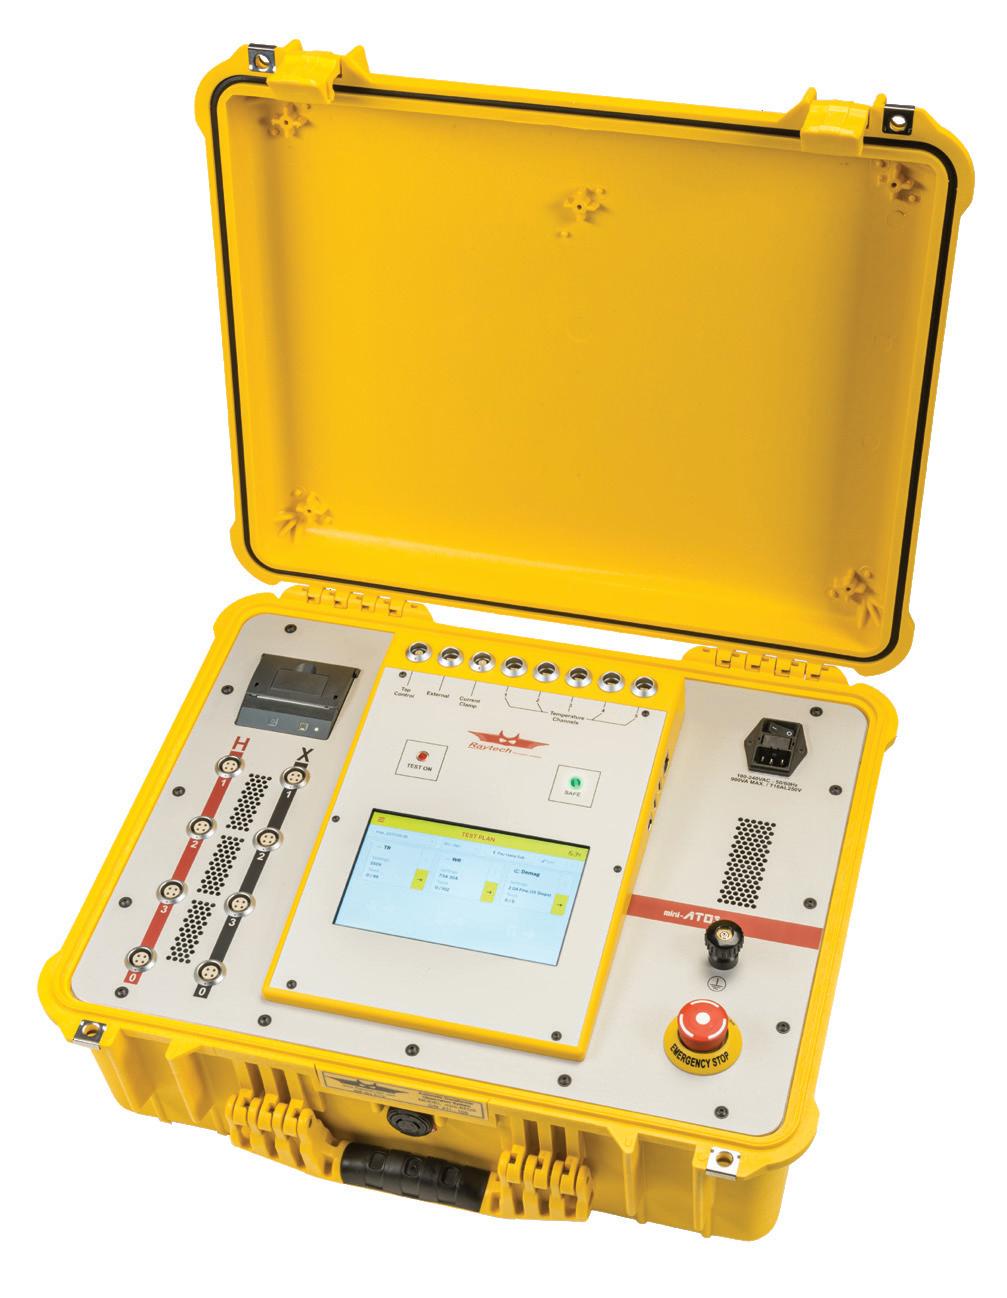
mini-ATOS
TR-WR Combo system
• Winding Resistance and Turns Ratio with a single hookup
• Demagnetization and Magnetic Balance
• Export complete Test Report via .pdf or CSV/Excel to USB drive or direct to PC Optional:
• Short Circuit Impedance
• Dynamic Resistance Measurement
• Frequency Response of Stray Losses

A quality leap through system-based protection testing

System-based protection testing – something new again? Yes, absolutely. This innovative approach makes it possible to check that the entire protection system works correctly, thus increasing the testing quality. Instead of validating individual relay settings, RelaySimTest simulates realistic scenarios in the energy system to reveal errors in the settings, the logic and the design of the protection system.
www.omicronenergy.com/relaysimtest
Scott Cooper
Application Engineer
