[
MARKETS
CDC PROJECTING UP TO FOUR PER CENT INCREASE IN TOTAL DEMAND FOR 2022 This could translate into a P5 quota increase of 2.1 per cent kg by 2025-26. Four million kg of butterfat is equivalent to one per cent of national demand, so when looking at the 34 million kg, that’s more than eight per cent of the market nationally that could be filled by imports, says Patrice Dubé, Dairy Farmers of Ontario’s chief economics and policy development officer. “With regards to the forecast on butter stocks, the projection for July 2022 is now at 23,000 tonnes, which is below the 35,000 tonnes target,” Dubé says. “For December 2022, we are looking at 11,000 tonnes at a time where we would expect stocks to be over 20,000 tonnes.” “All indications show there will be a need for more milk in the system,” he adds. “However, all these projections don’t take into account the
By Constantin Urtilescu GOVERNMENT RELATIONS SPECIALIST
T
he Canadian Dairy Commission has stated the growth in demand registered nationally for 2021 is expected to be around 3.8 per cent, which would translate into a quota increase at the P5 level of 2.6 per cent. This growth is being experienced over the recent year even if a significant increase of imports is observed. As discussed last month, when looking at butterfat, 13 million kilograms of butterfat came in from all the trade agreements at the end of the dairy year in 2021. It is expected this number could go up to close to 34 million
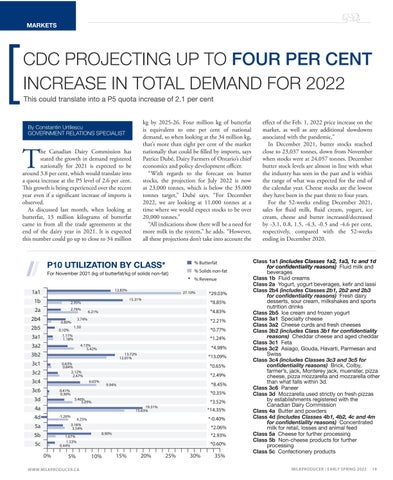
P10 UTILIZATION BY CLASS* For November 2021 (kg of butterfat/kg of solids non-fat) 12.83%
1a1 1b
2.95%
2a
2.76%
2b4
0.10% 1.11% 1.18%
3a1
% Solids non-fat
*
% Revenue
27.10% 15.31%
*4.83%
6.21%
*2.21%
1.50
*0.77% *1.24%
3a2
4.13% 5.42%
3b2
*4.98% 13.72% 12.01%
3c1
*13.09%
0.63% 0.84% 2.12% 2.47%
3c2 3c4
*0.65% *2.49% 6.65%
3c6
*8.45%
9.94%
0.41% 0.36%
3d
*0.35% 3.46% 5.09%
*3.52%
19.31% 15.63%
4a 4d
-1.26%
5a 5b 0%
*14.35% *-0.40%
4.25% 3.16% 3.54%
1.67% 1.53% 0.44%
5c
*29.03% *8.85%
3.74%
0.80%
2b5
% Butterfat
5%
WWW.MILKPRODUCER.CA
*2.06% 8.90%
*2.93% *0.60%
10%
15%
20%
25%
30%
35%
effect of the Feb. 1, 2022 price increase on the market, as well as any additional slowdowns associated with the pandemic.” In December 2021, butter stocks reached close to 23,037 tonnes, down from November when stocks were at 24,057 tonnes. December butter stock levels are almost in line with what the industry has seen in the past and is within the range of what was expected for the end of the calendar year. Cheese stocks are the lowest they have been in the past three to four years. For the 52-weeks ending December 2021, sales for fluid milk, fluid cream, yogurt, ice cream, cheese and butter increased/decreased by -3.1, 0.8, 1.5, -4.3, -0.5 and -4.6 per cent, respectively, compared with the 52-weeks ending in December 2020. Class 1a1 (includes Classes 1a2, 1a3, 1c and 1d for confidentiality reasons) Fluid milk and beverages Class 1b Fluid creams Class 2a Yogurt, yogurt beverages, kefir and lassi Class 2b4 (includes Classes 2b1, 2b2 and 2b3 for confidentiality reasons) Fresh dairy desserts, sour cream, milkshakes and sports nutrition drinks Class 2b5 Ice cream and frozen yogurt Class 3a1 Specialty cheese Class 3a2 Cheese curds and fresh cheeses Class 3b2 (includes Class 3b1 for confidentiality reasons) Cheddar cheese and aged cheddar Class 3c1 Feta Class 3c2 Asiago, Gouda, Havarti, Parmesan and Swiss Class 3c4 (includes Classes 3c3 and 3c5 for confidentiality reasons) Brick, Colby, farmer’s, jack, Monterey jack, muenster, pizza cheese, pizza mozzarella and mozzarella other than what falls within 3d. Class 3c6 Paneer Class 3d Mozzarella used strictly on fresh pizzas by establishments registered with the Canadian Dairy Commission Class 4a Butter and powders Class 4d (includes Classes 4b1, 4b2, 4c and 4m for confidentiality reasons) Concentrated milk for retail, losses and animal feed Class 5a Cheese for further processing Class 5b Non-cheese products for further processing Class 5c Confectionery products MILKPRODUCER | EARLY SPRING 2022
19


