
FATTENING OF STABLE CATTLE WITH LOW COST DIETS, BASED ON FORAGE BANKS.
Victoria Arronis 1 , Jorge Morales2SUMMARY
Fattening of stabled cattle with low-cost diets based on forage banks. The present study was carried out in a complete stable feeding system, in the area of La Colonia de Pérez Zeledón. 37 F1 bulls (Brahman x Romagnola ) were fattened. The diet was based on the use of products from the farm and the area, basically cut fodder such as Taiwan and Cameroon grass. Pennisetum Saccharum sugar cane purpureum officinarum , Tithonia buttercup diversifolia and coquito flour.
The cost of the diet including other fixed and variable costs (except financial and depreciation) of the operation was acceptably moderate ( ₡ 686.00/animal/day). The results were analyzed according to the condition of the animals, which presented two different ages and weights upon entering the system, a group (G1) with an average age of 11 months and an average weight of 254.3 kg, and a second group smallest (G2), 6.5 months of age and 183.6 kg of weight. Both groups were analyzed separately both in their behavior during their development and fattening, and in their economic results for the farm. The results indicate differences in both cases in favor of the larger animals that entered fattening; days in feeding (390 vs 509 days); daily weight gain (0.800 vs 0.580 kg); final market weight (529 vs 481 kg); profitability (7.57 vs 0.58%). G1 animals were more efficient in daily weight gain by 25.9% and in fattening time by 23.4% than those of G2. The conclusion obtained from this result is that the ideal animal for fattening should weigh around 300 kg of body weight. In general, the animals of both groups received AAA rating for age and carcass yield (59.5%) with an average premium per live kg ( ₡ 1256.35 vs ₡ 111.2), with respect to the auction price.
The general profitability of fattening was 4.97 %; Had the aforementioned premium not been received, the group of small animals would have affected the profitability of the fattening in its entirety (-1.5%) despite the small profitability (4.3%) that the largest group would have generated. Other important information, based on recognized precedents in the literature, was observed and confirmed, especially with the F1 of G1 animals, where decreasing yields indicate that the market weight should be around 481 kg; heavier animals reduce their profitability, which can make the difference between one case and the other. The subsequent
1National Institute of Innovation and Transfer of Agricultural Technology, INTA. Costa Rica. varronis@inta.go.cr, INTA Headquarters in Pérez Zeledón, Costa Rica; jmorales@inta.go.cr. INTA Headquarters, San José, Costa Rica.
analysis of the information indicates that the scale of production is definitely imperative, due to the high risk of the activity and if the investor wanted to generate more profitability than he could obtain by placing that money in an investment stock market. At least 200 animals, of the type used in this study, must grow fat every year, in order to opt not only for an acceptable return, but also to be able to live moderately from the activity. Fattening as an activity in family farming, with the care of small groups of animals (5 to 20 animals), is viable, meanwhile, it means savings due to the investment of the labor itself, which has an unquestionable great conversion value. of time available in money.
Keywords: stabled, fodder banks, daily weight gain, triple A.
Keywords: feedlots, fodder banks, daily weight gain, triple A.
INTRODUCTION
In recent years, the search for alternatives and options that increase efficiency in the use of farm resources and harmony with the environment, which must be essential for any agricultural activity, has intensified. These alternatives should ensure that the livestock activity is technically, socially, environmentally and economically sustainable (Morales et al. 2011). Livestock in the country has been characterized by being extensive and has been developed within a very low technological level, conditions that still persist. The use of irrational practices in the management of soils and remnants has led to environmental deterioration and, as a collateral consequence, to a decrease in the economic efficiency of production systems. ( Arronis 2017)
Detailed analysis of the commercial beef cattle activity, with farmers and technicians throughout the country, over the years and especially through the "Sustainable Intensive Livestock" project (Modelos Intensive Sostenibles - MIS 2013-2021) of INTA , showed important results in 2019. These results could contribute to giving beef cattle an opportunity towards a more profitable, competitive and sustainable activity, in these times of great challenges as a result of globalizing factors in trade, climate change and pandemics. (Morales 2017).
In these regions it is difficult to find bulls of pure or specialized beef breeds since most of the calves come from dual-purpose systems where crosses of Zebu Bos cattle predominate. indicus with European cattle Bos taurus such as the Brown Swiss, Charolais , Simmental , Beefmaster and Limousine breed, among others. When these crosses are systematically planned (Morales 2017 ), in confinement they have an excellent growth rate, feed conversion and carcass yield , compared to those animals that have more genes of the Zebuína breeds (Livas 2016).
In Costa Rica, this type of ordered crossbreeding is not a common practice in commercial beef breeding, therefore, difficult to achieve. The farmer must at least make his food source independent, manage low costs and thus improve his profitability. However, it is important to indicate that the scale of production here also makes a difference in the profitability and sustainability of the system. The
key elements to consider are: type of animal to be fattened (genetic profile, size and price), quality and cost of the diet, daily weight gain and, very importantly, the number of animals to be fattened, in order to generate a higher benefit/cost. to the investment unit.
The production of bovine meat in the stabling system (Morales and Acuña 2005; Morales et al. 2004; Morales and Cruz 2004), still presents numerous imperfections or technical deficiencies, mainly in the discipline of what, how and when to do things, which has resulted in many producers or those in charge of the exploitation, carrying out the zootechnical activities of a sui generis way without taking into account a technical methodology that benefits productivity (Livas 2016).
Simons (2015), indicated that the intensive fattening system has given positive results in farms where high-quality protein forages, supplements, mineralized salts and quality water are supplied. This has been demonstrated in our country by ( Arronis 2015; Morales and Acuña 2005 ).
The stabling system or feedlots consists of having the animals confined, all the time. Therefore, they receive all their feed at the feeder, and perform very little physical activity, which tends to reduce energy requirements, making more energy available for growth. These systems must have trained labor and the required amount of forage for the entire cycle. ( Arronis 2007; Rojas and Campos 2015)
The fattening of males in the country occurs in two ways, on the farm itself where they are produced and brought to market until completion (Morales 2002 and 2003), or they are acquired from neighboring farms or auctions. These traditional fattening systems take up to three years to bring animals to market; where carcass yields are around the range of 52 to 54%. It is a system based on extensive grazing, with daily weight gains 0,350 kgper animal ( Arronis 2008; Morales and Acuña 1999.
In the most efficient stabled systems, there are daily weight gains of0,9 a 1 kgdaily, the animals go on the market in 1.4 years with carcass yields of up to 58% ( Arronis 2015).
It has been shown for many years on the farm where this evaluation is carried out that fattening steers in a stable system, based on forage energy and protein banks, is a low-profit but positive option ( Arronis 2015 and Morales 2018).
The present study is based on the particular experience (Morales et al 2018), of using a group of animals, F1 offspring (50% zebuino + 50% European type) from purebred parents that can manifest 100% hybrid vigor. from a commercial breeding farm and take them to fatten on another farm with a stable system, both managed under the sustainable intensive livestock approach (MIS Costa Rica). If the theoretically expected result occurs (technical research and validation hypothesis), the technological practice, as such, would have technical and economic support, for its subsequent transfer to technicians and farmers.
Based on the above, this research aimed at the animal response in an intensive meat production system to diets based on forage energy and protein banks; that is, the answer to unknowns , which from the technical and practical point of view, are considered to be the key factors for the social, economic and environmental sustainability of cattle fattening for Costa Rica. The answers sought were how they affect: the type of animal (size, genetic profile, price), the animal market (farm, auctions, processing plants), the diet in terms of quality, costs and the number of animals or scale of production. production used (balance point), all of them based on profitability, particularly, as an essential element in the competitiveness and general sustainability of the activity. Based on this experience, the results are shared in this document.
MATERIALS AND METHODS
This study was carried out in La Colonia de San Pedro, Pérez Zeledón. The farm is located at 985 masl, with an average temperature of 23.4 ºC and an annual rainfall of 2700 mm.
VARIABLES TO EVALUATE
1. Genetic profile and weight
Thirty-seven Brahman half-blood bulls by Romagnola were transferred from Liberia to Pérez Zeledón, to be subjected to a stable feeding system. These animals were transferred on August 18, 2018. Two groups of bulls were identified based on their size. A first group (G1) of 20 animals, 11 months old, with an average weight of 254.3 kg (G1>200 kg) and a second group (G2) made up of 17 animals of approximately 6.5 months of age. and with an average weight of 183.6 kg (G2<200 kg).
The first weighing at the farm after the identification of each one of them was carried out twelve days after their arrival. From this weight (229.1 kg (G1) and 166.5 kg G2), the analyzes of the present document are based. The G1 lost an average of 25 kg from the farm weight in Cañas Dulces de Liberia, the G2 lost 16.5 kg. The second group of smaller animals were kept for two and a half months in a pasture with access to supplementation, very similar to G1, which entered the stable directly with diets based on ingredients produced on the farm, of which well-managed and good-quality forages quality would be the basis of the diet. The two groups were kept in separate pens during the feeding period.
1st animal handling
Upon arrival at the farm, each animal was identified with a plastic earring. In addition, they were dewormed internally and externally. They were weighed every month in a portable scale.
The diets were provided at two times of the day, at 7:30 a.m. and then at 2 p.m. Every day the forages were cut, starting at 5:30 a.m., they were transported by pick-up to the corrals, they were passed through the mincer all together in the due proportion. Then they were mixed with coquito flour and placed in the feeder twice a day. There was availability of salt and minerals for free consumption, as well as drinking fountains with permanently clean water.
The farm has an irrigation system for fodder all year round, giving it independence and availability even during the dry season. The pens were washed three times a week; the remnants went to a pit with an immersion pump for distribution to forage banks.
The pens are 40% covered, where the area of the feeders is located and part for shade and the rest, that is, 60% of the area under sun, for resting and mobility, required in animal welfare.
1 B. Purchase price of the bulls
The price paid for the bulls was ₡1,300 /kg and ₡1,350 /kg, respectively for animals G1 (254.25 kg) and G2 (183.55 kg), whose average weight is indicated and corresponds to the weight of the animals. at the place of purchase. The cost of transportation resulted in ₡ 8 108.00 average per animal. The average final cost per animal, already on the fattening farm, was ₡255,833.11 for G1 and ₡338,633.00 for G2.
2. Formulated diets.
It is important to point out that the basis of the diet is made up of forages for energy and protein, these have a very low price compared to concentrated grainbased feeds. Forage energy and protein banks constitute one of the best feeding options for ruminants in the tropics and a very efficient way to face the negative effects of climate change. In this region there are several forage options that have been generated and validated in previous studies ( Arronis 2015).
The diets used are shown in Table 1. The average daily cost of the diet per animal was ₡686.00, which includes variable costs and fixed costs during the fattening period, as can be seen most of the ingredients are fodder produced on the farm that has fodder banks in cameroon , taiwan ( Pennisetum sp .), fodder cane ( Saccharum officinarum ) and buttercup ( Tithonia diversifolia ). The nutritional quality of these materials was analyzed at the INTA Feed and Forage Laboratory.
Table 1. Diets used for fattening steers, during the period August 2018 – April 2020. Pérez Zeledón, Costa Rica.
Ingredient Diet according to animal weight in kg
(kg) 250 300 350 400 450 500
coquito flour 0.5 0.5 one 1.5 2 2
Sugar cane 5 6 7 8 10 eleven Cameroon/ Taiwan fifteen 18 twenty 23 26 28 Gold button 3 4 5 6 7 8 Mineral salts 0.035 0.040 0.045 0.050 0.055 0.060 The diet is based on the consumption of Dry Matter of 3 % of the live Weight , 14 to 16% of Crude Protein, 2.5 to 3.0 Mcal ME.
3. daily weight gains
The daily weight gains were evaluated, based on the data generated from the monthly weights.
In these more efficient forage-based intensive systems, animals have daily weight gains of0,9 a 1 kgand they go on the market in 1.4 years with carcass yields of up to 58% ( Arronis 2015).
4. bioeconomic analysis
The costs of all the activities related to the fattening process, weighing of animals and diets, sanitary management were recorded; expenses and income for each batch of fattening steers, in order to carry out the respective economic analysis and obtain the indicated variable.
RESULTS AND DISCUSSION
Weight gains and diets supplied
From the time the animals entered the stabling facility until their exit ready for the market, with weights between 460 and 600 kg, 594 days passed, that is, almost 20 months. The animals came out gradually, those of the larger G1 group came out sooner as expected. In total, five groups came out, three were from G1, which by January 10, 2020 (17 months) had all come out with an average market weight of 531.2 kg. Almost three months later (84 days) the animals of the G2 group came out, which they did in two batches on two different dates, the last and final one on April 3, 2020, with an average weight of the 17 animals of 489.7 kg. .
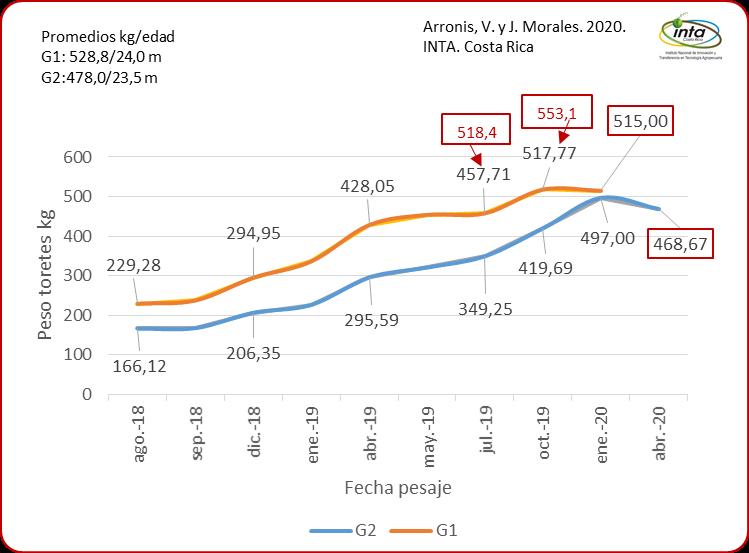
In the following Figure 1, the growth curves of the two groups of animals can be observed in general. On average, the G1 animals came out with a higher average market weight than the G2 group (538.8 vs 478.0 kg of live weight). G1 animals began to grow fat from June 2019 nine months after entering the pen, which due to their final observed weight (over 500 kg), should have left earlier.
Figure 1. Growth curve of F1 ( BrahmanxRomagnola ) animals, G1 and G2, during the entire fattening stage (in red weights of sub-groups sold. Finca Bendiciones. Pérez Zeledón, Costa Rica (2020).

The general curve of daily weight gain (Figure 2), for groups G1 and G2, shows averages of 0.800 and 0.580 kg per day, respectively, during the fattening period. The G1 animals showed their highest conversion efficiency (1.10 to 0.971 kg/day) between April and May 2019, between 7 and 8
Figure 2. Daily weight gain of F1 bulls ( Brahaman x Romagnola ) La Colonia, Perez Zeledon. Costa Rica (2020).
months of stables, corresponding to 18 to 19 months of age, just about 60 days before the first group goes on the market. The general average of the 20 animals at that time was 457.7 kg, which indicates that this is the most efficient approximate weight at which the animals should go to market, to save the extra feed-product of the loss in feed conversion. . In Figure 2 it is also evident the lower efficiency in feed conversion of the animals of group G2 with respect to those of G1.
Considering that the groups left on different dates, the batch analysis was carried out and from this analysis the behavior of these animals in a group and in a general way is discussed. Finally, based on the gains in weight and costs, the economic analysis of profitability and efficiency of both groups is made; and as a total event.
The diets supplied were formulated for a daily gain of 1 kg. There were variations in weight gains due to other factors, not just the formulation of the diet.
Group analysis of the bulls. Group G1
A first batch of seven fat animals (518.4 kg average weight) came out of group G1, just over nine months after entering the stable (June 27, 2019), at an age of 20.4 months. The average daily gain of these animals was 0.961 kg, reaching the maximum daily gain (1,395 kg/d) one month before their sale, when they had an average body weight of 492.7 kg; Figure 3.
500
400
300
200
100
Average weight of bulls kg weigh-in
600 24-9-18 13-12-18 31-1-19 25-4-19 27-5-19
1,395 0,804 y = -0,0584x3 + 0,4007x2 - 0,4727x + 0,4853 R² = 0,8764
Fattening 282 days/0.961 kg/day average. Age 20.4m
267,00 331,29 375,57 492,71 518,43 0,323 0,804 0,904
0,000 0,200 0,400 0,600 0,800 1,000 1,200 1,400 1,600 0
PESO PROM GDP Arronis, V. and J.
Daily weight gain kg
Figure 3. Behavior of body weight and daily weight gain of the first batch of F1 bulls (Brahman x Romagnola ), which went on the market- Finca Bendiciones. Perez Zeledon. Costa Rica (2020).
From now on the gain was 0.804 kg per day. This factor is known as diminishing returns, which affects the economic efficiency of the activity. This means that the animals, in this case, should have been sold when they weighed 493 kg and not when they weighed 518.5 kg, since this meant a loss of 42.36 % (0.591 grams per day) in the conversion efficiency that the animal brought , which could have meant some ₡ 8767/animal (cost of daily feeding of an animal ₡ 686.00 x 0.4263 x 30 days) that was no longer received, an important figure in an activity of recognized low profitability. Of course, in most cases, it is not about when one wants to sell, but when they are going to receive it. Normally these bio-economic gaps favor industrialists over producers. But if it is worth paying attention to this, planning sales and weighing animals periodically to try to minimize losses for reasons in which we have some control.
It is important to remember that these are half-blood animals, crossed with European-type cattle, which added to the age they reached and market weight (20 months), practically guarantees a very good quality meat (Morales et al 2018), that, although there is no classification system for quality payment, some industrialists and merchants look for them and pay extra for them.
A second batch of this G1 group of animals, Figure 4, went on sale on October 16, 2019, after 14.3 months of stabling, with an age of 25.1 months and an average weight of 553.1 kg. . Here we again observe the factor of
Fattening 424 days/0,800
Arronis, V. and J. Morales. 2020. INTA. Costa Rica
-0,200 0,000 0,200 0,400 0,600 0,800 1,000 1,200 1,400
Daily weight gain kg bull weight kg weighing
PESO PROM GDP Polinomial (GDP)
Figure 4.- Behavior of body weight and daily weight gain of second batch of F1 bulls (Brahman x Romagnola ), which went on the marketFinca Bendiciones. Perez Zeledon, Costa Rica (2020)
diminishing returns , when from around the month of July, the animals weighed an average of 488.4 kg and should have been sold. At an average weight gain of 0.598 kg per day per animal, from July onwards, 0.465 grams of weight gain per day was lost due to diminishing returns, which could have meant 43.7% less in feed efficiency than it has. a cost in the period of ₡ 686.00 x 0.437 x 106 days for sale = ₡ 31,776.89/animal) for extra feeding.
The third batch for sale of the G1 group (Figure 5), came out on January 10, 2020, seventeen months after entering the feeding system. These animals, evidently due to the longer fattening period, present a daily weight gain of only 0.630 kg and came out with an average body weight of 515 kg. Once again, diminishing returns are observed. When the animals had an average weight of 460.5 kg, they should have left, since they stopped gaining an average daily weight of 0.409 kg (45.1%) from that moment on and for 134 days, which meant approximately ₡ 686 x 0.451 x 134 days for sale = ₡ 41,475.70, per animal. With much more reason, for an animal that takes 17 months to reach market weight,
(which is in itself inefficient in these stabled systems), its departure should be well planned, to further force the presumably low profitability, as practically happens in most current livestock systems.
Fattening 510 days/0.630 kg/day average. Age 28m
Arronis, V. and J. Morales. 2020. INTA. Costa Rica
0,579 0,769 0,698 0,880 0,907 0,773 0,333 0,640 0,246
500
400
515,0 0,430
201,4 212,2 258,5 296,2 354,8 383,0 415,7 460,5 476,5 504,7
300
200
100
600 0,000 0,100 0,200 0,300 0,400 0,500 0,600 0,700 0,800 0,900 1,000 30-8-1824-9-1813-12-1831-1-1925-4-1927-5-19 2-7-1929-8-1916-10-1929-11-1910-1-20
Daily weight gain kg bull weight kg weighing
y = 0,0008x3 - 0,0386x2 + 0,3726x - 0,1854 R² = 0,6942
PESO PROM GDP Polinomial (GDP)
0
.
Figure 5.- Behavior in body weight and daily weight gain of the third batch of 6 F1 bulls (Brahman x Romagnola ), which went on the marketFinca Bendiciones. Perez Zeledon, Costa Rica. (2020)
With the sale of this third batch, all the animals in the heaviest group finished leaving. In this study and with this type of animals, the data indicates that the most efficient body weight to send the slaughter is on average 481 kg. The practice of carrying animals over 500 kg and sometimes up to 600 kg, can benefit someone, but not exactly the fattener.
Group analysis of bullfighters. Group G2
On the same previous date, nine of the animals from group G2 were sold, Figure 6, which had entered with lower weight; previously, only one animal from this group had come up for sale at market weight. Seventeen months after entering, these animals emerged with an average weight of 487 kg body weight and an age of 23.5 months. In this case, although an effect of increasing yields appears to be observed, it is evident that these animals at that time did not yet have a market weight (372.3 kg), which forces them to continue until they reach it, regardless of whether there was a market weight. earlier period of more efficient feed conversion. The animals were sold at a much lower weight than those of the large group (G1), which was the most rational, since these animals would hardly improve their efficiency and rather would have generated losses if they had continued in the process. These animals with that age and in knowledge of their genetic profile, also received a prize, because they also presented good carcass performance.
Fattening 498 days/0.639 kg/day average. Age 23.5m
Arronis, V. and J. Morales. 2020. INTA. Costa Rica
bulls kg weigh-in date PESO PROM GDP Polinomial (GDP)
Weighing
Daily weight gain
Figure 6. Behavior in body weight and daily weight gain of the first batch of nine G2 animals that went on the market. Farm Blessings. Perez Zeledon, Costa Rica. (2020)
Finally, the last batch of six animals from this G2 group, Figure 7, went on sale on April 3, 2020, after almost 20 months of feeding and an age of 26.3 months, when compared to conventional fattening.
These animals averaged slightly lower market weights than the previous group at 469 kg and daily gains during the period of just 0.527 kg. The same thing happens here, because there appears to be effects of diminishing returns, but rather it is an erratic behavior of rising and falling in weight gain, due to the slow fattening progress of these animals, related to the low weight that they reached in the stable. which says a lot in terms of the type and weight of animals suitable for fattening.
Finally, to close this section on the behavior of these two types of animals, in general it can be indicated that it is important to use efficient animals in feed conversion (daily gains above 900 grams per day, in stable feeding systems). Normally an animal close to 300 kg in weight is in a better physiological condition for fattening due to its state of maturity ( Prada 1989, cited by Sánchez M 2005; INTA Argentina 2012 and Arronis 2007 ) . For this, crossbred animals may be an option if
Arronis, V. and J. Morales. 2020. INTA. Costa Rica Fattening 594 days/0.527 kg/day average. age 3m
gain kg bull weight kg weighing
PESO PROM GDP Polinomial (GDP)
Figure 7. Behavior in body weight and daily weight gain of the second batch of six G2 animals that went on the market. Farm Blessings. Perez Zeledon, Costa Rica. (2020) there would be a greater availability of them in the market. In general, once the animals reach 450 to 500 kg of body weight, their feed conversion efficiency begins to decrease and this factor can become a key element in the profitability of the business, as we will see in the next section.
Economic-financial analysis of fattening
As previously commented on the management and behavior of fattening animals, we will now analyze the economic result of this particular activity. The fattening of bovines in stable systems has several key factors to consider in order to obtain a positive economic result. The factors to consider are: type of animal (genetic profile and size), purchase and sale prices of cattle , diet (quality and cost), daily weight gain of the animals, number of animals to fatten (production scale ).
Genetic profile and size
In the previous analysis, the behavior of animals of different sizes in terms of weight gain, body weight and market age was widely seen and discussed. There the data evidenced the importance of animals having an average of around 300 kg to enter the system. Smaller animals, such as those of the G2 group, which was used in this study, suffer from a "lethargy" (one can say natural), in weight gain, because muscle and adipose growth does not yet take off, but until bone tissue is built and others related to structural growth towards adult size, generally closely linked to their racial genetics. Perhaps not in these terms, but this physiological stage of the animal is recognized by farmers and is documented in the scientific literature (Morales 2002 and 2003). The condition of the animals at
this stage of their development is related to the changes they undergo, both psychological and physiological, caused by the separation from the mother at weaning ( Arronis 2007; INTA Argentina 2012) and an exclusive diet based on forage. This stage of development should be done grazing (Morales and Cruz 2000), because it is the lowest cost system to bring them to the weight (300 kg) from which the animal will be in a physiological condition more toward muscle and adipose tissue and less to structural growth, that is, when it will be ready for fattening.
Having mentioned the above, the differences are also evident in the economic analysis. Table 2 shows the figures related to size. For example, normally in the market animals weighing less than 200 kg of body weight have a higher price than those greater than 200 kg. However, due to their lower weight, the smallest ones cost ₡ 247,792.50 and the largest ones ₡ 330,525.00. The investment for the 37 animals was ₡ 10.8 million, an amount that has a financial cost that is not being considered in the calculations.
Table 2 . Animal and feed costs ( Exchange rate, 2019 ₡599/$ ), in relation to their weight. Perez Zeledon, Costa Rica.2020.
Cost analysis
Animals No. starting weight cost full value fattening days ₡686/a/day Little ones 17 183.55 ₡ 1350 ₡ 4,212,472.50 509.18 ₡ 349 295.10 Big twenty 254.25 ₡ 1300 ₡ 6,610,500.00 389.9 ₡ 267 471.40
Total 37 ₡ 10,822,972.50
The other important cost is that of feeding, which includes labor and other fixed and operating costs, which resulted in higher costs per animal for G2, compared to G1, given its longer permanence in the stable ( ₡ 349,295.1 vs ₡ 267 471.4).
Added the costs (without considering financial costs or depreciation), at 510 days after the end of fattening they add up to ₡ 22.1 million (cattle cost, feed costs and others). Due to the quality of this type of animals and their performance (59.5%), an average premium per kg of live weight ( ₡ 1,256.35) was received compared to the average auction price that was paid during the period they were out. these animals to the market ( ₡ 1111.11/kg LW). Once the cost of transporting the animals was discounted, this extra price allowed receiving a positive net income in both cases, ₡ 3,395.05 and ₡ 61,268.61, for G2 and G1, respectively (Table 3). In other words, those with the highest weight when entering the stable received a difference of approximately ₡ 57,873.56 more per animal.
Table 3. Total diet costs, income and net income per animal ( Exchange rate, 2019 ₡599/$ ). Perez Zeledon. Costa Rica. (2020)
Income analysis (- transport*)
Animals Diet cost** Sale ₡/kg
final weight (kg) Total sale ₡
Total Net Profit ₡ Net profit ₡
Little ones 5 938 016.00 1,256.35 8235 103 46 042.25 195 553.75 3395.05 Big 53 49 428.00 1,256.35 10624 13,347,462.40 1,387,534.40 61 268.61
Total 11 287 444.00 23 693 504.65
*Transportation ₡8108.11/animal (Liberia-Pérez Zeledón) ** Total cost of diet and other fixed and operating expenses for animal group.
The final economic analysis indicates, according to Table 4, that in total the fattening of the 37 animals as a whole, allowed a profitability of 4.79%. That the animals that entered the fattening heaviest generated a profitability of 7.57%, compared to only 0.58% of the smaller group.
Table 4. Total profitability and adjusted profitability per year. Efficiency of animal group G1 in relation to group G2.
Perez Zeledon. Costa Rica. (2020)
Analysis of profitability and efficiency
Animals
Cost effectiveness large animal efficiency Total Adjusted per year fattening time Weight gain
Little ones 0.6% 0.58% Big 10.2% 7.57% 23.43% 25.91% Total 5.8% 4.97%
In order to give an idea of what might have happened if conventional animals had been used in the feedlot instead of F1 animals, some rough calculations were made, not presented in Table 4. conventional animals commonly found on the market (many from dual-purpose systems) and considering the average auction price ( ₡ 1,111.17/kg LW) that occurred during the period that the animals were leaving finished for the slaughterhouse, small animals would have presented losses over 2, 36% and large animals would have received a net profit of no more than 6.36%. Of course we are assuming a similar behavior in feed conversion of these conventional animals and , therefore, feeding times similar to those of F1, which we can infer is not completely true. Up to this point, the analysis carried out indicates the importance of the weight of the animals when entering fattening, because these animals are almost 26% higher in feed conversion and therefore in fattening time (23.4%), than those that enter of lower weights and this means higher net income (more than ₡ 57 thousand colones per animal).
Unfortunately, conventional animals contemporary to those of the present study were not kept, such as to have observed the differences in biological and economic behavior of these animals. However, it is important to mention that usually the bulls on this farm enter the system with 300 kg, they are bought at
auction, or on farms from producers in the region; They are fattened for 222 days, with a daily weight gain of 0.9 kg per animal per day, then they go on the market with 500 kg of weight and are sold to butchers or processing plants (57% carcass yield), with a differentiated price. . Only when there is an oversupply are they sold at auction . ( Arronis 2015). This farm has the capacity to fatten 100 animals and the net profit obtained per steer in this case has been ₡ 118,384.00 likewise, with 50 animals it has been approximately ₡ 60,000.00 ( Arronis 2020 ).
The present study reveals similar results to other studies in the literature (Prada 1989, cited by Sánchez 2005) and closely related to the growth curve of a bovine (Morales 2002), where once a weight of 500 kg is reached, the subsequent growth in weight, shows a curve of diminishing returns. It is important to point out that, with intensive systems, it is possible to reduce the age at which these weights are reached.
production scale
A further analysis of the present study is necessary. The low profitability of fattening is definitely confirmed, despite the positive biological and economic result observed (Morales et al 2001; Morales et al 2003). This analysis starts from what economists call capital risk. It is important to remember that the 37 fattening animals generated an investment of ₡ 22.1 million. That there was a return of 4.97% on that capital, which is not very attractive for an investor with that amount of money in their hands.
That is to say, the term deposit probably has a lower rate of payment for the capital, but it certainly exceeds it by far with respect to the high risk of the fattening activity, where many factors come into play in which the producer has no control, call it cattle price, availability of good quality animals for fattening, uniform size animals, climate, diseases and even natural events. It is practically being said that a higher return is required to reduce this great risk on capital. We are talking about fattening animals, not a family-type activity where the attraction is fattening 5 to 20 animals per year, which allows labor savings, which is very welcome for family expenses when there is not much work available or even for a hobby type activity.
The present study indicated that the investor obtained, on average, about ₡ 57 thousand colones per animal sold, using the result of the sale of the heaviest animals. If this person and his family needed to live from this activity, they should receive ₡ 1 million colones per month to do it in a decent way, without ostentation or luxuries. This would mean ₡ 12 million a year, ₡ 57 thousand/animal. The minimum number of animals you would need to produce that net profit would be around the completion of about 200 fat animals. This is what is called in economics and administration, scale of production. Regardless of how well it does, with 300 kg animals, F1, cheap diets, among others, 200 animals would be the least required to live with dignity. Now the problem we face is that using the data from the present study, this would require an annual investment of around 120 million colones. This is where good planning and looking at the options is required. If the money is not available, it is definitely necessary to carry out the
financial and feasibility analysis of the project. If you have the money, you must weigh all the risks to ensure a safe place to put that money. Conclusion, to work a cattle fattening the use of proven technology and management is required, but particularly scale of production, financing, good planning (availability of animals, food production, infrastructure, etc.) and assuming the inherent risks are required. to activity. Possible yes, risky too. Knowledge of all these factors and a lot of planning are required to enter into this economic activity.
Several lessons learned can be pointed out as a result of this work. First of all, in this type of activity, animals weighing around 300 kg at the start of fattening should be used, a usual practice on the analyzed farm. Animals weighing less than 250 kg have a high cost to bring them to market weight. The desirable animal for fattening is the crossbred animal (cebuino for European), because there are more possibilities of receiving better prices for quality of the animal and for potential yield in carcass. This type of animal comes out with market weight at a younger age, which also gives it a potential for quality meat in terms of softness (Morales et al. 2018). It can also be inferred from here, in terms of efficiency and costs, that the animals should be brought to their final market weight, a maximum of 500 kg of live weight, given the diminishing returns of the animal response in weight gain, in relation to the units of food consumed, on that weight.
It is important to point out that the farm from which the animals were transferred, located in Cañas Dulces de Liberia, is located at an altitude of 144 meters above sea level and an average temperature of 27ºC, while the farm in the Colonia de Pérez Zeledón is at 985 masl and an average temperature of 23ºC. This was an important climatic factor in the adaptation of the animals, since at first the little ones developed a kind of fluff, probably because they were not used to lower temperatures.
The other great result observed is that the stall fattening activity is of very low profitability (Arronis 2017; Pérez 2016 and 2017), not to go any further if opportunity costs of land, personal property and capital were accounted for Apparently, penning poses a higher cost of feed per kg gained, it may require some expense in personnel structure and administration. Likewise, it is true that its profitability is very sensitive to variations in market prices. This means that sometimes an individual analysis of this practice shows low gross margins, null and sometimes even slightly negative. However, in order to objectively assess the benefits of housing, it is necessary to analyze the entire cycle globally. In this way it is demonstrated that the kg gained with the cheapest resource, which is fodder, culminates in a quality product and in accordance with market demands.
Small fattenings (5 to 20 animals) that do not require large investments and in which the attention of one person is only needed for a few hours a day, as such, it could be seen as a saving due to labor, which will be received at the end when the animals are sold; oO it could also be part of a broader family farming activity, where it comes to swell income by adding to other productive activities and which allow more efficient use of family labor.
Due to this low profitability of the activity, as occurs in other parts of the world (houses with thousands of animals – USA; EU, Brazil, etc.), in Costa Rica, houses
of 3,000 and more animals (still small compared to other latitudes). This level of scale allows you to dilute fixed costs and improve the profitability of the business, which, even so, may not compete with the opportunity costs mentioned above. However, the real business is not exactly fattening, but its industrialization and sale for export or retail outlets.
If we unify the results of the INTA experience in commercial breeding (article to be published on this subject in the INTA magazine), with the present, as a consequence of the MIS Costa Rica project, the actions are ratified. support to the primary sector of production, in conjunction with the efforts of the Ministry of Agriculture and Livestock (MAG), Chambers of Livestock, individual farmers, the Livestock Corporation (CORFOGA), etc. At this time, with the existing economic situation in financial, environmental and trade agreement terms, management, technology and scale are not enough for ranchers to get ahead and can guarantee a stable economic present and future for themselves and their families and, in addition, if they are not strengthened with the alliance of other ranchers and sector and financial institutions that allow them to assume the complete agrochain with a horizontal and vertical production strategy, to produce cattle, fatten it, process it and put it on the market. sale through digital channels and platforms, direct to customers (individual consumers, tourism, retail – butcher shops) competing for price and quality, attracting and growing for consumer satisfaction. The same is feasible in bovine meat, milk and other species.
LITERATURE CITED
Arronis , V. 2007. Recommendations on Intensive meat production systems: housing, semi -housing and supplementation in Fittacori grazing . Saint Joseph. Costa Rica. 24 p.m.
Arronis , V. 2008. Manual of recommendations on sustainable production systems for meat production. INTA. Saint Joseph. Costa Rica. 54 p.
Arronis , V. 2015. Study on the use of fodder banks as a strategy to face the effects of Climate Change in semi -stalled meat and milk systems in the Brunca Region. Final report. INTA. Perez Zeledon. Costa Rica. 51 p.
Arronis , V. 2017. Intensive sustainable meat production systems as a strategy to face climate change. INTA. Saint Joseph. Costa Rica.54 p.
Arronis , V.2020. Intensive meat production system, based on fodder banks as a strategy to face climate change. Presentation. INTA. Saint Joseph. Costa Rica.16 p.
Castellaro , G; Klee, G.; Chavarría, J. 2007. Simulation model of cattle fattening systems. Technical Agriculture 67(2)163-172.
Livas, F. 2016. Feeding and management of fattening cattle in tropical conditions. UNAM. Mexico.15 p.
Monge, M. 2016. Economic-environmental viability for the production of 40 fattening steers in the canton of San Ramón de Alajuela. Bachelor Thesis. UCR. Saint Joseph. Costa Rica. 202 p.
Morales, J.; Acuña, V. 1999. Assessment of bullock weight gain in Panicum pastures maximum cv . Tanzania in the Humid Tropics of Costa Rica. INTA. Saint Charles. Costa Rica. 14 p.m.
Morales, J. 1999. Weight gain of bulls fed with orange pulp silage in a pen system. Progress report. White hair. Guanacaste. Costa Rica. 5 p.
Morales, J.; Cruz, A. 2000. Weight gain of bullocks in a semi- stalled feeding system with access to fertilized transvalla grass pastures ( Digitaria decumbens cv . trasvala ). Final report. MAG. Canas, Guanacaste, Costa Rica. 28 p.m.
Morales, J.; Crosses; Acuna, V.; Dobles, F. 2001. Weight gain of calves fed with corn silage in a stable system. Final report. EEEJN, MAG. White hair. Guanacaste. Costa Rica. 10 p.m.
Morales, J. 2002. Evaluation of the weight gain of young bulls in Brachiaria pastures. brizantha CIAT 26110 in the dry tropics of Costa Rica. Final report. EEEJ MAG. White hair. Guanacaste. Costa Rica.41 p.
Morales, J. 2003. Assessment of bullock weight gain in Brachiaria pastures brizantha cv CIAT 26110 in the humid tropics of Costa Rica. Final report. E The Diamonds. MAG. Guapiles, Costa Rica. 23 p.m.
Morales, J.; Rivas, S; Acuna, V.; Crosses; Aguilar, I. 2004. Effect of quality hay, protein and excess fat , on the daily weight gain of stabled bulls. Final report. EEEJN MAG Cañas. Guanacaste. Costa Rica. 17 p.m.
Morales, J.; Acuña, V. 2005. Comparison of forage peanut hay ( Arachis pintoi ) associated with transvala grass ( Digitaria decumbens ) produced under irrigation and commercial hay from transvala grass , produced in dry land, in the weight gain of stabled bulls. Final report. EEEJN INTA. White hair. Guanacaste. Costa Rica. 36 p.m.
Morales, J.; Hidalgo, C; Cruz, A. 2007. Comparison of the quality of transvala grass hay ( Digitaria decumbens cv . transvala ) produced under irrigation, hay from commercial transvala grass and bales of rice straw, through the weight gain of stabled bulls. Technological Scopes. Volume 5, Costa Rica. 10 p.m.
Morales, J.; Orozco, E.; Arronis , V; Cruz, A. 2011. Intensive beef cattle farming. Separate. INTA. Saint Joseph. Costa Rica.6 p.
Morales, J. 2017. Regional innovation platform for sustainable livestock. CorpoicaINTA-IDIAF-IDB. Final report. Technical Files. INTA, Costa Rica. 53 p.
Morales, J.; Crosses; Orozco, E.; Brown, W.; Vermandel T; Fink, G.; Earnheart M; Jones, J.; Williams R; Hobbs, D. 2018. Evaluation of meat production and quality in F1 Red Angus-Brahman and Charolais -Brahman pups. INTA. Costa Rica. 21 p.m.
Pérez, E. 2016. Breeding beef cattle, Finca MIS Las Lajitas. Technical report. INTAFundecooperación . Canas Dulces, Liberia, Costa Rica. 8 p.m.
Pérez, E. 2016. Meat. Fattening in Corral. Farm MIS-Blessings. Technical report. INTA - Fundecooperación . Perez Zeledon. Costa Rica. 9 p.m.
Pérez, E. 2017. Management manual: sustainable intensive systems of fattening livestock. INTA. San Jose Costa Rica. 43 p.m.
Pérez, E. 2017. Technological baseline for three sustainable intensive livestock systems. PRGS project. INTA. Saint Joseph. Costa Rica.198 p.
Rojas, A; Campos, C. 2015. Towards intensive systems in beef production: grazing with supplementation, semi -stallage and stallage. CINA – UCR. UTN Magazine 74:14 – 21.
Sánchez, M. 2007. Animal Production. Intensive systems. tachira Venezuela. 21 p.m.
Simons, E. 2015. Feedlot. Steers gain 1 kg of weight per day Livestock Context Virtual Magazine (online). Consulted 20 May . 2020. Available at www.contextoganadero.com