LevinPro LTC Deal Valuation Tool White Paper | July 2025 Edition
LTC Deal Valuation Tool: Advanced Pricing Intelligence for Senior Care Properties
Author: Diana Lalchan, Levin Associates
Edition: July 2025
A machine learning approach to property valuation in the seniors housing and skilled nursing market
Executive Summary
Levin Associates is pleased to introduce a breakthrough machine learning-based valuation tool for the senior care property market. This innovative tool provides users with data-driven price estimates for senior care facilities, offering insights based on sophisticated predictive modeling that incorporates numerous market factors. With a 2025 predictive accuracy of 93.0% for the optimized blended model (a substantial improvement from 68.5% latest-year performance of the previous generation), this tool serves as a critical resource for property appraisers, brokers, lenders, and investors focused on the seniors housing and skilled nursing market.
The LTC Deal Valuation Tool leverages a proprietary dataset of actual market transactions to deliver reliable price estimates expressed as a price per unit/bed. By accounting for property characteristics, financial metrics, market conditions, and macroeconomic factors, the tool provides comprehensive valuation intelligence that would otherwise require extensive market research and analysis.
July 2025 model refresh at a glance
● Recency-optimized training window (transactions ≥ 2023) to better reflect current market pricing dynamics
● Log-target training (log1p of price per unit) for stability on the upper tail
● Blended inference for Assisted Living (AL) and Independent Living (IL): price-model PPU blended with cap rate-implied PPU when operating margins are high
● Latest-year results on 2025 deals:
○ Price-only (≥2023, log target): R² ≈ 0.889
○ Blended (AL/IL OM gating, τ=0 optimized): R² ≈ 0.930
The Challenge: Accurate Property Valuation in a Complex Market
The senior care property market poses unique valuation challenges:
● Market Heterogeneity: Diverse property types (Assisted Living, Skilled Nursing, CCRC, Independent Living, Active Adult) with different operational models and revenue structures
● Geographic Variations: Significant pricing differences across regions, states, and market types
● Evolving Financial Dynamics: Fluctuating cap rates, revenue multiples, and yield expectations
● Macroeconomic Sensitivity: Impact of interest rates and broader economic trends on valuations
● Data Fragmentation: Limited publicly available comprehensive transaction data
These challenges make traditional valuation approaches potentially less reliable and more time-intensive, creating an opportunity for advanced analytics to improve valuation accuracy and efficiency.
Our Approach: Data Science Meets Market Expertise
The development of the LTC Deal Valuation Tool followed a systematic, data-driven methodology:
1.Data Collection and Preparation
● Assembled a comprehensive dataset of verified senior care property transactions from Levin Associates' proprietary database
● Gathered multiple data points per transaction: property attributes, financial metrics, location data
● Incorporated macroeconomic indicators and market classification systems
● Applied rigorous data cleaning and normalization processes while preserving market nuances
Note: The proprietary transaction data has been transformed through the modeling process, ensuring that individual transaction details remain confidential. The tool provides predictions without exposing any sensitive information shared with Levin Associates.
2.Feature Engineering and Selection
Through meticulous analysis, we identified the key factors that most significantly influence property values:
Top Features by Importance (Comparables Model):
1. NOI per Unit (38.2%)
2. Facility Type (18.3%)
3. Sale Date (9.2%)
4. Revenues (5.2%)
5. Year Built (4.7%)
6. Net Operating Income (4.6%)
7. Age (4.0%)
8. Revenue per Unit (3.9%)
9. Median Household Income (2.5%)
10. SF per Unit/Bed (2.2%)
Note: Percentages represent relative importance in the Comparables Model's predictive capability. The Fundamentals Model uses the same features but optimizes for cap rate prediction rather than direct price prediction.
3.Model Selection and Optimization
We selected CatBoost for its exceptional performance in this domain. CatBoost offers several key advantages for property valuation:
● Superior handling of categorical variables: Effectively processes non-numeric data like facility types, states, and regions
● Robust performance with mixed data types: Seamlessly integrates financial metrics, dates, and categorical information
● Resistance to overfitting: Maintains predictive accuracy across different market segments and time periods
● Ability to capture complex non-linear relationships: Models the subtle interactions between multiple valuation factors
● Transparent feature importance: Provides clear insights into which factors drive valuations
The model underwent hyperparameter optimization and cross-validation to ensure reliable performance across diverse market scenarios. Beginning with a 2019–2024 historical window, we systematically tested recency cutoffs and loss formulations to improve out of sample performance on the latest market year (2025). Two decisions materially improved latest year accuracy:
1. Recency optimized training window (≥ 2023)
● A sweep of cutoffs (≥2025, ≥2024, ≥2023, ≥2022, ≥2021) showed that 2025 only was too small; ≥2024 improved but ≥2023 achieved the best 2025 R² (≈ 0.84–0.89), and adding older years beyond 2023 began to dilute latest year fit.
2. Log target regression
● Training on log1p(price per unit) stabilized tails and improved generalization to high quality deals, with negligible cost to interpretability (predictions are expm1 inverted at inference).
We retained CatBoost for its strong handling of mixed features and categorical encodings, early stopping regularization, and transparent feature importance.
Model Performance and Validation
The tool has two reference configurations that reflect how the model has evolved with the market:
A.2024 edition (historical, comparables-only)
● Overall R²: 0.8846
● 2024 Latest-Year R²: 0.6846 (performance on most recent data available at the time)
● RMSE: $24,581.90 per bed/unit
● MAE: $16,311.04 per bed/unit
What These Metrics Mean:
● R² Score (coefficient of determination): Measures how well the model explains the variance in property prices. A score of 0.8846 demonstrates exceptional predictive power, capturing nearly 90% of price variations.
● RMSE: Indicates the standard deviation of prediction errors. The lower this value, the more accurate the model.
● MAE: Represents the average difference between predicted and actual values, providing an intuitive measure of accuracy.
These metrics indicate that:
● The model provides reliable valuations across different property types and market conditions
● In approximately 50% of cases, predictions will be within ±$16,311 per bed/unit of actual transaction values
● In approximately 95% of cases, predictions will be within ±$24,582 per bed/unit of actual transaction values
● Target: log1p(price per unit), inverted at inference
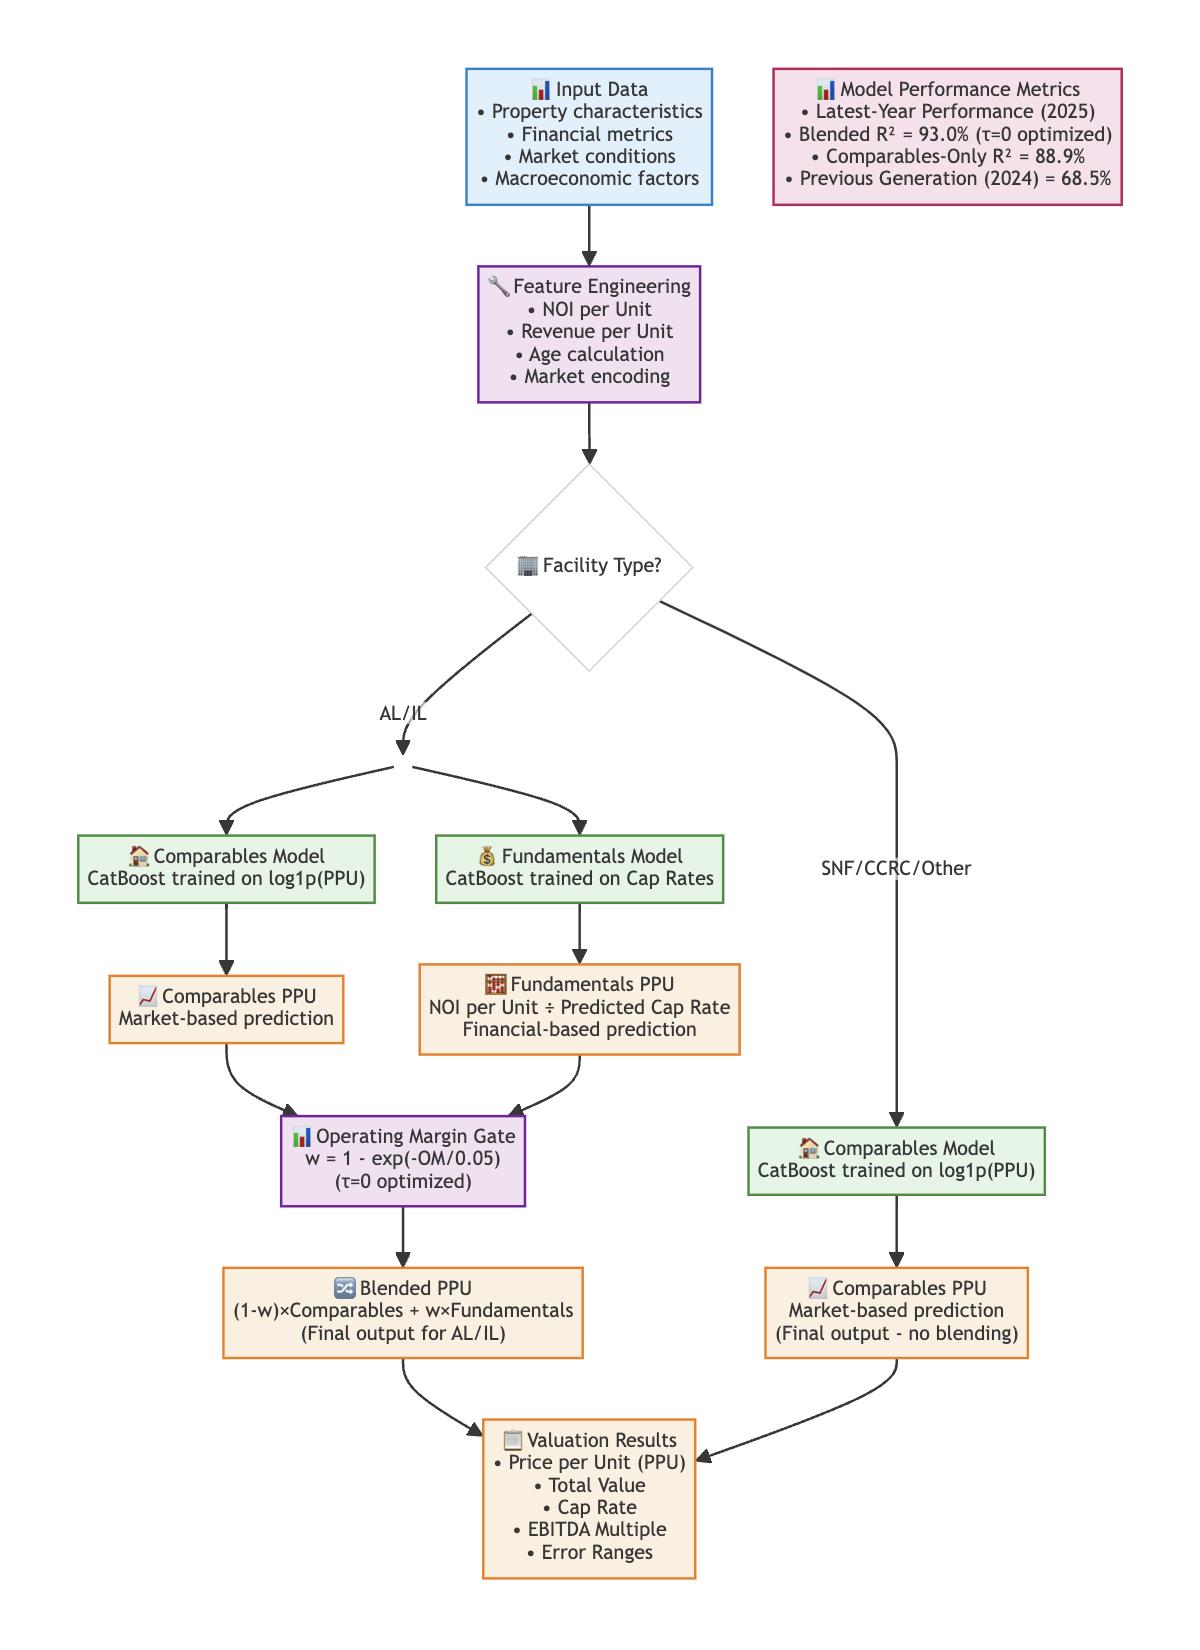
● Inference blend for Assisted Living / Independent Living:
○ Compute price model PPU (comps behavior)
○ Compute cap rate implied PPU = (NOI per unit) / predicted cap rate
○ Optimized gate weight: w = 1 − exp(−OM/0.05) for any positive operating margin (τ=0 optimized)
○ Final PPU = (1−w)·PPU_price + w·PPU_cap
● Results (2025 deals):
○ Comparables Model R² ≈ 0.889; Blended Model R² ≈ 0.930 (τ=0 optimized)
○ Overall blended R² ≈ 0.854 (expected when optimizing for latest year fit)
This design keeps the model faithful to market comps under typical conditions while behaving "finance correct" for top quartile operators where cap rate identity should dominate.
Model Architecture: Dual CatBoost Approach
The July 2025 implementation uses two separate CatBoost models with distinct training targets:
Comparables Model:
● Training target: Price per unit directly from transaction data
● Approach: Traditional market comparables methodology
● Strengths: Captures market sentiment, location premiums, and transaction dynamics
● Use case: Primary valuation for most properties and market segments
Fundamentals Model:
● Training target: Cap rates from transaction data
● Strengths: Reflects operating performance and financial efficiency
● Use case: Enhanced valuation for high-performing AL/IL facilities
Both models leverage the same feature set but optimize for different aspects of property valuation, enabling sophisticated blending based on operating performance.
AL/IL Gateway Logic: Operating Margin Distribution Patterns
The blending mechanism is selectively applied only to Assisted Living and Independent Living facilities based on fundamental differences in operating margin capabilities across LTC facility types.
Operating Margin Ceiling Analysis:
● Skilled Nursing facilities: Structurally limited to ~20% maximum operating margins due to labor intensity, regulatory requirements, and reimbursement constraints
● AL/IL facilities: Regularly achieve 25-40%+ operating margins due to different service models, lower staffing ratios, and private-pay revenue streams
How This Interacts with τ=0 Sigmoid Gate:
The sigmoid function w = 1 - exp(-OM/0.05) creates natural discrimination based on these margin patterns:
Both AL/IL and SNF can achieve
High-performing for both sectors
AL/IL exclusive territory
The Elegant Result:
● SNF facilities hit their margin ceiling around 20%, receiving minimal fundamentals weighting even when high-performing
● AL/IL facilities that achieve 25-40% margins receive nearly pure fundamentals-based valuation
● The gate naturally segments by operational capability rather than arbitrary facility type rules
Market Logic:
Properties achieving 25-40% operating margins demonstrate exceptional operational efficiency that justifies fundamentals-based valuation. Since only AL/IL facilities can reach these margin levels, the gate effectively targets the subset of properties where cap-rate-based pricing is most appropriate.
This approach respects the structural economics of different LTC segments while maximizing model accuracy through performance-based discrimination.
Blending Optimization Methodology
The discovery of the optimal gate threshold represents a systematic, data-driven approach to model refinement that yielded significant performance improvements.
Initial Market-Based
Hypothesis (τ = 0.32)
Our initial approach was grounded in market intuition:
● Rationale: Properties with operating margins above 32% likely represent well-managed, high-quality assets where cap-rate-based valuation should be more reliable
● Initial results: 2025 R² = 0.8886 for blended model vs 0.8886 for pure CatBoost (marginal improvement)
Systematic Optimization Process
Recognizing the potential for improvement, we conducted a comprehensive parameter sweep:
Phase 1: Broad Range Testing (τ = 0.15 to 0.45)
● Tested 16 different tau values in 0.02 increments
● Discovery: Clear pattern of improving 2025 R² as tau decreased
2. Medium-margin properties receive proportional blending of both approaches
3. High-margin properties are primarily fundamentals-driven (financial metrics approach)
4. No discontinuities exist in the prediction function
Economic Interpretation of τ = 0 Optimum
The discovery that τ = 0 maximizes performance suggests:
1. AL/IL sector differentiation: These facility types fundamentally benefit from cap-rate-based valuation logic at any positive margin level
2. Operating efficiency signal: Any positive operating margin indicates operational competence worthy of financial-model-based valuation
3. Market behavior: Recent (2025) transactions in the AL/IL space are increasingly valued on financial fundamentals rather than pure comparables
4. Model sophistication: The sigmoid ensures appropriate weighting without requiring arbitrary thresholds
This methodology demonstrates how systematic optimization can reveal market insights that challenge initial assumptions, leading to materially improved predictive performance.
The τ=0 optimized blended model combines traditional comparables methodology with financial fundamentals for AL/IL facilities, achieving 93.0% predictive accuracy on 2025 transactions.
● Market adaptability: Performs consistently across facility types and regions
● Temporal relevance: Captures evolving market trends through the Sale Date feature
● Financial focus: Gives appropriate weight to critical NOI and revenue metrics
● Geographic intelligence: Accounts for location value through region, state, and market type variables
Limitations and Considerations
● Unique property features: Exceptional property attributes or recent renovations may not be fully captured
● Extreme outliers: Unusual transactions or properties may receive less accurate valuations
● Market shifts: Sudden major market changes may require model recalibration
● Specialized properties: Highly unconventional facilities may fall outside the model's primary training data
● Complementary tool: Should be used alongside professional judgment and market expertise
In the July 2025 edition specifically:
● The AL/IL blending uses an empirically optimized gate threshold τ=0, discovered through systematic testing of 46 different tau values. Any positive operating margin triggers sigmoid-weighted blending for AL/IL facilities. For other sectors, the model behaves as a pure price per unit comps model.
● The optimization process revealed that aggressive blending (τ=0) maximizes 2025 R² performance while maintaining smooth, continuous predictions through the sigmoid function.
● We clip extreme predictions for cap rate and use epsilons in divisions to maintain numerical stability.
Tool Implementation and User Experience
The LTC Deal Valuation Tool is designed for intuitive use while providing sophisticated analytics. Users can:
1. Enter property details:
● Physical characteristics (units/beds, year built, property type)
● Location information (state, region, market type)
The tool's clean, professional interface makes sophisticated valuation intelligence accessible to all market participants, from experienced deal-makers to those newer to the senior care real estate sector.
Practical Applications
The LTC Deal Valuation Tool offers valuable support for multiple stakeholders in the senior care property market:
● Brokers: Quick validation of listing prices and offers; data-backed client guidance
● Investors: Initial screening of acquisition targets; support for investment committee materials
● Lenders: Preliminary underwriting reference; validation of proposed deal valuations
● Appraisers: Supplementary data point; efficiency in initial valuation assessments
Across all applications, the tool serves as a complementary resource to professional expertise, providing data-driven insights while acknowledging the importance of nuanced market knowledge.
Conclusion: The Future of Senior Care Property Valuation
The LTC Deal Valuation Tool represents a significant advancement in bringing data science to bear on the challenges of senior care property valuation. By combining Levin Associates' deep market knowledge with sophisticated machine learning techniques, we have created a resource that enhances decision-making capabilities across the industry.
Data Privacy and Confidentiality
It's important to note that this tool was developed with the utmost respect for data confidentiality:
● All transaction data used to train the model remains fully protected
● The machine learning approach transforms raw data into generalized patterns
● No specific transaction details are revealed through the tool's predictions
● The model's output represents market trends rather than individual data points
This approach ensures we can provide valuable market insights while maintaining the confidentiality of proprietary information shared with Levin Associates.
As the market continues to evolve, so too will the tool, with ongoing refinements to maintain and improve its predictive accuracy. We believe this represents not just a valuable current resource, but the beginning of a new approach to property valuation that blends human expertise with data-driven intelligence.
For further information about accessing or utilizing the LTC Deal Valuation Tool, please contact Levin Associates.