Minimally Destructive Ink Analysis Using Miniaturized UV/Vis Spectrometry Lenora Rutten, Morgan Morrill, Ling Huang, Ph.D. Chemistry Department, Hofstra University, Hempstead, NY 11549-0151
INTRODUCTION
ANALYSIS
•
Much of questioned document analysis focuses on non-chemical characteristics like handwriting, alternative light sources, and microscopic analysis.
•
As chemical ink analysis becomes more common, new methodology is developed with the goal of differentiating between inks’ chemical compositions.
•
Many existent ink analysis techniques use thin layer chromatography (TLC)1, but this requires an unrealistically large sample and uses harmful organic solvents2.
•
Micro UV/Vis spectrometry requires significantly smaller sample sizes and is compatible with sodium laureate sulfate (SDS), an environmentally and analyst friendly solvent.
•
Procedure was developed using a micro UV/Vis spectrometer to examine small, ink-onpaper samples cut out of written characters, ensuring minimal sample destruction.
•
Figure 2. (a, left) Sharpie samples with punches (b, right) Close up of blue ballpoint ink sampled Figure 6. (left to right) Implen NP80 spectrometer, squeeze droplet technology diagram
Forensically relevant samples include blue ink pens, porous point “permanent” pens, and “erasable” pens. This is due to legal use4, permeance/ impermanence, and consumer popularity3.
MATERIALS AND METHODS • • •
Samples (Figure 1b-d) were dried for two minutes at room temperature before extracting six, 0.7 mm hole punches (Figures 1a and 2a-b). They were placed in a tube with SDS and sonicated. The samples were then centrifuged. The SDS was pipetted into another tube, leaving the paper behind. All samples and a paper blank were run on the Implen NP80 micro UV/Vis spectrometer (Figure 6). The spectra were collected and looked at comparatively (Figures 3-5).
Table 1: Pen designations and details. Designation
Brand
Model
Color
Category
Blue pen 1
Bic
BU3 Grip 1.0
Blue
Ballpoint
Blue pen 2
Papermate
Profile 1.4 Bold
Blue
Ballpoint
Blue pen 3
Staples
Stick Grip
Blue
Gel
Blue pen 4
Pilot
G-2 07
Blue
Gel
Sharpie 1
Sharpie
Fine tip permanent marker
Black
Alcohol based porous point
Sharpie 2
Sharpie
Red
Sharpie 3
Sharpie
Black
Alcohol based porous point Alcohol based porous point Alcohol based porous point Erasable/ gel
Sharpie 4
Sharpie
Fine tip permanent marker Fine tip permanent marker Pen
Erasable pen
Pilot
Frixion Clicker 07
Green Black
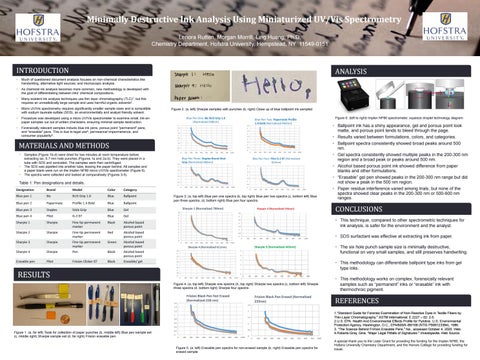
Figure 3. (a, top left) Blue pen one spectra (b, top right) Blue pen two spectra (c, bottom left) Blue pen three spectra, (d, bottom right) Blue pen four spectra
• Ballpoint ink has a shiny appearance, gel and porous point look matte, and porous point tends to bleed through the page. • Results varied between formulations, colors, and categories. • Ballpoint spectra consistently showed broad peaks around 500 nm. • Gel spectra consistently showed multiple peaks in the 200-300 nm region and a broad peak or peaks around 500 nm. • Alcohol based porous point ink showed difference from paper blanks and other formulations. • “Erasable” gel pen showed peaks in the 200-300 nm range but did not show a peak in the 500 nm region. • Paper residue interference varied among trials, but none of the spectra showed clear peaks in the 200-300 nm or 500-600 nm ranges.
CONCLUSIONS • This technique, compared to other spectrometric techniques for ink analysis, is safer for the environment and the analyst. • SDS surfactant was effective at extracting ink from paper. • The six hole punch sample size is minimally destructive, functional on very small samples, and still preserves handwriting. • This methodology can differentiate ballpoint type inks from gel type inks.
RESULTS Figure 4. (a, top left) Sharpie one spectra (b, top right) Sharpie two spectra (c, bottom left) Sharpie three spectra (d, bottom right) Sharpie four spectra
• This methodology works on complex, forensically relevant samples such as “permanent” inks or “erasable” ink with thermochroic pigment.
REFERENCES 1.“Standard Guide for Forensic Examination of Non-Reactive Dyes in Textile Fibers by Thin-Layer Chromatography.” ASTM International, E 2227 – 02: 2-5. 2.U.S. EPA. Health And Environmental Effects Profile for Pyridine. U.S. Environmental Protection Agency, Washington, D.C., EPA/600/X-86/168 (NTIS PB89123384), 1986. 3. “The Science Behind FriXion Erasable Pens,” Na., accessed October 4, 2020. Web. 4.Roberts-Grey, Gina. “Major Legal Pitfalls of Signatures.” Investopedia. Web Source.
Figure 1. (a, far left) Tools for collection of paper punches (b, middle left) Blue pen sample set (c, middle right) Sharpie sample set (d, far right) Frixion erasable pen Figure 5. (a, left) Erasable pen spectra for non-erased sample (b, right) Erasable pen spectra for erased sample
A special thank you to the Lister Grant for providing the funding for the Implen NP80, the Hofstra University Chemistry Department, and the Honors College for providing funding for travel.